Assessment of coping and adaptive...
71
I Assessment of coping and adaptive capacities Deliverable D4.3 September 2017 Rob Tinch 1 , Rob Dunford 2,4 , Jill Jäger 3 , Paula A. Harrison 4 , Ian Holman 5 , Katharina Hölscher 6 , Simona Pedde 7 , Cindy Schoumacher 1 . 1 Iodine sprl, Belgium 2 University of Oxford, UK 3 Independent, Austria 4 Centre for Ecology and Hydrology, UK 5 Cranfield University, UK 6 DRIFT, The Netherlands 7 Wageningen University, The Netherlands IMPRESSIONS – Impacts and Risks from High-End Scenarios: Strategies for Innovative Solutions (www.impressions-project.eu)
Transcript of Assessment of coping and adaptive...

I
Assessment of coping and adaptive capacities
Deliverable D4.3
September 2017
Rob Tinch1, Rob Dunford2,4, Jill Jäger3, Paula A. Harrison4, Ian Holman5, Katharina Hölscher6, Simona Pedde7, Cindy Schoumacher1.
1 Iodine sprl, Belgium 2 University of Oxford, UK
3 Independent, Austria 4 Centre for Ecology and Hydrology, UK
5 Cranfield University, UK 6 DRIFT, The Netherlands
7 Wageningen University, The Netherlands
IMPRESSIONS – Impacts and Risks from High-End Scenarios:
Strategies for Innovative Solutions (www.impressions-project.eu)

2 | Page D4.3: Assessment of coping and adaptive capacity __________________________________________________________________________________
Prepared under contract from the European Commission Contract n° 603416 Collaborative project FP7 Environment Project acronym: IMPRESSIONS Project full title: Impacts and Risks from High-end Scenarios: Strategies for
Innovative Solutions Start of the project: 01 November 2013 Duration: 60 months Project coordinator: NERC – Centre for Ecology and Hydrology Project website www.impressions-project.eu Deliverable title: Assessment of coping and adaptive capacities Deliverable n°: D4.3 Nature of the deliverable: Report Dissemination level: Public WP responsible: WP4 Lead beneficiary: Iodine sprl Citation: Tinch R, Dunford R, Jäger J, Harrison PA, Holman I, Hölscher K,
Pedde S, Schoumacher C (2017). Assessment of the coping and adaptive capacity. EU FP7 IMPRESSIONS Project Deliverable D4.3.
Due date of deliverable: Month 47 (September 2017) Actual submission date: Month 47 (September 2017)
Deliverable status: Version Status Date Author(s)
1.0 Draft 3 May 2017 Tinch and Schoumacher
2.0 Draft 1 September 2017 Tinch et al.
3.0 Final 18 September 2017 Tinch et al.
The content of this deliverable do not necessarily reflect the official opinions of the European Commission or other institutions of the European Union.
D4.3: Assessment of coping and adaptive capacity 3 | Page __________________________________________________________________________________
Table of contents
Summary ................................................................................................................................................. 4
1. Introduction ..................................................................................................................................... 5
Background and definitions ..................................................................................................... 5
IMPRESSIONS approach .......................................................................................................... 8
2. Developing capacity indicators for IMPRESSIONS ........................................................................... 9
Options for representing adaptive and coping capacity in integrated assessments .............. 9
2.1.1. ATEAM ........................................................................................................................... 10
2.1.2. CLIMSAVE and GUMBO ................................................................................................. 10
2.1.3. World Risk Index ............................................................................................................ 12
2.1.4. IIASA, EXIOBASE and GTAP ............................................................................................ 13
2.1.5. International Futures model (IFs) .................................................................................. 14
Developing capacity indicators for IMPRESSIONS ................................................................. 16
2.2.1. Using the IAP2 to project capitals for the IMPRESSIONS stakeholder workshops ........ 17
Use of capitals in adaptation and vulnerability assessment ................................................. 22
2.3.1. Adaptive capacity and limiting capitals ......................................................................... 22
2.3.2. Coping capacity in vulnerability assessment ................................................................. 26
3. Use of capacities in scenarios, visions and pathways in IMPRESSIONS ........................................ 27
Building blocks and process steps for co-creating scenarios, visions and pathways ............ 27
Analysis of capitals in scenarios and pathways ..................................................................... 30
Projections of capitals within the scenarios and pathways .................................................. 32
4. Conclusions .................................................................................................................................... 39
Strengths and Limitations ...................................................................................................... 39
Next steps: Extending coping capacity modelling to a fully dynamic system in rIAM .......... 41
5. Acknowledgements ....................................................................................................................... 43
6. References ..................................................................................................................................... 43
Annex A: Brief background to vulnerability assessment ....................................................................... 48
Annex B: International Futures (IFs) model .......................................................................................... 50
Annex C: Details of evolution of capitals in the scenarios .................................................................... 53
Annex D: Datasets supporting extension to dynamic model in rIAM ................................................... 65

4 | Page D4.3: Assessment of coping and adaptive capacity __________________________________________________________________________________
Summary
The IMPRESSIONS project aims to quantify and explain the consequences of ‘high-end scenarios’ of extreme climate, social and economic change up to 2100. These scenarios have been co-created with stakeholders within several case studies at different scales, and applied in climate change impact, adaptation, and vulnerability models to explore what futures under high-end scenarios might look like. The scenarios support the development of ‘pathways’ of mitigation, adaptation and transformation, which are robust in the face of uncertainties, and support transformations towards sustainability and resilience in the context of high-end scenarios.
This deliverable report focuses on a particular component of the IMPRESSIONS work: the development of indicators of adaptive and coping capacity, and their integration in the scenario and pathway development and modelling research. By ‘adaptive capacity’, we mean the resources and capabilities available to societies to design and implement adaptations in advance of changing climate and socio-economic conditions. By ‘coping capacity’, we mean the resources and capabilities available for dealing with extreme events and conditions as they happen. This research to explore and model the capacities of societies to adapt and to cope with high-end scenarios, and to expand these capacities via adaptive and transformative pathways, forms a key input both to assessing the feasibility of adaptation actions and to the assessment of vulnerability to residual impacts.
In this report, we summarise the methodology developed in IMPRESSIONS for representing societies’ capacities to adapt to and to cope with high-end scenarios of climate and socio-economic change, and explained how this was integrated with the modelling and with the development and analysis of the scenarios and pathways.
The research included a review of the options for modelling adaptive and coping capacities, which are not directly observable features of societies but rather metaphors for the vast range of ways in which the physical, financial, human and social resources available to societies shape and constrain the adaptation and coping measures they are able to introduce, and help to determine how effective those measures will be. There are many ways in which these capacities could be represented. The report sets out the rationale for opting to build on a framework that derives an index of capacity from indicators of the stocks of human, social, financial and manufactured capital available to societies. This has the advantages of being grounded in a theoretical model of wealth creation, being relatively easy to communicate and understand, while remaining flexible enough to represent a very wide range of possible scenarios. The capitals indicator framework was modified and extended to 2100 and integrated within the IMPRESSIONS IAP2 modelling platforms for Europe and Scotland, in the form of constraints on the adaptation options, and as a key component of the vulnerability assessment.
The capitals framework was also used as part of the process of building the scenarios and pathways in IMPRESSIONS, via assessment of baseline capital levels, and iterations between experts and stakeholders to establish how capitals evolve along pathways. The capitals are also used as determinants of capacity to adapt, influencing the effectiveness of adaptation options in both the quantitative and qualitative streams of the pathways analysis. In the quantitative (modelled) stream, the capitals available are included in the IAP2. For each time slice, they constrain the ability to implement adaptation options via the ‘limiting capitals’ for each option. They also influence the vulnerability analysis via the amount of coping capacity available in each region. In the qualitative stream, the availability of capitals is taken into account in determining the expert score for the effectiveness of each action. Building up adaptive and coping capacities is itself an adaptation option that is strongly represented in the pathways developed within all of the case studies in IMPRESSIONS and that feeds back to the assessment of effectiveness and vulnerability. In the report, we present the results of adaptation strategies, co-developed with stakeholders, which results in improved capacities to adapt and cope in both the European and Scottish case studies.
D4.3: Assessment of coping and adaptive capacity 5 | Page __________________________________________________________________________________
1. Introduction
‘High-end’ scenarios (HES) of extreme climate and socio-economic change are those that relate to climate change levels at the upper end of the range of possible futures. HES include the underlying socio-economic storylines, both as the drivers of emissions (and other contextual factors) and as narratives that capture a range of plausible societal challenges to adaptation and mitigation, as well as the ability of society to cope with the impacts of climate change.
Whilst the Paris Agreement aims to limit climate change to 2°C above pre-industrial levels, and to pursue efforts to limit it to 1.5oC, it is increasingly plausible that global increases in mean temperatures will surpass these thresholds, perhaps substantially (IPCC 2014; Smith et al. 2011). HES are considered in IMPRESSIONS as those beyond the 2oC target, including worlds of +4°C and higher. Such changes could lead to highly detrimental environmental, social, and economic consequences. There may also be critical thresholds that could tip current social-ecological systems into other states, with largely unknown consequences that are probably less socially desirable (Rockström et al. 2009; Steffen et al. 2015; Lenton et al. 2008; Russill 2015).
Actions and responses in the face of HES will involve some balance of mitigation, adaptation, transformation, and residual damages (Tinch et al. 2015). Difficult decisions need to be made regarding the appropriate balances of these actions and their associated outcomes. Desirable societal transformations are likely to be needed to cope with high-end climate change. Improving understanding of such transformations under HES requires new approaches that can deal with non-linearity and deep uncertainty, link climate resilience to broader considerations of sustainability and resilience, and foster more fundamental changes of societal practices, values and production and consumption processes to overcome underlying path dependencies and lock-ins (Hermwille et al. 2017; Meadowcroft 2011; Shaw et al. 2014).
The IMPRESSIONS project aims to quantify and explain the consequences of HES, taking into account uncertainties and strong non-linear changes related to these scenarios, as well as those with intermediate warming levels. High-end climate and socio-economic scenarios have been co-created with stakeholders at multiple scales within several case studies (see Deliverables D2.2 - Kok and Pedde 2016; and D2.3 - Madsen et al. 2016) and applied in climate change impact, adaptation, and vulnerability (CCIAV) models to explore what such futures under extreme climate change could look like (see Deliverables D3A.1 - Carter et al. 2016; D3B.2 - Holman et al. 2017; and D3C.2 - Clarke et al. 2017). The aim was to develop mitigation, adaptation and transformation pathways that produce synergies between adaptation and mitigation, develop resilience regarding uncertainties and support transformations towards sustainability and resilience in the context of high-end scenarios (see Deliverable D4.2 - Hölscher et al. 2017).
This report focuses on a particular component of the IMPRESSIONS work, the development of indicators of adaptive and coping capacity and their integration in the scenario and pathway development and modelling research. This work supports IMPRESSIONS’ research to explore the capacities of societies to adapt and to cope with HES – and particularly how the pathways that were co-created improve these capacities. It forms a key input to assessing the feasibility of adaptation actions and to the assessment of vulnerability to residual impacts.
Background and definitions
IMPRESSIONS developed four HES in each of its case studies (Deliverable D2.2 - Kok and Pedde 2016), which represent alternative futures of what the world could look like in the 21st century. It also developed a vision for the desirable future that stakeholders wanted in 2100 in each case study

6 | Page D4.3: Assessment of coping and adaptive capacity __________________________________________________________________________________
(Deliverable D4.2 - Hölscher et al. 2017). It then developed adaptation, mitigation, and transformation pathways to achieve that vision (Deliverable D4.2 - Hölscher et al. 2017). All these activities were undertaken in collaboration with stakeholders through a facilitated co-production process. This work required the ability to quantify, and represent in the CCIAV modelling, societies’ capacities to adapt to climate change and to cope with residual damages in the scenarios, and also to represent how these capabilities can be built up or degraded along pathways of actions. Important definitions related to this work are provided in Box 1.
This deliverable focuses specifically on adaptive and coping capacity. The two can be distinguished (see Box 1) as coping capacity is the ability to deal with climate changes (including variability and extremes) as they actually happen, whilst adaptive capacity is the ability to reduce future vulnerability to climate change (Brooks 2003). Adaptation is understood as a longer-term process that may involve structural changes and strategies for addressing the long-run consequences of climate change, while coping reflects the measures and abilities immediately available to reduce harm and damages in the occurrence of an event (Birkmann et al. 2015).
This distinction is useful, because it takes account of the time lags between adaptation decisions and their practical effects. Adaptation can work by targeting any of the components of vulnerability1: reducing exposure, reducing sensitivity, or increasing coping capacity. Building coping capacity can be
1 A brief overview of the background to vulnerability assessment is provided in Annex A.
Box 1: Definitions of relevance to the work on quantifying adaptive and coping capacity
High-end scenarios (HES) describe what could happen to climate and socio-economic conditions in the future at the more extreme end of what is possible.
Visions are normative statements about a desirable, sustainable, and resilient future.
Pathways are formed of short-, medium- and long-term actions that can be clustered together in strategies that seek to realise specific aspects of a vision.
Adaptive capacity reflects the resources available to societies that enable or constrain the adaptation options.
Vulnerability in IMPRESSIONS is considered to be the potential for a specific part of a system to be harmed by a specific threat or threats. Vulnerability can be thought of as a function of exposure, sensitivity and coping capacity:
Exposure is the degree, duration, and/or extent to which the system is subject to a particular perturbation (Gallopìn 2006);
Sensitivity is the degree to which a system is affected (adversely or beneficially) by these perturbations (IPCC 2001);
Coping capacity is the combination of all strengths and resources available within a community or organisation that can reduce the consequences of impacts arising through exposure and sensitivity (Birkmann 2007).

D4.3: Assessment of coping and adaptive capacity 7 | Page __________________________________________________________________________________ an important form of adaptation (Smit and Pilifosova 2003), especially where the nature of the challenges to be faced is uncertain, so flexibility must be maintained. This framework can be used as a qualitative metaphor for thinking about and discussing options (Carter et al. 2007) and/or can be developed into a quantitative model (Jones and Mearns 2005).
IMPRESSIONS combines elements of both approaches, including developing a quantitative model for integrating vulnerability assessment within regional integrated assessment models (Figure 1). This is done by:
Setting a threshold for impacts that are negligible;
Determining a coping range within which society may be able to deal with non-negligible impacts by using coping capacity, if that is available;
(Optionally) setting an upper threshold above which it is impossible to cope with the impact, whatever the coping capacity; and
Defining an index to represent coping capacity.
Figure 1: Schematic of the IMPRESSIONS approach to using coping capacity to distinguishing between impact and vulnerability.
Rothman et al. (2013) argue that modern vulnerability assessments tends to be polarised in two extremes, which they term ‘outcome’ and ‘contextual’ approaches. In the former, adaptive capacity is broadly assumed to be present, so that the ability to implement a given adaptation is not treated as a constraint and non-climatic and, especially, socio-economic factors become “almost invisible”. Reducing outcome vulnerability focuses on reducing exposure or sensitivity through either mitigation or technological adaptations. In contrast, contextual approaches focus on increasing the capacities of individuals and groups to adapt, mainly through addressing the underlying causes of their vulnerability.
A major challenge for modelling approaches such as those used within IMPRESSIONS is to steer a path between these two extremes, such that the models and their users are helped to consider the different options for reducing vulnerability in a way that takes account of both the capacities to adapt to climate change and to cope with residual impacts.
Research in IMPRESSIONS therefore combines elements of both the ‘contextual’ and ‘outcome’ approaches, using capacities as a metaphor and in the form of quantified indices of adaptive and coping capacity. The coping capacity index is developed through a methodology (see Section 2), that

8 | Page D4.3: Assessment of coping and adaptive capacity __________________________________________________________________________________
models adaptive and coping capacity as dependent on the stocks of different capitals (human, social, manufactured, and financial) that are available to a society/economy at a particular place and time.
IMPRESSIONS approach
IMPRESSIONS aims to understand the risks and consequences of HES for Europe, and the options available for averting its most adverse effects in the context of alternative development pathways. IMPRESSIONS research has sought to develop mitigation, adaptation and transformation pathways that reduce climate change, prepare and protect societies from the impacts of climate change and support transformations towards sustainability and resilience in the context of HES.
To achieve this, IMPRESSIONS work package (WP) 2 first developed a set of HES, which combined Representative Concentration Pathways (RCPs) beyond the 2°C threshold2 and Shared Socio-economic Pathways (SSPs). The SSPs are consistent with, but independent from, the RCPs (Deliverables D2.1 - Kok et al. 2015; D2.2 – Kok and Pedde 2016; and D2.3 –Madsen et al. 2016). The RCPs and SSPs were developed for the period 2010 to 2100. The impacts and vulnerabilities associated with these scenarios were simulated using a range of CCIAV modelling approaches in WP3 (Deliverables D3A.1 – Carter et al. 2016; D3B.2 - Holman et al. 2017; and D3C.2 - Clarke et al. 2017).
IMPRESSIONS WP4 then set out to develop and explore time- and scale-dependent adaptation, mitigation, and transformation pathways that build resilience and promote sustainability in the context of the combined high-end climate and socio-economic change scenarios, and which move the case study towards a desired scenario-independent vision. For each SSP, socio-economic scenario storylines and pathways have been developed through a comprehensive stakeholder engagement process organised by WP6A (Deliverables D6A.2 – Zellmer et al. 2016; and D6A.3 - Faradsch et al. 2017).
Deliverable D4.2 (Hölscher et al. 2017) presents the adaptation, mitigation and transformation pathways that were developed in the four IMPRESSIONS case studies in Europe, Scotland, Hungary and Iberia. These pathways identify possible courses of action for achieving desirable transformations, taking account of the synergies and trade-offs between different actions and strategies, the robustness of actions and solutions across different scenarios, and the institutional and agency conditions, as well as resources, that are needed to implement them. These last elements can be interpreted in terms of the governance capacities and system capitals that enable the implementation of the pathways and that are built up along the pathways. Through building governance capacities in the pathways, actors are able to create, mobilise and put in use the system capitals to implement the pathways and move towards the vision.
The modelling frameworks developed in IMPRESSIONS WP3 (particularly the integrated models IAP2 and rIAM, see Section 2) integrate sectoral models for urban development, agriculture, forestry, water supply, flooding and biodiversity. They quantify impacts within these sectors under the scenarios and pathways and map them at European or regional scales. The models use the capacity indices as quantitative constraints on adaptation in the models, and on coping in the vulnerability assessment.
This report (Deliverable D4.3) explains the development and implementation of the indices of adaptive and coping capacity, with stakeholder and expert input, and its integration with the modelling,
2 Thus, in the IMPRESSIONS project, we consider RCPs beyond the EU and UNFCCC target to limit climate change to 2°C above pre-industrial levels, and the aim after Paris 2015 to make efforts to limit climate change to 1.5°C above pre-industrial levels.

D4.3: Assessment of coping and adaptive capacity 9 | Page __________________________________________________________________________________ pathway development and assessment exercises reported in Deliverable D4.2 - Hölscher et al. 2017. The consideration of vulnerability and coping capacity helps to identify future vulnerabilities in the scenarios and thereby flag areas where additional adaptation is required in order to reduce sensitivity, reduce exposure, and/or build the coping capacity needed to avoid future vulnerabilities. This information is fed back in to the modelling and pathway development processes, both as a way of putting limits on the amount of adaptation that is feasible given the capacities available at a particular place and time in a scenario, and through the option of selecting actions and pathways that seek to build up the capacities needed to adapt and to cope. This is particularly important for some scenarios which have very low adaptive and coping capacity. The pathways were then assessed with regard to the effectiveness of the proposed measures, including assessment of the extent to which the pathways would improve the capacities.
In the following, we first explore the options for representing capacities to cope and to adapt in the IMPRESSONS integrated modelling (IAP2 and rIAM) and in the processes for developing and analysing scenario storylines and pathways (Section 2). We then explain the methods developed in IMPRESSIONS for representing adaptive and coping capacities, and how the capacity measures are integrated within the modelling. Section 3 then turns to the use of capitals in the analysis of scenarios and pathways, and explains how these are linked back in to the modelling. Section 4 summarises the methods and results, assesses strengths and weaknesses of the approaches taken, explores the extensions needed to provide a more dynamic framework in rIAM, and makes suggestions for future research.
2. Developing capacity indicators for IMPRESSIONS
Adaptive and coping capacities are closely related to the structure of societies, including human capabilities, technologies, and access to resources. They are not directly observable quantities but rather metaphors or models for the capabilities available for adapting to and coping with climate change. We need therefore to construct indicators of adaptive/coping capacity based on characteristics of societies and environments. Ideally, indicators should be derived from robust, available data for the past and present, which can be projected for future periods in one of three ways: modelled directly within the Integrated Assessment Models (IAMs); incorporated directly in scenarios; or modelled via an estimated relationship with some other variable that is either modelled or included in scenarios. In the following sections we review briefly existing attempts to model these concepts, then explain the methods used in IMPRESSIONS to measure capacities and represent them in modelling and in the analysis of scenarios and pathways.
Options for representing adaptive and coping capacity in integrated assessments
In IMPRESSIONS, adaptive and coping capacity indicators are required in order to supplement the biophysical and ecological modelling (representing natural capital) with a representation of social and economic factors that enable and constrain adaptation and transformation, and determine the ability to cope with extreme conditions and events. These factors are to a large extent a reflection of economic activity and investment decisions leading to changes in physical infrastructure, health, education and so on. The methods we use need to project changes in these factors under the scenarios and pathways.
One option is to construct initial conditions (and in particular their spatial distribution) based on a suite of indicators to reflect capacities, then to consider how these capacities evolve as part of the scenario development process. This is similar to the approaches developed in ATEAM and CLIMSAVE; the World Risk Index could also be adapted for this approach.
10 | Page D4.3: Assessment of coping and adaptive capacity __________________________________________________________________________________
An alternative method would be to model the changes in capitals over time more directly, through a model which has explicit representation of economic activity, investment, and trade. Constructing such a model is beyond the scope of IMPRESSIONS, but existing models could provide the information needed. Models examined included EXIOBASE, GTAP, IIASA and the International Futures model.
2.1.1. ATEAM
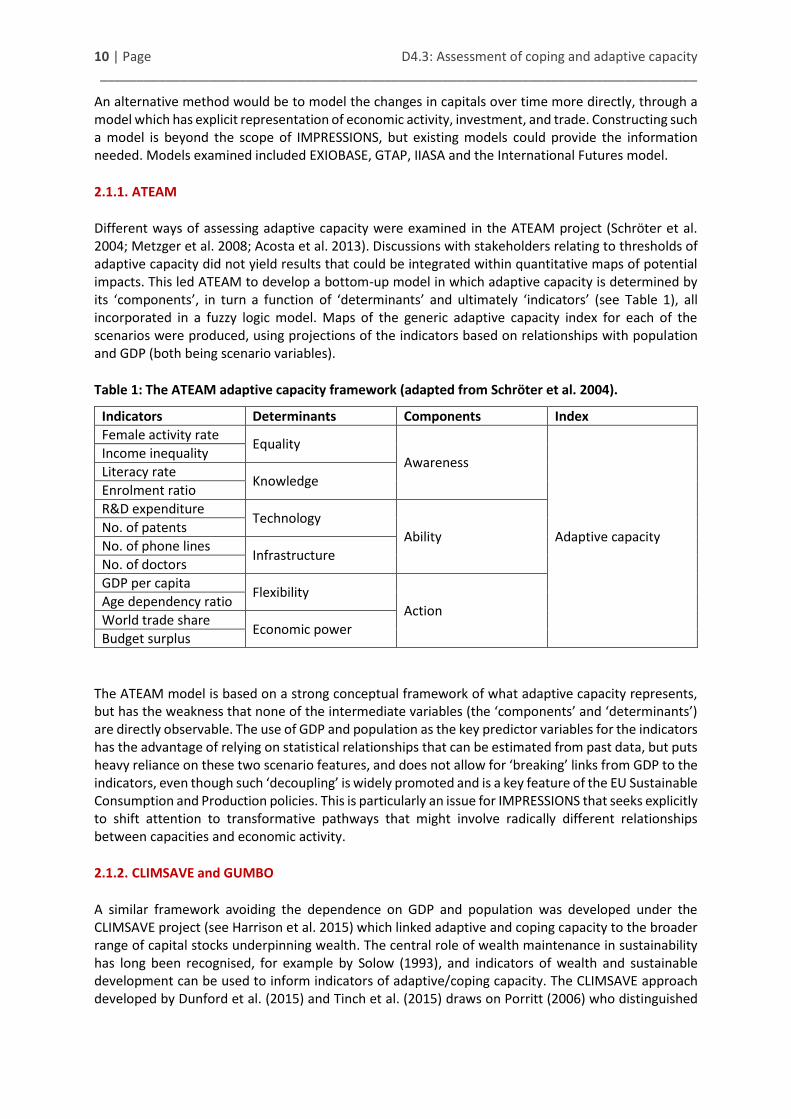
Different ways of assessing adaptive capacity were examined in the ATEAM project (Schröter et al. 2004; Metzger et al. 2008; Acosta et al. 2013). Discussions with stakeholders relating to thresholds of adaptive capacity did not yield results that could be integrated within quantitative maps of potential impacts. This led ATEAM to develop a bottom-up model in which adaptive capacity is determined by its ‘components’, in turn a function of ‘determinants’ and ultimately ‘indicators’ (see Table 1), all incorporated in a fuzzy logic model. Maps of the generic adaptive capacity index for each of the scenarios were produced, using projections of the indicators based on relationships with population and GDP (both being scenario variables).
Table 1: The ATEAM adaptive capacity framework (adapted from Schröter et al. 2004).
Indicators Determinants Components Index
Female activity rate Equality
Awareness
Adaptive capacity
Income inequality
Literacy rate Knowledge
Enrolment ratio
R&D expenditure Technology
Ability No. of patents
No. of phone lines Infrastructure
No. of doctors
GDP per capita Flexibility
Action Age dependency ratio
World trade share Economic power
Budget surplus
The ATEAM model is based on a strong conceptual framework of what adaptive capacity represents, but has the weakness that none of the intermediate variables (the ‘components’ and ‘determinants’) are directly observable. The use of GDP and population as the key predictor variables for the indicators has the advantage of relying on statistical relationships that can be estimated from past data, but puts heavy reliance on these two scenario features, and does not allow for ‘breaking’ links from GDP to the indicators, even though such ‘decoupling’ is widely promoted and is a key feature of the EU Sustainable Consumption and Production policies. This is particularly an issue for IMPRESSIONS that seeks explicitly to shift attention to transformative pathways that might involve radically different relationships between capacities and economic activity.
2.1.2. CLIMSAVE and GUMBO
A similar framework avoiding the dependence on GDP and population was developed under the CLIMSAVE project (see Harrison et al. 2015) which linked adaptive and coping capacity to the broader range of capital stocks underpinning wealth. The central role of wealth maintenance in sustainability has long been recognised, for example by Solow (1993), and indicators of wealth and sustainable development can be used to inform indicators of adaptive/coping capacity. The CLIMSAVE approach developed by Dunford et al. (2015) and Tinch et al. (2015) draws on Porritt (2006) who distinguished

D4.3: Assessment of coping and adaptive capacity 11 | Page __________________________________________________________________________________ five types of capital stocks that together underpin the generation of wealth/wellbeing in a society/economy:
Human capital includes the health, knowledge, skills and motivation of a country’s population as well as its individual emotional and spiritual capacities. It characterises the abilities that lie within an individual member of society. It broadly covers areas of education, job experience, skills and health.
Social capital consists of the structures, institutions, networks and relationships of a country’s population that enable individuals to maintain and develop their human capital in partnership with others, and to be more productive when working together than in isolation. It includes families, communities, businesses, trade unions, voluntary organisations, legal/political systems and educational and health institutions. Social capital can be used for adaptation by, for example, setting up voluntary organisations for emergency help. It includes informal and often local relationships as well as more formalised ones, like the political regime and civil and political institutions and basically refers to the networks and social relations of people.
Manufactured capital consists of material goods, tools, machines, buildings and other forms of infrastructure that contribute to the production process but do not become embodied in its output. Manufactured capital can be created for adaptation by building dams, water pipelines, sea-walls, hospitals, roads, etc.
Financial capital reflects the productive power of the other forms of capital and enables them to be owned and traded.
Natural capital consists of natural assets including geology, soil, air, water and all living things. Natural capital underpins the wide range of ecosystem services that are essential to human life and wellbeing.
Using these stocks as the underpinning for adaptive and coping capacity has the advantage of linking the capacity framework to an existing conceptual framework with substantial research and data available (Omann et al. 2010). Capital stocks are, at least in principle, separately measurable, though available methods do not distinguish between human and social capitals, and give an incomplete accounting of natural capital. The methods presented in World Bank (2005; 2011) derive estimates of Total Wealth broken down into manufactured capital, parts of natural capital, and “intangible capital”. Measurements are in monetary terms, with all capital stocks measured in the same units, and detailed calculations are available for 1995, 2000 and 2005. Intangible capital is measured as a residual (the difference between total wealth and produced and natural capital) and implicitly includes measures of human capital and social/institutional capital as well as components of natural capital that are not measured in the estimate.
UNECE (2009) notes that economic wealth calculated in this way is sensitive to assumptions about future income and to the choice of discount rate. This can be seen as a weakness from the perspective of making predictions. However, it does lend itself reasonably well to a scenario-based approach in which the future levels of income are features of the scenarios, and the objective is not prediction but rather exploration of the consequences of different scenarios, based on stakeholder discussions, to incorporate information on geographical differences and dynamics to inform assessment of likely future changes as part of scenario development.
The capitals approach has also been used successfully in the GUMBO (Boumans et al. 2002) simulation model of the integrated earth system. GUMBO uses estimates of the five capital stocks, and associated flows, differentiated by scenario, as an integral part of the modelling. The main objective was not to make accurate predictions about the future, but rather to scope possible scenarios, providing a simulation tool to facilitate participation in modelling and scenario exploration. In this respect, the

12 | Page D4.3: Assessment of coping and adaptive capacity __________________________________________________________________________________
objectives of GUMBO are similar to those of IMPRESSIONS, although IMPRESSIONS has a much more specific focus, and uses spatially-explicit modelling.
2.1.3. World Risk Index
The World Risk Index is based on globally available indicators selected on a priori grounds as representatives of constituent parts of adaptive and coping capacities. A ‘local’ version has also been developed. Figure 2 presents the indictors used to derive adaptive and coping capacities and their corresponding weightings.
Figure 2: Method (indicators and weightings) to assess coping and adaptive capacity within the World Risk Index (Birkmann et al. 2015).
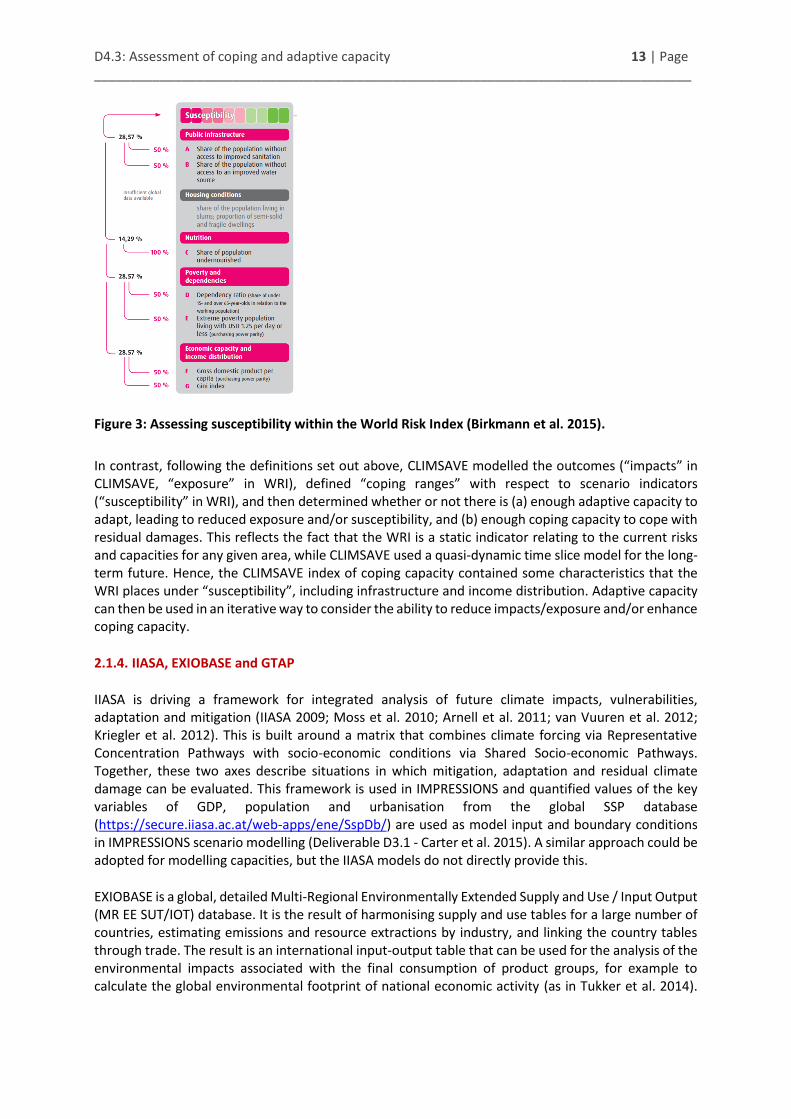
The World Risk Index is then developed by combining these capacities with estimates of exposure and susceptibility. Exposure relates to “natural hazards such as floods, earthquakes, droughts, storms, floods and sea level rise”3, based on how frequently they occurred from 1970 to 2005, and the number of casualties. Some hazards such as volcanic eruptions are not included because of the lack of data and impact. Susceptibility refers to “selected structural characteristics of a society and the framework conditions in which communities face potential natural hazards and climate phenomena”4 (Figure 3).
There are similarities with the ATEAM and CLIMSAVE approaches, in terms of indicator selection. The major difference in approach is that the World Risk Index (WRI) is assessed by multiplying the exposure (E) by an equally-weighted combination of susceptibility (S), coping (CC) and adaptive capacity (AC), together considered to be an index of vulnerability: WRI = E * (1/3*(S+CC+AC)).
3 http://ihrrblog.org/2011/09/26/2011-un-world-risk-index/ 4 http://ihrrblog.org/2011/09/26/2011-un-world-risk-index/
D4.3: Assessment of coping and adaptive capacity 13 | Page __________________________________________________________________________________
Figure 3: Assessing susceptibility within the World Risk Index (Birkmann et al. 2015).
In contrast, following the definitions set out above, CLIMSAVE modelled the outcomes (“impacts” in CLIMSAVE, “exposure” in WRI), defined “coping ranges” with respect to scenario indicators (“susceptibility” in WRI), and then determined whether or not there is (a) enough adaptive capacity to adapt, leading to reduced exposure and/or susceptibility, and (b) enough coping capacity to cope with residual damages. This reflects the fact that the WRI is a static indicator relating to the current risks and capacities for any given area, while CLIMSAVE used a quasi-dynamic time slice model for the long-term future. Hence, the CLIMSAVE index of coping capacity contained some characteristics that the WRI places under “susceptibility”, including infrastructure and income distribution. Adaptive capacity can then be used in an iterative way to consider the ability to reduce impacts/exposure and/or enhance coping capacity.
2.1.4. IIASA, EXIOBASE and GTAP
IIASA is driving a framework for integrated analysis of future climate impacts, vulnerabilities, adaptation and mitigation (IIASA 2009; Moss et al. 2010; Arnell et al. 2011; van Vuuren et al. 2012; Kriegler et al. 2012). This is built around a matrix that combines climate forcing via Representative Concentration Pathways with socio-economic conditions via Shared Socio-economic Pathways. Together, these two axes describe situations in which mitigation, adaptation and residual climate damage can be evaluated. This framework is used in IMPRESSIONS and quantified values of the key variables of GDP, population and urbanisation from the global SSP database (https://secure.iiasa.ac.at/web-apps/ene/SspDb/) are used as model input and boundary conditions in IMPRESSIONS scenario modelling (Deliverable D3.1 - Carter et al. 2015). A similar approach could be adopted for modelling capacities, but the IIASA models do not directly provide this.
EXIOBASE is a global, detailed Multi-Regional Environmentally Extended Supply and Use / Input Output (MR EE SUT/IOT) database. It is the result of harmonising supply and use tables for a large number of countries, estimating emissions and resource extractions by industry, and linking the country tables through trade. The result is an international input-output table that can be used for the analysis of the environmental impacts associated with the final consumption of product groups, for example to calculate the global environmental footprint of national economic activity (as in Tukker et al. 2014).

14 | Page D4.3: Assessment of coping and adaptive capacity __________________________________________________________________________________
The focus on environmental impacts of economic activities is not the best fit for IMPRESSIONS, which already has detailed models representing land use and some natural resources.
A better fit is provided by GTAP, the Global Trade Analysis Project (see Dimaranan and McDougall 2002). This is a multi-region, multi-sector, computable general equilibrium model, with perfect competition and constant returns to scale. The main output of GTAP is a global database describing bilateral trade patterns, production, consumption and intermediate use of commodities and services. The data are grounded in actual current flows and are not directly useful for projecting capitals in scenarios, but can be used to initialise further modelling. Hence, GTAP data underpin the economic modelling in the International Futures (IF) model, which combines this representation of the global economic system with key data from the Shared Socio-economic Pathways.
2.1.5. International Futures model (IFs)
International futures (IFs) is a free global integrated assessment model (with regional and country details) with a long-term focus (base cases from 2010 and scenario exploration until 2100). The IFs project started in 1980 and seven model generations have been developed since then. This model has been used for the United Nations Human Development Report (Hughes et al. 2011) and the Global Environmental Outlook5.
In principle, IFs and IMPRESSIONS are strongly complementary. Details of the model and the rationale for exploring it in detail are presented in Annex B. Briefly, IFs is strong on the components absent from IMPRESSIONS – notably modelling the whole world economy, modelling production by sector, feeding back into consumption, savings, and investments with balanced budgets – but is weak where the IMPRESSIONS Integrated Assessment Platform (IAP2) is strong, having very little in the way of spatial detail and nothing on land use or environment beyond a representation of climate change, GHG emissions and water use. There is a good overlap between the IFs scenarios and three of the SSPs, and the remaining SSP could be replicated.
To explore this further, a long list of all the reported6 IFs variables (1340 variables) was considered, to create a much shorter list (150) that are potentially useful in IMRESSIONS. There is considerable overlap with the variables used in Dunford et al. (2015) that would permit ‘replication’ of their capacity index using IFs variables - the only major gap is the 'social cohesion' part of the social capital index, which uses the 'help when threatened' indicator that is not present in IFs. However, the patterns in these variables exhibit a convergence over time such that in most cases by 2100 there is quite limited variability, in particular across countries but also across scenarios (see Figure 4 for an example). Furthermore, the actual model relationships underpinning the variables are strongly dependent on GDP and population (much like the ATEAM approach) which limits the appeal of using them as a way of modelling features that are not captured by GDP (which is already a scenario variable in IMPRESSIONS).
IFs includes several parameters that could underpin capital measures, for example from the parameters that influence productivity/growth. These include for example indicators of government effectiveness, government corruption and freedom/democracy that could be combined to represent social capital; and indicators of traditional infrastructure and ICT infrastructure that could represent manufactured capital. However, they are scenario input parameters (multipliers, in the case of the first
5 http://www.unep.org/geo/ 6 There are others that are calculated as internal steps, but not kept.

D4.3: Assessment of coping and adaptive capacity 15 | Page __________________________________________________________________________________ three cited, and elasticities for the last two) in IFs rather than anything modelled within the system, so they do not develop over time within scenarios.
Similarly, the original idea of using the IFs multi-factor productivity coefficients for each capital was not feasible, because these are not absolute measures, but rather relative ones, used to adjust the production function according to whether the capital in question is higher or lower than what would be expected/normal for a country at a given level of output/development (see Figure 4).
Figure 4: Examples of simulated times series of national multi-factor productivity coefficients (MFPSC) from International Futures model showing convergence over time for European countries.
The apparent advantage from the IMPRESSIONS perspective of using IFs variables is that these are modelled dynamically for each scenario, with feedbacks/consistency (e.g. total investments are limited by production and consumption), whereas an approach based on historical data for indicators only allows calculation for the base year, and must then be projected forwards using scenario-dependent assumptions. Hence, the spatial patterns stay the same as in the baseline - unless these assumptions are constructed to vary across countries, but that would require substantial demands on stakeholder/expert time. In practice, however, there are several disadvantages:
IFs variables are at national scales, whereas in IMPRESSIONS we are using NUTS1 or 2. It would be possible to adjust some IFs variables for which we have baseline data available at sub-national level, under the assumption that this within-nation variability remains fixed;
IFs is built on the assumption of convergence, i.e. the weaker societies gradually close the gap with the stronger ones. This is inconsistent with some of the SSPs, and results in much reduced variation across societies at the longer timescales of interest in IMPRESSIONS (see Figure 4);
16 | Page D4.3: Assessment of coping and adaptive capacity __________________________________________________________________________________
The variables in IFs are very strongly driven by the link to GDP, making them less interesting in terms of other sources of variability across scenarios/countries, and less suitable for studying transformative solutions.
Therefore, having examined the time-paths of the candidate variables within IFs, the conclusion was reached that modelling capacities through IFs (or similar approaches) would not give the range of capacity variation that is required for broad thinking about transformative pathways in response to the possibly extreme changes under high-end scenarios. This is in part because the relevant variables in these models are either fixed (elasticities/multipliers) or strongly linked to GDP and/or population, curtailing the extent to which the components of a capacity index could vary independently. This is an important part of thinking about transformative options – for example, pathways that cope with declining economic performance through building up social and human capital. We concluded that stakeholder- and expert-driven methods were more useful for the purposes of exploring transformative pathways.
Developing capacity indicators for IMPRESSIONS
Two integrated modelling platforms are being developed and applied within IMPRESSIONS (see Deliverable D3B.1 - Holman et al. 2015) – the IMPRESSIONS Integrated Assessment Platform 2 (IAP2) and the European regional Integrated Assessment Model (rIAM) which are both further developments of the CLIMSAVE Integrated Assessment Platform (IAP; Holman and Harrison 2012; Harrison et al. 2015). The principal difference between the two platforms (outlined in Holman et al. 2015) is the treatment of time, with the rIAM having an automated time-stepping approach whereas the IAP2 runs on time slices with the user moving between time slices. Both platforms contain a similar series of linked sectoral models which are described in Deliverable D3B.1 (Holman et al. 2015).
Within IAP2 and rIAM, the capacity framework is required to serve two main purposes:
To define adaptive capacity as a constraint on the amount of adaptation that can feasibly be carried out in any given scenario at any time period;
To define coping capacity as a determinant of the extent of coping that is feasible at a particular time and place in any given scenario.
The research in IMPRESSIONS sought to explore alternative methods for representing the capitals, to extend the time horizon to 2100 within IAP2, and to move to a dynamic model for rIAM. Following the review of options (see Section 2.1) the decision was taken to build on the methods developed in the CLIMSAVE project as set out in Dunford et al. (2015) and Tinch et al. (2015). The capacity index is developed based on indices of four capitals, each of which is in turn dependent on two indicators (Table 2). A natural capital component is not included in the index, because substantial components of the natural environment are formally modelled within IAP2 and rIAM. The remaining components – human, social, manufactured and financial capitals – need to be represented separately in the scenarios and through the incorporation of indicators of capitals in the modelling.
The Dunford et al. (2015) methodology requires three main sets of inputs:
(i) Initial raw, spatially-explicit baseline values of the capital indicators (listed in Table 2) quantified using available datasets (e.g. Eurostat);
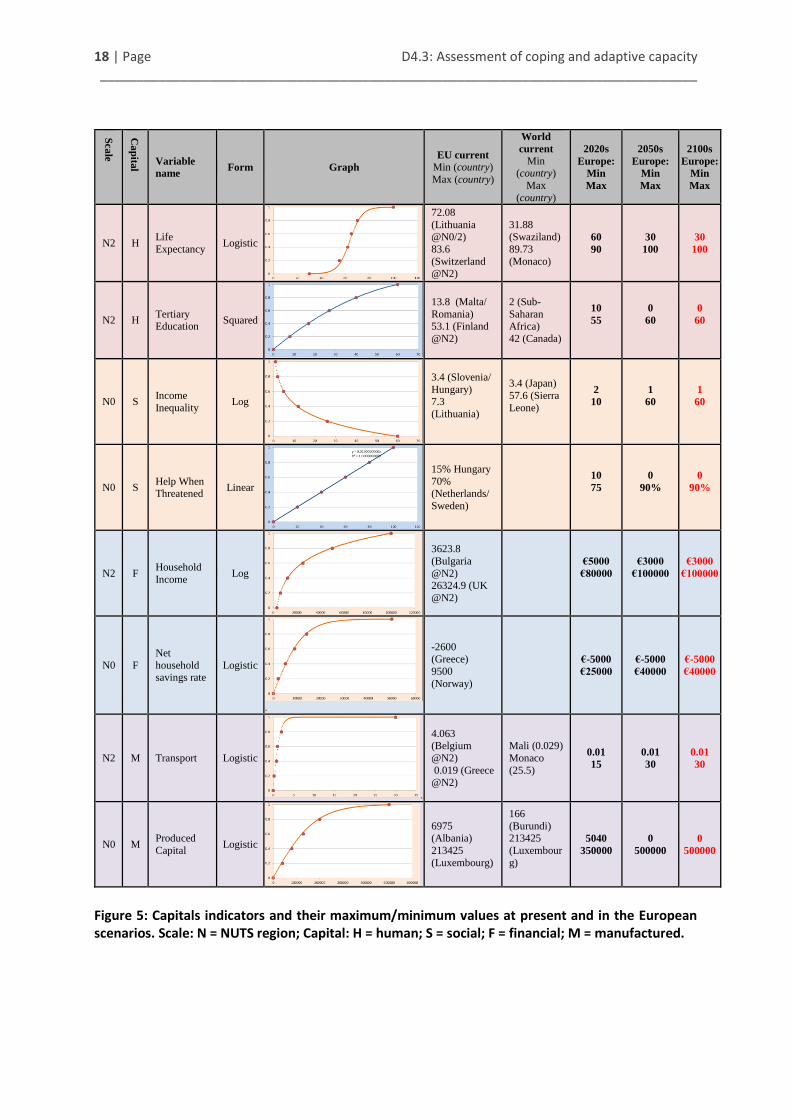
(ii) Expert-derived curves tying indicator values to levels of available capital (shown in Figure 5); and
(iii) Stakeholder-derived estimates of how these capital levels “shift” between time periods within the scenarios.

D4.3: Assessment of coping and adaptive capacity 17 | Page __________________________________________________________________________________ Table 2: The components of the IMPRESSIONS coping capacity index.
Of these, only the final dataset, the shifts in capitals with time, need to be modified to customise them to the SSP socio-economic scenarios used within the IMPRESSIONS project. These capital shifts (both positive and negative; explained in Section 2.2.1) are used to project indicator levels for different future scenarios and allow both capitals and, ultimately, capacities to be derived from them. The approach therefore starts from stakeholder-derived qualitative estimates of changes in capital levels over time, using these to project indicator levels for different scenarios, and then using those to calculate capitals. This may appear circular, but it is in fact useful because the baseline indicators are available in a spatially disaggregated form (NUTS1 or 2). This means that the method enables spatial mapping of capitals and coping capacity, based on stakeholder understanding of scenarios, but without making excessive demands on stakeholder time and thinking.
2.2.1. Using the IAP2 to project capitals for the IMPRESSIONS stakeholder workshops
The IAP2 was used to provide information on the capitals available within the scenarios for the IMPRESSIONS European and Scottish stakeholder workshops. This section details the methodology followed to produce these outputs for the SSP scenarios out to 2100 within the IAP2.
Step 1: Baseline Capital values
To quantify levels of baseline capital (from which scenarios can change through time) existing capital settings calculated by Dunford et al. (2015), and embedded in the IAP2 were used. These capital levels were determined based on published data sources by linking key indicator variables to levels of available capital by developing functional forms that reflected the expected relationships (Figure 5). This approach was complemented by a panel of IMPRESSIONS experts that defined plausible extreme values and distributions for each indicator, based on the stakeholder-derived scenarios and current data.
18 | Page D4.3: Assessment of coping and adaptive capacity __________________________________________________________________________________
Sca
le
Ca
pita
l
Variable
name Form Graph
EU current
Min (country)
Max (country)
World
current
Min (country)
Max
(country)
2020s
Europe:
Min
Max
2050s
Europe:
Min
Max
2100s
Europe:
Min
Max
N2 H Life
Expectancy Logistic
72.08
(Lithuania @N0/2)
83.6
(Switzerland @N2)
31.88 (Swaziland)
89.73
(Monaco)
60
90
30
100
30
100
N2 H Tertiary
Education Squared
13.8 (Malta/
Romania)
53.1 (Finland
@N2)
2 (Sub-
Saharan
Africa)
42 (Canada)
10
55
0
60
0
60
N0 S Income
Inequality Log
3.4 (Slovenia/
Hungary) 7.3
(Lithuania)
3.4 (Japan)
57.6 (Sierra
Leone)
2
10
1
60
1
60
N0 S Help When Threatened
Linear
15% Hungary
70% (Netherlands/
Sweden)
10
75
0
90%
0
90%
N2 F Household
Income Log
3623.8
(Bulgaria
@N2) 26324.9 (UK
@N2)
€5000
€80000
€3000
€100000
€3000
€100000
N0 F
Net
household savings rate
Logistic
.
-2600 (Greece)
9500
(Norway)
€-5000
€25000
€-5000
€40000
€-5000
€40000
N2 M Transport Logistic
.
4.063 (Belgium
@N2)
0.019 (Greece @N2)
Mali (0.029)
Monaco
(25.5)
0.01
15
0.01
30
0.01
30
N0 M Produced
Capital Logistic
6975 (Albania)
213425
(Luxembourg)
166
(Burundi) 213425
(Luxembour
g)
5040
350000
0
500000
0
500000
Figure 5: Capitals indicators and their maximum/minimum values at present and in the European scenarios. Scale: N = NUTS region; Capital: H = human; S = social; F = financial; M = manufactured.
D4.3: Assessment of coping and adaptive capacity 19 | Page __________________________________________________________________________________ Step 2: Determining scenario-driven changes in capitals (“the shifts”)
The first step in projecting the capitals for new scenarios to 2100 within the IAP2 was to identify the direction and magnitude of changes in each of the four capitals within each of the SSPs for three time periods: 2010–2025; 2025–2055; and 2055–2100.
This was achieved through stakeholder consultation and expert workshops in iteration with the IAP2 modelling team. For each SSP and each time slice, the expected direction (positive or negative) and magnitude (high, moderate, or none) of the change in each capital stock was estimated to reflect the scenario storyline (Table 3). These values were then translated into integer inputs for the IAP2 modelling though consultation between the modelling and stakeholder workshop teams.
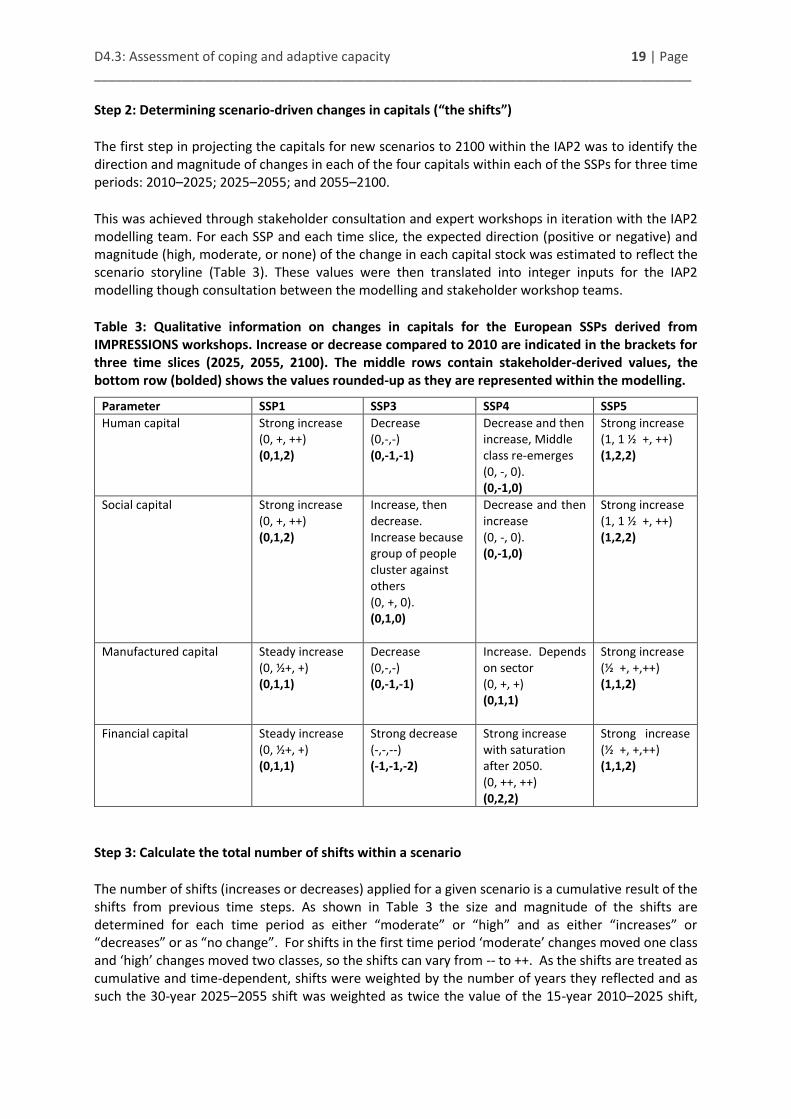
Table 3: Qualitative information on changes in capitals for the European SSPs derived from IMPRESSIONS workshops. Increase or decrease compared to 2010 are indicated in the brackets for three time slices (2025, 2055, 2100). The middle rows contain stakeholder-derived values, the bottom row (bolded) shows the values rounded-up as they are represented within the modelling.
Parameter SSP1 SSP3 SSP4 SSP5
Human capital Strong increase (0, +, ++) (0,1,2)
Decrease (0,-,-) (0,-1,-1)
Decrease and then increase, Middle class re-emerges (0, -, 0). (0,-1,0)
Strong increase (1, 1 ½ +, ++) (1,2,2)
Social capital Strong increase (0, +, ++) (0,1,2)
Increase, then decrease. Increase because group of people cluster against others (0, +, 0). (0,1,0)
Decrease and then increase (0, -, 0). (0,-1,0)
Strong increase (1, 1 ½ +, ++) (1,2,2)
Manufactured capital Steady increase (0, ½+, +) (0,1,1)
Decrease (0,-,-) (0,-1,-1)
Increase. Depends on sector (0, +, +) (0,1,1)
Strong increase (½ +, +,++) (1,1,2)
Financial capital Steady increase (0, ½+, +) (0,1,1)
Strong decrease (-,-,--) (-1,-1,-2)
Strong increase with saturation after 2050. (0, ++, ++) (0,2,2)
Strong increase (½ +, +,++) (1,1,2)
Step 3: Calculate the total number of shifts within a scenario
The number of shifts (increases or decreases) applied for a given scenario is a cumulative result of the shifts from previous time steps. As shown in Table 3 the size and magnitude of the shifts are determined for each time period as either “moderate” or “high” and as either “increases” or “decreases” or as “no change”. For shifts in the first time period ‘moderate’ changes moved one class and ‘high’ changes moved two classes, so the shifts can vary from -- to ++. As the shifts are treated as cumulative and time-dependent, shifts were weighted by the number of years they reflected and as such the 30-year 2025–2055 shift was weighted as twice the value of the 15-year 2010–2025 shift,

20 | Page D4.3: Assessment of coping and adaptive capacity __________________________________________________________________________________
while the 45-year 2055–2100 shift was weighted at three times that value. Any half values from the workshops were rounded up when converting into integer shifts within the IAP2.
This meant that the maximum total range of possible shifts is -12 to +12 in IMPRESSIONS (with ++ for all three periods counting as +2 for 2020s, +4 for 2050s and +6 for 2100s). However, in practice the shifts are truncated at +10 as shifts this extreme are considered to be sufficient to shift even the extreme values from baselines to maximum/minimum indicator values depending on the trajectory. The shift scores are as shown in Table 4. Hence the sequence (-, -, --) for SSP3 financial capital in Table 1 is converted to (M-, M-, H-) and would be evaluated as {-1,-2,-6} for a net impact by 2100 of -9 steps on the indicator scale.
Table 4: Conversion of capital change shifts to sliding scale.
Shift Standardisation maximum 2020 2050 2100
H+ High positive +2 +4 +6
M+ Moderate positive +1 +2 +3
0 No change 0 0 0
M- Moderate negative -1 -2 -3
H- High negative -2 -4 -6
Step 4: Determining the standardisation range for shifts
Following the methodology of Dunford et al. (2015), the scenario-driven shifts in overall capital availability are used to determine limits between which indicator variables are re-standardised to reflect changes through time. These re-standardisation limits (Table 5, Figure 5) were created in Dunford et al. (2015) with reference to the plausible 2020s and 2050s European and World maximum and minimum values for each indicator variable, and intended to represent a situation at which an indicator variable is contributing the most/least it possibly can to a capital – arguing, for example, that increasing tertiary education levels above 60% will not represent a relevant (to adaptive/coping capacity) increase in human capital. However, they needed to be customised for IMPRESSIONS to take into consideration both the extension of the time frame (to 2100), and the addition of an extra time step (from two time steps to three).
With respect to the time frame, within Dunford et al. (2015), plausible minima and maxima for each indicator value were developed for the 2050s and later times were not considered. However, within this work the 2050s extremes were used to represent the “far future” rather than 2050s specifically. Consequently, it was decided that, for IMPRESSIONS, it was reasonable to use Dunford et al.’s 2050s plausible minimum and maximum values to reflect the 2100s (see Figure 5).
The addition of the 2055–2100 time step within IMPRESSIONS required the standardisation process from Dunford et al. (2015) to be modified. The grey lines in Figure 6 show the re-standardisation approach used in the first IAP (Dunford et al., 2015). To include the additional time step two changes were made. Firstly, the number of shifts possible was extended from 6 in the original IAP to a 10 point scale in IMPRESSIONS (the red boxes on Figure 6) and, secondly, the existing boxes in shifts +/-3 to 6 were fine-tuned to slightly slow the rate at which maximum values could be reached (the blue boxes shown in Figure 6 – the original Dunford et al. (2015) boxes are shown in grey).

D4.3: Assessment of coping and adaptive capacity 21 | Page __________________________________________________________________________________ Table 5: Mapping capital change shifts onto indicator ranges.
Shift Standardisation maximum Standardisation minimum
10+ 2050s Max 2050s Max
9+ 2050s Max 2020s Max + 0.75 * (2050-2020s Range)
8+ 2050s Max 2020s Max + 0.5 * (2050-2020s Range)
7+ 2050s Max 2020s Max + 0.25 * (2050-2020s Range)
6+ 2050s Max 2020s Max
5+ 2050s Max (Current max + 2020 max)/2
4+ 2050s Max Current Max
3+ (Current max + 2050 max)/2 Current Min + 0.75*(Current Range)
2+ 2020s Max Current Min + 0.5*(Current Range)
1+ (Current max + 2020 max)/2 Current Min + 0.25*(Current Range)
0 Current max Current min
1- Current Min + 0.75*(Current Range) (Current min + 2020s min)/2
2- Current Min + 0.5*(Current Range) 2020s min
3- Current Min + 0.25*(Current Range) (2020s min + 2050s min)/2
4- Current min 2050s min
5- (Current min + 2020s min)/2 2050s min
6- 2020s min 2050s min
7- 2020s min - 0.25 * (2050-2020s Range) 2050s min
8- 2020s min - 0.5 * (2050-2020s Range) 2050s min
9- 2020s min - 0.75 * (2050-2020s Range) 2050s min
10- 2050s min 2050s min
Figure 6: Example of capital shifts for the human capital life expectancy indicator. Red boxes are new additions required to allow shifts to 2100 and blue boxes show modifications from the Dunford et al. (2015) standardisations shown as grey boxes. The initial spread of data is shown as the grey box at 0 shifts. The box around shifts +2 to -2 is to illustrate the scope of change considered plausible in the first timestep.

22 | Page D4.3: Assessment of coping and adaptive capacity __________________________________________________________________________________
Step 5: Applying the re-standardisations to produce scenario-relevant capital indicators
With the re-standardisation ranges determined, scenario values for each capital indicator were then calculated by applying the re-standardisations associated with the appropriate number of shifts for that time step as calculated in step 3. Applying the shifts takes the full distribution of capital availability at the baseline across the regions and re-standardises them between new maximum and minimum values, thereby maintaining the ordering of regions based on their levels of capital at baseline (based on contemporary data), but allowing the levels of capital to increase and decrease in line with the scenario storylines.
The shifts and thresholds allow all countries to have very low and very high levels of indicators (and hence capitals) under the scenarios. Figure 7 illustrates this for the human capital indicator of life expectancy. The figure illustrates how the order of regions is maintained whilst the absolute levels of capital are able to increase/decrease: a location at the bottom of the distribution will always be lowest, but could attain increasingly higher levels of the indicator in question. Thus the approach is focussed on across-the-board adaptations and transformations, not for considering the implications of different approaches in different regions.
Step 6: producing scenario-relevant capital indicators, and coping and adaptive capacities
Following transformation, each pair of indicator variables is averaged (assuming equal weighting) to calculate capital variables. Each capital indicator is spatially-explicit and resolved at either the NUTS 1 or NUTS 2 spatial resolution. The capital variables are then used in two ways to provide important inputs to the IMPRESSIONS scenario workshops. Firstly, coping capacity is calculated as the average of the four available capitals and is used for vulnerability assessment within the IAP2. Secondly, the four capital datasets produced are used to set the limits for adaptation within the IAP2. Furthermore the capital maps are shown to stakeholders within the workshops to contextualise the spatial patterns in available capital within the scenarios in each time period. The following section discusses in more detail the roles of these indicators in the adaptation and vulnerability assessment.
Use of capitals in adaptation and vulnerability assessment
As noted above, the capitals measures are being used for two main purposes in IAP2 and rIAM: firstly as constraints on the amount of adaptation that is feasible in a given time period under the scenarios, and secondly as determinants of coping capacity in the vulnerability assessment.
2.3.1. Adaptive capacity and limiting capitals
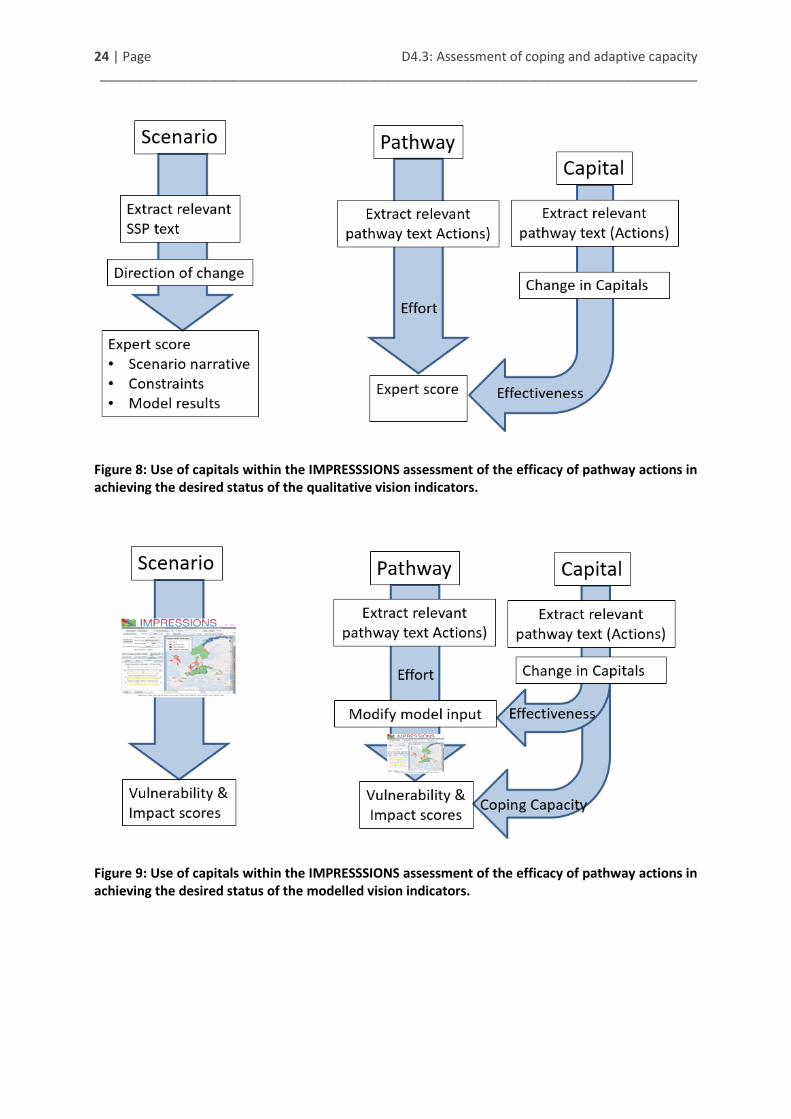
The capital levels determined for the scenarios have been used as a representation of adaptive capacity to qualitatively or quantitatively determine the effectiveness of the adaptation actions within each pathway in moving towards the vision. For adaptations that fall outside the capabilities of the IAP2 modelling (the “qualitative stream”: see Section 3 and Figure 8), this is done by using the capitals to inform the expert assessments of the likely effectiveness of the adaptation effort in reaching the desired status of the vision indicators (Figure 8).
For the modelled options in IAP2 (the “quantitative stream”), the capital levels are used to modify the model inputs that represent adaptation, by using the capitals to derive limits on the levels of adaptation measures that were considered feasible in any given scenario (Figure 9). The adaptation options in the IAP2 are represented by ‘sliders’ through which the level of adaptation is controlled (see Table 6). Stakeholder workshops and sector-specific expert judgement were used to determine the specific options that might be used to bring about the adaptation, and their requirements in terms of
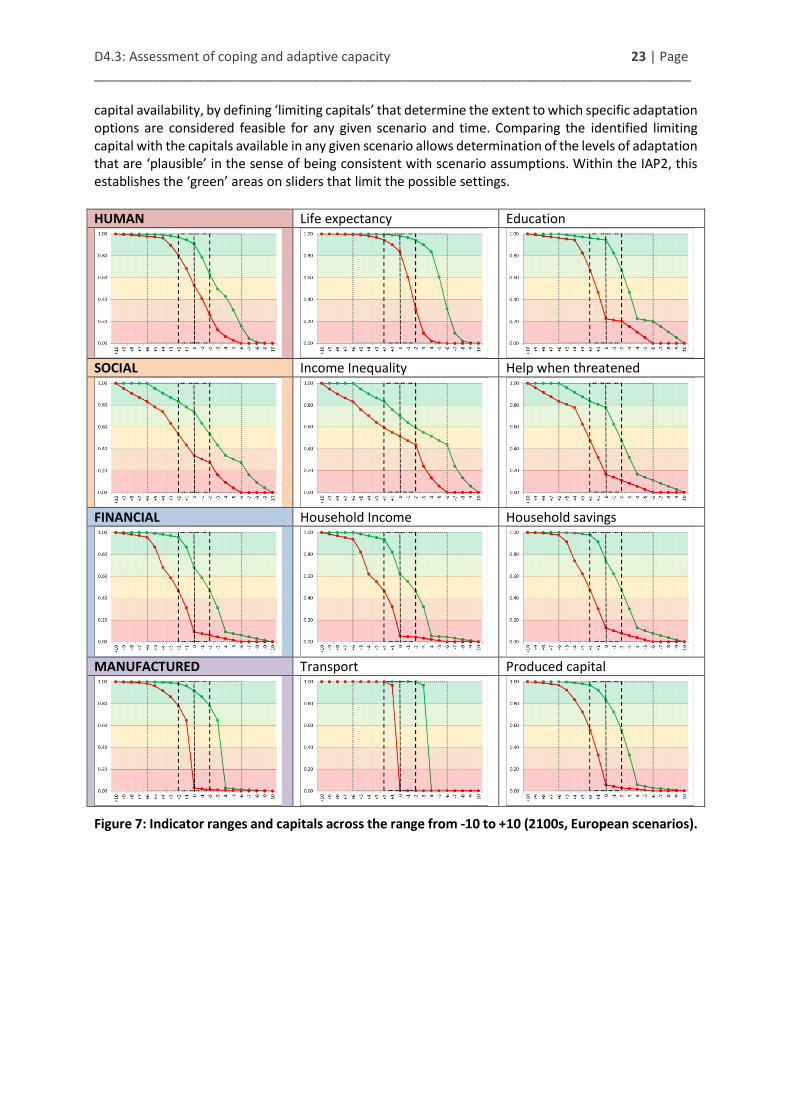
D4.3: Assessment of coping and adaptive capacity 23 | Page __________________________________________________________________________________ capital availability, by defining ‘limiting capitals’ that determine the extent to which specific adaptation options are considered feasible for any given scenario and time. Comparing the identified limiting capital with the capitals available in any given scenario allows determination of the levels of adaptation that are ‘plausible’ in the sense of being consistent with scenario assumptions. Within the IAP2, this establishes the ‘green’ areas on sliders that limit the possible settings.
HUMAN Life expectancy Education
SOCIAL Income Inequality Help when threatened
FINANCIAL Household Income Household savings
MANUFACTURED Transport Produced capital
Figure 7: Indicator ranges and capitals across the range from -10 to +10 (2100s, European scenarios).
24 | Page D4.3: Assessment of coping and adaptive capacity __________________________________________________________________________________
Figure 8: Use of capitals within the IMPRESSSIONS assessment of the efficacy of pathway actions in achieving the desired status of the qualitative vision indicators.
Figure 9: Use of capitals within the IMPRESSSIONS assessment of the efficacy of pathway actions in achieving the desired status of the modelled vision indicators.
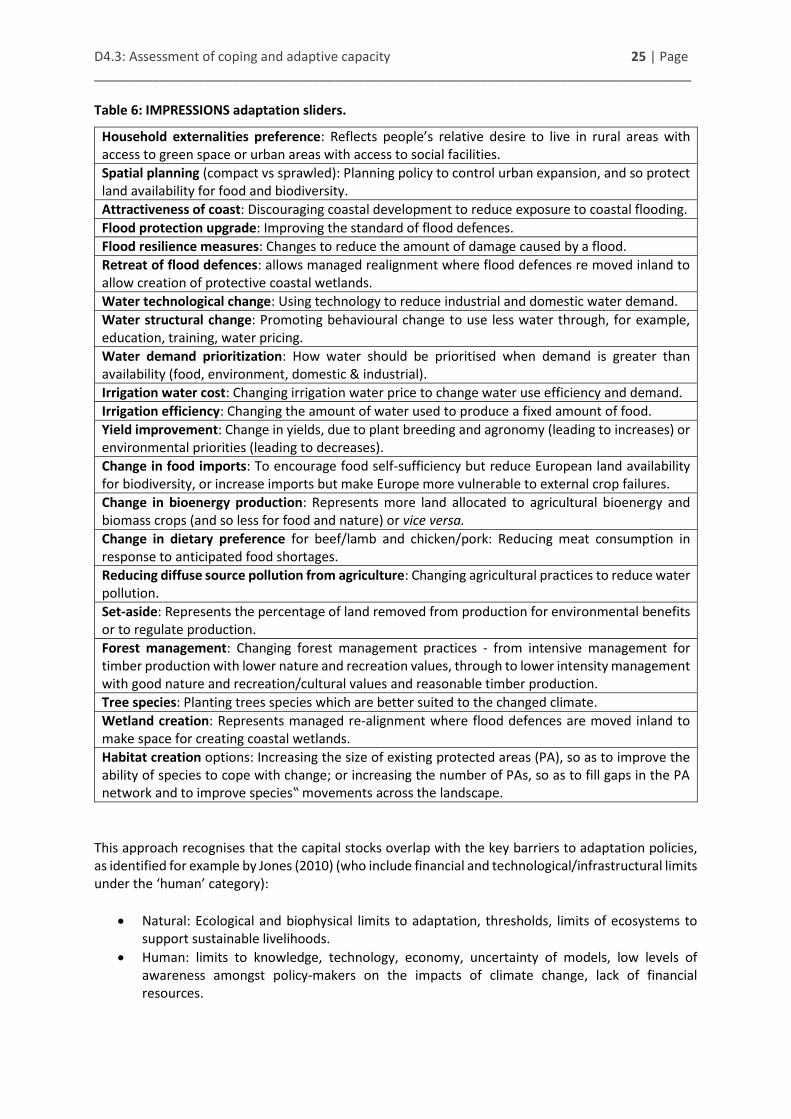
D4.3: Assessment of coping and adaptive capacity 25 | Page __________________________________________________________________________________ Table 6: IMPRESSIONS adaptation sliders.
Household externalities preference: Reflects people’s relative desire to live in rural areas with access to green space or urban areas with access to social facilities.
Spatial planning (compact vs sprawled): Planning policy to control urban expansion, and so protect land availability for food and biodiversity.
Attractiveness of coast: Discouraging coastal development to reduce exposure to coastal flooding.
Flood protection upgrade: Improving the standard of flood defences.
Flood resilience measures: Changes to reduce the amount of damage caused by a flood.
Retreat of flood defences: allows managed realignment where flood defences re moved inland to allow creation of protective coastal wetlands.
Water technological change: Using technology to reduce industrial and domestic water demand.
Water structural change: Promoting behavioural change to use less water through, for example, education, training, water pricing.
Water demand prioritization: How water should be prioritised when demand is greater than availability (food, environment, domestic & industrial).
Irrigation water cost: Changing irrigation water price to change water use efficiency and demand.
Irrigation efficiency: Changing the amount of water used to produce a fixed amount of food.
Yield improvement: Change in yields, due to plant breeding and agronomy (leading to increases) or environmental priorities (leading to decreases).
Change in food imports: To encourage food self-sufficiency but reduce European land availability for biodiversity, or increase imports but make Europe more vulnerable to external crop failures.
Change in bioenergy production: Represents more land allocated to agricultural bioenergy and biomass crops (and so less for food and nature) or vice versa.
Change in dietary preference for beef/lamb and chicken/pork: Reducing meat consumption in response to anticipated food shortages.
Reducing diffuse source pollution from agriculture: Changing agricultural practices to reduce water pollution.
Set-aside: Represents the percentage of land removed from production for environmental benefits or to regulate production.
Forest management: Changing forest management practices - from intensive management for timber production with lower nature and recreation values, through to lower intensity management with good nature and recreation/cultural values and reasonable timber production.
Tree species: Planting trees species which are better suited to the changed climate.
Wetland creation: Represents managed re-alignment where flood defences are moved inland to make space for creating coastal wetlands.
Habitat creation options: Increasing the size of existing protected areas (PA), so as to improve the ability of species to cope with change; or increasing the number of PAs, so as to fill gaps in the PA network and to improve species‟ movements across the landscape.
This approach recognises that the capital stocks overlap with the key barriers to adaptation policies, as identified for example by Jones (2010) (who include financial and technological/infrastructural limits under the ‘human’ category):
Natural: Ecological and biophysical limits to adaptation, thresholds, limits of ecosystems to support sustainable livelihoods.
Human: limits to knowledge, technology, economy, uncertainty of models, low levels of awareness amongst policy-makers on the impacts of climate change, lack of financial resources.

26 | Page D4.3: Assessment of coping and adaptive capacity __________________________________________________________________________________
Social: psychological, behavioural, and socio-institutional elements defining how people and societies react in the case of climate stress (behaviour in case of changes and uncertainties for taking adaptation actions now, acceptance of risks, norms, traditions and religious norms, inequities, institutional flexibility).
2.3.2. Coping capacity in vulnerability assessment
In addition to the role of constraining adaptation options along pathways, capitals are used in IMPRESSIONS as the basis for the coping capacity index in vulnerability assessment to determine whether or not society has sufficient resources to cope with a given level of (residual) climate change impact (see Figures 1 and 10). Within the IAP2, vulnerability indices are created for six aspects of the environment: food provision, water stress, flooding, biodiversity loss, landscape diversity and land use intensity. This is done by combining levels of impact produced as outputs from the integrated modelling (e.g. the food production index, the water exploitation index, or the proportion of species with suitable climate and habitat space) with information on the spatial pattern of coping capacity (calculated as the average of the four capitals – see Section 2.2.1, Step 6)
Figure 10: Overview of the IMPRESSIONS vulnerability approach taken within the IAP2.
These two datasets are combined with two “coping thresholds” determined separately for each indicator. The “lower coping threshold” determines the level below which impacts are considered to have a negligible effect on human wellbeing; the “upper coping threshold” determines the level of impact beyond which it is not possible to cope even given maximum coping capacity. By comparing the level of the impact indicator to these thresholds and the available capital, vulnerability can mapped spatially classified into four classes (see Figure 1):

D4.3: Assessment of coping and adaptive capacity 27 | Page __________________________________________________________________________________
“Coping – impact considered negligible”;
“Coping – sufficient capacity to cope with the impact”;
“Not coping – insufficient coping capacity to deal with the impact”; and,
“Not coping – impact is too high for coping capacity to enable coping”
These vulnerability indicators and maps of vulnerability were used as inputs to the stakeholder workshops contributing to the discussions with regard to whether stakeholders’ adaptation approaches had helped them approach elements of their desired vision (e.g. see Figure 16).
3. Use of capacities in scenarios, visions and pathways in IMPRESSIONS
Across the IMPRESSIONS project, the aim has been to develop mitigation, adaptation and transformation pathways that reduce climate change, prepare and protect societies from the impacts of climate change and support transformations towards sustainability and resilience in the context of high-end scenarios. The pathways have been developed by stakeholders to help find integrated solutions to address high-end climate change as a transformation challenge, and to combine the perspective on how system conditions shape the adaptive and coping capacities of societies as well as how actors can actively influence it.
This strategic approach not only links mitigation, adaptation and coping, but also positions them in a broader context of societal transformations (Abel et al. 2016; Foxon 2013; Wise et al. 2014). The pathways thereby generate policy-relevant knowledge on possible courses of action for achieving desirable transformations, synergies and trade-offs between different actions and strategies, robust actions and solutions across different scenarios, and the institutional and agency capacities that are needed to implement them.
The assessment of coping and adaptive capacities fits in to this overarching framework in several ways. In the previous section, we discussed the construction of the capacity indices and their use in the modelling frameworks as representations of adaptive capacity constraints in the IAP2 and as representations of coping capacity in the vulnerability assessment.
The full details of the research on scenarios, visions and pathways are presented in Deliverable D4.2 (Hölscher et al. 2017). In the following, we first summarise the overall process and then focus on how the scenarios, visions and pathways were developed and analysed in reference to the capitals. The capitals analysis includes qualitative and quantitative assessments of what capitals are available in the scenarios as well as what capitals are created, mobilised and put in use through the pathways.
Building blocks and process steps for co-creating scenarios, visions and pathways
The combined scenarios, visions and pathways approach adopted in IMPRESSIONS is built on a set of key research and policy questions addressed in IMPRESSIONS:
High-end scenarios (where might we be?): The high-end scenarios provide, through their distinct contexts, different enabling and disabling conditions for building resilience and promoting sustainability.
Vision (where do we want to be?): The vision includes normative statements that guide the development of pathways towards a desirable – sustainable and resilient – future.
Pathways (how do we get there?): The pathways include short-, medium- and long-term actions clustered in strategies that respond to specific vision elements. Pathways include

28 | Page D4.3: Assessment of coping and adaptive capacity __________________________________________________________________________________
sectoral or cross-sectoral and multi-actor strategies that demonstrate how to achieve the vision (or specific vision elements) in the context of high-end scenarios.
Adaptive capacities (with what do we get there?): The adaptive capacities enable and constrain the various adaptation options, by reflecting the resources available to societies with which to realise the visions. They also determine the extent of ability of societies to cope with residual impacts
Governance capacities (with whom do we get there?): The governance capacities indicate the collective abilities of actors to develop and implement adaptation, mitigation and transformation responses to climate change and socio-economic conditions and to move towards the vision. The capacities of actors are conditioned by the scenario context. The pathways mobilise and build up the capacities available in the scenarios to develop and implement strategies and actions.
The scenarios, visions and pathways have been co-created with stakeholders through a series of workshops in each case study (Deliverables D2.2 - Kok and Pedde 2016; and D4.2 - Hölscher et al. 2017). Figure 11 illustrates the relationships between these building blocks.
Figure 11: Schematic illustration of the relationships between the scenarios, visions and pathways. Under (4) A = Adaptation; M = Mitigation; T = Transformation.
In the first workshop series, the stakeholders developed socio-economic scenarios informed or contextualised by the SSPs for each case study. After drafting the scenarios (Kok and Pedde 2016), the climate impacts of the scenarios were modelled (see Deliverables D3A.1 – Carter et al. 2016; D3B.2 – Holman et al. 2017; and D3C.2 – Clarke et al. 2017). Between the first and second workshops, as well as during discussion in the second workshop, the stakeholders in each case study developed and agreed on a vision for 2100 (desired end-goals), which included a diverse range of qualitative vision elements (#2 in Figure 11). Modelling results for each case study were then presented to stakeholders, illustrating the consequence of each of the integrated RCP x SSP combinations (i.e. moving from #1 to #3 in Figure 11).
In the second workshop series, the ‘integrated scenario context’ – the socio-economic scenario narratives together with climate change scenarios – were presented to the stakeholders. In response to the differences between aspects of the scenario trajectory (#3 in Figure 11) and their vision (#2),
D4.3: Assessment of coping and adaptive capacity 29 | Page __________________________________________________________________________________ the stakeholders identified a range of adaptation, mitigation and transformation actions (#4) that they thought would move the scenario future closer (#5) to the vision (#2).
After the second set of workshops, the proto-pathways for dealing with the high-end integrated scenarios and contributing to broader societal transformations towards sustainability and resilience were developed and analysed based on the formulated responses. Briefly (for detail, see Deliverable D4.2 - Hölscher et al. 2017), the process of constructing the proto-pathways involved:
(i) The stakeholders’ actions were clustered into strategies: clusters of responses were identified for three time slices (today-2040; 2041-2070; 2071-2100) along with the vision element(s) they aim to achieve, then stakeholder responses that were not time-stamped were integrated.
(ii) Strategies that aim to achieve the same vision element(s) were clustered together as a proto-pathway.
(iii) Pathways were classified as mitigation, adaptation or transformation pathways: o Mitigation pathways include strategies and actions to reduce emissions and drivers of
unsustainability; o Adaptation pathways include strategies and actions to adapt and cope with climate change
and other negative social and environmental impacts; o Transformation pathways include strategies and actions to fundamentally change
structures, cultures, and practices of societal systems towards sustainability and resilience.
(iv) Synergies were identified based on the comparative analysis of the proto-pathways across scenarios. The analysis revealed a pattern of interlinked pathways, of which one or two pathways represent ‘conditional’ pathways, i.e. these pathways put in place the key conditions for developing and implementing the other pathways.
(v) The efficacy of proto-pathways in moving towards the vision was qualitatively and quantitatively assessed (#5) so that the stakeholders could identify additional actions in third workshop series to address some of the shortfall (#6 in Figure 11). This approach relies on assessing how the mitigation, transformation and adaptation actions influence the vision indicators taking account of the capitals. Here, a distinction is made between vision indicators that can be related to a modelled indicator (quantitative stream) and those that cannot (qualitative stream) (Figure 12).
(vi) Trade-offs between pathways, strategies and actions were identified in every scenario based on experts’ input during an IMPRESSIONS expert meeting in November 2016, the notes from the stakeholders’ discussion in the second workshop series and the preliminary analysis of the pathways’ efficacy in achieving the vision.
In the third workshop series, the stakeholders were asked to enrich the pathways to improve their efficacy in achieving the vision, avoid trade-offs and to think of concrete transformative solutions that are ‘game-changing’ for moving towards the vision. After the workshop, the additions made to the pathways were consolidated and the analyses of the effectiveness of the pathways updated. This resulted in the final pathways, including the analysis of their efficacy in achieving the vision, their synergies and trade-offs as well as the governance capacities and capitals that are built up and required for implementing the pathways.
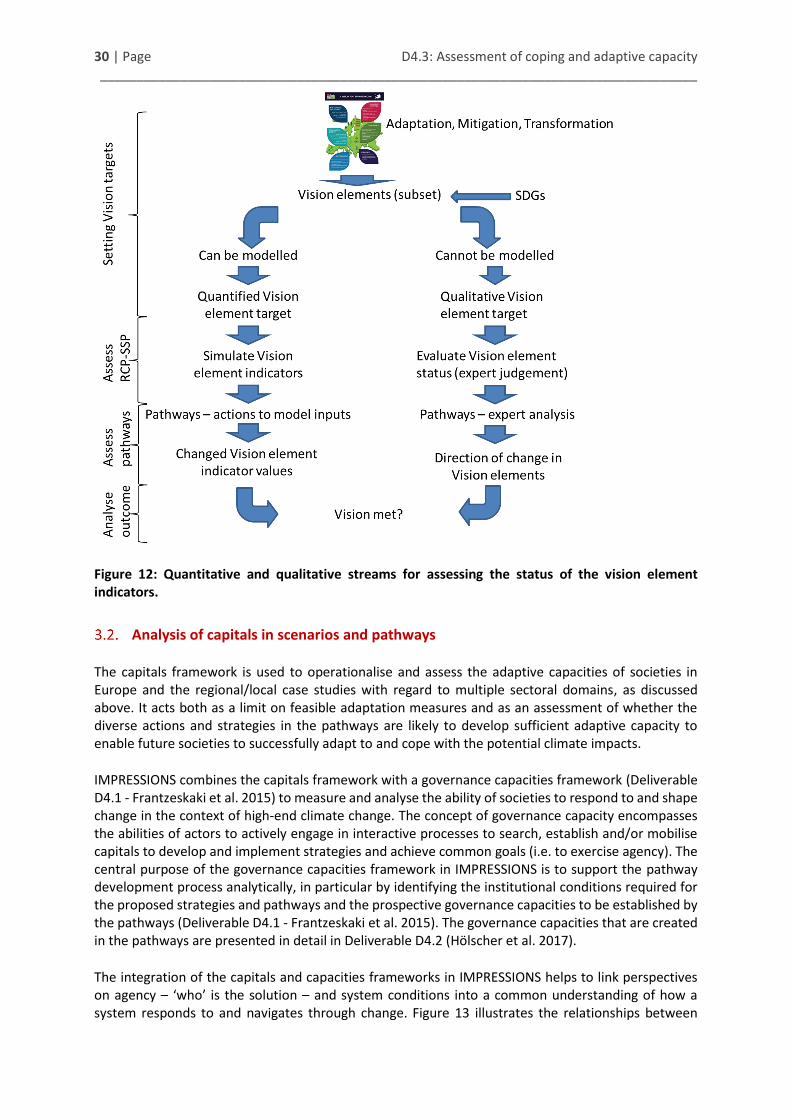
30 | Page D4.3: Assessment of coping and adaptive capacity __________________________________________________________________________________
Figure 12: Quantitative and qualitative streams for assessing the status of the vision element indicators.
Analysis of capitals in scenarios and pathways
The capitals framework is used to operationalise and assess the adaptive capacities of societies in Europe and the regional/local case studies with regard to multiple sectoral domains, as discussed above. It acts both as a limit on feasible adaptation measures and as an assessment of whether the diverse actions and strategies in the pathways are likely to develop sufficient adaptive capacity to enable future societies to successfully adapt to and cope with the potential climate impacts.
IMPRESSIONS combines the capitals framework with a governance capacities framework (Deliverable D4.1 - Frantzeskaki et al. 2015) to measure and analyse the ability of societies to respond to and shape change in the context of high-end climate change. The concept of governance capacity encompasses the abilities of actors to actively engage in interactive processes to search, establish and/or mobilise capitals to develop and implement strategies and achieve common goals (i.e. to exercise agency). The central purpose of the governance capacities framework in IMPRESSIONS is to support the pathway development process analytically, in particular by identifying the institutional conditions required for the proposed strategies and pathways and the prospective governance capacities to be established by the pathways (Deliverable D4.1 - Frantzeskaki et al. 2015). The governance capacities that are created in the pathways are presented in detail in Deliverable D4.2 (Hölscher et al. 2017).
The integration of the capitals and capacities frameworks in IMPRESSIONS helps to link perspectives on agency – ‘who’ is the solution – and system conditions into a common understanding of how a system responds to and navigates through change. Figure 13 illustrates the relationships between
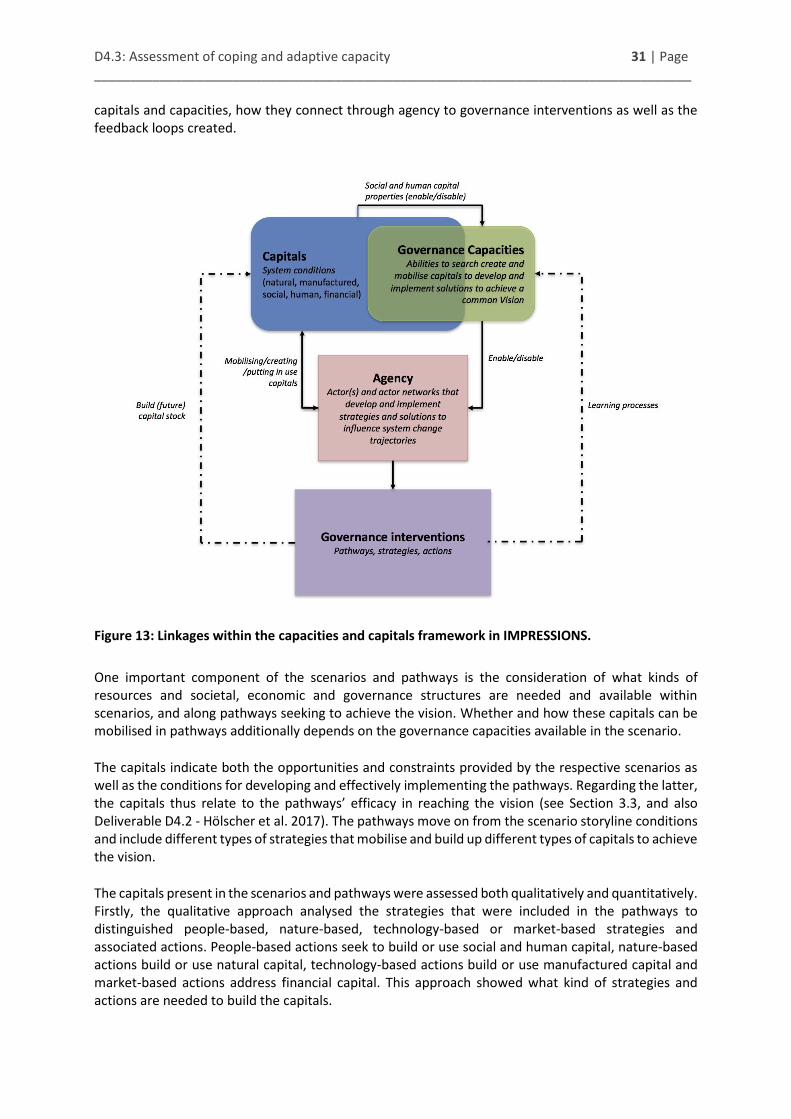
D4.3: Assessment of coping and adaptive capacity 31 | Page __________________________________________________________________________________ capitals and capacities, how they connect through agency to governance interventions as well as the feedback loops created.
Figure 13: Linkages within the capacities and capitals framework in IMPRESSIONS.
One important component of the scenarios and pathways is the consideration of what kinds of resources and societal, economic and governance structures are needed and available within scenarios, and along pathways seeking to achieve the vision. Whether and how these capitals can be mobilised in pathways additionally depends on the governance capacities available in the scenario.
The capitals indicate both the opportunities and constraints provided by the respective scenarios as well as the conditions for developing and effectively implementing the pathways. Regarding the latter, the capitals thus relate to the pathways’ efficacy in reaching the vision (see Section 3.3, and also Deliverable D4.2 - Hölscher et al. 2017). The pathways move on from the scenario storyline conditions and include different types of strategies that mobilise and build up different types of capitals to achieve the vision.
The capitals present in the scenarios and pathways were assessed both qualitatively and quantitatively. Firstly, the qualitative approach analysed the strategies that were included in the pathways to distinguished people-based, nature-based, technology-based or market-based strategies and associated actions. People-based actions seek to build or use social and human capital, nature-based actions build or use natural capital, technology-based actions build or use manufactured capital and market-based actions address financial capital. This approach showed what kind of strategies and actions are needed to build the capitals.

32 | Page D4.3: Assessment of coping and adaptive capacity __________________________________________________________________________________
Secondly, capitals have also been quantitatively assessed within the scenarios and pathways, using the same methodology as set out in Section 2.3 (Figure 9):
Baselines and levels of capitals consistent with the SSP storylines were determined;
Potential changes in levels of capitals were determined through expert judgement based on the actions within the pathway descriptions;
These were iterated back with stakeholders to finalise the pathways;
The levels of capitals were adjusted through expert judgement based on the final pathway descriptions after the third set of workshops.
Projections of capitals within the scenarios and pathways
The governance capacities and capitals are conditioned by the respective scenario contexts. The different scenarios provide different opportunities and challenges for building capacities and capitals:
SSP1: high levels of capacities and capitals are already in place, but can be further built on via multi-level governance approaches in the pathways.
SSP3: governmental institutions have limited capacity and capitals are highly constrained, but there is opportunity to develop the capacities of civil society actors who can self-organise in local communities.
SSP4: capacities and distribution of capitals are very unevenly shared within society. The political and business elite has a high level of capacities and capitals to develop and implement top-down strategic planning. However, most of the population has low capacity to act and limited access to capitals.
SSP5: there is a high level of capitals available that can be mobilised through market-based approaches, and market actors have a high capacity to act.
Following this logic of opportunities and constraints provided by the scenarios, the pathways that were co-created with stakeholders to achieve the vision follow scenario-specific logics (see Deliverable D4.2 – Hölscher et al. 2017 for more detail). For example, the European pathway A relates to a shift towards sustainable lifestyles, which involves changing towards sustainable production and consumption patterns and behaviours in all sectors (e.g. food, water, health, energy and mobility) as well as ensuring social security and equity. The scenario-specific flavours within pathway A are as follows:
A.1: ‘Shift to sustainable lifestyles’ through strategies to induce and trigger behavioural changes towards sustainable lifestyles, support wellbeing focus for equity and social capital development and establish new education models;
A.3: ‘Shift to sustainable lifestyles’ though strategies to foster social cohesion and support, integrate awareness raising on solidarity and sustainability in education and incentivise sustainable and equitable lifestyles;
A.4: ‘Shift to sustainable lifestyles’ through strategies to develop value-based education and incentives for sustainable lifestyles and re-distribute resources to meet basic needs;
A.5: ‘Shift to sustainable lifestyles’ through strategies to foster consumer awareness for agriculture products and practices and invest in environmental education and research.
As evident from the example, for each case study the pathways are identified by a letter followed by a number indicating the specific manifestation of a pathway in a particular SSP (i.e. A.1 refers to pathway A in SSP1, A.3 to SSP3). Not all pathways occur in all scenarios. More detail on these pathways is provided for the European, Scottish, Iberian and Hungarian case studies in the annexes to Deliverable D4.2.

D4.3: Assessment of coping and adaptive capacity 33 | Page __________________________________________________________________________________ While the analysis of capacities emphasises who and how capitals can be created, mobilised and put in use (Deliverable D4.2), the analysis of capitals also emphasises what kind of strategies are needed to build up and maintain specific capitals along a pathway in order to achieve the vision. Many of the pathways therefore have strong elements that can be represented under the capitals metaphor, and the build-up of capitals in the pathways relates to the types of strategies included in the pathways, i.e. to what extent people-based, nature-based, technology-based and market-based strategies are included in the pathways (see Section 3.2). Table 7 shows examples of this interpretation for the European pathways.
Table 7: European case study pathways and scenario strategies with interpretation of the capitals enhanced by selected exemplar actions.
Pathway Scenario-specific pathways Examples of actions Capital interpretation
Promote shifts towards sustainable lifestyles
A.1: Promoting shifts towards sustainable lifestyles A.3: Shift to sustainable lifestyles A.4: Shift to sustainable lifestyles A.5: Shift to sustainable lifestyles
Awareness raising to induce behavioural changes
Human
Education systems for all that promote sustainability values
Human
Institutional conditions that incentivise sustainable lifestyles
Social
Conditions for social equity and social security
Social, financial
Self-sufficient communities Social
Promote good governance systems for sustainability
B.1: Establishing open governance systems for sustainability B.3: Establish local and community-based governance for sustainability B.4: Establish multi-level process-based governance for sustainability and European self-sufficiency B.5: Establish participatory governance for sustainability
Transparent, accountable and sustainability-oriented governance system
Social
Strong international and multi-level governance institutions for coordination and collaboration
Social
Inclusive and participatory governance system that engages all societal actors
Social, human
Open and learning-based governance approaches
Social, human
Promote sustainable agriculture
C.1: Mainstream sustainable agriculture C.3: Mainstream sustainable agriculture C.5: Mainstream sustainable agriculture
Integrated agriculture standards and policy frameworks
Social
Internalise environmental costs into food practices
Social, financial
Integrated and multifunctional agriculture
Natural
Local community- and family-based agriculture systems
Social
Organic and climate-friendly farming practices
Natural
Innovations in agriculture technologies and infrastructure
Manufactured
Build skills and knowledge and promote knowledge transfer
Human

34 | Page D4.3: Assessment of coping and adaptive capacity __________________________________________________________________________________
Pathway Scenario-specific pathways Examples of actions Capital interpretation
Promote strong environmental policy
D.1: Strengthening environmental policy D.4: Strengthen environmental policy for ‘small ecosystems’ E.5: Create markets of ecosystem services
Integrated nature protection framework and policies
Natural, social
Ecosystem-based land-use planning Natural, social
nature-based solutions for water management and climate adaptation
Natural
Resource management is implemented by polycentric and knowledge-based management approaches
Human
Internalise value of environment and ecosystem services
Financial
Innovation in green technologies Manufactured
Promote integrated water management
D.3: Set up an integrated water management system D.5: Establish European integrated water management system
Integrated water management framework
Manufactured, human
Water infrastructures ensure high quality water availability across Europe and support climate adaptation.
Manufactured
Nature-based solutions for water availability and flood protection
Natural
Changing uses of water and living patterns
Social
Innovative water technologies Manufactured
Position Europe as a global leader for sustainability
E1: Positioning Europe as a global leader for sustainability
Supra-national sustainability goals for coordinating global and European action
Social
Strengthen European and international governance institutions and mechanisms
Social
Building governance capacities worldwide
Social
Knowledge generation Human
Establish a circular economy with green energy technologies
E.4 Establish a circular economy with green energy technologies
Circular economy is designed to close resource loops at multiple scales
Social, financial
Innovation in green technologies Manufactured
Knowledge conditions for resource efficiency and resource security
Human
Many strategies across pathways in all scenarios are people-based, i.e. they include actions such as education, provision of services and setting up new institutional conditions and governance structures to foster social and human capital. This enables the implementation of the pathways by facilitating strong environmental and social institutions, changing behaviours and lifestyles and promoting self-organisation in local communities and regions to share resources for self-sufficiency and to commonly respond to risks and climate impacts.
Additionally, all scenarios’ pathways include nature-based strategies to protect and regenerate the environment and ecosystems services by moving towards sustainable agriculture, land and water management and employing nature-based solutions to adapt to climate change and contribute to mitigation. This enables the maintenance of natural capital in the long-term, ensures resource quality and security and employs natural capital for climate adaptation and mitigation. For example, the European pathways for SSP3 include actions to create more green areas in cities and implement rainwater harvesting in households.

D4.3: Assessment of coping and adaptive capacity 35 | Page __________________________________________________________________________________ All scenarios’ pathways also include technology-based strategies that build the manufactured capital for achieving resource efficiency and security and environmental protection. While the technology-based strategy in the SSP3 pathways focuses largely on local technologies to ensure that infrastructure exists to allow local network economies to exist, SSP4 and SSP5 pathways include technology-based strategies that develop large-scale green technological innovation to support resource efficiency, green energy technology and, in SSP5, sustainable agriculture and water management. This reflects the high level of technological development and opportunity in SSP4 and SSP5.
The pathways in all scenarios include market-based strategies to promote green markets and financing mechanisms and incentivise sustainable production and consumption patterns. Market-based strategies create incentives and taxes for behavioural changes, especially by internalising the value of nature in economic activities and providing incentives for investing in sustainable technologies. Concrete actions include the setting up of carbon taxes, regulation to mandate that corporations re-invest profits into communities, and subsidies to community green energy schemes. For example, the European SSP5 pathway for stronger environmental protection creates nature-based markets that account for the cost of nature. It includes actions to introduce higher taxes for fossil fuels, integrate the value of ecosystem services into economic decisions and set up funds to deal with climate change impacts.
As stated above, scenario-specific differences relate both to the capitals as well as the governance capacities available in the scenarios. For example, the SSP5 pathways show stronger emphasis on market-based and technology-based strategies because of the underlying market logic, as well as high availability of manufactured capital, in this scenario. The SSP3 pathways focus especially on bottom-up community action that relies on local and low-tech solutions. Because of the high level of financial and manufactured capitals yet the unequal distribution of wealth, the SSP4 pathways take top-down strategic planning approaches with strong regulations and incentives for nature and social protection and invest in technological development for green energy.
The evolutions of capitals in the scenarios before and after the application of the pathways are represented in Figures 14 and 15 for the European and Scottish case studies. These show how the actions in the pathways progressively increase each of the capitals over time within the scenarios following our quantitative assessment. The visualisation illustrates both the different types of opportunities present in the respective scenarios – for example the high levels of capitals in SSP1 and SSP5, while SSP4 faces low levels of social and human capital due to the inequality in the scenario and SSP3 faces overall challenges regarding capitals availability.
Pathway actions defined by stakeholders offset these declines, to a greater or lesser extent, by the latter half of the century, and contribute to building all capitals in all scenarios. In SSP1 and SSP5, the build-up of capitals occurs much earlier, but the increase in capitals is particularly important for scenarios in which the storylines show capitals declining over time, notably SSP3 (where the pathways have achieved a high level of social and human capitals because of the pathways’ focus on local community self-organisation), but also SSP4. Actions to empower society in localised democracies and incentivise social services, for example, improve social capital. The provision of self-sufficiency education, an important skill in the context of the underlying scenario, increases human capital. Further details on the evolution of capitals in the European scenarios is provided in Annex C.
These improvements in capitals are then linked through the integrated assessment modelling to increase the range of adaptation options available in the IAP2 and to increase the measure of coping capacity in the vulnerability assessment (as described in Section 2.3.2), leading to a reduction in the vulnerability of society to climate change impacts. An example of the results of this process is illustrated in Figure 16 for the case of vulnerability to food shortages in the 2080s for SSP3.
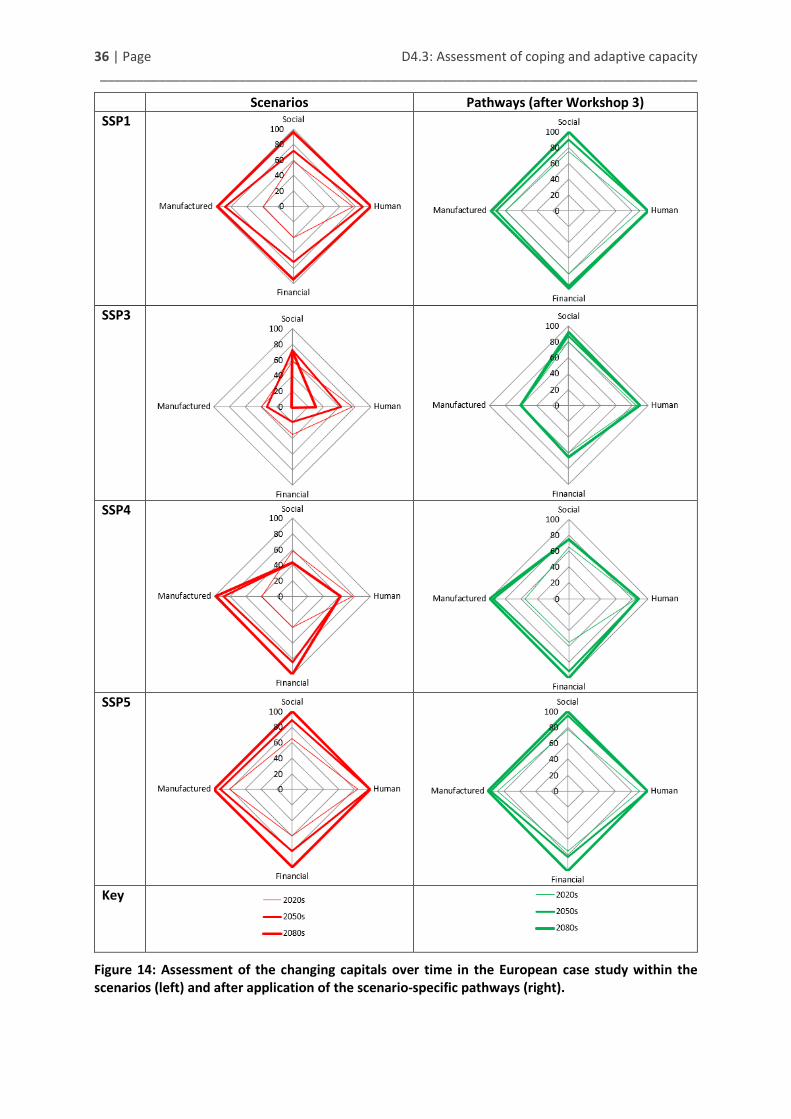
36 | Page D4.3: Assessment of coping and adaptive capacity __________________________________________________________________________________
Scenarios Pathways (after Workshop 3)
SSP1
SSP3
SSP4
SSP5
Key
Figure 14: Assessment of the changing capitals over time in the European case study within the scenarios (left) and after application of the scenario-specific pathways (right).

D4.3: Assessment of coping and adaptive capacity 37 | Page __________________________________________________________________________________
Scenarios Pathways (after Workshop 3)
SSP1
SSP3
SSP4
SSP5
Key
Figure 15: Assessment of the changing capitals over time in the Scottish case study within the scenarios (left) and after application of the scenario-specific pathways (right) [black dash line represents the baseline].
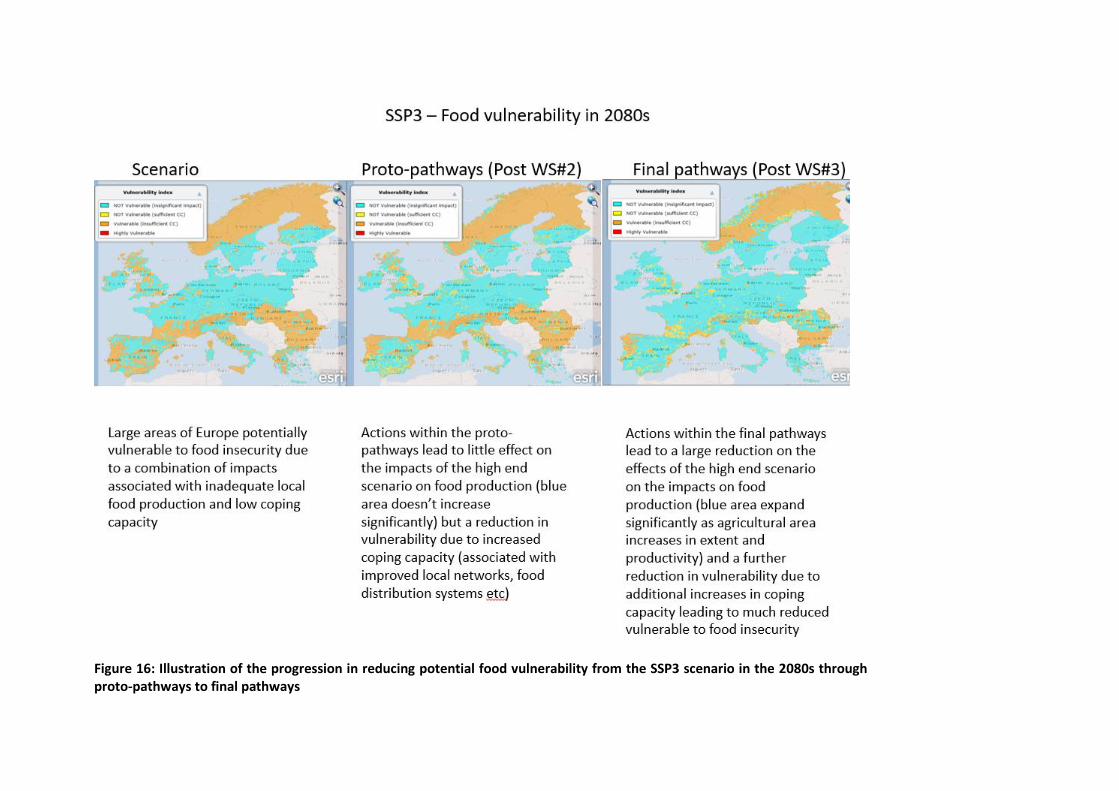
Figure 16: Illustration of the progression in reducing potential food vulnerability from the SSP3 scenario in the 2080s through proto-pathways to final pathways
4. Conclusions
In this deliverable report, we have summarised the methodology developed in IMPRESSIONS for representing societies’ capacities to adapt to and to cope with high-end scenarios of climate and socio-economic change, and explained how this was integrated with the modelling and with the development and analysis of the scenarios and pathways.
We reviewed the options for modelling capacities and set out the rationale for opting to build on the methods set out in Dunford et al. (2015). We explained how the indicators were modified and extended to 2100 and integrated within the IMPRESSIONS IAP2 modelling platforms for Europe and Scotland as constraints on the adaptation options, and as a key component of the vulnerability assessment.
In Section 3, we explained how the capitals were used in the process of building the scenarios and pathways, via assessment of baseline capital levels, and iterations between experts and stakeholders to establish how capitals evolve along pathways. The capitals are used as determinants of capacity to adapt, influencing the effectiveness of adaptation options in both the quantitative (modelled in IAP2) and qualitative streams of the pathways analysis. Building up adaptive and coping capacities is itself an adaptation option that is strongly represented in the pathways developed within all of the case studies in IMPRESSIONS. We presented results of adaptation resulting in improved capacities for the European and Scottish case studies. More detailed results synthesising the model-based findings across the IMPRESSIONS case studies will be published in Deliverable D3.2 (due in December 2017).
Strengths and Limitations
The capital indicators we use are general indicators of the ‘state’ of the social-economic system (as the environmental part is being explicitly modelled). That is, the capitals concepts are metaphors for the state of the system, for its capacities to sustain wealth and wellbeing and provide resources for adaptation and coping with extreme conditions. This brings advantages in terms of comprehensibility, ease of use and the ability to capture quite complex relationships in a fairly simple and tractable framework with a basis in theories of wealth creation. There are apparent, and related, limitations in this simplicity, related to the implicit assumption of fungibility of capitals and to the absence of a requirement for ‘balanced budgets’ in capital terms.
Adaptive and coping capacities are a metaphor for the human capabilities, technologies, and access to resources that permit adaptation and coping. The details of these capacities, and how they relate to enabling, constraining, and determining the effectiveness of the huge number of possible adaptations and coping actions are inevitably complex, and there is a need to represent them in a tractable and comprehensible fashion for exploring future scenarios and developing pathways at a broadscale that is appropriate for use with stakeholders in participatory settings. Capitals indicators have the advantage, on the one hand, of relating to an underlying theoretical model of wealth creation that has been empirically tested (World Bank 2005; 2011) and on the other of being derived from robust data that are available for the areas of interest at spatial scales that allow some representation of spatial variation in capacities within countries.
The concepts are relatively straightforward to describe, communicate and manipulate in work with stakeholders and experts as evidenced by their successful use within the European and regional case study workshops. In particular, it is possible to relate the capitals concepts to future scenarios and visions in intuitive ways, to imagine situations in which some capitals increase while others decline, and to think about how the capitals influence the feasibility and effectiveness of particular strategies and actions, as described in more detail in Section 3.

40 | Page D4.3: Assessment of coping and adaptive capacity __________________________________________________________________________________
However, the use of a generalised measure of capacity to adapt and to cope for entire societies has some limitations. Different characteristics and combinations of capital stocks may be required to adapt and cope with different specific threats in particular sectors. This is however partly accounted for via the identification of limiting capitals for adaptation. In IAP2, each adaptation option has one or more specific limiting capitals, so the capacity to adapt can vary depending on the specific option and the capitals available in a given scenario or pathway. Thus, for example, the level of financial capital is not considered as a constraint for a social adaptation in IAP2.
A further limitation is that human, social and manufactured capital are not fully fungible. A cardiologist cannot design bridges and engineers cannot perform heart surgery, for example. Furthermore, some forms of capital may be useless without others – a state-of-the art hospital building is no use without well-trained doctors and nurses. This makes it hard to relate a single measure of a particular capital stock to the adaptation or coping potential of that stock.
However, IMPRESSIONS is not seeking to elaborate detailed investment plans for particular sectors, areas and time periods. Rather, the function of the long-term, scenario-based simulation modelling and pathway analysis is to explore, at a broadscale, the potential consequences of high-end scenarios and the generalised viability of possible strategies for dealing with it. Therefore, broad-brush representations of capacities and capitals are appropriate, for two main reasons.Firstly, it is valid to assume, for example, that a society investing heavily in education and training to build up human capital will be able to do this in general rather than only in specific areas, so it will be possible to build a pool of expertise for dealing with a wide range of challenges. Secondly, we can also assume that there is time to take decisions about strategic build-up of capital, so that, for example, if it is identified through scenario and pathway analysis that flood and coastal erosion management will be among the most significant challenges faced in the 2080s, the decision could be taken to train hydrologists, ecologists and engineers in relevant skills.
Working out details of specific capital needs is not the objective of IMPRESSIONS. The analysis of the pathways and strategies suggest areas that require prioritisation in order to meet future needs; the details of how to meet those requirements need to be worked out through more sector-specific analyses.
A further possible critique relates to the fact that it is not possible to spend the same money twice. On a simple interpretation, it might be thought that this should also extend to the capital stocks – scarcity of resources implies the obligation to make difficult choices about what to spend them on, and if you invest in project A, that means not investing in project B. However, capitals are not necessarily reduced by an adaptation action, or in the process of coping, and generally require ongoing investment and maintenance in order to maintain the capitals. If there is a dynamic in terms of wearing down capitals in particular scenarios, for example through social structures breaking down and material wealth declining, this will be reflected in the scenarios via declining capitals, and in the pathways as strategies that could check or reverse the decline. But this is not in itself a direct result of using the capitals for adaptive or coping actions.
On the other hand, adaptive and coping actions can be constrained by lack of capital – the society lacks the infrastructure, social structure, or simply free cash, to cope with shocks and is therefore vulnerable to them – and in recognition of that, adaptation can seek to build up these capabilities, which we represent in the metaphor / model by expanding capital stocks.
Thus capitals should not be considered as stocks that are necessarily eaten into by adaptation or coping actions, but rather as characteristics of a society that control which adaptation options are feasible, how much financial cost they entail, and/or how effective they will be. The capital indicators within
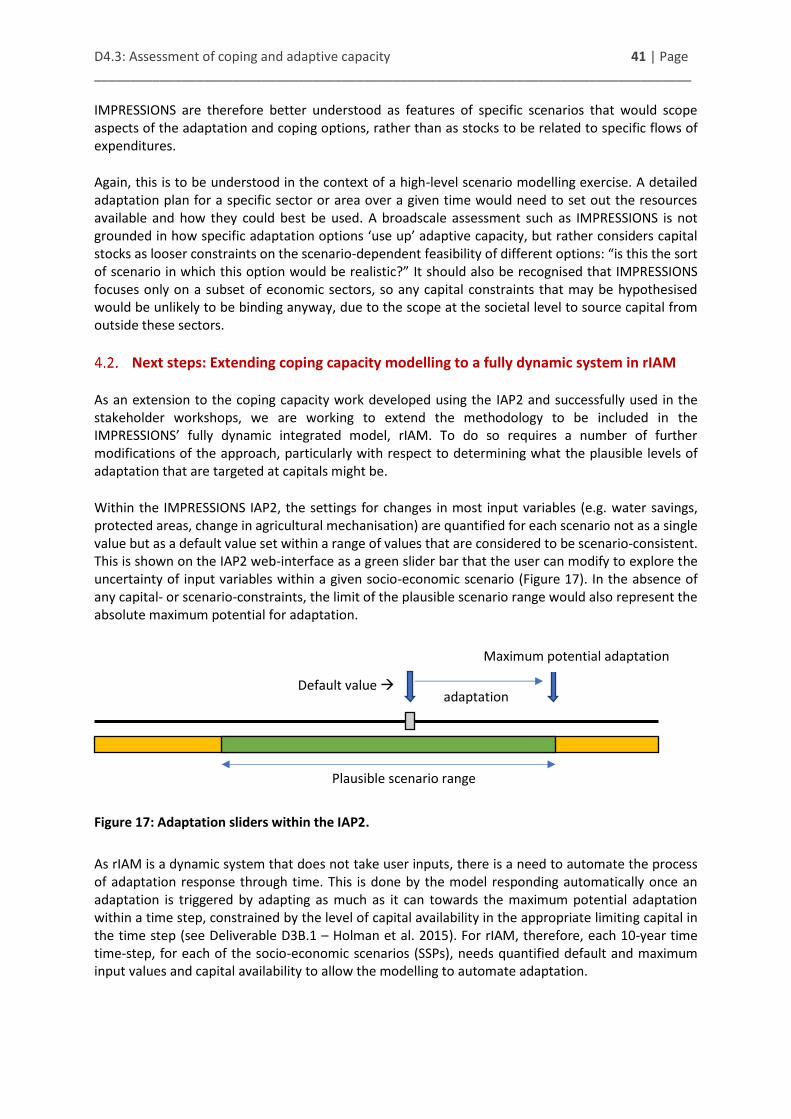
D4.3: Assessment of coping and adaptive capacity 41 | Page __________________________________________________________________________________ IMPRESSIONS are therefore better understood as features of specific scenarios that would scope aspects of the adaptation and coping options, rather than as stocks to be related to specific flows of expenditures.
Again, this is to be understood in the context of a high-level scenario modelling exercise. A detailed adaptation plan for a specific sector or area over a given time would need to set out the resources available and how they could best be used. A broadscale assessment such as IMPRESSIONS is not grounded in how specific adaptation options ‘use up’ adaptive capacity, but rather considers capital stocks as looser constraints on the scenario-dependent feasibility of different options: “is this the sort of scenario in which this option would be realistic?” It should also be recognised that IMPRESSIONS focuses only on a subset of economic sectors, so any capital constraints that may be hypothesised would be unlikely to be binding anyway, due to the scope at the societal level to source capital from outside these sectors.
Next steps: Extending coping capacity modelling to a fully dynamic system in rIAM
As an extension to the coping capacity work developed using the IAP2 and successfully used in the stakeholder workshops, we are working to extend the methodology to be included in the IMPRESSIONS’ fully dynamic integrated model, rIAM. To do so requires a number of further modifications of the approach, particularly with respect to determining what the plausible levels of adaptation that are targeted at capitals might be.
Within the IMPRESSIONS IAP2, the settings for changes in most input variables (e.g. water savings, protected areas, change in agricultural mechanisation) are quantified for each scenario not as a single value but as a default value set within a range of values that are considered to be scenario-consistent. This is shown on the IAP2 web-interface as a green slider bar that the user can modify to explore the uncertainty of input variables within a given socio-economic scenario (Figure 17). In the absence of any capital- or scenario-constraints, the limit of the plausible scenario range would also represent the absolute maximum potential for adaptation.
Figure 17: Adaptation sliders within the IAP2.
As rIAM is a dynamic system that does not take user inputs, there is a need to automate the process of adaptation response through time. This is done by the model responding automatically once an adaptation is triggered by adapting as much as it can towards the maximum potential adaptation within a time step, constrained by the level of capital availability in the appropriate limiting capital in the time step (see Deliverable D3B.1 – Holman et al. 2015). For rIAM, therefore, each 10-year time time-step, for each of the socio-economic scenarios (SSPs), needs quantified default and maximum input values and capital availability to allow the modelling to automate adaptation.
adaptation
Maximum potential adaptation
Plausible scenario range
Default value

42 | Page D4.3: Assessment of coping and adaptive capacity __________________________________________________________________________________
To extend the existing coping capacity methodology within the IAP2 to work within this system requires a number of significant extensions to the method.
(i) Within the IAP2 changes in the capitals are determined by discrete inputs (radio buttons with settings of ++ ,+ , 0, - and --) rather than continuous sliders. As such they have scenario-specific default values, but no plausible range around them.
(ii) The current radio-button settings are only quantified for the three IAP2 time steps. (iii) There is a need for conceptual development as there are no currently available data on what
“plausible shifts” in capital indicators, capitals or indeed coping capacity would be over a 10 year time period.
To be able to quantify more plausibly the possible changes in indicator variables (and therefore capital indices) over the 10-year time steps required, we have identified long-term, global datasets for a range of capital-related indicators as a means to identify how much indicator variables have been shown to be capable of changing over a 10-year period based on historical evidence. Global datasets are used to catch as wide a variety of changes as are possible to establish the full scope of potential change.
Initial results for eight indicators have been explored across the four capitals (for details of data and plots, see Annex D). Those marked with an asterisk (*) are direct equivalents of existing variables within the Dunford et al. (2015) methodology, those marked with a tilde (~) are similar but not identical, unmarked are new variables for comparison purposes:
Human o Life expectancy* o Tertiary education* o Dependency ratio (ratio of old/young population to working age population) o Innovation
Social o Inequality* (income distribution ratio)
Manufactured o Rail network infrastructure (km/km2)~ o Cellular network subscriptions o Percentage of population using the internet
Financial o Net savings~ o Household savings as proportion of disposable income~
In taking this work forwards to complete the integration in rIAM, the next steps will be:
(i) To develop new curves for those indicators without existing curves linking them to capitals (see Section 2.2.1, step 2);
(ii) To apply the curves to the indicator variables so as to quantify the maximum plausible changes in capital units (rather than in indicator units, e.g. years);
(iii) For the modelling team to work with scenario experts to determine the minimum and maximum plausible shifts in the context of each scenario;
(iv) To develop the coping capacity DLL within rIAM to change its inputs from discrete radio button values (e.g. ++, --) to a continuous variable in capital units (e.g. + 0.24 capital units).
The end result will be a state-of-the-art dynamic regional integrated assessment model for Europe that represents the time-dependent constraints and timelags for effective adaptation and provides a

D4.3: Assessment of coping and adaptive capacity 43 | Page __________________________________________________________________________________ further improved understanding of the challenges of climate change adaptation to high-end scenarios in Europe. The results of these model applications will be reported in D3.2 (due in December 2017).
5. Acknowledgements
We are grateful to numerous colleagues in the IMPRESSIONS project for their support of the work that provides the basis of this deliverable. The case study leaders and their teams have contributed to the design and implementation of the stakeholder workshops in which the scenarios and pathways have been developed, analysed and enhanced, providing invaluable support as scenario supporters, modelling experts and note-takers. The PROSPEX team has facilitated all of the stakeholder workshops and guided the stakeholders and the IMPRESSIONS team through a complex and effective process of engagement. The modelling work of a range of partners, especially Elizabeth Clarke (University of Edinburgh), provided both the inputs on impacts of scenarios and also the effectiveness of pathways in achieving the vision. Last but not least, we are grateful to the stakeholders who participated in the workshops and provided us with their vision for the future, the scenario narratives, the pathways, and reflections on what can be done in the face of high-end socio-economic and climatic change.
6. References
Abel, N., Wise, R., Colloff, M., Walker, B., Butler, J., Ryan, P., Norman, C., Langston, A., Anderies, J.M., Gorddard, R., Dunlop, M., O’Connell, D. (2016) Building resilient pathways to transformation when “no one is in charge”: insights from Australia's Murray-Darling Basin. Ecology and Society 21(2), 23. [doi: 10.5751/ES-08422-210223].
Acosta, L, Klein, RTJ, Reidsma, P, Metzger, MJ, Rounsevell, MDA, Leemans, R, Schröter D (2013) A spatially explicit scenario-driven model of adaptive capacity to global change in Europe. Global Environmental Change 23(5), 1211–1224.
Arnell, N. W., van Vuuren, D. P., Isaac, M. (2011) The implications of climate policy for the impacts of climate change on global water resources. Global Environmental Change 21(2), 592–603.
Aubin J.-P. (1997) Dynamic economic theory: a viability approach, Springer-Verlag.
Birkmann, J. (2007) Risk and vulnerability indicators at different scales: applicability, usefulness and policy implications. Environmental Hazards 7(1), 20–31.
Birkmann J., Garschagen M., Hagenlocher M., Kloos J., Lanzendörfer M., Mucke P., Pardoe J., Radtke K., Rhyner J., Walter B., Welle T. (2015) World risk report. UNU and IEHS, Bonn.
Boumans, R., Costanza, R., Farley, J., Wilson, M., Porela, R., Rotmans, J., Villa, F., Grasso, M. (2002) Modeling the dynamics of the integrated earth system and the value of global ecosystem services using the GUMBO model. Ecological Economics 41, 525–560.
Brooks N. (2003) Vulnerability, risk and adaptation: A conceptual framework. Tyndall Centre for Climate Change Research Working Paper 38, 1-16.
Carter, T.R., Jones, R.N., Lu, X., Bhadwal, S., Conde, C., Mearns, L.O., O’Neill, B.C., Rounsevell, M.D.A., Zurek, M.B. (2007) New assessment methods and the characterisation of future conditions. In Climate Change 2007: Impacts, Adaptation and Vulnerability. Contribution of Working Group II to the Fourth Assessment Report of the Intergovernmental Panel on Climate Change. Cambridge University Press.

44 | Page D4.3: Assessment of coping and adaptive capacity __________________________________________________________________________________
Carter TR, Rounsevell MDA, Fronzek S, Harrison PA, Holman IP & Pirttioja NK (2015) Integrated assessment approach. EU FP7 IMPRESSIONS Project Deliverable D3.1.
Carter TR, Fronzek S, Alkemade R, Holman I, Honda Y, Ito A, Jäger J, Leemans R, Nunez S, Oka K, O’Neil N, Onigkeit J, Pedde S, Rounsevell M, Takahashi K, Wimmer F, Yoshikawa M (2016) Global scale application of climate change impact, adaptation and vulnerability (CCIAV) models. EU FP7 IMPRESSIONS Project Deliverable D3A.1.
Chevé, M., Schubert, K. (2002) La croissance optimale d’une économie polluante: durabilité économique versus durabilité écologique. Annales d’Économie et de Statistique 65, 117–133.
Clarke, L., Rounsevell, M., Dunn, M., Capela Lourenço, T., Tàbara, D., Pinter, L., Juhasz-Horvath, L., Gaál, Z., Holman, I., Frantzeskaki, N., Jäger, J., Christensen, J.H., Madsen, M.S., Pedde, S., Cojocaru, G., Lobanova, A., Li, S., Bugmann, H., Snell, R., Lafond, V., Harrison, P.A., Fronzek, S., Takahashi, K., Honda, Y., Ito, A., Tanaka, A., Yoshikawa, M. and Janes, V. (2017) Climate Change Impacts, Adaptation and Vulnerability Model Applications in Three Regional to Local Scale Case Studies in Europe. EU FP7 IMPRESSIONS Project Deliverable D3C.2.
De Lara, M., Martinet, V., Doyen, L. (2010) Risque et durabilité: la viabilité est-elle si loin de l’optimalité?" INRA/Agro Paris Tech Joint Research Unit in Public Economics Working Paper 2010/02. Available from https://www6.versailles-grignon.inra.fr/economie_publique/content/download/3171/33548/version/1/file/2010_02.pdf.
Dimaranan, BV. and McDougall RA, eds. (2002) Global Trade, Assistance, and Production: The GTAP 5 Data Base. Center for Global Trade Analysis, Purdue University. Available at http://www.gtap.agecon.purdue.edu/databases/v5/v5_doco.asp.
Dunford R., Harrison P.A., Jager J., Rounsevell M.D.A., Tinch R. (2015) Exploring climate change vulnerability across sectors and scenarios using indicators of impacts and coping capacity. Climatic Change 128, 339-354 [doi: 10.1007/s10584-014-1162-8].
Fazey I., Wise R.M., Lyon C., Câmpeanu C., Moug P., Davies T.E. (2015) Past and future adaptation pathways. Climate and Development 8, 26-44. [doi: 10.1080/17565529.2014.989192].
Foxon, T.J., Pearson, P.J.G., Arapostathis, S., Carlsson-Hyslop, A., Thornton, J. (2013) Branching points for transition pathways: assessing responses of actors to challenges on pathways to a low carbon future. Energy Policy 52, 146–158.
Franzeskaki N, Hölscher K, Jäger J, Holman I, Tàbara JD, Pedde S, Kok K & Silvestri G (2015). Advanced Transition Management Methodology. EU FP7 IMPRESSIONS Project Deliverable D4.1.
Gallopín, G.C. (2006). Linkages between vulnerability, resilience, and adaptive capacity. Global environmental change 16(3), 293–303.
Goh, B.S. (1976) Global stability in two species interactions. Journal of Mathematical Biology 3, 313-318.
Hermwille, L., Obergassel, W., Ott, H. E., Beuermann, C. (2017) UNFCCC before and after Paris–what's necessary for an effective climate regime?. Climate Policy 17(2), 150–170.

D4.3: Assessment of coping and adaptive capacity 45 | Page __________________________________________________________________________________ Harrison P.A., Holman I.P. and Berry (2015) Assessing cross-sectoral climate change impacts, vulnerability and adaptation: An Introduction P.M. to the CLIMSAVE project. Climatic Change 128, 153–167.
Hinkel, J. (2011) Indicators of vulnerability and adaptive capacity: Towards a clarification of the science–policy interface. Global Environmental Change 21 (1), 198–208.
Holman I.P., Harrison P.A. (2012) Assessment of the report describing the development and validation of the sectoral meta-models for integration into the IA platform. EU FP7 CLIMSAVE project report (available from www.climsave.eu).
Holman, I., Audsley, E., Berry, P., Brown, C., Bugmann, H., Clarke, L., Cojocaru, G., Dunford, R., Harrison, P.A., Janes, V., Kovats, S., Lafond, V., Li, S., Lobanova, A., Mokrech, M., Rounsevell, M., Sandars, D., Savin, C., Wimmer, F. (2015) Specification for European model improvement and development. EU FP7 IMPRESSIONS Project Deliverable D3B.1. Available from www.impressions-project.eu.
Holman, I., Audsley, E., Berry, P., Brown, C., Bugmann, H., Clarke, L., Cojocaru, G., Dunford, R., Fronzek, S., Harrison, P.A., Honda, Y., Janes, V., Kovats, S., Lafond, V., Lobanova, A., Sloth Madsen, M., Mokrech, M., Nunez, S., Pedde, S., Sandars, D., Savin, C. & Wimmer, F. (2017) Modelling Climate Change Impacts, Adaptation and Vulnerability in Europe. IMPRESSIONS Deliverable D3B.2.
Hölscher K, Franzeskaki N, Holman I, Pedde S, Juhasz-Horvath L, Clarke E, Schipper K, Jäger J (2017) Adaptation and mitigation pathways, and synergy mechanisms between them, for the case studies. EU FP7 IMPRESSIONS Project Deliverable D4.2.
Hughes B.B., Irfan M.T., Moyer J.D., Rothman D.S., Solorzano J.R. (2011) Forecasting the Impacts of Environmental Constraints on Human Development. United Nations Development Programme Human Development Reports Research Paper 2011/08.
Hughes, B. B., Kuhn, R., Margolese-Malin, E. S., Rothman, D. S., Solórzano, J. R. (2015) Opportunities and challenges of a world with negligible senescence. Technological Forecasting and Social Change 99, 77–91.
IPCC (2001) IPCC Third Assessment Report. Climate Change 2001. Working Group II: Impacts, Adaptation and Vulnerability. Chapter 1.
IPCC (2007) Summary for Policymakers. In: Climate Change 2007: Impacts, Adaptation and Vulnerability. Contribution of Working Group II to the Fourth Assessment Report of the Intergovernmental Panel on Climate Change, Cambridge University Press.
IPCC (2014) Climate Change 2014: Synthesis Report. Contribution of Working Groups I, II and III to the Fifth Assessment Report of the Intergovernmental Panel on Climate Change [Core Writing Team, R.K. Pachauri and L.A. Meyer (eds.)]. IPCC, Geneva, Switzerland, 151 pp.
International Institute for Applied System Analysis (IIASA) GGI Scenario Database Ver 2.0, 2009 Available at: http://www.iiasa.ac.at/Research/GGI/DB/.
Jones L. (2010) Overcoming social barriers to adaptation. The Overseas Development Institute. Background Note.
46 | Page D4.3: Assessment of coping and adaptive capacity __________________________________________________________________________________
Jones, R., Mearns, L. (2005) Assessing future climate risks (2005) Chapter 5 in Lim, B., Spanger-Siegfried, E., Burton, I., Malone, E., & Huq, S. (eds.) Adaptation Policy Frameworks for Climate Change: Developing Strategies, Policies and Measures. Cambridge University Press, pp. 119-143.
Kok, K., Pedde, S. (2017) IMPRESSIONS socio-economic scenarios. EU FP7 IMPRESSIONS Deliverable D2.2.
Kok K, Hesselbjerg Christensen J, Sloth Madsen M, Pedde S, Gramberger M, Jäger J & Carter T (2015) Evaluation of existing climate and socio-economic scenarios. EU FP7 IMPRESSIONS Project Deliverable D2.1.
Lenton, T. M., Held, H., Kriegler, E., Hall, J. W., Lucht, W., Rahmstorf, S., Schellnhuber, H. J. (2008) Tipping elements in the Earth's climate system. Proceedings of the National Academy of Sciences 105(6), 1786–1793.
Kriegler, E., O’Neill, B. C., Hallegatte, S., Kram, T., Lempert, R. J., Moss, R. H., Wilbanks, T. (2012) The need for and use of socio-economic scenarios for climate change analysis: a new approach based on shared socio-economic pathways. Global Environmental Change 22(4), 807–822.
Meadowcroft, J. (2011) Engaging with the politics of sustainability transitions. Environmental Innovation and Societal Transitions 1(1), 70–75.
Metzger M.J., D. Schröter, R. Leemans , W. Cramer (2008) A spatially explicit and quantitative vulnerability assessment of ecosystem service change in Europe. Regional Environment Change 8(3): 91–107.
Moss, R. H., Edmonds, J. A., Hibbard, K. A., Manning, M. R., Rose, S. K., van Vuuren, D. P., Carter, T. R., Emori, S., Kainuma, M., Kram, T., Meehl, G. A., Mitchell, J. F. B., Nakicenovic, N., Riahi, K., Smith, S. J., Stouffer, R. J., Thomson, A. M., Weyant, J. P., Wilbanks, T. J. (2010) The next generation of scenarios for climate change research and assessment. Nature 463, 747–756.
Omann, I., Jäger, J., Grünberger, S. and Wesely, J. (2010) Report on the development of the conceptual framework for the vulnerability assessment. http://www.climsave.eu/climsave/doc/Report_on_Vulnerability_Framework.pdf.
Porritt, J. (2006) Capitalism as if the World matters. Earthscan, London, UK.
Rockström, J., Steffen, W., Noone, K., Persson, Å., Chapin, F. S., Lambin, E. F.,Lenton, T.M., Scheffer, M., Folke, C., Schnellnhuber, H.J., Nykvist, B., de Wit, C.A., Hughes, T., van der Leeuw, S., Rodhe, H., Sörlin, S., Snyder, P.K., Costanza, R., Svedin, U., Falkenmark, M., Karlberg, L., Corell, R.W., Fabry, V.J., Hansen, J., Walker, B., Liverman, D., Richardson, K., Crutzen, P., Foley, J.A. (2009) A safe operating space for humanity. Nature 461, 472–475.
Rothman, D. S., Romero-Lankao, P., Schweizer, V. J., Bee, B. A. (2013) Challenges to adaptation: a fundamental concept for the shared socio-economic pathways and beyond. Climatic Change 122, 1-13.
Russill, C. (2015) Climate change tipping points: origins, precursors, and debates. Wiley Interdisciplinary Reviews: Climate Change 6(4), 427–434.
Schröter, D. et al. (2004) ATEAM Final report. Contract n°EVK2-2000-00075, Potsdam.

D4.3: Assessment of coping and adaptive capacity 47 | Page __________________________________________________________________________________ Shaw, A., Burch, S., Kristensen, F., Robinson, J., & Dale, A. (2014) Accelerating the sustainability transition: Exploring synergies between adaptation and mitigation in British Columbian communities. Global Environmental Change 25, 41–51.
Smit, B., Pilifosova, O. (2003) From adaptation to adaptive capacity and vulnerability reduction. In Climate change, adaptive capacity and development (eds. JB Smith, RJT Klein, S Huq) World Scientific Publishing, pp 9-28.
Smith, S., Horrocks, L., Harvey, A., Hamilton, C. (2011) Rethinking adaptation for a 4◦C world. Philosophical Transactions of the Royal Society A 369, 196–216.
Solow, R. (1993) An almost practical step toward sustainability. Resources policy 19(3), 162–172.
Steffen, W., Richardson, K., Rockström, J., Cornell, S. E., Fetzer, I., Bennett, E. M., Biggs, R., Carpenter, S.R, de Vries, W., de Wit, C.A., Folke, C., Gerten, D., Heinke, J., Mace, G.M., Persson, L.M., Ramanathan, V., Reyers, B., Sörlin, S. (2015) Planetary boundaries: Guiding human development on a changing planet. Science 347(6223), 1259855.
Tinch R., Jager J., Omann I., Harrison P.A., Wesley J. & Dunford R. (2015) Applying a capitals framework to measuring coping and adaptive capacity in integrated assessment models. Climatic Change 128, 323–337.
Tukker, A., Bulavskaya, T., Giljum, S., de Koning, A., Lutter, S., Simas, M., Stadler, K., Wood, R. (2014) The Global Resource Footprint of Nations. Carbon, water, land and materials embodied in trade and final consumption calculated with EXIOBASE 2.1. Leiden/Delft/Vienna/Trondheim.
UNECE (2009) Measuring sustainable development: Report of the Joint UNECE/OECD/Eurostat Working Group on Statistics for Sustainable Development. New York: United Nations. http://www.cbs.nl/NR/rdonlyres/0E68A254-32DB-450C-BA47-3E16A4A658F8/0/UN_Measuring_sustainable_development2009.pdf.
Wise, R. M., Fazey, I., Smith, M. S., Park, S. E., Eakin, H. C., Van Garderen, E. A., Campbell, B. (2014) Reconceptualising adaptation to climate change as part of pathways of change and response. Global Environmental Change 28, 325–336.
World Bank (2005) Where is the Wealth of Nations? Measuring Capital for the 21st Century. Washington, DC. https://openknowledge.worldbank.org/handle/10986/7505.
World Bank (2011) The Changing Wealth of Nations: Measuring Sustainable Development in the New Millennium. World Bank. https://openknowledge.worldbank.org/handle/10986/2252.
Van Vuuren, D. P., Riahi, K., Moss, R., Edmonds, J., Thomson, A., Nakicenovic, N., Kram, T., Berkhout, F., Swart, R., Janetos, A., Rose, S. K., Arnell, N. (2012) A proposal for a new scenario framework to support research and assessment in different climate research communities. Global Environmental Change 22(1), 21–35.
Wyborn C., Yung L., Murphy D., Williams D.R. (2014) Situating adaptation: how governance challenges and perceptions of uncertainty influence adaptation in the Rocky Mountains. Regional Environmental Change 15, 669-682 [doi: 10.1007/s10113-014-0663-3].

48 | Page D4.3: Assessment of coping and adaptive capacity __________________________________________________________________________________
Annex A: Brief background to vulnerability assessment
Climate change can be considered a problem in resource management: how much effort should we invest in cutting emissions (mitigation), how much in dealing with the consequences (adaptation), and what residual damages should we accept, bearing in mind the opportunity costs of adaptation and mitigation? A mainstream economics approach to this problem focuses on optimisation techniques, aimed at developing policies for maximisation of economic returns. In this framework, the presence of risk is dealt with by considering the expected net present value of the output or wellbeing measure of interest.
There has, however, been increasing concern with the sustainability of the global economy and of specific societies and groups within societies; not least because the standard neo-classical optimisation criterion with discounting can generate unsustainable economic trajectories (Chevé and Schubert 2002). At the ecosystem level, sustainability has been interpreted as ‘resilience’, commonly used as a generic and often loosely defined descriptor of a tendency to stability and resistance to perturbation. Sustainability and resilience are ‘boundary concepts’ that people from different disciplines, interests, and perspectives agree are desirable, without necessarily agreeing on precisely what that entails. In the context of climate change, IPCC (WG2 2007: 880) defined resilience as “the ability of a social or ecological system to absorb disturbances while retaining the same basic structure and ways of functioning, the capacity for self-organisation, and the capacity to adapt to stress and change.”
As discussed in IMPRESSIONS Deliverable D5.1 (Tinch et al. 2015), a desire for resilience can be interpreted within the economics framework as indicative of risk aversion, a property which in principle can be built into the objective function to be maximised with respect to control variables. However, this is unlikely to be the most productive approach for dealing with highly complex systems in which reducing everything to a single optimal economic value is likely to obscure much interesting detail, in particular the risks of unacceptable outcomes associated with unlikely but extreme scenarios, such as high-end scenarios of social, economic and climate change.
Alternatively, strict minimum standards for resilience could be incorporated as constraints on management of the system. In this setting, the resilience of a system, or desirable levels of one or more indicators of it, would form part of the set of management objectives to be met adequately and robustly (rather than optimally) through the management process. In setting these objectives, allowance needs to be made for transformative solutions that may alter the underlying structures and processes, while still maintaining resilience with respect to specific goals (or ‘visions’).
The focus in IMPRESSIONS on adaptation, mitigation and transformation pathways explicitly recognises that transformative changes of some aspects of system organisation may be a tactical objective in seeking to maintain acceptable levels of some outcomes (e.g. human wellbeing) or otherwise achieve dynamic visions and objectives. This moves away from concepts of stability or resilience that focus on the ability to maintain existing structures in the face of changing conditions. Goh (1976) proposed that to bracket the effects of random disturbances on a model system over a given time period, it is necessary to determine both the worst and the best possible sequences of disturbances, and determine if there exist feasible pathways that lead to unacceptable outcomes. This is the underpinning of vulnerability assessment, which has been much developed over the last 40 years.
IPCC (WG2 2007: 883) defined vulnerability as “the degree to which a system is susceptible to, and unable to cope with, adverse effects of climate change, including climate variability and extremes.” Thus, vulnerability is a function of the type, size and timing of climate change and its variation to which

D4.3: Assessment of coping and adaptive capacity 49 | Page __________________________________________________________________________________ a system is exposed, the sensitivity of the system to that exposure, and the capacity of the system to adapt (in advance of an impact) or to cope (during an impact).
Vulnerability can be thought of in general (“this society is vulnerable to climate change”). In terms of developing specific strategies, it is often more useful to deal with vulnerability to specific threats (drought, heatwaves) impacting on specific indicators (agricultural output, human health), because the possible adaptation and coping strategies are often similarly specific. At a broader level, the generality and vagueness of the vulnerability concept leads to ambiguity in making it operational and methodologies that are only loosely connected to the theoretical definitions that they seek to implement (Hinkel, 2011). On the other hand, the factors contributing to the capability to adapt or to cope in specific ways can also be thought of in quite general ways – is this a society with surplus wealth, with modern and reliable infrastructure, with healthy and educated people, with sound and effective governance structures? This is in IMPRESSIONS we look to the capitals metaphor to help determine the extent to which societies can cope with specific threats to specific indicators, that together determine ‘overall’ vulnerability to climate change.
Vulnerability has been formalised in optimal control terms, where viability analysis (De Lara et al. 2010) describes the conditions on states (economic endowments) and controls (economic decisions) for the resulting trajectory to be viable, meaning that it meets constraints that maintain some stocks, some aggregate capital or, more generally, some indicators above viability thresholds at all times. The “viability kernel” (Aubin, 1997) is composed of all initial states from which viable trajectories can start.
A more dynamic conceptualisation is provided by Fazey et al. (2015) who focus on adaptation as a constrained process over time (Figure B1). Adaptation pathways consider different sets of possible actions that are sequenced over time at key decision and intervention points to achieve “better” outcomes. Similarly, Wyborn et al. (2014) present adaptation pathways as a “continual process of change and response in relation to interacting climatic and non-climatic processes”.
Figure B1: Adaptation pathways (Fazey et al. 2015).
50 | Page D4.3: Assessment of coping and adaptive capacity __________________________________________________________________________________
These frameworks are useful but beg the question of how the constraints are determined, both in terms of the definition of desirable and non-desirable outcomes and in terms of the extent of ability to act to adapt and cope. Furthermore, as show in Figure B1, constraints are not fixed, but are themselves determined within future scenarios and pathways. IMPRESSIONS tackles the endogeneity of constraints by developing, in consultation with stakeholders, visions or goals for future societies, then determining actions and strategies with the objective to achieve these visions robustly across different scenarios.
Annex B: International Futures (IFs) model
IFs was considered the best contender for integration with IMPRESSIONS for a number of reasons centred on its use of economic modelling with multiple sectors, balanced demand, supply, trade and budgets, its use of capital stocks similar to those used in IMPRESSIONS, and its use of scenarios that map reasonably well to the SSPs used in IMPRESSIONS.
IFs uses input-output matrices that change dynamically with the development level. A Cobb-Douglas function is used to model economic output. The production function is embedded in a six-sector model of the economy featuring agriculture, raw materials, energy, manufactures, services, and ICT. GTAP raw data underpin the representation of the economy in the six sectors (and could be used to add others) in IFs. To deal with data gaps and initialise IFs for all countries in the world, the Input-Output (IO) matrices of the GTAP were used to create nine generic IO matrices representing different levels of GDP per capita. GTAP data on return to factors of production, land, unskilled labour, skilled labour, and capital, were used in defining the value-added blocks of the IFs social accounting matrix (SAM). Again, generic patterns related to GDP per capita were used to fill holes and to provide a basis for dynamically representing changes in those shares as countries develop.
Starting from the GTAP matrices, the IFs model balances domestic demand and trade in a general equilibrium seeking structure, using inventories as buffer stocks to provide price signals so that the model chases equilibrium over time. Inventories (or stocks) act as equilibrating variables in negative feedback loops: if the stock increases, the prices decrease, then the demand increases but the production decreases, which then limits inventories.
Production and consumption of goods and services are in turn incorporated into a larger social accounting matrix (SAM) which represents the behaviour and financial interactions (flows) of households, firms, and government. This flows matrix is complemented by a matrix representing financial stocks (assets and liabilities) of different agent categories for all countries in the system. This representation of stocks provides the mechanism through which the system adjusts flows of finance among different agents and among countries over time.
The production function is modified by a multifactor productivity (MFP) index based on indices of the quality of four types of capitals used in IFs (human, social/governance, physical/natural, knowledge: Hughes et al., 2015) that interact with technology to determine productivity. Each of these components can take on a positive or negative value depending on whether the calculated value of the component is providing a positive or negative impact to economic growth rates relative to what would be expected based on the country’s level of development. The model does not fully take into account technology improvements and endogenous growth.

D4.3: Assessment of coping and adaptive capacity 51 | Page __________________________________________________________________________________ The general logic of the four driver clusters around human, social, physical and knowledge capital is the same. Productivity depends on the quality of capital (especially social, human and physical) interacting with levels of technology. Each cluster aggregates several variables that generally contribute to productivity. The capitals are defined as follows:
HUMAN: driven by years of education, education expenditures, life expectancy and health expenditure.
SOCIAL: driven by Freedom House’s measure of political freedom (a variable describing democracy), governance effectiveness, corruption perceptions and economic freedom.
PRODUCED: driven by two separate indices of infrastructure: traditional (roads, electricity, and water and sanitation) and information and communications technology (ICT).
KNOWLEDGE: driven by R&D expenditures and economic integration. This final component of MFP represents a measure of connectedness to the global economy.
The productivity factors are linked to actual capital stocks through elasticities, for example physical capital is primarily impacted by an index of traditional infrastructure (combining electricity, transportation, and water and sanitation) and an index for ICT. The elasticity of MFP to these indices is modifiable to make the production function more or less responsive to the speed of growth in the two areas of infrastructure.
In turn the capital stocks are influenced by a wide range of parameters via an infrastructure module. This projects infrastructure development and its consequences via a five-stage process:
estimates the expected/demanded level of infrastructure within a country in relation to key drivers like GDP per capita and population;
translates these expectations into financial requirements, accounting for both new construction and maintenance;
system balances these desired funding levels with the actual resources available for infrastructure construction and maintenance;
projects the actual attained levels of infrastructure (both in raw physical terms and in terms of population access rates);
these levels of infrastructure have specific and direct social, economic and environmental impacts related to these attained levels (processes discussed in connection with other modules).
Physical investment and capital stocks are the key driving variables in a positive feedback loop. If capitals increase, the value added and GDP increase as well, so the final demand investments increase. For each variable, such as average years of adult education in the human capital cluster, there is an expected value (for a given level of development) and an actual value. It is the difference between actual and expected values that gives rise to a positive or negative contribution to productivity and growth.7 Most expected values are identified in a relationship with GDP per capita at PPP, which is a
7 i.e. what the factors are showing when capital quality factors are higher/lower than the expected/average values. In IMPRESSIONS terms, we’re identifying populations that are more or less able to cope/adapt than average. This seems more intuitive than the absolute ‘available capitals’ approach as it allows the capital quality factors to be discussed as multipliers on vulnerability.
52 | Page D4.3: Assessment of coping and adaptive capacity __________________________________________________________________________________
function of multifactor productivity (MFP), capital stocks (KS), and labour inputs (LABS), all specified for each of six sectors.
Financial capital is not included directly but is rather modelled within IFs: these parameters explain growth/GDP, and capital dynamics are influenced by investment and depreciation. However, the role of financial capital in determining capacities in effect appears in a submodel for international trade and finance, and in the social accounting matrix. The model also does a good job of taking account of spending limits, since the public finance allocations are explicitly distributed between transfer payments, the military, education, health and infrastructure in the government budget submodule. Bottom-up factors like demographic changes and policies targeting intake or survival will pressure the government to increase education spending. But the model features somewhat rigid top-down control of the budget—spending on education competes with other government spending and IFs maintains accounting of both total government revenues and expenditures.
In the IFs Base Case, the underlying equations are based on historical data reflecting both underlying demands and supply constraints. In scenarios with targets, these equations are overridden by equations reflecting the target path, when the expected values lag behind the values defined by the target path. There is a good overlap between the IFs scenarios and three of the SSPs, and the remaining SSP could be replicated.
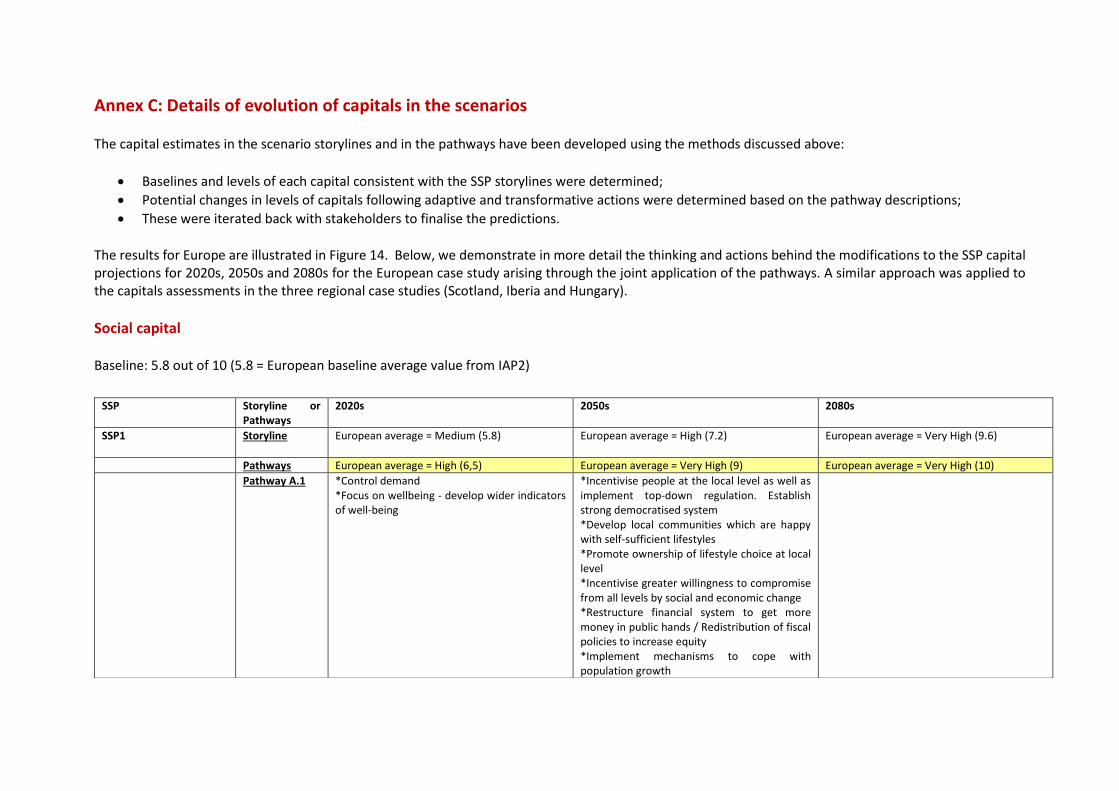
Annex C: Details of evolution of capitals in the scenarios
The capital estimates in the scenario storylines and in the pathways have been developed using the methods discussed above:
Baselines and levels of each capital consistent with the SSP storylines were determined;
Potential changes in levels of capitals following adaptive and transformative actions were determined based on the pathway descriptions;
These were iterated back with stakeholders to finalise the predictions.
The results for Europe are illustrated in Figure 14. Below, we demonstrate in more detail the thinking and actions behind the modifications to the SSP capital projections for 2020s, 2050s and 2080s for the European case study arising through the joint application of the pathways. A similar approach was applied to the capitals assessments in the three regional case studies (Scotland, Iberia and Hungary).
Social capital
Baseline: 5.8 out of 10 (5.8 = European baseline average value from IAP2)
SSP Storyline or Pathways
2020s 2050s 2080s
SSP1 Storyline European average = Medium (5.8)
European average = High (7.2) European average = Very High (9.6)
Pathways European average = High (6,5) European average = Very High (9) European average = Very High (10)
Pathway A.1 *Control demand *Focus on wellbeing - develop wider indicators of well-being
*Incentivise people at the local level as well as implement top-down regulation. Establish strong democratised system *Develop local communities which are happy with self-sufficient lifestyles *Promote ownership of lifestyle choice at local level *Incentivise greater willingness to compromise from all levels by social and economic change *Restructure financial system to get more money in public hands / Redistribution of fiscal policies to increase equity *Implement mechanisms to cope with population growth

54 | Page D4.3: Assessment of coping and adaptive capacity __________________________________________________________________________________
Pathway B.1 *Strengthen EU-citizen connection, reinforce EU democracy *Enhance subsidiary principle – define different levels of governance *Strengthen participation civil society in decision-making *Implement laws to improve energy use *Regulate for more energy efficient products, housing, etc. *Set up governance experiments *Develop new governance technology: massive research and application
*Incentivise communities and research *Change decision-making system - more transparency *Implement civil society engagement activities *Involve society more in decisions taken by government *Build European identity and governance *Hold European elections *Reduce pollution (multi-level agreements)
Pathway C.1 *Support agricultural practices of food exporters to maintain environmental standards *Provide incentives for market development in agriculture *Farm income support and agricultural protection. Common market organisation
*Set up cooperative type of companies
Pathway D.1 *Establish Water Union
Pathway E.1 *Build governance capacities worldwide *Implement stronger EU solidary mechanisms
*Return to UN, World Bank etc. *Focus on SDGs *Develop supra-national goals *Advance European cooperation to make sustainability available for all *Make more funds available through EU research policy *Inspire electorate through visionary leaders *Build trust internationally (after crises period) to create global collaborative system
*World governance *Establish truly global cooperation to achieve sustainability *Support other countries outside Europe to help them cope with growing EU autarky in agriculture *Provide financial support between countries to address climate impacts
SSP3 Storyline Medium (5.8)
High (7.2) High (7.2)
Pathways High (7) Very High (8,5) Very High (9)
Pathway A.3 Provide tax incentives for healthy lifestyles Put in place strong economic and environmental regulation Establish higher taxes on water use in drier areas (link to nature based solutions)
Build a strong social support system Create transparency for social cohesion Increase social protection; cover food, water, healthcare, housing
Pathway B.3 Strengthen democratic inclusiveness and transparency Reaffirm personal privacy
Strengthen civil society and community building Establish multilateral defence agreements
Strengthen and open communication infrastructure for citizens
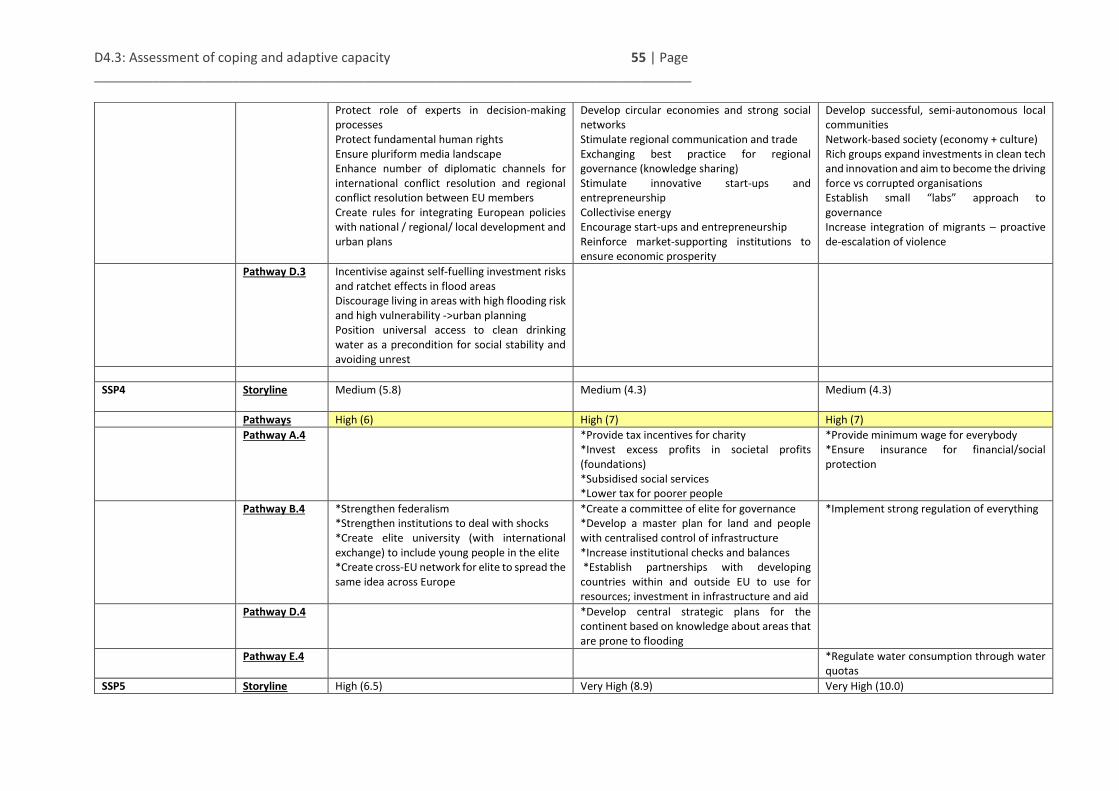
D4.3: Assessment of coping and adaptive capacity 55 | Page __________________________________________________________________________________
Protect role of experts in decision-making processes Protect fundamental human rights Ensure pluriform media landscape Enhance number of diplomatic channels for international conflict resolution and regional conflict resolution between EU members Create rules for integrating European policies with national / regional/ local development and urban plans
Develop circular economies and strong social networks Stimulate regional communication and trade Exchanging best practice for regional governance (knowledge sharing) Stimulate innovative start-ups and entrepreneurship Collectivise energy Encourage start-ups and entrepreneurship Reinforce market-supporting institutions to ensure economic prosperity
Develop successful, semi-autonomous local communities Network-based society (economy + culture) Rich groups expand investments in clean tech and innovation and aim to become the driving force vs corrupted organisations Establish small “labs” approach to governance Increase integration of migrants – proactive de-escalation of violence
Pathway D.3 Incentivise against self-fuelling investment risks and ratchet effects in flood areas Discourage living in areas with high flooding risk and high vulnerability ->urban planning Position universal access to clean drinking water as a precondition for social stability and avoiding unrest
SSP4 Storyline Medium (5.8)
Medium (4.3) Medium (4.3)
Pathways High (6) High (7) High (7)
Pathway A.4 *Provide tax incentives for charity *Invest excess profits in societal profits (foundations) *Subsidised social services *Lower tax for poorer people
*Provide minimum wage for everybody *Ensure insurance for financial/social protection
Pathway B.4 *Strengthen federalism *Strengthen institutions to deal with shocks *Create elite university (with international exchange) to include young people in the elite *Create cross-EU network for elite to spread the same idea across Europe
*Create a committee of elite for governance *Develop a master plan for land and people with centralised control of infrastructure *Increase institutional checks and balances *Establish partnerships with developing countries within and outside EU to use for resources; investment in infrastructure and aid
*Implement strong regulation of everything
Pathway D.4 *Develop central strategic plans for the continent based on knowledge about areas that are prone to flooding
Pathway E.4 *Regulate water consumption through water quotas
SSP5 Storyline High (6.5) Very High (8.9) Very High (10.0)
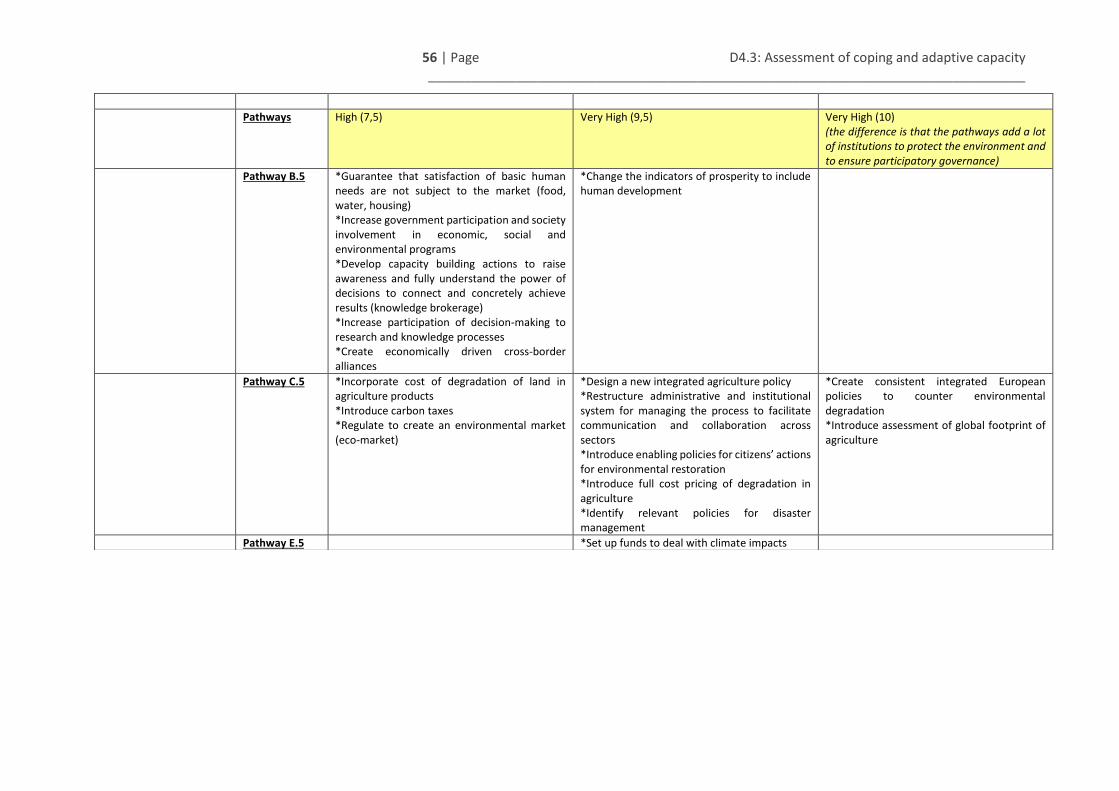
56 | Page D4.3: Assessment of coping and adaptive capacity __________________________________________________________________________________
Pathways High (7,5) Very High (9,5) Very High (10) (the difference is that the pathways add a lot of institutions to protect the environment and to ensure participatory governance)
Pathway B.5 *Guarantee that satisfaction of basic human needs are not subject to the market (food, water, housing) *Increase government participation and society involvement in economic, social and environmental programs *Develop capacity building actions to raise awareness and fully understand the power of decisions to connect and concretely achieve results (knowledge brokerage) *Increase participation of decision-making to research and knowledge processes *Create economically driven cross-border alliances
*Change the indicators of prosperity to include human development
Pathway C.5 *Incorporate cost of degradation of land in agriculture products *Introduce carbon taxes *Regulate to create an environmental market (eco-market)
*Design a new integrated agriculture policy *Restructure administrative and institutional system for managing the process to facilitate communication and collaboration across sectors *Introduce enabling policies for citizens’ actions for environmental restoration *Introduce full cost pricing of degradation in agriculture *Identify relevant policies for disaster management
*Create consistent integrated European policies to counter environmental degradation *Introduce assessment of global footprint of agriculture
Pathway E.5 *Set up funds to deal with climate impacts
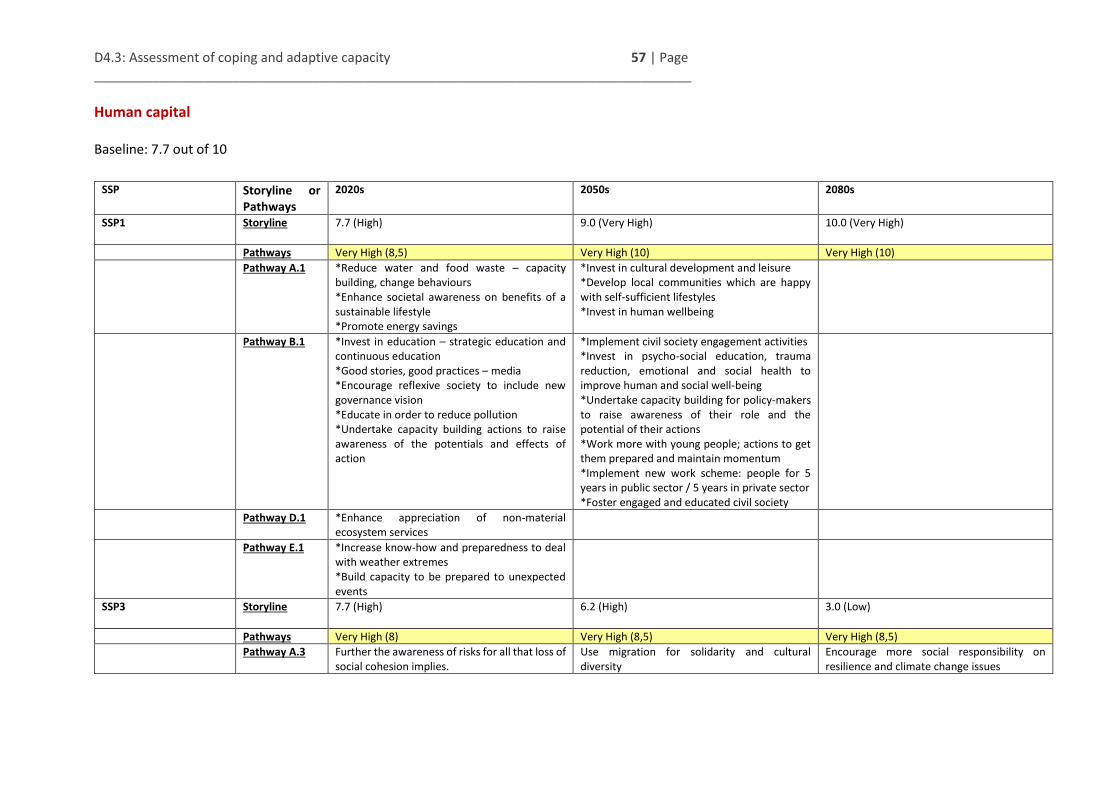
D4.3: Assessment of coping and adaptive capacity 57 | Page __________________________________________________________________________________
Human capital
Baseline: 7.7 out of 10
SSP Storyline or Pathways
2020s 2050s 2080s
SSP1 Storyline 7.7 (High)
9.0 (Very High) 10.0 (Very High)
Pathways Very High (8,5) Very High (10) Very High (10)
Pathway A.1 *Reduce water and food waste – capacity building, change behaviours *Enhance societal awareness on benefits of a sustainable lifestyle *Promote energy savings
*Invest in cultural development and leisure *Develop local communities which are happy with self-sufficient lifestyles *Invest in human wellbeing
Pathway B.1 *Invest in education – strategic education and continuous education *Good stories, good practices – media *Encourage reflexive society to include new governance vision *Educate in order to reduce pollution *Undertake capacity building actions to raise awareness of the potentials and effects of action
*Implement civil society engagement activities *Invest in psycho-social education, trauma reduction, emotional and social health to improve human and social well-being *Undertake capacity building for policy-makers to raise awareness of their role and the potential of their actions *Work more with young people; actions to get them prepared and maintain momentum *Implement new work scheme: people for 5 years in public sector / 5 years in private sector *Foster engaged and educated civil society
Pathway D.1 *Enhance appreciation of non-material ecosystem services
Pathway E.1 *Increase know-how and preparedness to deal with weather extremes *Build capacity to be prepared to unexpected events
SSP3 Storyline 7.7 (High)
6.2 (High) 3.0 (Low)
Pathways Very High (8) Very High (8,5) Very High (8,5)
Pathway A.3 Further the awareness of risks for all that loss of social cohesion implies.
Use migration for solidarity and cultural diversity
Encourage more social responsibility on resilience and climate change issues

58 | Page D4.3: Assessment of coping and adaptive capacity __________________________________________________________________________________
Raise awareness on ethical issues related to growing inequality Strongly invest in education and social services Reorganize and improve education Provide education for all levels to all groups Develop awareness and communication tools (zoos and reserves) for education and visibility Provide for strong media to offer examples of the effects of pollution
Turn around fragmentation by enhancing sense of solidarity Strengthen local initiatives – to live with less Invest in capacity building and education at all levels Develop bottom-up education (missionaries, village schools) Run “alternative schools” through social movements to enhance lifestyles (link to social capital) Use social counter-movement, engage poor people – educate, networking, support entrepreneurship Enhance education for all groups of society to counter fragmentation Provide info campaigns for basic knowledge
Engage the rich bubble in social programs to provide opportunities to address problems i.e. poverty (link to economy)
Pathway B.3 Maintain cultural heritage through creative and proactive approaches (e.g. privatize)
Increase integration of migrants – proactive de-escalation of violence Stimulate innovative start-ups and entrepreneurship
Pathway C.3 Share knowledge on agriculture and land-use Provide local education and skills network (link to education and governance) Provide incentives for environmentally friendly local agriculture Research into vegetarian or non-dairy diets
Encourage local entrepreneurship (link with governance) Develop local networks for circular economy (link with governance) Inform about management practice on extensive land-use to increase biodiversity (link with awareness raising)
SSP4 Storyline 7.7 (High)
6.2 (High) 6.2 (High)
Pathways Very High (8) Very High (8) Very High (8)
Pathway A.4 *Strengthen education for all people (invest) *Promote efficient use of resources
*Implement education and awareness campaigns for waste reduction (e.g. packaging, food) *Promote intercultural understanding to allow people to live together with a mind-set for a peaceful existence *Promote low consumption (of resources, food etc.)
*Control food and health for all: Planned society lifestyle – you control food, what you eat, you need to exercise

D4.3: Assessment of coping and adaptive capacity 59 | Page __________________________________________________________________________________
*Raise awareness for responsible water consumption *Educate the elite to foster philanthropy and spending for the societal good (e.g. health, education, charity) *Tend to the basic needs of the masses *Provide jobs from producing solar panels *Invest in public health
Pathway E.4 *Invest in R&D for improving quality of food and food technologies
SSP5 Storyline 8.4 (Very High)
9.9 (Very High) 10.0 (Very High)
Pathways Very High (9) Very High (10) Very High (10)
Pathway A.5 *Employ agriculture as lever for environmental awareness *Create demand for organic healthy products and good communication marketing of them Invest in education for nature *Educate young people to achieve higher sustainability *Educate people about ecosystem services including monetary values of ES *Strengthen the education on value of nature and biodiversity
*Promote that schools run environmental awareness programs for kids
*Source public and private investments for innovation *Reward good practices in agriculture (monetary incentives)
Pathway B.5 *Guarantee that satisfaction of basic human needs are not subject to the market (food, water, housing) *Develop capacity building actions to raise awareness and fully understand the power of decisions to connect and concretely
Pathway D.5 *Strong awareness campaign about water
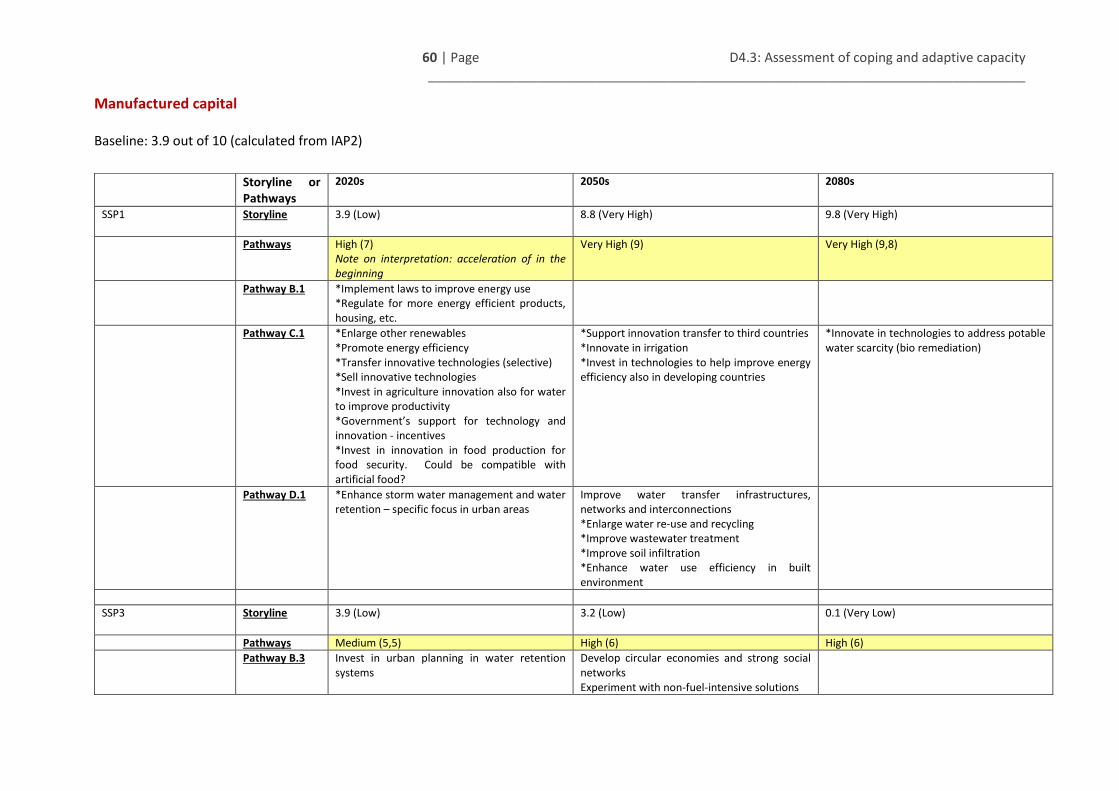
60 | Page D4.3: Assessment of coping and adaptive capacity __________________________________________________________________________________
Manufactured capital
Baseline: 3.9 out of 10 (calculated from IAP2)
Storyline or Pathways
2020s 2050s 2080s
SSP1 Storyline 3.9 (Low)
8.8 (Very High) 9.8 (Very High)
Pathways High (7) Note on interpretation: acceleration of in the beginning
Very High (9) Very High (9,8)
Pathway B.1 *Implement laws to improve energy use *Regulate for more energy efficient products, housing, etc.
Pathway C.1 *Enlarge other renewables *Promote energy efficiency *Transfer innovative technologies (selective) *Sell innovative technologies *Invest in agriculture innovation also for water to improve productivity *Government’s support for technology and innovation - incentives *Invest in innovation in food production for food security. Could be compatible with artificial food?
*Support innovation transfer to third countries *Innovate in irrigation *Invest in technologies to help improve energy efficiency also in developing countries
*Innovate in technologies to address potable water scarcity (bio remediation)
Pathway D.1 *Enhance storm water management and water retention – specific focus in urban areas
Improve water transfer infrastructures, networks and interconnections *Enlarge water re-use and recycling *Improve wastewater treatment *Improve soil infiltration *Enhance water use efficiency in built environment
SSP3 Storyline 3.9 (Low)
3.2 (Low) 0.1 (Very Low)
Pathways Medium (5,5) High (6) High (6)
Pathway B.3 Invest in urban planning in water retention systems
Develop circular economies and strong social networks Experiment with non-fuel-intensive solutions

D4.3: Assessment of coping and adaptive capacity 61 | Page __________________________________________________________________________________
Invest in water management technology and knowledge sharing (link with water)
Ensure infrastructure exists to allow network economy to exist: Trade – ports, rail airports (link to decentralised local governance) Build water harvesting infrastructure (link with water) Adapt waste water infrastructure -> more expensive
Pathway C.3 Improve waste management Implement resource management and regulation
Increase greenhouse farming Reuse resources, swapping /exchange of goods
Pathway D.3 Include flood initiatives as a quantified externality in infrastructure investment Combine river-flow interventions with clearance of rivers to make more effective actions Build / reinforce dyke system Build + invest in sewer systems and absorption of rain Develop water transportation system from north to south Europe Incentivise tech and innovation solution to reduce water demand (link to infrastructure and economy)
Low-key water-harvesting (from floods) in South Household rain harvesting for specific uses
Promote living in house boats
SSP4 Storyline 3.9 (Low)
8.8 (Very High) 9.8 (Very High)
Pathways Medium (5) Very High (9) Very High (10)
Pathway D.4 *Create more green and less hard structures/surfaces
*Establish massive zones for water production and recycling *Decrease infrastructure that is strategically positioned: ports, airports, in-between cities – in relation to efficient food production
Pathway E.4 *Replace conventional power stations that have reached the end of their life cycle with renewable power stations *Implement early warning systems for extreme weather events that protect technology, energy provision *Move from local to regional energy provision and generation
*Develop de-salination to create more fresh water sources *Use recycled water – not necessarily for human consumption (e.g. treating water and waste water from post-production processes) *Establish EU as leader in technologies *Electrify transport to make transport systems more energy efficient
*Transport water e.g. from Northern Spain (Pyrenees) to the South *Nuclear fusion *Massive investment in green energy and technology *Develop intelligent systems for storage capacity (e.g. huge pumped hydro plants) *Massive energy production in Southern Spain
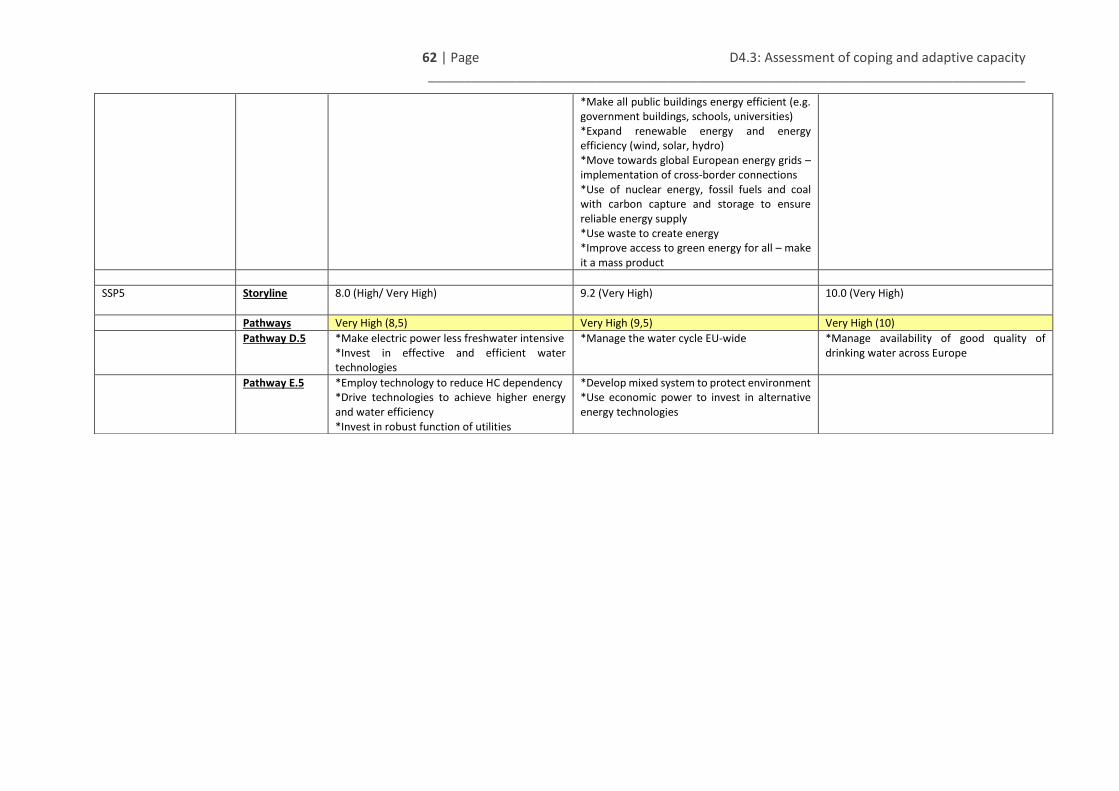
62 | Page D4.3: Assessment of coping and adaptive capacity __________________________________________________________________________________
*Make all public buildings energy efficient (e.g. government buildings, schools, universities) *Expand renewable energy and energy efficiency (wind, solar, hydro) *Move towards global European energy grids – implementation of cross-border connections *Use of nuclear energy, fossil fuels and coal with carbon capture and storage to ensure reliable energy supply *Use waste to create energy *Improve access to green energy for all – make it a mass product
SSP5 Storyline 8.0 (High/ Very High)
9.2 (Very High) 10.0 (Very High)
Pathways Very High (8,5) Very High (9,5) Very High (10)
Pathway D.5 *Make electric power less freshwater intensive *Invest in effective and efficient water technologies
*Manage the water cycle EU-wide *Manage availability of good quality of drinking water across Europe
Pathway E.5 *Employ technology to reduce HC dependency *Drive technologies to achieve higher energy and water efficiency *Invest in robust function of utilities
*Develop mixed system to protect environment *Use economic power to invest in alternative energy technologies
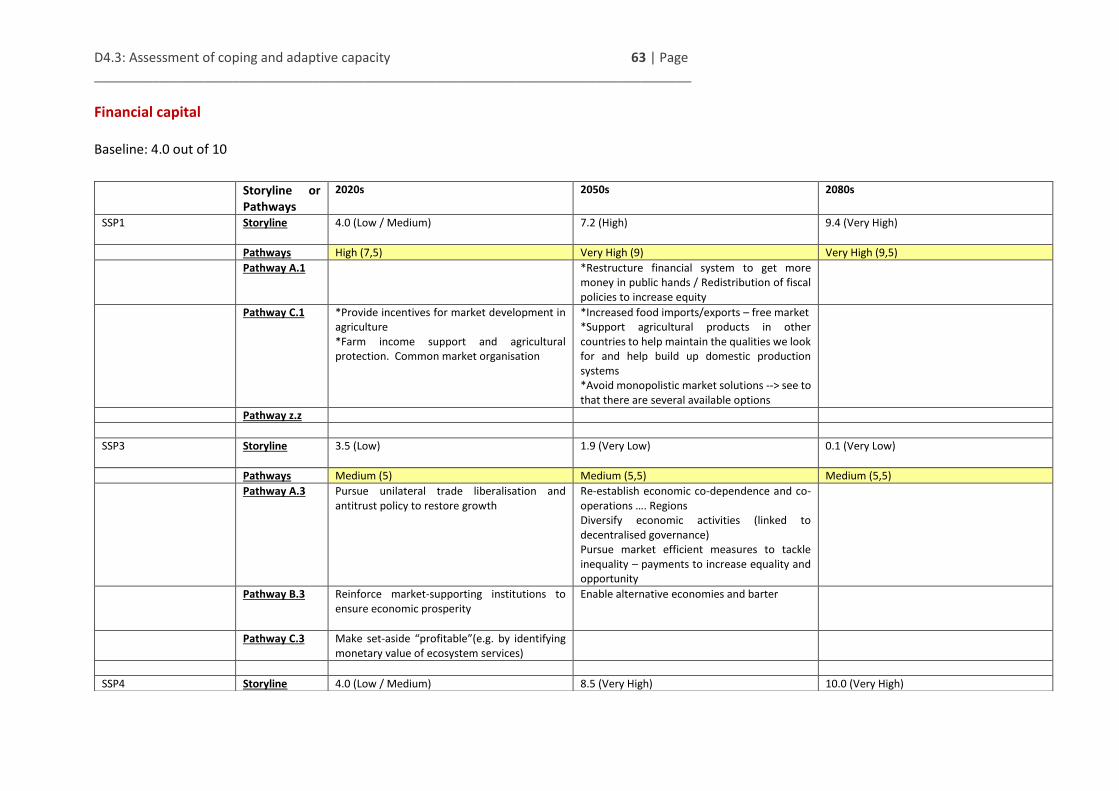
D4.3: Assessment of coping and adaptive capacity 63 | Page __________________________________________________________________________________
Financial capital
Baseline: 4.0 out of 10
Storyline or Pathways
2020s 2050s 2080s
SSP1 Storyline 4.0 (Low / Medium)
7.2 (High) 9.4 (Very High)
Pathways High (7,5) Very High (9) Very High (9,5)
Pathway A.1 *Restructure financial system to get more money in public hands / Redistribution of fiscal policies to increase equity
Pathway C.1 *Provide incentives for market development in agriculture *Farm income support and agricultural protection. Common market organisation
*Increased food imports/exports – free market *Support agricultural products in other countries to help maintain the qualities we look for and help build up domestic production systems *Avoid monopolistic market solutions --> see to that there are several available options
Pathway z.z
SSP3 Storyline 3.5 (Low)
1.9 (Very Low) 0.1 (Very Low)
Pathways Medium (5) Medium (5,5) Medium (5,5)
Pathway A.3 Pursue unilateral trade liberalisation and antitrust policy to restore growth
Re-establish economic co-dependence and co-operations …. Regions Diversify economic activities (linked to decentralised governance) Pursue market efficient measures to tackle inequality – payments to increase equality and opportunity
Pathway B.3 Reinforce market-supporting institutions to ensure economic prosperity
Enable alternative economies and barter
Pathway C.3 Make set-aside “profitable”(e.g. by identifying monetary value of ecosystem services)
SSP4 Storyline 4.0 (Low / Medium) 8.5 (Very High) 10.0 (Very High)

64 | Page D4.3: Assessment of coping and adaptive capacity __________________________________________________________________________________
Pathways Medium (5,5) Very High (9) Very High (10)
Pathway B.4 *Formulate regulation to establish a single energy market in Europe *Invest in international property as major source of wealth and political stability *Export massively (technology) *Invest in external countries to keep a flow of resources from abroad (e.g. water, energy)
*Expand market leadership globally to enhance sustainability globally *Advance economic growth in less developed countries and enlarge markets
SSP5 Storyline 6.0 (Medium / High)
7.9 (High) 10.0 (Very High)
Pathways High (7) High/Very High (8) Note: There is a mismatch between what we think is possible in this scenario (considering e.g. environmental degradation), what the scenario value shows and how much the pathways increase that. Thus, while the pathways would increase the capital value for quite a bit compared to the scenario value, we do not think in this scenario the capital value could be higher.
Very High (10)
Pathway B.5 *Create economically driven cross-border alliances
Pathway C.5 *Incorporate cost of degradation of land in agriculture products *Removal of CAP subsidies *Introduce carbon taxes *Regulate to create an environmental market (eco-market)
*Introduce enabling policies for citizens’ actions for environmental restoration *Introduce full cost pricing of degradation in agriculture
*Incorporate payment for ecosystem services of agriculture
Pathway E.5 *Introduce higher taxes for fossil fuels
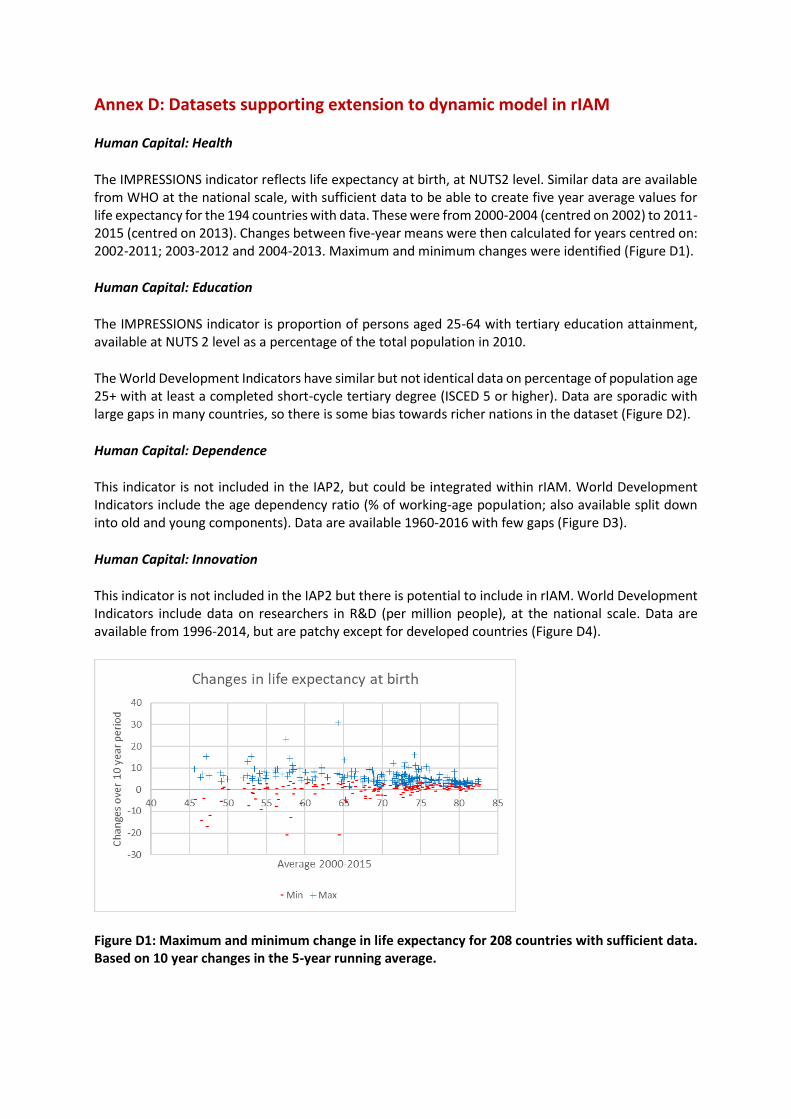
Annex D: Datasets supporting extension to dynamic model in rIAM
Human Capital: Health
The IMPRESSIONS indicator reflects life expectancy at birth, at NUTS2 level. Similar data are available from WHO at the national scale, with sufficient data to be able to create five year average values for life expectancy for the 194 countries with data. These were from 2000-2004 (centred on 2002) to 2011-2015 (centred on 2013). Changes between five-year means were then calculated for years centred on: 2002-2011; 2003-2012 and 2004-2013. Maximum and minimum changes were identified (Figure D1).
Human Capital: Education
The IMPRESSIONS indicator is proportion of persons aged 25-64 with tertiary education attainment, available at NUTS 2 level as a percentage of the total population in 2010.
The World Development Indicators have similar but not identical data on percentage of population age 25+ with at least a completed short-cycle tertiary degree (ISCED 5 or higher). Data are sporadic with large gaps in many countries, so there is some bias towards richer nations in the dataset (Figure D2).
Human Capital: Dependence
This indicator is not included in the IAP2, but could be integrated within rIAM. World Development Indicators include the age dependency ratio (% of working-age population; also available split down into old and young components). Data are available 1960-2016 with few gaps (Figure D3).
Human Capital: Innovation
This indicator is not included in the IAP2 but there is potential to include in rIAM. World Development Indicators include data on researchers in R&D (per million people), at the national scale. Data are available from 1996-2014, but are patchy except for developed countries (Figure D4).
Figure D1: Maximum and minimum change in life expectancy for 208 countries with sufficient data. Based on 10 year changes in the 5-year running average.
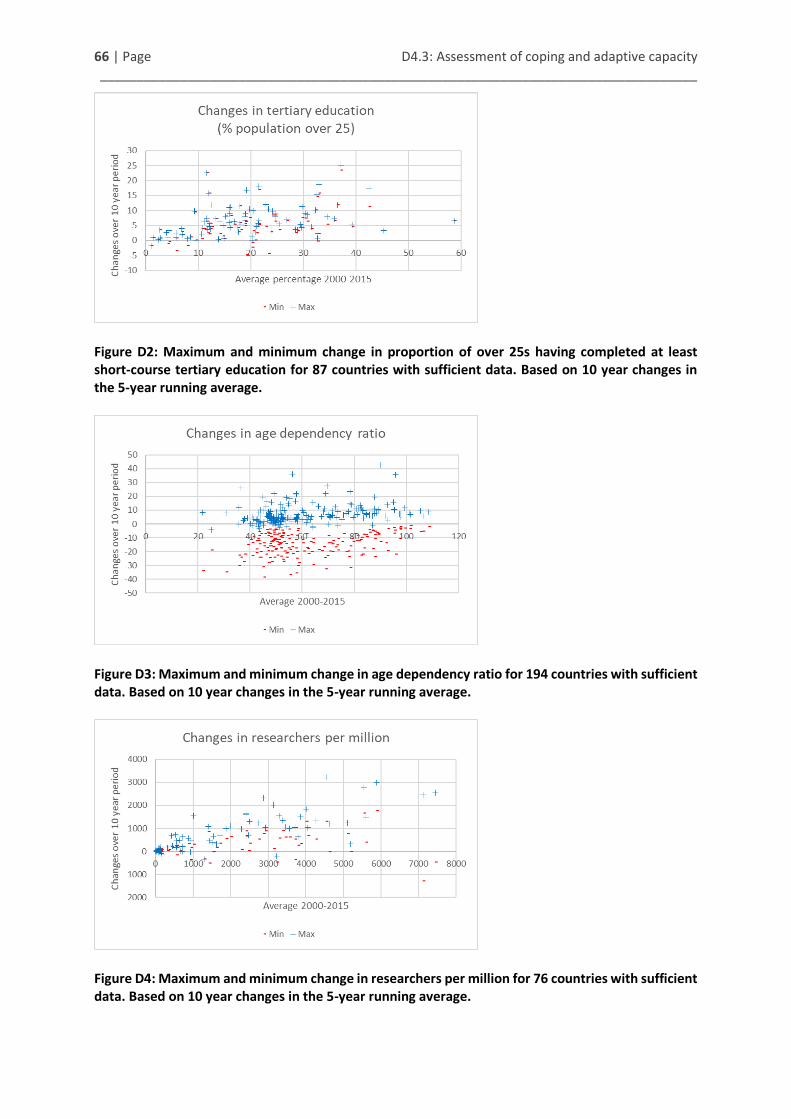
66 | Page D4.3: Assessment of coping and adaptive capacity __________________________________________________________________________________
Figure D2: Maximum and minimum change in proportion of over 25s having completed at least short-course tertiary education for 87 countries with sufficient data. Based on 10 year changes in the 5-year running average.
Figure D3: Maximum and minimum change in age dependency ratio for 194 countries with sufficient data. Based on 10 year changes in the 5-year running average.
Figure D4: Maximum and minimum change in researchers per million for 76 countries with sufficient data. Based on 10 year changes in the 5-year running average.
D4.3: Assessment of coping and adaptive capacity 67 | Page __________________________________________________________________________________ Social Capital: Inequality
In IMPRESSIONS, the income quintile share ratio or the S80/S20 ratio is a measure of the inequality of income distribution. It is calculated as the ratio of total income received by the 20% of the population with the highest income (the top quintile) to that received by the 20% of the population with the lowest income (the bottom quintile). The values for 2010 were used, with spatial scale at NUTS0.
It is straightforward to construct the same series from the World Development Indicators using the series on income share held by highest 20% and income share held by lowest 20%. Data availability is reasonable, with some data from 1980, better from 2000-2014, but with many gaps (Figure D5).
Social Capital: Help when threatened
In IMPRESSIONS, this indicator was drawn from the Eurobarometer Social Capital report (2005) as the proportion of the respondents who said they could call on friends for help when threatened. Data are at NUTS0. No equivalent was found with good data at that global level.
There are closely related questions recorded in the OECD social capital project and question databank8, including two from the Gallup World Poll “If you were in trouble, do you have relatives or friends you can count on to help you whenever you need them, or not?” and “Do you have relatives or friends who are living in another country who you can count on to help you when you need them, or not?” However there are not yet enough data to analyse decadal changes.
There are questions from some years of the European Social Survey and the European Survey on Income and Living Conditions, but changes in the questions mean the data are not comparable. For example the 2004 question “if you needed help, is there anyone outside your household you can count on to give you unpaid help with childcare, other care, housework or home maintenance?” has an average 74.6% positive response across Europe, while the 2013 question “Are you able to ask for help from others when you need” with the clarification “Refers to any kind of help: moral, material or financial” is much broader in scope, which likely explains the higher average score of 93.3%. The 2006 question is similar to the 2013 one, but (in the English version at least) used the phrasing “could you tell me if you would ask any of your neighbours for help?” “Would ask” is not the same as “able to ask” and this could explain why the UK positive response was 43.9% to the former in 2006, but 94.4% to the latter in 2013. Overall the EU average score was 85.1% in 2006, but due to the differences in questions this cannot really be interpreted as signalling an increase in the indicator from 2006-2013.
There are data in the World Development Indicators on “Social protection and labour”. This indicator assesses government policies in social protection and labour market regulations that reduce the risk of becoming poor, assist those who are poor to better manage further risks, and ensure a minimal level of welfare to all people. Hence this would reflect the availability of a formal safety net, rather than the more informal network of friendships and intra-community help. There is also some overlap with the income distribution measure, though that is also highly dependent on the share of the richest 20%. Furthermore, data are only available 2005-2016 with partial coverage and (most importantly for our purposes) there is very little change over time for individual countries. Hence this would not help to bracket possible changes over time.
8 http://www.oecd.org/std/social-capital-project-and-question-databank.htm

68 | Page D4.3: Assessment of coping and adaptive capacity __________________________________________________________________________________
Another option is to look at the “human capital: dependence” data cited above. Although that can be interpreted as an indicator of human capital (what proportion of population is ‘productive’) it could also be thought of as an indicator of social capital. However it is about ages, not relationships, so it does not capture the same concept.
Overall therefore we have no satisfactory method for assessing changes over time in “help when threatened” or similar indicators.
Figure D5: Maximum and minimum change in income distribution ratio (share of top quintile to bottom quintile) for 129 countries with sufficient data. Based on 10 year changes in the 5-year running average.
Manufactured Capital: Infrastructure
The IAP2 indicator uses the total length of European road, rail and navigable inland waterways networks for 2009 standardised by NUTS2 area from NUTS 2006 GIS data.
The closest equivalent in the World Development Indicators looks only at rail infrastructure (Figure D6) (there are also series on energy production, and some on rail, ports, and air, but nothing on roads). There is also the option of looking at communications. However the data here are quite monotonic, both for mobile telephone subscriptions (Figure D7) and for proportion of population using the internet (Figure D8).
Manufactured Capital: Produced Capital
The IAP2 indicator uses the produced capital series from the World Bank “Wealth of Nations” series. This is the sum of manufactured capital and urban land, which is valued at 24 percent of manufactured capital across all countries. Produced capital is defined as accumulation of investment series (gross capital formation) taking into account depreciation at the rate of 5%. 20-years is the service lifetime assumption. It is available at NUTS0 scale for 5-year intervals from 1995 to 2005, but the series is no

D4.3: Assessment of coping and adaptive capacity 69 | Page __________________________________________________________________________________ longer produced, having been replaced by the Wealth Accounting database9 which uses a different methodology.
These data include adjusted savings: net national savings (% of GNI), although this is an annual flow measure rather than a stock of capital: net national savings are equal to gross national savings less the value of consumption of fixed capital. So this variable is measuring the rate of change of the capital stock rather than the stock itself (Figure D9). Note that Kuwait is an outlier not shown on the graph: the temporary impact of the Iraqi invasion in 1990 gave resulted in -219% for the 1981-1991 change and a corresponding +192% for the 1991-2001 change.
Figure D6: Maximum and minimum change in railway density (km per km2) for 107 countries with sufficient data. Based on 10 year changes in the 5-year running average.
Figure D7: Maximum and minimum change in mobile cellular subscriptions (per 100 people) for 211 countries with sufficient data. Based on 10 year changes in the 5-year running average.
9 http://databank.worldbank.org/data/reports.aspx?source=wealth-accounting

70 | Page D4.3: Assessment of coping and adaptive capacity __________________________________________________________________________________
Figure D8: Maximum and minimum change in proportion of population using internet (%) for 206 countries with sufficient data. Based on 10 year changes in the 5-year running average.
Financial Capital: Income
The IAP2 uses data for disposable income per household following purchasing power standardisation (PPS), available at NUTS2 level.
Financial capital: Savings
The IAP2 uses European net household savings, also at purchasing power standards per inhabitant. These data are available at NUTS0 level.
The OECD produces data on household savings as a proportion of household income, though for most countries the series begins in the 1990s (Figure D10).
Figure D9: Maximum and minimum change in adjusted net savings (% of GNI) for 162 countries with sufficient data. Based on 10 year changes in the 5-year running average.

D4.3: Assessment of coping and adaptive capacity 71 | Page __________________________________________________________________________________
Figure D10: Maximum and minimum change in household savings (% of household disposable income) for 31 countries with sufficient data. Based on 10 year changes in the 5-year running average.