
How Do Altimeters Work - Part 3
11
ISSUE 257 MARCH 23, 2010 Apogee Components, Inc. — Your Source For Rocket Supplies That Will Take You To The “Peak-of-Flight” 3355 Fillmore Ridge Heights Colorado Springs, Colorado 80907-9024 USA www.ApogeeRockets.com e-mail: [email protected] Cover Photo: LOC Precision Minie-Magg rocket kit. Get your’s today at: www.apogeerockets.com/LOC_Minie_Magg.asp How Do Altimeters Work - Part 3 Feature Article
Transcript of How Do Altimeters Work - Part 3

I S S U E 2 5 7 M A R C H 2 3 , 2 0 1 0
Apogee Components, Inc. — Your Source For Rocket Supplies That Will Take You To The “Peak-of-Flight”3355 Fillmore Ridge Heights
Colorado Springs, Colorado 80907-9024 USAwww.ApogeeRockets.com e-mail: [email protected]
Cover Photo: LOC Precision Minie-Magg rocket kit. Get
your’s today at:www.apogeerockets.com/LOC_Minie_Magg.asp
How Do Altimeters Work - Part 3
Feature Article

Page 2 I S S U E 2 5 7 M A R C H 2 3 , 2 0 1 0
You can subscribe to receive this e-zine FREE at the Apogee Components web site (www.ApogeeRockets.com), or by sending an e-mail to: [email protected] with “SUB-SCRIBE” as the subject line of the message.
About this Newsletter Newsletter Staff
Writer: Tim Van MilliganLayout / Cover Artist: Tim Van MilliganProofreader: Michelle Mason
By Norm Diedzic Jr.
Continued on page 3
How Do Electronic Altimeters Work - Part 3
{Ed: This is part three in the series of articles that explains how altimeters work. Part 1 was in Peak-of-Flight Newsletter #240 at www.ApogeeRockets.com/Education/Downloads/Newsletter240.pdf. Part 2 was in Newsletter #242 which can be downloaded at www.ApogeeRockets.com/Education/Downloads/Newsletter242.pdf. }
In our previous two installments, we have been slowly circling around the heart of the altimeter. This is where all the logic processing occurs. In our block diagram, we called this part of the altimeter the Computer or Processing unit. Actually more common names in industry for these would be microprocessors, microcontrollers or embedded controllers. Many times they simply are called MCU as an abbreviation for MicroController Unit, which we will use in this article.
for a personal com-puter or laptop. Just like shopping for a PC, the main consider-ations for the proces-sor are bits, speed and memory. For a PC we look for 32 vs. 64 bits, gigahertz speeds and gigabytes of memory; with an MCU we gen-erally look for 8 or 16 bits, kilohertz or megahertz speeds and kilobytes of memory.
But while all PC processors must work with the same few mother board designs and operating systems, in the MCU arena there are no such restrictions, so you fi nd much more variety in “extras” that may be included in an MCU. In fact, many microcontrollers include A/D and D/A convert-ers right in the processor. In this way certain MCU devices become specialized to certain tasks.
Other things that you may need to consider with MCUs that you don’t with PC processors are the number of input and output lines, communication ports available, power consumption, programming method and chip packaging.
The input and output lines get connected to things like jumpers for setting altimeter features, LED’s for fl ashing out altitude and signals for fi ring ejection charges. Certain communication ports may be required to communicate with A/D converters, memory chips or displays. In summary, just like with all of the other devices discussed so far, with an MCU, there are a lot of options and the designer will spend a lot of time looking at different hardware to fi nd the right mix of features and prices to meet their design criteria.
One nice thing most of the MCU manufacturers have done is package their controllers in what is known as a starter kit with a controller mounted on a board with some other devices for testing and evaluation. Generally, soft-ware, a manual and programming cable are also included. This is an easy way for the designer to test the MCU and see if it meets their needs.
PowerSource
Computer /Processing
Unit
Sensor
Mounting Holes
Altitude OutputBeeper, FlashingLED or Screen
Opt
iona
l - O
utpu
t(s)
Te
rmin
als
for
Cha
rges
Analog toDigital Converter
(A/D)SensorSensorSensor
PowerSourcePowerSourcePowerSource
Altitude Output
Analog toDigital Converter
(A/D)
Analog toDigital Converter
(A/D)
Analog toDigital Converter
(A/D)
Opt
iona
l - O
utpu
t(s)
O
ptio
nal -
Out
put(
s)
Figure 1: Altimeter block diagram.
So what makes an MCU different from the other de-vices we have been covering in the series? All of these devices are little black chips with pins sticking out that get soldered on a board of some sort. The differentiator with an MCU is that it can be programmed with software to per-form a multitude of tasks. The other devices can be confi g-ured, but only perform one task such as voltage regulation or A/D conversion.
Like all of the other devices we have discussed, differ-ent MCU’s have different features and capabilities. When reviewing an MCU, the features are very similar to looking
Figure 2: Chips on a board.

Page 3I S S U E 2 5 7 M A R C H 2 3 , 2 0 1 0
How Do Electronic Altimeters Work - 3Continued from page 2
Continued on page 4
When it comes to programming, microcontrollers have come a long way from their roots. They used to be pro-grammed almost exclusively in something called assembly language.
Well written assembly programs (also known as code) result in the fastest running systems possible. That is be-cause each instruction in assembly code relates 1:1 to an actual MCU instruction. For this reason, assembly is also called a low level programming language. The instructions are very rudimentary but execute quickly. For instance,
if you wanted to add three numbers together in assembly code, you would have to perform all of the following steps:
1. Fetch the fi rst number into a register
2. Add the 2nd number to the fi rst (the result of this operation stays in the register)
3. Add the 3rd number to the register.
4. Move the result to storage for use later.
If our numbers are 10, 15, and 33, the assembly code might look like this:
MOVLW 0Ah
ADDLW 0Fh
ADDLW 21h
MOVWF 30h
Ouch – if you never saw assembly language be-fore, that doesn’t make much sense at all. Most assembly instructions are entered as abbreviations called mnemonics and most numbers are entered in a format called hexadeci-mal, so it’s like everything is in double shorthand. A full, or even cursory depiction of assembly language is defi nitely beyond the scope of this article.
We also may need to see if the result of our math cre-ated a number too big for the MCU to handle. Remember when we discussed bits in the last article and how with 8 bits, we can have 256 states. If we are using an 8 bit controller and our sum gets larger than 256 we should
Altimeter One
ww
w.A
pogeeRock
ets.co
mYour Source For Everything
Rock
etry
• Records peak altitude up to 29,000 feet (ASL)• Rechargable battery. Just plug it into a USB
port on your computer to recharge.• Small size: Fits easily in a 18mm diameter
tube, and weighs only 7 grams.• Rock-solid design. No need to protect it by
putting it in a separate payload bay. Just clip it to the nose cone or shock cord.
• Easy-to-read LCD display. No need to count beeps.
“The one altimeter you’ll use in every rocket you fl y.”
ww
w.A
pogeeRock
ets.co
mYour Source For Everything
Rock
etry
ww
w.A
pogeeRock
ets.co
mYour Source For Everything
Rock
etryCom
ing
May, 2010
Finally... A simple to use device that “shows” you how high your rocket went.
Figure 3: A MicroController Unit development kit comes with a lot of extras to make programming easier.
Quarter shown for size comparison

Page 4 I S S U E 2 5 7 M A R C H 2 3 , 2 0 1 0
How Do Electronic Altimeters Work - 3Continued from page 3
know about it. The MCU will turn on a special reserved bit in a place called the carry fl ag when that happens so our program can react accordingly.
Thankfully, as MCUs have increased in capabilities and speed, higher level languages are able to be used. The most common of these are BASIC and C. In either of these languages, our attempt to add three numbers together would look more like an equation you learned in grammar school: A = 10+15+33;
These are called high level languages because each statement in these languages corresponds to many instruc-tions at the MCU hardware level. Contrast this with assem-bly language where each statement is an MCU hardware instruction. While assembly language has the potential to create faster executing programs, it also has a steeper learning curve and is harder to debug (the process of fi xing programming errors). For each different architecture of MCU, there will be different assembly instructions to learn, while with C or Basic, the majority of the language is stan-dardized so a programmer is more free to switch between MCU’s and not have to spend a lot of time learning the new architecture.
Ok, enough about the MCU. Let’s assume we have the hardware, we know the language and we want to make an altimeter out of this conglomeration of chips, solder and green board. We have a number that represents air pres-sure, but we need a way to turn that into an altitude. To do this, we need to learn a little more about the atmosphere.
For analysis purposes, the atmosphere is broken up into different zones, each with its own properties. One accepted defi nition of these zones and their properties is detailed in the U.S. Standard Atmosphere 1976, from the Government Printing Offi ce. This 241 page tome tells you more than you will ever want to know about the atmo-sphere, and contains 165 pages of tables of altitudes, pres-
sures, temperatures and a host of other data of interest to scientists.
The zones are broken up based on how the temperature changes within each zone. The zone closest to earth, the tropo-sphere, is what we are most interested in. This layer extends from the surface of the earth to 11,000m (about 6.8 miles) above sea level.
The way the tem-perature changes within a layer is called the temperature gradient. For the layer of air from sea level to 11km the temperature gradient is given as:
[1]
The K in this equation is degrees Kelvin, which is a
Continued on page 5
mkKL
���� 5.6
Figure 4: U.S. Standard Atmo-sphere book.
Discovery
United States
P r e s e n t i n gThe
National Association of Rocketry’s
National S por t L aunchMemorial Day Weekend
May 29-31, 2010Alamogordo, New Mexico
http://nsl2010.com
You get:(4) AT 29/13(4) AT 41/18(2) AT 56/18(2) AT 66/18(1) AC-56(1) AC-66Price: $22.72You Save: $5.17
You get:(6) AT 13/18(6) AT 18/18(6) AT 24/18(6) AT 33/18
Price: $26.00From Estes, you would spend over $44.45!
http://www.ApogeeRockets.com/body_tubes.asp

Page 5I S S U E 2 5 7 M A R C H 2 3 , 2 0 1 0
How Do Electronic Altimeters Work - 3Continued from page 4
temperature scale referenced to absolute zero. Absolute zero is the temperature at which all motion, even within molecules and atoms, stops. Standards are generally defined to absolute scales if they can be. So zero degrees Kelvin is as cold as it gets. To convert to Celsius, you have to add 273.15 to the Kelvin temperature. The size of a degree Kelvin is exactly the same as the size of a degree Celsius but the entire scale is just shifted down 273.15 degrees.
The km’ in the equation is something called geopoten-tial km. This is one of those little engineered properties that scientists use to make their equations nicer and deserves a little more explanation.
Remember back to when we stated the air above us is a column that is being pulled down to the earth by gravity? So in essence, pressure is mostly due to the gravity pulling down on the air particles, but as we increase our altitude, the pull of gravity is less and less. Trying to take the chang-ing gravity into account complicates the equations we use to calculate pressure changes, so the scientists came up with an interesting work around. They made a new, non-linear height scale, the geopotential height, which changes as you get farther from the surface of the earth. The idea is that for any small change in geopotential height, the gravi- Continued on page 6
tational effect will be the same whether you are at sea level or some other altitude. The definition of the geopotential meter from the standard may help: “The unit of measure-ment of geopotential is the standard geopotential meter (m’) which represents the work done by lifting a unit mass 1 geometric meter, through a region in which the acceleration of gravity is uniformly 9.80665 m/s2”.
Using geopotential altitude in the equations has the double simplification of eliminating gravity changes and density from the equations.
So what equation do we use to relate pressure and altitude? It is called the hydrostatic equation. It has two forms depending on whether the temperature is changing in a layer. Since we are mostly concerned with the tropo-sphere, the temperature is changing as given by L above, and the hydrostatic equation is:
[2]
With the following definitions:
ln: The natural logarithm functionP: the measured pressureP
b: the pressure at the base of the layer (for us we use
ww
w.A
pogeeRock
ets.co
m
www.ApogeeRockets.com/All_rocket_kits.asp
Looking For A Fun Rocket Kit?Roam In Our Forest of Over 190 Different Types
• Unique and exotic kits from over 20 different manufacturers
• Skill Levels range from “easy” to “fiendish”
• Sizes from 1/4A motor to level-2-high-power
• We build & fly them to find out what they’re like, saving you grief
• More new ones arriv-ing all the time
• Educational bulk packs available too
� ����
����
� ����������
����
�
b
bb
b THHLT
LRMG
PP
lnln

Page 6 I S S U E 2 5 7 M A R C H 2 3 , 2 0 1 0
Continued on page 7
How Do Electronic Altimeters Work - 3Continued from page 5
the standard pressure at sea level = 1 atmosphere)G: Acceleration of gravity at sea levelM: Mean molecular weight of airR: Perfect gas constantL: Temperature gradient (defi ned above)T
b: Temperature at the base of the layer (for us we use
the standard temp. at sea level = 15°C (59°F)H: The geopotential altitudeHb: The geopotential altitude at the base of the layer (0
m in our case).If we are measuring pressure with our altimeter, then
the trick becomes to solve the equation for H which is the only unknown. I’ll save you the step by step evaluation which is beyond the scope of this article and give you the equation for altitude based on pressure (sometimes called pressure altitude).
[3]
Note also that this is the geopotential altitude, so we must also convert to the geometric altitude using the follow-ing equation:
[4]
Where Z is the geometric altitude, H is the geopotential
altitude and E is the radius of the earth (taken as 6357 km in the 1976 Standard).
For small model rocket altitudes, the difference be-tween geopotential and geometric altitude is very small. You have to get to around 4560 ft. [1390 m] before the difference reaches 1ft. [30 cm] Although for mid and high power rockets, the difference becomes larger (by the time you get to 20,000 ft. [6096 m] the difference between geo-potential and actual altitude is about 19 ft. [5.8 m]), it is still usually much smaller than the resolution of the altimeter which becomes more coarse the higher the fl ight. By the time a rocket reaches 20,000 ft. the accuracy of the altim-eter may only be +/- 500 ft.
Even though many of the values in the pressure alti-tude equation are constants, it still includes exponential and natural logarithm functions. Not many MCU’s will have these functions built in, let alone fl oating point math. If they do have these functions, they will take many CPU cycles to complete and may slow things down enough to affect the rocket’s fl ight events or miss the peak altitude.
The very simplest way to handle this is to offl oad that work onto the user. An altimeter may beep out a number that relates to the pressure reading, and then the rocketeer looks that value up in the table of altitudes provided with the altimeter. While this makes it simpler for the program-mer, the user might not want to have to keep track of a booklet of values, and if lost will not be very happy with the
Cesaroni Reload Motors
ww
w.A
pogeeRock
ets.co
m
• Standard Sizes Fit Your Existing Fleet• Easy Assembly, Minimal Clean-up• Casings & Propellant Available• Adjustable Ejection Delays• 9 Propellant Formulations
www.ApogeeRockets.com/Cesaroni_Reload_Kits.asp
Pro-XA better way to fly.™Kick Your Rockets Into High Gear
29mm Starter Pack Available
Your Source For Everything R
ocketry
LTeTH b
PP
MGLR
bb ���
��
���
��
���
��
���
��
��� ln
HEHEZ
���

Page 7I S S U E 2 5 7 M A R C H 2 3 , 2 0 1 0
How Do Electronic Altimeters Work - 3Continued from page 6
manufacturer.
The MCU may be programmed save only raw pressure transducer readings during ascent. Then, only when the MCU has determined that the rocket is descending will it perform the time consuming task of converting the trans-ducer reading into an altitude.
Another way to overcome a slow MCU is to use some-thing called a look up table. As the name says, a table is generated of pressures and altitudes and stored in the permanent memory of the altimeter. As the pressure read-ings are made, they are compared to the table to find the altitude. Obviously the table cannot be infinitely large, so another technique called interpolation is used with the look up table to find the altitude between table entries. When a pressure is read, the table is scanned to find the pressures above and below the measurement. Then the interpolated altitude can be found with simple +,-,x and ÷ operations as follows:
[5]
The designer could also use an approximation function that uses simpler math to calculate the altitude
Looking closely at these equations, you might think that they are only valid at sea level on a day when the tem-perature at that sea level location is 15°C and the pressure at sea level is 1 atmosphere. After all, the equations are based on these values. Let’s look first at how the altim-eter actually uses the equations, and then we can do an analysis on how different initial conditions affect an altitude reading.
We have to make intelligent use of the data at hand to end up with a useful altimeter. Just like a successful launch will follow a set checklist, the well-designed altimeter will
follow a well-planned procedure for sensing storing and reacting to the signals pro-vided to it.
The best way to document these procedures is in something called a flow chart. Back in school a flow chart was required with most programming assignments and was usually done late at night after the real program code was hacked out over diet sodas and Snick-ers™ bars. Time has shown me that this is truly the wrong way to proceed, and that a well thought out flow chart actu-ally should come first!
Figure 6 shows a very simplified flow chart for the steps a peak holding altimeter with drogue and main outputs might go through during a flight. The diagram shows the sequence of steps that are performed for starting up the altimeter, detecting the various stages of the flight and out-putting the maximum attained altitude. Note that each of the drawn blocks may actually be its own very complicated algorithm.
For example, detecting the launch is not as simple as checking if the current pressure reading is less than the stored initial reading. There must some consideration for noise in the sensor readings as well as the situation where the rocket is not flown and is manually lifted off the launch-er. You definitely don’t want the altimeter to fire the drogue & main in that situation. Several methods can be used for
Space Foundation certified as an excellent teaching aid. For further information, call Apogee Components at: 719-535-9335.
www.RockSim.comv9
Your Cool Rocket Designs Look So Much Better In
RockSim Version 9!
Launch It.
� �nnnn
nMeasuredn AA
PPPPA ��
��� �
�1
1
Continued on page 8
Table P
ressuren
Table P
ressuren+
1
Table Altituden
Table Altituden+1
InterpolatedAltitude
Measured
Pressure
Figure 5: Interpolation between two points in the chart.

Page 8 I S S U E 2 5 7 M A R C H 2 3 , 2 0 1 0
How Do Electronic Altimeters Work - 3Continued from page 7
this, such as waiting for a specific altitude to be reached or a certain number of decreasing pressure readings to be taken in a row before launch is detected.
The designer may also want to see a decrease in pressure over a short period of time and ignore changes that occur over lon-ger timeframes. The longer time frame changes are more likely due to chang-es in local baromet-ric pressure and not a rocket launch.
While the launch detection is the most critical of the sequences in an altimeter, each of
the other tasks will have its own set of “gotcha” elements to contend with. Serious thought and very thorough test-ing must go into any new designs to make sure that they function reliably and predictably every time the altimeter is used.
Now let’s move back to how the actual determination of altitude is accomplished and how changes in the local
weather could affect the readings.
The first thing to realize is that a barometric altimeter is always looking at the difference between two pressures, and is not trying to relate a specific pressure to an exact altitude. While the MCU may assign an altitude number to the initial reading, it will actually report to you the difference between the initial reading and the apogee reading (See Figure 7 Altitude Calculation). If this weren’t the case then, as mentioned before, the only place an altimeter would be valid would be at the altitude and temperature the device was designed for.
As an example let’s say the initial pressure measured is 98.354 kPa [14.265 psi]. According to the standard, this represents an altitude of 250 m above sea level. Then the apogee reading taken is 93.196 kPa [13.517 psi], which
ww
w.A
pogeeRock
ets.co
m
We’re Paying CashFor Great Articles for This Newsletter
Are you a writer looking for some serious pocket change? We’re pay-ing up to $350 for good how-to articles for this newsletter. If you’re interested, see our submission guidelines on the Apogee web site.
www.ApogeeRockets.com/Newsletter_Guidelines.asp
Start
Pass?No
Yes
Launch?No
Yes
Apogee?No
Yes
No
Yes
Save Apogee
Read Pressure
Initial PressureReading - Store value
Power Up Test
Fault Indication
Read Pressure
Read Pressure
Fire Main Output
Blink Max Altitude
At Main Alt?
Read SetupInformation
Set Program StatusFlags for Mach Inhibit,Droge Output, Main
Output, Etc...
Figure 6: Simplified flow chart for writing the instructions.
PressureA
ltitu
de
InitialReading
ApogeeReading
Reported Altitude
Figure 7: Altitude calculation from pressure readings.
Continued on page 9

Page 9I S S U E 2 5 7 M A R C H 2 3 , 2 0 1 0
How Do Electronic Altimeters Work - 3Continued from page 8
represents an altitude of 700 m above sea level. The re-ported flight altitude would be 700-250 or 450m [1476 ft].
Now we’ll move on to the questions that have been sitting in the back of my mind for years and the impetus for me writing this entire altimeter explanation series. What happens when you use a barometric altimeter and your launch site is not at standard temperature and pressure?
On first glance, we’re tempted to say that the changes in initial environment are cancelled out because we are subtracting the apogee pressure reading from the initial pressure reading. That would be true if the pressure vs. altitude plot was a straight line, but as you can see, it is a curve. So how do changes in initial conditions affect our measurements?
It is easiest to tackle temperature and pressure sepa-rately. First we’ll look at what happens when the tempera-ture is different from standard conditions but the pressure is at standard conditions. Luckily, we have the hydrostatic equation (equ. [3]) to help us with this analysis. By chang-ing the T
b value and plotting the equation, we can see how
a change in temperature changes the altitude reading.
Figure 8 shows a graph of pressure vs. geopotential altitude for the standard temperature of 15 °C as well as
0 °C and 30 °C. We see that the curve shifts up when the temperature is high and down when the temperature is low.
Let’s do an analysis of three flights, all of which are flown from a site with an elevation of 250m Above Sea Level (ASL) and all of which have a true apogee of exactly 750m ASL. For all three flights, the actual altitude flown
High-Power Reload Casings ww
w.A
pogeeRock
ets.co
m
• Reusable Rocket Motors Save Money• Holds Aerotech’s Reload Propellant• Sizes: 24mm To 98mm Diameter• Power Range: E Through N• Cases For Any Project• Rouse-Tech Quality• Affordable!
www.ApogeeRockets.com/Rouse-Tech_Monster_Motors.asp
Your Source For Everything R
ocketry
Continued on page 10
Pressure (atm)
Alti
tude
(m
')
Altitude vs. Pressure
Standard Temp (15 deg C)
Low Temp (0 deg C)
High Temp (30 deg C)
1.0
2200
4400
6600
8800
11000
0.9 0.8 0.7 0.6 0.5 0.4 0.3 0.2
Figure 8: Temperature variation effects of pressure.
Page 10 I S S U E 2 5 7 M A R C H 2 3 , 2 0 1 0
How Do Electronic Altimeters Work - 3Continued from page 9
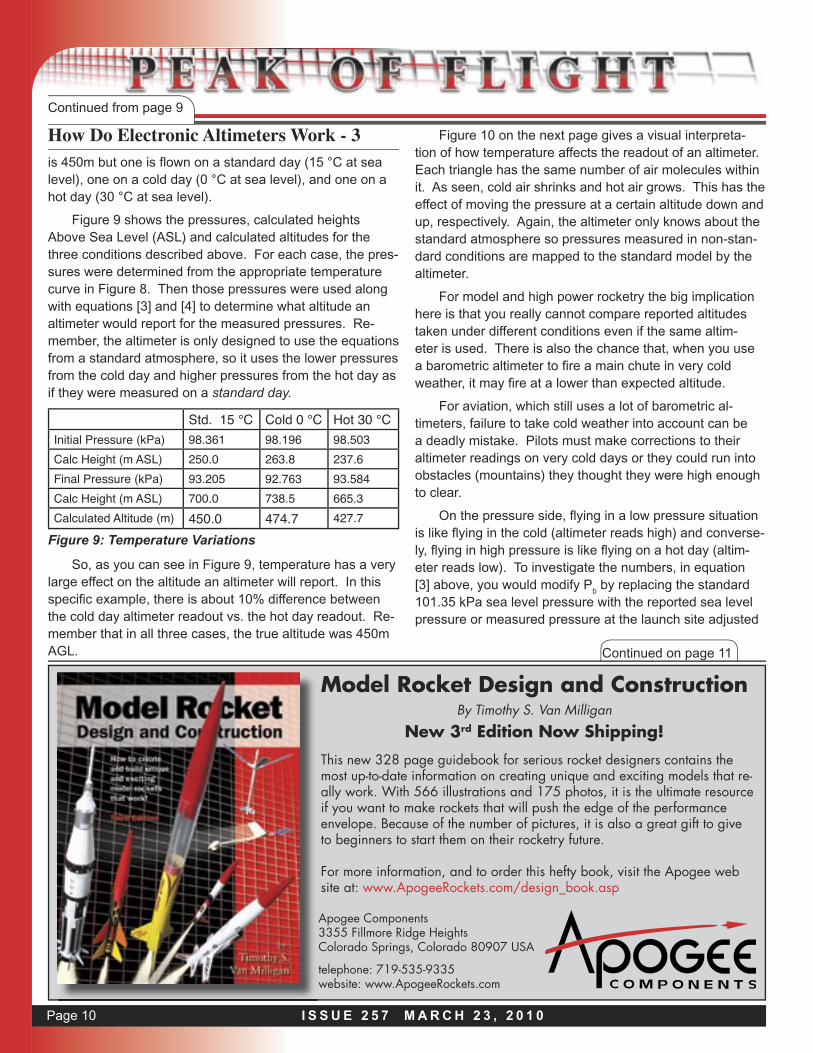
is 450m but one is fl own on a standard day (15 °C at sea level), one on a cold day (0 °C at sea level), and one on a hot day (30 °C at sea level).
Figure 9 shows the pressures, calculated heights Above Sea Level (ASL) and calculated altitudes for the three conditions described above. For each case, the pres-sures were determined from the appropriate temperature curve in Figure 8. Then those pressures were used along with equations [3] and [4] to determine what altitude an altimeter would report for the measured pressures. Re-member, the altimeter is only designed to use the equations from a standard atmosphere, so it uses the lower pressures from the cold day and higher pressures from the hot day as if they were measured on a standard day.
Std. 15 °C Cold 0 °C Hot 30 °CInitial Pressure (kPa) 98.361 98.196 98.503Calc Height (m ASL) 250.0 263.8 237.6Final Pressure (kPa) 93.205 92.763 93.584Calc Height (m ASL) 700.0 738.5 665.3Calculated Altitude (m) 450.0 474.7 427.7
Figure 10 on the next page gives a visual interpreta-tion of how temperature affects the readout of an altimeter. Each triangle has the same number of air molecules within it. As seen, cold air shrinks and hot air grows. This has the effect of moving the pressure at a certain altitude down and up, respectively. Again, the altimeter only knows about the standard atmosphere so pressures measured in non-stan-dard conditions are mapped to the standard model by the altimeter.
For model and high power rocketry the big implication here is that you really cannot compare reported altitudes taken under different conditions even if the same altim-eter is used. There is also the chance that, when you use a barometric altimeter to fi re a main chute in very cold weather, it may fi re at a lower than expected altitude.
For aviation, which still uses a lot of barometric al-timeters, failure to take cold weather into account can be a deadly mistake. Pilots must make corrections to their altimeter readings on very cold days or they could run into obstacles (mountains) they thought they were high enough to clear.
On the pressure side, fl ying in a low pressure situation is like fl ying in the cold (altimeter reads high) and converse-ly, fl ying in high pressure is like fl ying on a hot day (altim-eter reads low). To investigate the numbers, in equation [3] above, you would modify P
b by replacing the standard
101.35 kPa sea level pressure with the reported sea level pressure or measured pressure at the launch site adjusted
Continued on page 11
Model Rocket Design and ConstructionBy Timothy S. Van Milligan
New 3rd Edition Now Shipping!
Apogee Components3355 Fillmore Ridge HeightsColorado Springs, Colorado 80907 USA
telephone: 719-535-9335website: www.ApogeeRockets.com
This new 328 page guidebook for serious rocket designers contains the most up-to-date information on creating unique and exciting models that re-ally work. With 566 illustrations and 175 photos, it is the ultimate resource if you want to make rockets that will push the edge of the performance envelope. Because of the number of pictures, it is also a great gift to give to beginners to start them on their rocketry future.
For more information, and to order this hefty book, visit the Apogee web site at: www.ApogeeRockets.com/design_book.asp
Figure 9: Temperature Variations
So, as you can see in Figure 9, temperature has a very large effect on the altitude an altimeter will report. In this specifi c example, there is about 10% difference between the cold day altimeter readout vs. the hot day readout. Re-member that in all three cases, the true altitude was 450m AGL.

Page 11I S S U E 2 5 7 M A R C H 2 3 , 2 0 1 0
How Do Electronic Altimeters Work - 3Continued from page 10
to sea level.
Although I’m not aware of any altimeters that take local conditions into account, it would be possible through jump-er settings or perhaps a computer interface to enter the local temperature and elevation so that the MCU could cor-rect its calculations for local conditions. There is also the possibility of using a temperature sensor with an additional analog input at the MCU, but the local elevation would still need to be entered to make the proper corrections.
Conclusion
So with even the air we fly in stacked against us, should we give up on barometric altimeters? To the con-trary, despite all the possible sources of error and complex-ity of designing and creating an altimeter, they are useful and valuable tools for model and high power rocketeers. Even if the reported altitude is not exactly correct, these devices will still accurately detect apogee to fire a drogue chute and will be able to fire a main on the way down. Also, the temperature swing in the example represents the extremes of flying conditions, so generally errors from air conditions will not be as much as the 10% in the example.
This third and last installment brings us to the end of the road in describing and analyzing barometric altimeters,
what they are made of, how they work their magic, and what limitations they are subject to. I have tried to make as much of the science and math accessible to as many read-ers as possible while remaining true to the subject.
If you have any comments or questions regard-ing this series, please feel free to drop me a line at [email protected].
References
The Hydrostatic Equations Ralph L. Charmichael, January 23, 2003
http://www.grc.nasa.gov/WWW/K-12/airplane/atmos.html
http://ntrs.nasa.gov/archive/nasa/casi.ntrs.nasa.gov/19770009539_1977009539.pdf
http://www.tripoli.org/records/single.shtml
http://www.bluecoat.org/reports/Long_98_Cold.pdf
A Study Of Barometric Altimeter Errors In High Latitude Regions by Young Yee & Eric Yee
About The Author:
Norm Diedzic Jr. is an avid rocket flyer and a mem-ber of NIRA (Northern Illinois Rocketry Association; NAR Section 117). He has written several technical articles for
their LAC winning newsletter, The Leading Edge, as well as a treatese on hemispherical parachute construction that appears in the book Model Rocket Design and Construc-tion.
You may also recognize Norm as the inventor of a method of restraining small rocket motors in minimum diameter models, called the Dziedzic cut-out method (see Model Rocket Design and Construction, 3rd Edition, page 100)
He has an M.S. in Mechan-ical Engineering from Univer-sity of Illinois at Chicago, and is currently the Engineering Manager at CMA/Flodyne/Hy-dradyne, an industrial distribu-tion company serving Northern
Cold DayAir Column
ActualAltitude
Standard DayAir Column
Hot DayAir Column
Hot Pressure as seenon Standard Day
Cold Pressure as seenon Standard Day
Same Number ofMolecules
Same Number ofMolecules
Figure 10: Temperature effects on altimeter readings.