Housing Rough Sleeping Statistics Autumn 2016, England · This publication provides information on...
16
Introduction 2 Rough Sleeping 3 Demographics 6 CHAIN Data 7 Accompanying Tables 9 Definitions 9 Technical notes 10 Enquiries 15 Housing Statistical Release 25 January 2017 Responsible Statistician: Mike Young Statistical enquiries: Office hours: 0303 444 4387 roughsleepingstatistics@comm unities.gsi.gov.uk Media Enquiries: 0303 444 1201 [email protected] v.uk Date of next publication: Winter 2017/18 Rough Sleeping Statistics Autumn 2016, England This publication provides information on the single night snapshot of rough sleeping that is taken annually in England using street counts and intelligence driven estimates. • The autumn 2016 total number of rough sleepers counted and estimated is 4,134. • This is up 565 (16%) from the autumn 2015 total of 3,569. • The number of rough sleepers has increased by 3% in Lon- don and 21% in the rest of England since autumn 2015. • London had 964 rough sleepers in autumn 2016, which is 23% of the England total. This is down from 26% of the Eng- land total in autumn 2015. 0 500 1,000 1,500 2,000 2,500 3,000 3,500 4,000 4,500 2010 2011 2012 2013 2014 2015 2016 London Rest of England England total
Transcript of Housing Rough Sleeping Statistics Autumn 2016, England · This publication provides information on...

Introduction 2 Rough Sleeping 3 Demographics 6 CHAIN Data 7 Accompanying Tables 9 Definitions 9 Technical notes 10 Enquiries 15
Housing Statistical Release 25 January 2017
Responsible Statistician: Mike Young Statistical enquiries: Office hours: 0303 444 4387 [email protected] Media Enquiries: 0303 444 1201 [email protected] Date of next publication: Winter 2017/18
Rough Sleeping Statistics Autumn 2016, England
This publication provides information on the single night snapshot of rough sleeping that is taken annually in England using street counts and intelligence driven estimates.
• The autumn 2016 total number of rough sleepers counted and
estimated is 4,134. • This is up 565 (16%) from the autumn 2015 total of 3,569.
• The number of rough sleepers has increased by 3% in Lon-
don and 21% in the rest of England since autumn 2015.
• London had 964 rough sleepers in autumn 2016, which is 23% of the England total. This is down from 26% of the Eng-land total in autumn 2015.
0500
1,0001,5002,0002,5003,0003,5004,0004,500
2010 2011 2012 2013 2014 2015 2016
London Rest of England England total

2 Rough Sleeping Statistical Release
Introduction This is the seventh annual statistical release presenting rough sleeping counts and estimates following the introduction of revised guidance in September 2010 on evaluating the extent of rough sleeping. Rough sleeping counts and estimates are single night snapshots of the number of people sleeping rough in local authority areas. Local authorities decide whether to carry out a count or an estimate. They are encouraged to gain intelligence for street counts and estimates from local agencies such as outreach workers, the police, the voluntary sector and faith groups who have contact with rough sleepers on the street. This year, for the first time, this statistical release includes some basic demographic information about those found sleeping rough, covering gender, age and nationality. The release provides national summary information on rough sleeping counts and estimates carried out by local authorities between 1 October and 30 November 2016. Accompanying tables, showing figures for each local authority from 2010 to 2016, are available at: https://www.gov.uk/government/statistics/rough-sleeping-in-england-autumn-2016 The rough sleeping figures are now established as a consistent time series and provide a reliable way of assessing changes over the years. Their robustness is enhanced by the provision of detailed guidance to authorities on how to conduct counts and estimates, by the involvement of partner agencies, and by the work of Homeless Link to verify all local counts and validate local estimates and demographic information. Nevertheless, accurately counting or estimating the number of rough sleepers within the area of a local authority is inherently difficult, and the figures are subject to some limitations which are explained in the Data Quality section on page 10.
3 Rough Sleeping Statistical Release
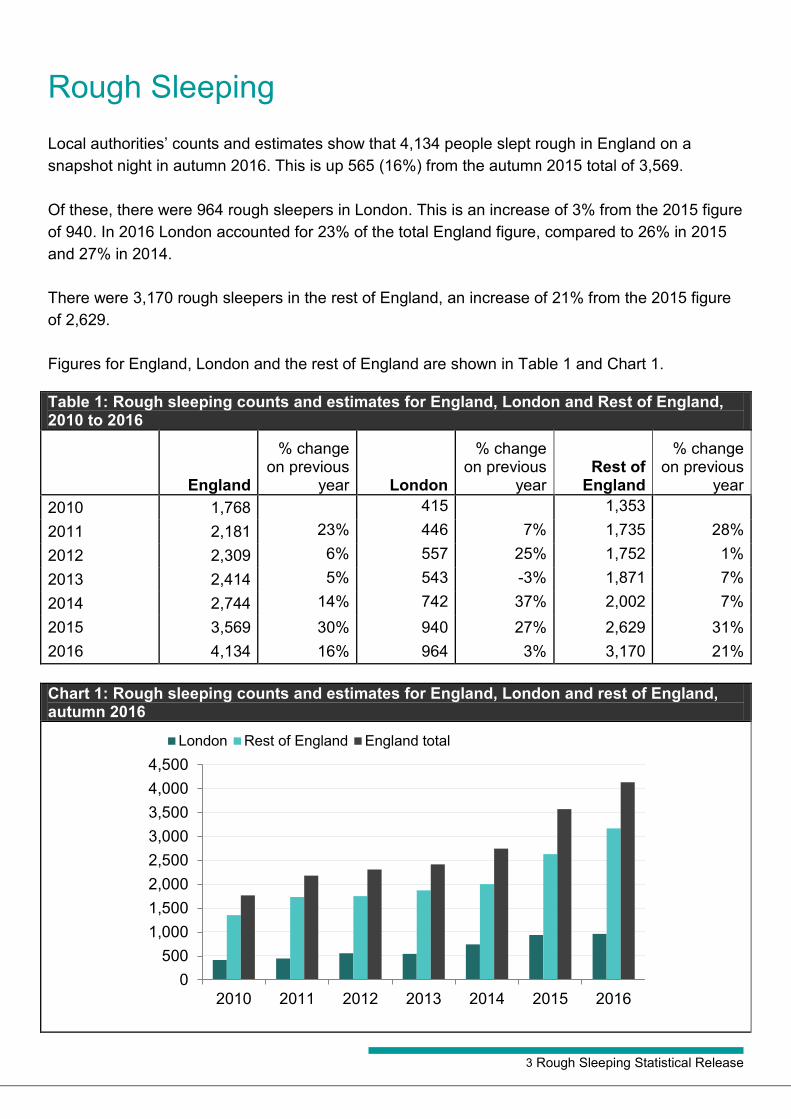
Rough Sleeping Local authorities’ counts and estimates show that 4,134 people slept rough in England on a snapshot night in autumn 2016. This is up 565 (16%) from the autumn 2015 total of 3,569. Of these, there were 964 rough sleepers in London. This is an increase of 3% from the 2015 figure of 940. In 2016 London accounted for 23% of the total England figure, compared to 26% in 2015 and 27% in 2014. There were 3,170 rough sleepers in the rest of England, an increase of 21% from the 2015 figure of 2,629. Figures for England, London and the rest of England are shown in Table 1 and Chart 1.
Table 1: Rough sleeping counts and estimates for England, London and Rest of England, 2010 to 2016
England
% change on previous
year London
% change on previous
year Rest of
England
% change on previous
year 2010 1,768 415 1,353 2011 2,181 23% 446 7% 1,735 28% 2012 2,309 6% 557 25% 1,752 1% 2013 2,414 5% 543 -3% 1,871 7% 2014 2,744 14% 742 37% 2,002 7% 2015 3,569 30% 940 27% 2,629 31% 2016 4,134 16% 964 3% 3,170 21% Chart 1: Rough sleeping counts and estimates for England, London and rest of England, autumn 2016
0500
1,0001,5002,0002,5003,0003,5004,0004,500
2010 2011 2012 2013 2014 2015 2016
London Rest of England England total

4 Rough Sleeping Statistical Release
The ten local authorities who had the largest number of rough sleepers in autumn 2016 are shown in Table 2 below.
Table 2: Top ten highest local authority rough sleeping counts and estimates, England, autumn 2016 Local Authority Total Count or Estimate Westminster 260 Brighton and Hove 144 Cornwall 99 Manchester 78 Luton 76 Bristol 74 Croydon 68 Redbridge 60 Bedford 59 Birmingham 55
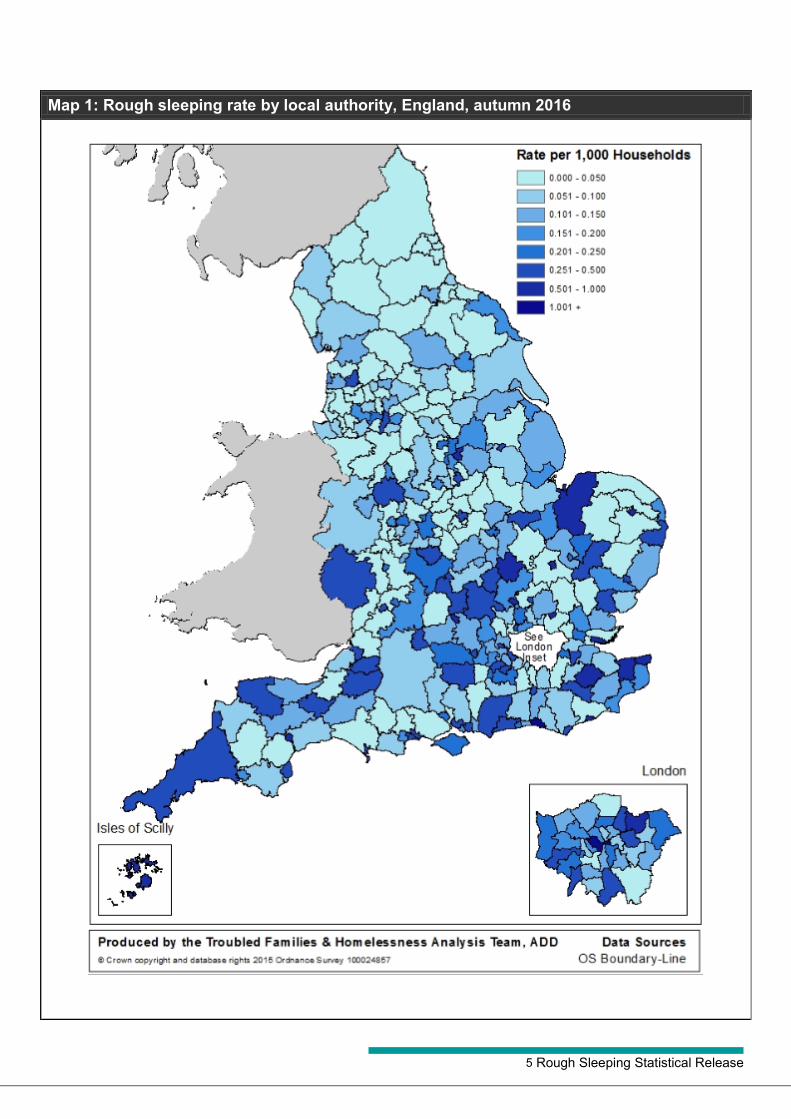
The rate of rough sleeping per 1,000 households is 0.18 for England, 0.27 for London and 0.16 for the rest of England. This compares to 0.16 for England, 0.27 for London and 0.14 for the rest of England in 2015. The rates per 1,000 households by local authority are shown in Map 1 on the next page.
Counts and Estimates Local authorities can choose whether to conduct a street count or make an estimation based on intelligence gathered from local services. In 2016 all 326 local authorities in England submitted a rough sleeping figure. Of these 47 authorities (14%) conducted a count and 279 (86%) provided an estimate. This compares to 44 and 282 respectively in 2015, and 49 and 277 respectively in 2014. The 47 authorities conducting a count reported 1,137 rough sleepers (28% of the total) while those compiling an estimate reported 2,997 rough sleepers (72% of the total). Rough sleeping figures for all local authorities since 2010, showing whether they conducted a count or an estimate, are given in accompanying table 1: Street counts and estimates of rough sleeping, by local authority https://www.gov.uk/government/publications/rough-sleeping-in-england-autumn-2016
5 Rough Sleeping Statistical Release
Map 1: Rough sleeping rate by local authority, England, autumn 2016
6 Rough Sleeping Statistical Release
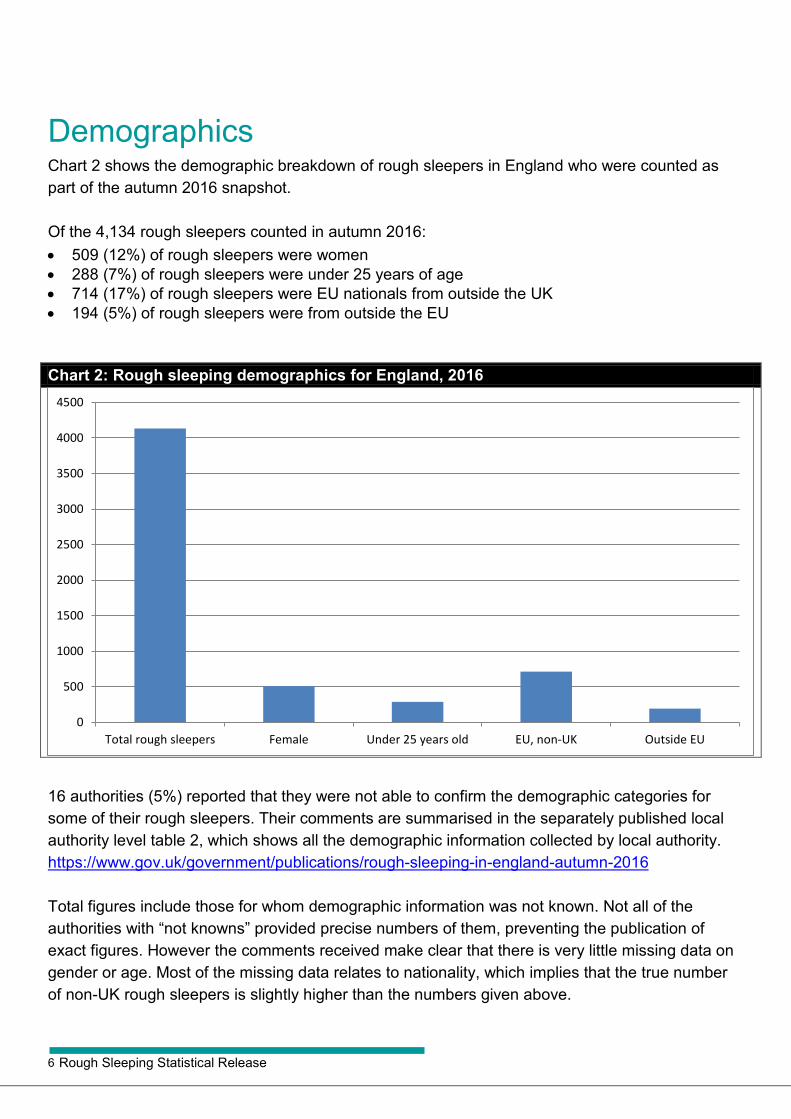
Demographics Chart 2 shows the demographic breakdown of rough sleepers in England who were counted as part of the autumn 2016 snapshot. Of the 4,134 rough sleepers counted in autumn 2016: • 509 (12%) of rough sleepers were women • 288 (7%) of rough sleepers were under 25 years of age • 714 (17%) of rough sleepers were EU nationals from outside the UK • 194 (5%) of rough sleepers were from outside the EU Chart 2: Rough sleeping demographics for England, 2016
16 authorities (5%) reported that they were not able to confirm the demographic categories for some of their rough sleepers. Their comments are summarised in the separately published local authority level table 2, which shows all the demographic information collected by local authority. https://www.gov.uk/government/publications/rough-sleeping-in-england-autumn-2016 Total figures include those for whom demographic information was not known. Not all of the authorities with “not knowns” provided precise numbers of them, preventing the publication of exact figures. However the comments received make clear that there is very little missing data on gender or age. Most of the missing data relates to nationality, which implies that the true number of non-UK rough sleepers is slightly higher than the numbers given above.
0
500
1000
1500
2000
2500
3000
3500
4000
4500
Total rough sleepers Female Under 25 years old EU, non-UK Outside EU
7 Rough Sleeping Statistical Release
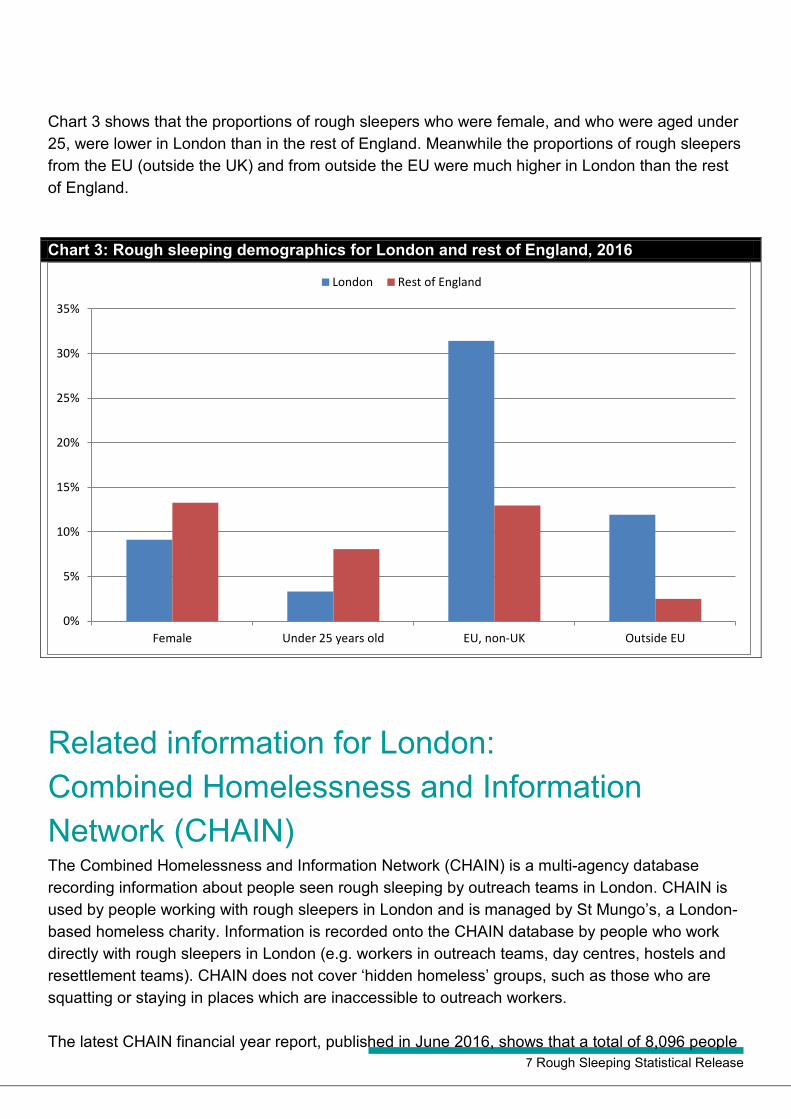
Chart 3 shows that the proportions of rough sleepers who were female, and who were aged under 25, were lower in London than in the rest of England. Meanwhile the proportions of rough sleepers from the EU (outside the UK) and from outside the EU were much higher in London than the rest of England.
Chart 3: Rough sleeping demographics for London and rest of England, 2016
Related information for London: Combined Homelessness and Information Network (CHAIN) The Combined Homelessness and Information Network (CHAIN) is a multi-agency database recording information about people seen rough sleeping by outreach teams in London. CHAIN is used by people working with rough sleepers in London and is managed by St Mungo’s, a London-based homeless charity. Information is recorded onto the CHAIN database by people who work directly with rough sleepers in London (e.g. workers in outreach teams, day centres, hostels and resettlement teams). CHAIN does not cover ‘hidden homeless’ groups, such as those who are squatting or staying in places which are inaccessible to outreach workers. The latest CHAIN financial year report, published in June 2016, shows that a total of 8,096 people
0%
5%
10%
15%
20%
25%
30%
35%
Female Under 25 years old EU, non-UK Outside EU
London Rest of England

8 Rough Sleeping Statistical Release
were seen rough sleeping by outreach workers in London during 2015-16, an increase of 7% compared to 2014-15. The CHAIN data is not comparable to the single night snapshot counts and estimates presented by this release, as it is a count of all individuals who were seen sleeping rough on the streets of London on at least one night during the year between 1 April 2015 and 31 March 2016. In addition it relates to an earlier time period than the autumn 2016 figures in this release. The CHAIN figure shows 8,096 rough sleepers during the whole year 2015-16, whereas the London single night snapshot gives a figure of 940 for autumn 2015. The CHAIN database records identifying and demographic information about rough sleepers. Their 2015-16 report shows that:
• 65% of rough sleepers were new, meaning they were seen for the first time in 2015-16, • 23% of 2015-16 rough sleepers had also been seen in 2014-15 and • 12% were returning after not having been seen during 2014-15.
Of the total recorded rough sleepers for 2015-16, 55% were seen rough sleeping only once during the year, while 5% were seen rough sleeping more than ten times during the year. Of the new rough sleepers, 64% were seen only once in the year. The proportion of all recorded rough sleepers who were female was 15%, while 10% were aged 25 or under and 11% were aged over 55. Of the rough sleepers for whom nationality information was available, 41% were recorded as having United Kingdom as their nationality, while 37% were from Central and Eastern European countries that joined the EU in 2004 or 2007. A more detailed breakdown by origin is in Table 3 below.
Table 3: CHAIN data, Nationality of rough sleepers in London, 2015-16
Nationality (or continent) Number % of known
United Kingdom 3,271 41.2 CEE countries that joined the EU in 2004 or 2007(a) Of which: Romania
2,924
1,546
36.8
19.5 Poland 695 8.7 Lithuania 220 2.8 Other EEA countries 745 9.4 Other Europe 83 1.0 Africa 434 5.5 Asia 386 4.9 Americas 92 1.2 Australasia 11 0.1 Total non-UK 4,675 58.8 Total for which information exists 7,946 100.0 Not known 150
9 Rough Sleeping Statistical Release
TOTAL 8,096 (a) Romania, Bulgaria, Czech Republic, Estonia, Latvia, Lithuania, Slovenia, Slovakia, Poland and Hungary The proportion of non-UK nationals recorded on CHAIN is higher than that recorded in the DCLG counts and estimates. This is partly due to some of the information on nationality not being collected by local authorities during the annual street counts and estimates, which means the true proportion of non-UK rough sleepers in the DCLG exercise is likely to be slightly higher than shown. However most of the difference is likely to be due to the different methodologies employed. Of those rough sleepers who had a support needs assessment recorded, 43% had alcohol support needs, 31% drug support needs and 46% mental health support needs, with 13% having all three needs and 26% having none of these three needs. No support needs assessment was recorded for 32% of rough sleepers. More information about the CHAIN data collection is available at: http://www.mungos.org/chain Source for the statistics in this section: CHAIN Annual Report, April 2015 – March 2016: https://files.datapress.com/london/dataset/chain-reports/2016-06-29T11:14:50/Greater%20London%20full%202015-16.pdf
Accompanying Tables Two accompanying tables are available to download alongside this release. This is:
Table 1 Total of rough sleeping counts and estimates, by local authority, autumn 2010 to autumn 2016
Table 2 Demographic information on rough sleeping, autumn 2016 These tables can be accessed at https://www.gov.uk/government/publications/rough-sleeping-in-england-autumn-2016 Related DCLG statistical releases are available at: https://www.gov.uk/government/collections/homelessness-statistics
Definitions Rough Sleepers: are defined as follows for the purposes of rough sleeping counts and estimates: People sleeping, about to bed down (sitting on/in or standing next to their bedding) or actually bedded down in the open air (such as on the streets, in tents, doorways, parks, bus shelters or encampments). People in buildings or other places not designed for habitation (such as stairwells, barns, sheds, car parks, cars, derelict boats, stations, or “bashes” which are makeshift shelters, often comprised of cardboard boxes).
10 Rough Sleeping Statistical Release
The definition does not include people in hostels or shelters, people in campsites or other sites used for recreational purposes or organised protest, squatters or travellers. Bedded down: is taken to mean either lying down or sleeping. About to bed down includes those who are sitting in/on or near a sleeping bag or other bedding.
Technical notes Data collection Since 1998, rough sleeping has been measured by street counts in areas with a known or suspected rough sleeping problem. Local authorities had been asked to conduct an annual count if they estimated there were more than ten rough sleepers in the area. In June 2010, to supplement the counts, local authorities that had not conducted a street count were asked to provide an estimate of the number of rough sleepers on a given night. Results of the June 2010 estimates and a time series of rough sleeping counts since 1998 are published here: https://www.gov.uk/government/publications/rough-sleeping-in-england-total-street-count-and-estimates-2010 Following the publication of these figures, a public consultation on evaluating the extent of rough sleeping was run over the summer 2010, and new guidance for local authorities was published in September 2010 explaining how to carry out rough sleeping counts and estimates. The guidance and form can be found at: https://www.gov.uk/government/publications/evaluating-the-extent-of-rough-sleeping--2 The changes that were made to the methodology and the definition of rough sleepers mean that figures produced in line with the September 2010 guidance are not directly comparable with previous statistics. The impact of these methodological changes cannot be separated from changes in the level of rough sleeping between autumn 2010 and earlier time periods. A technical note setting out and explaining the differences between the autumn 2010 rough sleeping statistics and previously published figures was published alongside the autumn 2010 release on the DCLG website: https://www.gov.uk/government/uploads/system/uploads/attachment_data/file/7379/1846366.pdf Rates per 1,000 households have been calculated using the 2014-based household projections for 2016 produced by the Department for Communities and Local Government. These are consistent with the projections published on 12 July 2016 at the following link: https://www.gov.uk/government/statistical-data-sets/live-tables-on-household-projections
Data quality All rough sleeping returns submitted by local authorities are independently verified or validated by Homeless Link to ensure they are robust. Homeless Link are the national membership charity for organisations working directly people who become homeless in England: http://www.homeless.org.uk/about-us

11 Rough Sleeping Statistical Release
Homeless Link verified all street counts, liaising with the Count Coordinator to check that the guidance has been followed in the planning of the count. They observed the process during the night of the count, joining one of the count teams and reviewing the count forms from other teams as they are submitted. The verifier discussed the single figure and demographics with the Coordinator, and completed a verification form that is sent to Homeless Link for review. Verifiers are trained by Homeless Link and are not employed by the Local Authority or its commissioned services. Homeless Link also conducted detailed verification of 10% of the rough sleeping estimates submitted. They chose these authorities by risk assessing whether they would need direct support with planning or verification of their estimate. High risk authorities could be those with high numbers, issues with local partners disputing figures, concerns about the correct methodology being used in previous years, or requests for additional support. Verifiers attend estimation meetings in person. Those estimates not selected for detailed verification underwent a validation process by telephone. A Homeless Link member of staff or associate asked a series of questions of the Coordinator about how they have conducted their estimate in order to complete the validation form. This includes checking that the guidance has been followed, for example that relevant partners were involved, that a single typical night was used, and that there is an understanding of the rough sleeping definition. Homeless Link provide additional guidance to local authorities on conducting counts and estimates: http://www.homeless.org.uk/our-work/resources/counts-and-estimates-evaluating-extent-of-rough-sleeping The Department chases late returns and conducts further validation and sense checks to ensure overall response is as complete and accurate as possible. Local authorities providing estimates are asked to provide details of agencies that have been consulted in deriving the estimate. 98.6% of authorities that provided estimates reported that they had consulted with at least one type of local agency. Of the 275 authorities that consulted in this way, the numbers consulting with particular types of agency were, in descending order:
Police 256 Voluntary sector 255 Outreach workers 231 Faith groups 203 Substance misuse 181 Mental health agencies 157 Drugs and alcohol treatment teams 139 Local residents/businesses 104
12 Rough Sleeping Statistical Release
These counts exclude authorities who conducted a street count but also consulted an agency. There are many practical difficulties in counting the number of rough sleepers within the area of a local authority. It is not possible to cover the entire area of a local authority in a single evening, so counts will be targeted to areas according to local intelligence. Rough sleepers may bed down at different times meaning that some may be missed. Some places of rough sleeping may be difficult or unsafe for those conducting the count to access. For these reasons, the figures in this release are subject to some uncertainty. In addition to the difficulties in capturing an accurate number, various factors can affect the numbers of rough sleepers on any given night, such as the availability of alternatives such as night shelters, and the weather. Homeless Link collected a limited demographic breakdown of rough sleepers during the 2015 count with the agreement of DCLG. The lead statistician later reviewed this exercise with Home-less Link. Burden on local authorities was felt to be low and the information submitted to be of high quality, as much of the information was already known through the continuous work they do with rough sleepers. In light of this, it was decided to collect this data again in 2016 for the purposes of publication. The Department’s statistical quality guidelines are published here: https://www.gov.uk/government/publications/statistical-notice-dclg-quality-guidelines The UK Statistics Authority published an assessment report covering the Department’s homelessness and rough sleeping statistics in December 2015: https://www.statisticsauthority.gov.uk/publication/statistics-on-homelessness-and-rough-sleeping-in-england-department-for-communities-and-local-government/ The Department’s Statistics Head of Profession wrote to The Authority’s Director General for Regulation responding to the report: https://www.statisticsauthority.gov.uk/correspondence/statistics-on-homelessness-and-rough-sleeping-in-england/
Revisions policy This policy has been developed in accordance with the UK Statistics Authority Code of Practice for Official statistics and the Department for Communities and Local Government Revisions Policy (found at https://www.gov.uk/government/publications/statistical-notice-dclg-revisions-policy). There are two types of revisions that the policy covers: Non-Scheduled Revisions
Where a substantial error has occurred as a result of the compilation, imputation or dissemination process, the statistical release, live tables and other accompanying releases will be updated with a correction notice as soon as is practical.

13 Rough Sleeping Statistical Release
Where a local authority notifies DCLG of an error in the information they have submitted after publication of the release a decision on whether to revise will be made based upon the impact of any change and the effect it has on the interpretation of the data.
Scheduled Revisions
There are no scheduled revisions for this release.
Uses of the data The data in this statistical release provide evidence on the prevalence of and trends in rough sleeping in England. They are used by ministers and officials in the Department for Communities and Local Government in the formulation and monitoring of policy, the allocation of resources, performance monitoring and to support bids for funding from the Treasury. The data are also used to ensure democratic accountability in answers to Parliamentary Questions, ministerial correspondence, Freedom of Information Act cases and queries from the public.
Local housing authorities are both providers and users of the statistics and will use the data to track progress, benchmark against other authorities and plan and commission services to prevent and tackle rough sleeping. The voluntary sector also use the statistics to monitor and evaluate housing policy and for campaigning and fundraising purposes.
User engagement Users are encouraged to provide feedback on how these statistics are used and how well they meet user needs. Comments on any issues relating to this statistical release are welcomed and encouraged. Responses should be addressed to the "Public enquiries" contact given in the "Enquiries" section below. A website has been created to keep users up to date with all the latest developments in DCLG’s homelessness statistics. It contains details of user events and information about planned developments such as the redesign of the P1E form. Users can also feedback their comments through this forum: https://gss.civilservice.gov.uk/statistics/working-with-users/dclg-homelessness-statistics-user-forum/ The Department’s engagement strategy to meet the needs of statistics users is published here: https://www.gov.uk/government/publications/engagement-strategy-to-meet-the-needs-of-statistics-users The Department’s Statistics Plan for 2011/12 is available at: https://www.gov.uk/government/consultations/dclg-draft-statistics-plan-for-2011-to-2012) The Statistics Plan was available for user consultation from 13 July to 3 December 2011 and the final version of the plan was published on 7 March 2012.
https://www.gov.uk/government/publications/engagement-strategy-to-meet-the-needs-of-statistics-users
14 Rough Sleeping Statistical Release
Notes The scope of this data collection and release is limited to a single night snapshot of rough sleeping in England. This release does not contain data on other forms of homelessness, for example local authorities’ actions under homelessness legislation. The Department publishes quarterly statistics on statutory homelessness and homelessness prevention and relief here: https://www.gov.uk/government/organisations/department-for-communities-and-local-government/series/homelessness-statistics For both rough sleeping and statutory homelessness releases, all decisions and judgements regarding what data to collect, how and when it should be published, and the content and presentation of published statistics, are taken by the lead statistician reporting to the DCLG Head of Profession for statistics. For both releases one policy colleague is involved in producing and quality assuring the statistics, and they have a full understanding of the requirements of the National Statistics Code of Practice as regards pre-release access to statistics. Details of officials who receive pre-release access to the Department’s rough sleeping statistical release up to 24 hours before release can be found at: https://www.gov.uk/government/organisations/department-for-communities-and-local-government/about/statistics#pre-release-access-to-official-statistics It is expected that autumn 2017 Rough Sleeping Statistics will be published in early 2018. The date will be pre-announced on the UK Statistics Authority publication release calendar. This statistical release does not include any regional totals except for London following the consultation on the publication of regional statistics. Further details are given in the Written Ministerial Statement of 18 September 2012, which is available at: https://www.gov.uk/government/speeches/statistics-for-local-enterprise-partnerships-and-upper-tier-local-authorities. Figures are given for London because they relate to the area covered by the Greater London Authority.
Devolved administration statistics The devolved administrations publish their own statistics on homelessness and details of their releases which contain information on rough sleeping are provided below. The Scottish Government publishes figures on the number of households applying for assistance under homelessness legislation who say they have slept rough the previous night or have reported their housing situation as ‘long term roofless’. The latest annual figures are published here: http://www.gov.scot/Resource/0050/00502030.pdf In 2007 and 2008, local authorities in Wales undertook rough sleeping street counts to gauge the extent of rough sleeping in Wales. The Welsh Government has introduced an annual rough sleeping count, with the first count taking place in November 2015. These are currently published as experimental statistics. Results can be

15 Rough Sleeping Statistical Release
found at the following link: http://wales.gov.uk/statistics-and-research/national-rough-sleeping-count/?lang=en
Enquiries Media enquiries: office hours: 0303 444 1157
0303 444 1159
out of hours: 0303 444 1201 Email: [email protected] Public enquiries and Responsible Statistician: Mike Young
Email: [email protected] Information on Official Statistics is available via the UK Statistics Authority website: https://www.statisticsauthority.gov.uk/ Information about statistics at DCLG is available via the Department’s website: www.gov.uk/government/organisations/department-for-communities-and-local-government/about/statistics

16 Rough Sleeping Statistical Release
© Crown copyright, 2017 Copyright in the typographical arrangement rests with the Crown. You may re-use this information (not including logos) free of charge in any format or medium, under the terms of the Open Government Licence. To view this licence, www.nationalarchives.gov.uk/doc/open-government-licence/ or write to the Information Policy Team, The National Archives, Kew, London TW9 4DU, or email: [email protected]. This document/publication is also available on our website at www.gov.uk/dclg If you have any enquiries regarding this document/publication, email [email protected] or write to us at: Department for Communities and Local Government Fry Building 2 Marsham Street London SW1P 4DF Telephone: 030 3444 0000
January 2017
For all our latest news and updates follow us on Twitter: https://twitter.com/CommunitiesUK ISBN: 978-1-4098-4987-2