Hood River Watershed Assessment Report stores/data libraries/files/Watershed Councils...The Hood...
141
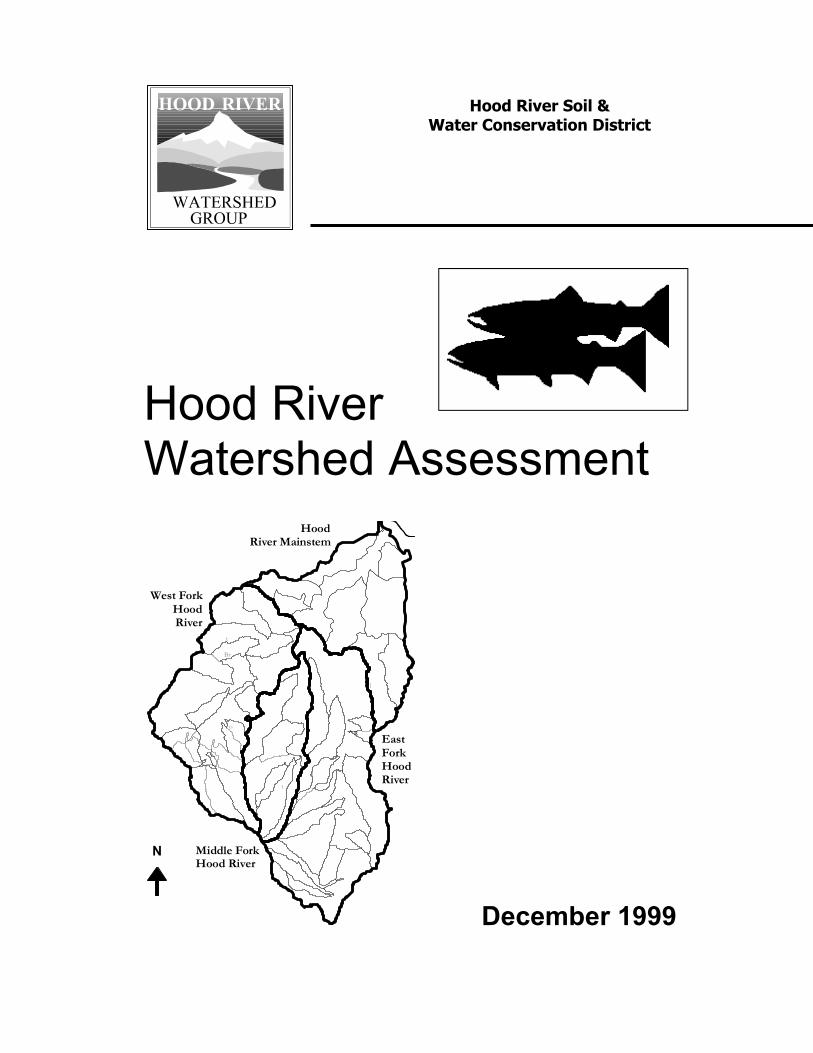
Hood River Soil & Water Conservation District Hood River Watershed Assessment t Br o t l R l East Fork Hood River Middle Fork Hood River West Fork Hood River Hood River Mainstem N December 1999
Transcript of Hood River Watershed Assessment Report stores/data libraries/files/Watershed Councils...The Hood...
Hood River Soil & Water Conservation District
Hood River Watershed Assessment
t
Br
o
t
l
R
l
EastForkHoodRiver
Middle ForkHood River
West ForkHoodRiver
HoodRiver Mainstem
N
December 1999

This page blank intentionally
Acknowledgements
The Hood River Watershed Assessment is a project of the Hood River Watershed Group and the Hood River Soil and Water Conservation District, whose members are dedicated to working together locally to improve the sustainability and health of natural resources in the Hood River system. Financial assistance was provided from the Oregon Watershed Enhancement Board, Confederated Tribes of the Warm Springs Reservation and For the Sake of the Salmon Foundation. Invaluable technical assistance was received from the U.S. Forest Service Hood River Ranger District, Oregon Department of Environmental Quality, Confederated Tribes of the Warm Springs Reservation, Natural Resources Conservation Service, the Oregon Fish and Wildlife Department and the Oregon Watershed Enhancement Board.
Prepared by
Holly Coccoli, Hood River Watershed Group
Contributors
Bonnie Lamb, Oregon Department of Environmental Quality Karen Hale, U.S. Forest Service
Ed Salminen, Watershed Professionals Network Monica Burke
John Wells, U.S. Forest Service Holly Coccoli, Hood River Watershed Group
Reviewers
Dennis Carlson, Hood River County
Brian Nakamura, Hood River Grower Shipper Association Jim Newton, Steve Pribyl and Rod French, Oregon Department of Fish & Wildlife
Mick Jennings and Mike Lambert, Confederated Tribes of the Warm Springs Reservation Larry Toll, Oregon Water Resources Department
Rick Ragan, U.S. Forest Service Hood River Ranger District John Buckley, East Fork Irrigation District
Bill Stanley and Brian Conners, Middle Fork Irrigation District Jerry Bryan, Farmers Irrigation District
Steve Hansen, Longview Fibre Company Randy Johnston, City of Hood River
Linda Prendergrast, PacifiCorp Larry Hoffman, Oregon Department of Forestry
John Bartlett, Hood River Soil & Water Conservation District Chuck Gehling, Hood River Soil & Water Conservation District Mike Udelius, Hood River Soil & Water Conservation District Anne Saxby, Hood River Soil & Water Conservation District
TABLE OF CONTENTS 1. INTRODUCTION...............................................................................................1
PURPOSE AND NEED FOR THE WATERSHED ASSESSMENT ............................................................ 1 WATERSHED DESCRIPTION .......................................................................................................... 5
2. HISTORICAL CONDITIONS ........................................................................12
WATERSHED CONDITIONS AT THE TIME OF SETTLEMENT .......................................................... 12 HISTORICAL CONDITIONS OUTLINE ........................................................................................... 17
3. CHANNEL HABITAT TYPES IN THE HOOD RIVER WATERSHED..19
INTRODUCTION .......................................................................................................................... 19 METHODS AND RESULTS............................................................................................................ 23
4. FISH POPULATION STATUS AND DISTRIBUTION ..............................29
HABITAT CONDITIONS SUMMARY.............................................................................................. 41 FISH PASSAGE PROBLEMS.......................................................................................................... 45
5. CHANNEL MODIFICATIONS......................................................................52
HISTORIC AND EXISTING CHANNEL MODIFICATIONS................................................................. 52
6. HYDROLOGY AND WATER USE ................................................................56
CLIMATE AND STREAMFLOW ..................................................................................................... 56 WATER RIGHTS AND WATER USE.............................................................................................. 65
7. WATER QUALITY..........................................................................................74
SUMMARY OF AVAILABLE WATER QUALITY DATA AND CONCERNS ......................................... 76
8. RIPARIAN AND WETLANDS CONDITIONS............................................93
HOOD RIVER MAINSTEM WATERSHED RIPARIAN ASSESSMENT ................................................ 93 WETLANDS ASSESSMENT......................................................................................................... 100
9. SEDIMENT SOURCES ..................................................................................105
NATURAL SEDIMENT SOURCES ................................................................................................ 105 SEDIMENT SOURCES FROM LAND USE ..................................................................................... 107
10. UPLAND VEGETATION AND WILDLIFE HABITAT.........................113
11. WATERSHED CONDITION EVALUATION...........................................120
SUMMARY OF KEY FINDINGS................................................................................................... 123 REFERENCE LIST...................................................................................................................... 128
WATER QUALITY APPENDIX
0
1. INTRODUCTION
Purpose and Need for the Watershed Assessment The Hood River Watershed Assessment was prepared by the Hood River Watershed Group (HRWG), a forum of landowners, businesses, growers, sport fishers, irrigation/water districts, individuals, state, federal and tribal agencies, and local government working cooperatively for a healthier environment and sustainable natural resources. The HRWG is one of 84 locally-formed “watershed councils” statewide that are a key part of the Oregon Plan for Salmon and Watersheds. The Oregon Plan is designed to improve the health of the state’s aquatic resources. In contrast to Endangered Species Act and environmental protection emphasizing regulations, the Oregon Plan relies on voluntary action, government coordination , monitoring and accountability, public education and the prioritized enforcement of environmental laws. The purpose of the assessment is to characterize watershed and stream habitat conditions to support planning for watershed health and fish recovery efforts. It will be used to develop a Watershed Action Plan in the year 2000 that will prioritize cooperative habitat protection, restoration, monitoring and education projects for implementation. Watershed assessments and analyses use a science-based, ecosystem approach to identify areas that need protection or rehabilitation. The Hood River watershed assessment generally follows the Oregon Watershed Assessment Manual prepared for the Oregon Watershed Enhancement Board (Watershed Professionals Network, 1999). Its geographic scope covers the whole Hood River subbasin. The Hood River is located on the east slope of the Cascade Range and enters the Columbia River 22 miles above Bonneville Dam. Its 339-square mile watershed supports bull trout, spring chinook salmon, summer and winter steelhead, rainbow and cutthroat trout, and lesser numbers of fall chinook and coho salmon. Hood River fish populations have declined markedly in the last decades. Native Hood River spring chinook became extinct in the early 1970s, along with native coho and fall chinook stocks. In 1998, steelhead and bull trout in the Hood River were listed as Threatened under the Endangered Species Act. Presently, all but the lower 4 miles of the Hood River are closed to salmon and steelhead angling. Several stream sections are listed under the Clean Water Act as water quality-impaired. In the Hood River as throughout the Pacific Northwest, loss and damage to spawning and rearing habitat are not due to a single factor, but are caused by the combination of many impacts over time. Dams, diversions, agriculture, timber harvest and other land use practices - have all contributed to the decline of Hood River salmon and steelhead habitat (BPA 1996). While parallel measures regionwide and in the Hood River target other contributing factors affecting native fish populations (e.g., overharvest, hatchery interactions, predation) – the watershed assessment focuses on freshwater habitat conditions.
1
Social and Economic Background
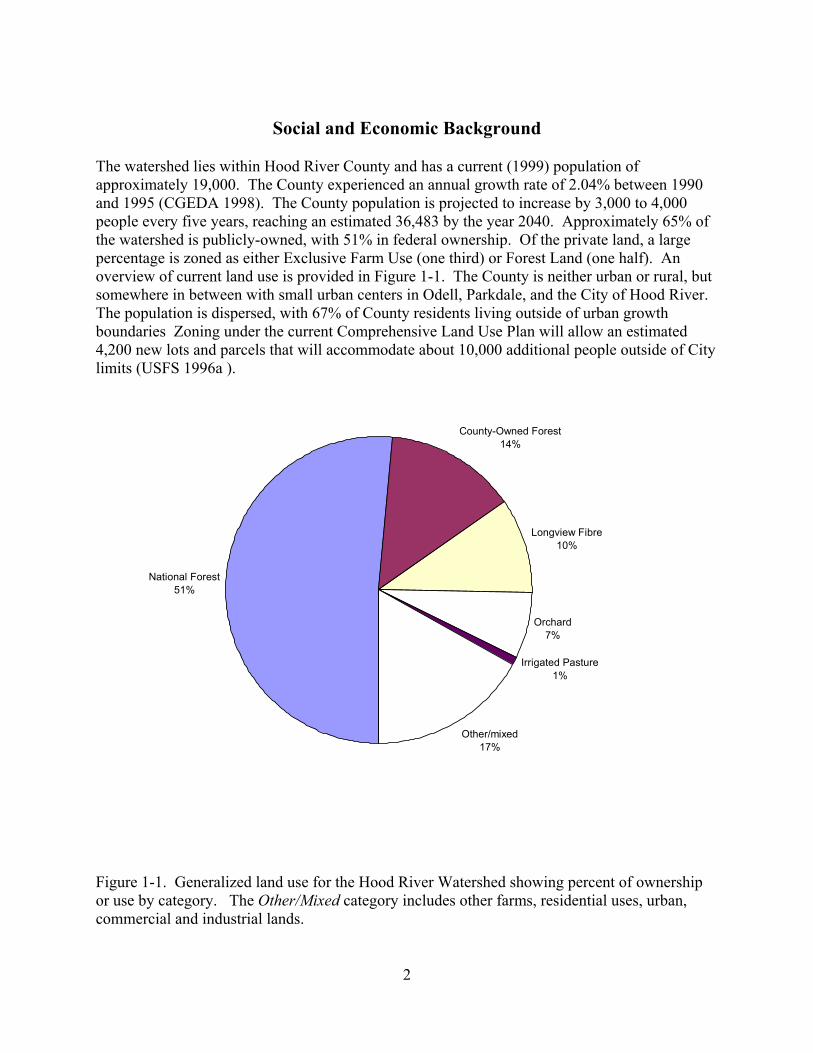
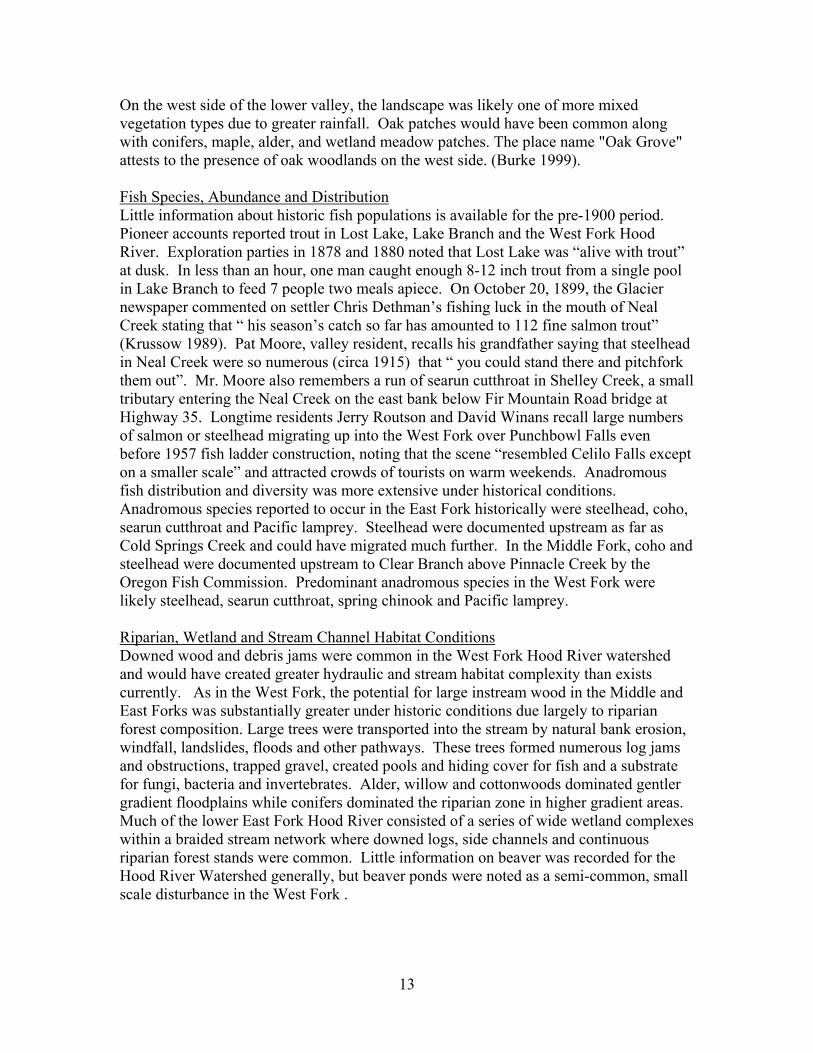
The watershed lies within Hood River County and has a current (1999) population of approximately 19,000. The County experienced an annual growth rate of 2.04% between 1990 and 1995 (CGEDA 1998). The County population is projected to increase by 3,000 to 4,000 people every five years, reaching an estimated 36,483 by the year 2040. Approximately 65% of the watershed is publicly-owned, with 51% in federal ownership. Of the private land, a large percentage is zoned as either Exclusive Farm Use (one third) or Forest Land (one half). An overview of current land use is provided in Figure 1-1. The County is neither urban or rural, but somewhere in between with small urban centers in Odell, Parkdale, and the City of Hood River. The population is dispersed, with 67% of County residents living outside of urban growth boundaries Zoning under the current Comprehensive Land Use Plan will allow an estimated 4,200 new lots and parcels that will accommodate about 10,000 additional people outside of City limits (USFS 1996a ).
National Forest51%
County-Owned Forest14%
Longview Fibre10%
Orchard7%
Irrigated Pasture1%
Other/mixed17%
Figure 1-1. Generalized land use for the Hood River Watershed showing percent of ownership or use by category. The Other/Mixed category includes other farms, residential uses, urban, commercial and industrial lands.
2
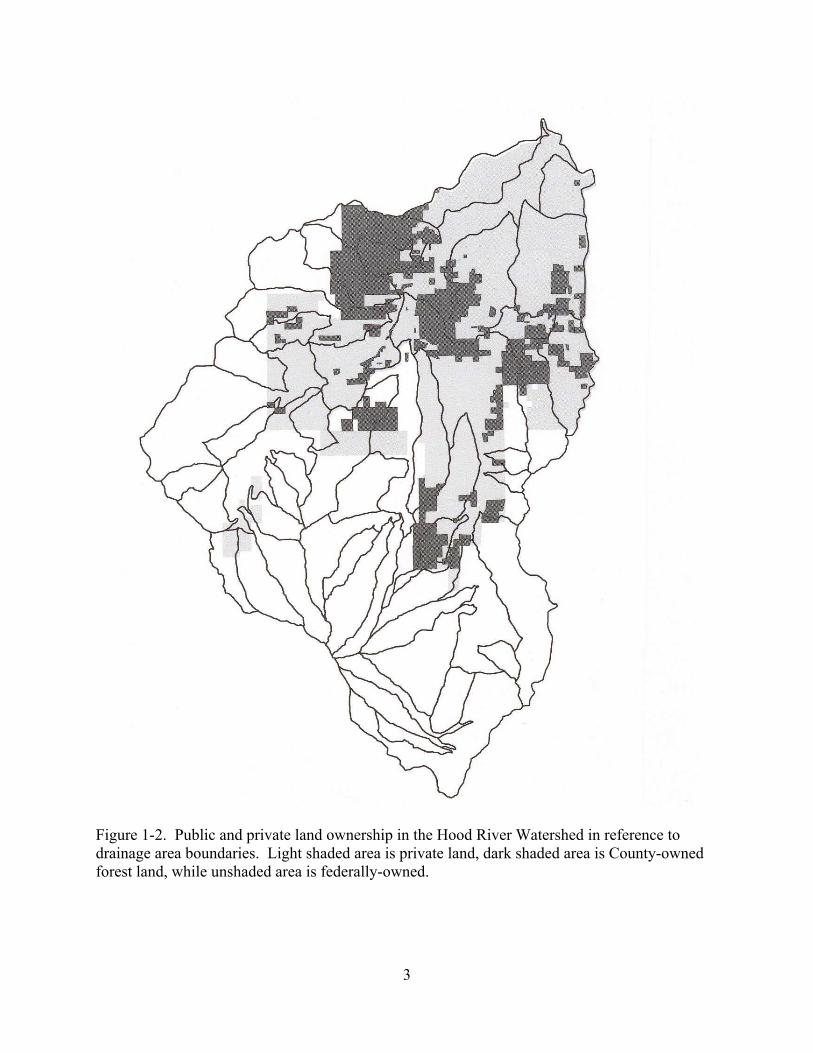
Figure 1-2. Public and private land ownership in the Hood River Watershed in reference to drainage area boundaries. Light shaded area is private land, dark shaded area is County-owned forest land, while unshaded area is federally-owned.
3
Agriculture is the leading industry in the watershed followed by tourism and forestry. Irrigated orchards growing mostly pears and apples make up approximately 15,000 acres (Niederholzer, OSU County Extension Agent, pers comm.). The Hood River Valley contributes about a third of the U.S. winter pear crop. Cherries, peaches, wine grapes and produce are also grown in smaller amounts. The fruit industry generates $65 to 70 million annually for the local economy and directly employs between 1,000 to 2,800 people depending on time of year (Nelson, HR Grower-Shippers Association, pers. comm). Among the 305 farms in the County with sales of $10,000 or more, the average farm size is 73 acres. Of these, more than half are less than 49 acres (Seavert 1994). Other agricultural activities include a number of farms raising livestock, one commercial dairy, and a single grazing allotment on the Mt. Hood National Forest (MHNF). Approximately 2,000 acres of pasture lands are irrigated. Most agricultural lands are located on land below 2,000 feet in elevation. Outdoor recreation and tourism has expanded into the second biggest economy in the watershed. Recreational use of the MHNF is rising as population grows in Portland and the Columbia River Gorge area. The MHNF, Mt. Hood Meadows Ski Resort and Cooper Spur Ski Area draws visitors, while the City of Hood River is an international windsurfing destination. The lower river lies within the Columbia River Gorge National Scenic Area. Whitewater kayaking, angling, hiking, general tourism, camping, backcountry snow sports and mountain biking are increasing watershed uses. Sportfishing remains a popular activity in the area among residents. A strong link between tourism and land development in the Hood River valley is noted by historians and continues today (USFS 1996b). The Confederated Tribes of the Warm Springs Reservation (CTWS) hold federally-reserved fishing rights in the Columbia River and the Hood River watershed. These rights arise from the Treaty with the Tribes of Middle Oregon signed June 25, 1855. The CTWS is the legal successor to signatories of the 1855 Treaty, under which seven bands of Wasco and Sahaptin-speaking Indians ceded ownership of ten million acres of tribal land, including the Hood River watershed, to the United States (BPA 1996). In exchange for these lands, the Treaty reserved to the Tribes an exclusive right to fish within Indian reservation boundaries and the right to fish in common with other citizens at all other usual and accustomed places including ceded lands. Ceremonial, commercial and subsistence fishing remains an essential part of tribal culture and economy. Treaty fishing opportunity has become severely restricted because of low abundance and the need to protect weak or threatened stocks. Tribal and non-tribal fishing affecting Hood River stocks is regulated or co-managed by CTWS and the Oregon Department of Fish and Wildlife (ODFW). The tribal co-management authority is derived from the 1855 Treaty and subsequent court rulings. As co-managers, the CTWS is actively involved in habitat protection, restoration, fisheries enforcement, enhancement and research activities. Forestry continues to be an important economic activity, with two lumber mills currently in operation. About half the watershed lies within the MHNF where timber harvest is guided by the 1994 Northwest Forest Plan. The MHNF is involved in substantial habitat restoration and monitoring activities in the basin. Hood River County owns approximately 30,000 acres of dedicated forest land in the watershed (Figure 1-2). Timber sales revenue from County-owned
4
forest lands contribute about 12.5% of the County budget (USFS 1996b). Longview Fibre Company owns 22,000 acres held in two main blocks - Fir Mountain in the Neal Creek drainage and along the West Fork Hood River, with some holdings along Tony Creek. PacifiCorp operates a hydroelectric project on the Hood River at Powerdale Dam (locally called Copper Dam) at river mile 4.5. A fish ladder and trap is operated at the dam by Oregon Department of Fish and Wildlife (ODFW) in conjunction with the Confederated Tribes of the Warm Springs Reservation to track anadromous fish populations and implement wild fish protection and recovery measures. PacifiCorp has applied to the Federal Energy Regulatory Commission for a new license to continue operating after its current license expires in March 2000. The new license is expected to improve existing conditions for fish in the project area, and includes increased summer and fall minimum flow requirements below the dam and new fish screen facilities.
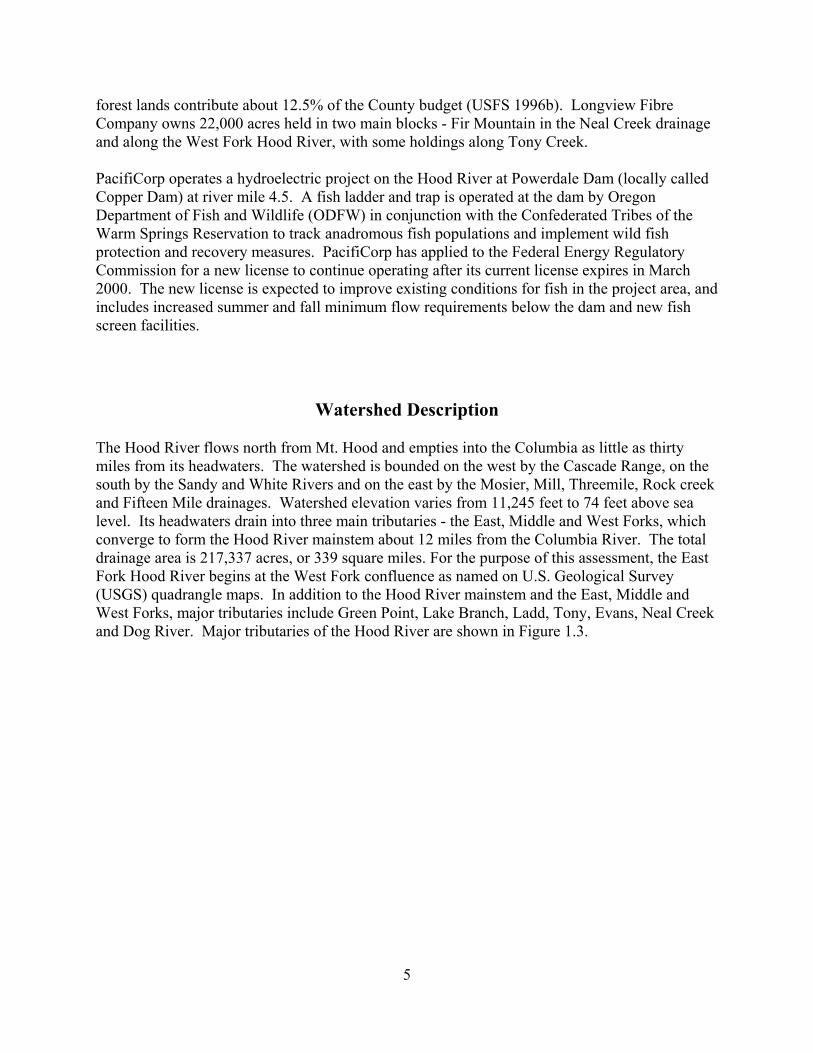
Watershed Description The Hood River flows north from Mt. Hood and empties into the Columbia as little as thirty miles from its headwaters. The watershed is bounded on the west by the Cascade Range, on the south by the Sandy and White Rivers and on the east by the Mosier, Mill, Threemile, Rock creek and Fifteen Mile drainages. Watershed elevation varies from 11,245 feet to 74 feet above sea level. Its headwaters drain into three main tributaries - the East, Middle and West Forks, which converge to form the Hood River mainstem about 12 miles from the Columbia River. The total drainage area is 217,337 acres, or 339 square miles. For the purpose of this assessment, the East Fork Hood River begins at the West Fork confluence as named on U.S. Geological Survey (USGS) quadrangle maps. In addition to the Hood River mainstem and the East, Middle and West Forks, major tributaries include Green Point, Lake Branch, Ladd, Tony, Evans, Neal Creek and Dog River. Major tributaries of the Hood River are shown in Figure 1.3.
5
Figure 1.3. Diagram of major Hood River tributaries with locations of Hood River Production Program facilities.
6
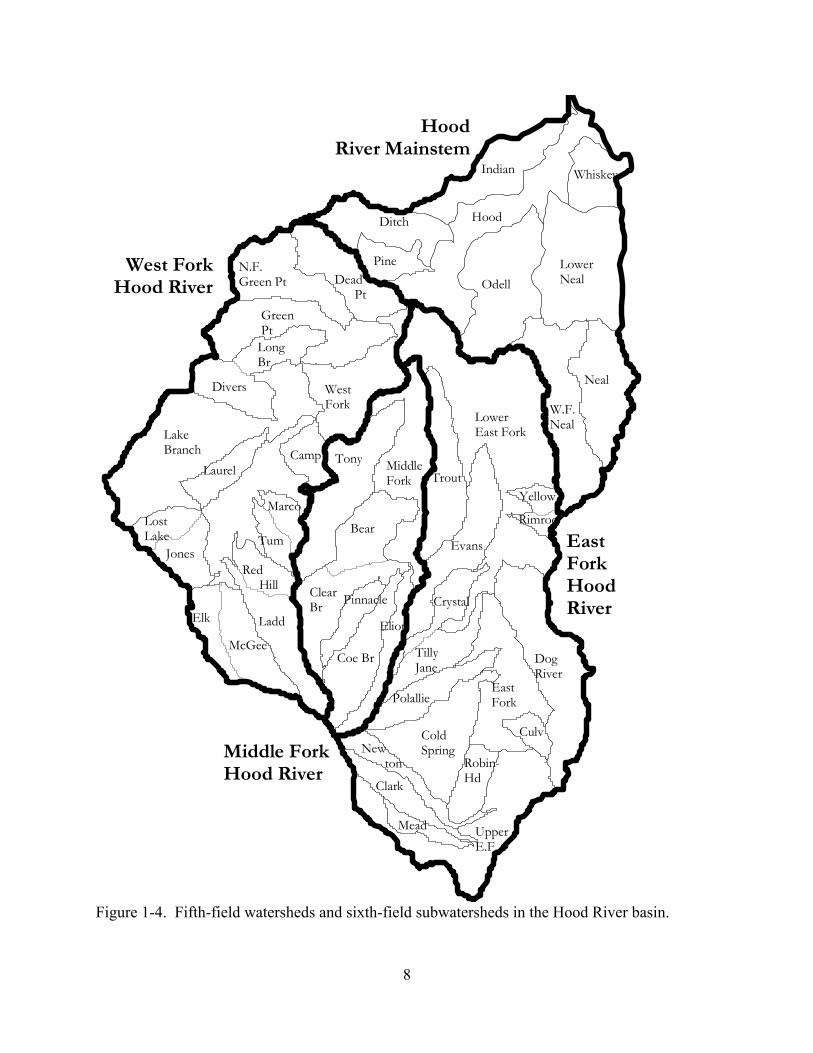
Conditions in rivers and creeks are controlled by the geology, climate, hydrology and land use of their surrounding drainage area from ridgetop to ridgetop. To assess habitat conditions, the stream network is divided into individual watersheds or groups of smaller watersheds with similar characteristics. Because the word “watershed” can be used to refer to both large and small drainages, confusion can be created about what land area is being discussed. To avoid confusion, the Oregon Watershed Assessment process assigns specific terms to different drainage levels using the U.S. Geological Survey Hydrologic Unit Code (HUC) system. This system is based on a watershed hierarchy and size. The Hood River subbasin - hereafter referred to as the “Watershed” - is a Fourth-field HUC watershed. The Hood River Watershed consists of four principal sub-basins, each of which corresponds to a “Fifth-field” watershed with an average size of around 60,000 acres. These 5th field watersheds are (1) West Fork Hood River; (2) Middle Fork Hood River; (3) East Fork Hood River; and (4) Hood River Mainstem – the lower river and its tributaries. The smallest level used in this assessment is the “subwatershed” corresponding to 6th field HUC watersheds having an average size of around 5,000 acres. A total of fifty 6th field subwatersheds make up the Hood River Watershed. The 6th field subwatershed boundaries used in this assessment were adopted from the US Forest Service Watershed Analysis for the West, Middle and East Fork Hood River and were delineated for the Hood River Mainstem. Watershed and subwatershed boundaries used in the Assessment are shown in Figure 1-3.
7
Dead Pt
N.F.Green Pt
GreenPt
WestFork
LongBr
Divers
LakeBranch Camp
Laurel
Marco
TumLostLake
JonesRed Hill
LaddElk
McGee
MiddleFork
Tony
Bear
ClearBr
Eliot
Coe Br
Pinnacle
Hood
Indian Whiskey
LowerNeal
Ditch
Odell
Pine
W.F.Neal
Neal
LowerEast Fork
Trout
Evans
Yellow
Rimroc
DogRiver
Crystal
TillyJane
EastForkPolallie
ColdSpring
CulvNew ton Robin-
HdClark
UpperE.F.
Mead
EastForkHoodRiver
Middle ForkHood River
West ForkHood River
HoodRiver Mainstem
Figure 1-4. Fifth-field watersheds and sixth-field subwatersheds in the Hood River basin.
8
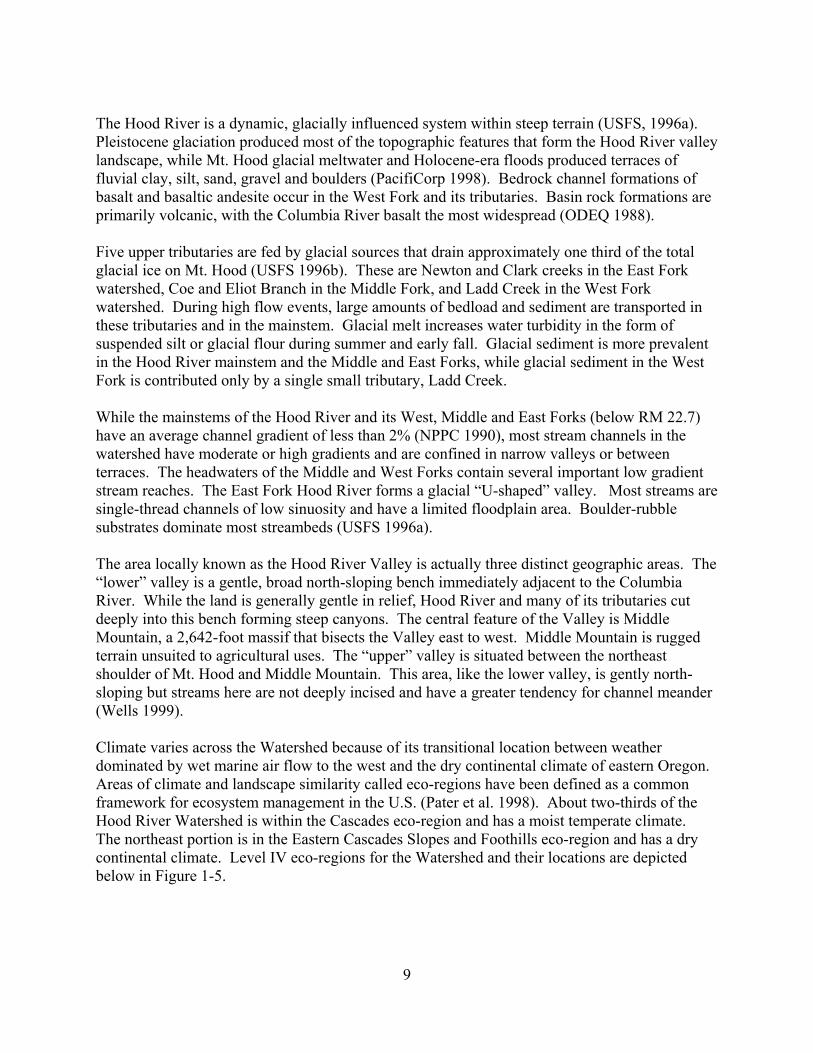
The Hood River is a dynamic, glacially influenced system within steep terrain (USFS, 1996a). Pleistocene glaciation produced most of the topographic features that form the Hood River valley landscape, while Mt. Hood glacial meltwater and Holocene-era floods produced terraces of fluvial clay, silt, sand, gravel and boulders (PacifiCorp 1998). Bedrock channel formations of basalt and basaltic andesite occur in the West Fork and its tributaries. Basin rock formations are primarily volcanic, with the Columbia River basalt the most widespread (ODEQ 1988). Five upper tributaries are fed by glacial sources that drain approximately one third of the total glacial ice on Mt. Hood (USFS 1996b). These are Newton and Clark creeks in the East Fork watershed, Coe and Eliot Branch in the Middle Fork, and Ladd Creek in the West Fork watershed. During high flow events, large amounts of bedload and sediment are transported in these tributaries and in the mainstem. Glacial melt increases water turbidity in the form of suspended silt or glacial flour during summer and early fall. Glacial sediment is more prevalent in the Hood River mainstem and the Middle and East Forks, while glacial sediment in the West Fork is contributed only by a single small tributary, Ladd Creek. While the mainstems of the Hood River and its West, Middle and East Forks (below RM 22.7) have an average channel gradient of less than 2% (NPPC 1990), most stream channels in the watershed have moderate or high gradients and are confined in narrow valleys or between terraces. The headwaters of the Middle and West Forks contain several important low gradient stream reaches. The East Fork Hood River forms a glacial “U-shaped” valley. Most streams are single-thread channels of low sinuosity and have a limited floodplain area. Boulder-rubble substrates dominate most streambeds (USFS 1996a). The area locally known as the Hood River Valley is actually three distinct geographic areas. The “lower” valley is a gentle, broad north-sloping bench immediately adjacent to the Columbia River. While the land is generally gentle in relief, Hood River and many of its tributaries cut deeply into this bench forming steep canyons. The central feature of the Valley is Middle Mountain, a 2,642-foot massif that bisects the Valley east to west. Middle Mountain is rugged terrain unsuited to agricultural uses. The “upper” valley is situated between the northeast shoulder of Mt. Hood and Middle Mountain. This area, like the lower valley, is gently north-sloping but streams here are not deeply incised and have a greater tendency for channel meander (Wells 1999). Climate varies across the Watershed because of its transitional location between weather dominated by wet marine air flow to the west and the dry continental climate of eastern Oregon. Areas of climate and landscape similarity called eco-regions have been defined as a common framework for ecosystem management in the U.S. (Pater et al. 1998). About two-thirds of the Hood River Watershed is within the Cascades eco-region and has a moist temperate climate. The northeast portion is in the Eastern Cascades Slopes and Foothills eco-region and has a dry continental climate. Level IV eco-regions for the Watershed and their locations are depicted below in Figure 1-5.
9
Figure1-5. General location of eco-regions depicted for Hood River County (from Pater et al. 1998).
10
About the Hood River Watershed Group An awareness that Hood River fish populations were declining has generated concern among biologists, water users and anglers for the last decade. The Hood River Watershed Group was formed in 1993 by the Hood River Soil and Water Conservation District (SWCD) to promote watershed improvement. The main catalyst in its creation was the expected listings of fish under the Endangered Species Act. The prevailing view was that local solutions to habitat problems would be preferable and more effective than federal regulatory controls. At the time the HRWG formed, some watershed restoration projects were already underway by irrigation districts, the Forest Service and others. In 1996, the Hood River County Board of Commissioners formally recognized the HRWG was as the subbasin’s Watershed Council. Funding from For the Sake of the Salmon foundation and the Governor's Watershed Enhancement Board was obtained in 1996 to hire a full-time coordinator. Additional funding has since been provided by the Confederated Tribes of the Warm Springs Reservation. The Group’s mission statement reads: “The purpose of the group is to sustain and improve the Hood River Watershed through education, cooperation and stewardship”. The HRWG makes decisions by consensus. A diverse 14-member Executive Committee represents the Group in an official capacity, and an Advisory Committee provides technical assistance. Citizen participation in meetings and volunteer activities are strongly encouraged. Committee memberships are listed below:
Executive Committee
Hood River County U.S. Forest Service City of Hood River Irrigation Districts (2 positions) Hood River Soil and Water Conservation District Domestic Water and/or Sewer Districts Industry Forestry Recreational Users Environmental Groups Small Business Orchardists (2 positions)
Advisory Committee
Confederated Tribes of the Warm Springs Reservation Oregon Department of Forestry Oregon Department of Fish and Wildlife Natural Resources Conservation Service Oregon Department of Environmental Quality Oregon Water Resources Department Oregon State University Extension Service
11
2. HISTORICAL CONDITIONS
Introduction
This Chapter summarizes available information on historic and current land use effects on the natural watershed. While the Hood River Watershed has been altered and restoration to a pristine condition is not an option, a knowledge of historic conditions and the cumulative effects of land use can help guide restoration actions and improve chances for success. Documenting how natural, unmanaged streams interacted with the streamside forest allows us to see how far we have deviated from optimum fish habitat requirements (Sedell and Luchessa 1981). Much of this Chapter was compiled from Forest Service Watershed Analysis reports (USFS 1996a; 1996b) which should be consulted for original citations. Added information was provided by valley residents of pioneer family origin, by John Wells of the USFS Hood River Ranger District, and by ecologist and historian Monica Burke of Parkdale.
Watershed Conditions at the Time of Settlement Vegetation Since few historical records are available to describe the landscape prior to Euro-American settlement, the USFS examined information from the turn of the century for use in watershed analysis. The USFS concluded that around the time of settlement, tree species in the Watershed were similar to those present today although their relative proportions differed. Douglas fir dominated the West Fork watershed, followed by western hemlock, red cedar, Pacific silver, noble and grand fir, and Englemann spruce. Large old-growth trees were found in Dee Flat and headwaters, on side slopes and canyons of Green Point Creek and Lake Branch, and on the valley floor of the West Fork Hood River. Government Land Office surveys from the 1880s suggest that dense understory brush was virtually everywhere in the West Fork. In the Middle Fork watershed, most of Tony and upper Bear Creek contained mature forest stands over 21 inches in diameter, while other areas had young or mixed age stands due to fire history. In 1901, the primary forest type in the East Fork drainage was a mix of sapling-pole and small tree conifer forest.
Historic photographs, relict trees, landscape features and place names can provide other clues to the nature of vegetation around the time of settlement (Burke 1999). On the drier east side of the lower Hood River valley, pine-oak forests were probably prevalent. Early photographs of Eastside Drive, the vegetation of undeveloped parcels, and a 1930 panoramic photograph taken from Wasco Point attest to this. Large oak trees still exist on the bench of Eastside Drive and relict pines stand near Pine Grove. The middle valley on the east side was certainly dominated by pine-oak stands on all but the north-facing slopes. Large old oak snags persist today beneath the conifer canopies in Booth Hill, the Neal Creek drainage and Fir Mountain. A panoramic photograph taken in the early 1930s from Twin Pine lookout near Neal Creek shows a mature Ponderosa pine forest.
12
On the west side of the lower valley, the landscape was likely one of more mixed vegetation types due to greater rainfall. Oak patches would have been common along with conifers, maple, alder, and wetland meadow patches. The place name "Oak Grove" attests to the presence of oak woodlands on the west side. (Burke 1999). Fish Species, Abundance and Distribution Little information about historic fish populations is available for the pre-1900 period. Pioneer accounts reported trout in Lost Lake, Lake Branch and the West Fork Hood River. Exploration parties in 1878 and 1880 noted that Lost Lake was “alive with trout” at dusk. In less than an hour, one man caught enough 8-12 inch trout from a single pool in Lake Branch to feed 7 people two meals apiece. On October 20, 1899, the Glacier newspaper commented on settler Chris Dethman’s fishing luck in the mouth of Neal Creek stating that “ his season’s catch so far has amounted to 112 fine salmon trout” (Krussow 1989). Pat Moore, valley resident, recalls his grandfather saying that steelhead in Neal Creek were so numerous (circa 1915) that “ you could stand there and pitchfork them out”. Mr. Moore also remembers a run of searun cutthroat in Shelley Creek, a small tributary entering the Neal Creek on the east bank below Fir Mountain Road bridge at Highway 35. Longtime residents Jerry Routson and David Winans recall large numbers of salmon or steelhead migrating up into the West Fork over Punchbowl Falls even before 1957 fish ladder construction, noting that the scene “resembled Celilo Falls except on a smaller scale” and attracted crowds of tourists on warm weekends. Anadromous fish distribution and diversity was more extensive under historical conditions. Anadromous species reported to occur in the East Fork historically were steelhead, coho, searun cutthroat and Pacific lamprey. Steelhead were documented upstream as far as Cold Springs Creek and could have migrated much further. In the Middle Fork, coho and steelhead were documented upstream to Clear Branch above Pinnacle Creek by the Oregon Fish Commission. Predominant anadromous species in the West Fork were likely steelhead, searun cutthroat, spring chinook and Pacific lamprey. Riparian, Wetland and Stream Channel Habitat Conditions Downed wood and debris jams were common in the West Fork Hood River watershed and would have created greater hydraulic and stream habitat complexity than exists currently. As in the West Fork, the potential for large instream wood in the Middle and East Forks was substantially greater under historic conditions due largely to riparian forest composition. Large trees were transported into the stream by natural bank erosion, windfall, landslides, floods and other pathways. These trees formed numerous log jams and obstructions, trapped gravel, created pools and hiding cover for fish and a substrate for fungi, bacteria and invertebrates. Alder, willow and cottonwoods dominated gentler gradient floodplains while conifers dominated the riparian zone in higher gradient areas. Much of the lower East Fork Hood River consisted of a series of wide wetland complexes within a braided stream network where downed logs, side channels and continuous riparian forest stands were common. Little information on beaver was recorded for the Hood River Watershed generally, but beaver ponds were noted as a semi-common, small scale disturbance in the West Fork .
13
Three main depositional areas of low gradient, broad floodplain in the East Fork were mapped by the MHNF as likely to collect large woody material and allow development of high quality fish habitat. These areas in the East Fork mainstem were (1) between Baldwin and Tilly Jane Creeks; (2) a half-mile upstream of the Pollallie Creek mouth; and (3) from Cold Spring to Robinhood Creek. Two areas of the Middle Fork watershed had similar potential for high quality fish habitat development – (1) the lower mainstem between Tony and Bear Creeks; and (2) the reach of Clear Branch inundated by Laurance Lake. Tributary streams believed to have had large volumes of instream wood and heavy salmonid use were Tony Creek, lower Dog River and the lower East Fork tributaries. Natural Disturbance Patterns Natural disturbance types that occur in the Watershed include floods, fires, mudflows, landslides, beaver ponding, and insect and disease epidemics. Evidence suggests that most natural disturbance processes in the West Fork watershed are driven primarily by climate. Stand-replacing fire historically was a large-scale but rare event. Below 4,000 feet, fire return is driven by seasonal drought combined with prolonged drought. A rain-on-snow flood was documented as early as 1887 in Neal Creek (Krussow 1989). Most streams in the West, Middle and East Fork Hood River lie entirely within the rain-on-snow elevation zone, which usually is under 4500 feet, but due to its orientation and the influence of Mt Hood, the entire East Fork watershed is subject to rain on snow flooding (USFS 1996b). Catastrophic landslides and debris flows are common in several upper East Fork Hood River tributaries. These large scale events have significantly affected habitat conditions in affected stream channels, resulting in less instream wood and less mature riparian vegetation than would be found in the absence of such disturbances. One to 25-year floods are frequent in the West Fork and 25–50 year flood events are semi-frequent, as are mass wasting or landslides. These events are a major force in shaping riparian and aquatic habitat conditions. Mudflows in Ladd Creek are a large-scale and semi-frequent to rare disturbance event. Because of shallow, rocky, well-drained soils, climate fluctuations have greater effect on disturbance processes in the Green Point drainage compared to other West Fork subwatersheds. As a result, insect epidemics and rain-on-snow flood events have caused larger scale impacts in Green Point than elsewhere in the West Fork system. Beaver ponding was historically considered a small-scale, semi-rare event in the West Fork and was not noted to occur in the Green Point subwatershed. No other information about beaver ponding elsewhere was found.
Patterns of Land Development and Resource Use Established trails were used by Native Americans and later by non-Indian settlers as trade routes and access to hunting, gathering and fishing grounds. Native houses were located at the Hood River mouth and at nearby sites. Major trails went from the upper valley to the slopes of Mt. Hood, through prairies and meadows along Surveyors Ridge, up the West Fork Hood River over Lolo Pass, and from Bald Butte to The Dalles. Intentional burning by Native Americans to maintain travel routes and berry patches is well documented. Native Americans maintained huckleberry fields in meadows around Lost Lake and Indian Mountain. They collected camas, bear grass and other plants, hunted
14
deer, elk and other game, and fished in the tributaries and main forks of the Hood River. Temporary camps were set up to collect and prepare foods. Peeled cedars are still found in the East and Middle Forks, the bark of which was used for clothing and basketry. Sheep herding and cattle grazing was common on the upper slopes of the East Fork in meadow areas during early settlement and continued into the 1950s or later. Around 1880, orchards and strawberry fields began to progress gradually up the valley as acres of forest were transformed into pasture and fruit crops. Camas fields in the upper valley were drained in the 1890s to plant strawberry crops. The results of a Geological Survey in Forest Conditions in the Cascade Range Forest Reserve, Oregon (Langille 1903) were reviewed for this assessment by John Wells of the Hood River Ranger District. Langille said in his report of Township 2 North, Range 10 East in the lower Hood River Valley:
"It is all good agricultural land, and is thickly settled below the hills. Most of the timber has been cut, and the land is being cleared at a rapid rate and set to fruit trees or berries."
In the upper valley, the majority of which is located in Township 1 North, Range 10 East, Langille wrote:
"The greater part of it is comparatively level land, well adapted to agriculture and fruit growing, and all of the areas except the hills along the eastern side [Surveyors Ridge] and in the northwestern sections are located upon, and the work of clearing is going on as rapidly as the circumstances of the settlers will permit."
Extensive fires of 1,000 acres or more were intentionally set by homesteaders in the lower East Fork valley. The use of drain tiles and ditches to drain wet areas for agriculture and roadways was extensive and continues to the present. Many wetlands and stream channels have been drained or diverted to reduce saturated soil conditions. Roads were constructed adjacent to and across streams. Possibly the biggest factor altering the vegetative pattern in the lower Watershed was the growth of the fruit industry, where orchards have replaced coniferous forest and riparian habitat networks (USFS 1996b). Beginning in 1861, water-powered sawmills, dams and mill ponds operated in Neal Creek, the East Fork Hood River at Hines Dam, Hood River and in Green Point Creek. At the same time, streams began to be diverted into hand-dug irrigation canals and ditches. Logs were transported in river channels or by flumes, horse teams and later railroads. By 1909, Powerdale Dam was built across the lower Hood River to generate hydroelectric power. By 1913, the area around Parkdale had been logged and the flat land between the East and Middle Forks was being cut. Timber harvest did not begin in the East Fork on National Forest lands until 1940s, where historic logging focused mainly on mature stands within the Pocket, Culvert, Engineers and Dog River drainages. While headwater areas have been subject to less alteration, management activities have significantly altered the lower East and Middle Fork watersheds. The availability of
15
contiguous mature forest habitat in the East Fork watershed has been reduced by management-related fragmentation. Historic timber harvest has resulted in fish habitat with fewer pieces of instream wood and less variation in water velocity and substrate sizes than that which once existed. Extensive use of splash dams is well documented in the Hood River watershed through the 1940s. During the 1960s and 1970s, stream clean out was an encouraged practice and was believed to benefit fish passage. All large instream and riparian wood was cleared from the East Fork Hood River channel between Robinhood and Sherwood campgrounds as recently as 1979. In much of the watershed, the structural habitat capable of supporting historic population levels of anadromous fish is limited today. The loss of the former natural wood supply into stream channels has resulted in higher flood velocities, less interaction between streams and floodplains, and a deficiency of pool habitat. This lack of instream wood and slow water areas makes it difficult for gravel to deposit and be retained in the low-water channel where it is needed for spawning. As a result, many channels in the Watershed are deficient in gravel substrate suitable for spawning. Portions of channels in the West Fork watershed have cut down to bedrock and are disconnected from their floodplain. Down cutting, floodplain abandonment, channel widening and agradation is visible in the East Fork Hood River suggesting a stream system out of balance. Visitor use of the National Forest has multiplied due to regional population growth and the increasing popularity of outdoor recreation including hiking, angling, whitewater kayaking, mountain biking, skiing, snowboarding, backcountry snow sports, off-road motorcycling, camping and general tourism. Residential development activity is increasing within the watershed.
16
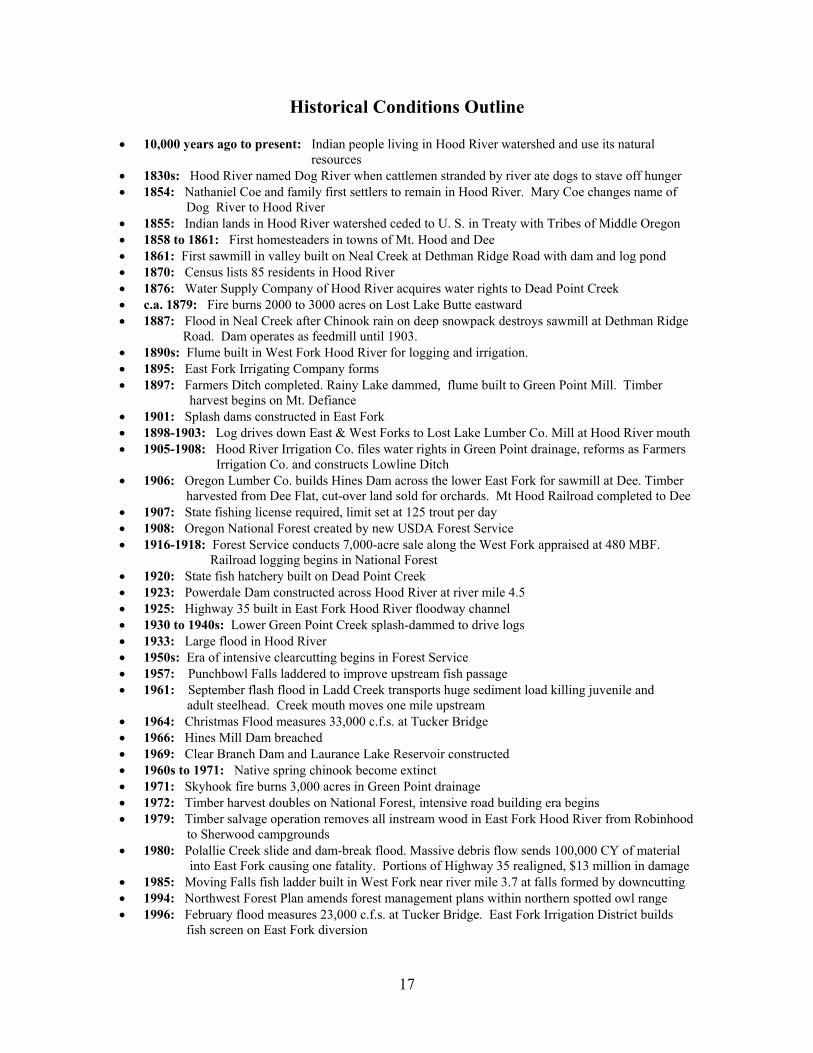
Historical Conditions Outline • 10,000 years ago to present: Indian people living in Hood River watershed and use its natural
resources • 1830s: Hood River named Dog River when cattlemen stranded by river ate dogs to stave off hunger • 1854: Nathaniel Coe and family first settlers to remain in Hood River. Mary Coe changes name of Dog River to Hood River • 1855: Indian lands in Hood River watershed ceded to U. S. in Treaty with Tribes of Middle Oregon • 1858 to 1861: First homesteaders in towns of Mt. Hood and Dee • 1861: First sawmill in valley built on Neal Creek at Dethman Ridge Road with dam and log pond • 1870: Census lists 85 residents in Hood River • 1876: Water Supply Company of Hood River acquires water rights to Dead Point Creek • c.a. 1879: Fire burns 2000 to 3000 acres on Lost Lake Butte eastward • 1887: Flood in Neal Creek after Chinook rain on deep snowpack destroys sawmill at Dethman Ridge Road. Dam operates as feedmill until 1903. • 1890s: Flume built in West Fork Hood River for logging and irrigation. • 1895: East Fork Irrigating Company forms • 1897: Farmers Ditch completed. Rainy Lake dammed, flume built to Green Point Mill. Timber harvest begins on Mt. Defiance • 1901: Splash dams constructed in East Fork • 1898-1903: Log drives down East & West Forks to Lost Lake Lumber Co. Mill at Hood River mouth • 1905-1908: Hood River Irrigation Co. files water rights in Green Point drainage, reforms as Farmers Irrigation Co. and constructs Lowline Ditch • 1906: Oregon Lumber Co. builds Hines Dam across the lower East Fork for sawmill at Dee. Timber harvested from Dee Flat, cut-over land sold for orchards. Mt Hood Railroad completed to Dee • 1907: State fishing license required, limit set at 125 trout per day • 1908: Oregon National Forest created by new USDA Forest Service • 1916-1918: Forest Service conducts 7,000-acre sale along the West Fork appraised at 480 MBF.
Railroad logging begins in National Forest • 1920: State fish hatchery built on Dead Point Creek • 1923: Powerdale Dam constructed across Hood River at river mile 4.5 • 1925: Highway 35 built in East Fork Hood River floodway channel • 1930 to 1940s: Lower Green Point Creek splash-dammed to drive logs • 1933: Large flood in Hood River • 1950s: Era of intensive clearcutting begins in Forest Service • 1957: Punchbowl Falls laddered to improve upstream fish passage • 1961: September flash flood in Ladd Creek transports huge sediment load killing juvenile and
adult steelhead. Creek mouth moves one mile upstream • 1964: Christmas Flood measures 33,000 c.f.s. at Tucker Bridge • 1966: Hines Mill Dam breached • 1969: Clear Branch Dam and Laurance Lake Reservoir constructed • 1960s to 1971: Native spring chinook become extinct • 1971: Skyhook fire burns 3,000 acres in Green Point drainage • 1972: Timber harvest doubles on National Forest, intensive road building era begins • 1979: Timber salvage operation removes all instream wood in East Fork Hood River from Robinhood
to Sherwood campgrounds • 1980: Polallie Creek slide and dam-break flood. Massive debris flow sends 100,000 CY of material into East Fork causing one fatality. Portions of Highway 35 realigned, $13 million in damage • 1985: Moving Falls fish ladder built in West Fork near river mile 3.7 at falls formed by downcutting • 1994: Northwest Forest Plan amends forest management plans within northern spotted owl range • 1996: February flood measures 23,000 c.f.s. at Tucker Bridge. East Fork Irrigation District builds fish screen on East Fork diversion
17
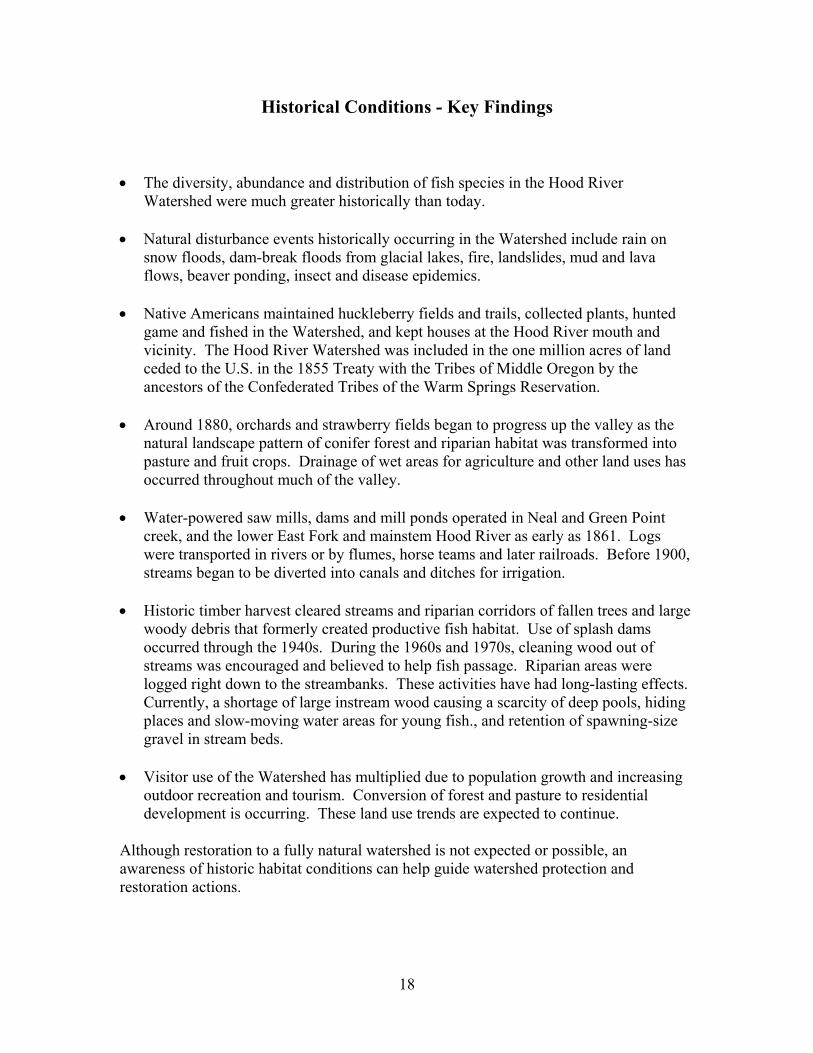
Historical Conditions - Key Findings • The diversity, abundance and distribution of fish species in the Hood River
Watershed were much greater historically than today. • Natural disturbance events historically occurring in the Watershed include rain on
snow floods, dam-break floods from glacial lakes, fire, landslides, mud and lava flows, beaver ponding, insect and disease epidemics.
• Native Americans maintained huckleberry fields and trails, collected plants, hunted
game and fished in the Watershed, and kept houses at the Hood River mouth and vicinity. The Hood River Watershed was included in the one million acres of land ceded to the U.S. in the 1855 Treaty with the Tribes of Middle Oregon by the ancestors of the Confederated Tribes of the Warm Springs Reservation.
• Around 1880, orchards and strawberry fields began to progress up the valley as the
natural landscape pattern of conifer forest and riparian habitat was transformed into pasture and fruit crops. Drainage of wet areas for agriculture and other land uses has occurred throughout much of the valley.
• Water-powered saw mills, dams and mill ponds operated in Neal and Green Point
creek, and the lower East Fork and mainstem Hood River as early as 1861. Logs were transported in rivers or by flumes, horse teams and later railroads. Before 1900, streams began to be diverted into canals and ditches for irrigation.
• Historic timber harvest cleared streams and riparian corridors of fallen trees and large
woody debris that formerly created productive fish habitat. Use of splash dams occurred through the 1940s. During the 1960s and 1970s, cleaning wood out of streams was encouraged and believed to help fish passage. Riparian areas were logged right down to the streambanks. These activities have had long-lasting effects. Currently, a shortage of large instream wood causing a scarcity of deep pools, hiding places and slow-moving water areas for young fish., and retention of spawning-size gravel in stream beds.
• Visitor use of the Watershed has multiplied due to population growth and increasing
outdoor recreation and tourism. Conversion of forest and pasture to residential development is occurring. These land use trends are expected to continue.
Although restoration to a fully natural watershed is not expected or possible, an awareness of historic habitat conditions can help guide watershed protection and restoration actions.
18
3. CHANNEL HABITAT TYPES IN THE HOOD RIVER WATERSHED
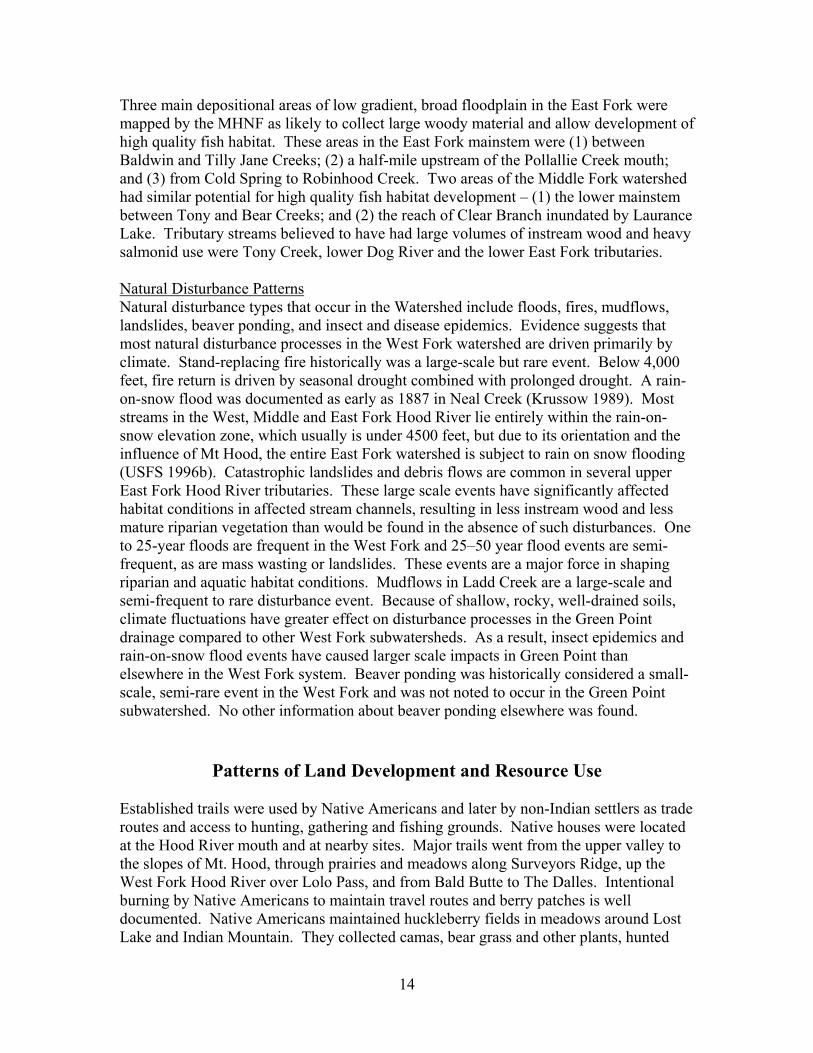
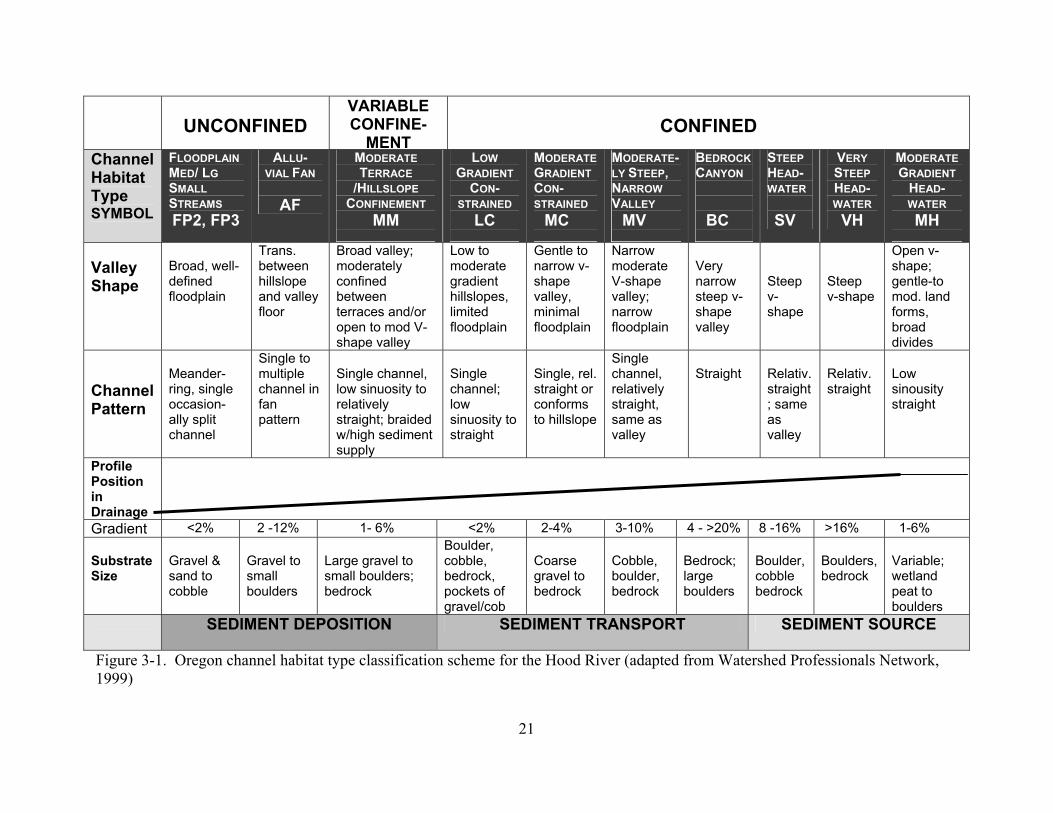
Introduction The Oregon assessment method uses the channel structure of a stream to evaluate restoration potential and effects of land use practices. The Oregon Watershed Assessment Manual presents a classification system to divide streams into "channel habitat types” in order to evaluate habitat conditions and productive potential (Watershed Professionals Network 1999). This classification system uses features such as valley shape, degree of confinement, gradient, substrate, channel pattern and geology and is illustrated in Figure 3-1. Its most influential factors are stream gradient and channel confinement. Each channel habitat type has predictable attributes that influence fish use, sensitivity to disturbances, and the potential for improvement and recovery (USFS 1996a). Gradient determines whether a particular stream reach (i.e., segment) is predominantly a deposition, transport, or source area for sediment and large woody debris. Low gradient reaches (less than 2%) are depositional zones for woody debris and sediment, including spawning gravel. Depositional areas are highly productive for fish. The primary spawning and rearing habitat used by anadromous fish typically occurs in areas averaging less than a 2% gradient (NPPC 1990). Moderate gradient reaches (2-4 %) are transitional transport areas for sediment and wood and are moderately productive for fish. High gradient reaches (4-10%) are transport zones with only a fair productivity for fish, but high productivity for amphibians. Reaches with gradients over 10% are often not naturally fish-bearing (USFS 1996a). Many stream segments in the Watershed are confined between hillslopes, bedrock canyons, or terraces that restrict the streams lateral movement and prevent development of meanders and wide floodplains. Lateral movement affects habitat quality and is also of prime concern to land managers (Watershed Professionals Network 1999).
19
UNCONFINED
VARIABLE CONFINE-
MENT
CONFINED
Channel Habitat Type SYMBOL
FLOODPLAIN MED/ LG SMALL STREAMS FP2, FP3
ALLU- VIAL FAN
AF
MODERATE TERRACE
/HILLSLOPE CONFINEMENT
MM
LOW GRADIENT
CON-STRAINED
LC
MODERATE GRADIENT CON-STRAINED MC
MODERATE-LY STEEP, NARROW VALLEY MV
BEDROCK CANYON BC
STEEP HEAD- WATER SV
VERY STEEP HEAD-WATER VH
MODERATE GRADIENT
HEAD-WATER MH
Valley Shape
Broad, well-defined floodplain
Trans. between hillslope and valley floor
Broad valley; moderately confined between terraces and/or open to mod V-shape valley
Low to moderate gradient hillslopes, limited floodplain
Gentle to narrow v-shape valley, minimal floodplain
Narrow moderate V-shape valley; narrow floodplain
Very narrow steep v- shape valley
Steep v- shape
Steep v-shape
Open v-shape; gentle-to mod. land forms, broad divides
Channel Pattern
Meander-ring, single occasion-ally split channel
Single to multiple channel in fan pattern
Single channel, low sinuosity to relatively straight; braided w/high sediment supply
Single channel; low sinuosity to straight
Single, rel. straight or conforms to hillslope
Single channel, relatively straight, same as valley
Straight
Relativ. straight; same as valley
Relativ. straight
Low sinousity straight
Profile Position in Drainage
Gradient <2% 2 -12% 1- 6% <2% 2-4% 3-10% 4 - >20% 8 -16% >16% 1-6% Substrate Size
Gravel & sand to cobble
Gravel to small boulders
Large gravel to small boulders; bedrock
Boulder, cobble, bedrock, pockets of gravel/cob
Coarse gravel to bedrock
Cobble, boulder, bedrock
Bedrock; large boulders
Boulder,cobble bedrock
Boulders, bedrock
Variable; wetland peat to boulders
SEDIMENT DEPOSITION SEDIMENT TRANSPORT SEDIMENT SOURCE
Figure 3-1. Oregon channel habitat type classification scheme for the Hood River (adapted from Watershed Professionals Network, 1999)
21
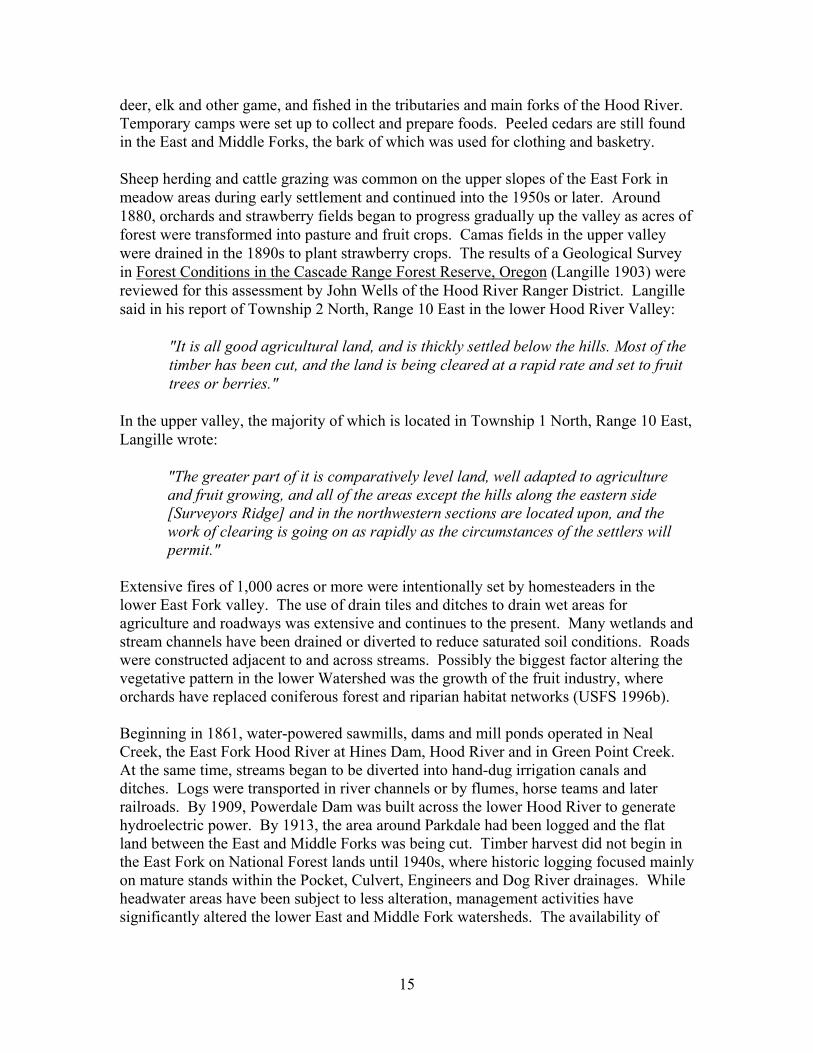
LowSensitivity
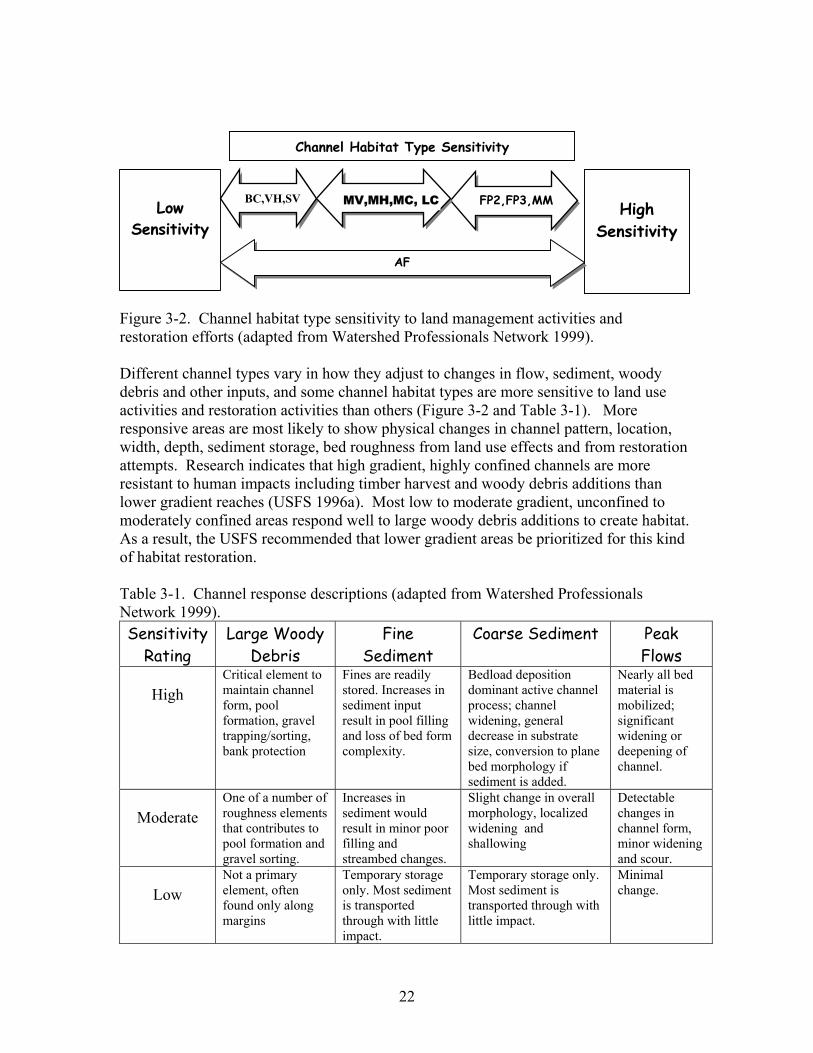
Figure 3-2. Channel habitat type sensitivity to land management activities and restoration efforts (adapted from Watershed Professionals Network 1999). Different channel types vary in how they adjust to changes in flow, sediment, woody debris and other inputs, and some channel habitat types are more sensitive to land use activities and restoration activities than others (Figure 3-2 and Table 3-1). More responsive areas are most likely to show physical changes in channel pattern, location, width, depth, sediment storage, bed roughness from land use effects and from restoration attempts. Research indicates that high gradient, highly confined channels are more resistant to human impacts including timber harvest and woody debris additions than lower gradient reaches (USFS 1996a). Most low to moderate gradient, unconfined to moderately confined areas respond well to large woody debris additions to create habitat. As a result, the USFS recommended that lower gradient areas be prioritized for this kind of habitat restoration. Table 3-1. Channel response descriptions (adapted from Watershed Professionals Network 1999). Sensitivity
Rating Large Woody
Debris Fine
Sediment Coarse Sediment Peak
Flows
High Critical element to maintain channel form, pool formation, gravel trapping/sorting, bank protection
Fines are readily stored. Increases in sediment input result in pool filling and loss of bed form complexity.
Bedload deposition dominant active channel process; channel widening, general decrease in substrate size, conversion to plane bed morphology if sediment is added.
Nearly all bed material is mobilized; significant widening or deepening of channel.
Moderate
One of a number of roughness elements that contributes to pool formation and gravel sorting.
Increases in sediment would result in minor poor filling and streambed changes.
Slight change in overall morphology, localized widening and shallowing
Detectable changes in channel form, minor widening and scour.
Low
Not a primary element, often found only along margins
Temporary storage only. Most sediment is transported through with little impact.
Temporary storage only. Most sediment is transported through with little impact.
Minimal change.
High
Sensitivity
Channel Habitat Type Sensitivity
MV,MH,MC, LC
AF
BC,VH,SV FP2,FP3,MM
22
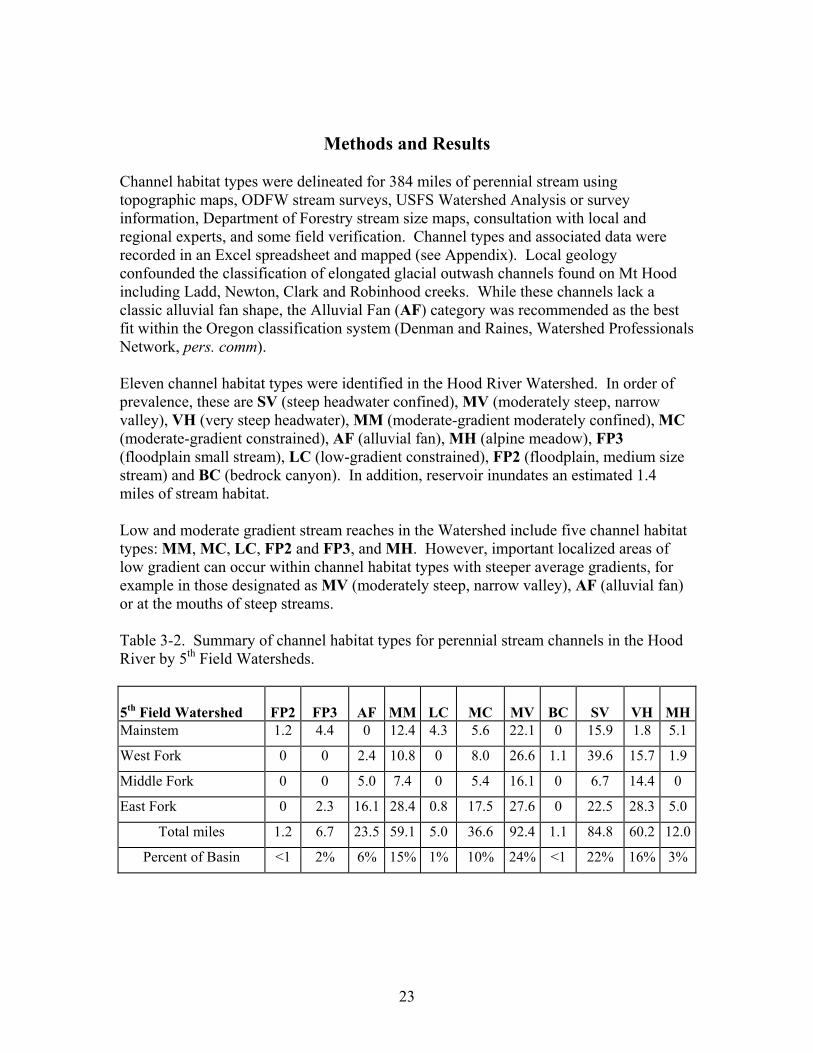
Methods and Results Channel habitat types were delineated for 384 miles of perennial stream using topographic maps, ODFW stream surveys, USFS Watershed Analysis or survey information, Department of Forestry stream size maps, consultation with local and regional experts, and some field verification. Channel types and associated data were recorded in an Excel spreadsheet and mapped (see Appendix). Local geology confounded the classification of elongated glacial outwash channels found on Mt Hood including Ladd, Newton, Clark and Robinhood creeks. While these channels lack a classic alluvial fan shape, the Alluvial Fan (AF) category was recommended as the best fit within the Oregon classification system (Denman and Raines, Watershed Professionals Network, pers. comm). Eleven channel habitat types were identified in the Hood River Watershed. In order of prevalence, these are SV (steep headwater confined), MV (moderately steep, narrow valley), VH (very steep headwater), MM (moderate-gradient moderately confined), MC (moderate-gradient constrained), AF (alluvial fan), MH (alpine meadow), FP3 (floodplain small stream), LC (low-gradient constrained), FP2 (floodplain, medium size stream) and BC (bedrock canyon). In addition, reservoir inundates an estimated 1.4 miles of stream habitat. Low and moderate gradient stream reaches in the Watershed include five channel habitat types: MM, MC, LC, FP2 and FP3, and MH. However, important localized areas of low gradient can occur within channel habitat types with steeper average gradients, for example in those designated as MV (moderately steep, narrow valley), AF (alluvial fan) or at the mouths of steep streams. Table 3-2. Summary of channel habitat types for perennial stream channels in the Hood River by 5th Field Watersheds. 5th Field Watershed
FP2
FP3
AF
MM
LC
MC
MV
BC
SV
VH
MH
Mainstem 1.2 4.4 0 12.4 4.3 5.6 22.1 0 15.9 1.8 5.1
West Fork 0 0 2.4 10.8 0 8.0 26.6 1.1 39.6 15.7 1.9
Middle Fork 0 0 5.0 7.4 0 5.4 16.1 0 6.7 14.4 0
East Fork 0 2.3 16.1 28.4 0.8 17.5 27.6 0 22.5 28.3 5.0
Total miles 1.2 6.7 23.5 59.1 5.0 36.6 92.4 1.1 84.8 60.2 12.0
Percent of Basin <1 2% 6% 15% 1% 10% 24% <1 22% 16% 3%
23
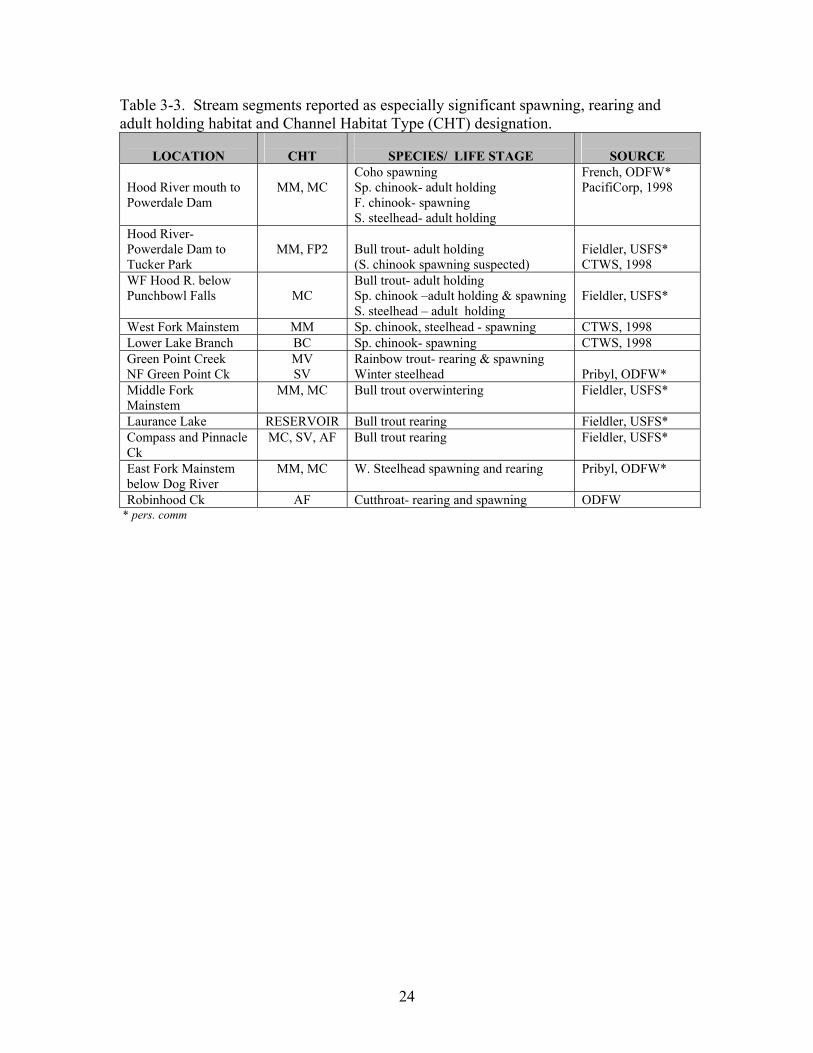
Table 3-3. Stream segments reported as especially significant spawning, rearing and adult holding habitat and Channel Habitat Type (CHT) designation.
LOCATION
CHT
SPECIES/ LIFE STAGE
SOURCE
Hood River mouth to Powerdale Dam
MM, MC
Coho spawning Sp. chinook- adult holding F. chinook- spawning S. steelhead- adult holding
French, ODFW* PacifiCorp, 1998
Hood River- Powerdale Dam to Tucker Park
MM, FP2
Bull trout- adult holding (S. chinook spawning suspected)
Fieldler, USFS* CTWS, 1998
WF Hood R. below Punchbowl Falls
MC
Bull trout- adult holding Sp. chinook –adult holding & spawning S. steelhead – adult holding
Fieldler, USFS*
West Fork Mainstem MM Sp. chinook, steelhead - spawning CTWS, 1998 Lower Lake Branch BC Sp. chinook- spawning CTWS, 1998 Green Point Creek NF Green Point Ck
MV SV
Rainbow trout- rearing & spawning Winter steelhead
Pribyl, ODFW*
Middle Fork Mainstem
MM, MC Bull trout overwintering Fieldler, USFS*
Laurance Lake RESERVOIR Bull trout rearing Fieldler, USFS* Compass and Pinnacle Ck
MC, SV, AF Bull trout rearing Fieldler, USFS*
East Fork Mainstem below Dog River
MM, MC W. Steelhead spawning and rearing Pribyl, ODFW*
Robinhood Ck AF Cutthroat- rearing and spawning ODFW * pers. comm
24
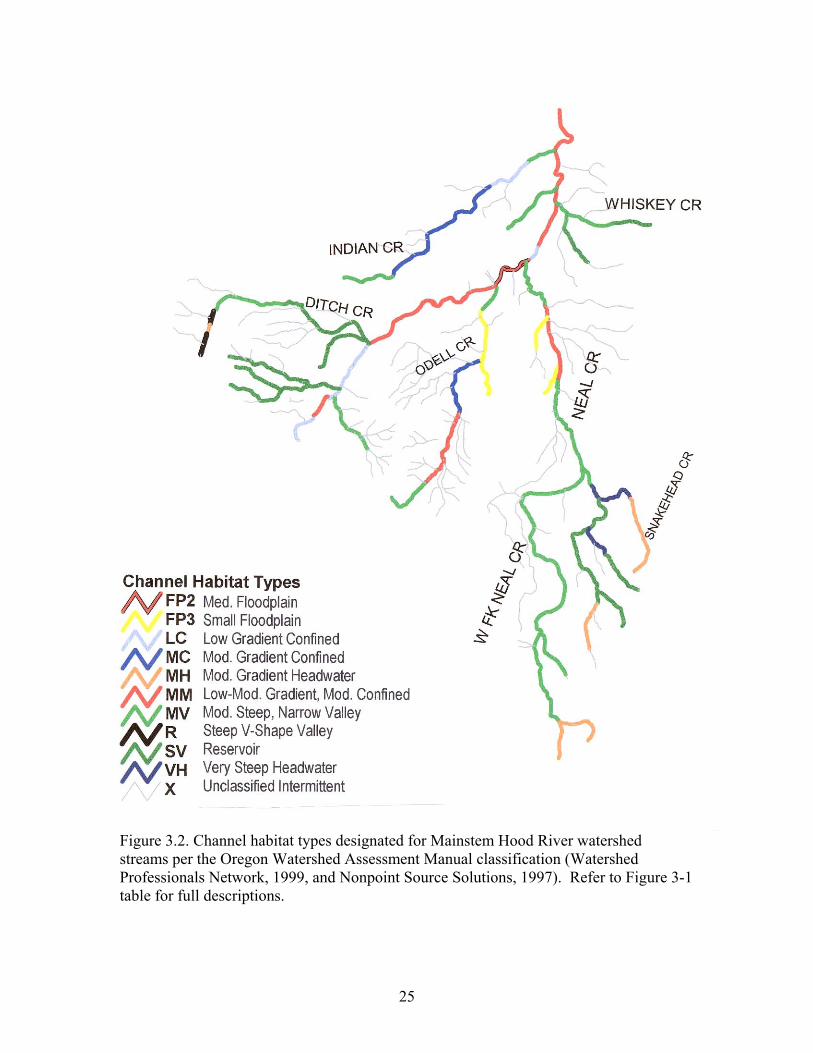
Figure 3.2. Channel habitat types designated for Mainstem Hood River watershed streams per the Oregon Watershed Assessment Manual classification (Watershed Professionals Network, 1999, and Nonpoint Source Solutions, 1997). Refer to Figure 3-1 table for full descriptions.
25
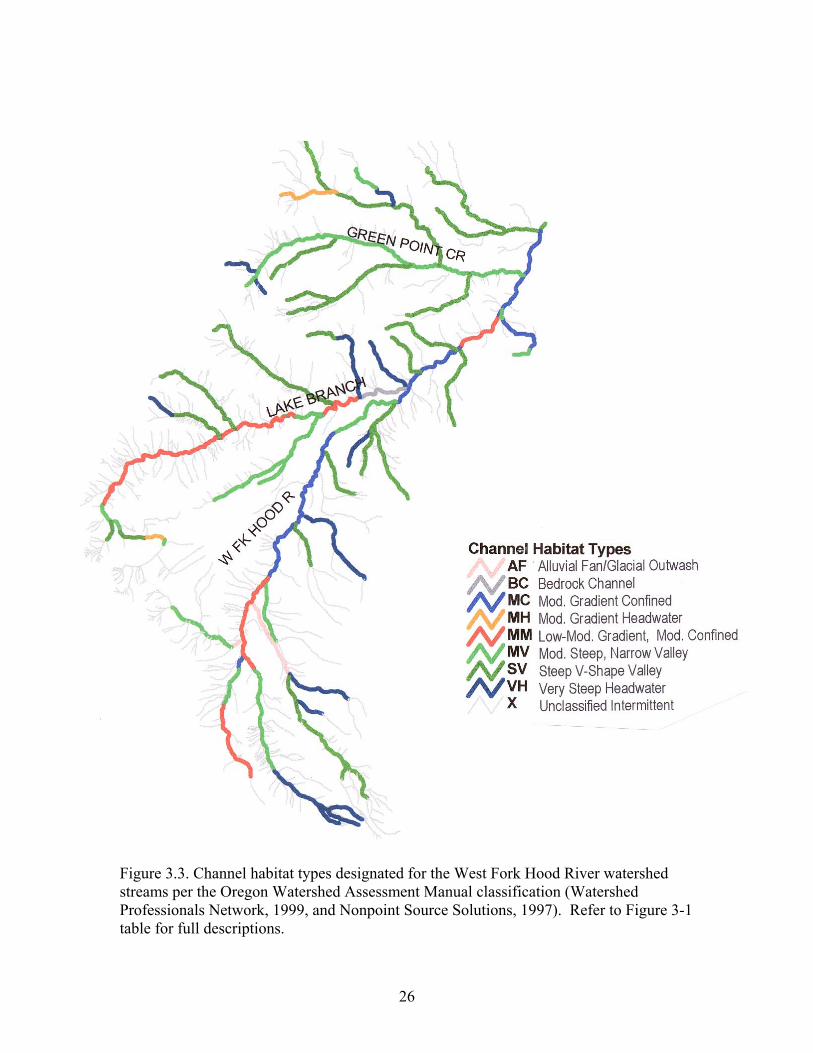
Figure 3.3. Channel habitat types designated for the West Fork Hood River watershed streams per the Oregon Watershed Assessment Manual classification (Watershed Professionals Network, 1999, and Nonpoint Source Solutions, 1997). Refer to Figure 3-1 table for full descriptions.
26
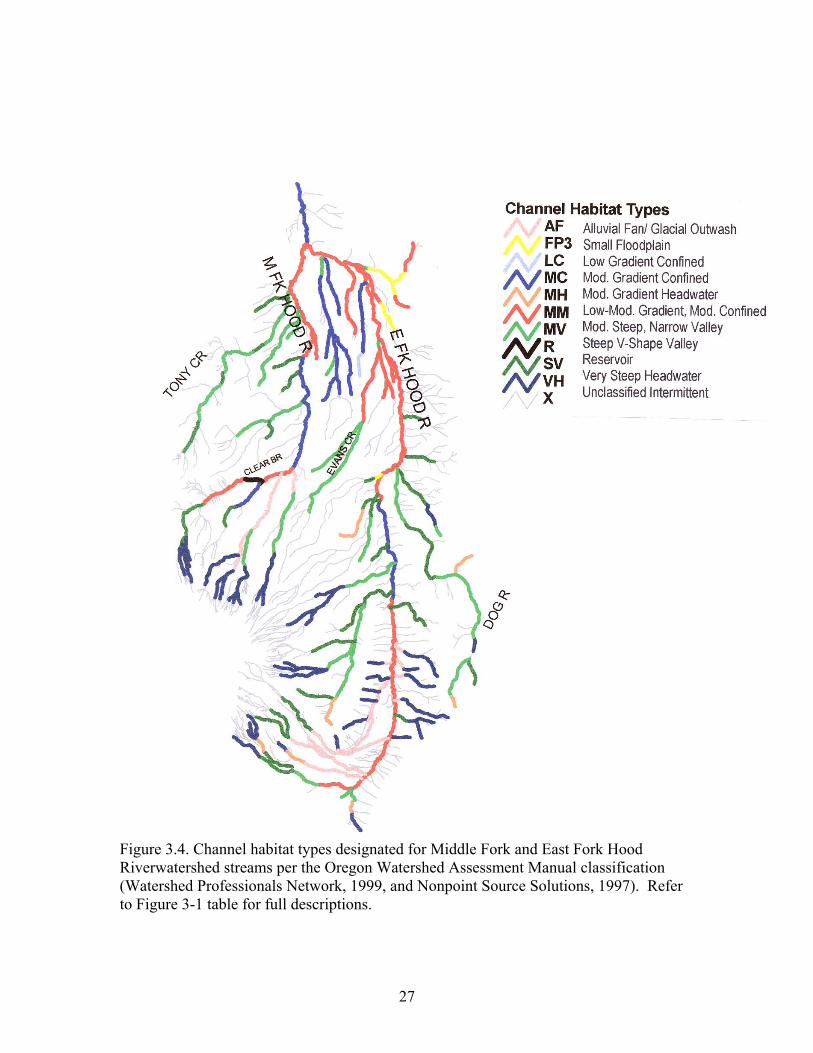
Figure 3.4. Channel habitat types designated for Middle Fork and East Fork Hood Riverwatershed streams per the Oregon Watershed Assessment Manual classification (Watershed Professionals Network, 1999, and Nonpoint Source Solutions, 1997). Refer to Figure 3-1 table for full descriptions.
27
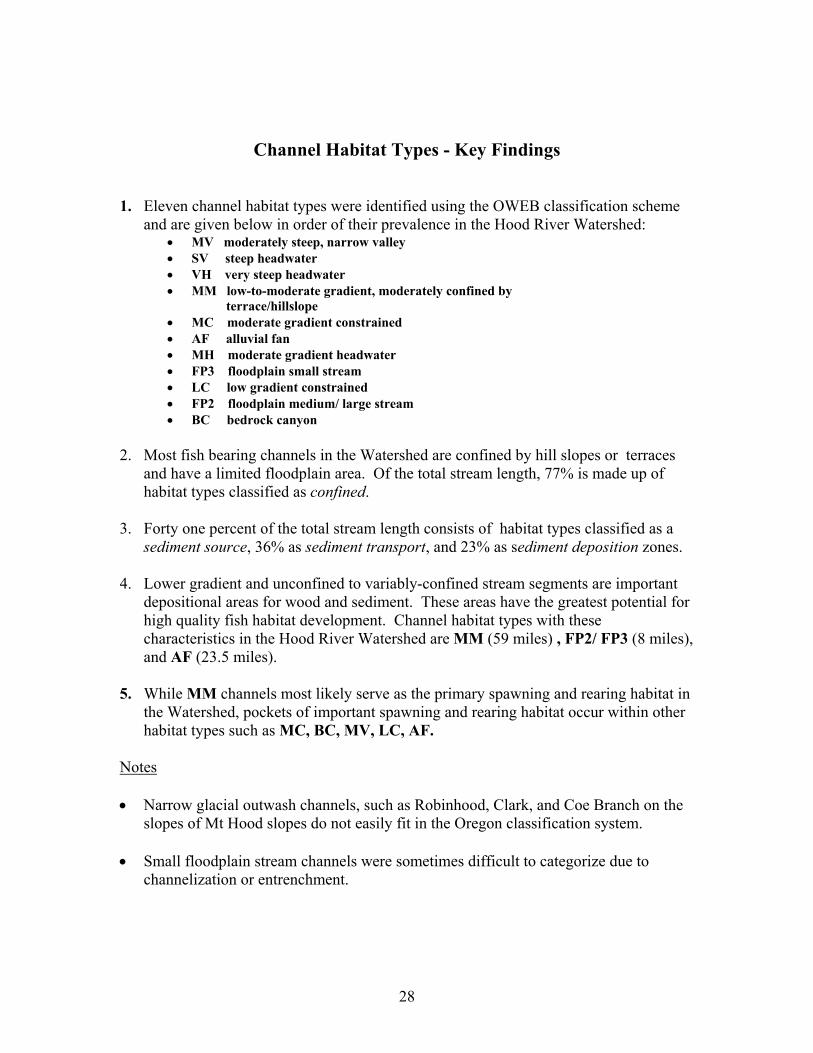
Channel Habitat Types - Key Findings 1. Eleven channel habitat types were identified using the OWEB classification scheme
and are given below in order of their prevalence in the Hood River Watershed: • MV moderately steep, narrow valley • SV steep headwater • VH very steep headwater • MM low-to-moderate gradient, moderately confined by
terrace/hillslope • MC moderate gradient constrained • AF alluvial fan • MH moderate gradient headwater • FP3 floodplain small stream • LC low gradient constrained • FP2 floodplain medium/ large stream • BC bedrock canyon
2. Most fish bearing channels in the Watershed are confined by hill slopes or terraces
and have a limited floodplain area. Of the total stream length, 77% is made up of habitat types classified as confined.
3. Forty one percent of the total stream length consists of habitat types classified as a
sediment source, 36% as sediment transport, and 23% as sediment deposition zones. 4. Lower gradient and unconfined to variably-confined stream segments are important
depositional areas for wood and sediment. These areas have the greatest potential for high quality fish habitat development. Channel habitat types with these characteristics in the Hood River Watershed are MM (59 miles) , FP2/ FP3 (8 miles), and AF (23.5 miles).
5. While MM channels most likely serve as the primary spawning and rearing habitat in
the Watershed, pockets of important spawning and rearing habitat occur within other habitat types such as MC, BC, MV, LC, AF.
Notes • Narrow glacial outwash channels, such as Robinhood, Clark, and Coe Branch on the
slopes of Mt Hood slopes do not easily fit in the Oregon classification system. • Small floodplain stream channels were sometimes difficult to categorize due to
channelization or entrenchment.
28
4. FISH POPULATION STATUS AND DISTRIBUTION
Anadromous Fish Introduction Anadromous salmonids present in the Hood River Watershed include chinook (Oncorynchus tshawytscha) and coho salmon (O. kisutch), sea run cutthroat trout (O. clarki) and steelhead trout (O. mykiss iridius). Pacific lamprey (Lamptera tridentata) are present below Powerdale Dam although none have been documented upstream in since the 1960s. Trap counts, catch data, anecdotal and historic accounts indicate that anadromous fish populations in the Hood River are less diverse and are severely depressed compared to historic levels. Since 1992, all adults migrating upstream into the Hood River have been trapped at Powerdale Dam (river mile 4.5) on a continuous basis by ODFW. Trap counts were made at the dam between 1963 and 1971 but these records are not complete (Pribyl, ODFW, pers com). Hood River indigenous coho, spring chinook and fall chinook stocks are extinct, and steelhead were listed as Threatened under the Endangered Species Act in 1998. Little is known about the status and distribution of sea run cutthroat trout.
An estimated 100 miles of stream in the Hood River Watershed are currently accessible to anadromous fish. In addition to the Mainstem and Forks, major tributaries accessible to anadromous fish include Green Point, Lake Branch, Ladd, Tony, Evans, Neal Creek and Dog River. A computer model developed by the Northwest Power Planning Council estimated the natural production potential of existing watershed habitat to be 24,000 spring chinook, 32,000 summer steelhead and 31,000 winter steelhead smolts annually (ODFW and CTWS 1990). The current smolt production is much lower - the total wild steelhead smolt outmigration was estimated at 6,313 to 13,222 per year between 1994 and 1997 (Olson and French 1998). The 1998 outmigration was notably higher - an estimated 24,485 wild steelhead smolts left the system by mid-June (ODFW, unpub. data, 1999). Hood River Production Program Description The Hood River Production Program (HRPP) is a major salmon and steelhead recovery effort initiated in the Hood River system in 1991. The HRPP is part of a program funded by the Bonneville Power Administration to mitigate impacts of the Columbia River hydrosystem on anadromous fish. The HRRP is jointly implemented by ODFW and CTWS. Its goals are to (1) establish naturally self-sustaining spring chinook salmon population in the Hood River subbasin using Deschutes River stock; (2) rebuild naturally self-sustaining runs of summer and winter steelhead; (3) maintain the genetic characteristics of wild anadromous populations; (4) restore degraded fish habitat; and (5) contribute to tribal and non-tribal fisheries, ocean fisheries, and the Northwest Power Planning Council interim goal of doubling Columbia Basin salmon runs (CTWS 1998). Monitoring and evaluation is a central program element and includes adult and juvenile trapping, creel surveys, spawning surveys, electrofishing, adult radiotracking and genetic
Fish Population Status and Distribution 29
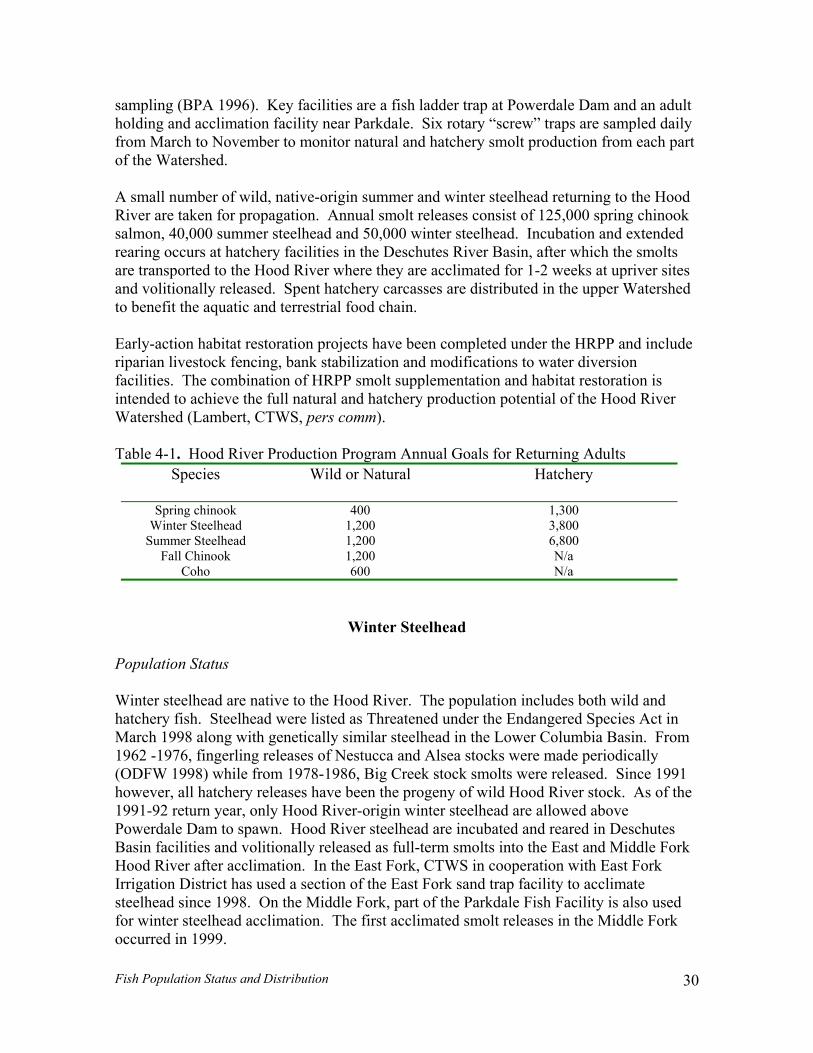
sampling (BPA 1996). Key facilities are a fish ladder trap at Powerdale Dam and an adult holding and acclimation facility near Parkdale. Six rotary “screw” traps are sampled daily from March to November to monitor natural and hatchery smolt production from each part of the Watershed. A small number of wild, native-origin summer and winter steelhead returning to the Hood River are taken for propagation. Annual smolt releases consist of 125,000 spring chinook salmon, 40,000 summer steelhead and 50,000 winter steelhead. Incubation and extended rearing occurs at hatchery facilities in the Deschutes River Basin, after which the smolts are transported to the Hood River where they are acclimated for 1-2 weeks at upriver sites and volitionally released. Spent hatchery carcasses are distributed in the upper Watershed to benefit the aquatic and terrestrial food chain. Early-action habitat restoration projects have been completed under the HRPP and include riparian livestock fencing, bank stabilization and modifications to water diversion facilities. The combination of HRPP smolt supplementation and habitat restoration is intended to achieve the full natural and hatchery production potential of the Hood River Watershed (Lambert, CTWS, pers comm). Table 4-1. Hood River Production Program Annual Goals for Returning Adults
Species
Wild or Natural Hatchery
Spring chinook 400 1,300 Winter Steelhead 1,200 3,800
Summer Steelhead 1,200 6,800 Fall Chinook 1,200 N/a
Coho 600 N/a
Winter Steelhead Population Status Winter steelhead are native to the Hood River. The population includes both wild and hatchery fish. Steelhead were listed as Threatened under the Endangered Species Act in March 1998 along with genetically similar steelhead in the Lower Columbia Basin. From 1962 -1976, fingerling releases of Nestucca and Alsea stocks were made periodically (ODFW 1998) while from 1978-1986, Big Creek stock smolts were released. Since 1991 however, all hatchery releases have been the progeny of wild Hood River stock. As of the 1991-92 return year, only Hood River-origin winter steelhead are allowed above Powerdale Dam to spawn. Hood River steelhead are incubated and reared in Deschutes Basin facilities and volitionally released as full-term smolts into the East and Middle Fork Hood River after acclimation. In the East Fork, CTWS in cooperation with East Fork Irrigation District has used a section of the East Fork sand trap facility to acclimate steelhead since 1998. On the Middle Fork, part of the Parkdale Fish Facility is also used for winter steelhead acclimation. The first acclimated smolt releases in the Middle Fork occurred in 1999.
Fish Population Status and Distribution 30
0
1 0 0
2 0 0
3 0 0
4 0 0
5 0 0
6 0 0
7 0 0
8 0 0
1 9 9 1 -9 2 1 9 9 2 -9 3 1 9 9 3 -9 4 1 9 9 4 -9 5 1 9 9 5 -9 6 1 9 9 6 -9 7 1 9 9 7 -9 8 1 9 9 8 -9 9R e tu rn Y e a r
Num
ber o
f Ret
urns
W ild
S tra y H a tc h e ry
H a tc h e ry
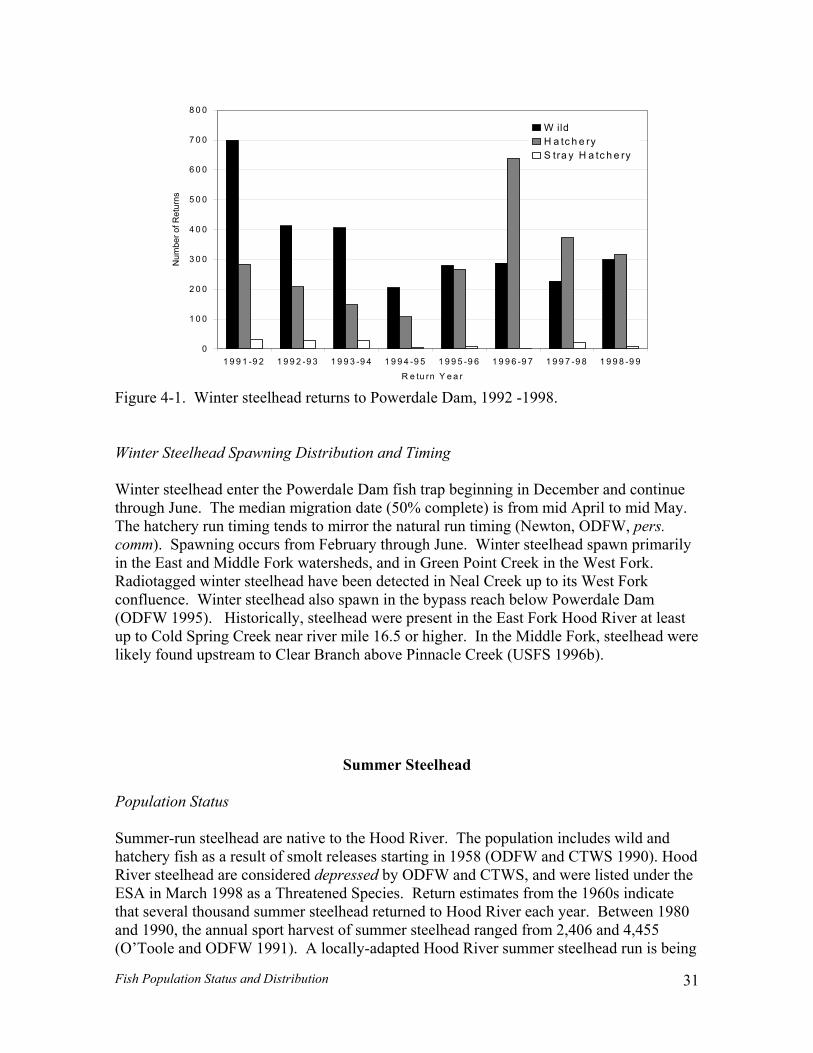
Figure 4-1. Winter steelhead returns to Powerdale Dam, 1992 -1998. Winter Steelhead Spawning Distribution and Timing Winter steelhead enter the Powerdale Dam fish trap beginning in December and continue through June. The median migration date (50% complete) is from mid April to mid May. The hatchery run timing tends to mirror the natural run timing (Newton, ODFW, pers. comm). Spawning occurs from February through June. Winter steelhead spawn primarily in the East and Middle Fork watersheds, and in Green Point Creek in the West Fork. Radiotagged winter steelhead have been detected in Neal Creek up to its West Fork confluence. Winter steelhead also spawn in the bypass reach below Powerdale Dam (ODFW 1995). Historically, steelhead were present in the East Fork Hood River at least up to Cold Spring Creek near river mile 16.5 or higher. In the Middle Fork, steelhead were likely found upstream to Clear Branch above Pinnacle Creek (USFS 1996b).
Summer Steelhead Population Status Summer-run steelhead are native to the Hood River. The population includes wild and hatchery fish as a result of smolt releases starting in 1958 (ODFW and CTWS 1990). Hood River steelhead are considered depressed by ODFW and CTWS, and were listed under the ESA in March 1998 as a Threatened Species. Return estimates from the 1960s indicate that several thousand summer steelhead returned to Hood River each year. Between 1980 and 1990, the annual sport harvest of summer steelhead ranged from 2,406 and 4,455 (O’Toole and ODFW 1991). A locally-adapted Hood River summer steelhead run is being
Fish Population Status and Distribution 31
developed from returning wild fish collected at the Dam. The first group of Hood River stock hatchery summer steelhead releases was made in 1999. Non-indigenous, i.e., out of basin stock hatchery summer steelhead have not been allowed above Powerdale Dam since August of 1997. Approximately 19,500 smolts were acclimated and volitionally released from a portable acclimation raceway on the upper West Fork Hood River. Approximately 40,000 Skamania stock hatchery smolts are released annually below the dam to provide fishing opportunity.
4 0 0
8 0 0
1 0 0 0
1 2 0 0
1 4 0 0
1 6 0 0
1 8 0 0
Num
ber o
f Ret
urns
W ild H a tc h e ry S tra y H a tc h e ry
6 0 0
0
2 0 0
1 9 9 2 -9 3 1 9 9 3 -9 4 1 9 9 4 -9 5 1 9 9 5 -9 6 1 9 9 6 -9 7 1 9 9 7 -9 8 1 9 9 8 -9 9R u n Y e a r
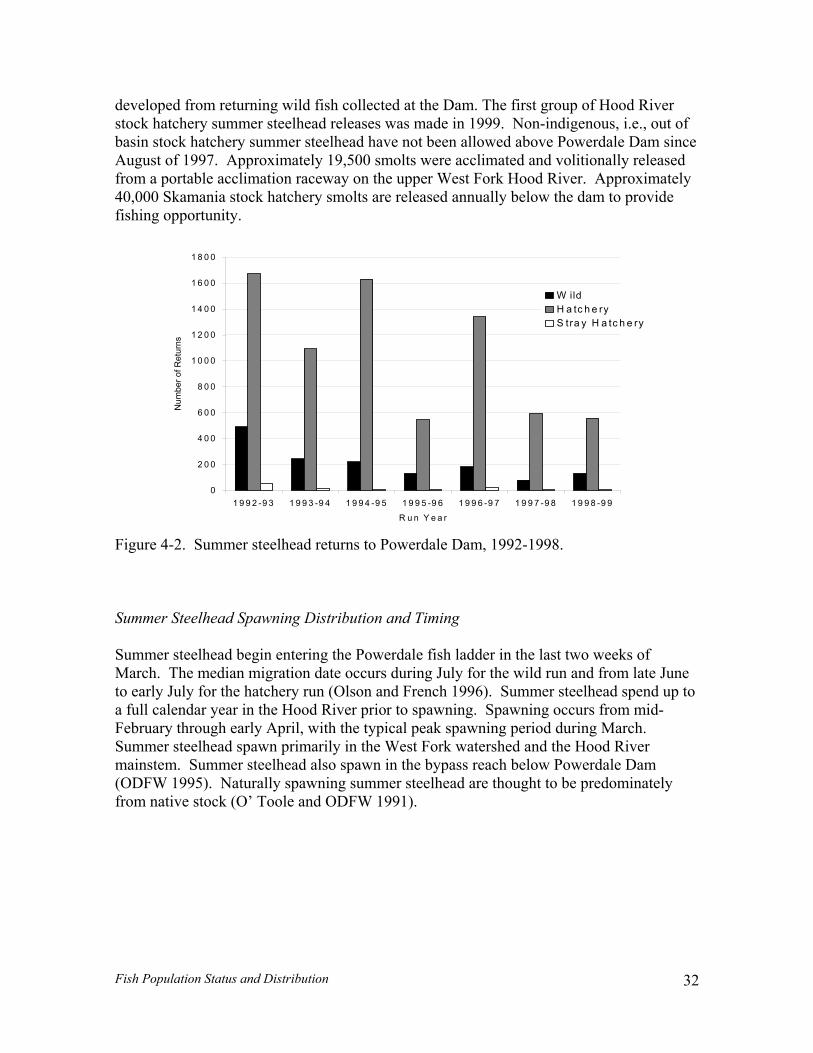
Figure 4-2. Summer steelhead returns to Powerdale Dam, 1992-1998. Summer Steelhead Spawning Distribution and Timing Summer steelhead begin entering the Powerdale fish ladder in the last two weeks of March. The median migration date occurs during July for the wild run and from late Junto early July for the h
e atchery run (Olson and French 1996). Summer steelhead spend up to
full calendar year in the Hood River prior to spawning. Spawning occurs from mid-February through early April, with the typical peak spawning period during March. Summer steelhead spawn primarily in the West Fork watershed and the Hood River mainstem. Summer steelhead also spawn in the bypass reach below Powerdale Dam (ODFW 1995). Naturally spawning summer steelhead are thought to be predominately from native stock (O’ Toole and ODFW 1991).
a
Fish Population Status and Distribution 32
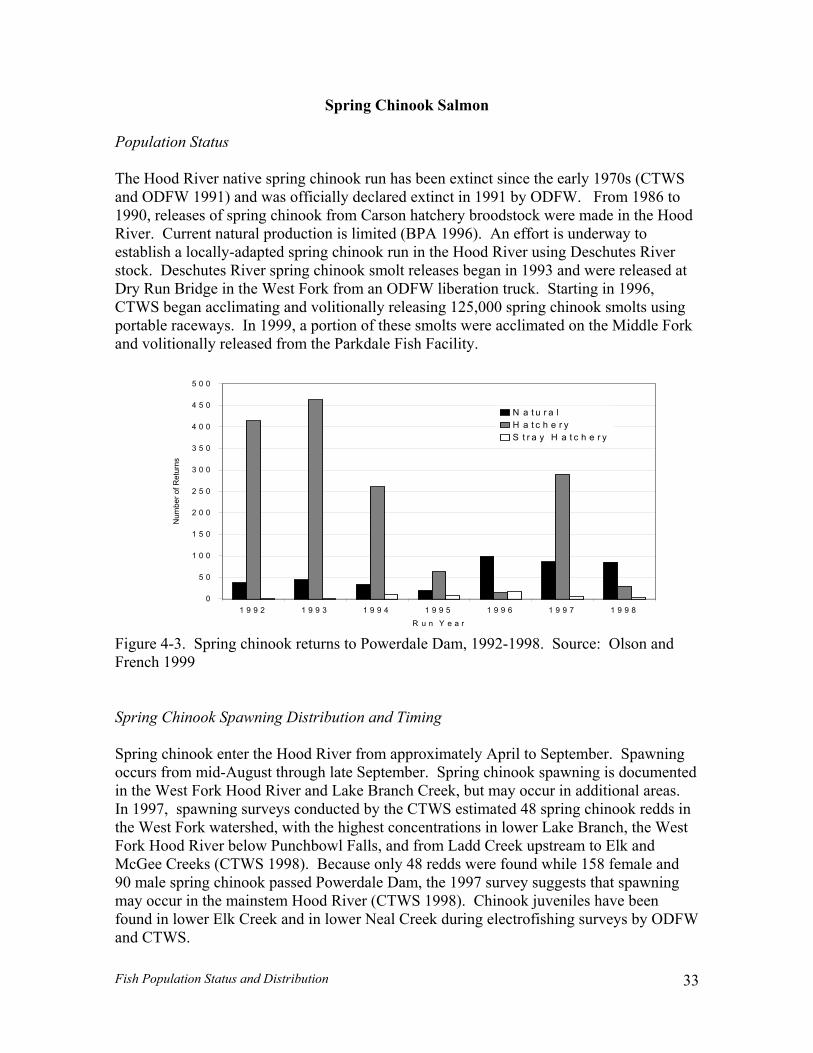
Spring Chinook Salmon Population Status The Hood River native spring chinook run has been extinct since the early 1970s (CTWS and ODFW 1991) and was officially declared extinct in 1991 by ODFW. From 1986 to 1990, releases of spring chinook from Carson hatchery broodstock were made in the Hood River. Current natural production is limited (BPA 1996). An effort is underway to establish a locally-adapted spring chinook run in the Hood River using Deschutes River stock. Deschutes River spring chinook smolt releases began in 1993 and were released at Dry Run Bridge in the West Fork from an ODFW liberation truck. Starting in 1996, CTWS began acclimating and volitionally releasing 125,000 spring chinook smolts using portable raceways. In 1999, a portion of these smolts were acclimated on the Middle Fork and volitionally released from the Parkdale Fish Facility.
2 5 0
3 5 0
4 0 0
5 0 0
Num
ber o
f Ret
urns
N a t u r a l H a t c h e r yS t r a y H a t c h e r y
4 5 0
3 0 0
0
5 0
1 0 0
1 5 0
2 0 0
1 9 9 2 1 9 9 3 1 9 9 4 1 9 9 5 1 9 9 6 1 9 9 7 1 9 9 8R u n Y e a r
Figure 4-3. Spring chinook returns to Powerdale Dam, 1992-1998. Source: Olson and rench 1999 F
S pring Chinook Spawning Distribution and Timing
pring chinook enter the Hood River from approximately April to September. Spawning ccurs from mid-August through late September. Spring chinook spawning is documented the West Fork Hood River and Lake Branch Creek, but may occur in additional areas. 1997, spawning surveys cond ed 48 spring chinook redds in e West Fork watershed, with th lower Lake Branch, the West
elow Punchbowl Falls, and from Ladd Creek upstream to Elk and WS 1998). Because only 48 redds were found while 158 female and
SoinIn ucted by the CTWS estimat
e highest concentrations in thFork Hood River b
cGee Creeks (CTM90 male spring chinook passed Powerdale Dam, the 1997 survey suggests that spawning may occur in the mainstem Hood River (CTWS 1998). Chinook juveniles have been found in lower Elk Creek and in lower Neal Creek during electrofishing surveys by ODFWand CTWS.
Fish Population Status and Distribution 33
Fall Chinook Salmon Population Status Fall chinook are native to the Hood River and occur in low numbers. Indigenous fall chinook are extinct and current natural production is believed to be the progeny of hatchery strays. Between 1992 and 1998, fall chinook escapements to the Powerdale trap have ranged from 6 to 36 naturally-produced fish with 2 to 7 hatchery strays (Olson and French 1999). No hatchery releases of fall chinook are made in the Hood River. Fall Chinook Spawning Distribution and Timing Natural fall chinook enter the Hood River from early July through October, and spawn in late September through early November. The majority of fall chinook entering the Hood River spawn below Powerdale Dam, with some spawning in the East Fork Hood River (BPA 1996). Juvenile chinook have been found in Neal Creek.
opulation Status
esent in low numbers. Hood River nd lower Columbia River coho are classified as a sensitive species by ODFW. The
h
ng Distribution and Run Timing
oho enter the Hood River from September to December (ODFW 1998). Coho spawn in e Hood River mainstem above and below Powerdale Dam, in the mouth of Whiskey
Creek, in Neal Creek, the East For butaries and the Middle Fork ood River. Adult coho have been observed in Dog River. Coho spawning distribution in
likely more extensive under pre-development conditions than it is today. oho spawning was documented during the mid-1960s in Clear Branch within the stream
reach now inundated by Laurance Lake (USFS 1996b). An early account in the Glacier
Coho Salmon P Coho salmon are native to the Hood River and are praindigenous population of coho salmon is determined to be extinct by ODFW (BPA 1996). For the 1992 to 1998 run years, coho salmon escapements to Powerdale Dam ranged from 0-24 naturally produced fish and from 6-79 hatchery strays (Olson and French 1996). Natural coho returning to the Hood River are believed to be the progeny of hatchery strays.Hatchery coho juveniles were released in the basin in 1967, 1971 and 1977. Coho juveniles have been found in the East Fork Hood River, East Fork Irrigation Canal fissalvages, Baldwin, Neal, and Lenz creeks and the Hood River mainstem (Olsen et al. 1996). Coho Spawni Cth
k Hood River and its triHthe watershed was C
Fish Population Status and Distribution 34
newspaper October 20, 1899, reported “salmon trout” caught in the mouth of Neal Crein October (Krussow 1989), suggesting that coho used Neal Creek in larger numbers. East Fork tributaries such as Evans, Emil, Griswell, and Wishart Creeks potentially support some coho spawning and/or rearing.
ek
oastal cutthroat trout are native to the watershed, and are most numerous as resident fish the upper tributaries of the East Fork. The anadromous form of cutthroat may be
everely depressed in the Hood River. Juvenile plants of sea-run cuthhroat from various hatchery stocks were made in the wate 973-1988 (BPA 1996). Sea-run utthroat are listed as a sensitive species by ODFW. In 1992, five adult sea run cutthroat
dale Dam and three were counted by ODFW in 1997, otherwise recent turns have been zero. In 1995 and 1996, only 16 and 24 downstream migrant cutthroat
in the
ge.
River Lamprey
acific lamprey (Lamptera tridentata) are an anadromous fish and a culturally important
Sea-Run Cutthroat Trout Population Status Cins
rshed between 1ctrout passed Powerrewere captured in the migrant traps. Sea-run Cutthroat Trout Spawning Distribution and Timing The present or historic spawning distribution of sea-run cutthroat trout is unknown. One anecdotal account suggests a large run of sea run cutthroat trout used Shelley Creekearly part of the century (P. Moore, Moore Orchards, pers. comm). Shelley Creek is a small eastern tributary to Neal Creek a quarter mile below the Fir Mountain Road brid
Pfood to Native Americans. A 1963 Oregon State Game Commission report noted that lamprey were found “throughout the basin” (USFS 1996a). It is believed that their numbers have declined dramatically compared to historic population levels (BPA 1996).Lamprey are reported as extirpated from the West Fork watershed (USFS 1996a). Lamprey have been observed in recent years below the Powerdale Dam (PacifCorp 1998; Jennings, CTWS, pers. comm).
Fish Population Status and Distribution 35
Resident Salmonids
out in Oregon (Spruell and Allendorf 1997). The ood River bull trout population, including juveniles, is believed to number less than 300,
nd is classified as “at high risk of extinction” by ODFW (Buchanan et al. 1997).
ull trout are primarily found in the headwater streams of the Middle Fork within the Mt.
olcanic activity affecting the Middle Fork basin (Pribyl et al. 1996).
Since 1991, the Forest Service and O om Middle Fork Irrigation District ave monitored the number, distribution and life history of bull trout. Information is
by U.S.
r.
eshwater throughout their life history and exhibit 3 life istory patterns represented by fluvial, adfluvial and resident fish. A fluvial population
migrates between small tributaries used for spawning and early rearing, using larger treams such as the main forks, mainstem Hood River and the Columbia River for late venile or adult rearing. An adfluvial population spawns and rears in small streams and
ses Laurance Lake for late or adult rearing. Resident bull trout generally confine their igrations within their natal stream (Buchanan et al. 1997).
dult bull trout were captured in low numbers at Powerdale Dam from 1962 to 1971, uggesting that a small fluvial population has existed in the mainstem for years (Pribyl et l. 1995). An adult bull trout was captured in the West Fork at Punchbowl Falls in 1963, hile other sightings were made in Evans Creek and Lake Branch in the 1990s. An adult
bull trout was radio-tracked in and out of Tony Creek in 1998. Most bull trout trapped at owerdale Dam eventually move up into the Middle Fork (Fieldler, USFS, pers comm).
Bull Trout Bull trout (Salvelinus confluentus) are native to the Hood River Watershed and are a species of special concern. Bull trout were listed under the Endangered Species Act as a Threatened Species in 1998. DNA analysis found that Hood River bull trout are genetically distinct from other bull trHa BHood National Forest. The largest proportion of the population are found in Clear Branchabove the Dam and in Laurance Lake itself. Bull trout are also observed in Pinnacle, Compass, Coe, Eliot and lower Clear Branch Creeks. Their narrow distribution in the watershed makes bull trout vulnerable to a catastrophic event such as a major wild fire or v
DFW with help frhcollected in adult traps at Powerdale and Clear Branch Dams, juvenile migrant traps, snorkel surveys, and radio telemetry. A Bull Trout Conservation Plan is being preparedthe interagency Hood Basin Bull Trout Working Group, and a Recovery Plan by the Fish and Wildlife Service is required under ESA. Oregon State Police fisheries enforcement targets bull trout protection along with other species in the Hood Rive Hood River bull trout remain in frh
sjuum Asaw
P
Fish Population Status and Distribution 36
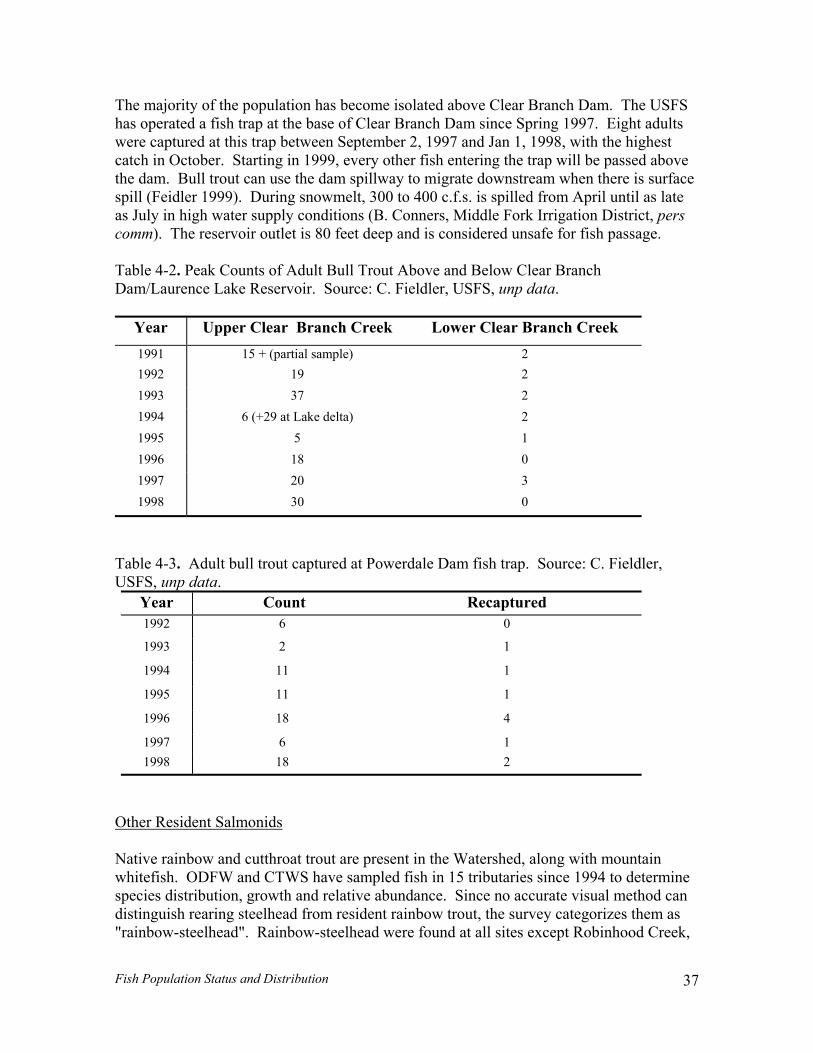
The majority of the population has beco bove Clear Branch Dam. The USFS as operated a fish trap at the base of Clear Branch Dam since Spring 1997. Eight adults
t
s surface te
e.
me isolated ahwere captured at this trap between September 2, 1997 and Jan 1, 1998, with the highescatch in October. Starting in 1999, every other fish entering the trap will be passed abovethe dam. Bull trout can use the dam spillway to migrate downstream when there ispill (Feidler 1999). During snowmelt, 300 to 400 c.f.s. is spilled from April until as laas July in high water supply conditions (B. Conners, Middle Fork Irrigation District, pers comm). The reservoir outlet is 80 feet deep and is considered unsafe for fish passag Table 4-2. Peak Counts of Adult Bull Trout Above and Below Clear Branch Dam/Laurence Lake Reservoir. Source: C. Fieldler, USFS, unp data.
Year Upper Clear Branch Creek Lower Clear Branch Creek 1991 15 + (partial sample) 2 1992 19 2 1993 37 2 1994 6 (+29 at Lake delta) 2 1995 5 1 1996 18 0 1997 20 3 1998 30 0
Table 4-3. Adult bull trout captured at Powerdale Dam fish trap. Source: C. Fieldler, USFS, unp data.
Year Count Recaptured 1992 6 0
1993 2 1
1994 11 1
1995 11 1
1996 18 4
1997 6 1 1998 18 2
Other Resident Salmonids Native rainbow and cutthroat trout are present in the Watershed, along with mountain whitefish. ODFW and CTWS have sampled fish in 15 tributaries since 1994 to determine species distribution, growth and relative abundance. Since no accurate visual method can distinguish rearing steelhead from resident rainbow trout, the survey categorizes them as "rainbow-steelhead". Rainbow-steelhead were found at all sites except Robinhood Creek,
Fish Population Status and Distribution 37
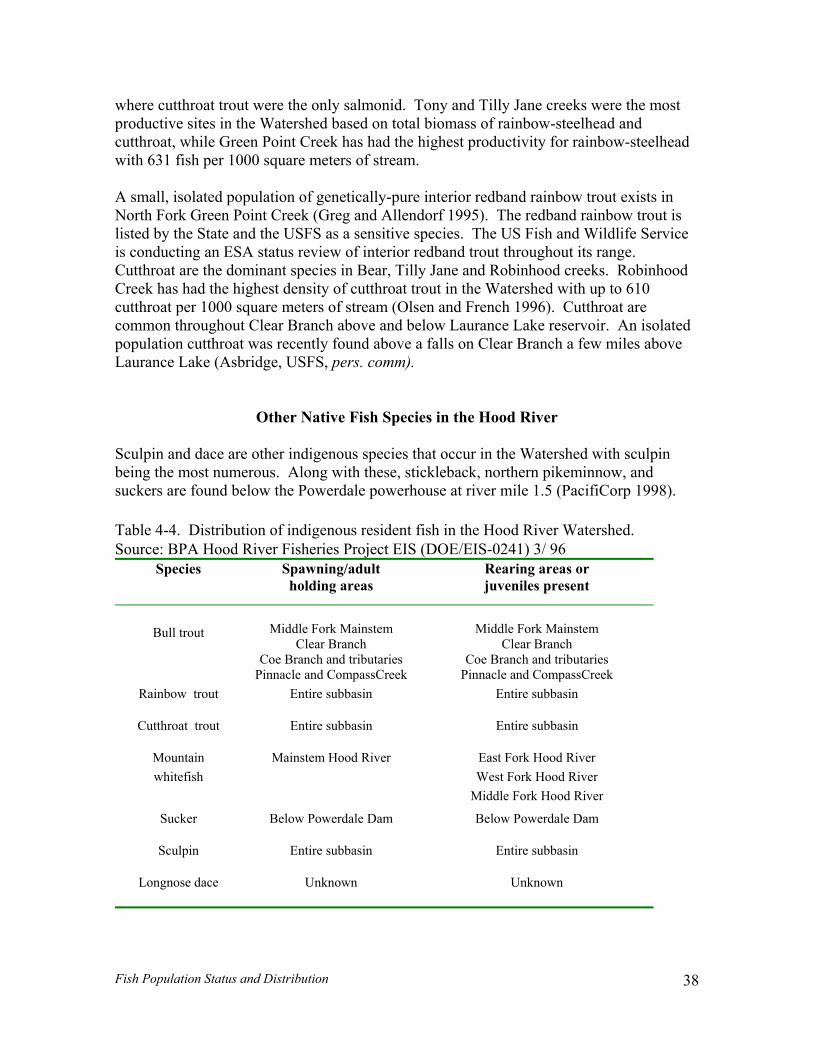
where cutthroat trout were the only salmonid. Tony and Tilly Jane creeks were the most productive sites in the Watershed based on total biomass of rainbow-steelhead and cutthroat, while Green Point Creek has had the highest productivity for rainbow-steelhead
small, isolated population of genetically-pure interior redband rainbow trout exists in No k G endo trout is listed by the State and the USFS as a sensitive species. The US Fish and Wildlife Service is conducting an ESA status review of interior redband trout throughout its range. Cutthroat are the dominant species in Bear, Tilly Jane and Robinhood creeks. Robinhood Creek has had the highest density of cutthroat trout in the Watershed with up to 610 cut per 1000 s eam (Olsen and French 1996). Cutthroat are common throughout Clear Branch above and below Laurance Lake reservoir. An isolated population cutthroat was recently found above a falls on Clear Branch a few miles above Laurance Lake (Asbridge, USFS, pers. comm).
Other Native Fish Species in the Hood River
merous. Along with these, stickleback, northern pikeminnow, and suckers are found below the Powerdale powerhouse at river mile 1.5 (PacifiCorp 1998). Table 4-4. Distribution of indigenous resident fish in the Hood River Watershed. Source: BPA Hood River Fisheries Project EIS (DOE/EIS-0241) 3/ 96
cies
awning/adult olding areas
Rearing areas or juveniles present
with 631 fish per 1000 square meters of stream. A
rth For reen Point Creek (Greg and All rf 1995). The redband rainbow
throat quare meters of str
Sculpin and dace are other indigenous species that occur in the Watershed with sculpin being the most nu
Spe Sph
Bull id
e Br
le Clean
trout
M dle Fork Mainstem
Clear Branch Co anch and tributaries
Pinnacle and CompassCreek
Midd Fork Mainstem
ar Branch Coe Br ch and tributaries
Pinnacle and CompassCreek Rainbow trout Entire subbasin Entire subbasin
Cutthroat trout Entire subbasin Entire subbasin
Mountain whitefish
Mainstem Hood River
East Fork Hood River West Fork Hood River
Middle Fork Hood River
Sucker Below Powerdale Dam Below Powerdale Dam
Sculpin Entire subbasin Entire subbasin
Longnose dace Unknown Unknown
Fish Population Status and Distribution 38
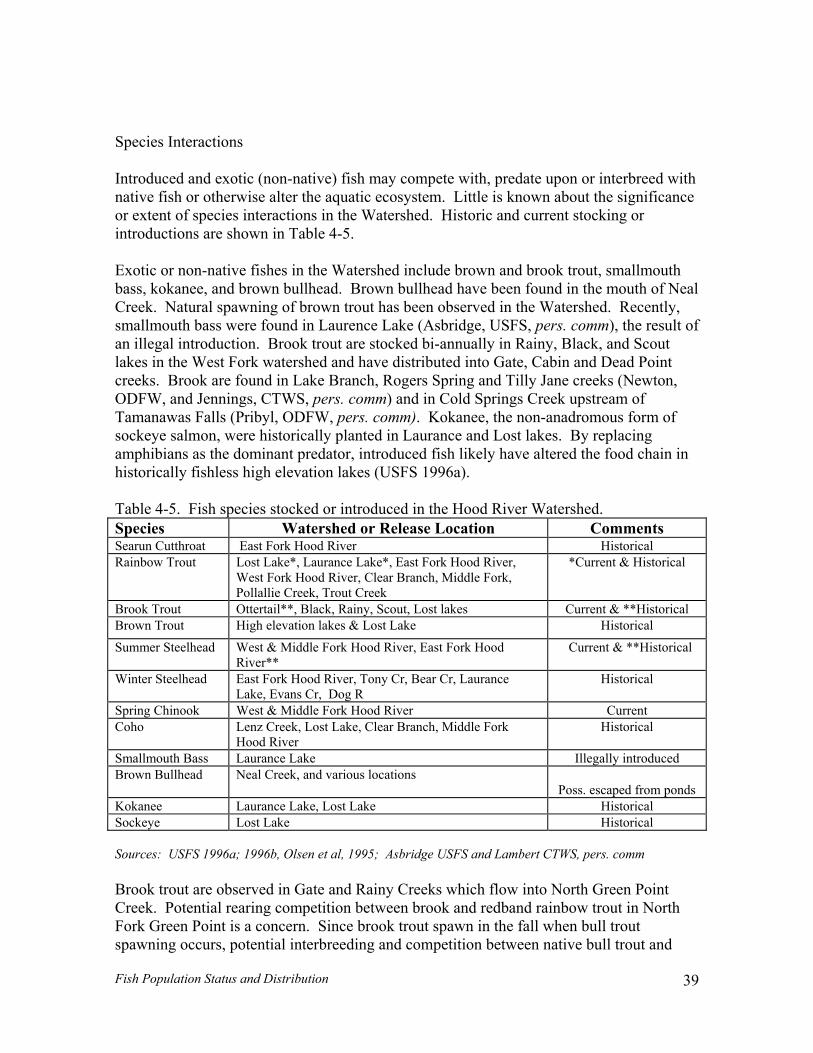
Species Interactions Introduced and exotic (non-native) fish may compete with, predate upon or interbreed withnative fish or otherwise alter the aquatic ecosystem. Little is known about the signifior extent of species interactions in the Watershed. Historic and current stocking or introductions are shown in Table 4-5. Exotic or non-native fishes in the Watershed inc
cance
lude brown and brook trout, smallmouth ss, kokanee, and brown bullhead. Brown bullhead have been found in the mouth of Neal
Creek. Natural spawning of brown trout has been observed in the Watershed. Recently, smallmouth bass were comm), the result of n illegal introduction. Brook trout are stocked bi-annually in Rainy, Black, and Scout
n,
amanawas Falls (Pribyl, ODFW, pers. comm). Kokanee, the non-anadromous form of g
the food chain in histori hless high elevation lakes (USFS 1996a). Table 4-5. Fish species stocked or introduced in the Hood River Watershed. Species lease Locat mments
ba
found in Laurence Lake (Asbridge, USFS, pers.alakes in the West Fork watershed and have distributed into Gate, Cabin and Dead Point creeks. Brook are found in Lake Branch, Rogers Spring and Tilly Jane creeks (NewtoODFW, and Jennings, CTWS, pers. comm) and in Cold Springs Creek upstream of Tsockeye salmon, were historically planted in Laurance and Lost lakes. By replacinamphibians as the dominant predator, introduced fish likely have altered
cally fis
Watershed or Re ion Co Cutthroat Fork Hood River Hi
t Lake*, Laurance Lake*, Ea od River, *Currentst Fork Hood River, Clear Bran ddle Fork,
reek, Trout Creeok Trout *, Black, Rainy, S Curwn Trout ation lakes & Lost
* Steelhead urance Historical
CuCreek, Lost Lake, Clear B e Fork Historical
outh Bass Lake Ill
Po
Searun East storical Rainbow Trout Los st Fork Ho
We ch, MiPollallie C k
& Historical
Bro Ottertail* cout, Lost lakes rent & **Historical Bro High elev Lake Historical
Summer Steelhead West & Middle Fork Hood River, East Fork Hood River*
Current & **Historical
Winter East Fork Hood River, Tony Cr, Bear Cr, LaLake, Evans Cr, Dog R
Spring Chinook West & Middle Fork Hood River rrent Coho Lenz ranch, Middl
Hood River Smallm Laurance egally introduced Brown Bullhead Neal Creek, and various locations
ss. escaped from ponds Kokanee Laurance Lake, Lost Lake Historical Sockeye Lost Lake Historical Sources: USFS 1996a; 1996b, Olsen et al, 1995; Asbridge USFS and Lambert CTWS, pers. comm
ved in Gate and Rainy Creeks which flow into North Green Point ing competition between brook and redband rainbow trout in North
ork Green Point is a concern. Since brook trout spawn in the fall when bull trout spawning occurs, potential interbreeding and competition between native bull trout and
Brook trout are obser
reek. Potential rearCF
Fish Population Status and Distribution 39
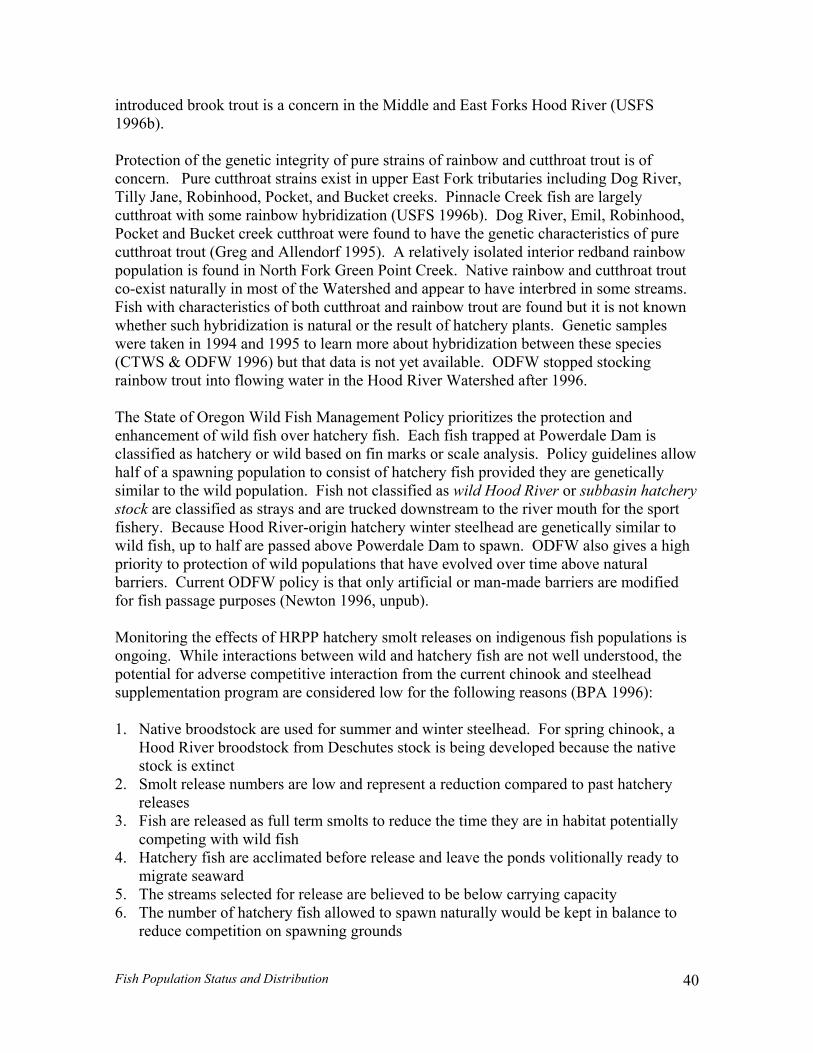
introduced brook trout is a concern in the Middle and East Forks Hood River (USFS 1996b). Protection of the genetic integrity of pure strains of rainbow and cutthroat trout is of
ncern. Pure cutthroat strains exist in upper East Fork tributaries including Dog River,
t
he State of Oregon Wild Fish Management Policy prioritizes the protection and Dam is
as hatchery or wing t of hatchery fish provided they are g
wild River o stock are classified river mouth for the sport
cause H lhead are gen to hal Dam to spawn. ODFW also gives a high
priority to protection of wild populations that have evolved over time above natural O ade ba
pu
eff releases on indigenous fish p ns is ng. While in e not well un the
potential for adver ive interaction from the current chinook and steelhead p the following reasons
e broodst River bro rom Deschutes stock is being developed because the native
stock is extinct ery
releases
y to
mber of hatchery fish allowed to spawn naturally would be kept in balance to reduce competition on spawning grounds
coTilly Jane, Robinhood, Pocket, and Bucket creeks. Pinnacle Creek fish are largely cutthroat with some rainbow hybridization (USFS 1996b). Dog River, Emil, Robinhood, Pocket and Bucket creek cutthroat were found to have the genetic characteristics of pure cutthroat trout (Greg and Allendorf 1995). A relatively isolated interior redband rainbow population is found in North Fork Green Point Creek. Native rainbow and cutthroat trouco-exist naturally in most of the Watershed and appear to have interbred in some streams. Fish with characteristics of both cutthroat and rainbow trout are found but it is not knownwhether such hybridization is natural or the result of hatchery plants. Genetic samples were taken in 1994 and 1995 to learn more about hybridization between these species (CTWS & ODFW 1996) but that data is not yet available. ODFW stopped stocking rainbow trout into flowing water in the Hood River Watershed after 1996. Tenhancement of wild fish over hatchery fish. Each fish trapped at Powerdale classified ild based on fin marks or scale analysis. Policy guidelines allow half of a spawn population to consis eneticallysimilar to the population. Fish not classified as wild Hood
as strays and are trucked downstream to ther subbasin hatchery
fishery. Be ood River-origin hatchery winter stee etically similar to wild fish, up f are passed above Powerdale
barriers. Current DFW policy is that only artificial or man-m rriers are modified for fish passage rposes (Newton 1996, unpub).
Monitoring the ects of HRPP hatchery smolt opulatioongoi teractions between wild and hatchery fish ar
se competitderstood,
supplementation rogram are considered low for (BPA 19 6): 9
1. Nativ ock are used for summer and winter steelhead. For spring chinook, a Hood odstock f
2. Smolt release numbers are low and represent a reduction compared to past hatch
3. Fish are released as full term smolts to reduce the time they are in habitat potentiallycompeting with wild fish
4. Hatchery fish are acclimated before release and leave the ponds volitionally readmigrate seaward
5. The streams selected for release are believed to be below carrying capacity 6. The nu
Fish Population Status and Distribution 40
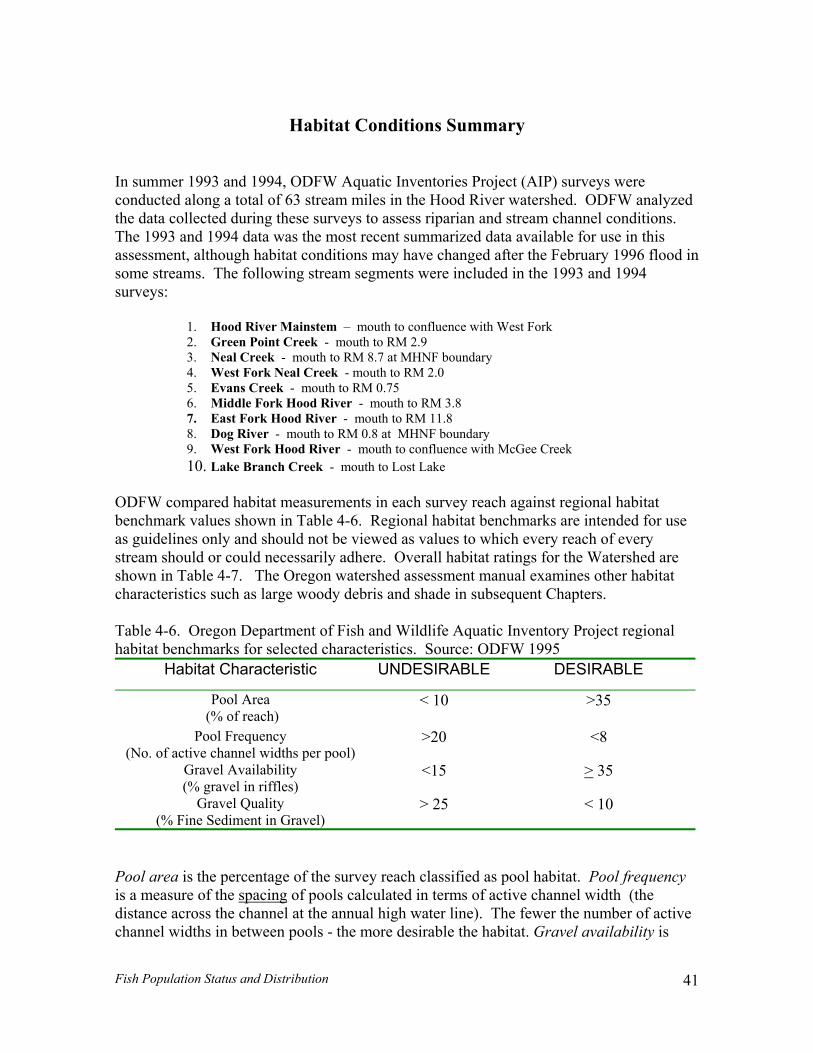
Habitat Conditions Summary
In summer 1993 and 1994, ODFW Aquatic Inventories Project (AIP) surveys were conducted along a total of 63 stream miles in the Hood River watershed. ODFW analyzedthe data collected during these surveys to assess riparian and stream channel conditions. The 1993 and 1994 data was the most recent summarized data available for use in this assessment, although habitat conditions may have changed after the February 1996 flood insome streams. The following stream segments were included in the 1993 and 1994 surveys:
1. Hood River Mainstem – mouth to confluence with West Fork
2. Green Point Creek - mouth to RM 2.9
t
tream should or could necessarily adhere. Overall habitat ratings for the Watershed are
al abitat benchmarks for selected characteristics. Source: ODFW 1995
3. Neal Creek - mouth to RM 8.7 at MHNF boundary 4. West Fork Neal Creek - mouth to RM 2.0 5. Evans Creek - mouth to RM 0.75 6. Middle Fork Hood River - mouth to RM 3.8 7. East Fork Hood River - mouth to RM 11.8 8. Dog River - mouth to RM 0.8 at MHNF boundary 9. West Fork Hood River - mouth to confluence with McGee Creek 10. Lake Branch Creek - mouth to Lost Lake
ODFW compared habitat measurements in each survey reach against regional habitabenchmark values shown in Table 4-6. Regional habitat benchmarks are intended for useas guidelines only and should not be viewed as values to which every reach of every sshown in Table 4-7. The Oregon watershed assessment manual examines other habitat characteristics such as large woody debris and shade in subsequent Chapters. Table 4-6. Oregon Department of Fish and Wildlife Aquatic Inventory Project regionh
Habitat Characteristic UNDESIRABLE DESIRABLE
Pool Area (% of
< 10 >35 reach)
Pool Frequency >20 <8 (No. of active channel widths per pool)
Gravel Availability (% gravel in riffles)
<15 > 35
Gravel Quality (% Fine Sedime
> 25 < 10 nt in Gravel)
l area is the percentage of the survey reachPoo classified as pool habitat. Pool frequency is a measure of the spacing of pools calculated in terms of active channel width (the distance across the channel at the annual high water line). The fewer the number of active channel widths in between pools - the more desirable the habitat. Gravel availability is
Fish Population Status and Distribution 41
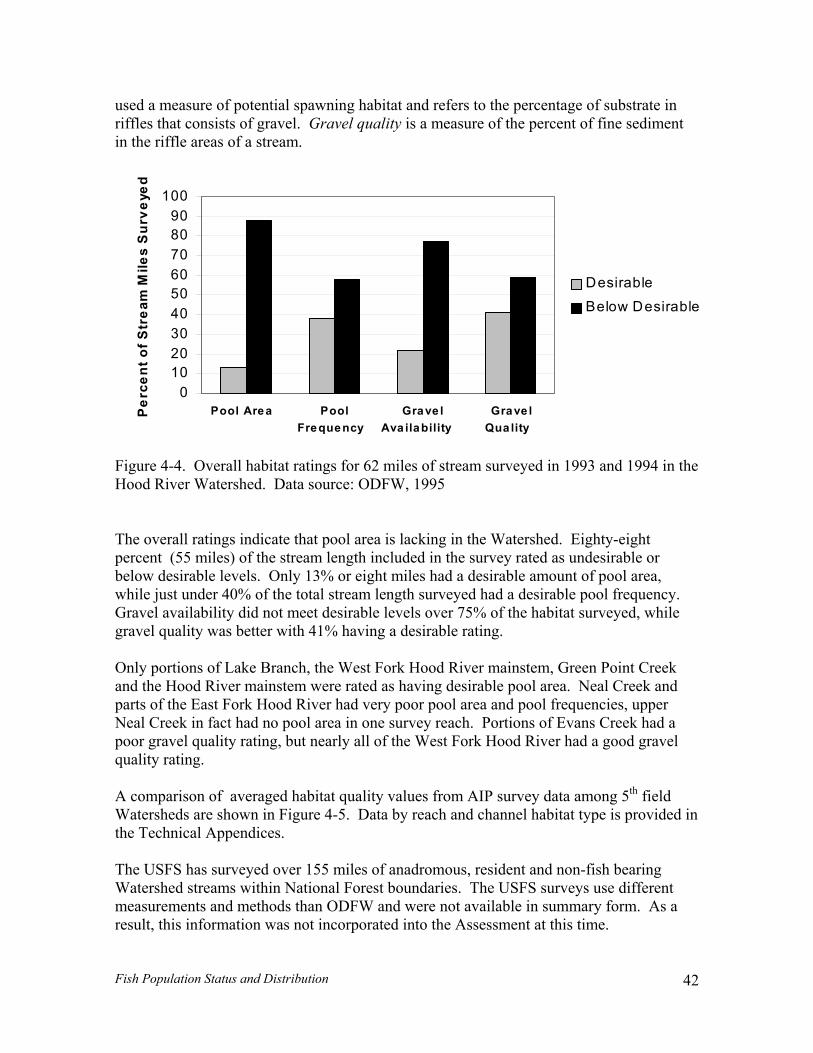
used a measure of potential spawning habitat and refers to the percentage of substrate in riffles that consists of grav ercent of fine sediment
the riffle areas of a stream. el. Gravel quality is a measure of the p
in
010203040
Grave la lity
Per
cent
of S
trea Below Desirable
5060708090
100
m M
iles
Sur
veye
d
Desirable
Pool Area Pool Grave lFrequency Ava ilability Qu
Figure 4-4. eam surveyed in 1993 and 1994 in the ood River Watershed. Data source: ODFW, 1995
quency. ravel availability did not meet desirable levels over 75% of the habitat surveyed, while
Only po e West ainstemand the Hood River mainstem were rated as having desirable pool area. Neal Creek and parts of the East Fork Hood River had very poor pool area and pool frequencies, upper Neal Creek in ool area in one survey reach. Portions of Evans Creek had a poor gravel quality rating, but nearly all of the West Fork Hood River had a good gravel q A comparison of averaged habitat quality values from AIP survey data a 5th field Water -5. Data by r nd channel habitat type is provided in
e Technical Appendices.
nt
Overall habitat ratings for 62 miles of strH The overall ratings indicate that pool area is lacking in the Watershed. Eighty-eight percent (55 miles) of the stream length included in the survey rated as undesirable or below desirable levels. Only 13% or eight miles had a desirable amount of pool area, while just under 40% of the total stream length surveyed had a desirable pool freGgravel quality was better with 41% having a desirable rating.
rtions of Lake Branch, th Fork Hood River m , Green Point Creek
fact had no p
uality rating.
mong sheds are shown in Figure 4 each a
th The USFS has surveyed over 155 miles of anadromous, resident and non-fish bearing Watershed streams within National Forest boundaries. The USFS surveys use differemeasurements and methods than ODFW and were not available in summary form. As a result, this information was not incorporated into the Assessment at this time.
Fish Population Status and Distribution 42
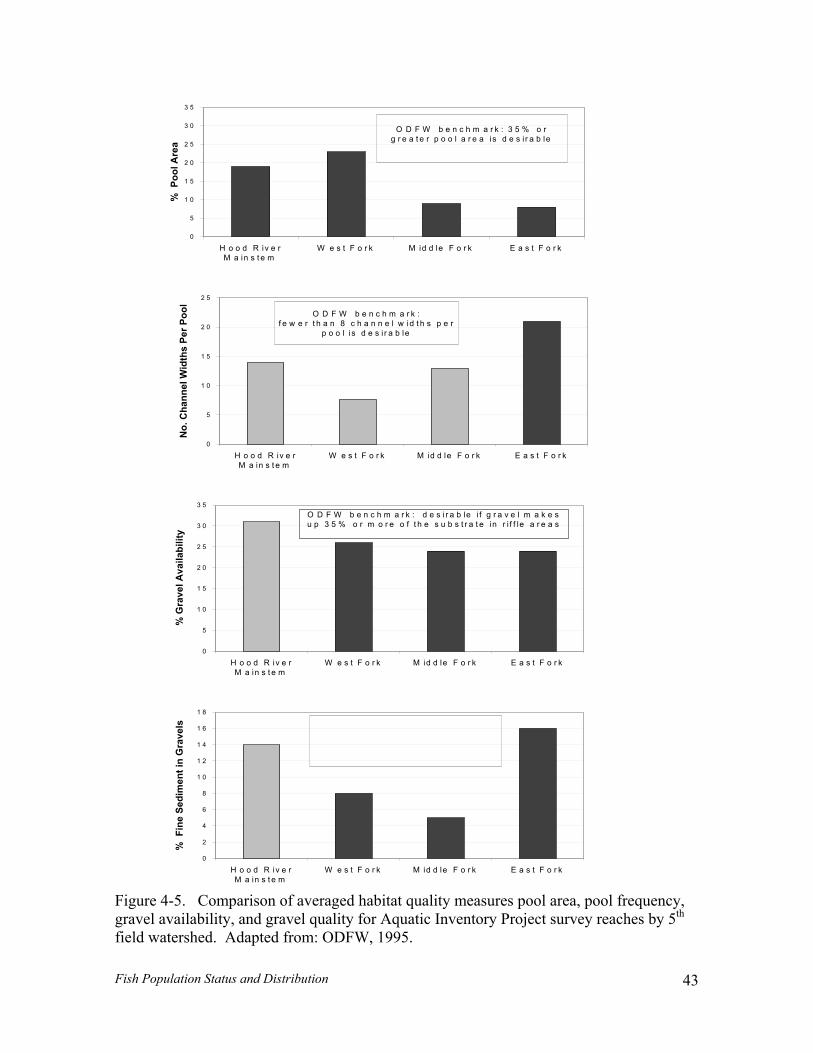
0
5
1 0
1 5
2 0
H o o d R iv e rM a in s t e m
W e s t F o r k M id d le F o r k E a s t F o r k
% P
ool A
re
g r e a t e r p o o l a r e a i s d e s i r a b le2 5
3 0
3 5
a
O D F W b e n c h m a r k : 3 5 % o r
0
5
1 0
1 5
2 0
2 5
No.
Cha
nnel
Wid
ths
Per P
ool
O D F W b e n c h m a r k :f e w e r t h a n 8 c h a n n e l w id t h s p e r
p o o l is d e s i r a b le
H o o d R iv e rM a in s t e m
W e s t F o r k M id d le F o r k E a s t F o r k
0
3 0
3 5O D F W b e n c h m a r k : d e s i r a b le i f g r a v e l m a k e s u p 3 5 % o r m o r e o f t h e s u b s t r a t e in r i f f le a r e a s
5
1 0
1 5
2 0
2 5
% G
rave
l Ava
ilabi
lity
H o o d R iv e rM a in s t e m
W e s t F o r k M id d le F o r k E a s t F o r k
1 2
1 4
1 6
1 8
in G
rave
ls O D F W b e n c h m a r k : n o m o r e t h a n 1 0 % f in e s e d im e n t
in g r a v e ls is d e s i r a b le
1 0
men
t
2
4
6
8
% F
ine
Sedi
0
H o o d R iv e rM a in s t e m
W e s t F o r k M id d le F o r k E a s t F o r k
Figure 4-5. Comparison of averaged habitat quality measures pool area, pool frequency,gravel availability, and gravel quality for Aquatic Inventory Project survey rea th
ches by 5
eld watershed. Adapted from: ODFW, 1995. fi
Fish Population Status and Distribution 43
Status of the Aquatic Food Chain Little is known about the health and status of the aquatic food supply in the Watershed with regard to natural nutrient cycling, algal growth, detrital processes, and invertebrate production. The role of marine nutrients from spawned-out anadromous fish carcasses in the stream food chain has been the subject of study in recent years. Researchers have found that fish carcasses are an important source of nutrients to the aquatic food chain as well as to wildlife and riparian vegetation. Juvenile fish rearing in streams with adequate carcass supply have a faster growth rate. In western Washington streams sampled, the amount of marine-derived nitrogen in juvenile coho salmon tissue increased rapidly with increased density of spawning fish up to a limit of 124 fish per mile (Bilby et al. 1997). The researchers suggest that this information, together with data on stream habitat characteristics, could be used to determine basin-specific escapement goals to maintain or enhance watershed productivity. As a result of low fish populations in recent years, e.g. 1993 to 1998 - the combined fish carcass density in the Hood River Watershed (all species) has been less than 20 fish per anadromous stream mile based on total adult returns to the Powerdale Dam fish trap facility. Since 1998, ODFW and CTWS have placed a small number of spent hatchery carcasses from Hood River-origin fish into the upstream areas in an effort to restore marine nutrients and enhance stream productivity.
Fish Population Status and Distribution 44
Fish Passage Problems
his section addresses man-made structures or conditions that obstruct, delay or interfere e
t
ish
ed
stream passage is provided on the east side of the dam y a fish ladder operated and maintained by PacifiCorp. A fish trap in the ladder was
ll
much greater than the fish ladder attraction ow on the east bank. As a result, fish are more strongly attracted to the spill on the west ank and are seen jumping up onto the concrete spillway. The agencies and Tribes have onsulted with PacifiCorp to improve attraction into the ladder entrance. The influence of
dam passage conditions and/or handling stress at the trap on the pre-spawning mortality rates of chinook and steelhead are of potential concern. A two-year radio telemetry study by CTWS and PacifiCorp investigated how long it took salmon and steelhead to migrate through the bypass reach and locate the fish ladder. In 1995 spring chinook held 66.0 days and summer steelhead 28.3 days in the vicinity of Powerdale Dam, and only 21% and 31% of radiotagged fish successfully passed the dam (CTWS 1997). Because of poor attraction to the fish ladder, the flow was modified to exit the bottom pool in the ladder. This measure helped fish find the ladder more quickly - in the 1996 study, spring chinook held 21.0 and steelhead 25.2 days, with 67% and 52% dam passage success rate. Further downstream, the powerhouse discharge (tailrace) at river mile 1.5 can attract fish and delay migration (PacifiCorp 1998). Tagged chinook and steelhead spent an average of 4.5 and 8 days per fish respectively near the tailrace in 1995 but dropped to 1.6 and 3.1 days per fish in 1996 after short-term modifications to the tailrace area were made. Clear Branch Dam was built in 1969 for irrigation storage and is a complete barrier to the upstream migration of anadromous and resident fish, and has isolated a bull trout population above the dam. Beginning in 1997, the USFS in cooperation with Middle Fork Irrigation District has operated an upstream fish trap at the base of the dam. Eight adult
Twith or harm migrating fish. Man-made fish passage problems in the Watershed includ(1) inadequate fish screens at irrigation and hydro diversions; (2) delay or poor function afish ladders; and (3) culvert barriers at road crossings. Three large dams - Hines, Powerdale, and Clear Branch - have historically had the greatest impacts on upstream fmigration in the Watershed. Hines Mill Dam was built in 1907 spanning the East Fork Hood River at river mile 1.4 at Dee. It had a wood fish ladder that often malfunctioned and blocked passage into the East Fork (USFS 1996b). The Hines Mill Dam was breachin 1966. Fish passage conditions at the remaining dams and other diversions are describedbelow. PacifiCorp’s Powerdale Dam diverts up to 500 c.f.s. from the Hood River at river mile 4.5 for power generation. Presently, upbinstalled as part of the Hood River Production Program and is operated by ODFW. PacifiCorp volunteered use of the facility and the land. There is concern that upstream migration conditions need further improvement, although re-entry of steelhead and butrout into the ladder after release above the dam has been observed, as has re-entry of hatchery fish released back downstream for the sport fishery (Newton, ODFW, pers. comm). Discharge on the west bank is oftenflbc
Fish Population Status and Distribution 45
bull trout were captured at this location between September 2, 1997 and Jan 1, 1998. Current policy is to transport ev to Clear Branch upstream of
e reservoir.
actions.
ast
at the Farmers Irrigation District 80 c.f.s. iversion from the Hood River. Fish salvage operations have found spring chinook,
.
f of streamflow), delay in screen
placement at Powerdale Dam will undermine subbasin-wide habitat restoration, fisheries
at
. These passage barriers are identified and summarized in Table . Road culvert barriers are described later in this Chapter.
ery other fish entering the trapth Fish screens meeting state and federal fish protection criteria are mandatory in Oregon fordiversions of 30 c.f.s. or greater. Under existing state law, screens are voluntary for diversions under 30 c.f.s. but the Endangered Species Act could require mandatoryState cost-share programs are available to help private water users screen diversions. In 1996, the East Fork Irrigation District constructed a new screen facility at its 127 c.f.s. EFork Hood River canal. The diversion was operated for decades without screens except briefly in the 1960s during which chronic mechanical problems forced the EFID to abandon the screens. The new screens (Coanda type) are designed to handle high glacial sediment loads. A screen upgrade is needed drainbow/steelhead, cutthroat and mountain whitefish juveniles trapped in Farmers Canal despite an existing rotary drum screen. The screens at the Powerdale diversion do not meet NMFS or ODFW criteria for fishprotection (Pribyl et al. 1996). Testing in 1995 by PacifiCorp found that a proportion ofoutmigrant salmonids were swept into the power canal (PacifiCorp 1998). PacifiCorp proposes to replace the fish screens once the new license is issued and accepted. The project license expires in March 2000; however, the timing of screen replacement is uncertain and may be delayed by relicensing, permitting and design proceedings. PacifiCorp indicates it may take 2 years after a new license is issued and accepted by the utility before actual screen construction will begin (Prendergrast, PacifiCorp, pers comm)Screen upgrade completions at all other major water diversions in the Watershed is anticipated by the year 2001. Because of its downstream location and the large volume owater diverted (average monthly diversion of up to 80% reenforcement, and supplementation efforts and will slow the recovery of anadromous fish inthe Hood River (Jennings, CTWS, pers comm). ODFW is finalizing a subbasin-wide survey of screens in need of upgrade to meet currentfish protection criteria (Hartlerode, ODFW, pers. comm) and will offer financial aid to eligible landowners. The ODFW survey included small private pumps as well as irrigationand water district diversions. A number of other known or potential fish passage problems exist in addition to those dams described above. Presently, 14 migration barriers (excluding road culverts or small private withdrawals) are known or suspected to affect anadromous fish or bull trout passage in the Watershed4-7
Fish Population Status and Distribution 46
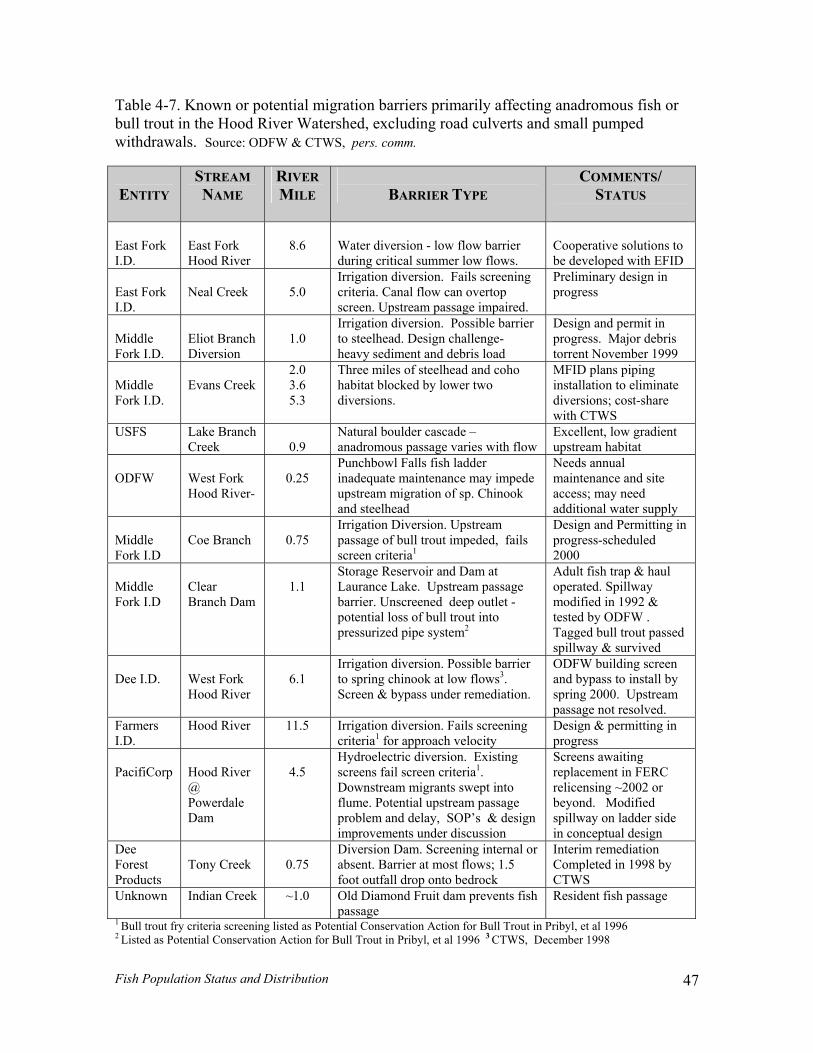
Table 4-7. Known or potential migration barriers primarily affecting anadromous fish bull trout in the Hood River Watershed, excluding road culverts and small pumped withdrawals. So
or
urce: ODFW & CTWS, pers. comm.
ENTITY
STREAM NAME
RIVER MILE
BARRIER TYPE
COMMENTS/ STATUS
East Fork I.D.
East Fork Hood River
8.6
Water diversion - low flow barrier during critical summer low flows.
Cooperative solutions to be developed with EFID
East Fork I.D.
Neal Creek
5.0
Irrigation diversion. Fails screening criteria. Canal flow can overtop screen. Upstream passage impaired.
Preliminary design in progress
Middle Fork I.D.
Eliot Branch Diversion
1.0
Irrigation diversion. Possible barrier to steelhead. Design challenge- heavy sediment and debris load
Design and permit in progress. Major debritorrent November 1999
s
Middle
Evans Creek
2.0 3.6
Three miles of steelhead and coho habitat b
MFID plans piping
ork I.D. 5.3 locked by lower two
diversions. installation to eliminate diversions; cost-share Fwith CTWS
USFS Lake Branch Creek
0.9
Natural boulder cascade – anadromous passage varies with flow
Excellent, low gradient upstream habitat
ODFW
West Fork Hood River-
0.25
Punchbowl Falls fish ladder inadequate maintenance may impede upstream migration of sp. Chinook and steelhead
Needs annual maintenance and site access; may need additional water supply
Middle Fork I.D
Coe Branch
0.75
Irrigation Diversion. Upstream passage of bull trout impeded, fails screen criteria1
Design and Permitting in progress-scheduled 2000
Middle Fork I.D
Clear Branch Dam
1.1
Storage Reservoir and Dam at Laurance Lake. Upstream passage barrier. Unscreened deep outlet -potential loss of bull trout into pressurized pipe system2
Adult fish trap & haul operated. Spillway modified in 1992 & tested by ODFW . Tagged bull trout passed spillway & survived
Irrigation diversio Dee I.D. West Fork 6.1
n. Possible barrier to spring chinook at low flows3.
ODFW building screen and bypass to install by
Hood River Screen & bypass under remediation. spring 2000. Upstream passage not resolved.
Farmers I.D.
Hood River
11.5 Irrigation diversion. Fails screening 1
Design & permitting in
criteria for approach velocity progress
PacifiCorp Hood River 4.5
Hydroelectric diversion. Existing screens fail screen criteria1.
Screens awaiting replacement in FERC
side
@ Powerdale Dam
Downstream migrants swept into flume. Potential upstream passage problem and delay, SOP’s & design improvements under discussion
relicensing ~2002 or beyond. Modified spillway on ladder in conceptual design
Dee Forest
Tony Creek
0.75
Diversion Dam. Screening internal or absent. Barrier at most flows; 1.5
Interim remediation
Products foot outfall drop onto bedrock Completed in 1998 by CTWS
Unknown Indian Creek ~1.0 Old Diamond Fruit dam prevents fish passage
Resident fish passage
1 Bull trou2 Listed
t fry criteria screening listed as Potential Conservation Action for Bull Trout in Pribyl, et al 1996 as Potential Conservation Action for Bull Trout in Pribyl, et al 1996 3 CTWS, December 1998
Fish Population Status and Distribution 47
Fish Passage Barriers at Road Crossings In 1 8, the ep of Transportation n cooperation with O d
lver d o iation along state Highways and county-owned public roads (not including forest roads) in the Watershed. ODFW identified 46 culverts that
hibit fish assage, and ranked th ing to affected species and quality of existing h ble 4-8 igh ed
diation generally due to anadr abi b m. S en y- .
dditional assage problem at ro fi o bar y is ent est ro
la -wide field su ars. C e of s ote fis 200
istrict intends to r ce ert with a bridge at the Pinnacle Creek mouth at Laurance Lake reservoir to improve bull trout passage during low reservoir and flow
ions , US S, pe ulvert barr near river m 0 was rem in
99 Oregon D artment f remed
i DFW surveyestream cu ts in nee
in p em accordupstreamreme
abitat (Ta ). E teen culverts were ranked as momous fish presence and avail
ium priority for lity of good or medium
quality ha
itat upstrea ixte of these are located along Count owned public roads
A p s ad culverts are likely to be identily available for National Forrvey within the next few ye
ed in the future. Nads, however, the ounty forest roads ar
culvertMHNF p
rier inventor currns a forest
in needRanger D
urveys for p ntial h passage barriers as well. In a road culv
0, the Hood River epla
condit (G. Asbridgeile 1.
F rs. comm). A second c 1999.
ier on Pinnacle Creekoved
Fish Population Status and Distribution 48
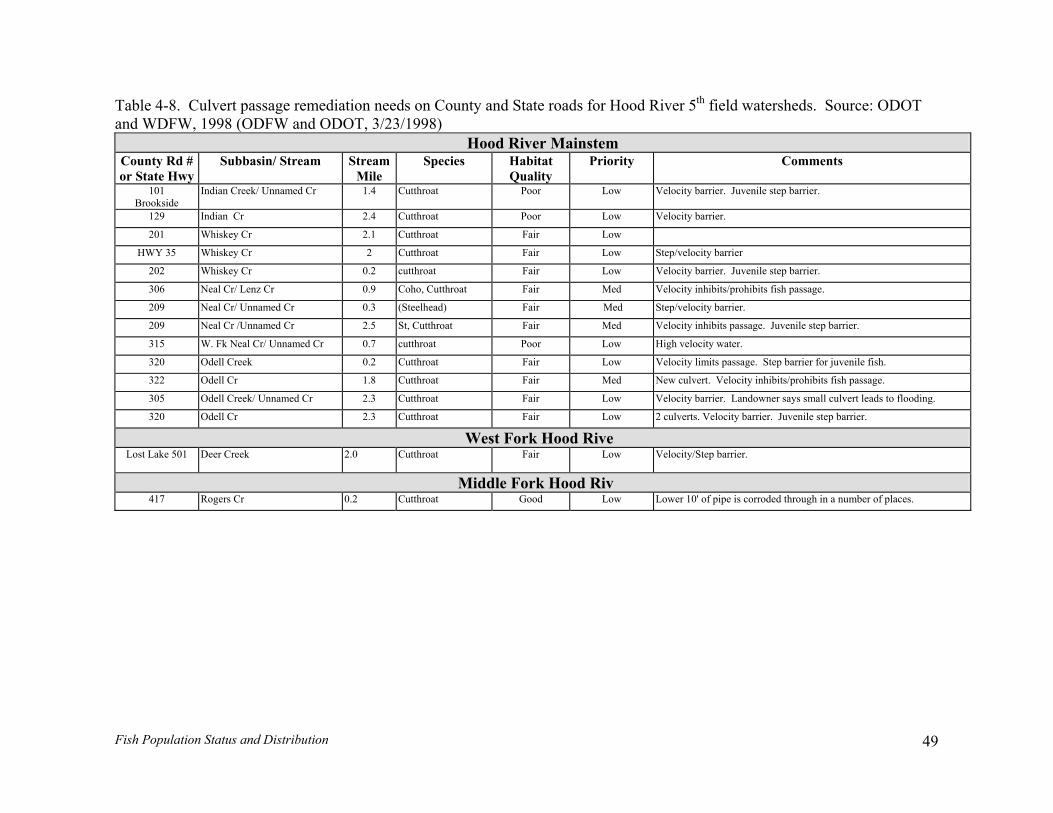
Table 4-8. Culvert passage remediation needs on County and State roads for Hood River 5th field watersheds. Source: ODOT and WDFW, 1998 (ODFW and ODOT, 3/23/1998)
Hood River Mainstem Priority
Low Velocity barrier. Ju
Low Velocity barrier.
Low
Low Step/velocity barrier
Low Velocity barrier. Ju
Med Velocity inhibits/pro
Med Step/velocity barrier
Med Velocity inhibits pas
Low High velocity water.
Low Velocity limits pass
Med New culvert. Veloc
ow Velocity barrier. La
ow 2 culverts. Velocity
r ow Velocity/Step barrie
er ow Lower 10' of pipe is
County Rd # or State Hwy
Subbasin/ Stream StreamMile
Species Habitat Quality
Comments
ile step barrier.
ile step barrier.
its fish passage.
e. Juvenile step barrier.
Step barrier for juvenile fish.
nhibits/prohibits fish passage.
wner says small culvert leads t
rier. Juvenile step barrier.
roded through in a number of p
ooding.
101 Brookside
Indian Creek/ Unnamed Cr 1.4 Cutthroat Poor ven
129 Indian Cr 2.4 Cutthroat Poor
201 Whiskey Cr 2.1 Cutthroat Fair
HWY 35 Whiskey Cr 2 Cutthroat Fair
202 Whiskey Cr 0.2 cutthroat Fair ven
306 Neal Cr/ Lenz Cr 0.9 Coho, Cutthroat Fair hib
209 Neal Cr/ Unnamed Cr 0.3 (Steelhead) Fair .
209 Neal Cr /Unnamed Cr 2.5 St, Cutthroat Fair sag
315 W. Fk Neal Cr/ Unnamed Cr 0.7 cutthroat Poor
320 Odell Creek 0.2 Cutthroat Fair age.
322 Odell Cr 1.8 Cutthroat Fair ity i
305 Odell Creek/ Unnamed Cr 2.3 Cutthroat Fair L ndo o fl
320 Odell Cr 2.3 Cutthroat Fair L bar
West Fork Hood RiveLost Lake 501 Deer Creek 2.0 Cutthroat Fair L r.
Middle Fork Hood Riv417 Rogers Cr 0.2 Cutthroat Good L cor laces.
Fish Population Status and Distribution 49
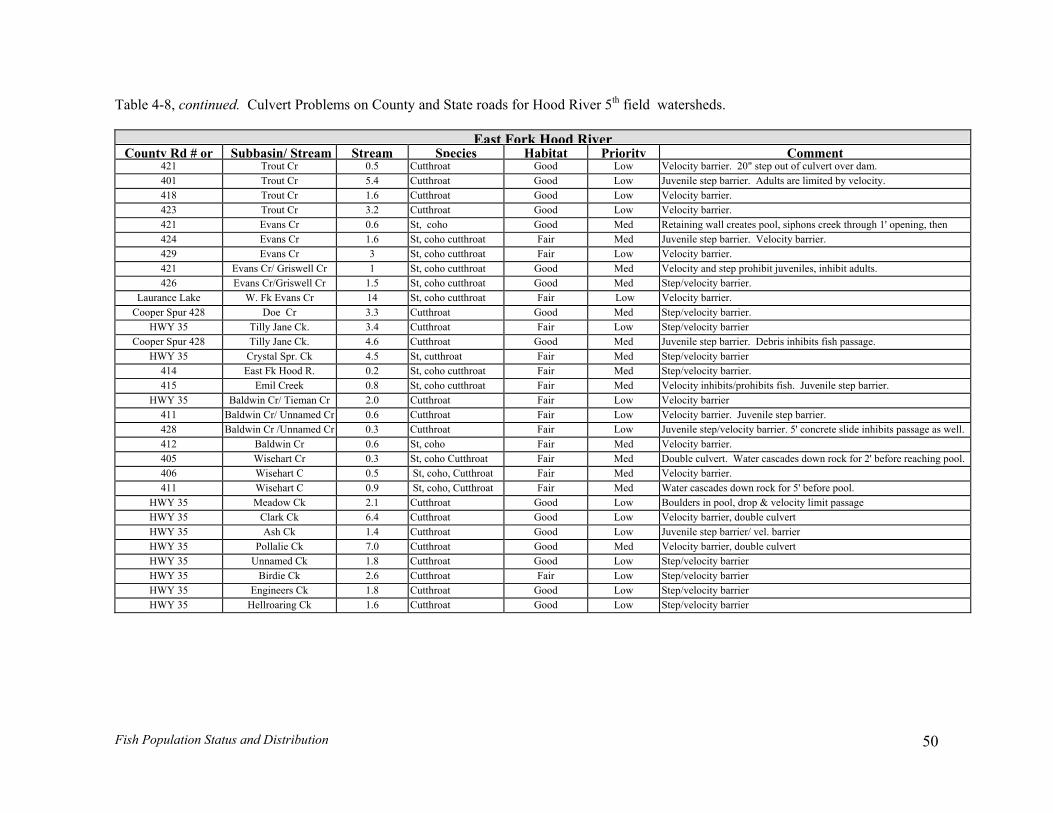
Table 4-8, continued. Culvert Problems on County and State roads for Hood River 5th field watersheds.
East Fork Hood RiverCounty Rd # or Subbasin/ Stream Stream Species Habitat Priority Comment
421 Trout Cr 0.5 Cutthroat Good Low Velocity barrier. 20" step out of culvert over dam. 401 Trout Cr 5.4 Cutthroat Good Low Juvenile step barrier. Adults are limited by velocity. 418 Trout Cr 1.6 Cutthroat Good Low Velocity barrier. 423 Trout Cr 3.2 Cutthroat Good Low Velocity barrier. 421 Evans Cr 0.6 St, coho Good Med Retaining wall creates pool, siphons creek through 1' opening, then 424 Evans Cr 1.6 St, coho cutthroat Fair Med Juvenile step barrier. Velocity barrier. 429 Evans Cr 3 St, coho cutthroat Fair Low Velocity barrier. 421 Evans Cr/ Griswell Cr 1 St, coho cutthroat Good Med Velocity and step prohibit juveniles, inhibit adults. 426 Evans Cr/Griswell Cr 1.5 St, coho cutthroat Good Med Step/velocity barrier.
Laurance Lake W. Fk Evans Cr 14 St, coho cutthroat Fair Low Velocity barrier. Cooper Spur 428 Doe Cr 3.3 Cutthroat Good Med Step/velocity barrier.
HWY 35 Tilly Jane Ck. 3.4 Cutthroat Fair Low Step/velocity barrier Cooper Spur 428 Tilly Jane Ck. 4.6 Cutthroat Good Med Juvenile step barrier. Debris inhibits fish passage.
HWY 35 Crystal Spr. Ck 4.5 St, cutthroat Fair Med Step/velocity barrier 414 East Fk Hood R. 0.2 St, coho cutthroat Fair Med Step/velocity barrier. 415 Emil Creek 0.8 St, coho cutthroat Fair Med Velocity inhibits/prohibits fish. Juvenile step barrier.
HWY 35 Baldwin Cr/ Tieman Cr 2.0 Cutthroat Fair Low Velocity barrier 411 Baldwin Cr/ Unnamed Cr 0.6 Cutthroat Fair Low Velocity barrier. Juvenile step barrier. 428 Baldwin Cr /Unnamed Cr 0.3 Cutthroat Fair Low Juvenile step/velocity barrier. 5' concrete slide inhibits passage as well. 412 Baldwin Cr 0.6 St, coho Fair Med Velocity barrier. 405 Wisehart Cr 0.3 St, coho Cutthroat Fair Med Double culvert. Water cascades down rock for 2' before reaching pool. 406 Wisehart C 0.5 St, coho, Cutthroat Fair Med Velocity barrier. 411 Wisehart C 0.9 St, coho, Cutthroat Fair Med Water cascades down rock for 5' before pool.
HWY 35 Meadow Ck 2.1 Cutthroat Good Low Boulders in pool, drop & velocity limit passage HWY 35 Clark Ck 6.4 Cutthroat Good Low Velocity barrier, double culvert HWY 35 Ash Ck 1.4 Cutthroat Good Low Juvenile step barrier/ vel. barrier HWY 35 Pollalie Ck 7.0 Cutthroat Good Med Velocity barrier, double culvert HWY 35 Unnamed Ck 1.8 Cutthroat Good Low Step/velocity barrier HWY 35 Birdie Ck 2.6 Cutthroat Fair Low Step/velocity barrier HWY 35 Engineers Ck 1.8 Cutthroat Good Low Step/velocity barrier HWY 35 Hellroaring Ck 1.6 Cutthroat Good Low Step/velocity barrier
Fish Population Status and Distribution 50
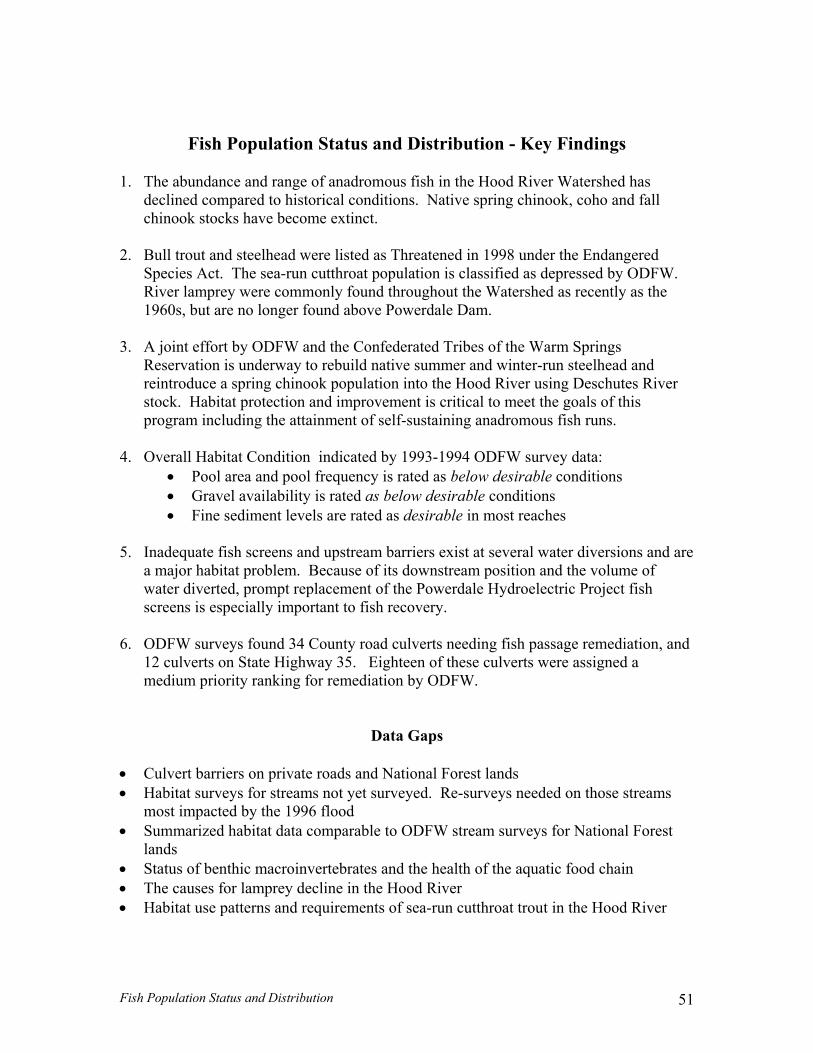
Fish Population Status and Distribution - Key Findings 1. The abundance and range of anadromous fish in the Hood River Watershed has
declined compared to historical conditions. Native spring chinook, coho and fall chinook stocks have becom xt
2. Bull trout and steelhead were listed as Threatened in 1998 under the Endangered
Speci ct. The n c hro n is class d as depressed by ODFW. River lamprey wer m y f hout the W recently as the 1960s, but are no longer found above Powerdale Dam
3. A join f by d es he Warm Springs
Reser io s u mm and nter-run steelhead and reintr c sp th ood ver using Deschutes River stock. Habitat protection and improvement is critical to meet the goals of this program including the attainment of self-sustaining anadromous fish runs.
4 all Habitat Condition indicated by 1993-1994 ODFW survey data:
• Pool area and pool frequency is rated el esirable conditions • Gravel availability is rated as below rab onditions
i i t reaches 5 adequate fish screens and upstream barrier ist veral water diversions and are
ajor habitat problem. Because of its downstrea sition and the volume of water diverted, prom ent of the Powerdale Hydroelectric Project fish screens is especially t to fish recovery.
ODFW surveys found 34 County road culverts needing fish passage remediation, and 12 culverts on State Highway 35. Eighteen of these culverts were assigned a m p ODFW.
Data Gaps
Culvert barriers on priva and N onal Forest lands Habitat surveys for st et sur ed. Re-surveys needed on those streams m aS m z W eam rveys for National Forest lands Status of benthic macroinvertebrates and the health of the aquatic food chain T RivHabitat use patterns and requirements of sea-run cutthroat trout in the Hood River
e e
uttonl
d t rek p
inct
at oun
Cold nula
.
popd t
nfeat
tio
es A
t evatodu
seae c
DFerwg c
-ruom
Wayhin
ulhro
deiven i
atioug
rate sunto
ifieatershed as
.
of t wi Ri
fortn ie a
Ondrin
an tooo
he buiop
Triber
e H
. O
. Ina m
ver as bdesirab
s ex
ow dle cn m
at sem po
• F ne sediment levels are rated as desi le os
pt replacemimportan
edium riority ranking for remediation by
te ms96 co
roa noflomp
ds t yodar
ativey
o O
rea 19ata
ostum
impari
cteed
d bha
y bita
thet d
able t DF str su
he causes for lamprey decline in the Hood er
6.
• •
•
• • •
Fish Population Status and Distribution 51
5. CHANNEL MODIFICATIONS Introduction • Where are the locations of channel a wet d difications? • Where are the locations of historic c nel t a uch as splash damming,
ic m stream anin • are k n locati of r a l rbance such as channel
g, e iv ank eros , la s en aW trea b types ha bee d c fication?
Chann n ve reduced the qu itions. In the ab c resources from nd the chann Cha e to declining transportability and sediment deposition, making channel disturbances, such as channel widening, extensive bank erosion or large gravel deposits, with no apparent adjacent cause, response indicators of changes in upstream channel input factors which m This Chapter locates known sites of historic or continuing disturbance or modification of stream channels. Examples of channel modifications in the Hood River Watershed in de bank stab ds or ra s constru ng streams, channel realignment, reservoirs, ditching and wetland drainage. Historic modifications like spla s on habitat condi s can in some cases form in response to upstream channel modification and can aggravate downstream flooding impacts. Diking, road fill, rip-rap and other development encroachments narrow the stream channel and limit stream meandering and m nt within its floodplain. In response the stream length shor ater ve e d sediment movement and stream-floo ss of cha g or loss of gra eposition, and s er t tats needed by fish.
Historic and Existing Channel Modifications Top her info tion was used to id the locations and number of miles of historic and current channel modifications in the four Hood River fifth-field watersheds. Where more than one modification type occurred in the same reach, only the principal modification was
ndhang?currgen im
lait
d er
lan dis
chimte
seouonro
mourb
nnet bby
destioth
nce
dirs,han
-com, typ
s s
stu etn
ha p
hee o
hyWwi
drhedeha
elalisetheel
aulre nint s
mtync chha
inthextem
caoro
el ty
ingre nsha
tio qucumope
andnowe b
itat
antint
ifife
cleonsionve
hisatipr b
entedpac
d ures c f
c.?el
nnre
imf
mo
el -lap
mo
di
acnd
acd
od ane oan
bi
ifid/f dn
tat
nsa
med af
ndtyatcatcte
so ofioniod
m aq o
n c.
e un an
toc he-le
ricab
aninf
anrcdim
in frnse t
tiv u
t toifi
itise a
cat
es cquio
haondatin a
at usered
nnel gradient can be used to predict zones of potential channel impacts du
ay
clu
be related to land use activities.
iliz
tresi
at
amve
io
ba
n,
clenk
roa
an e
ilw
mow
ay
ponc
ct
aud
ed
se ex
alo
ofpa
sh dtio
amns
s . E
anx
d sten
-oro
utsio
arn
e i, d
rtaut
nttin
bg
ecan
lond
ngin
lag s
sted
ingim
ee
ffnt
ectbar
os rine
hane
vesel m
nnls,
me, an
oel p
ten ar s th
s,re toe l
wdiraos
lo. cie
citiChtych
dpnnvel d
lael
in an
ind f
terlo
acod
tiow
nsate
sruge
pt caof
edpasid
an, can
diinoo
ficcisls,
atio an
ionn, d
s str oth
caea
n m
resbeyp
uld aes
t irm
of
n ao
h
lorinabi
ogrma
raphic maps, ODFW sen
tretify
am surveys, watershed analysis reports, and ot
Channel Modifications 52
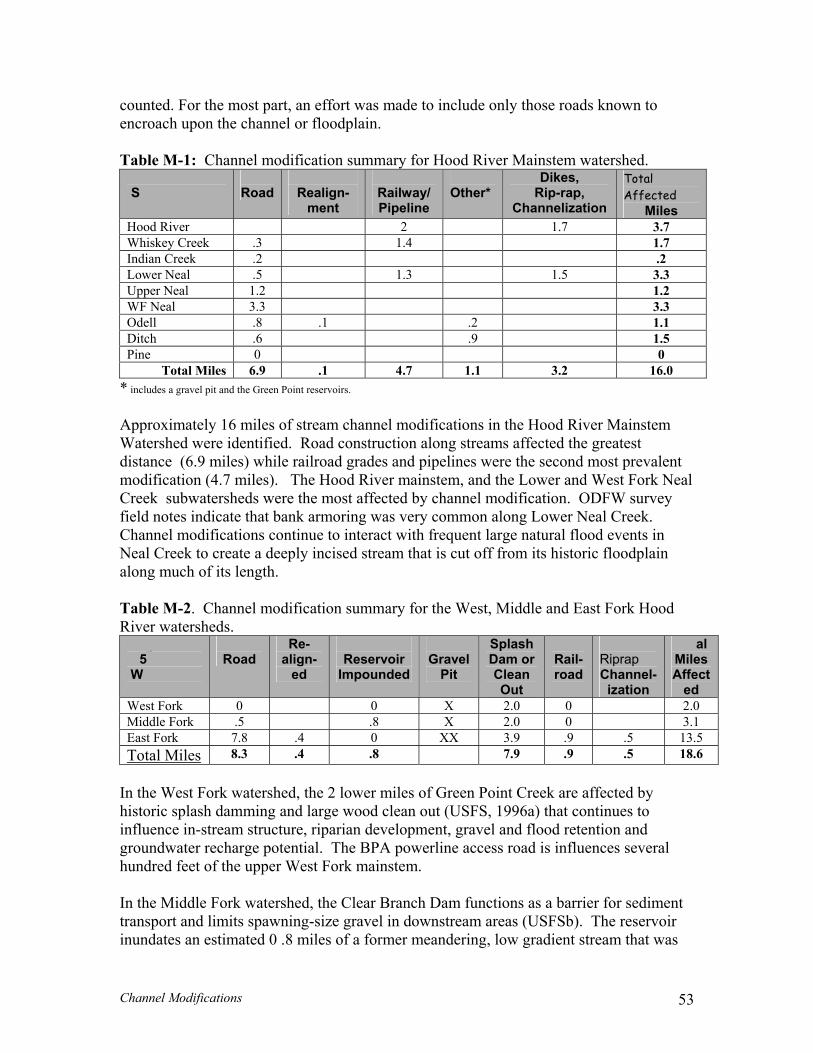
counted. For the most part, an effort was made to include only those roads known to ncroach upon the channel or floodplain.
able M-1: Channel modification summary for Hood River Mainstem watershed.
e
T
ubwatershed
Road
Realign-ment
Railway/ Pipeline
Other*
Dikes, Rip-rap,
Channelization
Total Affected
Mileod River
Ss
Ho 2 1.7 3.7 Whiskey Creek .3 1.4 1.7 Indian Creek .2 .2
wer Neal .5 1.3 1.5 3.3 per Neal 1.2 1.2
F Neal 3.3
LoUpW 3.3 Odell .8 .1 .2 1.1 Ditch .6 .9 1.5 Pine 0 0
Total Miles 6.9 .1 4.7 1.1 3.2 16cludes a gravel pit and the Green Point reservoirs.
proximately 16 miles of stream channel modifications in the Hood River Ma
.0 * in
Ap instem
atershed were identified. Road construction along streams affected the greatest t prevalent
modifi io ork Neal Creek . ODFW survey field no Neal Creek.
hannel modifications continue to interact with frequent large natural flood events in
alon Tab West, Middle and East Fork Hood
iver watersheds.
Wdistance (6.9 miles) while railroad grades and pipelines were the second mos
cat n (4.7 miles). The Hood River mainstem, and the Lower and West Fsubwatersheds were the most affected by channel modificationtes indicate that bank armoring was very common along Lower
CNeal Creek to create a deeply incised stream that is cut off from its historic floodplain
g much of its length.
le M-2. Channel modification summary for the R
th Field atershed
Road
Re-align-
ed
Reservoir
Impounded
Gravel
Pit
Splash Dam or Clean
Rail-
Diking, Riprap
Tot
Out road Channel-
ization
5W
al Miles Affect
ed West Fork 0 0 X 2.0 0 2.0 Middle Fork .5 .8 X 2.0 0 3.1 East Fork 7.8 .4 3.9 .9 .5 13.5 0 XX Total Miles 8.3 .4 .8 7.9 .9 .5 18.6
In the West Fork watershed, the 2 lower miles of Green Point Creek are affected by
oric splash damming and large wohist od clean out (USFS, 1996a) that continues to
groundwater recharge potential. The BPA powerline access road is influences several
ansport and limits spawning-size gravel in downstream areas (USFSb). The reservoir inundates an estimated 0 .8 miles of a former meandering, low gradient stream that was
influence in-stream structure, riparian development, gravel and flood retention and
hundred feet of the upper West Fork mainstem. In the Middle Fork watershed, the Clear Branch Dam functions as a barrier for sediment tr
Channel Modifications 53
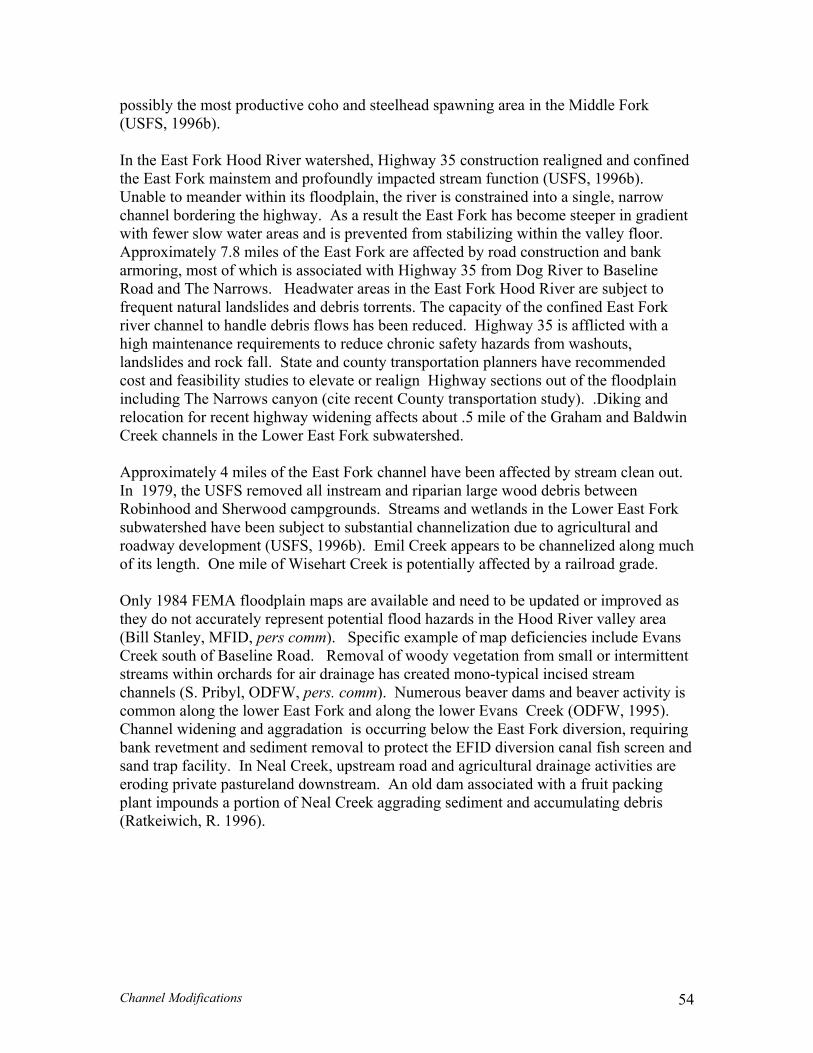
possibly the most productive coho and steelhead spawning area in the Middle Fork SFS, 1996b).
the East Fork Hood River watershed, Highway 35 construction realigned and confined SFS, 1996b).
t
arm seline oa ject to equent natural landslides and debris torrents. The capacity of the confined East Fork
in (cite recent County transportation study). .Diking and
ldwin
ut.
ds. Streams and wetlands in the Lower East Fork
s ittent
rainage has created mono-typical incised stream ity is
g and
are
h, R. 1996).
(U Inthe East Fork mainstem and profoundly impacted stream function (UUnable to meander within its floodplain, the river is constrained into a single, narrow channel bordering the highway. As a result the East Fork has become steeper in gradienwith fewer slow water areas and is prevented from stabilizing within the valley floor. Approximately 7.8 miles of the East Fork are affected by road construction and bank
oring, most of which is associated with Highway 35 from Dog River to Bad and The Narrows. Headwater areas in the East Fork Hood River are subR
frriver channel to handle debris flows has been reduced. Highway 35 is afflicted with a high maintenance requirements to reduce chronic safety hazards from washouts, landslides and rock fall. State and county transportation planners have recommended cost and feasibility studies to elevate or realign Highway sections out of the floodplaincluding The Narrows canyonrelocation for recent highway widening affects about .5 mile of the Graham and BaCreek channels in the Lower East Fork subwatershed. Approximately 4 miles of the East Fork channel have been affected by stream clean oIn 1979, the USFS removed all instream and riparian large wood debris between
obinhood and Sherwood campgrounRsubwatershed have been subject to substantial channelization due to agricultural and roadway development (USFS, 1996b). Emil Creek appears to be channelized along muchof its length. One mile of Wisehart Creek is potentially affected by a railroad grade. Only 1984 FEMA floodplain maps are available and need to be updated or improved as they do not accurately represent potential flood hazards in the Hood River valley area (Bill Stanley, MFID, pers comm). Specific example of map deficiencies include EvanCreek south of Baseline Road. Removal of woody vegetation from small or intermstreams within orchards for air dchannels (S. Pribyl, ODFW, pers. comm). Numerous beaver dams and beaver activcommon along the lower East Fork and along the lower Evans Creek (ODFW, 1995). Channel widening and aggradation is occurring below the East Fork diversion, requirinbank revetment and sediment removal to protect the EFID diversion canal fish screen sand trap facility. In Neal Creek, upstream road and agricultural drainage activities eroding private pastureland downstream. An old dam associated with a fruit packing plant impounds a portion of Neal Creek aggrading sediment and accumulating debris (Ratkeiwic
Channel Modifications 54
Key Findings - Channel Modifications
1 ro c nt t t t
in the W tershe s o th affec Strly af ted include the upper East Fork Hood River and lower Neal Creek.
2 ek is he ly impac ed by chan ization, confinement bank stabil on
lt of agr odifications have increased od scou and channe incision that has largely separated the creek
m its floodplain. 3. Co f East Fo Hood Ri ue to c truction, nstruction a
is a significant and continuing impact to aquatic habitat particularly along The Narrows and below Dog River to Baseline Road.
all
ses
• A c annel mig tion a sis for lower Neal Cr k, lo t Fo an ialleam nt
• is of hi ric aeri photos an General aps ide
of fo er strea realignm t and channelization for restoration purposes • ob nd channel shifting) are identified
. Road and rail ad bed onfinemed in term
is the mosf st am leng
prevalen modification to sted (20 miles).
ream channels a re .8 ea msmost severe fec
. Neal Cre avi t nel and izatias a resu icultural land use and road construction. These mcaused flo r l fro
nfinement o the rk ver d ons reco nd maintenance of State Highway 35
4. Drainage and stream channelization likely have altered channel conditions in sm
streams in agricultural areas compared to historic conditions. 5. Affected channel habitat types include FP3, MM, MV, SV, MC, and LC. Data Gaps/ Further Analy • Updated FEMA floodplain maps
h ra nalys
ee wer Eas rk d potent y other str segme
Analys sto al d Land Survey m to ntify locations rm m en
Not all “pr lem” sites (e.g. erosion a
• Locations of bridge crossing fills were not identified
Channel Modifications 55
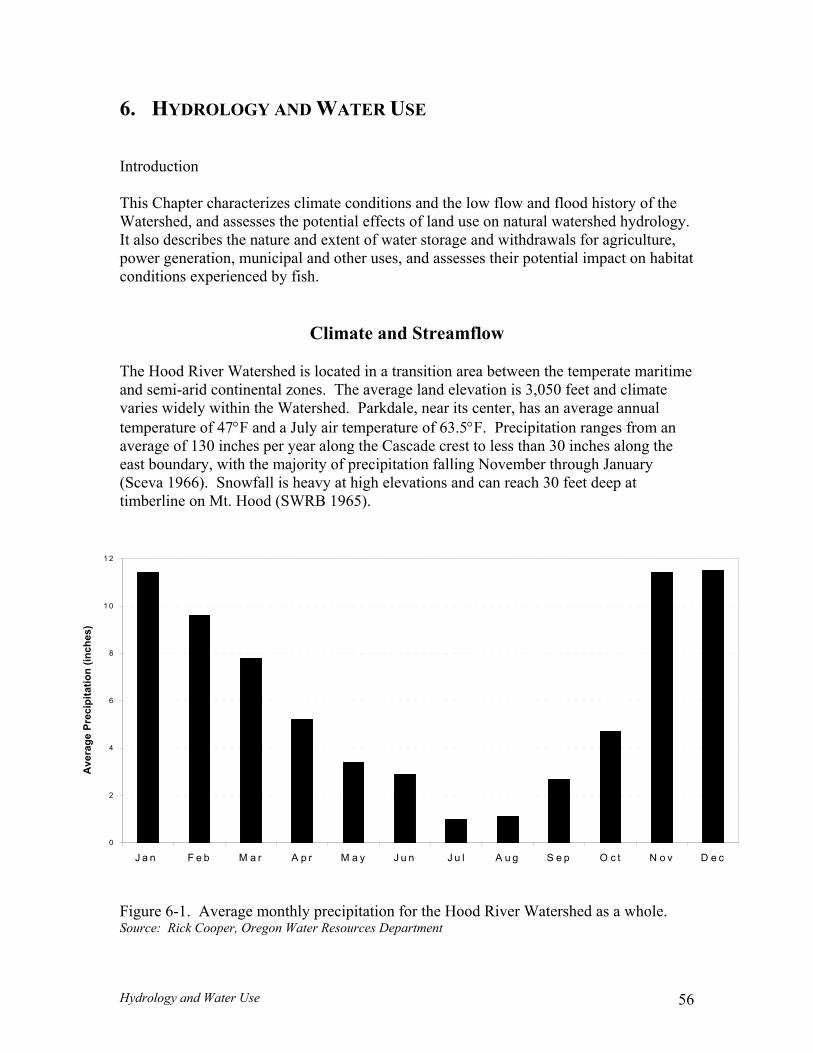
6. HYDROLOGY AND WATER USE
56
e
itat
e
o less than 30 inches along the
Figure 6-1. Average monthly precipitation for the Hood River Watershed as a whole. Source: Rick Cooper, Oregon Water Resources Department
Introduction This Chapter characterizes climate conditions and the low flow and flood history of thWatershed, and assesses the potential effects of land use on natural watershed hydrology. It also describes the nature and extent of water storage and withdrawals for agriculture,power generation, municipal and other uses, and assesses their potential impact on habconditions experienced by fish.
Climate and Streamflow The Hood River Watershed is located in a transition area between the temperate maritimand semi-arid continental zones. The average land elevation is 3,050 feet and climate varies widely within the Watershed. Parkdale, near its center, has an average annual temperature of 47°F and a July air temperature of 63.5°F. Precipitation ranges from an
erage of 130 inches per year along the Cascade crest taveast boundary, with the majority of precipitation falling November through January (Sceva 1966). Snowfall is heavy at high elevations and can reach 30 feet deep at timberline on Mt. Hood (SWRB 1965).
0
2
4
6
8
1 0
1 2
J a n F e b M a r A p r M a y J u n J u l A u g S e p O c t N o v D e c
Ave
rage
Pre
cipi
tatio
n (in
ches
)
Hydrology and Water Use
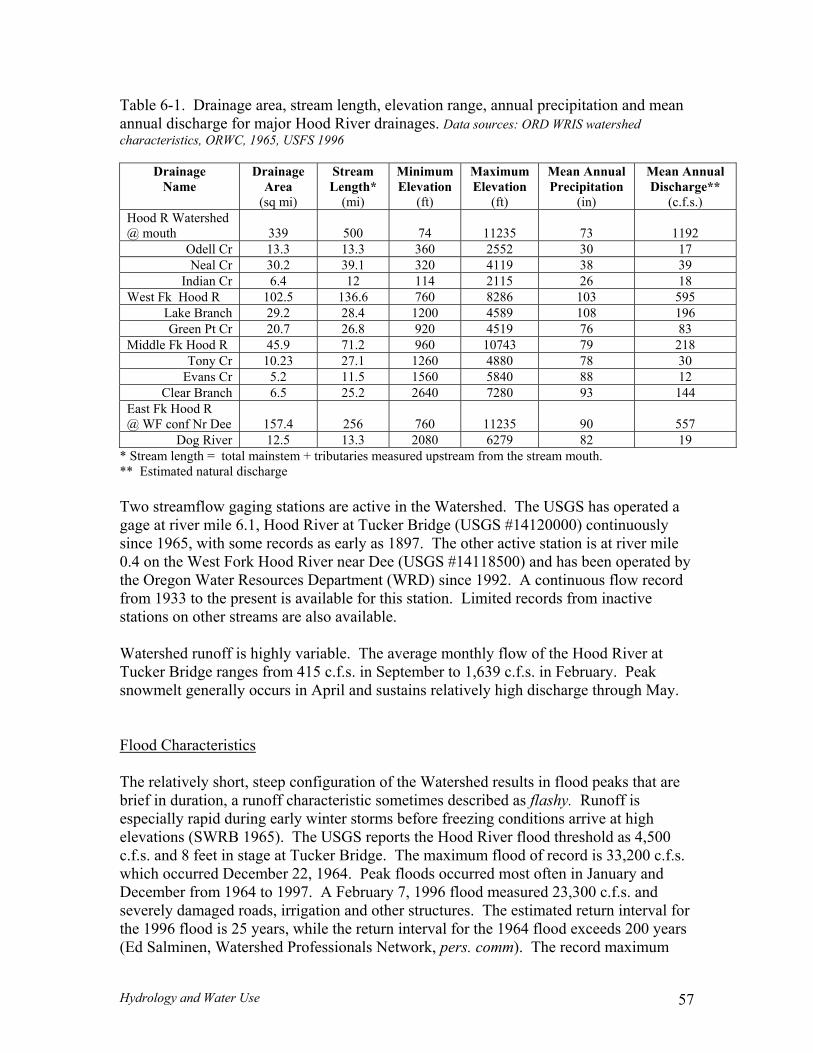
Table 6-1. Drainage area, stream length, elevation range, annual precipitation and mean nnual discharge for major Hood River drainages. Data sources: ORD WRIS watershed
characteristics, ORWC, 1
Drainage Name
Drainage Area
Stream Length*
Minimum Elevation
Maximum Elevation
Mean Annual Precipitation
Mean Annual Discharge**
(c.f.s.)
a965, USFS 1996
(sq mi) (mi) (ft) (ft) (in) od R Watershed
mouth
339
500
74
11235
73 1192 Ho@
Odell Cr 13.3 13.3 360 2552 30 17 Neal Cr 30.2 39.1 320 4119 38 39
Indian Cr 6.4 12 114 2115 26 18 est Fk Hood R 102.5 136.6 760 8286 103 59
Lake Branch 29.2 28.4 1200 4589 108 196 Green Pt Cr 20
W 5
.7 26.8 920 4519 76 83 Middle Fk Hood R 45.9 71.2 960 10743 79 218
Tony Cr 10.23 27.1 1260 4880 78 30 Evans Cr 5.2 11.5 1560 5840 88 12
Clear Branch 6.5 25.2 2640 7280 93 14st Fk Hood R
4 Ea@ WF conf Nr Dee 157.4 256 760 11235 90
557
Dog River 12.5 13.3 2080 6279 82 19 ream length = total mainstem + tributaries measured upstream from the str* St eam mouth.
* Estimated natural discharge
wo streamflow gaging stations are active in the Watershed. The USGS has operated a age at river mile 6.1, Hood River at Tucker Bridge (USGS #14120000) continuously ince 1965, with some records as early as 1897. The other active station is at river mile
r near Dee (USGS #14118500) and has been operated by e Oregon Water Resources Department (WRD) since 1992. A continuous flow record
r this station. Limited records from inactive tations on other streams are also available.
Watershed runoff is highly variable. The average monthly flow of the Hood River at uc 415 c.f.s. in September to 1,639 c.f.s. in February. Peak
May.
* Tgs0.4 on the West Fork Hood Rivethfrom 1933 to the present is available fos
ker Bridge ranges fromTsnowmelt generally occurs in April and sustains relatively high discharge through Flood Characteristics The relatively short, steep configuration of the Watershed results in flood peaks that are
ed as flashy. Runoff is especially rapid during early winter storms before freezing conditions arrive at high elevations (SWRB 1965). The USGS reports the Hood River flood threshold as 4,500 c.f.s. and 8 feet in stage at Tucker Bridge. The maximum flood of record is 33,200 c.f.s. which occurred December 22, 1964. Peak floods occurred most often in January and December from 1964 to 1997. A February 7, 1996 flood measured 23,300 c.f.s. and severely damaged roads, irrigation and other structures. The estimated return interval for the 1996 flood is 25 years, while the return interval for the 1964 flood exceeds 200 years (Ed Salminen, Watershed Professionals Network, pers. comm). The record maximum
brief in duration, a runoff characteristic sometimes describ
Hydrology and Water Use 57
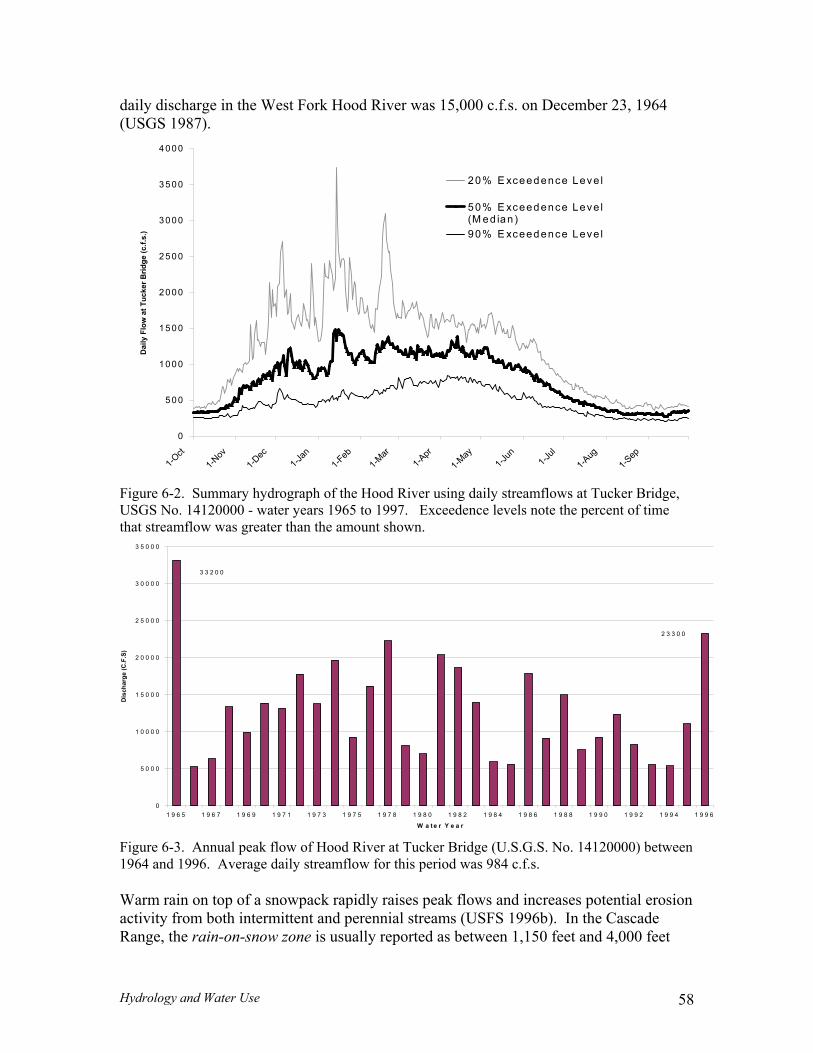
daily discharge in the West Fork Hood River was 15,000 c.f.s. on December 23, 1964 SGS 1987). (U
1 5 0 0
2 0 0 0
3 5 0 0
4 0 0 0D
aily
Flo
w a
t Tuc
ker B
ri
20% E xceedence Leve l
2 5 0 0
3 0 0 0
dge
(c.f.
s.)
50% E xceedence Leve l(M ed ian )90% E xceedence Leve l
0
5 0 0
1 0 0 0
1-Oct
1-Nov
1-Dec
1-Jan
1-Feb
1-Mar
1-Apr
1-May
1-Jun
1-Jul
1-Aug
1-Sep
Figure 6-2. Summary hydrograph of the Hood River using daily streamflows at Tucker BSGS No. 14120000 - water years 1965 to 1
ridge, 997. Exceedence levels note the percent of time
at streamflow was greater than the amount shown. Uth
2 3 3 0 0
3 3 2 0 0
0
5 0 0 0
1 0 0 0 0
1 5 0 0 0
2 0 0 0 0
2 5 0 0 0
3 0 0 0 0
3 5 0 0 0
1 9 6 5 1 9 6 7 1 9 6 9 1 9 7 1 1 9 7 3 1 9 7 5 1 9 7 8 1 9 8 0 1 9 8 2 1 9 8 4 1 9 8 6 1 9 8 8 1 9 9 0 1 9 9 2 1 9 9 4 1 9 9 6
W a t e r Y e a r
Dis
char
ge (C
.F.S
)
Figure 6-3. Annual peak flow of Hood River at Tucker Bridge (U.S.G.S. No. 14120000) between 1964 and 1996. Average daily streamflow for this period was 984 c.f.s.
arm rain on top of a snowpack rapidly raises peak flows and increases potential erosion
between 1,150 feet and 4,000 feet
Wactivity from both intermittent and perennial streams (USFS 1996b). In the Cascade
ange, the rain-on-snow zone is usually reported asR
Hydrology and Water Use 58
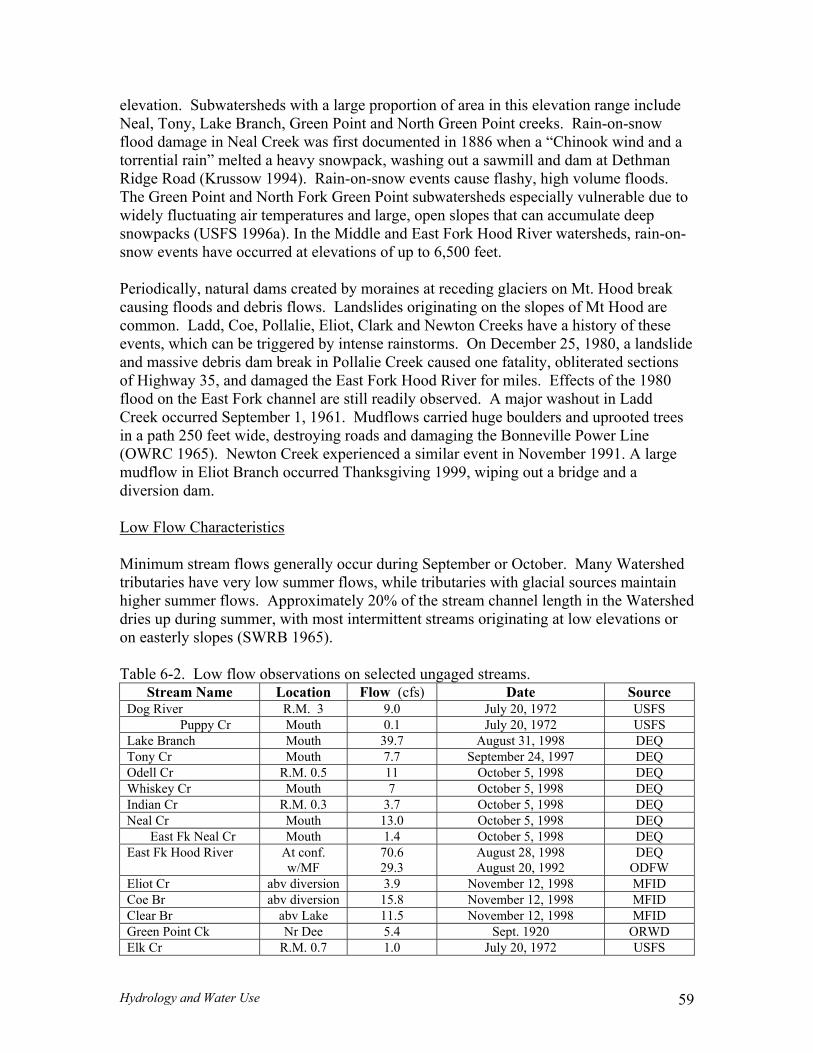
elevation. Subwatersheds with a large proportion of area in this elevation range include Neal, Tony, Lake Branch, Green Point and North Green Point creeks. Rain-on-snoflood damage in Neal Creek was firs
w t documented in 1886 when a “Chinook wind and a
rrential rain” melted a heavy snowpack, washing out a sawmill and dam at Dethman Ridg russo R o a h oThe Green Point and ork G Point atershe specially erable duwidely fluctuating air temperatures and large, o mulate deep s s (USFS 199 n the M le and E Fork H iver wat eds, rain-osnow even ccu at elev s of up ,500 fe P l d eated raines at receding glaciers on Mt. Hood break causing floods and debris flows. Landslides originating on the slopes of Mt Hood are common. Ladd, Coe, Pollalie, Eliot, Clark and Newton Creeks have a history of these events, which can be triggered by intense rainstorms. On mber 25 80, a landsland massi da k in P e Cre sed o lity, obl ted sectionsof Highway 35, and damaged the East Fork Hood River for miles. Effects of the 1980 flood on the East Fork channel are still readily observed. A major washout in Ladd C ptem , 1961 dflow ried h ulders an prooted treein a path ide roying roads and ging the Bonneville Power Line
1. A large curred Thanksgiving 1999, wiping out a bridge and a
m.
toe (KRoad w 1994). ain-on-sn w events c use flashy, igh volume fl ods.
North F reen subw ds e vuln e to pen slopes that can accu
nowpack 6a). I idd ast ood R ersh n-ts have o rred ation to 6 et.
eriodically, natura ams cr by mo
Dece , 19 ide ve debris m brea ollali ek cau ne fata itera
reek occurred Se ber 1 . Mu s car uge bo d u s 250 feet w , dest dama
(OWRC 1965). Newton Creek experienced a similar event in November 199mudflow in Eliot Branch ocdiversion da Low Flow Characteristics Minimum stream flows generally occur during September or October. Many Watershed tributaries have very low summer flows, while tributaries with glacial sources maintain higher summer flows. Approximately 20% of the stream channel length in the Watedries up during summer, with most intermitte
rshed nt streams originating at low elevations or
n easterly slopes (SWRB 1965). o Table 6-2. Low flow observations on selected ungaged streams.
Stream Name Location Flow (cfs) Date Source Dog River R.M. 3 9.0 July 20, 1972 USFS Puppy Cr Mouth 0.1 July 20, 1972 USFS Lake Branch Mouth 39.7 August 31, 1998 DEQ Tony Cr Mouth 7.7 September 24, 1997 DEQ Odell Cr R.M. 0.5 11 October 5, 1998 DEQ Whiskey Cr Mouth 7 October 5, 1998 DEQ Indian Cr R.M. 0.3 3.7 October 5, 1998 DEQ Neal Cr Mouth 13.0 October 5, 1998 DEQ East Fk Neal Cr Mouth 1.4 October 5, 1998 DEQ East Fk Hood River At conf.
w/MF 70.6 29.3
August 28, 1998 August 20, 1992
DEQ ODFW
Eliot Cr abv diversion 3.9 November 12, 1998 MFID Coe Br abv diversion 15.8 November 12, 1998 MFID Clear Br abv Lake 11.5 November 12, 1998 MFID Green Point Ck Nr Dee 5.4 Sept. 1920 ORWD Elk Cr R.M. 0.7 1.0 July 20, 1972 USFS
Hydrology and Water Use 59
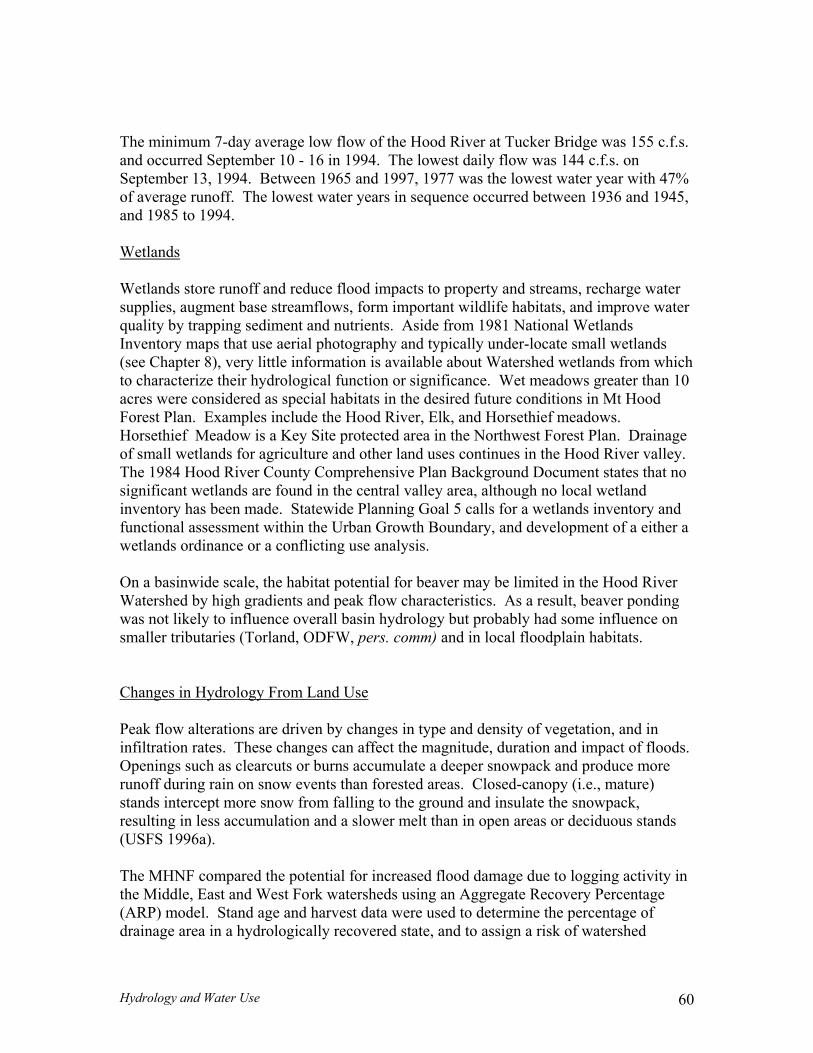
The minimum 7-day average low flow of the Hood River at Tucker Bridge was 155 c.f.s. and occurred September 10 - 16 in 1994. The lowest daily flow was 144 c.f.s. on September 13, 1994. Between 1965 and 1997, 1977 was the lowest water year with 47% of average runoff. The lowest water years in sequence occurred between 1936 and 1945, and 1985 to 1994. Wetlands Wetlands store runoff and reduce flood impacts to property and streams, recharge water supplies, augment base streamflows, form important wildlife habitats, and improve water quality by trapping sediment and nutrients. Aside from 1981 National Wetlands Inventory maps that use aerial photography and typically under-locate small wetlands (see Chapter 8), very little information is available about Watershed wetlands from which to characterize their hydrological function or significance. Wet meadows greater than 10 acres were considered as special habitats in the desired future conditions in Mt Hood Forest Plan. Examples include the Hood River, Elk, and Horsethief meadows. Horsethief Meadow is a Key Site protected area in the Northwest Forest Plan. Drainage of small wetlands for agriculture and other land uses continues in the Hood River valley. The 1984 Hood River County Comprehensive Plan Background Document states that no
oundary, and development of a either a
wetlands ordinance or a conflicting use analysis. On a basinwide scale, the habitat potential for beaver may be limited in the Hood River Watershed by high gradients and peak flow characteristics. As a result, beaver ponding was not likely to influence overall basin hydrology but probably had some influence on smaller tributaries (Torland, ODFW, pers. comm) and in local floodplain habitats. Changes in Hydrology From Land Use
significant wetlands are found in the central valley area, although no local wetland inventory has been made. Statewide Planning Goal 5 calls for a wetlands inventory andfunctional assessment within the Urban Growth B
Peak flow alterations are driven by changes in type and density of vegetation, and in infiltration rates. These changes can affect the magnitude, duration and impact of floods. Openings such as clearcuts or burns accumulate a deeper snowpack and produce more runoff during rain on snow events than forested areas. Closed-canopy (i.e., mature) stands intercept more snow from falling to the ground and insulate the snowpack, resulting in less accumulation and a slower melt than in open areas or deciduous stands
e MHNF compared the potential for increased flood damage due to logging activity in
(USFS 1996a). Ththe Middle, East and West Fork watersheds using an Aggregate Recovery Percentage (ARP) model. Stand age and harvest data were used to determine the percentage of drainage area in a hydrologically recovered state, and to assign a risk of watershed
Hydrology and Water Use 60
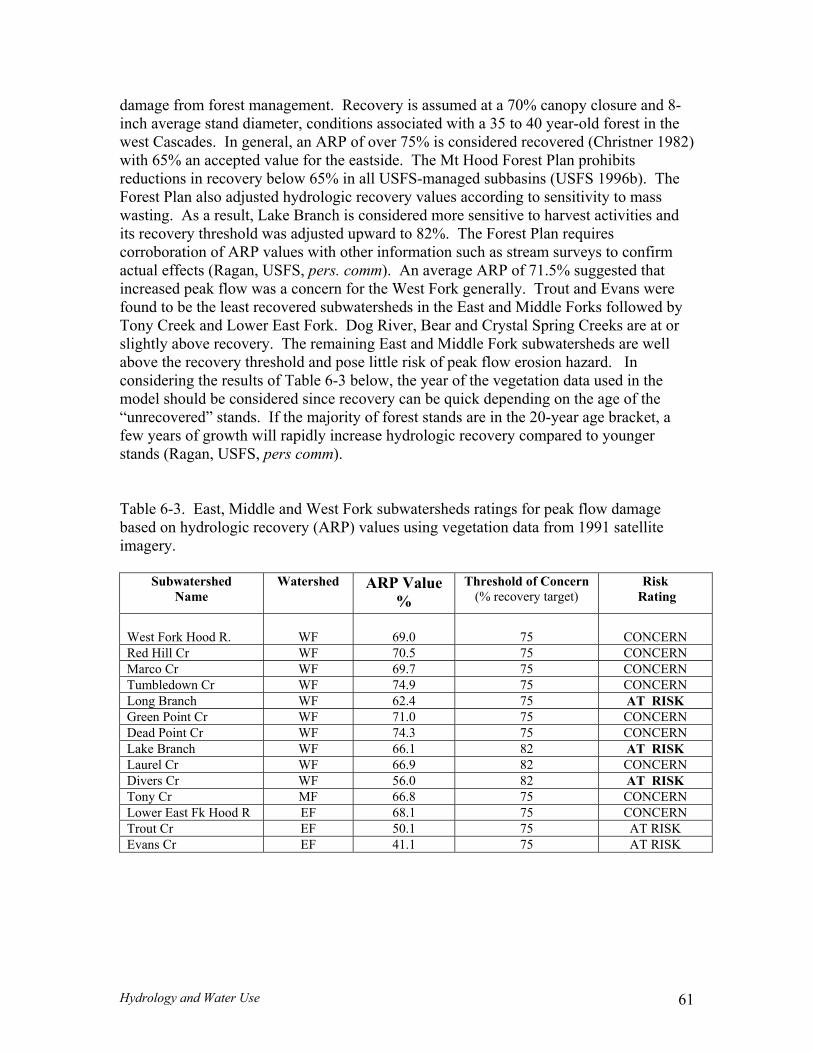
damage from forest management. Recovery is assumed at a 70% canopy closure and 8-inch average stand diameter, conditions associated with a 35 to 40 year-old forest in thwest Cascades. In general, an ARP of over 75% is considered recovered (Christner 1982with 65% an accepted value for the eastside. The Mt Hood Forest Plan prohibits reductions in recovery below 65% in all USFS-managed subbasins (USFS 1996b). TheForest Plan also adjusted hydrologic recovery values according to sensitivity to mass wasting. As a result, Lake Branch is considered more sensitive to harvest activities aits recovery threshold was adjusted upward to 82%. The Forest Plan requires corroboration of ARP values with other information such as s
e )
nd
tream surveys to confirm ctual effects (Ragan, USFS, pers. comm). An average ARP of 71.5% suggested that
y
able 6-3. East, Middle and West Fork subwatersheds ratings for peak flow damage ry (ARP) values using vegetation data from 1991 satellite
agery.
a
Tbased on hydrologic recoveim
Subwatershed Name
Watershed ARP Value %
Threshold of Concern (% recovery target)
Risk Rating
West Fork Hood R.
WF
Marco Cr WF 69.7 75 CONCERN Tumbledown Cr WF 74.9 75
h .4
increased peak flow was a concern for the West Fork generally. Trout and Evans were found to be the least recovered subwatersheds in the East and Middle Forks followed bTony Creek and Lower East Fork. Dog River, Bear and Crystal Spring Creeks are at orslightly above recovery. The remaining East and Middle Fork subwatersheds are well above the recovery threshold and pose little risk of peak flow erosion hazard. In considering the results of Table 6-3 below, the year of the vegetation data used in the model should be considered since recovery can be quick depending on the age of the“unrecovered” stands. If the majority of forest stands are in the 20-year age bracket, a few years of growth will rapidly increase hydrologic recovery compared to youngerstands (Ragan, USFS, pers comm).
69.0 75 CONCERN Red Hill Cr WF 70.5 75 CONCERN
C N ONCERA KT RISLong Branc WF 62 75
Green Point Cr r
WF 71.0 75 C N ONCERDead Point C
nch WF 74.3
.1 75 CONCERN
A K T RISLake Bra WF 66 82 Laurel Cr .9 C N WF 66
682 ONCER
Divers Cr WF 5 82 .0 A K T RISTony Cr
asMF 66.8 75 C N ONCER
Lower E t Fk Hood R CONCERN EF 68.1.1
75 Trout Cr EF 50 75 A K T RISEvans Cr EF 41.1 75 A K T RIS
Hydrology and Water Use 61
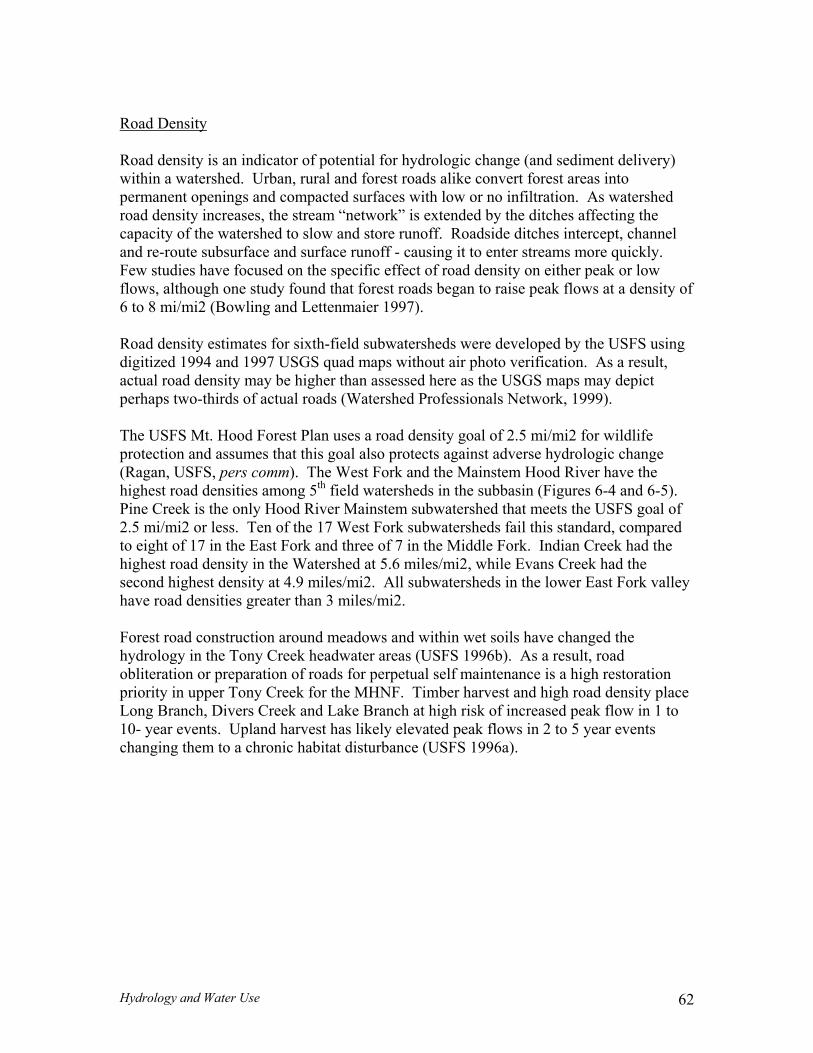
Road Density
ery)
es, the stream “network” is extended by the ditches affecting the apacity of the watershed to slow and store runoff. Roadside ditches intercept, channel
e subsurface and surface runoff - causing it to enter streams more quickly. w studies have focused on the specific effect of road density on either peak or low
f
g
-5).
iddle Fork. Indian Creek had the ighest road density in the Watershed at 5.6 miles/mi2, while Evans Creek had the
ydrology in the Tony Creek headwater areas (USFS 1996b). As a result, road bliteration or preparation of roads for perpetual self maintenance is a high restoration
F. Timber harvest and high road density place ong Branch, Divers Creek and Lake Branch at high risk of increased peak flow in 1 to
Road density is an indicator of potential for hydrologic change (and sediment delivwithin a watershed. Urban, rural and forest roads alike convert forest areas into permanent openings and compacted surfaces with low or no infiltration. As watershed road density increascand re-routFeflows, although one study found that forest roads began to raise peak flows at a density o6 to 8 mi/mi2 (Bowling and Lettenmaier 1997). Road density estimates for sixth-field subwatersheds were developed by the USFS usindigitized 1994 and 1997 USGS quad maps without air photo verification. As a result, actual road density may be higher than assessed here as the USGS maps may depict perhaps two-thirds of actual roads (Watershed Professionals Network, 1999). The USFS Mt. Hood Forest Plan uses a road density goal of 2.5 mi/mi2 for wildlife protection and assumes that this goal also protects against adverse hydrologic change (Ragan, USFS, pers comm). The West Fork and the Mainstem Hood River have the highest road densities among 5th field watersheds in the subbasin (Figures 6-4 and 6Pine Creek is the only Hood River Mainstem subwatershed that meets the USFS goal of 2.5 mi/mi2 or less. Ten of the 17 West Fork subwatersheds fail this standard, compared to eight of 17 in the East Fork and three of 7 in the Mhsecond highest density at 4.9 miles/mi2. All subwatersheds in the lower East Fork valleyhave road densities greater than 3 miles/mi2. Forest road construction around meadows and within wet soils have changed the hopriority in upper Tony Creek for the MHNL10- year events. Upland harvest has likely elevated peak flows in 2 to 5 year events changing them to a chronic habitat disturbance (USFS 1996a).
Hydrology and Water Use 62
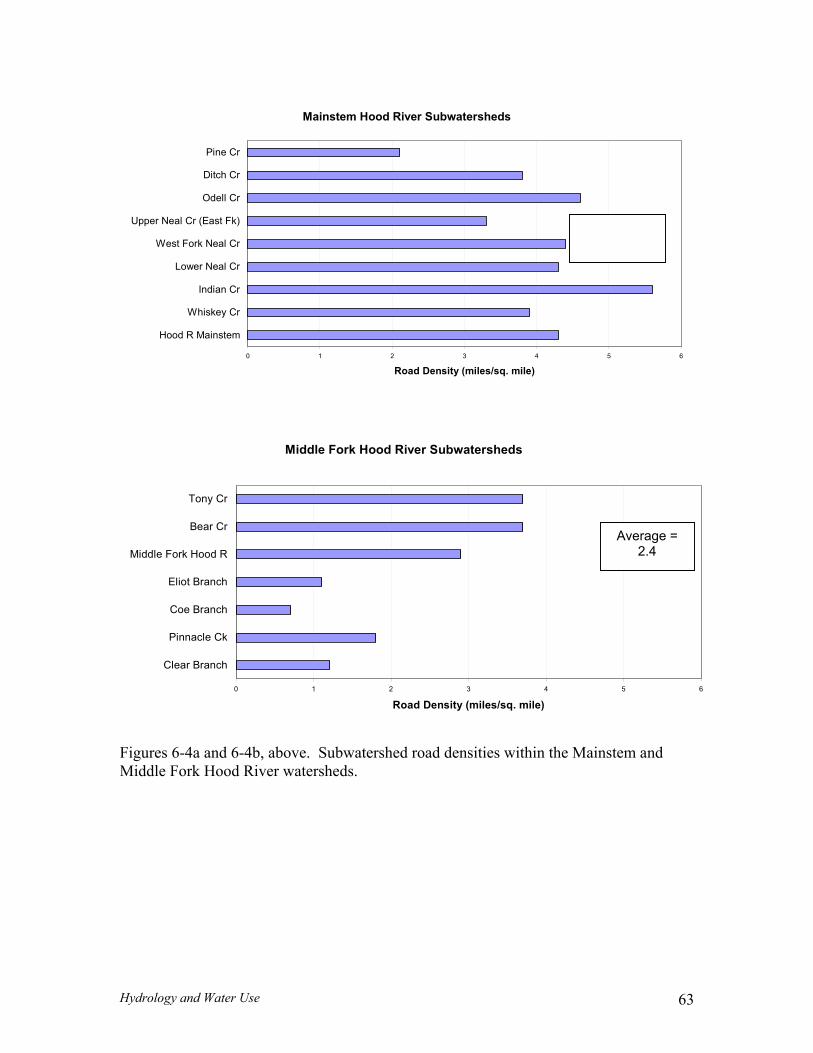
Mainstem Hood River Subwatersheds
0 1 2 3 4 5
Hood R Mainstem
Whiskey Cr
Indian Cr
Lower Neal Cr
West Fork Neal Cr
Upper Neal Cr (East Fk)
Odell Cr
Ditch Cr
Pine Cr
Road Density (miles/sq. mile)
Middle For
Avera4.2
ge =
6
k Hood River Subwatersheds
0 3 4
r Branch
Coe Branch
Hood R
nsity (miles/sq. )
=2.4 Middle Fork
Bear Cr
Tony Cr
Average
Eliot Branch
Pinnacle Ck
Clea
1 2 5 6
F and 6-4b, abov ubwatersh ad densities w the MainsteMiddle Fork Hood River watersheds.
Road De mile
igures 6-4a e. S ed ro ithin m and
Hydrology and Water Use 63
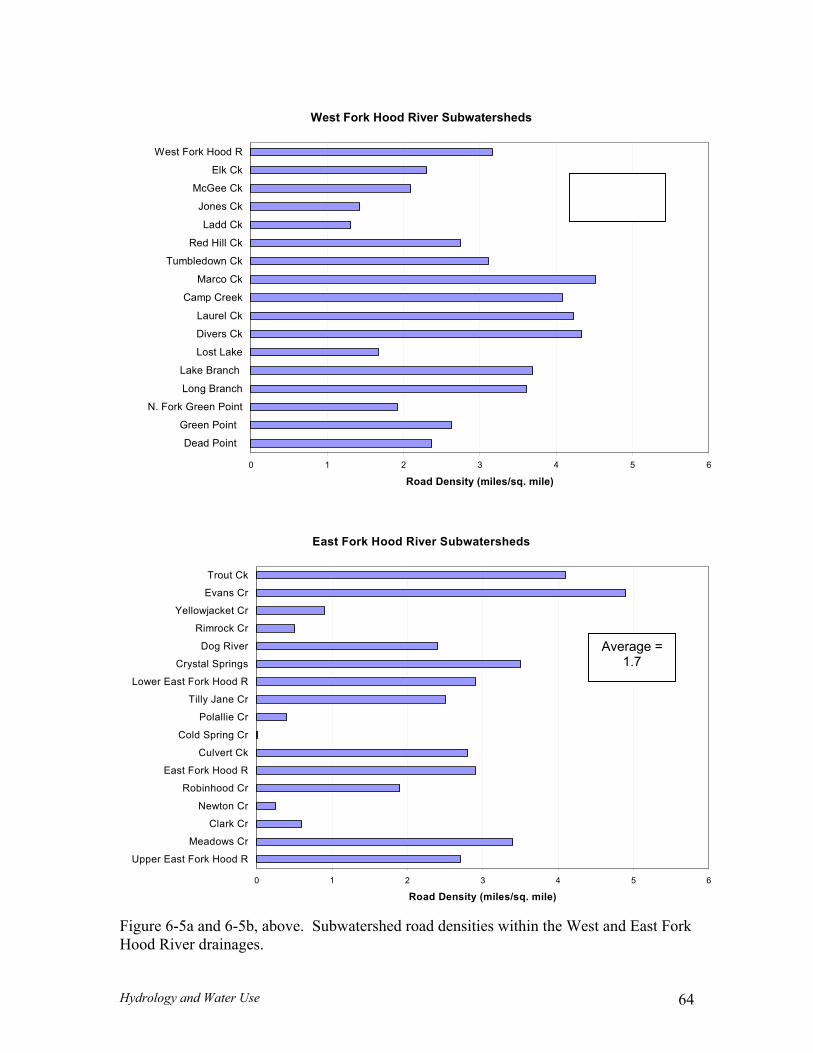
West Fork Hood River Subwatersheds
Laurel Ck
Camp Creek
Marco Ck
Tumbledown Ck
Red Hill Ck
Ladd Ck
Jones Ck
McGee Ck
Elk Ck
West Fork Hood R
Average = 2.9
N. Fork Green Point
Long Branch
Lake Branch
Lost Lake
Divers Ck
0 1 2 3 4 5
Dead Point
Green Point
Road Density (miles/sq. mile)
East Fork Hood River Subwatersheds
Yellowjacket Cr
Evans Cr
Trout Ck
6
0 1 2 3 4 5
Upper East Fork Hood R
Meadows Cr
Clark Cr
Newton Cr
Robinhood Cr
East Fork Hood R
Road Density (miles/sq. mile)
e =7
Culvert Ck
Cold Spring Cr
Polallie Cr
Tilly Jane Cr
Lower East Fork Hood R
Crystal Springs
Dog River
Rimrock Cr
Averag1.
6
Figure 6-5a and 6-5b, above. Subwatershed road densities within the West and East Fork Hood River drainages.
Hydrology and Water Use 64
The Forest Service found that the risk of damage from landslides has been elevated in West Fork and Lake Branch subwatersheds as a result of harvest rate, roads, poor potential for instream wood recruitment, and removal of downed logs from intermittent channels (USFS 1996a). The West Fork has one of the highest rates of debris torrents on the MHNF, with the majority associated with clearcuts and roads. Splash damming, riparian logging, stream clean-out and the 1964 flood eliminated much of the natural instream and riparian downed wood throughout the Hood River Watershed. Historically, large wood is believed to have played a crucial role in providing the habitat structure capable of producing large anadromous fish runs in the Hood River’s flashy, high flow environment (USFS 1996b). Large wood slows moving water and tends to desynchronize the timing of peak inflow from the outflow, lowering the peak flow (Watershed Professionals Network 1999). The Forest Service postulated that forest management in the West Fork, especially roads and removal of wood from channels, has increased peak flows over natural conditions, although flow records are not available for confirmation (USFS 1996a).
Impervious and semi-pervious surface area from urban development (asphalt, lawns, rooftops, etc.) impedes infiltration of rainfall and snowmelt, causing rapid runoff with higher peak flows and lower base streamflows. Several studies found chronic stream habitat degradation when total impervious area exceeds 5 to 10% within a drainage (e.g., Schueler 1994; May et al. 1997). The Oregon Watershed Assessment Manual assigns a high potential for impact at a threshold of 10%, and a moderate potential above 5% imperviousness. A 5.1% impervious land area was calculated for Indian Creek assuming that no surface runoff occurs from orchard lands that comprise more than half the subwatershed. Indian Creek is the only 6th field subwatershed in the Hood River where urbanization presents even a moderate risk of hydrologic impact. Wetlands temporarily store water and release it slowly to streams and aquifers, thereby moderating peak flows. Wetlands most effective at storing water are generally located in the middle elevations of a watershed (Watershed Professionals Network 1999). These wetlands are far enough away from receiving channels to delay runoff, but low enough in the system to collect significant amounts of water. Under natural conditions, wetlands and associated groundwater recharge likely provided greater summer baseflow support in
rainage of wet areas was historically used in the middle to lower Watershed for griculture and other land uses. Ditching and drain tiling continues to be a common land se practice. Information is not available to assess the cumulative effects of drainage
activities on Watershed hydrology.
Water Rights and Water Use
the Watershed compared to present conditions (Ragan, USFS, pers comm). Dau
Hydrology and Water Use 65
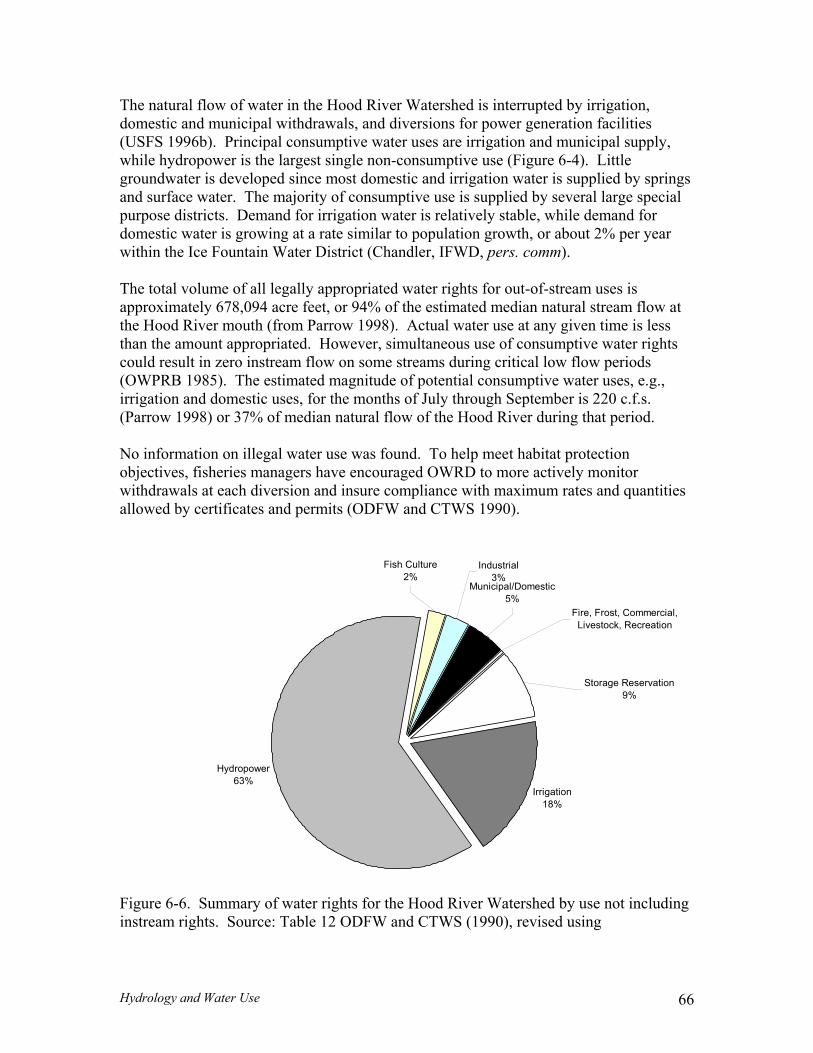
The natural flow of water in the Hood River Watershed is interrupted by irrigation, domestic and municipal withdrawals, and diversions for power generation facilities (USFS 1996b). Principal consumptive water uses are irrigation and municipal supply, while hydropower is the largest single non-consumptive use (Figure 6-4). Little groundwater is developed since most domestic and irrigation water is supplied by springs and surface water. The majority of consumptive use is supplied by several large special purpose districts. Demand for irrigation water is relatively stable, while demand for domestic water is growing at a rate similar to population growth, or about 2% per year within the Ice Fountain Water District (Chandler, IFWD, pers. comm). The total volume of all legally appropriated water rights for out-of-stream uses is approximately 678,094 acre feet, or 94% of the estimated median natural stream flow at the Hood River mouth (from Parrow 1998). Actual water use at any given time is less than the amount appropriated. However, simultaneous use of consumptive water rights could result in zero instream flow on some streams during critical low flow periods (OWPRB 1985). The estimated magnitude of potential consumptive water uses, e.g., irrigation and domestic uses, for the months of July through September is 220 c.f.s. (Parrow 1998) or 37% of median natural flow of the Hood River during that period. No information on illegal water use was found. To help meet habitat protection objectives, fisheries managers have encouraged OWRD to more actively monitor withdrawals at each diversion and insure compliance with maximum rates and quantities llowed by certificates and permits (ODFW and CTWS 1990).
a
Storage Reservation9%
Fish Culture2%
Industrial3%
Fire, Frost, Commercial, Livestock, Recreation
Hydropower63%
Irrigation18%
Municipal/Domestic5%
Figure 6-6. Summary of water rights for the Hood River Watershed by use not including instream rights. Source: Table 12 ODFW and CTWS (1990), revised using
Hydrology and Water Use 66
municipal/domestic and storage reservation rights of 36,705 and 64,000 acre feet, respectively. Irrigation Irrigation is the second largest water use in the Watershed, which contains 32,696 acres
f lands with irrigation water rights, 90% of which are served by irrigation district
rrigation District (FID) has adopted a Water Conservation lan (FID 1995) that favors use of conservation strategies to satisfy demand increases
) y,
funds ,
d micro-sprinklers is creasing. Of 300 orchards, around 30 are using soil moisture sensors to irrigate based
District (c.f.s.) ated Peak Use*
odeliveries. Approximately 23,720 acres are actively irrigated (Hood River News 1995), 15,000 of these in orchard and 2,000 in pasture (Neiderholzer, OSU Extension, pers comm). The main irrigation season is April 15 to October 1 with peak usage in July. If all lands with irrigation rights were irrigated simultaneously, the maximum allowable diversion would total 409 c.f.s. (Bailey 1997), an amount equal to 80% of the median natural flow of the Hood River in the month of August. To achieve operational and environmental gains, irrigation districts are replacing open ditches and canals with pressurized pipe, eliminating end-spill and reducing the number of diversion points. Farmers IPand use of surplus conserved water for stream restoration. Large water savings to datehave eased dependence on supplemental sources, enabled elimination of 18 diversion points, and produced economic returns. Pressure pipe lessens the need to pump water,saving some landowners $600 - $1,000 in yearly energy costs, and recovery of canal leakage has increased hydropower revenues. The Middle Fork Irrigation District (MFIDestimates that 10 c.f.s. could be saved by eliminating end-spill in their system (StanleMFID, pers comm). The East Fork Irrigation District (EFID) has piped numerous open laterals and small canals and plans to continue, and to improve their large canals asallow. This helps conserve water and reduce grower pumping expenses (Buckley, EFIDpers.comm). On-farm efficiency using soil moisture monitoring aninon actual crop requirements (Nakamura, Hood River Grower-Shippers As., pers comm). Table 6-4. Primary water rights and peak use of irrigation districts for irrigation, stock,spray, frost and fire control - excluding water rights for power generation. Complete district water rights are listed in the Technical Appendices. Data sources: OWRD; Conners, MFID; Bryan, FID
Irrigation Water Source Water Rights Estim
East Fork I.D. EF Hood River 157.2 113 Mount Hood I.D. EF Hood River 34.91 12
Clear Branch 75 Roger Sp Cr
Middle Fork I.D.
80 5.17
Other Middle Fork Tributaries 34.83 Evans Cr 8.3 Trout Cr 4.46 Wishart
all sources combined
, Griswell Cr 1.87 Hood River 11.1 West Fk 13
Hydrology and Water Use 67
Dee Flat I.D Camp, Alder, No Name, Deer Cr 13.5 all sources combined
Hood River 80.04 41 Farmers I.D. West Fk Tributaries including
Green Point Cr 72.19 25
Aldridge Irr Co. Tony Creek 0.96 c.f.s. No data * not including hydroelectric uses Instream habitat in the East Fork Hood River is affected by the withdrawal of up to 127 .f.s. below the EFID diversion point. During critical low flows and high demand,
is
istribution in the East Fork (Pribyl, ODFW, pers. comm). The timing of maximum ion of
dentified as a problem on e West Fork. The district has been unable to maintain its delivery system in good
condition and canal leakage is substantial even in summer (USFS 1996a). Streams are used as conveyance to transfer irrigation water between watersheds at several sites. Neal Creek conveys water from the East Fork Hood River to orchards and pastures in the lower east valley. Rogers Creek and East Fork tributaries Emil, Griswell, Trout, Evans and Wishart Creeks transfer water from Coe and Elliot Branch. These transfers import glacial silt into otherwise clear streams during summer melt. The MFID believes that instream and operational benefits could be achieved by abandoning its East Fork sources in favor of new piping relying on their Middle Fork sources alone. Because some of the District’s oldest water rights are in the East Fork tributaries, a water right trade or other mechanism is needed to allow a change in water sources without loss of water rights priority (MFID 1998). Water is considered over-allocated on an ecological basis in Green Point tributaries (USFS 1996a). Summer baseflow is considered inadequate for fish and diversions may have reduced the width of the riparian zone. The FID has recognized the need for a higher summer baseflow in Green Point Creek. Part of the FID strategy to address this need includes watershed restoration to improve natural water retention and storage (FID 1995).
cstreamflow between the diversion down to the Middle Fork confluence (6.5 miles)impaired (USFS 1996b). An instream water right of 100 to 150 c.f.s. was established forthe East Fork but is superceded by the EFID irrigation water right. A low flow of 29.3 c.f.s. in the East Fork just above the Middle Fork confluence was measured on August 20, 1992 (Pribyl, ODFW, unp data) while surface streamflow immediately below thediversion was essentially zero. Low flow conditions in this reach influence water temperature, rearing habitat, juvenile and adult migration, and food production. Theimpact on adult anadromous fish passage is uncertain given the present species ddepletion occurs in mid to late summer. This does not coincide with adult migratwinter steelhead, the dominant anadromous species in the East Fork. Leakage from the Dee Flat Irrigation District mainline canal is ith
Hydroelectric Generation
Hydrology and Water Use 68
The single largest diversion and the single largest water right in the Hood River is PacifiCorp Po
the werdale Dam diversion. Up to 500 c.f.s. is diverted at RM 4.5 and is
turned 3 miles downstream. Minimum flow requirements for the bypass reach below re established by the state in 1965 and modified in 1983. Under existing
inimum flows, between 10% and 74% of the monthly average flow at Tucker Bridge is
sion
ed to
igure 6-7. Existing and future recommended flow requirements for the Hood River
,
rethe dam wemdiverted with the greatest proportional flow reduction in late July. In August 194, prior to instream requirements, streamflow below the dam dropped to 3 c.f.s. due to diverby Pacific Power & Light Company (ORWD 1965). As part of their pending Federal Energy Regulatory Commission (FERC) relicensing application, PacifiCorp has agremaintain higher instream flows in spring, summer and fall to improve anadromous fish habitat below their diversion. To offset financial losses, PacifiCorp is seeking an additional water right to divert up to 620 c.f.s. during November through April. Error! Not a valid link. Fbelow Powerdale Dam agreed to PacifiCorp and state, federal and tribal agencies. Farmers and Middle Fork Irrigation Districts operate 5 small hydro plants year round along their irrigation canals and pipelines. Water not used for irrigation after power generation is returned instream various distances from the points of withdrawal. Their combined generation water rights total 158 c.f.s, although actual peak use varies. The maximum winter hydro diversion is 45 c.f.s. from Middle Fork sources (Conners, MFIDpers comm). FID has a water right to use 73 c.f.s. from the Hood River for power generation. A small hydro plant is operated by a private individual on Odell Creek near its mouth. Municipal, Domestic and Industrial Water Supply Springs supply the majority of drinking and domestic water in the watershed. Cold and Stone Springs on Lake Branch supplies the City of Hood River. The City has explored the feasibility of a hydro plant to utilize their full water right of 25.5 c.f.s., however no current plans exist to build the project (Bradsy, City of Hood River, pers comm). Full use
upplies domestic water to the east valley, and Ice Fountain Spring in the Middle Fork serves the west springs s s ofParkd umber of wells are used by landowners and fruit processors, however the quantity of groundwater use is small. Industrial water has been diverted in the past from T iver he Dee Mill. The City of The Dalles diversion on the Dog River at rivbasin transfer. Betw drawn to p 70% of Th ater supply on an annual average basis. Operations legally dewater Dog River below the diversion each summ w hundred feet downstream hroat and rainbow trout are found where surface nderson, City of t lles, pers comm).
of the City water right would likely impact low flows in lower Lake Branch (Newberry 1995). Crystal Springs s
valley. Other upply the town Odell and ale. A n
ony Creek at r mile 0.7 for t
er mile 6.0 is the only out of een 3 and 12 c.f.s. is with rovide e Dalles w
er. A fe , cutt flow reappears (A he Da
Hydrology and Water Use 69
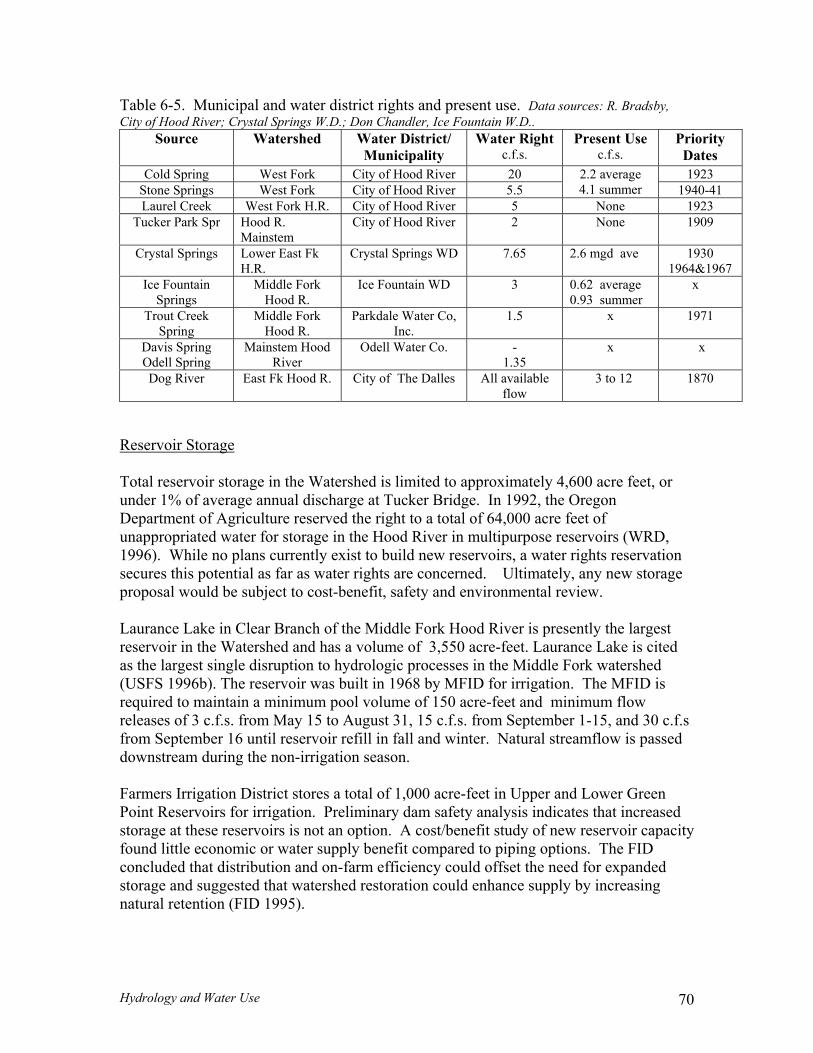
T unicip d presen . Data source y, City of Hood River; Crystal Springs W.D.; Don Chandler, Ice Fountain W.D..
Water District/ pality
Water Right s.
Present Use c.f.
Priority Dates
able 6-5. M al and water district rights an t use s: R. Bradsb
Source WatershedMunici c.f. s.
Cold Spring West Fork City of Hood River 1923 20 average Stone Springs West FLaurel Creek West Fo
ork City of Hood River 5.5 2.2 4.1 summer 1940-41
rk H.R. City of Hood River 5 None 1923 Tucker Park Spr Hood R.
Mainstem City of Hood River 2 None 1909
Crystal Springs Lower East Fk H.R.
Crystal Springs WD 7.65 2.6 mgd ave 1930 1964&1967
Ice Fountain Springs
Middle Fork Hood R.
Ice Fountain WD 3 0.62 average 0.93 summer
x
Trout Creek Spring
Middle Fork Hood R.
Parkdale Water Co, Inc.
1.5 x 1971
Davis Spring Odell Spring
Mainstem Hood River
Odell Water Co. - 1.35
x x
Dog River East Fk Hood R. City of The Dalles All available flow
3 to 12 1870
Reservoir Storage
otal reservoir storage in the Watershed is limited to approximately 4,6T 00 acre feet, or
, reservation
ed
ation season.
ty
and suggested that watershed restoration could enhance supply by increasing atural retention (FID 1995).
under 1% of average annual discharge at Tucker Bridge. In 1992, the Oregon Department of Agriculture reserved the right to a total of 64,000 acre feet of unappropriated water for storage in the Hood River in multipurpose reservoirs (WRD
996). While no plans currently exist to build new reservoirs, a water rights 1secures this potential as far as water rights are concerned. Ultimately, any new storage proposal would be subject to cost-benefit, safety and environmental review. Laurance Lake in Clear Branch of the Middle Fork Hood River is presently the largest reservoir in the Watershed and has a volume of 3,550 acre-feet. Laurance Lake is cited as the largest single disruption to hydrologic processes in the Middle Fork watershed (USFS 1996b). The reservoir was built in 1968 by MFID for irrigation. The MFID is required to maintain a minimum pool volume of 150 acre-feet and minimum flow releases of 3 c.f.s. from May 15 to August 31, 15 c.f.s. from September 1-15, and 30 c.f.sfrom September 16 until reservoir refill in fall and winter. Natural streamflow is pass
ownstream during the non-irrigd Farmers Irrigation District stores a total of 1,000 acre-feet in Upper and Lower Green Point Reservoirs for irrigation. Preliminary dam safety analysis indicates that increased storage at these reservoirs is not an option. A cost/benefit study of new reservoir capacifound little economic or water supply benefit compared to piping options. The FID concluded that distribution and on-farm efficiency could offset the need for expanded torage s
n
Hydrology and Water Use 70
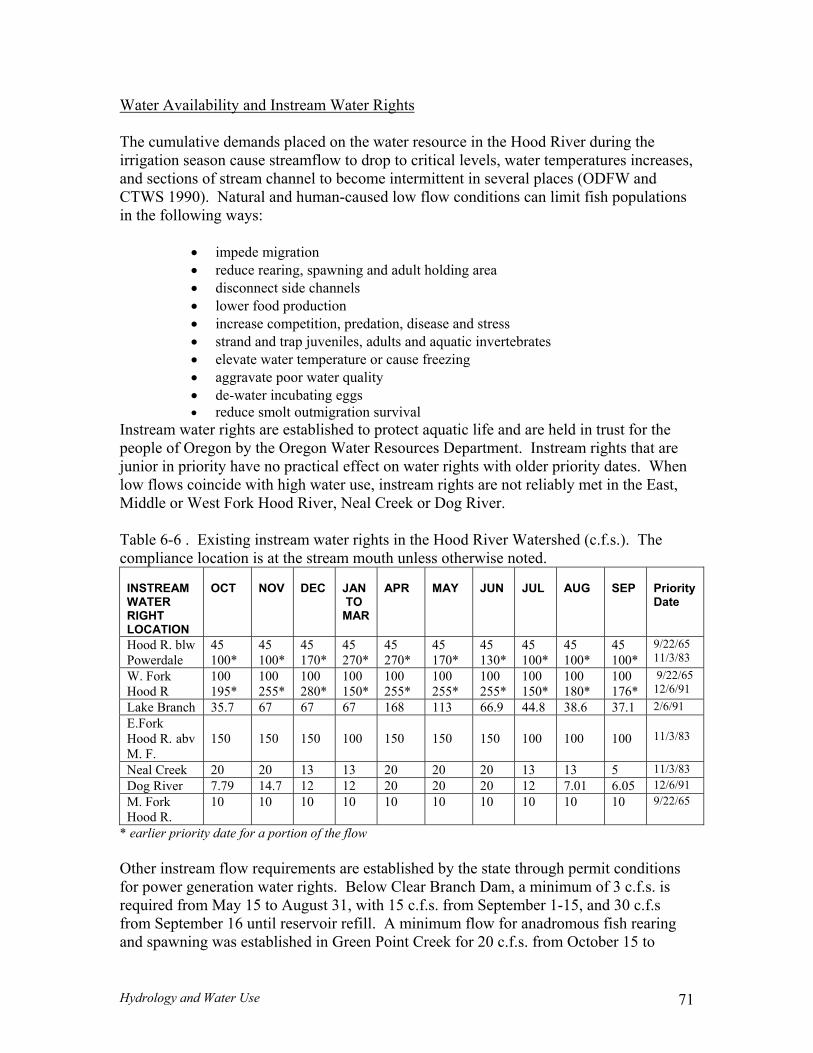
Water Availability and Instream Water Rights The cumulative demands placed on the water resource in the Hood River during the irrigation season cause streamflow to drop to critical levels, water temperatures increaand sections of stream channel to become intermittent in several places (ODFW and CTWS 1990). Natural and human-caused low flow conditions can limit fish populationsin the following ways:
• impede migration • reduce rearing, spawning and adult holding area • disconnect side channels • lower food production
ses,
competition, predation, disease and stress
• aggravate poor water quality
ast,
able 6-6 . Existing instream water rights in the Hood River Watershed (c.f.s.). The therwise noted.
y
• increase• strand and trap juveniles, adults and aquatic invertebrates • elevate water temperature or cause freezing
• de-water incubating eggs • reduce smolt outmigration survival
Instream water rights are established to protect aquatic life and are held in trust for the people of Oregon by the Oregon Water Resources Department. Instream rights that arejunior in priority have no practical effect on water rights with older priority dates. When low flows coincide with high water use, instream rights are not reliably met in the EMiddle or West Fork Hood River, Neal Creek or Dog River. Tcompliance location is at the stream mouth unless o
INSTREAM WATER RIGHT LOCATION
OCT NOV DEC JAN TO MAR
APR MAY JUN JUL AUG
SEP
PrioritDate
Hood R. blw Powerdale
45 100*
45 100*
45 170*
45 270*
45 270*
45 170*
45 130*
45 100*
45 100*
45 100*
9/22/65 11/3/83
W. Fork Hood R
100 100 100 100 100 100 100 100 100 100 9/22/6195* 255* 280* 150* 255* 255* 255* 150* 180* 176*
5 12/6/91
Lake Branch 35.7 67 67 67 168 113 66.9 44.8 38.6 37.1 2/6/91 E.Fork Hood R. abv M. F.
150
150
150
100
150
150
150
100
100
100
11/3/83
Neal Creek 20 20 13 13 20 20 20 13 13 5 11/3/83 Dog River 7.79 14.7 12 12 20 20 20 12 7.01 6.05 12/6/91 M. Fork 10 10 10 10 10 10 Hood R.
10 10 10 10 9/22/65
* earlier priority date for a portion of the flow Other instream flow requirements are established by the state through permit conditiofor power generation water rights. Below Clear Branch Dam, a minimum of 3 c.f.s. is required from May 15 to August 31, with 15 c.f.s. from September 1-15, and 30
ns
c.f.s om September 16 until reservoir refill. A minimum flow for anadromous fish rearing
and spawning was established in Green Point Creek for 20 c.f.s. from October 15 to fr
Hydrology and Water Use 71
December 31, and 40 c.f.s. from January 1 to April 15. No summer minimum flow standard presently exists in Green Point Creek. Summer streamflow in Green Point is repor concern NF d e , pers comm). No minimum flow stand ect at ot ID source potentinet water gains from pe p hed re ation mim flow ach iment The Oregon Water Resources Department determines water availability by individual dr r “ bili on ins rights plus the sum of all certificates, per r approved uses in relation to estimated natural flow that is exc of the o wa determi tion is EaFork Hood River above the Middle ecember, and for Middle Fork fromApril-December (Bailey 1997). No new consumptive water rights are available from the West Fork from Ju Th veloping atewide strea flow rest rities by the level of optimism that str ow can be increased cons e typ e ter by spotential for flow restoration strategies such as conservation es and transfers,
istribution, and measurement improvements.
ted as a by the MH (USFS 1996a) an by the FID its lf (Bryan, FIDards are in eff her F s, but al
pressure pi rojects and waters stor ay make proved stream protection ievable at no detr to agriculture (FID 1995).
ainage units o Water Availa ty Basins” based treammits o
eeded 80% time. A “n ter availability” na in effect for st Fork from May-D
ne- November. rating
e OWRD is de st moration prio eamflidering th e, value and siz of water uses, wa availability
, leaseason, and the
d
Hydrology and Water Use 72
Key Findings – Hydrology and Water Use
he following streams:
• e er • • s ve the Middle Fork • •
2. During it flows are diminished or depleted by use of
senior w te ood River from the EFID diversion to the Middle r eased water temperatures, a potential
. Given the rapid runoff characteristics of the Hood River Watershed, a lack of woody h
5 rk U G P an y a d
cially vulnerable to rain-on peak flow events due to a large proportion of area between 1500 and 4000 feet elevation.
6 Fo e r o rs a o
tivit D , s o an e r s h olo rec ry es)
Data Gaps • lativ loc ffe of wa ig n ditches a e d dr ge
ow and summer base flows
1. Instream water rights are established at 7 locations and are consistently met at 2 of
these: the Hood River below Powerdale Dam and Lake Branch. Instream rights, being junior to other water rights with earlier priority dates, are frequently not met in summer and fall in t
W st Fork Hood RivMiddle Fork Hood River Ea t Fork Hood River aboNeal Creek Dog River
cr ical conditions, summer lowa r rights in the East Fork H
Fo k confluence. Effects include incrmigration barrier, reduced rearing area and aquatic food production.
3. Summer streamflow restoration in Green Point Creek was identified as a need by
Farmers Irrigation District and the US Forest Service. 4
debris has eliminated the aquatic habitat structure necessary to produce historic fispopulation abundance.
. West Foespedrainage
Neal, pper Neal, reen oint, d Ton creek subw tershe s are -snow
. The Uuse ac
S rest S rvice eported a high risk f wate hed d mage from f restry or land ies in ivers, Trout Evan and L ng Br ch du to la ge gap in the forest
canopy (i.e. low ydr gic ove valu .
Cumupeak fl
e or al e cts road y, irr atio nd w tlan aina on
Hydrology and Water Use 73
7. WATER QUALITY Introduction
This Chapter identifies water quality concerns in the Hood River Watershed based on available information about dissolved oxygen, pH, nutrients, bacteria, pesticides, turbidity
and
and water temperature. Land use practices that potentially influence water quality as covered in this Chapter include water storage and diversion, agricultural and livestock runoff, failing septic systems, wastewater treatment and other discharges, toxic spills soil erosion. A list of piped discharges in the Watershed regulated and administered by Oregon Department of Environmental Quality (DEQ) is provided in the Appendix.
Beneficial Uses and Water Quality Criteria The Department of Environmental Quality establishes water quality standards to protect beneficial uses of the State’s waters. The designated beneficial uses listed for waterHood River Watershed are: public and private d
s in the omestic water supply, industrial water
supply, irrigation, livestock watering, anadromous fish passage, salmonid fish rearing, salmonid fish spawning, resident fish and aquatic life, wildlife and hunting, fishing, boating, water contact recreation, aesthetic quality and hydro power. Aquatic life, particularly salmonid spawning and rearing, is considered one of the most sensitive beneficial uses. Based on State of Oregon water quality standards, water quality limited stream segments were identified by DEQ (Table 7-1) and included on the 1998 303(d) list (DEQ 1998). Monitoring Efforts Water quality monitoring is routinely conducted at a variety of locations by the following natural resource agencies and groups in the Hood River Watershed:
• DEQ: bimonthly ambient monitoring on Hood River at the footbridge downstream
from I-84 (river mile 0.5) (1993-present) • US Forest Service (USFS), Confederated Tribes of the Warm Springs
Reservation (CTWS), Farmers Irrigation District (FID), Middle Fork I.D. (MFID), Hood River Watershed Group (HRWG), Mt. Hood Meadows Ski Resort: continuous temperature monitoring at least during the summer for the past 2-9 years depending on group
• Mt. Hood Meadows Ski Resort: continuous to quarterly monitoring for a variety of parameters (1992-present)
Water Quality 74
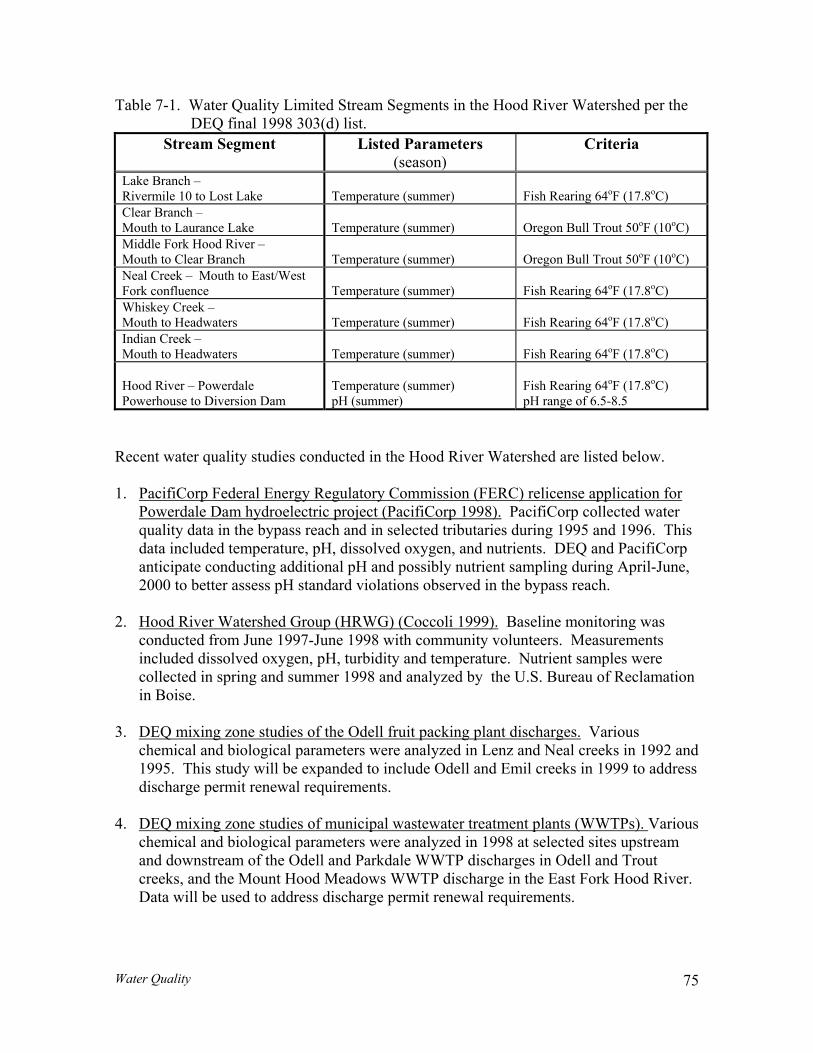
Table 7-1. Water Q atershed per the DEQ final 1998 303(d) list.
Stream Segment Listed Parameters Criteria
uality Limited Stream Segments in the Hood River W
(season) e Branch – ermile 10 to Lost Lake
Temperature (summer)
Fish Rearing 64oF (17.8oC)
ar Branch – uth to Laurance Lake
Temperature (summer)
LakRivCleMo Oregon Bull Trout 50oF (10oC) Middle Fork Hood River – Mouth t l
mperature (summer)
Oregon Bull Trout 50oF (10oC) o C ear Branch Te
Neal Cr –Fork co e
Fish Rearing 64oF (17.8oC)
eek Mouth to East/West nflu nce Temperature (summer)
Whiske reMouth t Temperature (summer)
Fish Rearing 64oF (17.8oC)
y C ek – o Headwaters
Indian Creekouth to Headwaters
Temperature (summer)
Fish Rearing 64oF (17.8oC)
– M
od River – Powerdale erhouse to Diversion Dam
Temperature (summer) pH (summer)
Fish Rearing 64oF (17.8o
pH range of 6.5-8.5 HoPow
C)
RC) relicense application for
Recent water quality studies conducted in the Hood River Watershed are listed below.
PacifiCorp Federal Energy Regulatory Commission (FE1.Powerdale Dam hydroelectric project (PacifiCorp 1998). PacifiCorp collected water quality data in the bypass reach and in selected tributaries during 1995 and 1996. Thisdata included temperature, pH, dissolved oxygen, and nutrients. DEQ and PacifiCorpanticipate conducting ad
ditional pH and possibly nutrient sampling during April-June,
2.
2000 to better assess pH standard violations observed in the bypass reach.
Hood River Watershed Group (HRWG) (Coccoli 1999). Baseline monitoring was conducted from June 1997-June 1998 with community volunteers. Measurements i
DEQ mixing zone studies of the Odell fruit packing plant discharges.
ncluded dissolved oxygen, pH, turbidity and temperature. Nutrient samples were collected in spring and summer 1998 and analyzed by the U.S. Bureau of Reclamation in Boise.
3. Various
and biological parameters were analyzed in Lenz and Neal creeks in 1992 and is study will be expanded to include Odell and Emil creeks in 1999 to address
4. l wastewater treatment plants (WWTPs).
chemical1995. Thdischarge permit renewal requirements.
DEQ mixing zone studies of municipa Various chemical and biological parameters were analyzed in 1998 at selected sites upstream and downstream of the Odell and Parkdale WWTP discharges in Odell and Trout creeks, and the Mount Hood Meadows WWTP discharge in the East Fork Hood River. Data will be used to address discharge permit renewal requirements.
Water Quality 75
5. DEQ intensive water quality monitoring. DEQ conducted intensive baseline monitoring at 39 sites in the Hood River Watershed during 1998 to prepare for development of a Total Maximum Daily Load (TMDL) plan. Maps of the 1998
ites are included in Appendix 7. The Hood River Watershed was prioritized for a TMDL plan primarily due to Endangered Species Act (ESA) listings for steelhead
ned
or
Summary of Available Water Quality Data and Concerns
n overall summary of water quality impairment as determined by monitoring described
allowed in the Hood River basin if surface water temperatures: (i) exceed 64 F (17.8 C) during times of salmonid rearing; (iii) exceed 55oF (12.8oC) during times of
, egg incubation and fry emergence from the egg; and (iv) exceed 50oF termined to support or be necessary to maintain the viability of native
e daily maximum tem eratures (7DMA). Temperature increases were measured in stream segments influ(stream in the Appendix. Riparian shade cond nt Manuaconcern • Lak Lost Lake to the Road 13 bridge near river mile 10
nUSFS data collected at the Road 13 bridge. Data was collected in 1995, 1996, and 1998 at this site and the 64oF criteria was exceeded all three years. Additional USFS data collected between 1994 and 1998 suggest that the river cools to below 64oF by the USFS boundary (river mile 3.5). Natural lake storage may be one factor in the heating observed in upper Lake Branch.
sampling s
and bull trout. A local Hood River Water Quality Technical Committee was convein early 1998. The Committee identified temperature, pH and nutrients, bacteria, toxics and sediment as concerns to be evaluated in the TMDL process. DEQ will convene a local stakeholder Advisory Committee during 2000 to develop TMDLs fstream segments where water quality standards are not met.
Aabove is provided in Table 7-4 near the end of this Chapter. Individual parameters are discussed below. Temperature Elevated water temperature is detrimental to cold water fish species and other aquatic life. According to Oregon Administrative Rule (OAR) 340 41 525 (2) (b) (A):
“...no measurable surface water temperature increase resulting from anthropogenic activities is o
o
salmonid spawning(10oC) in waters deOregon bull trout.”
These numeric criteria are based on a seven-day moving average of thpenced by water diversion, reservoir storage, natural lake storage and reduced riparian
side) shade. A data summary is provideditions are treated separately in Chapter 9 per the Oregon Watershed Assessme
l (Watershed Professionals Network 1999). Temperature was identified as a in the following stream segments:
e Branch – The segment belowis i cluded on the 1998 303(d) list for temperature (rearing criteria of 64oF) based on
Water Quality 76
• Clear Branch - Clear Branch below Laurance Lake reservoir is included on the 1998 303 criteria of 50oF) based on USFS data collected at the ion below t ata collected in Clear Branch directly downstream of Coe and nches show exceedences of the 50oF
997 and 1998. Re iew of data collected by the USFS and MFID in Clear nce Lake ment sho he
am to river mile 4.0 based on the 50oF bull trout criteria. This criteria was – directly ake in 19
approximate 1994, 199at ignificantly warms Clear Branch below the dam
t. al., 1997) durin t is hypotable to spawn su cessfully in Clear Branch immediately below the dam
arm temperat the heatin own. Questi er the 50o te nable standar the Wate
• er – The Middle Fork Hood River is included on the 1998 303(d) list for temperature (bull trout criteria of 50oF) for its entire length. Data collected by the USFS and CTWS at the Road 16 bridge (approximately river mile 4.5)
e
gate (near river mile 9.5) in 1998. The maximum 7DMA at this site was 61.9oF. In the Watershed Analysis of the East Fork Hood River, a comparison of
e
to the EFID irrigation canal which can occasionally divert 100% of streamflow during the low flow season; and (2) the lack of
• re
m 7DMA of 63.5oF). The probe appeared to have been buried during most of July, so it is possible that the criteria would have been exceeded at this site as well. The data suggests that
(d) list for temperature (bull trout USGS Gaging Stat he dam since 1994. D
Eliot Braby MFID
criteria in 1 vBranch above Laura indicates that this seg uld also be listed from tlake upstreexceeded at two sites upstream from the l 97 and 1998 and at the 2840-640 bridge ( ly river mile 4.0) in 5 and 1998. Laurance Lake creates a heat sump th(Buchanan e
sg parts of the year. I hesized that bull trout
would not be cbecause of the w ures. The causes of g in Clear Branch abovethe lake are unknor naturally attai
ons exist as to wheth in some streams in
F criteria is an appropriashed. d r
Middle Fork Hood Riv
show that the 50oF criteria was exceeded every year from 1994 -1998.
• Compass Creek – The lower portion of Compass Creek is designated by ODFW as supporting bull trout spawning, rearing and adult residence (ODFW 1997). Based on data collected by the USFS and MFID at the mouth of Compass Creek, the 50oF bull trout criteria was exceeded in 1996, 1997 and 1998. As in upper Clear Branch, questions have arisen as to whether the 50oF criteria is naturally attainable or realistic in this stream.
• East Fork Hood River – Data collected by CTWS at the Trout Creek railroad bridg
near river mile 0.6 shows that the 64oF criteria was exceeded in 1990, 1992, 1994, 1996 and 1998. This data suggests that the lower East Fork Hood River should havebeen included on the 303(d) list for temperature. The HRWG collected data at the EFID head
temperatures among monitoring sites in the East, Middle, and West Forks and thHood River at Powerdale Dam found that the East Fork contributed the hottest temperatures (USFS, 1996). The USFS suggested that probable causes are: (1) the substantial withdrawal of the East Fork in
riparian shade along much of the East Fork system.
Odell Creek – Data collected by the HRWG in 1998 show that the 64oF temperatucriteria was exceeded in 1998 at approximately rivermile 1.0. Continuous temperature data was also collected from Odell Creek at Sylvester Drive (maximu
Water Quality 77
temperature is an issue for Odell Creek along most of its length, and that it shobeen included on the 303(d) list.
Neal Creek – Neal Creek is included on the 303(d) list for temperature (rearing criteriaof 64oF) from the mouth to the confluence of the East and West Forks. The listing is based on data collected by PacifiCorp near the mouth of Neal Creek in 1996. Data collected by the HRWG and CTWS in 1998 support this listing, with an observed maximum 7DMA of 69.3oF at the mouth. Data collected by the HRWG in 1998 atmouths of the East and West Forks Neal Creek indicate maximum 7DMAs of 58.6oF and 62.6oF, respectively, indicating a greater heat contribution
uld have
•
the
from the West Fork. • hiskey Creek/Spring Creek – Whiskey Creek is included on the 303(d) list for
tempe ata collected at the mouth in 1996. Data collected by the HRWG in 1998 support this
ded at the mouth of Spring Creek (64.9oF). Spring Creek should also
have been included on the 303(d) list based on this data.
Indian Creek – Indian Creek is included on the 303(d) list for temperature (rearing
maximum 7DMA of 64.4oF observed near the Union Avenue power station.
•
o
all as a mitigation measure in the new
uring 2000, DEQ will convene a local Advisory Committee to develop a TMDL for
not Nu
Wrature (rearing criteria of 64oF) for its entire length based on PacifiCorp d
listing, with maximum 7DMAs of 66.2oF at the mouth and 68.2oF above the confluence with Spring Creek. 1998 HRWG data indicated that the rearing standardwas also excee
•
criteria of 64oF) for its entire length based on PacifiCorp data collected at the mouth in 1996. Data collected by the HRWG in 1998 support this listing with a
Hood River – The lower Hood River from the Powerdale powerhouse to the diversiondam is included on the 303(d) list for temperature (rearing criteria of 64oF) based nPacifiCorp data collected in 1995 and 1996. This data shows that daily maximum temperatures increase within the bypass reach by up to 2-30 F. PacifiCorp plans to ncrease instream flow during summer and fi
hydropower license with a goal of decreasing temperatures in the bypass reach. Datacollected by the CTWS and HRWG suggest additional temperature concerns upstreamof Powerdale Dam. CTWS monitoring begun in 1990 immediately above the dam indicated temperatures exceeding the criteria in 1991, 1994, and 1998. In 1998, the HRWG collected data near Tucker Bridge and observed a slight exceedence of the64oF criteria (maximum 7DMA of 64.4oF).
Dtemperature for the Hood River system. Additional stream segments may be identified through the TMDL process, particularly as compliance with the 55oF spawning criteria has
yet been evaluated.
trients and pH
trients” refer to the elements phos
u phorous and nitrogen that stimulate algae and plant owth in water. Algae and aquatic plants process sunlight into food for aquatic insects
“Ngr
Water Quality 78
and other organisms and are an important part of the stream ecosystem. However, essive inputs of nutrients can over-stimulate plant growth and harm beneficial uses by ing the pH level, biological and biochemical oxygen demand, creating nuisance algae rrigation canals, and changing aquatic communities. The State of Oregon standard for atic weeds and algae (DEQ 1999) states that:
“... the development of fungi or other growths having a deleterious effect on stream bottoms,fish or other aquatic life, or which are injurious to health, recreation or industry shall noallowed.”
sphorus and nitrogen are the principal growth-limiting nutrients in water. Potentiarces of these nutrients from human activities include wastewater discharge, agricultura livestock runoff, and failing septic systems. Although no State numeric standard for er nitrogen or phosphorus presently exists, target concentrations in the Hood River may stablished as part of the TMDL process. An indicator value of 0.30
excraisin iaqu
t be
Pho l sou l andeithbe e mg/L for total nitrates on purposes (Watershed Professionals
for predisc
he pH of water is a measure of the concentration or activity of hydrogen ions in the water
speranElefish
“...pH values should not fall outside the range of 6.5 to 8.5
To e HR l Ap Hoenrero • ale
in 1995 and 1996. The pH standard of 8.5 was exceeded in the downstream end of the bypass reach in May 1995
esis
is recommended for water quality evaluatiNetwork 1999). An indicator value of 0.10 mg/L for total phosphorus is recommended
vention of eutrophication nuisances in flowing waters (i.e. streams) that do not harge directly to a lake or reservoir (USEPA Quality Criteria for Water 1986).
Texpressed as the negative log of free hydrogen ions. Values from 0 to 7 indicate acidic waters and from 7 to 14 indicate alkaline waters. Spawning and rearing of salmonid fish
cies are the most sensitive beneficial uses affected by pH. Values of pH outside the ge in which a species evolved may result in both direct and indirect toxic effects. vated pH levels can cause dramatic increases in toxicity of other pollutants and cause kills. The pH standard in the Hood Basin (DEQ 1999) states that:
. “
date, pH and nutrient data has been collected by PacifiCorp (1999), DEQ, and by thWG (1999). Data from the 1998 DEQ intensive monitoring study are in the Technicapendices. The available data indicates potential nutrient enrichment problems in theod River Watershed, particularly in its lower portions. Possible sources of nutrient ichment include: fertilizer use; on-site septic systems; WWTP discharges; and soil sion. Areas of potential concern for nutrients and pH are listed below.
Hood River below Powerdale Dam - The mainstem Hood River below the PowerdDam is included in the 303(d) list for pH. As part of their pending FERC relicensing process, PacifiCorp investigated water quality upstream and downstream of Powerdale Dam and in Whiskey, Indian, Odell and Neal creeks
(pH of 8.9 observed in a grab sample) and in June 1996 (daily maximum pH of greaterthan 8.5 observed regularly in diel studies, maximum pH of 8.97). PacifiCorp scientists hypothesized that these pH violations are caused by increased photosynthby attached algae in the bypass reach. Increased algal activity is believed to be stimulated by the combined effect of flow modification in the bypass reach and
Water Quality 79
associated temperature increases, and elevated nutrient inputs from Odell, Neal, Whiskey and Indian creeks. Both the PacifiCorp study and monitoring conducted by DEQ and the HRWG indicate that the evaluation criteria of 0.30 mg/L for total nitrates
•
lower East Fork and the EFID canal. Trout and Wishart creeks were identified as Q
ons of the
,
Dis
and 0.10 mg/l for total phosphorus were exceeded in Indian, Whiskey, Neal, Lenz, Odell, and McGuire creeks at some point during each study. During these studies, no violations of the pH standard were observed in these tributaries.
East Fork Hood River Watershed – The Hood River Technical Committee identified the East Fork Hood River watershed as another area where nutrient enrichment and pHmight be a problem. This concern was based on observations of nuisance algae in the
tributaries with high potential nutrient contributions. Data collected in the 1998 DEintensive study confirmed that Wishart and Trout creeks had high nutrient concentrations, with nitrate concentrations well above the evaluation criteria of 0.30mg/L. Baldwin Creek had slightly elevated nitrate concentrations. No violatipH standard were observed. Nutrients in the East Fork mainstem were well below indicator values, except for the monitoring site located downstream of Newton Creekwhich had elevated total phosphorus levels.
solved Oxygen
equate dissolve Ad d other aquatic life.
ome aquatic species including salmonids are sensitive to reduced concentrations of D.O.,
freecou wat ls (intcon sedTheacc , alti
“During the periods from spawning until fry emergence, D.O. in the water column shall not , is
cted by DEQ and PacifiCorp (1999). Based on results of the 1998 EQ intensive monitoring study, D.O. concentrations in the Watershed ranged from 8.3 –
from 7.8 – 10.7 mg/L in August, and from 8.0 – 11.8 mg/L in st D.O. concentration observed during each sampling period was from
d oxygen (D.O.) is essential to fish, invertebrates, anSespecially during early life stages as eggs and alevins (hatchlings prior to developing into
-swimming fry) . D.O. concentrations in the water column vary naturally over the rse of the day due to changes in temperature and photosynthesis. D.O. levels in theer are typically lowest during the early morning hours. The D.O. level within graveergravel D.O., or I.G.D.O.) directly affects the survival of salmonid eggs. I.G.D.O centrations are influenced by water column D.O. concentrations, the percentage of fineiment in the gravel pores, sediment oxygen demand, and oxygen demand of the eggs. water quality standard for dissolved oxygen is somewhat complicated, taking into ount the salmonid life stage present, the I.G.D.O. concentrations, barometric pressuretude and temperature. The standard (DEQ 1999) is summarized as follows:
be less than 11.0 mg/L. However, if the minimum I.G.D.O., measured as a spatial mean8.0 mg/L or greater, then the water column D.O. criterion is 9.0 mg/L. During periods of salmonid rearing, D.O. in the water column shall not be less than 8.0 mg/L.”
D.O. data has been colleD11.7 mg/L in June,
ctober. The loweOthe site on Lenz Creek near the Stadelman Drive WWTP pump station. This was the only site that violated the rearing criteria of 8.0 mg/L. As with temperature, determination of compliance with water quality criteria for D.O. is contingent on the final resolution of
Water Quality 80
spawning, incubation and rearing times and species usage in each stream reach. Thand tribal fisheries agencies will resolve this matter with the Hood River Water Quality Technical Committee. Bacterial Contamination
e state
Waconstat
ed
r the .
imited bacterial data was collected by DEQ and PacifiCorp in studies noted earlier.
list
.
nt plant (WWTP) permits for the Odell WWTP discharge into Odell Creek, the Parkdale WWTP discharge into Trout Cre arge into the
ast Fork Hood River. These data will be evaluated by DEQ in 1999 to address discharge
h n
ndard
• EQ
ream as
ter contact recreation is the beneficial use most directly affected by bacterial tamination of surface waters. The bacteria standard for surface waters (DEQ, 1999) es:
“...organisms of the coliform group commonly associated with fecal sources must not excethe following limits: (a) a 30-day log mean of 126 E. coli organisms per 100 ml, based on a minimum of five samples; or (b) 406 E. coli organisms per 100 ml based on one single sample.”
No Watershed stream segments are presently on the 303(d) list for bacteria based on data collected to date. Routine bacterial monitoring is not conducted by the County Health Department or other entity, except for a DEQ monthly ambient monitoring site neaHood River mouth where significant bacterial contamination has not been observedLPacifiCorp (1999) observed no violations of the bacterial standards in the lower Hood River in 1995 or 1996. DEQ did observe exceedence of the standards in its 1992, 1995 and 1998 studies based on the single grab sample criteria of 406 E.coli organisms per 100ml. While not enough data was collected to include any stream segments on the 303(d) for bacteria, this data does indicate areas of possible concern to be investigated further DEQ also sampled for bacteria in 1998 in relation to wastewater treatme
ek, and the Mount Hood Meadows Ski Resort WWTP dischEpermit renewal. • Wishart Creek – Wishart Creek was monitored during the DEQ intensive water
quality sampling in June and August 1998. Samples were collected near WoodwortDrive and near Perron Point Road. The bacteria standard was exceeded at the PerroPoint Road site on August 5th.
• Baldwin Creek - Samples were collected from 2 sites during the DEQ intensive water
quality sampling in 1998. One site was at the Highway 35 crossing and the other downstream at the end of Baldwin Creek Road. The E. coli standard was exceeded at the Highway 35 crossing on June 4th. At the end of Baldwin Creek Road, the stawas exceeded on August 5th and October 7th.
Odell Creek – Samples were collected at 3 Odell Creek sites during the 1998 Dintensive water quality study –the Sylvester Road crossing, upstream of the confluence with McGuire Creek near John Weber Park, and at a site about 0.5 miles downstof Dethman Ridge Drive and Odell WWTP (river mile 1). The E. coli standard w
Water Quality 81
exceeded at least one of these sites each sampling period. At Sylvester Drive, thestandard was exceeded on August 6th; at John Weber Park on June 4th and August 6th; and downstream from the Odell WWTP on October 5th. The October 5th exceedence appeared to be related to a malfunction at the Odell WWTP.
McGuire Creek – Samples were collected at 2 sites during the D
• EQ 1998 study – at
the Davis Drive crossing and upstream of the confluence with Odell Creek near John
iamond s.
• y –
d 1995 fruit packing plant study, samples
were collected in Neal Creek upstream and downstream of Lenz Creek. The E. coli standard was exceeded in both years at the upstream site and only in 1992 at the
.
li
•
th at rd
Weber Park. Samples were collected at two other locations during the 1992 and 1995 fruit packing plant study above and below the Diamond Odell plant discharge. E. coli counts at the Davis Drive site were less than 100 organisms/100 ml on all three sampling days in 1998. Downstream near John Weber Park, however, the E. coli standard was exceeded August 6th and October 8th in 1998. In the 1992 packing plant study, the E. coli standard was exceeded upstream and downstream of the DOdell plant September 15th. On October 4th in 1995, the standard was met at both site
Neal Creek – Samples were collected at 2 sites during the 1998 DEQ intensive studat the Highway 35 crossing and near the mouth. The E.coli standard was not exceededin any samples collected. During the 1992 an
downstream site • Lenz Creek – Samples were collected at the mouth and near the Stadelman Drive
WWTP pump station during the 1998 DEQ intensive study. The E. coli standard was not exceeded for any samples collected at either site. Samples were also collected at the mouth of Lenz Creek during the 1992/1995 fruit packing plant study. The E. costandard was exceeded at in 1992 but not in 1995.
• Whiskey Creek and Spring Creek – During the 1998 DEQ intensive study, samples
were collected near the Whiskey Creek mouth, the mouth of Spring Creek, and Whiskey Creek upstream of Spring Creek. Samples were not collected at the latter two sites during June. The E. coli standard was exceeded at the upstream Whiskey Creeksite on August 6th; the Spring Creek mouth on August 6th and October 8th; and near themouth of Whiskey Creek on August 3rd.
Indian Creek – Samples were collected at 3 locations during the 1998 DEQ intensive study – at Country Club Road, Alameda Road crossing, and near the PPL power stationon Union Avenue. Samples were not collected from the upper two sites during June ampling. The E. coli standard was exceeded on August 6th and October 8s
Alameda Road, and on August 3 at Union Avenue, but was not exceeded at Country Club Road on any sampling dates.
Water Quality 82
Turbidity Turbidity is a measure of water clarity using light penetration through a water sample. In
urbidity serves as a surrogate for measuring suspended sediment - the as silts and clays carried along in the water column.
uspended sediment interferes with the sight-feeding ability of fishes and can damage gill reation,
d almonid incubation and invertebrate communities. The state standard for turbidity
EQ 1999) specifies that:
his standard is useful when assessing a point source (i.e. individual or end-of-pipe)
ted.
l en
vestock areas that drain to streams; (4) winter sanding of roads and the Mount Hood
the highest turbidity was observed in April by the HRWG. It is likely that ome of the higher turbidity readings are due to glacial runoff – for example, near the
rk Hoturberosion. Sites of potential concern include:
as
sured during August and October sampling. On August 6th, the turbidity was 17 NTU at the Sylvester Road site,
many streams, tsmaller particles of soil suchStissue. Suspended sediment can carry other pollutants and may interfere with recirrigation, and aesthetics. Deposition of sediment can fill in pools or gravel interstices anaffect s(D
“...no more than a ten percent cumulative increase in natural stream turbidities as measuredrelative to a control point immediately upstream of the turbidity causing activity.”
Tdischarge, but does not fully address nonpoint source (i.e. runoff) concerns. DEQ is considering a review of state sediment standards during an upcoming standards review process. The Oregon Watershed Assessment manual recommends using an evaluation criteria of 50 NTU as the level at which sight feeding of salmonids is negatively affec Assessment of turbidity in the Hood River Watershed is complicated by natural seasonaglacial melt and occasional natural landslides in steep terrain. Glacial melt occurs betweJuly and October in most years. Potential human-caused sources of turbidity identified by the Hood River Water Quality Technical Committee included: (1) sediment runoff from roads and construction sites; (2) return flow from eroding irrigation ditches; (3) denudedliMeadows parking lots; and (5) landslides from forest or irrigation activities. Chapter 9 assesses sediment sources separately as per the Oregon Watershed Assessment Manual. The highest turbidities in the 1998 DEQ intensive study were observed during August sampling, while smouth of the Middle Fork Hood River (44 NTU), below Newton Creek in the East Fo
od River (44 NTU), and in the Hood River mainstem (33-37 NTU). In contrast, high idity values observed in some of the lower tributaries are potentially due to soil
Wishart Creek – Wishart Creek had the highest turbidity level measured during
the 1998 DEQ intensive study. On August 5th 1998, a 50 NTU turbidity level wobserved at Parrons Point Road while 28 NTU was measured on the same day upstream at Woodworth Drive.
Odell Creek – Elevated turbidity was mea
decreasing to 10 NTU downstream from the Odell WWTP. On October 5th, the highest turbidity observed in October sampling (30 NTU) was in Odell Creek below the WWTP. This relatively high turbidity was probably related to an apparent malfunction at the WWTP.
Water Quality 83
McGuire Creek – An NTU reading of 17 NTU was observed at John Weber Pon August 6th 1998. Turbidities were less than 15 NTU on all other sampling dates in the DEQ intensive monitoring study and DEQ fruit packing plant surveys in 1992 and 1995.
ark
Neal Creek – Elevated turbidities were observed in Neal Creek by both DEQ and
pril
e
Whiskey Creek – A relatively high turbidity of 22 NTU was observed at the
oxics
the HRWG volunteers. During the September 1992 DEQ fruit packing plant survey, a turbidity of 62 NTU was observed both upstream and downstream of Lenz Creek. From June 1997 to June 1998, the HRWG (1999) monitored turbidityat 6 sites. The median turbidity value at all sites was less than 10 NTU, however peak values ranged from 9 NTU in the West Fork Neal Creek to 377 NTU (A13, 1998) at the Neal Creek mouth. During the 1998 DEQ intensive study, thehighest turbidities were observed in August sampling: 35 NTU at the West Fork Neal Creek mouth, 28 NTU at the East Fork Neal Creek mouth, and 18 NTU at thmouth of Neal Creek.
mouth of Whiskey Creek on June 2, 1998. This site had turbidities of 15 and 12 NTU in August and October sampling, respectively.
Indian Creek –The only Indian Creek site with elevated turbidity during the 1998 intensive was at Alameda Road where turbidity was 30 NTU on August 6.
T
Pesticides. Pesticides, herbicides and fungicides are widely used in apple and pear hards, residential and silvicultural uses, and in right-of-way and road maintenance. A l of 719,188 pounds of 43 different pesticides were used in Hood River County in 1987inhold et al. 1989).
orctota (Re
use or indOdOremalathion, 2-4D, diuron, and endosulfan as pesticides used in the Watershed with the
reatest potential toxicity to aquatic organisms. Three of these compounds are
OPyea gration upsmig egrade relatively quickly (soil half-life <40 days) there is potential for exposure to aquatic life and even low doses can be neurotoxic to fish. The inhibition of the enzyme acetylcholine esterase (AchE) in fish tissue can be measured and correlated with the exposure and toxicity of organophosphate and carbamate pesticides (Foster 1998).
Hood River Water Quality Technical Committee members were concerned that pesticide
in orchards, forest land, right-of-ways, and residential properties might directly irectly contribute to reduced fish populations in the Hood River. A direct fish kill in ell Creek occurred in the past from pesticide spraying (J. Newton, ODFW, pers comm). gon Department of Agriculture (ODA) technical staff identified carbaryl, diazinon,
gorganophosphate (OP) insecticides, which can be highly toxic to fish.
pesticides are used on orchards in the winter, spring, and summer and may be used r round in urban areas. Use times overlap with mature wild winter steelhead mitream to spawn, spawning, early life stage development, and juvenile steelhead ration downstream. Although OPs d
Water Quality 84
Limited testing for pesticide contamination in the aquatic environment has occurred in the ood River watershed to date. Quarterly sampling conducted by PacifiCorp in 1995 found
y d, and
indane and diazinon were observed in the water sample ollected from the mouth of Neal Creek. The fish tissue samples will be analyzed for
Ach
ecause use of pesticides in orchards was raised as a potential concern, a cooperative pilot r six
e Trout Creek railroad bridge, and Trout Creek near the mouth. Sampling was timed to
re ts
“Chronic criteria = 41 ng/L, Acute criteria = 83 ng/L”
ns
ria = none set”
BasWatersprogram s in surface quatic life, determining the mechanism by which pespractic
Hno detectable levels of pesticides in the Powerdale dam study area (PacifiCorp 1998). Water, sediment and fish tissue samples were collected at five locations by DEQ in Ma1998: Hood River above Powerdale dam, West Fork Hood River at Lost Lake Roathe mouths of Neal Creek, East Fork Hood River and Middle Fork Hood River. Sampling was not timed with any known periods of pesticide use on the land. Samples were analyzed for PCBs, selected chlorinated pesticides (such as DDT and DDT-metabolites) and OP insecticides. DDT and/or its metabolites were found in sediment samples at all five locations. In addition, lc
E inhibition, although this analysis is not yet complete.
Bstudy was initiated in 1999 by DEQ, OSU Cooperative Extension, and the Hood RiveGrower Shipper Association. A limited number of water samples were collected fromlocations in the Hood River Basin in March, April and June of 1999. Samples were collected from: the mouth of Neal Creek, the mouth of Indian Creek, Hood River belowthe PacfiCorp tailrace, West Fork Hood River at Lost Lake Road, East Fork Hood River atthcoincide with the times of pesticide use in the orchards and occurrence of anadromous salmonids in the adjacent streams. These samples were analyzed for total (DEQ laboratory) and dissolved (ODA laboratory) OP pesticides. Chlorpyrifos (Lorsban) was detected in the March and April samples at all locations but not all samples (Table 7-2). Chlorpyrifos concentrations in Neal and Indian Creeks weabove both the acute and chronic state water quality criteria (DEQ 1999). The criteria sethe following chlorpyrifos concentration limits to protect freshwater aquatic life: Azinphos methyl (Guthion) was detected in samples collected in June at Neal Creek, Indian Creek, Hood River, and Trout Creek (Table 7-3). Azinphos methyl concentratioin Neal and Indian Creeks and the Hood River were above the chronic water quality criteria for Guthion (DEQ 1999). The criteria sets the following Guthion concentration limits to protect freshwater aquatic life: “Chronic criteria = 10 ng/L, Acute crite
ed on the results of this pilot study, collaborative efforts are now underway in the hed to find funding to conduct a more comprehensive pesticide monitoring
. The proposed work would include assessing whether pesticide concentration waters are adversely affecting a
ticide residues are reaching surface waters, and implementing best management es to prevent pesticide contamination of surface waters.
Water Quality 85
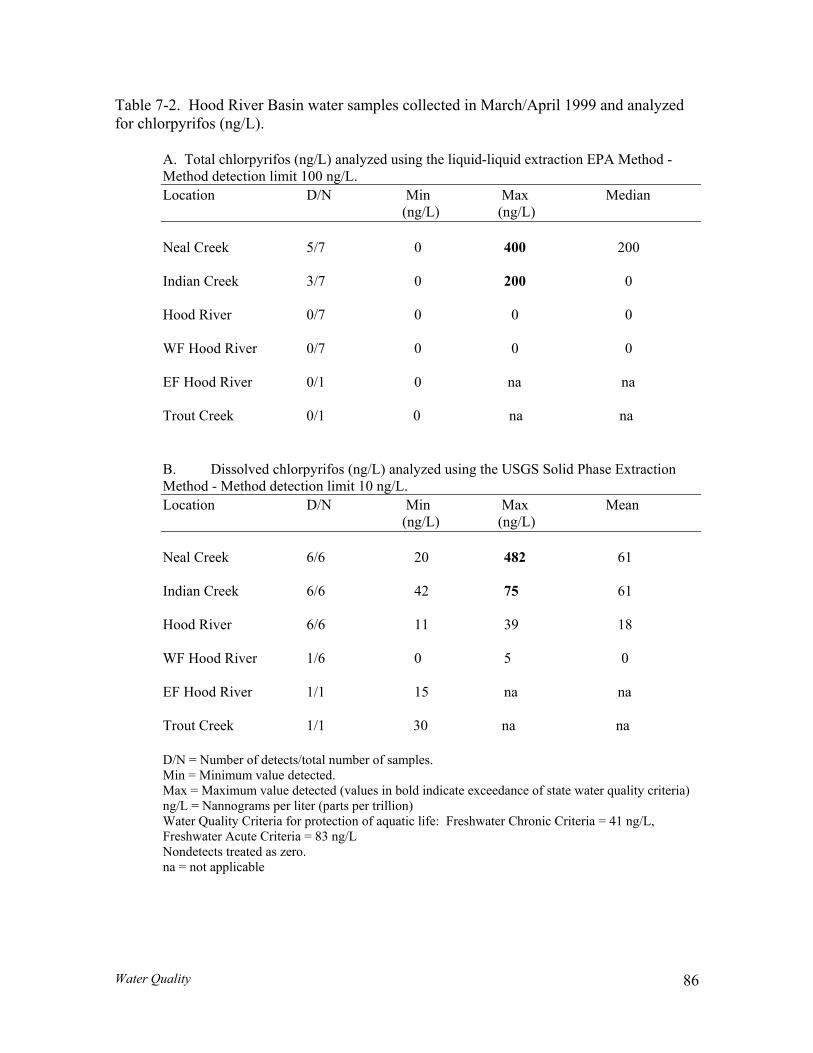
Tabfor chlo
ifos (ng/L) analyzed using the liquid-liquid extraction EPA Method -
le 7-2. Hood River Basin water samples collected in March/April 1999 and analyzed rpyrifos (ng/L).
A. Total chlorpyrMethod detection limit 100 ng/L. Location D/N Min Max Median (ng/L) (ng/L) Neal Creek 5/7 0 400 200
Indian Creek 3/7 0 200 0 Hood River 0/7 0 0 0
WF Hood River 0/7 0 0 0
B. Dissolved chlorpyrifos (ng/L) analyzed using the USGS Solid Phase Extraction
hod detection limit 10 ng/L. ocation D/N Min Max Mean
EF Hood River 0/1 0 na na
Trout Creek 0/1 0 na na
Method - MetL (ng/L) (ng/L) Neal Creek 6/6 20 482 61
Indian Creek 6/6 42 75 61
D/N = Number of detects/total number of samples.
ia)
,
Hood River 6/6 11 39 18 WF Hood River 1/6 0 5 0
EF Hood River 1/1 15 na na
Trout Creek 1/1 30 na na
Min = Minimum value detected. Max = Maximum value detected (values in bold indicate exceedance of state water quality criterng/L = Nannograms per liter (parts per trillion) Water Quality Criteria for protection of aquatic life: Freshwater Chronic Criteria = 41 ng/LFreshwater Acute Criteria = 83 ng/L Nondetects treated as zero. na = not applicable
Water Quality 86
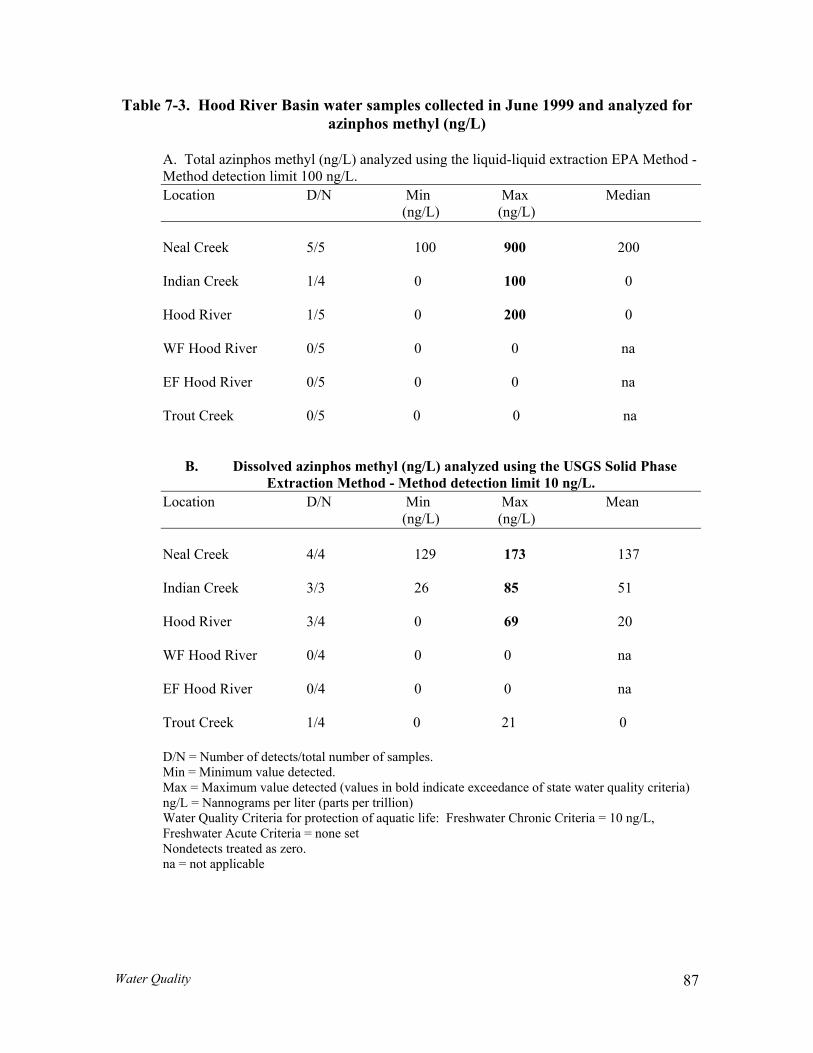
Table 7-3. Hood River Basin water samples collected in June 1999 and analyzed for azinphos methyl (ng/L)
A. Total azinphos methyl (ng/L) analyzed using the liquid-liquid extraction EPA MethodMethod detection limit 100 ng/L. Location D/N Min Max Median
-
(ng/L) (ng/L) Neal Creek 5/5 100 900 200
Indian Creek 1/4 0 100 0 Hood River 1/5 0 200 0
ax Mean
WF Hood River 0/5 0 0 na
EF Hood River 0/5 0 0 na
Trout Creek 0/5 0 0 na
B. Dissolved azinphos methyl (ng/L) analyzed using the USGS Solid PhaseExtraction Method - Method detection limit 10 ng/L.
Location D/N Min M (ng/L) (ng/L) Neal Creek 4/4 129 173 137
Indian Creek 3/3 26 85 51 Hood River 3/4 0 69 20
0 21 0
D/N = Number of detects/total number of samples.
eria)
WF Hood River 0/4 0 0 na
EF Hood River 0/4 0 0 na
Trout Creek 1/4
Min = Minimum value detected. Max = Maximum value detected (values in bold indicate exceedance of state water quality critng/L = Nannograms per liter (parts per trillion) Water Quality Criteria for protection of aquatic life: Freshwater Chronic Criteria = 10 ng/L, Freshwater Acute Criteria = none set Nondetects treated as zero. na = not applicable
Water Quality 87
Accidental Toxic Spills Severa orted due to accidental spills or releases of fuels or other toxic substances. On Easter Sunday 19 toxic spil rred in Nea when a diesewhen f sh cement spilled into Neal Creek as part of a water pipeline construction project. In 1996, hydraulic fluid spilled from machiner sed during entered Baldwin Creek via a roadside ditch. As population and vehi affic increases in the Watershed, the potential for accidental spills and fish kills m e as well.
l fish kill incidents have been rep95, a l occu l Creek
l fuel line used for frost control smudge pots ruptured. In1997, a fish kill occurred re
y u Highway 35 wideningcle tray ris
Water Quality 88
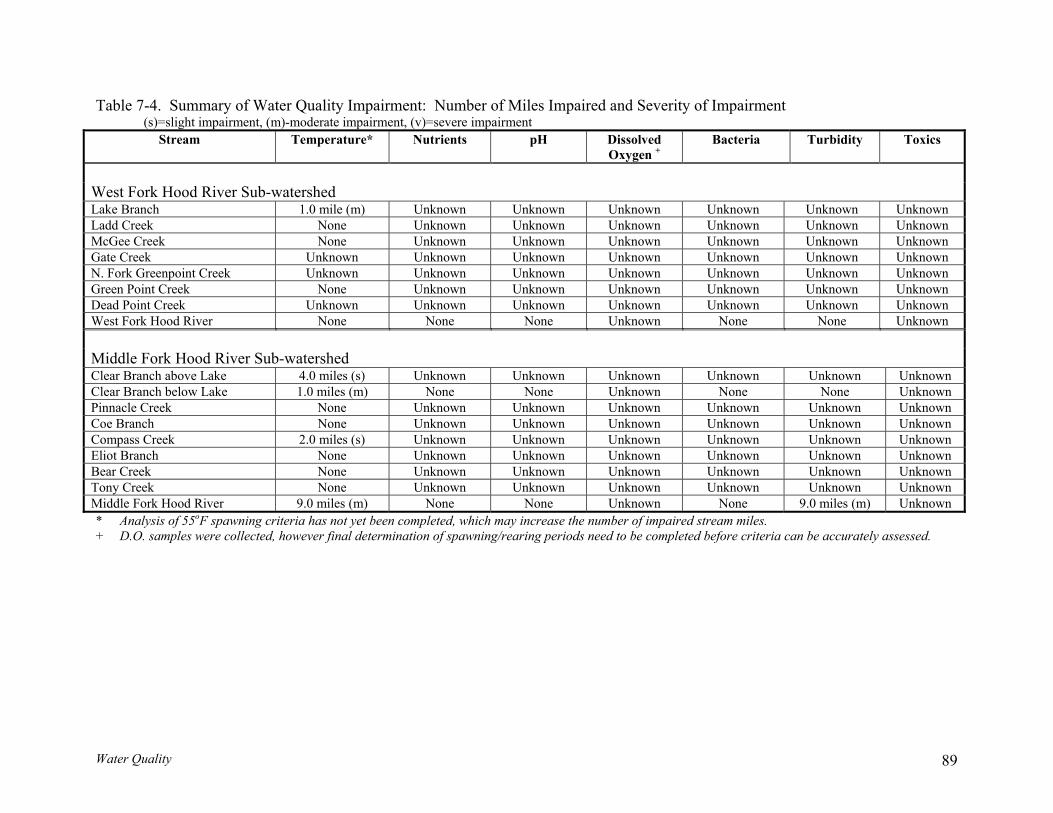
Table 7-4. Summary of Water Quality Impairment: Number of Miles Impaired and Severity of Impairment ht impairment, (m)-m rate impairment, (v)=severe impairment
Stream Temperature* Nutrients pH Dissolved Oxygen +
Bacteria Turbidity (s)=slig ode
Toxics
n nnnn nn n
nown nown nown nown nown nown nown nown nown
West Fork Ho shod
int
R
Cr
ver
iver
eek
Middle Fork Hood River Sub-watershed
wn
Sub-
g crwere collected, however final
water1
41.
2
ed mileNonNon
nkn
Non
NonNon
Non
miles no
Lake Branch .0 ( U ow U Unk wn nk n nk nknowm)
t yet b
nknnknnkn
No
nkn
plete
n nn
n
whpaw
nknonknnknonknnknnknonknNon
nknoNonnknonknnknonknonknnknNonncreing
wnown
e
wownwn
e aseper
nokno
nkn
kno
nono
no
kno of i
pair
UUUU
U
stre
nownowown
one
now
mi c
UU
UU
n be
nownownownownownownowne
nowone nownownownownownowiles
ccur
n n
n n n
(m
ate
U U U U
U U
UU
UUUUUUUUU
asse
Ladd Creek e U ow U Un wn nk n nk nknow McGee Creek e U ow U wn Unknown nkn Unk n nknow
n n n
n
n
n n n
the niods n
Gate Creek Unknown Unknown U own Unknown nknown Unk n nknow N. Fork Greenpo U own Unknown U ow U own Unknown Unk n nknowGreen Point Creek None Unknown U w Unknown Unknown Unk n nknow Dead Point Creek Unknown Unknown U ow Unknown Unknown Unk n nknowWest Fork Hood Ri e ne Un wn N No nknow
Clear Branch above Lake .0 miles (s) Unknown U w Unknown Unknown Unk n nkClear Branch below Lake 0 miles (m) None e Unknown None N nkPinnacle Creek e Unknown U Unk wn Unknown Unk nkCoe Branch e U ow U Unk wn nk n nk nkCompass Creek .0 miles (s) Unknown U Unknown Unknown nk nkEliot Branch e Unknown U w Unk wn Unknown Unk n nkBear Creek None Unknown U ow Unknown Unknown Unk n nkTony Creek None Unknown U ow Unknown Unknown Unk n nkMiddle Fork Hood River 9.0 s (m) None Un wn None 9.0 m ) nk* Analysis of 55oF spa in iteria ha ee m d, ich y i umber m ed am les+ D.O. samples determination of s ar eed to be completed before rit ca a ly ssed.
n co maning/re
. eria
Water Quality 89
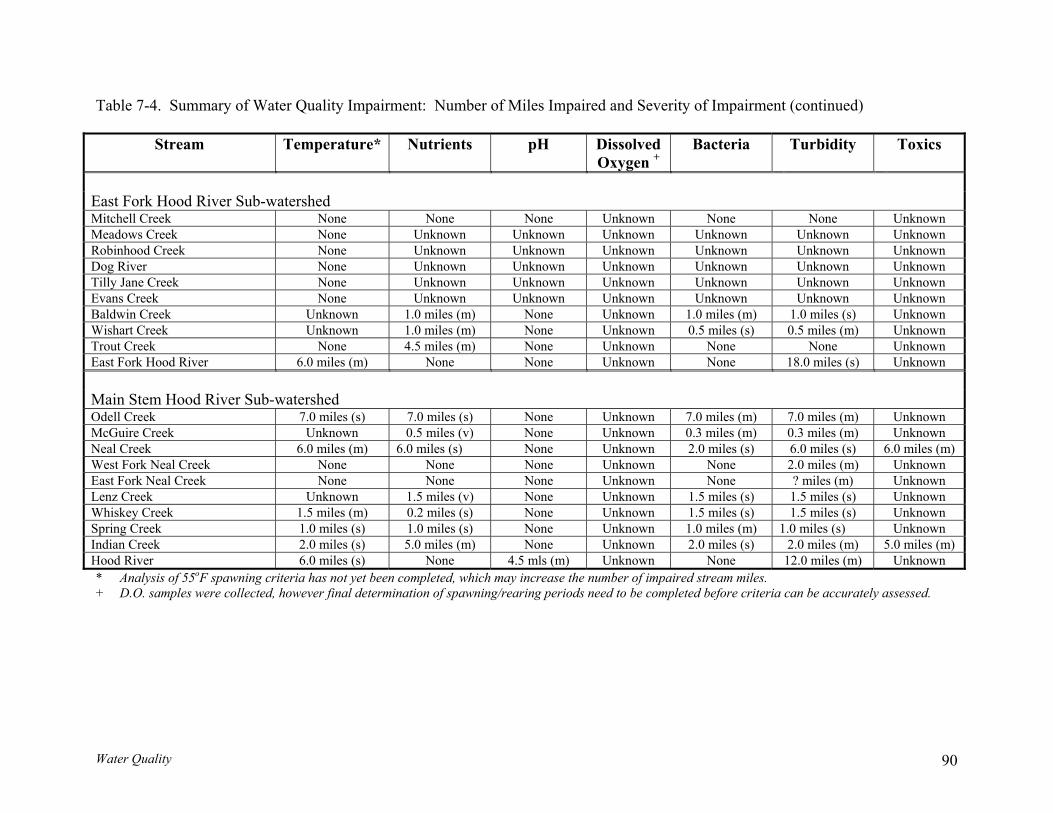
Table 7-4. Summary of Water Quality Impairment: Number of Miles Impaired and Severity of Impairment (continued)
Stream Temperature* Nutrients pH Dissolved Oxygen +
Toxics Bacteria Turbidity
None Unknown Unknown Unknown
Unknown Unknown
) 1.0 miles (s) 0.5 miles (m)
None 18.0 miles (s)
) 7.0 miles (m) ) 0.3 miles (m) 6.0 miles (s)
2.0 miles (m) ? miles (m)
1.5 miles (s) 1.5 miles (s) ) 1.0 miles (s) 2.0 miles (m)
12.0 miles (m) es. iteria can be accurately a
East Fork Hood River Sub-watershed Mitchell Creek None None None Unknown None U own nkn
nknnknnkn
Meadows Creek None Unknown Unknown Unknown Unknown U own Robinhood Creek None Unknown Unknown Unknown Unknown U own Dog River None Unknown Unknown Unknown Unknown U own Tilly Jane Creek None Unknown Unknown Unknown Unknown Unknown Evans Creek None Unknown Unknown Unknown Unknown Unknown Baldwin Creek Unknown 1.0 miles (m) None Unknown 1.0 miles (m Unknown Wishart Creek Unknown 1.0 miles (m) None Unknown 0.5 miles (s) Unknown Trout Creek None 4.5 miles (m) None Unknown None Unknown East Fork Hood River 6.0 miles (m) None None Unknown None Unknown Main Stem Hood River Sub-watershed Odell Creek 7.0 miles (s) 7.0 miles (s) None Unknown 7.0 miles (m Unknown McGuire Creek Unknown 0.5 miles (v) None Unknown 0.3 miles (m Unknown Neal Creek 6.0 miles (m) 6.0 miles (s) None Unknown 2.0 miles (s) 6.0 miles (m) West Fork Neal Creek None None None Unknown None Unknown East Fork Neal Creek None None None Unknown None Unknown Lenz Creek Unknown 1.5 miles (v) None Unknown 1.5 miles (s) Unknown Whiskey Creek 1.5 miles (m) 0.2 miles (s) None Unknown 1.5 miles (s) Unknown Spring Creek 1.0 miles (s) 1.0 miles (s) None Unknown 1.0 miles (m Unknown Indian Creek 2.0 miles (s) 5.0 miles (m) None Unknown 2.0 miles (s) 5.0 miles (m) Hood River 6.0 miles (s) None 4.5 mls (m) Unknown None Unknown * Analysis of 55oF spawning criteria has not yet been completed, which may increase the number of impaired stream mil+ D.O. samples were collected, however final determination of spawning/rearing periods need to be completed before cr ssessed.
Water Quality 90
Water Q 1. The 64oF salmonid rearing temper d ortions of Indian,
Whiskey, Neal and Odell creeks; in the Hood River below Tucker bridge; in the East Fork Hood River below the EFID diversion, and in Lake Branch below Lost Lake.
2. The 50oF re cr d ork Hood River,
lear Br Lau w ompass Creek. Questions exist as to whether 50oF is naturally attainable fo mpass Creek and Clear Branch above the reservoir.
3 he pH ceed pass reach below the
owerda 5 and ere found in the atersh by DE 1998 and 1999.
4. Elevated nitrogen and phosphorus (nutrient) levels exceeding recommended criteria
re fou , Ne iskey and Indian ks d in uring 1998 sampling he H of th River mainstem
during 1995/1996 monitoring by PacifiCorp. 5. Based on oring st r (D.O.)
oncentr ed ra June, 7.8 – 10.7 g/L in .8 mg state D.O. standard
relies on a determination of salmonid spawning vs. rearing periods for each stream reach, further analysis and input from fisheries agencies is needed to assess where and when D.O. standards apply.
acteria ound Watershed tributaries 1998. sive st w t tify contamination
sources.
nly on 34 sites (Wishart Cree pled during the 1998 DEQ intensive study xceeded rb TU. However, most mp r mpling in the mouth of eal by t W after rain 1998 sam asured 337 NTU.
Pesticide and herbicide use on orchard, forest, right-of-way and residential properties was identified as a potential concern by the Hood River W uality Technical Comm e. A preliminary study conducted in cooperation with the Hood River Grower-Shipper Association in spring 1999 found that concentrations of chlorpyrifos, n org phospha sec e d the state standard in Neal and Indian reek n June 19 tr azinphos methyl, another organophosphate estic c e ta a d Indi s and near the mouth
of the
ua
atu
lity
re
–
cri
K
ter
ey
ia
Fi
is
nd
ex
in
cee
gs
de
banc
ullh
troab
utov
tee a
mpnd
er be
atulow
iterra
ia nc
is e R
exes
ceeerv
deoi
d r,
in an
Midd loC
. TPW
stanle ed
daDadu
rdm rin
oing s
f 8 spam
.5 rinp
wag ling
s ex199
ed 1
Q in
in99
th6,
e lbu
owt n
ero e
enxc
d ee
of den
we nduriRW
inng
G
O 19, a
de98nd
ll, D in
McEQ se
G mve
uireonral
al, g,ese
Le in tr
nz Nib
, Tealuta
ro anrie
ut,d s a
WLend
isnz th
har cre
creeby t
itor
1atiAu
99ongu
8 Ds inst,
E th
an
Q e d
moW8.0
nitate –
udyng/L
esufro O
ltm
cto
s, d 8.be
is3 –r.
sol 1
B
ved1.7eca
cm
rsh 11
ed in
mus
. Bin
l co A
ntmo
amre
in co
atim
onpre
when
as f inudy
seveou
ralld
m be
id n
dleee
anded
d
. OesaN
e of th byek
k) ty drea
samevy wvy
e D
recE
omQ he
moccHR
enur
dereG
d tud du
idiing a h
, exationda
alue
atath
ioner
c co
ritend
riiti
a oonspli
lingCre
itte
anos. Iide Ho
aCp
te in99
d th
ticidcente s
censrd
ede of in
, ce
onsta, ex
odeediv
Ne l an an C R er.
in p
le Fer C
r Co
e byes w
Whks dod
genL inhe
erden
0 N Sa me
ter Q
eek
thc
t, eeHo
oxyg/e t
lowo i
f 5.
ng
a
r
6
7
8.
Riparian and Wetlands Condition 91

D Gaps or • Based on the 1999 monitoring results, expand ticide monitoring program to better
assess transport mechanisms and toxicity to aquatic organisms. • ll p obs n study • entify natu s clari n al growth and
pH • solve fish and rearing areas by river reach to determine
propria a
ata Further Study Needs:
pes
Fo
Id
owu on ba
ral
ct
nu
eri
tr
al
ien
con
t s
ta
ou
mi
rce
nation
and
erv
fy
ed
the
du
re
ri
la
ng
tio
th
ns
e 1
hip
99
b
8
etw
inte
ee
Reap
spse
eci of
es sp
spec
awifi
nic t
ng emte u perature nd dissolved oxygen crite
sive
alg
ria
Riparian and Wetlands Condition 92
8. RIPARIAN AND W
Intr
ETLANDS CONDITIONS
oduction
his Chap r summarizes a riparian (streamside) conditions assessment completed for the nts
res re con for thes est.
1 r
usenatu mu ical
ue
• •
rotection and what appropriate restoration or enhancement opportunities might be?
Me
T teHood River Mainstem watershed - the lower Hood River and its tributaries- and prese
ults of a wetlands assessment for the Hood River Watershed as a whole. Both wetributed by Ed Salminen, forest hydrologist and Parkdale resident. Data collected e assessments are available by requ
Hood River Mainstem Watershed Riparian Assessment The purpose of this assessment was to evaluate current riparian vegetation conditions fotheir ability to provide recruitment2 of large wood3 and shade. This information can be
d in prioritizing stream restoration projects. Large woody debris is an important ral structural element that creates and maintains good fish habitat. Shade affects how
ch sunlight is received by a stream and can influence water temperature. The critstions for this section are: q
• What are the current conditions of riparian areas in the Hood River Mainstem
watershed? How do current conditions compare to pre-development conditions for this area? How can the existing riparian areas be grouped within the watershed to better understand what areas need p
thods
arge wood recruitment potential and shade levels were assessed along 83 miles of
The(Wtop h
f the area examined along the streams was 100 feet on each side. Each side of the
cha
Lstream using 1:12,000 scale color aerial photographs (1995) and spot field verification.
methods used are described in the Oregon Watershed Assessment Manual atershed Professionals Network 1999). All year-round streams shown on USGS ographic maps were included as well as some larger intermittent streams. The widt
ostreams were evaluated separately for vegetation type, size, and density and other
racteristics. The basic mapping unit for data collection was called a Riparian
parian vegetation refers to the vegetation found on stream banks and adjoining floodplain cruitment, in the context of riparian function, refers to the natural addition over time of new lard pieces to a stream channel from riparian forests. It is the physical movement of large wood from m-side forest into the stream channel.
rge wood, as used in thiches) greater than 6 fee
1 Ri2 Re ge woostrea3 La s context, refers to pieces of wood (either tree trunks, stumps, or large
ran t long and greater than 4 inches in diameter. As a general rule, the larger the iece size the more functional it will be in the stream. Large wood is important in the formation of channel ructure, and consequently, in creating and enhancing fish habitat.
bpst
Riparian and Wetlands Condition 93
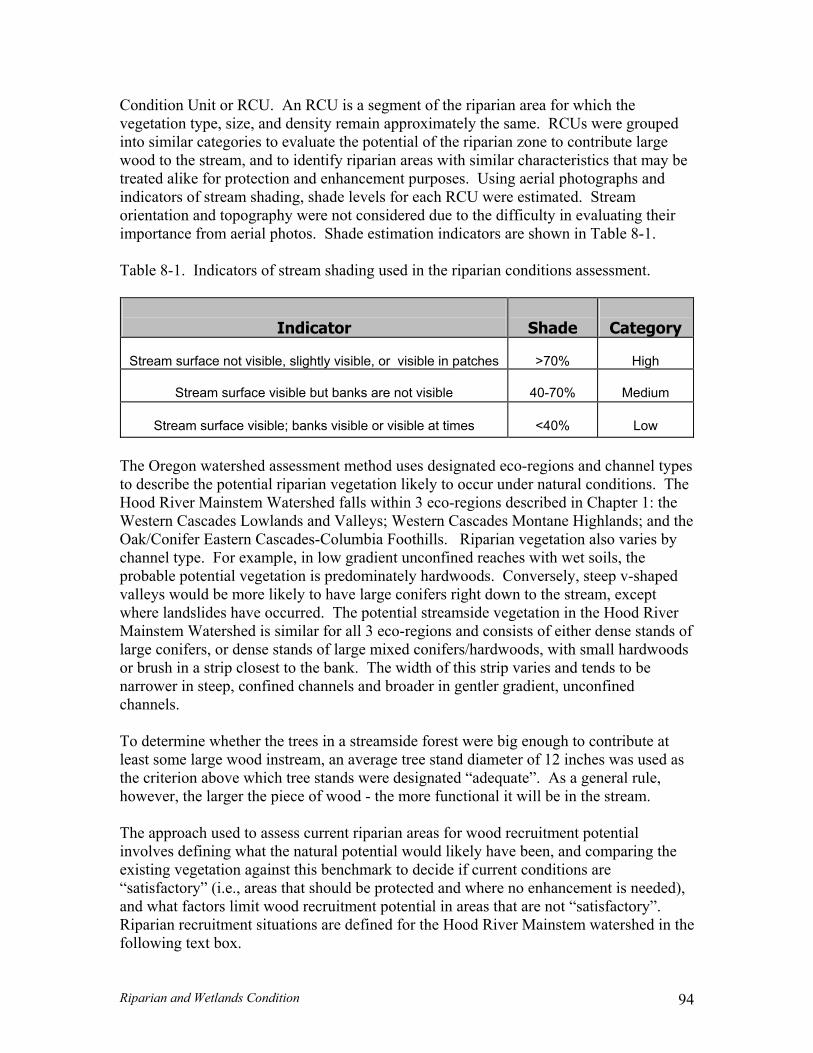
Condition Unit or RCU. An RCU is a segment of the riparian area for which the ately the same. RCUs were grouped
to similar categories to evaluate the potential of the riparian zone to contribute large
trea photographs and dicators of stream shading, shade levels for each RCU were estimated. Stream
eir portance from aerial photos. Shade estimation indicators are shown in Table 8-1.
Table 8-1. Indicators of stream shading used in the riparian conditions assessment.
vegetation type, size, and density remain approximinwood to the stream, and to identify riparian areas with similar characteristics that may be
ted alike for protection and enhancement purposes. Using aerialinorientation and topography were not considered due to the difficulty in evaluating thim
Indicator
Shade
Category
Stream surface not visible, slightly visible, or visible in patches
>70%
High
Stream surface visible but banks are not visible
40-70%
Medium
Stream surface visible; banks visible or visible at times
<40%
Low The Oregon watershed assessment method uses designated eco-regions and channel types to describe the potential riparian vegetation likely to occur under natural conditions. The Hood River Mainstem Watershed falls within 3 eco-regions described in Chapter 1: the Western Cascades Lowlands and Valleys; Western Cascades Montane Highlands; and the Oak/Conifer Eastern Cascades-Columbia Foothills. Riparian vegetation also varies by channel type. For example, in low gradient unconfined reaches with wet soils, the probable potential vegetation is predominately hardwoods. Conversely, steep v-shaped valleys would be more likely to have large conifers right down to the stream, except where landslides have occurred. The potential streamside vegetation in the Hood River Mainstem Watershed is similar for all 3 eco-regions and consists of either dense stands of large conifers, or dense stands of large mixed conifers/hardwoods, with small hardwoods or brush in a strip closest to the bank. The width of this strip varies and tends to be narrower in steep, confined channels and broader in gentler gradient, unconfined channels. To determine whether the trees in a streamside forest were big enough to contribute at least some large wood instream, an average tree stand diameter of 12 inches was used as the criterion above which tree stands were designated “adequate”. As a general rule, however, the larger the piece of wood - the more functional it will be in the stream. The approach used to assess current riparian areas for wood recruitment potential involves defining what the natural potential would likely have been, and comparing the existing vegetation against this benchmark to decide if current conditions are “satisfactory” (i.e., areas that should be protected and where no enhancement is needed), and what factors limit wood recruitment potential in areas that are not “satisfactory”. Riparian recruitment situations are defined for the Hood River Mainstem watershed in the following text box.
Riparian and Wetlands Condition 94
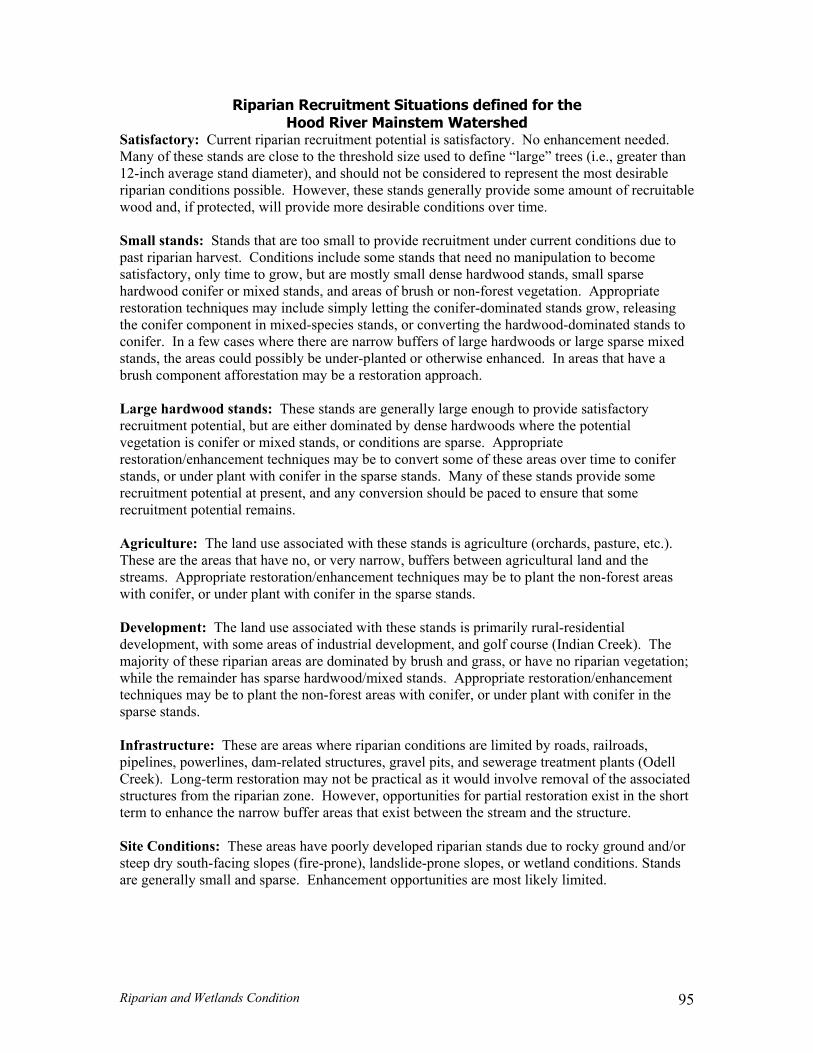
Riparian Recruitment Situations defined for the Hood River Mainstem Watershed
atisfactory: Current riparian recruitment potential is satisfactory. No enhancement needed. stands are close to the threshold size used to define “large” trees (i.e., greater than e stand diameter), and should not be considered to represent the most desirable
mall dense hardwood stands, small sparse ardwood conifer or mixed stands, and areas of brush or non-forest vegetation. Appropriate storation techniques may include simply letting the conifer-dominated stands grow, releasing
the conifer stands to nifer. In e mixed
s may be to convert some of these areas over time to conifer ands, or under plant with conifer in the sparse stands. Many of these stands provide some
recr ial remains.
stre areas with parse stands.
nt: The land use associated with these stands is primarily rural-residential evelopment, with some areas of industrial development, and golf course (Indian Creek). The
tion;
r in the
ell ociated
he short term to enhance the narrow buffer areas that exist between the stream and the structure. Site Conditions: These areas have poorly developed riparian stands due to rocky ground and/or steep dry south-facing slopes (fire-prone), landslide-prone slopes, or wetland conditions. Stands are generally small and sparse. Enhancement opportunities are most likely limited.
SMany of these
2-inch averag1riparian conditions possible. However, these stands generally provide some amount of recruitable wood and, if protected, will provide more desirable conditions over time. Small stands: Stands that are too small to provide recruitment under current conditions due to past riparian harvest. Conditions include some stands that need no manipulation to become satisfactory, only time to grow, but are mostly shre
component in mixed-species stands, or converting the hardwood-dominated a few cases where there are narrow buffers of large hardwoods or large sparsco
stands, the areas could possibly be under-planted or otherwise enhanced. In areas that have a brush component afforestation may be a restoration approach. Large hardwood stands: These stands are generally large enough to provide satisfactory recruitment potential, but are either dominated by dense hardwoods where the potential vegetation is conifer or mixed stands, or conditions are sparse. Appropriate restoration/enhancement techniquestrecruitment potential at present, and any conversion should be paced to ensure that some
uitment potent Agriculture: The land use associated with these stands is agriculture (orchards, pasture, etc.).These are the areas that have no, or very narrow, buffers between agricultural land and the
ams. Appropriate restoration/enhancement techniques may be to plant the non-forest conifer, or under plant with conifer in the s
Developmedmajority of these riparian areas are dominated by brush and grass, or have no riparian vegetawhile the remainder has sparse hardwood/mixed stands. Appropriate restoration/enhancement techniques may be to plant the non-forest areas with conifer, or under plant with conifesparse stands. Infrastructure: These are areas where riparian conditions are limited by roads, railroads, pipelines, powerlines, dam-related structures, gravel pits, and sewerage treatment plants (OdCreek). Long-term restoration may not be practical as it would involve removal of the assstructures from the riparian zone. However, opportunities for partial restoration exist in t
Riparian and Wetlands Condition 95
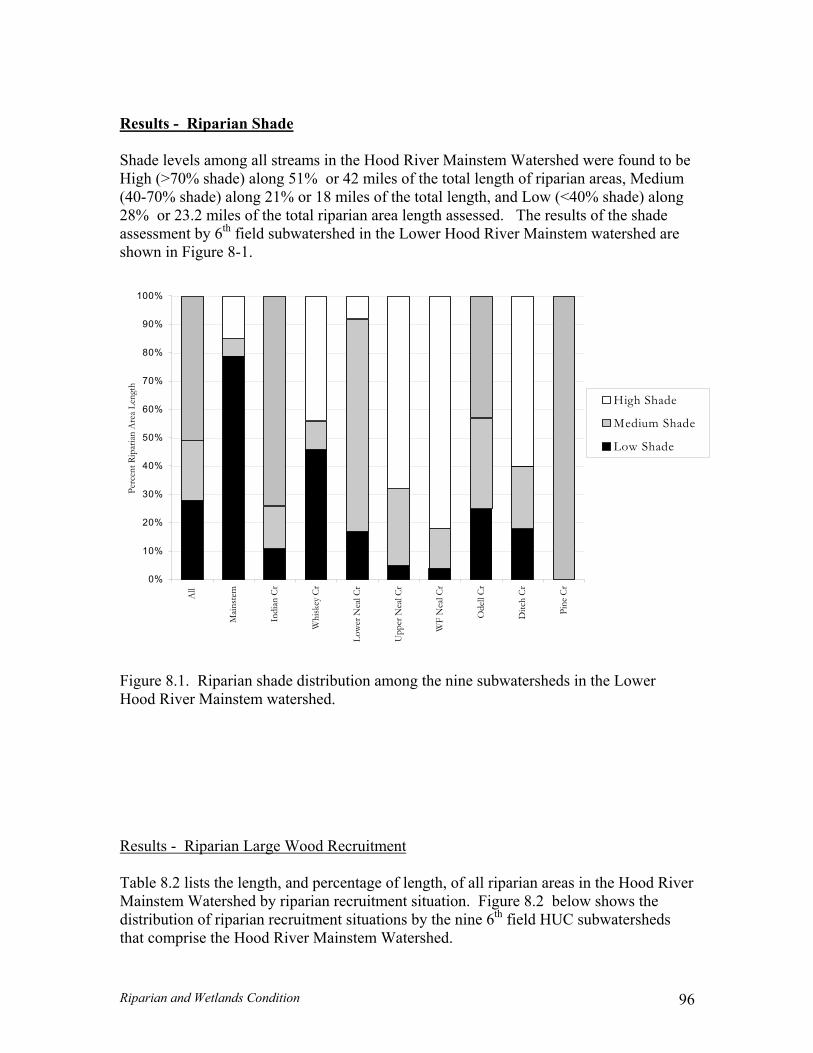
Results - Riparian Shade Shade levels among all streams in the Hood River Mainstem Watershed were found to be High (>70% shade) along 51% or 42 miles of the total length of riparian areas, Mediu(40-70% shade) along 21% or 18 miles of the total length, and Low (<40% shade)28% or 23.2 miles of the total riparian area length assessed. The results of the shade assessment by 6th field subwatershed in the Lower Hood River Mainstem watershed a
m along
re hown in Figure 8-1. s
50%
60%
70%
90%
100%
H
Me hade
Low Shade
80%
igh hadeS
dium S
0%
10%
20%
30%
40%
All
Mai
nste
m
Indi
an C
r
Whi
skey
Cr
Low
er N
eal C
r
Upp
er N
eal C
r
WF
Nea
l Cr
Ode
ll C
r
Ditc
h C
r
Pine
Cr
Figure 8.1. Riparian shade distribution among the nine subwatersheds in the LowHood Rive
Perc
ent R
ipar
ian
Are
a Le
ngth
er r Mainstem watershed.
Results - Riparian Large Wood Recruitment Table 8.2 lists the length, and percentage of length, of all riparian areas in the Hood RiverMainstem Watershed by riparian recruitment situation. Figure 8.2 below shows the distribution of riparian recruitment situations by the nine 6th field HUC subwatersheds that comprise the Ho
od River Mainstem Watershed.
Riparian and Wetlands Condition 96
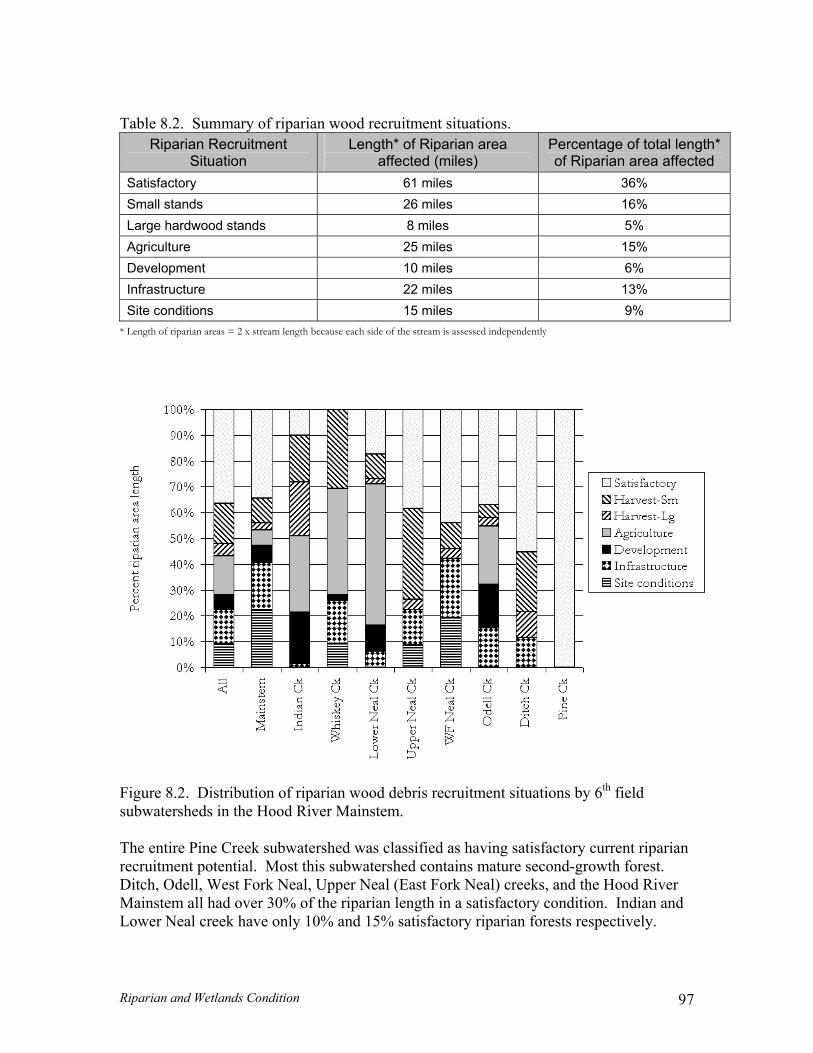
Table 8.2. Summary of riparian wood recruitment situations.
Riparian Recruitment Situation
Length* of Riparian area affected (miles)
Percentage of total length* of Riparian area affected
Satisfactory 61 miles 36% Small stands 26 miles 16% Large hardwood stands 8 miles 5% Agriculture 25 miles 15% Development 10 miles 6% Infrastructure 22 miles 13% Site conditions 15 miles 9%
* Length of riparian areas = 2 x stream length because each side of the stream is assessed independently
Figure 8.2. Distribution of riparian wood debris recruitment situations by 6th field subwatersheds in the Hood River Mainstem. The entire Pine Creek subwatershed was classified as having satisfactory current riparian recruitment potential. Most this subwatershed contains mature second-growth forest. Ditch, Odell, West Fork Neal, Upper Neal (East Fork Neal) creeks, and the Hood River
ainstem all had over 30% of the riparian length in a satisfactory condition. Indian and Lower Neal creek have only 10% and 15% satisfactory riparian forests respectively. M
Riparian and Wetlands Condition 97
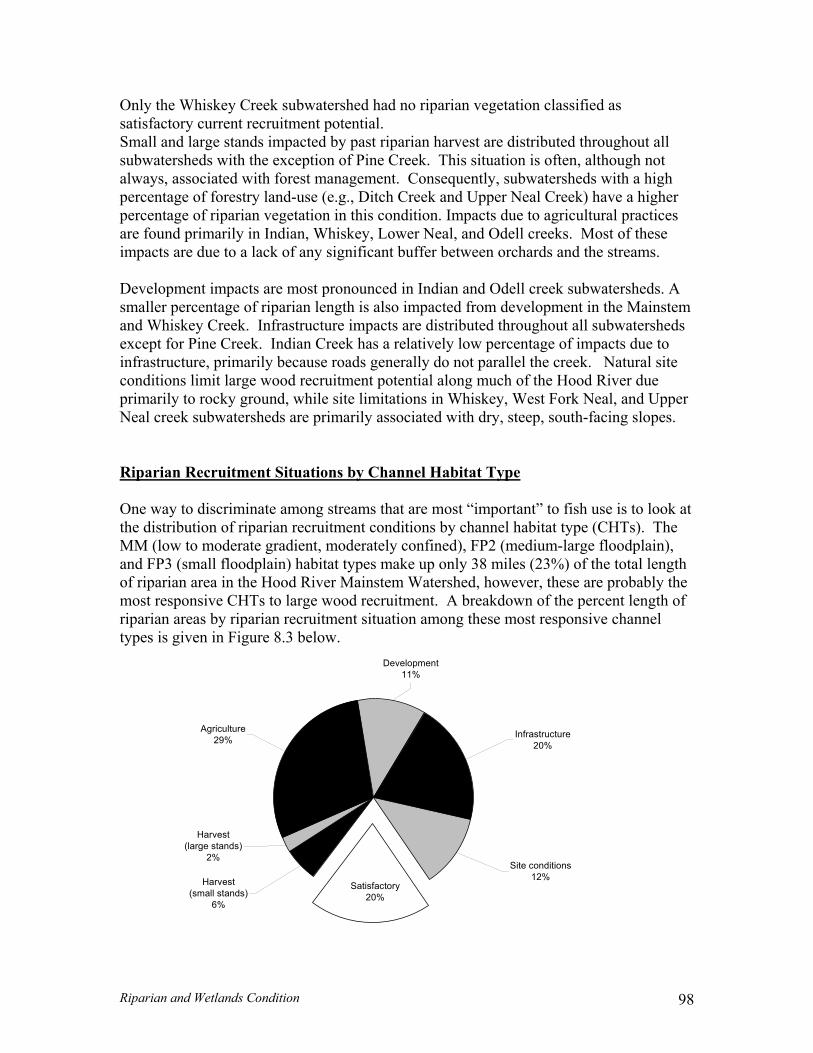
Only the Whiskey Creek subwatershed had no riparian vegetation classified as ent potential.
mall and large stands impacted by past riparian harvest are distributed throughout all
ck of any significant buffer between orchards and the streams.
Development impacts are most pronounced in Indian and Odell creek subwatersheds. A smaller percentage of riparian length is also impacted from development in the Mainstem and Whiskey Creek. Infrastructure impacts are distributed throughout all subwatersheds except for Pine Creek. Indian Creek has a relatively low percentage of impacts due to infrastructure, primarily because roads generally do not parallel the creek. Natural site conditions limit large wood recruitment potential along much of the Hood River due primarily to rocky ground, while site limitations in Whiskey, West Fork Neal, and Upper Neal creek subwatersheds are primarily associated with dry, steep, south-faci Riparian Recruitment Situations by Channel Habitat Type
satisfactory current recruitmSsubwatersheds with the exception of Pine Creek. This situation is often, although not always, associated with forest management. Consequently, subwatersheds with a high percentage of forestry land-use (e.g., Ditch Creek and Upper Neal Creek) have a higher percentage of riparian vegetation in this condition. Impacts due to agricultural practicesare found primarily in Indian, Whiskey, Lower Neal, and Odell creeks. Most of these impacts are due to a la
ng slopes.
One way to discriminate among streams that are most “important” to fish use is to look at the distribution of riparian recruitment conditions by channel habitat type (CHTs). The MM (low to moderate gradient, moderately confined), FP2 (medium-large floodplain), and FP3 (small floodplain) habitat types make up only 38 miles (23%) of the total length of riparian area in the Hood River Mainstem Watershed, however, these are probably the most responsive CHTs to large wood recruitment. A breakdown of the percent length of riparian areas by riparian recruitment situation among these most responsive channel types is given in Figure 8.3 below.
Site conditions
Agriculture29%
Harvest
2%
Development
Infrastructure20%
11%
12%Harvest(small stands)
6%
Satisfactory20%
(large stands)
Riparian and Wetlands Condition 98
Figure 8.3. Percentage of riparian length among channel habitat types most responsive to nt, moderately confined
broa 3, MM)
Along the streams that are within channel ha s most responsive to large wood, Agriculture presents the largest impact to cu rian recruitment, affecting 29% of t s. Infrastructu cts another 20% and deve ent 11% of the riparian length within those CH esponsive to large wood. Harvest ( large stands) impacts only 8 total length of riparian areI ite conditions (12% of length arily due to wetlands. Only 20% of t f riparian areas in these CHTs currently provides “satisfactoryrecruitment potential.
large wood (medium-large floodplain, low-to-moderate gradied valley types -FP2, FP .
bitat typerrent ripa
he total length of riparian area re impa lopmTs most r
both small and % of the as. mpacts from s ) are primhe total length o ”
Riparian and Wetlands Condition 99
Wetlands Assessment Introduction The purpose of this assessment was to identify wetland locations within the entire Hood
iver Watershed, summarize available data on current wetland conditions, and provide
• Where are the priority wetlands within the watershed? shed?
Rrecommendations on further wetland assessments. The critical questions were:
• Where are the wetlands in the watershed? • What are the general characteristics of wetlands within the watershed?
The following critical questions are included in the Oregon Watershed Assessment Manual but were not considered in this assessment due to a lack of information:
• What opportunities exist to restore wetlands in the water No attempt was made to identify wetland restoration opportunities in this analysis. If wetland restoration is identified as a goal for the Hood River Watershed Group, additional analysis will be required. Methods The methods used in this assessment follow those described in the Oregon Watershed Assessment Manual (Watershed Professionals Network 1999) except as noted. Local wetland inventory information is currently unavailable for Hood River County. All information about wetland locations and current conditions was derived from digital National Wetland Inventory (NWI) data produced by the US Fish and Wildlife Service. Additional GIS data layers were supplied by the US Forest Service, Mt. Hood National Forest. Information was organized by the 4 fifth-field watersheds and 50 sixth-field subwatersheds delineated for the Hood River drainage (Table 8-3). All NWI wetlands were included regardless of distance from stream channels, however, wetlands that appear as line features, i.e., riparian wetlands, were not included. Information identified in the Oregon Watershed Assessment Manual not collected in this assessment included surface-water connections between wetlands and streams, buffer condition, and wetland position in the watershed.
Riparian and Wetlands Condition 100
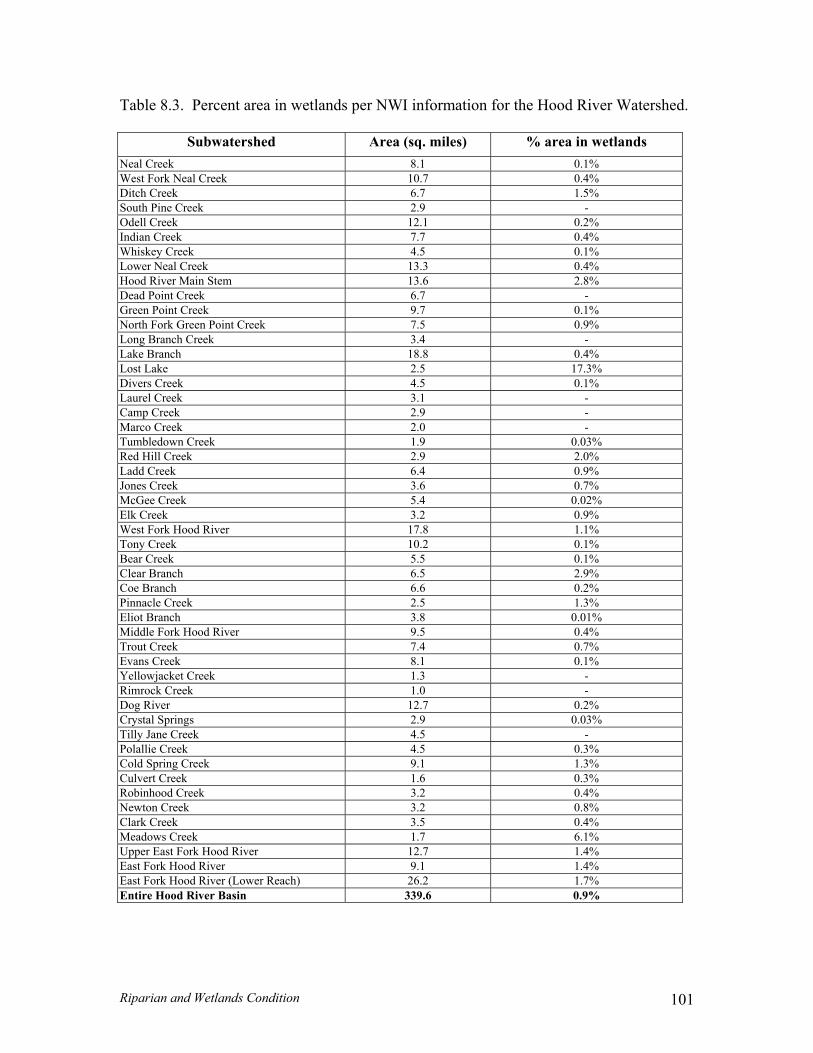
Table 8.3. Percent area in wetlands per NWI information for the Hood River Watershed.
Subwatershed N
Lake Branch 18.8 0.4% Lost Lake 2.5 17.3% Divers Creek 4.5 0.1% Laurel Creek 3.1 - Camp Creek 2.9 - Marco Creek 2.0 - Tumbledown Creek 1.9 0.03% Red Hill Creek 2.9 2.0% L
McGee Creek 5.4 0.02% Elk Creek 3.2 0.9% West Fork Hood River 17.8 1.1% Tony Creek 10.2 0.1% Bear Creek 5.5 0.1% Clear Branch 6.5 2.9% Coe Branch 6.6 0.2% Pinnacle Creek 2.5 1.3% E
Trout Creek 7.4 0.7% Evans Creek 8.1 0.1% Yellowjacket Creek 1.3 - Rimrock Creek 1.0 - Dog River 12.7 0.2% Crystal Springs 2.9 0.03% Tilly Jane Creek 4.5 - Polallie Creek 4.5 0.3% C
Robinhood Creek 3.2 0.4% Newton Creek 3.2 0.8% Clark Creek 3.5 0.4% Meadows Creek 1.7 6.1% Upper East Fork Hood River 12.7 1.4% East Fork Hood River 9.1 1.4% East Fork Hood River (Lower Reach) 26.2 1.7% E
Area (sq. miles) % area in wetlands eal Creek 8.1 0.1%
West Fork Neal Creek 10.7 0.4% Ditch Creek 6.7 1.5% South Pine Creek 2.9 - Odell Creek 12.1 0.2% Indian Creek 7.7 0.4% Whiskey Creek 4.5 0.1% Lower Neal Creek 13.3 0.4% Hood River Main Stem 13.6 2.8% Dead Point Creek 6.7 - Green Point Creek 9.7 0.1% North Fork Green Point Creek 7.5 0.9% Long Branch Creek 3.4 -
add Creek 6.4 0.9% Jones Creek 3.6 0.7%
liot Branch 3.8 0.01% Middle Fork Hood River 9.5 0.4%
old Spring Creek 9.1 1.3% Culvert Creek 1.6 0.3%
ntire Hood River Basin 339.6 0.9%
Riparian and Wetlands Condition 101
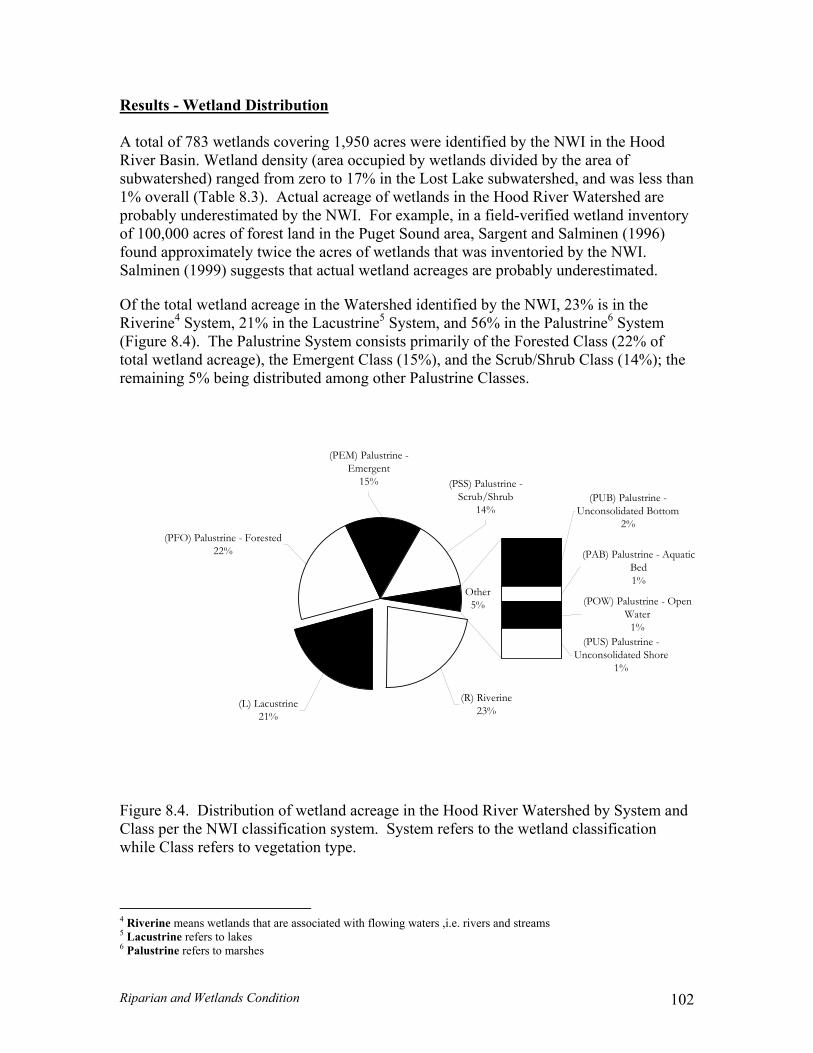
R AR
o to 17% in the Lost Lake su1
ofound approximately twice the acres of wetlands that was inventoried by the NWI. Salminen (1999) suggests that actual wetland acreages are probably underestimated.
Oeri e System, 21% in the Lacustrine System, ur 8.4). The Palustrine System consists primarily of the Forested Class (22
etland acreage), the Emergent Class (15%), and the Scrub/Shrub Class (1toremaining 5% being distributed among other Palustrine Classes.
(PUB) Palustrine - Unconsolidate
2%(PFO) Palustrine - Forested
Scrub/Shrub14%
(PEM) Palustrine - Emergent
tion type.
5
esults - Wetland Distribution
total of 783 wetlands covering 1,950 acres were identified by the NWI in the Hood iver Basin. Wetland density (area occupied by wetlands divided by the area of
subwatershed) ranged from zer bwatershed, and was less than % overall (Table 8.3). Actual acreage of wetlands in the Hood River Watershed are
estimated by the NWI. For example, in a field-verified wetland inventory f 100,000 acres of forest land in the Puget Sound area, Sargent and Salminen (1996)
f the total wetland acreage in the Watershed identified by the NWI, 23% is in the Riv n 4 5 and 56% in the Palustrine6 System (Fig e % of
tal w 4%); the
probably under
Other5% (POW) Palustrine - Open
Water
(PAB) Palustrine - Aquatic Bed1%
d Bottom
22%
(PSS) Palustrine - 15%
(PUS) Palustrine - Unconsolidated Shore
1%
1%
(L) Lacustrine21%
(R) Riverine23%
Figure 8.4. Distribution of wetland acreage in the Hood River Watershed by System andClass per the NWI classification system. System refers to the wetland classification while Class refers to vegeta
4 Riverine means wetlands that are associated with flowing waters ,i.e. rivers and streams
Lacustrine refers to lakes 6 Palustrine refers to marshes
Riparian and Wetlands Condition 102
Wetland Ownership Among the four fifth-field watersheds that m p the Hood River dra , wetland
he Hood River Mainstem wate d is almost entirely non-federal, while nership in the remaining watersh re primarily federal: West Fork Hood ), Middle Fork (88%), and East Fork (55%) Hood River .
rbance
ake u inageownership in t rshewetland ow eds aRiver (70%
Wetland Distu The National Wetlands etlands that have been mod fieiactivity. Thave bee s (31 acres ntifiedas having bobservationHood Rive
Table 8.4. S theRiver basi
Water
Hood River Mainstem
Indian Creek 2 8.3
East Fork Hood Lower East Fork Hood Ri 8 22.8 River
ver
More inforprioritize wetland p ffor aterrecommen inveconducted. Appin Oregon. E in dfrom the upper Watersassessment in inventoryingfederal lands.
Inventory identified w d by human he only disturbances noted for the Hood River Watershed were wetlands that
n drained/ditched. Only 10 wetland ) have been ide in the NWI een drained/ditched in the Watershed (Table 8.4). Based on local s, the NWI appears to significantl derestimate wetland disturbance in the
r Watershed.
ummary of wetlands identified in NWI as drained/ditched in the Hood n.
shed Subwatershed Number of wetlands
Acres
y un
mation on wetland location, condi and function is needed in order to rotection and restoration e ts in the Hood River W shed. It is
ded that a comprehensive wetland ntory and functional assessment be roximately 45 wetland invent s have been completed by communities
xamples of these and assistance eveloping an inventory can be obtained Oregon Division of State Lands. B f the
hed, it may be most sensible to complete a inventory and functional in two phases - with the Mt. Hood National Forest acting as the lead agency
federal lands, while Hood River County should be the lead entity on non-
tion
orie
ecause of the large federal ownership o
Riparian and Wetlands Condition 103
Key Findings- Riparian Area and Wetlands
ong
recruitment potential is satisfactory. No enhancement needed.
t
Hardwood stands (8 miles; 5%)
Agriculture (25 miles; 15%)
Development (10 miles; 6%)
Infrastructure (22 miles; 13%)
Site conditions (15 miles; 9%)
3. Wetland density is low in the Hood River Watershed. Based on National Wetland Inventory (NWI) information, less than 1% of the basin is occupied by wetlands.
4. The actual area of wetlands in the Watershed is probably underestimated by the NWI. 5. Human-caused disturbances within wetlands appear to be significantly
underestimated by the NWI. Data is not available to assess the actual extent or impact of wetland losses in the Watershed.
6. A lack of information on existing wetland locations and conditions presently
precludes our ability to prioritize wetland protection or restoration efforts. Further Work Needed
riparian conditions for streams within National Forest lands.
• A wetland inventory and functional assessment is needed in order to identify and
prioritize wetland protection and restoration opportunities.
1. Riparian shade levels on all streams in the Hood River Mainstem watershed were
found to be High along 51% of the total length of riparian areas, Medium al21% and Low (<40% shade) along 28% of the total length.
2. Riparian woody debris recruitment situations for the Hood River Mainstem watershed
were found to be as follows:
• Satisfactory (61 miles; 36% of total riparian length): Current large wood
• Limited (106 miles; 64% of total riparian length): Current wood recruitmen
restricted by the following limitations: Small stands (26 miles; 16%)
• Conduct riparian condition assessments for the remaining 5h-field watersheds • Summarize Forest Service information on
Riparian and Wetlands Condition 104
9. SEDIMENT SOURCES
troduction In Erosion, sediment movement and deposition are natural watershed processes. Many streams in the Hood River Watershed have a naturally high sediment load due to geologyterrain and glacial runoff. Aquatic organisms have evolved along with
sediment transport occlarelated to human activity occurs during smaller, more frequent storms and can be a chronic disturbance to stream environments. Chronic sediment delivery to streams alters habitat quality and can interfere wagricultural and other water uses. Large increases in sediment loading can harm or even eliminate fish and aquati
agradation or widening. Fine sediment particles tend to fill in the interstitial spaces between coar
ther organism ring the permeab streambed andrces such a
apidly when theiamete
nis often directly related to loading of other contaminants (MacDonald et al. 1991). This Chapter uses existing information to (1) locate natural sediment sources; (2) identify land uses that may raise sediment input to streams above natural rates; and (3) assess their degree of significance if possible. Limitations on time and information did not allow as detailed an assessment as outlined in the Oregon Watershed Assessment manual in this report. Instead this Chapter presents a preliminary treatment of sedsources subject to additional work and future refinement.
GstsebtrF
, the local natural
rate and pattern of erosion and sedimentation. In contrast, human activity can accelerate the natural erosion rate and alter the timing of sediment delivery to streams. Most natural
urs only every decade or so during the highest storm flows, and sts a few days (Watershed Professionals Network 1999). In contrast, sediment delivery
ith
c invertebrate habitat (MacDonald et al. 1991). Direct effects include changes in bed sediment sizes, filling of pools, increased turbidity, and channel
ser particles – reducing critical habitat space for small fish, invertebrates and o s, and lowe ility of the intergdissolved oxygen. The shape of sediment particles from sou s road sanding or construction runoff is often angular and tends to interlock more than the rounded particles typical of most river and glacial sediments. Survival of salmonid eggs can decrease r prop nt (particle sizes <6 mm or ¼ inch d r) in spawning areas exceeds 20% (Bjornn and Reiser 1991). Since many
utrients and other chemical constituents are sorbed onto fine particles, sediment loading
iment
Natural Sediment Sources
laciers, landslides and unstable slopes form the principal supply of natural sediment to reams in the Hood River Watershed. The Hood River is a dynamic glacial system with asonally high amounts of suspended silt and sand. Glacial melt occurs intermittently
etween July and October. Glacial-origin sediment deposited in stream channels may be ansported and re-deposited at other times of the year - especially during fall storms. ive tributaries originate from glaciers: Coe and Eliot Branch in the Middle Fork Hood
ravel
ortion of surface fine sedime
Sediment Sources 105
River, Newton and C d Creek in the est Fork Hood River. The percentage of glacial-origin sediment is greater in the
dueterm aring salmonids in
lacial streams depend on the spring and late fall “shoulder seasons” before and after
likely to use non-glacial tributaries and springs during periods of high glacial turbidity.
Hig drainag f the Watershed. The long steep gradients on the flanks of Mt Hood allow mass-wasting events to gain size and san exam t can occur following even a medium sized landslide (USFS 1996b). In general, areas of steep gradient within the following subwatersh orest Service as being prone to landslides, mudflows a
• • • • Polallie (1980) •
Newton (1991)
• Coe Branch
• Compass
The ast and Middle Fork Hood River
atersheds rated certain landform types as having a high potential for debris flows. rock-
stee del was sed to group East and Middle Fork 6th field watersheds into 3 debris flow hazard types, nd estimated the potential frequency of such events for each hazard type (USFS 1996b).
Type 1: Pollalie, North Fork Cold Spring and Tilly Jane creeks.
lark creeks in the East Fork Hood River, and LadW
gglacial melt to put on the most growth (G. Koonce, Inter-Fluve, pers. comm), and also are
h precipitation, an abundance of weak rock and unconsolidated material, confined
es and steep slopes all contribute to frequent landslides in parts o
de tructive force prior to reaching gentler terrain. The 1980 Pollalie Debris Flow is ple of the type of catastrophic event tha
nd debris torrents:
McGee Creek Tilly Jane Cold Springs
Clark • • Clear Branch • Ladd Creek (1961) • Lake Branch (upper)
• Pinnacle
• Eliot Branch (1999)(Parentheses = year of most recent event)
Forest Service watershed analyses for the EwThese landforms were slope deposits, unconsolidated material-steep slopes, weak
p slopes, and resistant rock-steep slopes. A Benda-Cundy Debris Flow Moua
Middle Fork Hood River mouth (23%) than in the East Fork Hood River (5%) mainly to differences in dilution (USFS 1996b). Glacial influence is relatively minor in s of sediment loading in the West Fork. As sight-feeders, re
eds were identified by the F
Initiation slide ranging from
of 70
degrees. Subsequent debris dam at the junction of the East Fork Hood River could form and s
Type II: Coe and Eliot branches, Compass, Newton, Engineers, Hellroaring, Culvert, Cat,
1000 to 5000 cubic yards. Long channels of steep enough gradien to scour, an abundanceerodible material in the channels, and entry into larger order stream at an angle greater than
t
develop a catastrophically large debris flow. Potential occurrence intervals: 30 to 50 year
Rimrock and Birdie creeks. Initiation slide ranging from 1000 to 5000 cubic yards. These drainages tend to be intermediate in length and the scour zone is not long enough to entrain catastrophic volumes of material. Periodic debris flows are released that will probably not dam the larger order streams they enter. Potential occurrence intervals: 30 to 40 years
Sediment Sources 106
Type III: All those not mentioned above. Not usually susceptible to initiation slides larger than 2000 cubic yards. Short steep channel generally not capable of accumulating an abundance of material in the channel. Potential occurrence intervals: 20 to 30 years
reas of high soil erosion hazard are shown in Figure 9-1 based on selected USDA Hood oil
d
ARiver County soil survey (Green 1981) and Mt Hood National Forest (MHNF) 1979 SResource Inventory map data. The former covers nonfederal land and the latter covers federally-owned lands. Unfortunately, each coverage uses different map units and hazarcategories. Because additional work is required before a uniform interpretation can be developed, only the highest risk categories from each data source is depicted. Areas with soils classified as having both a high erosion hazard and rapid runoff from the Hood River County soil survey map are shown. For MHNF, only the following erosion categories and risk ratings are shown: “surface soil erosion potential - moderately ssevere or very severe, “sedimentation yield pote
evere, ntial - high” and “subsoil erosion
otential - high”.
le a
, d
p Soil resiliency is defined as the capability of a site to recover following natural or land-use related disturbance (USFS 1996b). Forest Service watershed analyses for the Middand East Fork Hood River watersheds identified the following subwatersheds as having large proportion of basin area with low resiliency soils: Robinhood (71%) , Clark (42%), Newton (54%), and Upper East Fork (52%) and Cold Spring Creek (39%) and Lower East Fork Hood River (39%).
Sediment Sources from Land Use Potential sediment sources from land use and human activity in the Watershed consist principally of forest and rural roads7 and open irrigation ditches. Locations where ivestock are concentrated along streams can be locally significant sediment sourcesl
along with exposed soils at construction sites, camping or recreation sites, trails, andrainage ditches. Roads and Culverts As in most forested watersheds, roads and undersized culvert problems are likely esponsible for most of the human-caused sediment load inr
D the Watershed (USFS 1996b).
ata collected in the West, Middle and East Fork Hood River watersheds suggested that roads and timber management-related debris ows are the principal sediment sources (USFS 1996a; USFS 1996b) rshed has one of the ighest rates of debris torrents on the Mount Hood National Forest with most of these
fl. The West Fork Hood River wate
hassociated with clearcuts and roads (USFS 1996a). A chronic road-related sediment problem was noted at the confluence of Elk and McGee creeks.
7 Rural roads are those that access farmlands and rural homes including county and state highways.
Sediment Sources 107
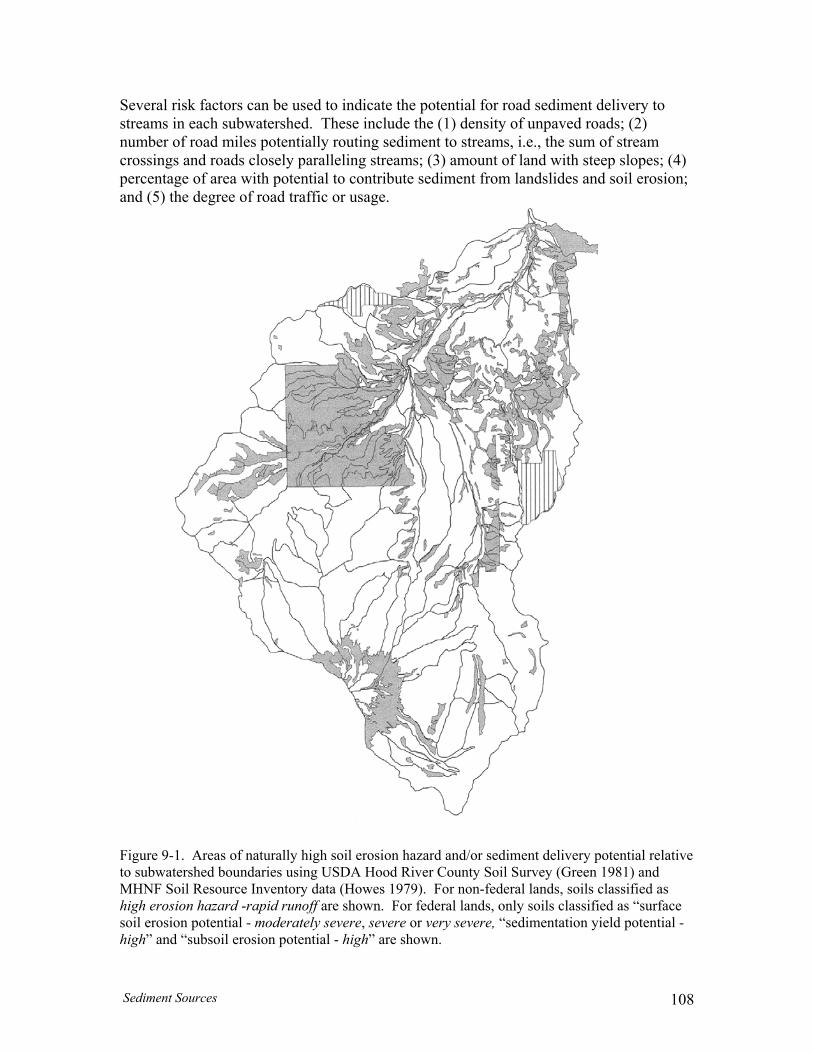
Several risk factors can be used to indicate the potential for road sediment delivery to streams in each subwatershed. These include the (1) density of unpaved roads; (2) number of road miles potentially routing sediment to streams, i.e., the sum of stream crossings and roads closely paralleling streams; (3) amount of land with steep slopes; percentage of area with potential to contribute sediment from landslides and soil erosand (5) the degree of road traffic or usage.
(4) ion;
-1. Areas of naturally high soil erosion hazard and/or sediment delivery potential relati Figure 9 ve to subwatershed boundaries using USDA Hood River County Soil Survey (Green 1981) and MHNF s high ero face soil ero high” a
Soil Resoff are shown. For federal lands, only soils classified as “sur
sion potential - moderately severe, severe or very severe, “sedimentation yield potential -nd “subsoil erosion potential - high” are shown.
urce Inventory data (Howes 1979). For non-federal lands, soils classified asion hazard -rapid runo
Sediment Sources 108
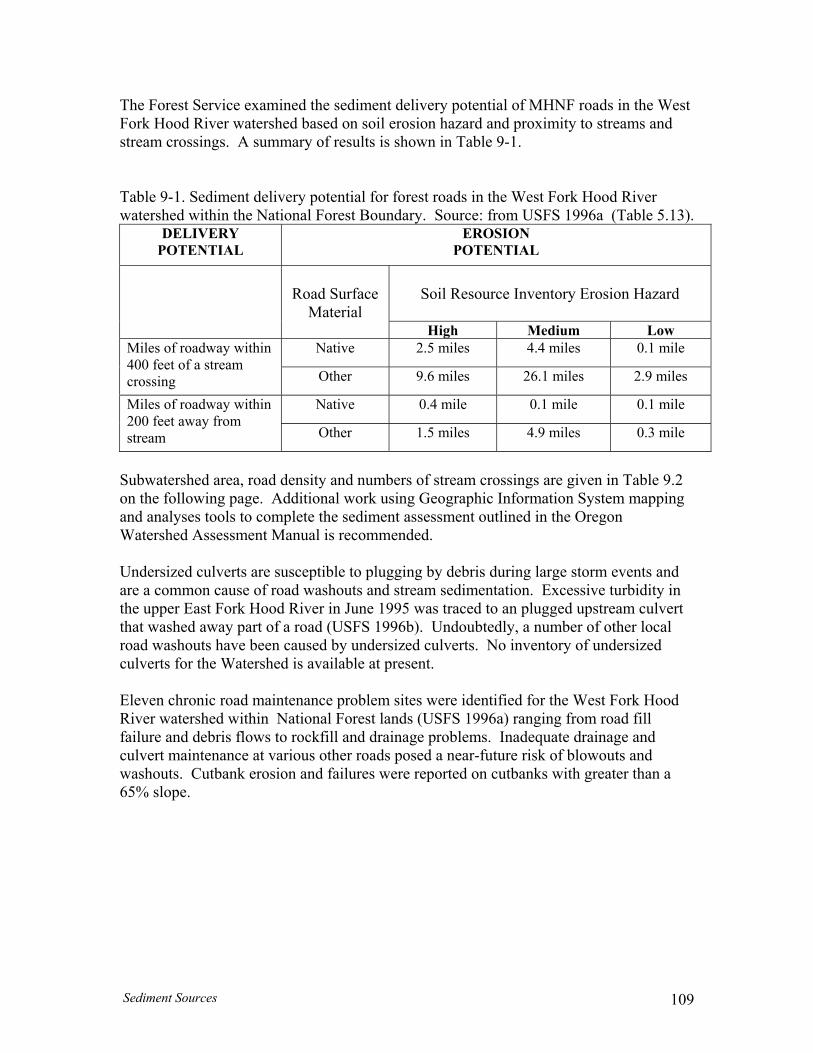
The Forest Service examined the sediment delivery potential of MHNF roads in the West Fork Hstream
).
ood River rosion hazard and proximity to streams and crossings. A summary of results is shown in Table 9-1.
watershed based on soil e
Table 9-1. Sediment delivery potential for forest roads in the West Fork Hood River watershed within the National Forest Boundary. Source: from USFS 1996a (Table 5.13
DELIVERY POTENTIAL
EROSION POTENTIAL
Soil Resource Inventory Erosion Haza
rd
Road Surface
Material High Medium Low
Native 2.5 miles 4.4 miles 0.1 mile Miles of roadway within 400 feet of a stream crossing Other 9.6 miles 26.1 miles 2.9 miles
Native 0.4 mile 0.1 mile 0.1 mile Miles of roadway within 200 feet away from stream Other 1.5 miles 4.9 miles 0.3 mile
Subwatershed area, road density and numbers of stream crossings are given in Table 9.on the following page. Additional wor
2 k using Geographic Information System mapping
and analyses tools to complete the sediment assessment outlined in the Oregon Watershed Assessment Manual is recommended.
ndersized culverts are ge storm events and
vert l
maintenance problem sites were identified for the West Fork Hood iver watershed within National Forest lands (USFS 1996a) ranging from road fill
d
U susceptible to plugging by debris during larare a common cause of road washouts and stream sedimentation. Excessive turbidity inthe upper East Fork Hood River in June 1995 was traced to an plugged upstream culthat washed away part of a road (USFS 1996b). Undoubtedly, a number of other locaroad washouts have been caused by undersized culverts. No inventory of undersized culverts for the Watershed is available at present. Eleven chronic road R
failure and debris flows to rockfill and drainage problems. Inadequate drainage anculvert maintenance at various other roads posed a near-future risk of blowouts and washouts. Cutbank erosion and failures were reported on cutbanks with greater than a 65% slope.
Sediment Sources 109
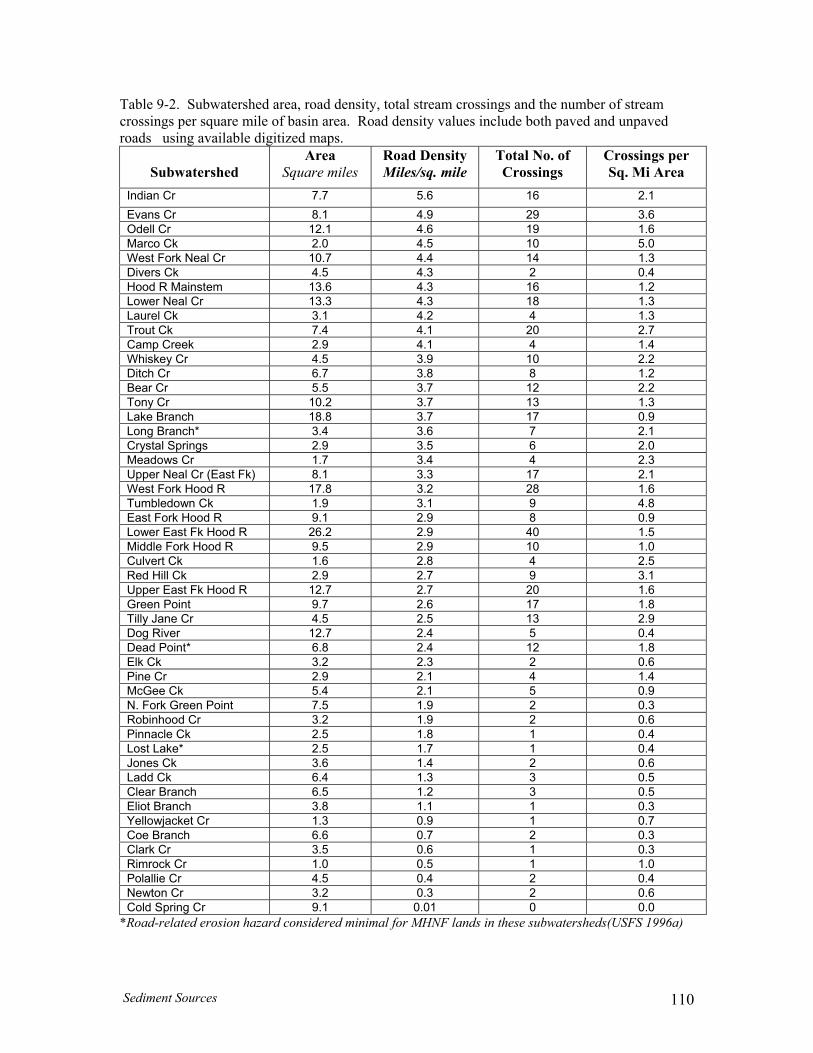
Table 9-2. Subwatershed area, road density, total stream crossings and the number of stream crossings per square mile of basin area. Road density values include both paved and unpavroads using available digitized maps.
Subwatershed
Area Square miles
Road Density Miles/sq. mile
Total No. of Crossings
Crossings per Sq. Mi Area
ed
Indian Cr 7.7
Clark Cr 3.5 0.6 1 0.3 Rimrock Cr 1.0 0.5 1 1.0 Polallie Cr 4.5 0.4 2 0.4 Newton Cr 3.2 0.3 2 0.6 Cold Spring Cr 9.1 0.01 0 0.0
*Road-related erosion hazard considered minimal for MHNF lands in these subwatersheds(USFS 1996a)
5.6 16 2.1 Evans Cr 8.1 4.9 29 3.6 Odell Cr 12.1 4.6 19 1.6 Marco Ck 2.0 4.5 10 5.0 West Fork Neal Cr 10.7 4.4 14 1.3 Divers Ck 4.5 4.3 2 0.4 Hood R Mainstem 13.6 4.3 16 1.2 Lower Neal Cr 13.3 4.3 18 1.3 Laurel Ck 3.1 4.2 4 1.3 Trout Ck 7.4 4.1 20 2.7 Camp Creek 2.9 4.1 4 1.4 Whiskey Cr 4.5 3.9 10 2.2 Ditch Cr 6.7 3.8 8 1.2 Bear Cr 5.5 3.7 12 2.2 Tony Cr 10.2 3.7 13 1.3 Lake Branch 18.8 3.7 17 0.9 Long Branch* 3.4 3.6 7 2.1 Crystal Springs 2.9 3.5 6 2.0 Meadows Cr 1.7 3.4 4 2.3 Upper Neal Cr (East Fk) 8.1 3.3 17 2.1 West Fork Hood R 17.8 3.2 28 1.6 Tumbledown Ck 1.9 3.1 9 4.8 East Fork Hood R 9.1 2.9 8 0.9 Lower East Fk Hood R 26.2 2.9 40 1.5 Middle Fork Hood R 9.5 2.9 10 1.0 Culvert Ck 1.6 2.8 4 2.5 Red Hill Ck 2.9 2.7 9 3.1 Upper East Fk Hood R 12.7 2.7 20 1.6 Green Point 9.7 2.6 17 1.8 Tilly Jane Cr 4.5 2.5 13 2.9 Dog River 12.7 2.4 5 0.4 Dead Point* 6.8 2.4 12 1.8 Elk Ck 3.2 2.3 2 0.6 Pine Cr 2.9 2.1 4 1.4 McGee Ck 5.4 2.1 5 0.9 N. Fork Green Point 7.5 1.9 2 0.3 Robinhood Cr 3.2 1.9 2 0.6 Pinnacle Ck 2.5 1.8 1 0.4 Lost Lake* 2.5 1.7 1 0.4 Jones Ck 3.6 1.4 2 0.6 Ladd Ck 6.4 1.3 3 0.5 Clear Branch 6.5 1.2 3 0.5 Eliot Branch 3.8 1.1 1 0.3 Yellowjacket Cr 1.3 0.9 1 0.7 Coe Branch 6.6 0.7 2 0.3
Sediment Sources 110
Another potential sediment source is rural road maintenance activity, i.e., winter sanding nd ditch cleaning. Sand and gravel applied to Forest Service Road 3555 for winter road afety is reported to ultimately end up in the East Fork Hood River and Stringer
r
the significance or location of impacts for this assessm n Department of Transportation (ODOT) places approximately 1000 cubic yards of aggregate per year on the portion of Highway 35 from Parkdale to Bennet Pass, while the same amount is used to sand the 3.6 miles of acc t Hooconducts sanding along some ing nowfall, but the amounts applied have been limited due to costs and availability of materials der to red l transpo m p s into acent he of the East Fork Hood River, Mt Hood Meadows Ski Resort is working to obtain approvals for a new stormwater system. I easures such as settling basins, straw check been In 1998, ODOT installed several sand traps alo ay 35 n lie Creec ivery into the East Fork Hood River.
oad ditch erosion is a potentially important contributor of sediment to Watershed
a
Meadows (USFS 1996b). Sand and gravel entering streams from State Highway 35 oother roads has been raised as a concern, but little information is available to determine
ent. Orego
d Meadows. Hood River County roads dur s
uce grave rt froarking lots and roadway
nterim m
the adj adwaters
bales and dams have installed. ng Highw ear Polla k to
Rstreams. Sites where significant amounts of sediment can enter stream channels along rural roads should be identified so that appropriate management practices can be applied to reduce sediment delivery to streams.
Sediment Sources Related to Irrigation Systems Open irrigation ditches and canals in the Watershed can deliver sediment to streams through canal failure, slope failure, ditch erosion, end flow, and inter-basin transfer of glacial silt loads into non-glacial streams. Some open canals traverse slopes and hillsides prone to landslide under storm and saturat
Irrigation District Lowline Canal failed and caused a landslide sending sediment into Ditch Creek and the West Fork Hood River. Farmers Canal suffered a catastrophic failure in the winter of 1964-5 and again in spring 1988 ( FID 1995). The District reports that the upper reach of Highline Canal is in poor condition and is at a high risfailure (J. Bryan, FID). Tininitc
s
ess roads to M
. In or
ontrol sediment del
ed soil conditions. These canals can ansfer large amounts of sediment into streams. In the February 1996 flood, Farmers
k of
he Neal Creek stream channel is used to convey irrigation water from the glacially fluenced East Fork Hood River before it is diverted into the East Side Lateral, troducing a glacial silt load not natural to Neal Creek, as well as erosion from the ditch self and runoff from local land uses. Similarly, Evans Creek is used as an irrigation onveyance for water from Coe and Eliot glacial sources.
Irrigation return flow or end flow carries sediment to streams at a number of sites. One of these sites is on Neal Creek near river mile 5.
tr
Sediment Sources 111
Key Findings – Sediment Sources
1 ry natural sources o iment delivery to streams in the Hood River W shed include glacial sediment, landslides and dam break floods originating on the slopes of
ood. 2 t to streams due to human activity is primaril lated to roads,
lverts at roa ssings, and ation ditches 3 ent delivery from open irrigation ditches and canals is noted as a specif
m in the Watershed. Sediment trans s is likely to continue as a canal failures, lan des, ditch er n, and inter-b transfer of g l silt
into non-glacial stre . 4 l road maintenance a ies including ditch cleaning and winter sand/gravel
ns are probable l sediment sources but more information is needed to ations and sign ance of impacts.
5 vice se nt monitorin ta analysis su ested that mos e
duction in th st, Middle a ast Fork Hoo River watershe as st roads and forest managem related debris
F / Data G
. Prima f sed ater
Mt. H . Sediment inpu y re
undersized cu d cro irrig .
. Sedim ic proble port to streamresult of dsli osio asin lacialoads ams
. Rura ctivitapplicatio locaidentify loc ific
. The US Forest Ser dime g da gg t finsediment pro e We nd E d ds wrelated to fore ent- flows.
aps
non
tems
Conduct sses imend
continAssessment Manual.
Update r
urther Work Needed • nd map forest road maintenance needs including undersized culverts on
-federal lands • p sediment sources and hazard areas specific to irrigation sys • a more detailed a sment of sed nt sources including identification of
egments with a significant potential for sediment delivery to streams, aue sediment source analyses and ma g per the Oregon Watershed
• oad maps for all land ownerships g aerial photo
Identify a
Identify and ma
ditch sppin
usin s
Sediment Sources 112
10. UPLAND VEGETATION AND WILDLIFE HABITAT Introduction Healthy native plant and wildlife communities are part of a sound watershed ecosyWhile conditions of upland forest and wildlife habitat on National Forest lands are described in Forest Service reports (USFS 1996a; USFS 1996b), this Chapter focuses on private and non-federal land in the Hood River Valley. It is not intended as acomprehensive look at wildlife habitat or native plant status but instead discusses selected topics and voluntary opportunities to assist wildlife on private lands. Information was provided by John Wells, wildlife biologist, USFS; Jim Torland, wildlife biologist, ODFW; Dean Guess, Forester, Hood River County, and Monica Burke, Parkdale resident, naturalist and historian.
stem.
e the valley landscape. The Hood River Valley a “working” environment where people continually manipulate plant and animal
environments to meet human needs (Wells 1999). The most obvious change from forest with apple and pear orchards. of the valley, trees covering lower
ted
w lt
rural residential properties are damaged live trees, standing dead eter downed trees that provide nesting cavities, scanning perches,
upper
Landscape Changes
is
historic conditions is the replacement of conifer Although trees are still the dominant vegetation
trees, and large-diamand insect-feeding substrate for birds and a variety of other wildlife. While remnantforest patches are present among cultivated and developed lands in the lower andValley, these are often fragmented. In many areas, streamside or riparian vegetation is the last stronghold of native plant form and function in the Hood River Valley (Wells,1999).
Vegetation and wildlife habitats that once existed in the Hood River Valley area have been substantially altered in the last 150 years by human development. Agricultural, residential uses and roads now dominat
elevation lands and the valley floor today are deciduous, uniformly spaced, and planin single-species monotypes. It is not so much the spatial or compositional change in vegetation that is important, butrather the absence of certain structural features in orchards and residential environments. Deciduous trees do not provide the year-round hiding, thermal and snoaccumulation cover or shelter for birds and mammals that conifers provide. The resuis a net loss of shelter for resident birds and mammals, especially in winter, at elevations under 2,500 feet. Another structural attribute of native forests, missing in fruit orchards and most
Upland Vegetation and Wildlife 113
Pine-Oak Woodlands
the
ickly keep
s left its mark. In places like the Upper Hood River Valley, the pine-oak woodlands are disconnected and almost
, the Oregon poppy. The pine-oak woodlands are the winter habitat of deer and elk and their predators.
ty
nd of the last Ice Age and peaked about h ts
ence allows the oaks to grow out here in the eastern hinterlands of their range in Oregon. The marine influence map and the map of the historic distribution of Oregon white oak overlap. When I think of the pine-oak woodlands, I see the absolute glory of fields of balsam
-widow wildflowers poking up through the snow. I see the fact that there isn't much of it; that the oaks can move in geologic time, but not fast enough to withstand the pace of change”.
e
ex life see le
ize human-wildlife interactions, including bear and cougar
The winter range of large migratory animals like deer and elk in the Hood River valley floor has been usurped by human habitation (Wells 1999). Half the remaining winter range of deer and elk in the Watershed as a whole is on private land. These areas are mapped by ODFW and provided to the Hood River County Planning Department to assist with land use planning (Figure 10-1). Wildlife populations are managed by
The following was excerpted from Maritime, an essay by Hood River valley resident Monica Burke (1999) describing the origin and status of the unique pine-oak forests in
Hood River area, many of which are found on private land.
“Our savannas, the pine-oak woodlands of the Gorge, are both sublime and qudisappearing. ..They are disappearing because fires do not come often enough tofir trees from overshadowing the gentle oaks. Development ha
gone. Beyond the loss of aesthetics, the disappearance and fragmentation of this ecosystem is significant. It is the habitat for a guild of animals and plants that are among the most rare in Oregon and Washington: the Western Pond Turtle, the Violet suksdorfia, ball-head waterleaf
The oaks in these woodlands are Oregon white oaks (Quercus garryana). Universiof Oregon Paleobotanist Leroy Detling postulated that the Oregon white oaks and manyof its associated flowers migrated northward from the Rogue valley in southern Oregonduring a xerothermic period that began at the e6,500 years ago. The oaks and plants moved up the Willamette Valley and east througthe Columbia River Gorge. As the climate gradually cooled again, some of these planwere able to survive in the Gorge, especially in the drier east end, and became isolated. Still, the oaks in the Gorge are a bit of an anomaly. The marine influ
root, and the tenacity of grass
er and Elk D ODFW management objectives for deer and elk include maximizing deer and elk populations on public lands and finding a balance between the needs of landowners andthe needs of wildlife on private lands, as opposed to managing deer and elk out of
istence (Torland, ODFW, pers comm). State land use planning objectives for wildk to direct dense residential development away from wildlife habitat to enab
encounters.
hunting activities and minim
Upland Vegetation and Wildlife 114
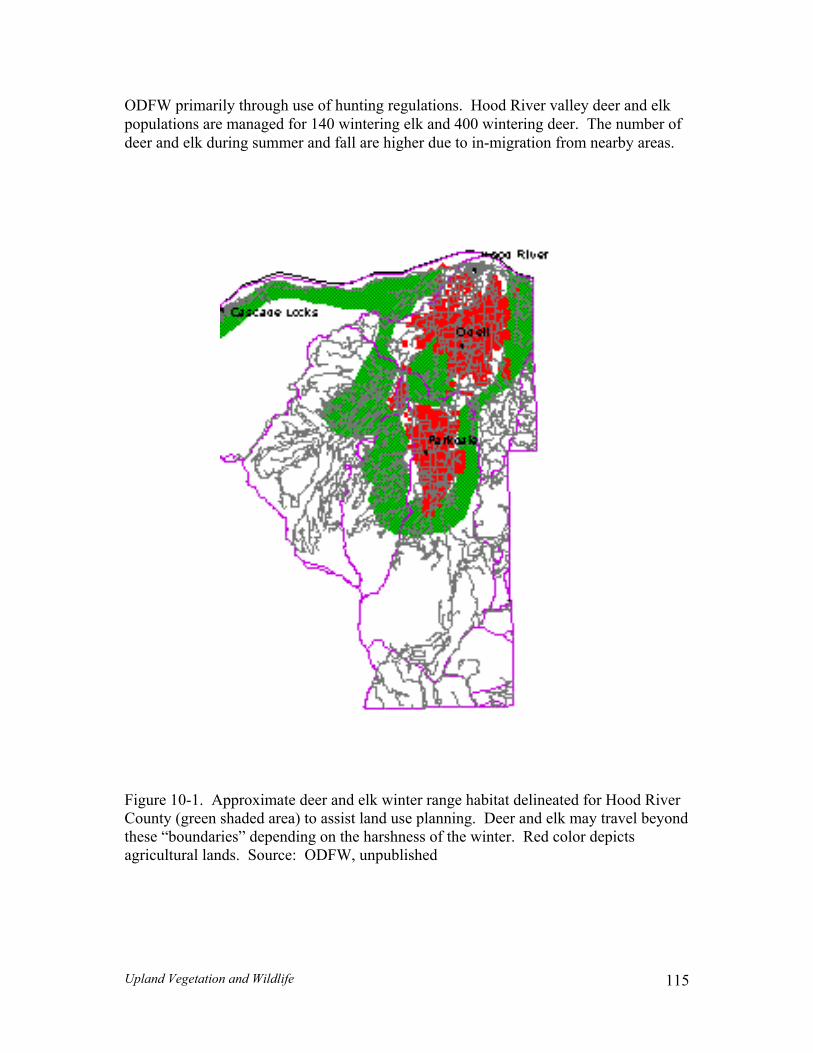
ODFW primarily through use of hunting regulations. Hood River valley deer and elk number of rby areas.
populations are managed for 140 wintering elk and 400 wintering deer. Theeer and elk during summer and fall are higher due to in-migration from nea
Figure 10-1. Approximate deer and elk winter range habitat delineated for Hood RiveCounty (green shaded area) to assist land use planning. Deer and elk may travel beyond these “boundaries” depending on the harshness of the winter. Red color depicts agricultural lands. Source: ODFW, unpublished
r
d
Upland Vegetation and Wildlife 115
Noxious Weeds and Invasive Plants
The Weed and Pest Division of the Hood River County Parks and Buildings
monly recognized as a erious threat to croplands and livestock. Noxious weeds are also a threat to native
ecosystby indiurban, weed sslow m lion acres oeight to The Hotechniqmechancontrol 1999 is Tansy rhave inlivestoc . Hood RbiologiPurple that gro s, choking off native riparian vegetation nd filling in aquatic habitat and waterways. Purple loosestrife causes economic losses nd is the target of intensive control measures. Large numbers of this plant have been
eams near Odell and are spreading into Neal Creek and parts of the East ork Irrigation District canal system. The proliferation of Scotch broom, also
e
Department keeps track of invasive plant species on public and private land and employs control measures on contract for landowners such as Longview Fibre and the Forest Service. Noxious weeds or invasive plant species are coms
od River County Weed and Pest Division uses Integrated Pest Management ues to control noxious weeds, combining biological controls, herbicide use and ical mowing or removal. Currently, 23 invasive plant species are targeted for
or eradication in Hood River County. Their estimated infestation (% of land) in shown in Table 10-1.
agwort and knapweed both have become well established in the County and fested 5% and 7% of lands, respectively. Tansy ragwort is very toxic to k, while knapweed aggressively displaces pasture feed grasses and other plants8
iver County focuses on attacking large concentrations of these weeds using cal or chemical methods. Isolated plants and small patches are hand pulled. loosestrife was introduced as an ornamental plant and is now an aggressive pest ws along the banks of lakes and stream
aafound along strF
8 Use of gloves is strongly recommended when hand-pulling knapweed. Studies recently found a possible link between knapweed and cancer-like tumors after cuts or scrapes contact plant toxins. (S. Smith, Wasco County Weed and Pest Department, pers. comm)
ems, as they can crowd out and compete with native vegetation depended upon genous wildlife. All ecosystems are vulnerable to invasion by noxious weeds - suburban and rural, forest, riparian areas, wetlands and range lands. The noxious ituation in the U.S. has been described as “a biological disaster, an explosion in otion” by the Wyoming Department of Agriculture. An estimated 6 to 7 miln National Forest lands are presently infested and increasing at a rate of up to twelve percent per year (USDA 1998).
introduced as an ornamental plant, is of growing concern and has infested 6% of thCounty. The goal for these species is “zero-tolerance” or eradication (Hood River News, June 9, 1999). Himalayan blackberry is another aggressive plant that can proliferate along streams in cleared areas, crowding out and competing with native plants for moisture.
Upland Vegetation and Wildlife 116
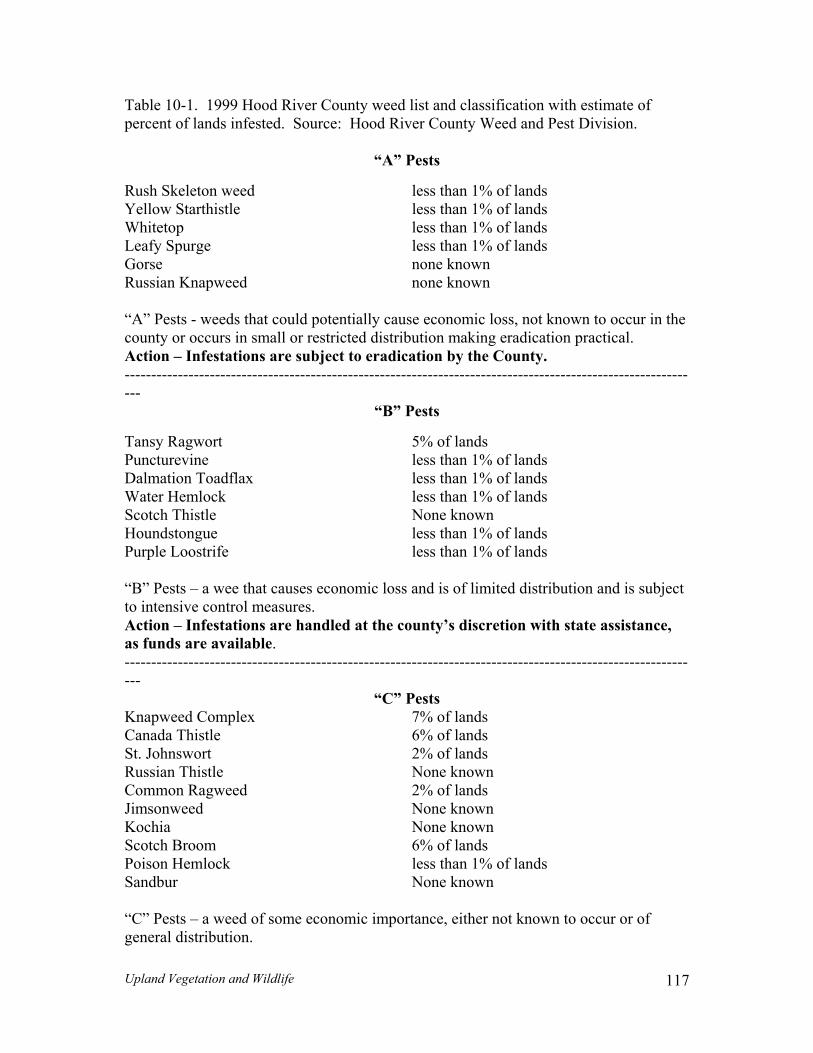
Table 10-1. 1999 Hood River County weed list and classification with estimate of percent of lands infested. Source: Hood River County Weed and Pest Division.
“A” Pests
ush Skeleton weed less than 1% of lands ellow Starthistle less than 1% of lands hitetop less than 1% of lands
Leafy Spurge less than 1% of lands Gorse none known Russian Knapweed none known “A” Pests - weeds that could potentially cause economic loss, not known to occur in the county or occurs in small or restricted distribution making eradication practical. Action – Infestations are subject to eradication by the County. -------------------------------------------------------------------------------------------------------------
“B” Pests
Tansy Ragwort 5% of lands Puncturevine less than 1% of lands Dalmation Toadflax less than 1% of lands Water Hemlock less than 1% of lands Scotch Thistle None known Houndstongue less than 1% of lands Purple Loostrife less than 1% of lands “B” Pests – a wee that causes economic loss and is of limited distribution and is subject to intensive control measures. Action – Infestations are handled at the county’s discretion with state assistance, as funds are available. -------------------------------------------------------------------------------------------------------------
“C” Pests napweed Complex 7% of lands anada Thistle 6% of lands t. Johnswort 2% of lands ussian Thistle None known
an 1% of lands andbur None known
C” Pests – a weed of some economic importance, either not known to occur or of general distribution.
R
KCSR
PS “
YW
Common Ragweed 2% of lands Jimsonweed None known Kochia None known Scotch Broom 6% of lands
oison Hemlock less th
Upland Vegetation and Wildlife 117

Action - Infestations are handled at the county’s discretion with technical or
ent and Protection
ll
ative vegetation than others.
d d, or
. tering
. Eliminate noxious weeds on your land. Removal of invasive noxious weeds will not only improve your property, it will reduce the spread to neighboring properties. The County cannot do it all !
. Encourage predators like red-tailed hawk, barn owl, great horned owl, American kestrel, long-tailed weasel, striped skunk and spotted skunk for assistance in controlling meadow mice (voles) and pocket gophers.
5. Hang up a bat house to encourage bats. Bats aid control of coddling moth, and other
advisory assistance from the state. Sensitive Area Protection Local governments are required by state law to prepare inventories of wildlife habitat, riparian corridors, wetlands and other significant habitats under Goal 5 of the Statewide Planning Program - Oregon Department of Land Conservation and Development (DLCD). Local governments use these inventories to determine which resources are most significant and to take steps to protect them (DLCD 1997). Hood River County has not yet prepared such inventories, potentially leaving wildlife and native plants at risk of incompatible development or inducing greater conflict between wildlife and people given continued population growth.
pportunities for Wildlife Habitat EnhancemO Many opportunities exist to improve habitat conditions to benefit people and wildlife inand around agricultural and residential lands. Not all of these will be appropriate for alands or landowners. Some landowners may have a greater ability to provide, enhance or protect wildlife habitats and n A number of sources in the Columbia Gorge area can provide information, advice, anassistance to persons interested in enhancing or protecting wildlife on private lanhelp landowners minimize conflict with wildlife. Assistance ranges from low-cost native plant seedlings, low-cost nesting boxes or plans, technical advise, and programinformation for land donations or conservation easements to potential tax relief for voluntary protection of eligible habitat on private lands. Potential wildlife enhancement opportunities are listed below: 1. Retain snags, dead trees and downed wood in wood lots and riparian areas to
provide perching spots, a food supply and habitat for cavity nesting birds. 2. Keep or plant a native landscape on part or all of your lot instead of a large lawn
Once established, native landscaping requires a fraction of the upkeep and waof a lawn and can provide food and shelter for small mammals and birds.
3
4
Upland Vegetation and Wildlife 118
orchard pests. Put up a scanning post or nest boxes to help birds. 6. Conserve native vegetation along streams, around ponds or in wet areas.
. Big glass windows kill thousands of migratory and resident birds each year.
, using shades, and een chimney prevent any
side from direct kills,
variety of vegetation can foil the sp organisms which rely on a single plant species and enhance natural control of pests by providing predator habitat.
scrub and e bor rs of lds an can provide wildlife
mpr ing p vacy a d help ays and trespass.
. Beaver t for young fish.
Natural Resources Conservation Service Hood River Soil and Water Conservation District
7Marking windows with strips of white tape or raptor silhouetteslocating birdfeeders well away from windows prevents such kills. Scr
ent nes ing ins de - consult w xpert totops to prev t i ith a local fire safety ehazard.
8. Control pets that chase or kill birds, deer and other wildlife. A
loose pets can prevent wildlife from using otherwise suitable habitat. Free-roaming cats are easy prey for cougar, coyote and fox and may cause predators to remain where they are unwelcome.
9. Diversify vegetation. Plant native species that offer shelter and food. A greater
read of pest
10. Maintain or enhance field and property buffers. Allowing native trees,
grasses to grow at th de fie d along property lineshabitat while i ov ri n ing to buffer noise, spr
11. Co-exist with or tolerate beaver activity along streams if at all possible
Contact these groups and agencies for further information:
Oregon Department of Fish and Wildlife District Office
Wasco County Soil and Water Conservation District Native Plant Society
Audubon Society US Forest Service Hood River County Weed and Pest Division
ponds recharge groundwater and provide excellent winter habita
Upland Vegetation and Wildlife 119
1 This Chapter summarizes information collected in the assessment process in order to i d protection opportunities, and outlines missing information or data gaps identified in the assessment process. Key findings and areas of habitat/
s
n
f
it the biological potential of the Watershed. Several of these are to human g, high stream
ent, rapid runoff and high peak flows. In addition, subbasin
Upstream and downstream passage barriers: The upstream migration of salmon,
Lack of habitat structure and diversity: Given its rapid runoff and confined is believed to be an
especially significant limitation. Historic timber harvest and other land use has able
mplexity and pool frequency. Flood refuge, hiding cover, over-wintering and productive early
a ded. Most channels lack structure to retain gravels for spawning and invertebrate production and ao
3. Water quality and riparian degradation: Summer and early fall water t of s tion h tock, forestry and agricultural land use have removed riparian vegetation decreasing shade, bank
1. Watershed Condition Evaluation
dentify habitat restoration an
water quality concerns are described in summary tables at the end of this Chapter. Mapwhich overlay fish distribution, channel habitat types, habitat conditions and land use impacts and maps which show the locations of planned or recommended restoratioactions will be used in the Action Plan development process. This information will be used to assist the development of a community-based Watershed Action Plan beginningin early 2000 by the HRWG with the help of a technical advisory committee made up okey stakeholders and agencies. Various factors limassociated with natural physical characteristics, while others are relatedactivities. Primary physical constraints include glacial sediment loadingradients, valley confinemwater chemistry has been characterized as having relatively low productivity reflected by low specific conductance, alkalinity, hardness and trace elements (O’Toole and ODFW 1991). Significant limiting factors related to human activities are summarized below: 1.
steelhead, and resident trout is blocked or impeded at numerous locations by diversion dams and other structures, resulting in the failure to seed historically utilized spawning and rearing habitat. Direct mortality of downstream migrant salmonids occurs in canals and ditches associated with unscreened or inadequately screened water diversions.
2.
channel characteristics, the lack of instream habitat structure
resulted in simplified channels and riparian zones with little instream or recruitlarge woody debris. Inadequate wood supply has reduced pool area, pool co
rearing habitats (i.e. shallow lateral habitats, side channels) are lacking. Sediment deposition and meander processes have been disrupted causing channels to downcut nd disconnect from their floodplain, while others have widened and aggra
re instead dominated by coarse boulder and rubble substrates. A current deficiency f gravel in the low-water channel for use by fall spawners is of particular concern.
emperatures exceed reported preferred ranges for salmonid life stages in a numbertream reaches. Elevated nutrients, high pH episodes and pesticide contaminaave been measured. Road construction, power lines, lives
120
s mperatures. 4 L sions
during critical periods diminishes or even dewaters aquatic habitat and may impede a water t s
5. Increased sediment and turbidity: Seasonally high turbidity and episodic sediment
loading is natural to aquatic habitat given the Watershed’s glacial characteristics. Cmlirrigation ditches raise the natural sediment load and increase turbidity. Glacial silt is imported into several non-glacial tributaries used to convey irrigation water from East a
6. C
encroachment has narrowed stream channels and limits meander inside floodplains. e
aimodifications like splash damming and stream clean-out also have had lasting effects
7. Loss of marine nutrients: Subbasin water chemistry has been characterized as
having relatively low biological potential reflected by low specific conductance, alkalinity, hardness and trace elements (O’Toole and ODFW 1991). Loss of nutrients
ely low population levels and migration barriers further depresses the biological productivity of the subbasin.
8. Ups eak flows: Natural subbasin
char age capacity, and a high prop ally rapid runoff and high
ese natural factors, low road densities and maintenance of a high percentage of closed-canopy forest cover are especially important in order to avoid chronic increases in peak flows that undermine productivity and potential for succ
A number of restoration project opportunities in the Hood River Watershed are relatively straightforward while other potential projects require further information. The following guidance is recommended in the Oregon Watershed Assessment Manual as a framework for watershed protection and restoration projects: 1. Protect stream reaches in relatively good condition - areas with relatively high-quality
aquatic-riparian habitat, fish populations or water quality conditions
tability and water retention capabilities; and raising summer water te
. ow summer/fall instream flows: Low flow conditions below water diver
nadromous or resident fish migration. Low summer flows contribute to warmemperatures and water quality impairment. Land use activities affecting subsurfacetorage and recharge have also likely contributed to lower summer flows.
ontrolling chronic sediment delivery and turbidity from human sources is critical to aximizing biological productivity. Chronic sources such as road runoff and
andslides associated with roads, undersized culverts, streambank erosion, and
nd Middle Fork Hood River sources.
hannel modifications: Channelization, road fill, bank armoring and other
This has created shorter channels, steeper gradients, higher velocities, loss of storagnd recharge capacity, bed armoring, and entrenchment. Channel modifications in nteract with each flood event to further aggravate these channel changes. Historic
on habitat development potential in the subbasin.
from anadromous adult spawning carcasses due to extrem
lope watershed conditions and altered pacteristics including steep gradients, low flood storortion of area vulnerable to rain on snow cause especi
peak flows. Because of th
essful instream restoration.
121
2. Restore stream reaches with habitat or fish populations that are currently in degraded
s -condition but have the potential to support high quality habitat and fish populationareas with low-quality aquatic-riparian habitat or limitations on fish presence or production, or water quality concerns where the impacts and sources are identified
3. Survey stream reaches where there is insufficient data to assess stream habitat qualor fish population status - areas where the aquatic-riparian condition, fish populator water quality cannot be accurately determined and/or the links to impacts are not clear.
In general, desirable aquatic hab
ity ions
itat conditions for the Hood River subbasin include the llowing elements:
actors
Complex habitat structure, i.e., large wood, pools, side channels, diverse lateral
• • •
fo • Anadromous or resident fish migration and distribution unimpeded by human f• Excellent water quality • Natural streamflows preserved or restored to the degree feasible • Healthy, mature riparian zones that provide shade and contribute large wood to
stream channels • Stream channels able to access and interact with their floodplains during high water •
habitats Abundant gravel supply Watershed disturbances are localized and infrequent High species diversity and abundance
122
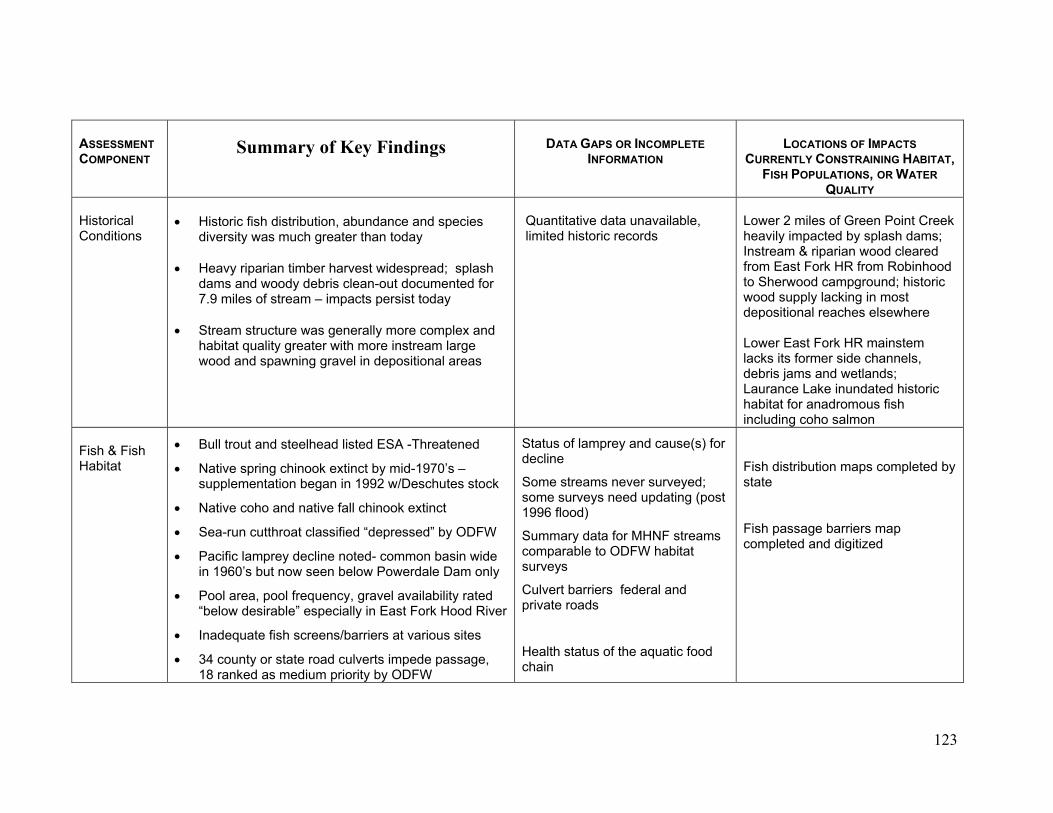
ASSESSMENT COMP
ummary of Key ndings
DATA GAPS O COMPLETE ON
L TIONS OF IMPAC
C BITUL ER
S
• Historic
diversit • Heavy r
dams a7.9 mile
• Stream
habitat wood a
• Bull tro
Native supple
Native
Sea-run
Pacific lin 1960’
Pool ar“below
Inadequ
34 coun18 rank
Fi
h distribution, abundanas much greater than
arian timber harvest wi woody debris clean-ouof stream – impacts pe
ucture was generally ality greater with more
awning gravel in de
steelhead listed ES
chinook extinct by tion began in 1992
nd native fall chino
roat classified “dep
ey decline noted- conow seen below Po
ol frequency, graveble” especially in E
sh screens/barriers
state road culvermedium prio
R ININFORMATI
Quantitative data un limited historic record
Status of lamprey anddecline
ome streams never me surveys need u96 flood)
ummary data for MHmparable to ODFWrveys
ulvert barriers fedeivate roads
ealth status of thain
TS ONSTRAINING HAATIONS, OR WAT
QUALITY
of Green Point ed by splash daarian wood clear HR from Robinampground; hist
acking in most aches elsewher
rk HR mainstemr side channels,d wetlands;
e inundated histodromous fish salmon
n maps complet
barriers map digitized
OCA
CURRENTLYFISH POP
ailable, Lower 2 milheavily impInstream & from East Fto Sherwoowood suppldepositiona Lower East lacks its fordebris jamsLaurance Lhabitat for aincluding co
e(s) for
yed; g (post
treams tat
d
food
Fish distribustate
Fish passagcompleted a
ONENT
ical itions
& Fish at
AT,
ek ; od c
by
HistorCond
fis cey w tod
ip dend t ds rsi
str moqu insnd sp po
avs
es Creact msrip edork hod c oriy ll re e
Fo me anak ricnaho
and species ay
spread; splash ocumented for
st today
re complex and tream large
sitional areas
-Threatened
d-1970’s – Deschutes stock
extinct
sed” by ODFW
mon basin wide erdale Dam only
vailability rated Fork Hood Rive
various sites
pede passage, DFW
Fish Habit
ut and A
• spring mimenta w/
• coho a ok
• cutth res
• ampr ms but w
• ea, po l adesira ast r
• ate fi at
• ty or ts imed as rity by O
caus
S surveso pdatin19
S NF sco habisu
C ral anpr
H e aquaticch
tio ed
e nd
123
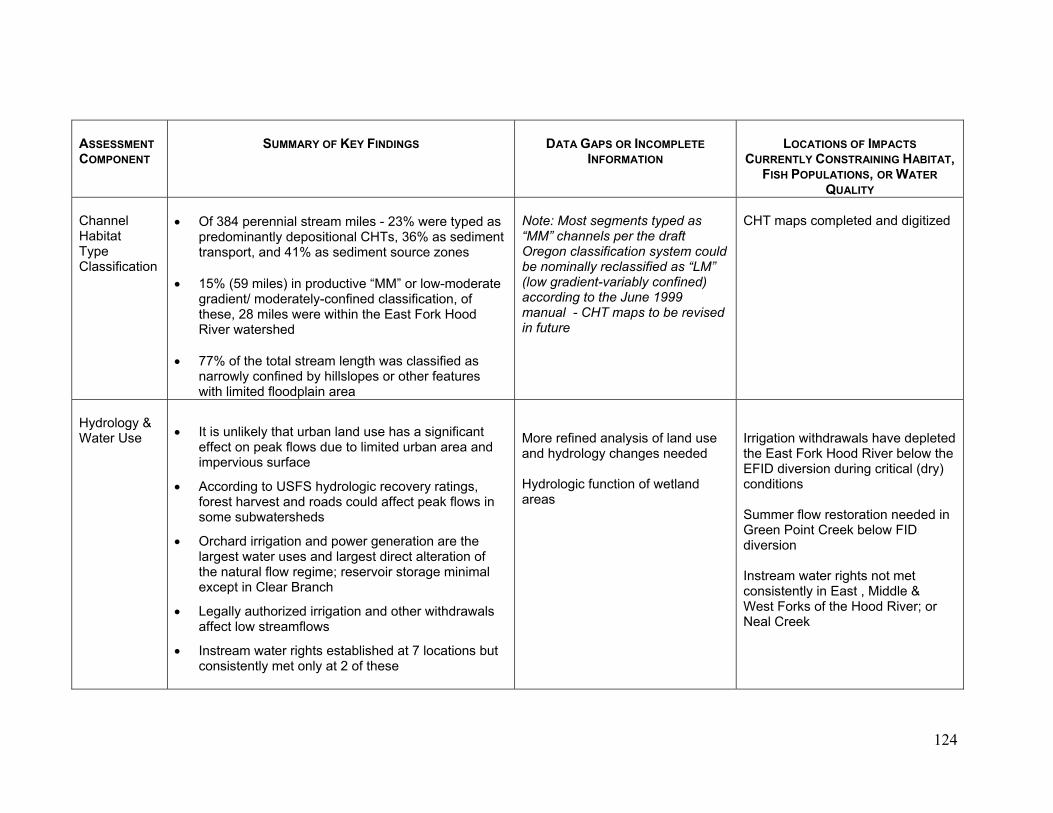
ASSESSMENT COMPONENT
SUMMARY OF KEY FINDINGS DATA GAPS OR INCOMPLETE
LOCATI OF IMPACTS
UR TR T, F ON
LIT
N“Ob(lami
Ma
ONS RENTLY CONSISH POPULATI
QUA
ps comple
n withdrawt Fork Hooversion duns
r flow restoint Creen
water rigntly in Earks of the
eek
C
ld
CH
IrrithEFco SuGrdiv InscoWNe
INF
senelssiflly rnt-to t
ed aogy
fun
ORMAT
gments per tication
assiablJunaps
lysiang
on
ION
s tyhe d syifiey ce 1 to
s ofes
of w
pedrafsted asonfi999
AINING HABITAS, OR WATER Y
d and digitize
s have depletRiver below tg critical (dry)
tion needed ielow FID
not met Middle & ood River; or
Channel Habitat Type Classification
• Of 384 perennial stream miles - 23% were typed
predominantly depositional CHTs, 36% as sedimtransport, and 41% as sediment source zones
• 15% (59 miles) in productive “MM” or low-modera
gradient/ moderately-confined classification, of these, 28 miles were within the East Fork Hood River watershed
• 77% of the total stream length was classified as
narrowly confined by hillslopes or other features with limited floodplain area
: M ” con ouom ecl M” gr var ) rdi he
be ised n futur
T ma te d oteMMrege nowcco
osthan claina
adieng
anual - CHT me
efindrol
ogic
ast m c “L
ned
rev
nd uede
and
as ent
te
Hydrology & Water Use
• It is unlikely that urban land use has a significant effect on peak flows due to limited urban area and impervious surface
• According to USFS hydrologic recovery ratings, forest harvest and roads could affect peak flows in some subwatersheds
• Orchard irrigation and power generation are the largest water uses and largest direct alteration of the natural flow regime; reservoir storage minimal except in Clear Branch
• Legally authorized irrigation and other withdrawals affect low streamflows
• Instream water rights established at 7 locations but consistently met only at 2 of these
ore r na la se nd hy ch ne d
Hydrol cti etl areas
gatio al ed e Eas d he ID di rin nditio
mme ora n een P k bersio
tream htsnsiste st ,est Fo H al Cr
124
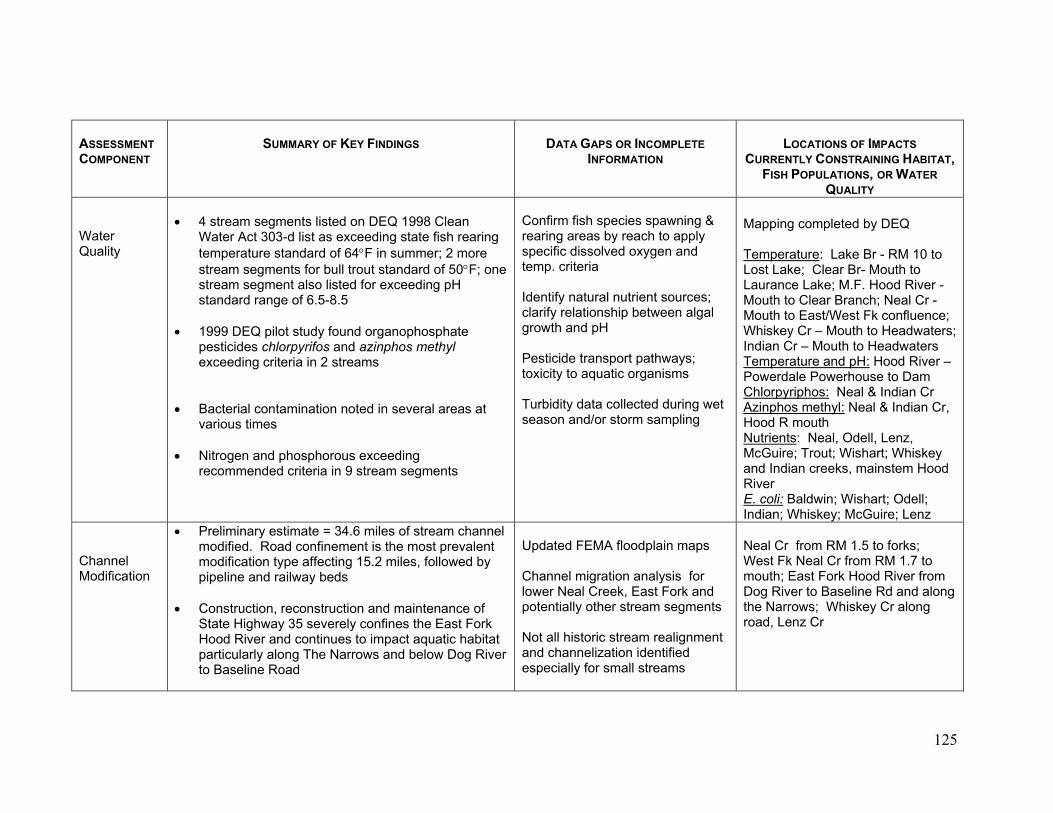
ASSESSMENT COMPONENT
SUMMARY OF KEY FINDINGS
DATA GAPS OR INCOMPLETE
INFORMATION
LOCATIONS OF IMPACTS
CURRENTLY CONSTRAINING HABITAT, FISH POPULATIONS, OR WATER
QUALITY Water Quality
• 4 stream segments listed on DEQ 1998 Clean
Water Act 303-d list as exceeding state fish rearitemperature standard of 64°F in summ
ng er; 2 more
e
• Bacterial contamination noted in several areas at
various times
&
temp. criteria Identify natural nutrient sources; clarify relationship between algal growth and pH Pesticide transport pathways; toxicity to aquatic organisms Turbidity data collected during wet season and/or storm sampling
stream segments for bull trout standard of 50°F; onstream segment also listed for exceeding pH standard range of 6.5-8.5
• 1999 DEQ pilot study found organophosphate
pesticides chlorpyrifos and azinphos methyl exceeding criteria in 2 streams
• Nitrogen and phosphorous exceeding recommended criteria in 9 stream segments
Confirm fish species spawning
o apply rearing areas by reach tecific dissolved oxygen and sp
Mapping completed by DEQ Temperature: Lake Br - RM 10 to Lost Lake; Clear Br- Mouth to Laurance Lake; M.F. Hood River - Mouth to Clear Branch; Neal Cr - Mouth to East/West Fk confluenWhiskey Cr – Mouth to Headwaters;
ce;
rs Indian Cr – Mouth to HeadwateTemperature and pH: Hood RivPowerdale Powerhouse to Dam
er –
Chlorpyriphos: Neal & Indian Cr Azinphos methyl: Neal & Indian CHood R mouth Nutrients
r,
: Neal, Odell, Lenz, McGuire; Trout; Wishart; Whiskey
:
and Indian creeks, mainstem Hood River E. coliI
• Preliminary estimate = 34.6 miles of stream channemodified. Road confinement is the most prevalent modification type affecting 15.2 miles, followed by pipeline and railway beds
• Construction, reconstruction and maintenance of
State Highway 35 severely confines the East Fork Hood River and continues to impact aquatic habiparticularly along The Narrows and below Dog Rto Baseline Road
Updated FEMA floodplain maps Channellower Neal Creek, East Fork potentially other stream se
and channelization identified especially for small streams
Neal Cr from RM 1.5 to forWest Fk Neal Cr from
Baldwin; Wishart; Odell; ndian; Whiskey; McGuire; Lenz
Channel Modification
l
tat iver
migration analysis for and
gments
Not all historic stream realignment
ks; RM 1.7 to
mouth; East Fork Hood River from Dog River to Baseline Rd and along the Narrows; Whiskey Cr along road, Lenz Cr
125
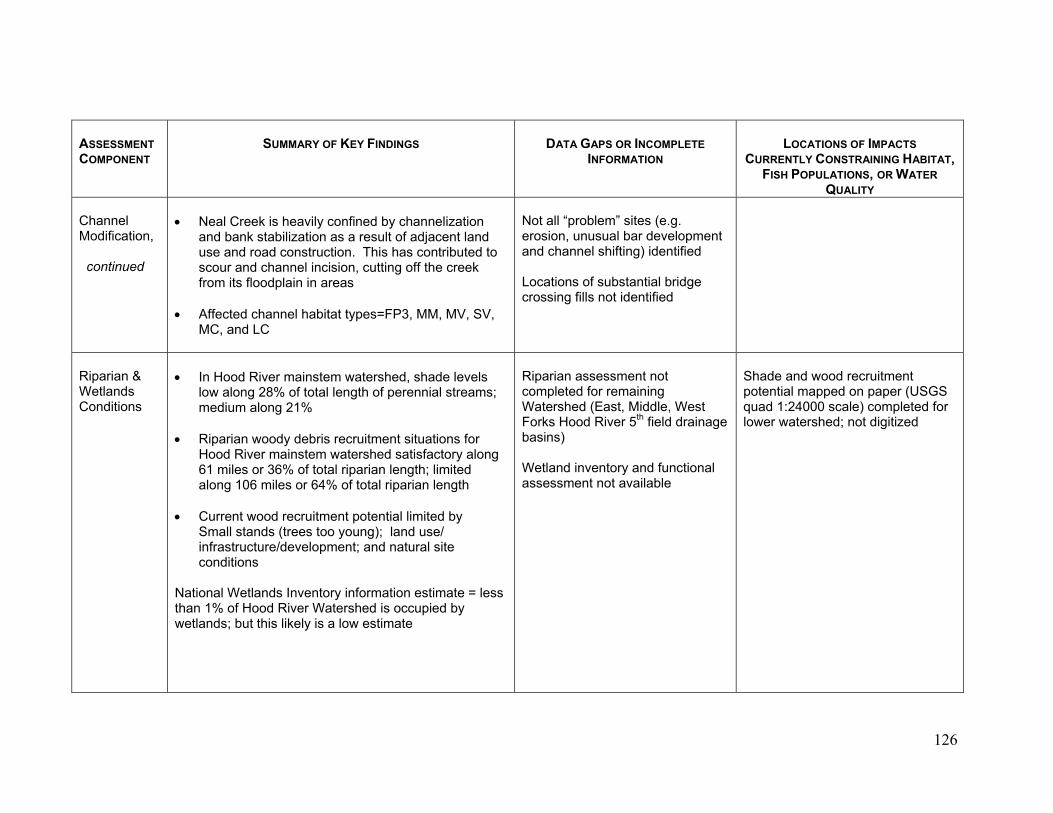
ASSESSMENT COMPONENT
SUMMARY OF KEY FINDINGS
DATA GAPS OR INCOMPLETE
INFORMATION
LOCATIONS OF IMPACTS
CURRENTLY CONSTRAINING HABITAT, FISH POPULATIONS, OR WATER
QUALITY Channel Modification,
• V,
ent continued
• Neal Creek is heavily confined by channelization
and bank stabilization as a result of adjacent land use and road construction. This has contributed to scour and channel incision, cutting off the creek from its floodplain in areas
Affected channel habitat types=FP3, MM, MV, SMC, and LC
Not all “problem” sites (e.g. erosion, unusual bar developmand channel shifting) identified Locations of substantial bridge crossing fills not identified
• In Hood River mainstem watershed, shade level
low along 28% of total length of perennial streammedium along 21%
• Riparian woody debris recruitment situations for
Hood River mainstem watershed satisfactory along61 miles or 36% of talong 106 miles or 64% of total riparian length
Current wood recruitment potential limited by Small stands (treesinfrastructure/development; and natural site conditions onal Wetlands Inventory
than 1% of Hood River Watershed is occupied by w ands; but this likely is a low estimate
Fbasins) Wetland inventory and functional assessment not available
ql
Riparian & Wetlands Conditions
s s;
otal riparian length; limited
• too young); land use/
Nati information estimate = less
etl
Riparian assessment not completed for remaining Watershed (East, Middle, West
orks Hood River 5th field drainage
Shade and wood recruitment potential mapped on paper (USGS
uad 1:24000 scale) completed for ower watershed; not digitized
126
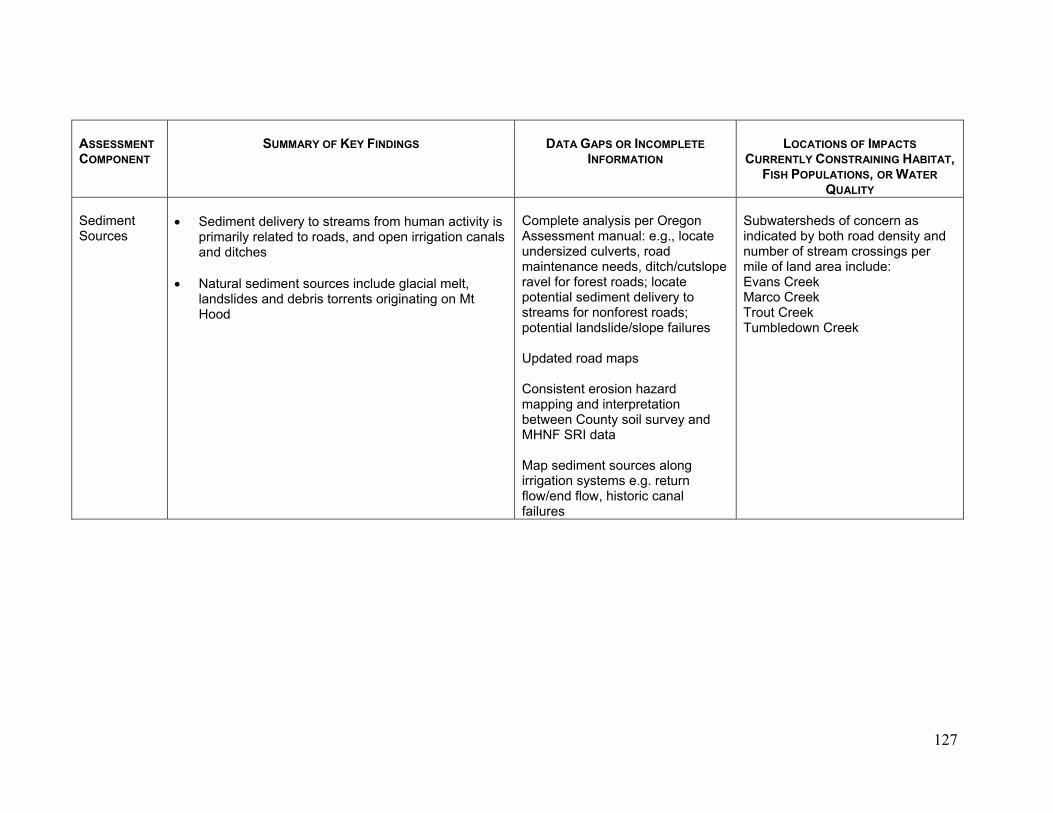
ASSESSMENT COMPONENT
SUMMARY OF KEY FINDINGS
DATA GAPS OR INCOMPLETE
INFORMATION
LOCATIONS OF IMPACTS
CURRENTLY CONSTRAINING HABITAT, FISH POPULATIONS, OR WATER
QUALITY Sediment
s ity is
•
ope st roads; locate
Map sediment sources along irrigation systems e.g. return flow/end flow, historic canal failures
s nsity and Source
• Sediment delivery to streams from human activ
primarily related to roads, and open irrigation canalsand ditches
Natural sediment sources include glacial melt, landslides and debris torrents originating on Mt Hood
Complete analysis per Oregon Assessment manual: e.g., locate undersized culverts, road maintenance needs, ditch/cutslavel for forer
potential sediment delivery to streams for nonforest roads; potential landslide/slope failures Updated road maps Consistent erosion hazard mapping and interpretation between County soil survey and MHNF SRI data
Subwatersheds of concern aindicated by both road denumber of stream crossings per mile of land area include: Evans Creek Marco Creek Trout Creek Tumbledown Creek
127
R List Ba 97. Memorandum to Water mmission – Proposed extension of the Ho sin irrigation season. Age November 21, 1997. Oregon Water Re partment. Salem, OR. B . Fransen, J. Walter, J. Cedarh Scarlett. 1997. Spawning salmon and the maintenance of healthy stream ecosystem y fish do we need? Oregon Sea Grant Restoration. Fall 1997. Corvallis OR. Bjornn, T.C. and D.W. Reiser. 1991. Habitat requirements of salmonids in streams. In W.R. M n, ed. Infl o rest and rangelan gem on salmonid fishes and their habitat. Bowling, L.C. L aier. 199 on of the effects of forest roads on stream flo ard an r ashingto 20 , Water Resources Series Tech. Rep. 155. Univ Seattle. BPA. 1996. H es Projec En ental Impact Statement (D /EIS-024 9 nneville s Portland, Oregon. Buchanan, D.V., M .L. Hanson, and R. M 7 s of Oregon’s bull trout. Oregon Department of Fish and Wildlife. October 1997. Portland, Oregon. Burke, M. 199 me. U b, essa kdale, CGEDA. 1998. Gor conomic Develo ciation. Onlin net website. Christener, J. 1982. Changes in peak stre s f d the te National Forest. USDA Forest Service. W ette r e, O C li, H. 19 eek er Qua onit t . Pr r the Hood River Wa , ver, OR. CTWS. 1998. ning s 9 e es o rm Sp s Reserv n od Riv c , prin C . 1998. d ladder evaluation studies. 1997 Annual Progress Report to BPA, Portlan c 199 d sReservation. W DEQ. 1998. Oregon’s final 1998 Section 303(d) list of water quality lim erbodies. Oregon Depar nt of Environmental ality. tland, OR DEQ. 1999. Oreg d Oregon Department of Environmental Quality rtland, OR.
eference
Resources Conda Item D,
olm and W.s: How man
ileodso
ilby
y, Rurc
, R
D. 19iver baes De
., B
eeha
w in H
OE
uences
and D.P. d Ware c. of Wash
ood River1). July 1
f fo
ettenmeeks, Wington,
Fisheri96. Bo
d mana
7. Evaluatin. TFW
ent
-97-001
vironmtration,
. Statu
-SH
t Draft/FinalPower Admini
. Hooton. 199
9. Mariti
Columbia
99. Neal Crtershed Group
Spring chinookation of Orego
Hood River and, Oregon. Dearm Springs, O
tme
npu
ge E
WatHood Ri
spaw , Ho
Peltonemberregon.
y. Par
amflowillam
lity M
urveys, 1er Produ
8. Confe
Qu
OR.
pment Asso
rom manageNational Fo
oring Projec
97. Confedtion Program
erated Tribe
Por
e Inter
WillametR.
epared fo
f the Wags, OR.
Springs
ited wat
arest.
, 19
rate W
of
.
eas of Eugen
97-98
d Tribarm S
the Warm
occo
ring
TWS
on a ministrative rules (OAR) Chapter 340.. Po
128
DLCD. 1997. Oregon statewide planning program. Oregon Department of Land Conservation and D pment Feilder, C. 199 summary packet for Hood Basin Bull trout working group, unpub. data . US Forest Service, Mt Hood National Forest. Parkdale-Mt Hood, OR. FI ation a anagement plan. Version 8.0. March 17, 1995. Farmers Irr r River, OR. Foster, E. 1998. Presence of organophosphate pesticides in the Hood River and effects on steelhead: samp . Oregon Depart. of Environmental Quality, Portland, OR. Gree . L. od River County area, Oregon. USDA Soil Conservation Service. January 1981 Gr R. and F l Systematic s species in the vicinity of Mt. Hood: Prelimi epart ish life. Univ. of Montana. Div.. Bi . Dece Ho . 197 n . rvi , Pacific Northwest Region. M Natio HRC. 1984. H e U ackground Document. Hood River County P Krussow, J.P. 1 o River, OR . 148 pp. Krussow, J.P. 1 ditor. Aakki-daakki to Zoomorphic. An encyclopedia about Hood River country. Friends of the Hood River Library, Hood River, OR. MacDonald, L. W. S nd R.C. Wissmar. 1991. Monitoring guidelines to evaluate effects of forest vitie ream in the Pacific Northwest and Alaska. EPA 910/9-91-001. Marshall, D. B. 1992. Se vertebrates of Oregon. Oregon Department of Fish and Wildlife, June 1 ortl R. MFID. 1998. Fo ation District – system history and function. Unpub. Middle Fork Irrigation District. Parkdale, OR. Newberry, D. 1 Hyd report. Appendix C. In USDA Forest Service, Pacific No est Reg est f Hood River Watershed Analysis Report. Mt Hood National Forest. Parkdale-Mt Hood, OR. Newton, J. 199 . Kim Titus, USDA Forest Service Hood River Ranger District September 17, e rtment of Fish and Wildlife. The Dalles. OR
point So lut c. 1 Assessment Manual. October 20, 1997. Prepared for Governors Watershed Enhancement Board. Salem, OR. ODFW. 1995. Oregon Department of Fish and Wildlife Aquatic Inventories Project: Physical Habitat Survey Surveys, Hood River subbasin.
ev
19tio
n, G
elo
95. Wn Dist
.
9. 1998
ater conservict. Hood
ling and a
81. Soil s
D. iga
nd m
lan
f Ho
nal
urv
ys
ey
is p
o 19.
. W. Al endorf. 1995. nary report to Oregon Dmber 1995.
9. Soil Resource Invenal Forest.
ood River County Comlanning Department.
989. Pine Grove mem
eg,
ol. Sci
wes, St Hood
s of Onchorynchument of F
Forest Se
nsive Land
in the Hood River Valley. Hood
and Wild
ce USDA
se Plan B
tory
preh
ries
994. E
H. , A.ry acti
992. P
Middle
996. ion. W
6. Unpub1996. Or
e So
mart as on st
nsitiveand, O
rk Irrig
rologyFork o
letter togon Depa
, In
rthw
Non urc ions 997. Draft Oregon Watershed
s, Fish
129
ODFW and CTWS. 1990. Hood River Subbasin Salmon and Steelhead Production Plan. Oregon Department of Fish and Wildlife and th s of the Warm Springs Reservation.
eptember 1990. Columbia Basin syst
lsen, E. S., R.A. French and A. D. Ritchy. 1994. Hood River and Pelton ladder evaluation
lsen, E. S. and R.A. French. 1998. Hood River and Pelton ladder evaluation studies. Annual
h and Wildlife. 1991. Hood River production master lan. Final report of the CTWS and ODFW (Project 88-053, Contract DE-BI79-89BP00631) to
WPRB. 1985. Findings and conclusions, stipulated modifications to Hood Basin Program
oject No. 2659. Application for
an
d. .
A.J. r
y 1996.
Service.
e Confederated Tribeem planning. S
Ostudies. Annual Progress Report to BPA, Portland, Oregon. Oregon Department of Fish and Wildlife, Portland OR. Olsen, E .S. and R.A. French. 1996. Hood River and Pelton ladder evaluation studies. Annual Progress Report to BPA, Portland, Oregon. Oregon Department of Fish and Wildlife, Portland OR. OProgress Report to BPA, Portland, Oregon. Oregon Department of Fish and Wildlife, Portland OR. Oregon State Game Commission. 1963. The fish and wildlife resources of the Hood Basin, Oregon, and their water use requirements. December 1963. Portland, OR.
’ Toole, P. and Oregon Department of FisOpBonneville Power Administration, Portland, OR. Obefore the Water Policy Review Board of the State of Oregon February 26, 1985. Oregon Water
olicy Review Board. Salem, OR. P PacifiCorp. 1998. Powerdale Hydroelectric Project, FERC Prnew license for major project—existing dam. Vol. III, Exhibit E- environmental reports. Portland, OR. February 1998. PacifiCorp. 1999. Application for Certification Pursuant to Section 401 of the Federal CleWater Act. Portland, OR. Parrow, D. 1998. Streamflow restoration priorities -Hood Basin spreadsheet data, unpublisheOregon Water Resources Department. Salem, OR Pater, D.E., S.A. Bryce, T.D. Thorson, J. Kagan, C. Chappell, J. mernik, S.H. Azevedo, andWoods. 1998 . Ecoregions of Western Washington and Oregon. Map. USEPA and othecooperators. Corvallis OR. Pribyl, S., C Ridgley, and J. Newton. 1996. Bull trout population summary Hood River ubbasin. Third working draft. Januars
Ratkeiwich, R. 1996. Indian Creek stream survey. Unpublished notes. Hood River Watershed Group. Hood River, OR. Reinhold, J. W. et al. 1989. Oregon pesticide use estimates for 1987. OSU Extension Corvallis, OR.
130
Sceva, J.E. 1966. A reconnaissance of the groundwater respources of the Hood River valley andthe Cascade Locks a
rea, Hood River County, Oregon. State engineer ground water report No. 10.
pril 1966. Salem, OR.
Extension Service. ugust 1994. Hood River, OR.
Using the historical record as an aid to salmonid habitat nhancement. Paper presented at the Symposium on acquisition and utilization of aquatic habitat
erres, C. 1996. 1996 Tony Creek Stream Survey Mt. Hood National Forest Hood River Ranger
pruell, P. and F.W. Allendorf. 1997. Nuclear DNA analsys of Oregon bull trout. Final Report
ate Water Resources Board. April 1965. Salem, OR.
Forest Service. 29 pp.
ood-Parkdale, OR.
nd Middle Fork Hood River atershed Analysis. Mt. Hood-Parkdale, Oregon.
urvey Open File Report 90-118. Portland, OR.
999. Oregon watershed assessment of aquatic resources anual. Draft January 1999. Prepared for the Governors Watershed Enhancement Board.
atershed Professionals Network. 1999. Oregon Watershed Assessment Manual. June 1999.
n and wildlife habitat. Prepared for Hood River Watershed roup. US Forest Service, Hood River Ranger District. Unpublished draft.
, Division 504. ovember 13, 1996. Oregon Water Resources Department.
A Seavert, C. F. 1994. Hood River County statistical information. OSU A Sedell, J.R. and K.J. Luchessa. 1981. einventory information. October 23-28, 1991. Portland, OR. SDistrict. Sandy, OR. Sto ODFW. Rep. No. 97/5. Div. of Biol. Sci, Univ. of Montana. 28pp. SWRB. 1965. Hood Basin. St USDA. 1998. Stemming the invasive tide: Forest Service strategy for noxious and nonnative plant management”. USDA USEPA. 1986. Quality Criteria for Water. EPA 440/5-86-001. United States Environmental Protection Agency Washington, DC. USFS. 1996a. Mt Hood National Forest. West Fork of Hood River Watershed Analysis. Mt. H USFS. 1996b. Mt Hood National Forest. East Fork Hood River aW USGS. 1990. Statistical summaries of streamflow data in Oregon. Volume I. US Geological S Watershed Professionals Network. 1mSalem, Oregon. WPrepared for the Governor’s Watershed Enhancement Board. Salem, OR. Wells, J. 1999. Upland vegetatioG WRD. 1996. Hood Basin Program - Oregon Administrative Rules, Chapter 690N
131
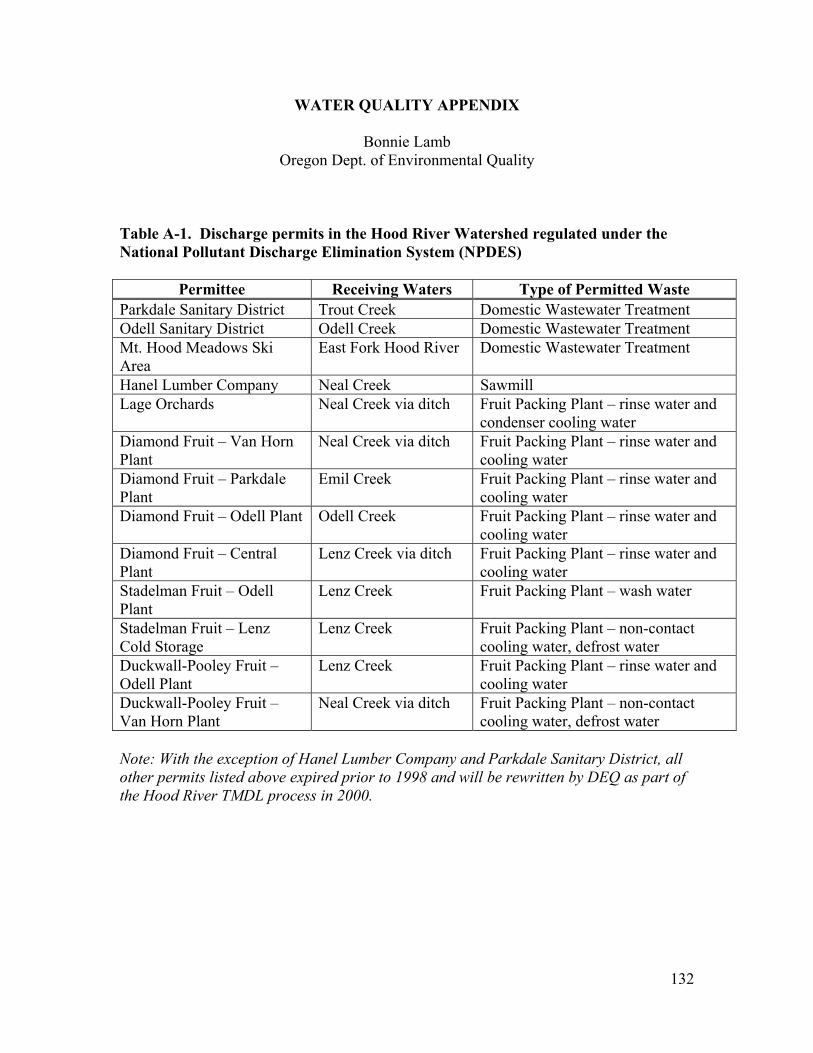
WATER QUALITY APPENDIX
nmental Quality
able A-1. Discharge permits in the Hood River Watershed regulated under the
Permittee Receiving Waters Type of Permitted Waste
Bonnie Lamb
Oregon Dept. of Enviro TNational Pollutant Discharge Elimination System (NPDES)
Parkdale Sanitary District Trout Creek Domestic Wastewater Treatment Odell Sanitary District Odell Creek Domestic Wastewater Treatment Mt. Hood Meadows Ski
reaEast Fork Hood River Domestic Wastewater Treatme
A nt
Hanel Lumber Company Neal Creek Sawmill Lage Orchards Neal Creek via ditch Fruit Packing Plant – rinse water and
condenser cooling water Diamond Fruit – Van Horn Plant
Neal Creek via ditch Fruit Packing Plant – rinse water acooling water
nd
Diamond Fruit – Parkdale Emil Creek Plant
Fruit Packing Plant – rinse water and cooling water
Diamond Fruit – Odell Plant Odell Creek Fruit Packing Plant – rinse water acooling water
nd
Diamond Fruit – Central Lenz Creek via ditch Fruit Packing Plant – rinse water and Plant cooling water Stadelman Fruit – Odell Plant
Lenz Creek Fruit Packing Plant – wash water
Stadelman Fruit – Lenz Lenz Creek Fruit Packing Plant – non-contact Cold Storage cooling water, defrost water Duckwall-Pooley Fruit – Lenz Creek Fruit Packing Plant – rinse water and Odell Plant cooling water Duckwall-Pooley Fruit – Neal Creek via ditch Fruit Packing Plant – non-contactVan Horn Plant
cooling water, defrost water
Note: With the exception of Hanel Lumber Company and Parkdale Sanitary Distriother permits listed above
ct, all expired prior to 1998 and will be rewritten by DEQ as part of
e Hood River TMDL process in 2000. th
132
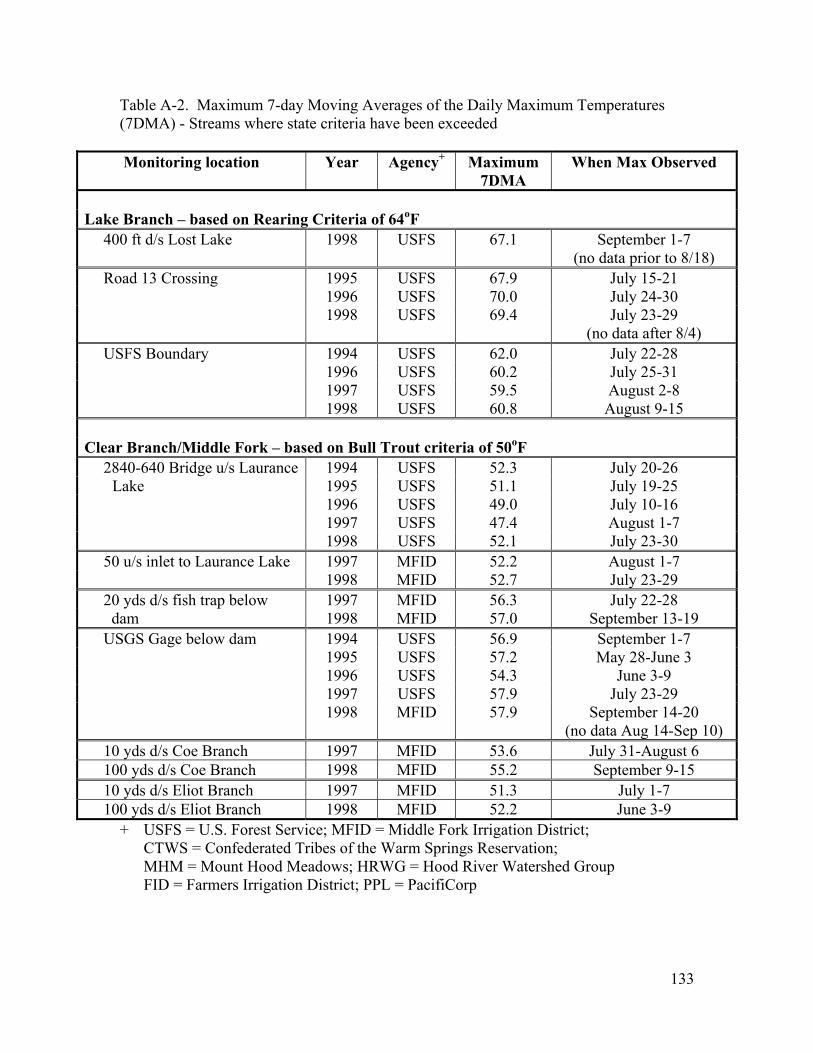
Table A-2. Maximum 7-day Moving Averages of the Daily Maximum Temperatures (7DMA) - Streams where state criteria have been exceeded Monitoring location Year Agency Maximum
7DMA When Max O+ bserved
Lake Branch – based on Rearing Criteria of 64oF
0 ft d/s Lost Lake 1998 USFS 67.1 September 1-7 40(no data prior to 8/18)
Road 13 Crossing 1995 USFS 67.9 July 15-21 1996 USFS 70.0 July 24-30
1998 USFS 69.4 July 23-29 ) (no data after 8/4
FS Boundary 1994 USFS 62.0 US July 22-28 1996 USFS 60.2 July 25-31 ugust 2-8 1997 USFS 59.5 A 1998 USFS 60.8 August 9-15
Clear iteria of 50oF Branch/Middle Fork – based on Bull Trout cr
28 40-640 Bridge u/s Laurance 1994 USFS 52.3 July 20-26ake 19 L 95 USFS 51.1 July 19-25
1996 USFS 49.0 July 10-16 7 1997 USFS 47.4 August 1- 1998 USFS 52.1 July 23-30
50 u/s inlet to Laurance Lake 1997 MFID 52.2 August 1-7 1998 MFID 52.7 July 23-29
yds d/s fish trap below 1997 MFID20 56.3 July 22-28 d 19 am 1998 MFID 57.0 September 13-
GS Gage below dam 1994 USUS FS 56.9 September 1-7 1995 USFS 57.2 May 28-June 3 1996 USFS 54.3 June 3-9
1997 USFS 57.9 July 23- 29 1998 MFID 57.9 September 14-20
(no data Aug 14-Sep 10) 10 6 yds d/s Coe Branch 1997 MFID 53.6 July 31-August
yds d/s Coe Branch 1998 MFID 55.2 10 September 9-15 010 yds d/s Eliot Branch 1997 MFID 51.3 July 1-7
0 yds d/s Eliot Branch 1998 MFID 52.2 10 June 3-9 + USFS = U.S. Forest Service; MFID = Middle Fork Irrigation District;
er Watershed Group FID = Farmers Irrigation District; PPL = PacifiCorp
CTWS = Confederated Tribes of the Warm Springs Reservation; MHM = Mount Hood Meadows; HRWG = Hood Riv
133
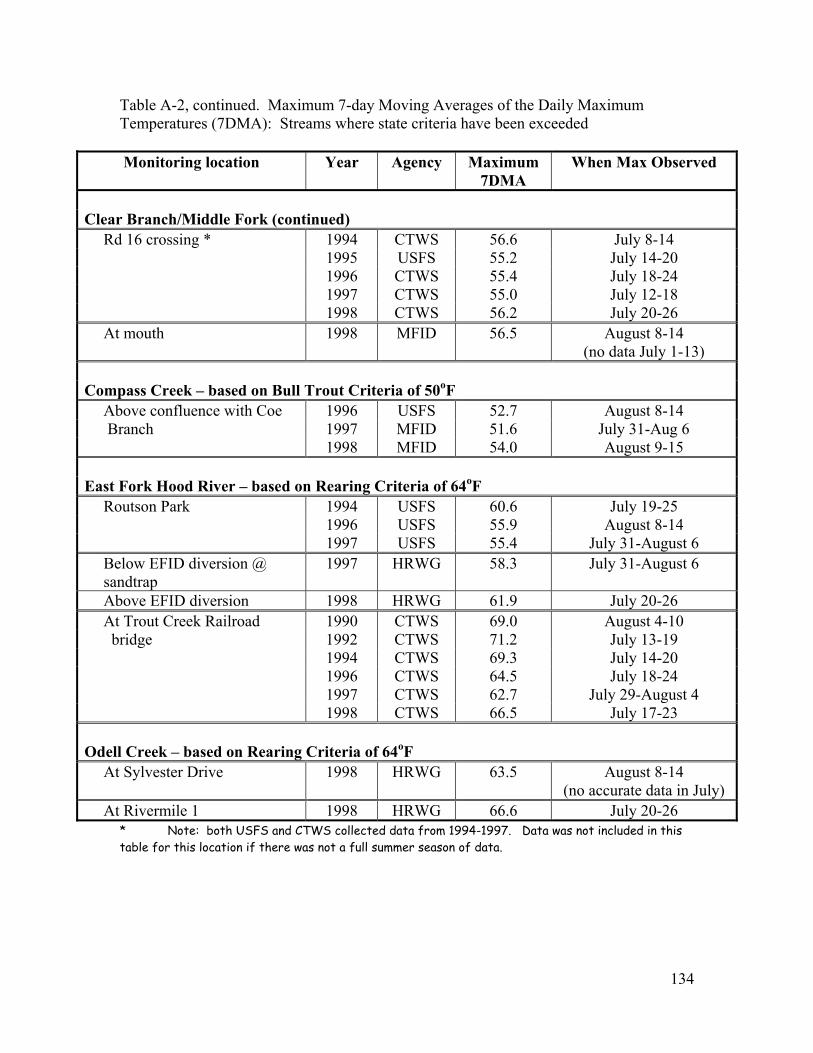
Table A-2, continued. Max Daily Maximum emperatures (7DMA): Streams where state criteria have been exceeded
Monitoring location
7DMA When Max Observed
imum 7-day Moving Averages of theT
Year Agency Maximum
Clear Branch/Middle Fork (continued)
Rd 16 crossing * 1994 CTWS 56.6 July 8-14 USFS 55.2 1995 July 14-20
1996 CTWS 55.4 July 18-24 1 55.0 997 CTWS July 12-18
1998 C 56.2 July 20-26 mouth 1998 M 56.5 August 8-14
(no data July 1-13
pass Creek – based on Bu rout Criteria1996 USFS 52.7 August 8-14
51.6 July 311998 MFID 54.0 August 9-15
Fork Hood River – based Rearing Crit utson Park 1994 U 60.6 July 19-25
1996 U 55.9 August 8-14 1997 USFS 55.4 July 31-August 6
low EFID diversion @ ndtrap
1997 HRWG 58.3 July 31-August 6
ove EFID diversion 1998 H 61.9 July 20-26 Trout Creek Railroad 1990 C 69.0 August 4-10 ridge 1992 C 71.2 July 13-19
1994 C 69.3 July 14-20 1996 C 64.5 July 18-24 1997 CTWS 62.7 July 29-August 4 1998 CTWS 66.5 July 17-23
TWS At FID
) Com ll T of 50oF
Above confluence with Coe Branch 1997 MFID -Aug 6
East on eria of 64oF
Ro SFS SFS BesaAb RWG At TWS b TWS TWS TWS
Odel ol Creek – based on Rearing Criteria of 64 F
Sylvester Drive 1998 HRWG 63.5 August 8-14 At(no accurate data in July)
At Rivermile 1 1998 HRWG 66.6 July 20-26 * Note: both USFS and CTWS collected data from 1994-1997. Data was not included in this table for this location if there was not a full summer season of data.
134
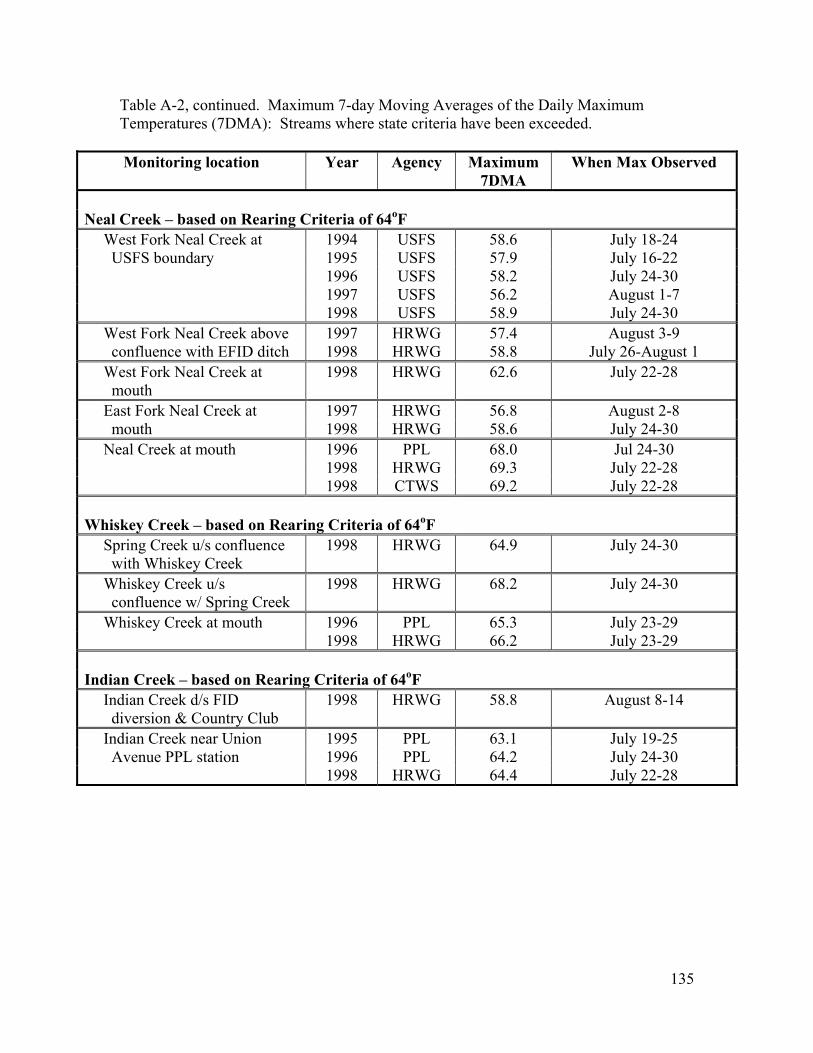
Table A-2, continued. Maximum 7-day Moving Averages of the Daily Maximum Temperatures (7DMA): Streams where state criteria have been exceeded. Monitoring location Year Agency Maximum
7DMA When Max Observed
Neal Creek – based on Rearing Criteria of 64oF
West Fork Neal Creek at 1994 USFS 58.6 July 18-24 July 16-22
1996 USFS 58.2 July 24-30 USFS 56.2 August 1-7 USFS 58.9 July 24-30
August 3-9 confluence with EFID ditch HRWG July 26-August 1 1998 58.8 West Fork Neal Creek at
mouth H
1998 RWG 62.6 July 22-28
East Fork Neal Creek at HRWG 1997 56.8 August 2-8
Neal Creek at mouth 1996 PPL 68.0 Jul 24-30 1998 HRWG 69.3 July 22-28 1998 CTWS 69.2 July 22-28
Whiskey Creek – based on Rearing Criteria of 64oF
with Whiskey Creek 1998 RWG 64.9 July 24-30
Whiskey Creek u/s ek
H confluence w/ Spring Cre
1998 RWG 68.2 July 24-30
Whiskey Creek at mouth 1996 PPL 65.3 July 23-29 1998 HRWG 66.2 July 23-29
Indian Creek – based on Rearing C of 6riteria 4oF
1998 RWG 58.8 ugust 8-14
July 19-25 Avenue PPL station 1996 PPL 64.2 July 24-30 1998 HRWG 64.4 July 22-28
USFS boundary 1995 USFS 57.9
1997 1998
West Fork Neal Creek above 1997 HRWG 57.4
mouth 1998 HRWG 58.6 July 24-30
Spring Creek u/s confluence H
Indian Creek d/s FID diversion & Country Club
H A
Indian Creek near Union 1995 PPL 63.1
135
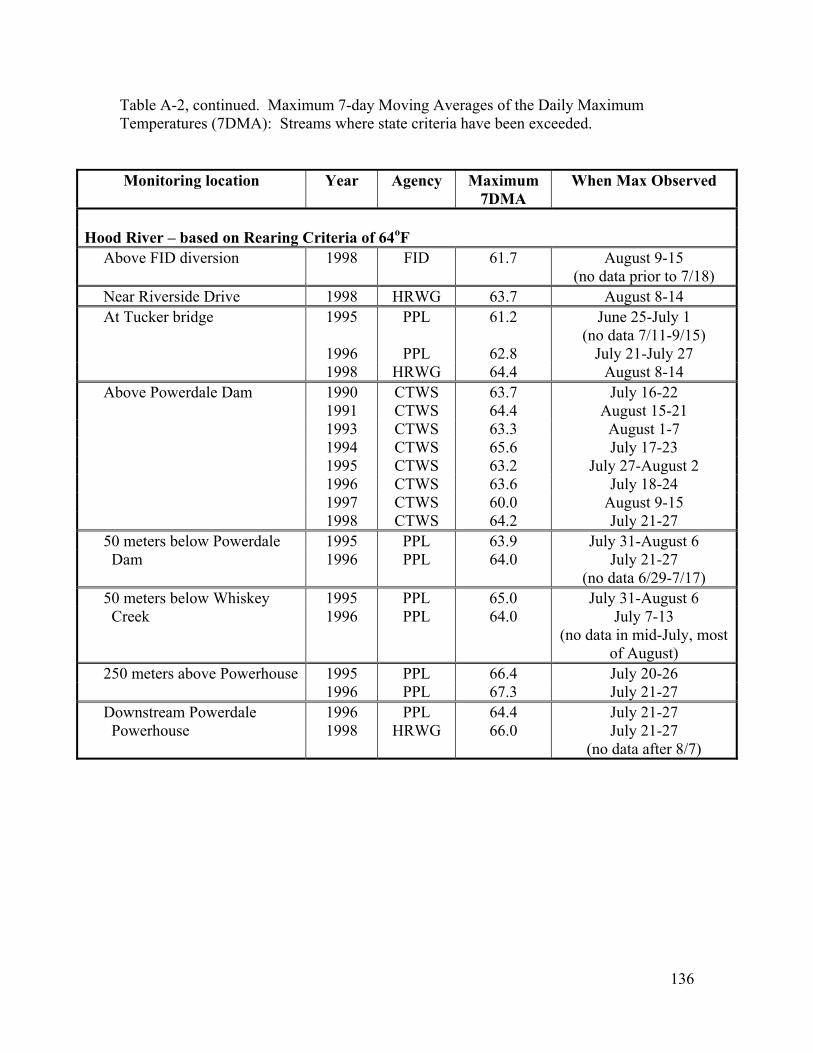
Table A-2, continued. Maximum 7-day Moving Averages of the Daily Maximum Temperatures (7DMA): Streams where state criteria have been exceeded. Monitoring location Year Agency Maximum
7DMA When Max Observed
oF
Above FID diversion August 9-15 (no data prior to 7/18)
1998 FID 61.7
Near Riverside Drive August 8-14 1998 HRWG 63.7 1995 PPL 61.2
July 21-July 27
Above Powerdale Dam 1990 CTWS 63.7 July 16-22 1991 CTWS 64.4 August 15-21 1993 CTWS 63.3 August 1-7 1994 CTWS 65.6 July 17-23
1996 CTWS 63.6 July 18-24 1997 CTWS 60.0 August 9-15 1998 CTWS 64.2 July 21-27 50 meters below Powerdale 1995 PPL 63.9 July 31-August 6 Dam 1996 PPL 64.0 July 21-27
(no data 6/29-7/17) 50 meters below Whiskey July 31-August 6 1995 PPL 65.0 Creek 1996 PPL 64.0 July 7-13
(no data , most in mid-Julyof August)
250 meters above Powerhouse 1995 PPL 66.4 July 20-26 1996 PPL 67.3 July 21-27 Downstream Powerdale 1996 PPL 64.4 July 21-27
Hood River – based on Rearing Criteria of 64
At Tucker bridge June 25-July 1 (no data 7/11-9/15)
1996 PPL 62.8 1998 HRWG 64.4 August 8-14
1995 CTWS 63.2 July 27-August 2
Powerhouse 1998 HRWG 66.0 July 21-27 (no data after 8/7)
136
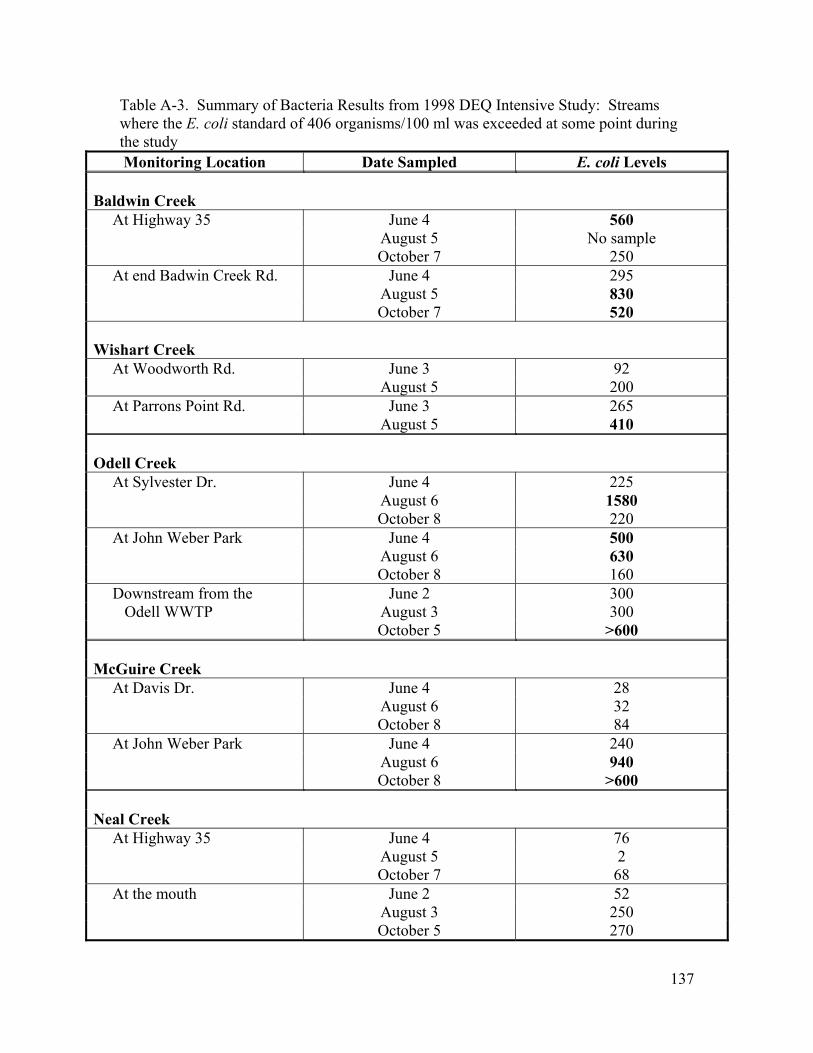
Table A-3. Summary of Bacteria Results from 1998 DEQ Intensive Study: Streamwhere the E. coli standard of 406 organisms/100 ml was exceeded at some p
s oint during
e study thMonitoring Location Date Sampled E. coli Levels
At Highway 35 Junegust 5 sample
7 250
5 830 520
ishart Creek At Woodworth Rd. June 3 92
At Parrons Point Rd. June 3 265 5 410
une 4 225
October 8 220 At John Weber Park June 4 500
8 160 Downstream from the June 2 300 Odell WWTP August 3 300
5 600
McGuire Creek At Davis Dr. June 4
6 32
At John Weber Park June 4 240 6 940
Baldwin Creek
4 560 Au No October
At end Badwin Creek Rd. June 4 295 August October 7 W
August 5 200
August Odell Creek
At Sylvester Dr. J August 6 1580
August 6 630 October
October >
28 August October 8 84
August October 8 >600 Neal Creek
At Highway 35 June 4 76 August 5 2 October 7 68
At the mouth June 2 52 August 3 250 October 5 270
137
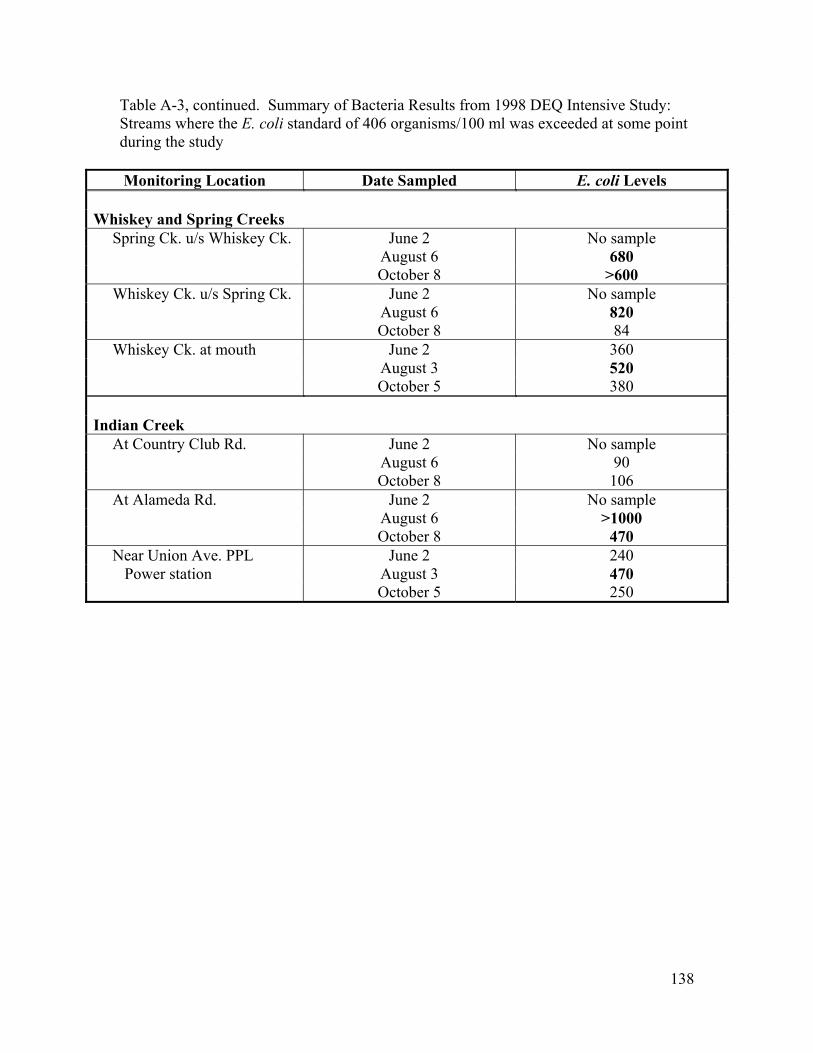
138
dy: t some point
uring the study
Monitoring Location
Table A-3, continued. Summary of Bacteria Results from 1998 DEQ Intensive StuStreams where the E. coli standard of 406 organisms/100 ml was exceeded ad
Date Sampled E. coli Levels Whiskey and Spring Creeks
Spring Ck. u/s Whiskey Ck. June 2 No sample August 6 680 October 8 >600
Whiskey Ck. u/s Spring Ck. NoJune 2 sample August 6 820 October 8 84
Whiskey Ck. at mouth June 2 360 August 3 520 October 5 380
Indian Creek
At Country Club Rd. J Noune 2 sample August 6 90 October 8 106
At Alameda Rd. J Noune 2 sample August >6 1000 October 8 470
Near Union Ave. PPL June 2 240 Power station August 3 470 Oct ober 5 250