HOMOGENEOUS GROUPS WITHIN A HETEROGENEOUS …cege/Diskussionspapiere/138.pdf · ·...
36
HOMOGENEOUS GROUPS WITHIN A HETEROGENEOUS COMMUNITY- EVIDENCE FROM AN INDEX MEASURING EUROPEAN ECONOMIC INTEGRATION Jörg König, Renate Ohr
Transcript of HOMOGENEOUS GROUPS WITHIN A HETEROGENEOUS …cege/Diskussionspapiere/138.pdf · ·...
���������������
������� ���������������
�
HOMOGENEOUS GROUPS WITHIN A
HETEROGENEOUS COMMUNITY-
EVIDENCE FROM AN INDEX
MEASURING EUROPEAN ECONOMIC
INTEGRATION
Jörg König, Renate Ohr
Homogeneous groups within a heterogeneous community -
Evidence from an index measuring European economic integration
Jörg König* and Renate Ohr*
Department of Economics, Georg-August-Universität Göttingen
August 2, 2012
Abstract
In the light of the current economic debt crisis within the Euro zone, the heterogeneity of EU
members has becoming increasingly apparent. This heterogeneity is evident not only in some
single macroeconomic variables but also in the level of economic integration with the other EU
members. Despite the common use of the term “European integration”, neither a uniform
definition nor a holistic economic approach to this concept exists. Thus, the different steps and
processes of European integration are hard to quantify, thereby making it almost impossible to
argue objectively whether an individual EU member state has fallen behind the general speed of
European integration or whether the distance to a potential core group is undesirably large. In
order to fill this gap, we have developed a composite indicator – the EU-Index – measuring the
extent of European economic integration of the EU member states. The EU-Index exhibits large
heterogeneities between the member states with respect to overall European economic
integration and with respect to various sub-indices. By using cluster analysis, however, we find
relatively homogeneous country groups within this heterogeneous community. The prevailing
economic heterogeneities combined with the strong and even growing clustering of EU members
may create fundamental difficulties for further integration of the European Union, and may even
put existing integration steps (such as the creation of the European Monetary Union) into
question. The EU-Index thus offers a unique statistically solid base for political discussions and
empirical investigations, since now the degree of European economic integration is numerically
tangible and can be determined individually for each country.
Keywords: European Union, economic integration, multivariate analysis.
JEL classifications: C 43, F 15, F 55.
* [email protected], [email protected], www.eu-index.de
2
1 Introduction
The European Union (EU) is a unique community of 27 sovereign countries, which are
politically connected and economically tied through the various steps of European
integration. To foster economic ties between its member states is one of the main
objectives of the EU’s integration policy “in creating an ever closer union” (Preamble
TEU). Moreover, the European Union seeks to promote economic, social and territorial
cohesion by “reducing disparities between the levels of development of the various
regions” (Art. 174 TFEU).
Despite this integration policy, the EU member states still demonstrate large
heterogeneities with respect to their economic performance. Although they are committed
to the same acquis communautaire, economic research has found heterogeneous outcomes
for the investigated member states by analyzing trade integration (e.g. Badinger 2005,
Baldwin 2006), monetary integration (e.g. de Grauwe 2006, Mongelli and Vega 2006),
capital market integration (e.g. Baele et al. 2004), labor market integration (e.g. Nowotny
et al. 2009) or institutional integration (e.g. Mongelli et al. 2007). While economic
research is thus able to compare the economic performance of the EU members within
one specific field, it is not able to give an overall comparison of the members’
heterogeneity across the various fields of European economic integration.
In order to fill this gap, we have developed a composite indicator measuring the
extent of European economic integration in the EU member states. This “EU-Index” will
be able to determine the degree of European integration on an annual basis since the
formation of the European Monetary Union (EMU) in 1999. It can be used to evaluate a
country’s level of integration for a certain year and to analyze whether a member state
has fallen behind the general speed of integration for a given period. The index is
designed to offer a solid analytical foundation for economic developments and political
decisions in the European Union, which are usually justified by referring, quite
unspecified, to “the need of deeper European integration". Since there is no common
definition of the concept of European integration, the EU-Index will be composed of
various mostly economic indicators, capturing the variety of forms of integration in
different markets and with respect to different economic outcomes. In order to develop
this complex index, we use the following procedure:
3
1) analyzing the structure of European integration,
2) identifying adequate integration indicators according to their economic
legitimacy and relevance,
3) normalizing the data and using appropriate statistical methods to assign
proper weights to the individual indicators.
Eventually we will present the EU-Index, in which the EU member states can be
ranked according to their current level of European integration. This ranking order gives
a first impression of the extent of heterogeneity between the member states. In order to
investigate more closely whether heterogeneity differences have led to the formation of
country groups pursuing their own speed of integration, a cluster analysis is performed at
the end of this paper. The thereby identified country groups are exactly those groups that
are counterparts in the current Euro zone debt crisis.
2 Structure and characteristics of European integration
The structure of European economic integration is characterized by two different forms of
integration policy: market integration and institutional integration. Market integration
aims at the removal of tariffs, quotas and non-tariff barriers to trade as a first step.
Liberalizing and opening up the markets of all goods, services, and their production
factors leads to the formation of a common market (Balassa 1961). Institutional
integration focuses on allocating political competences to the supra-national level, e.g. in
order to reduce transnational market inefficiencies. The highest stage of institutional
integration is the formation of a political union, to which all important national
sovereignties are transferred.
The indicators to be analyzed in the EU-Index can be derived from both market
and institutional integration. Following Balassa’s “stages of economic integration”, the
highest stage of market integration can be represented by the European Single Market.
The European Single Market – with its four fundamental freedoms – ensures the free
movement of goods and services within the European Union (intra-European trade),
which in turn should result in positive welfare effects, according to traditional trade
theories. It also attempts to ensure efficient intra-European movements of capital and
labor, thereby improving factor allocation within the EU. Since the European Union as a
customs union imposes a common external tariff, this discrimination against third
4
countries (and the possibility of retaliatory tariffs) further enhances the amount of intra-
European trade, both through trade diversion and trade creation (Viner 1950).
Increasing intra-European trade and optimizing intra-European factor movements
is expected to eventually equalize the prices of goods and services (“law of one price”) and
the factor prices (Lerner-Samuelson theory) in the integration area. Per capita income is
supposed to converge through the equalization of factor prices as well, meaning that the
per capita income levels of less developed countries will tend to catch up with the per
capita income levels of advanced economies.
The convergence of European economies, implying greater homogeneity among
them, can also be supported by institutional integration, for instance, through a common
regulary framework, reducing transactions costs and friction losses and therewith
enhancing intra EU-trade, capital flows and labor migration. Convergence of per capita
income is also supported by the cohesion policy of the European Union, where European
regions and countries whose per capita GDP is far below the EU average receive financial
assistance for structural projects.
After all, the idea of endogeneity of the optimum currency area (Frankel and Rose
1998) proposes that the intensity of transnational capital and goods mobility will increase
in a monetary union (mainly through reduced transaction costs, the loss of currency risks
and enhanced price transparency). Especially the former weak-currency countries are then
more likely to attract foreign capital through the decreased long-term interest rates as the
currency risk runs off. If this capital is invested in an efficient and productive manner and
not solely spent for consumptive purposes, the European economies are expected to
converge.
However, Myrdal (1957) and Hirschman (1958) argue that deeper market
integration may also have diverging effects on the regions’ per capita income. According
to new growth theory, increasing economies of scale, spillover effects, and endogenous
technological progress will favor especially advanced economies at the expense of less
advanced economies (Lucas 1990). Additionally, new trade theory (and new economic
geography) holds that spatial concentration of economic activities will lead to
agglomeration effects and further increases these diverging effects (Krugman 1979, 1991).
Moreover, following the Prebisch-Singer thesis, an inter-industry trade
specialization as defined by traditional trade theory may have a diverging effect on the
countries’ terms of trade as world income is expected to increase. This effect in turn
5
implies diverging tendencies with respect to factor prices, prices of tradables, income per
capita, and other main economic indicators in the integration area.
European integration, however, is characterized by growing intra-industry trade
rather than inter-industry trade. Similar demand structures across advanced economies
imply the production and trade of similar types of goods and services. By exporting and
importing similar products, the income elasticity of the trading partners’ export demand
will be similar too. Thus, intra-industry trade is less likely to cause divergence effects
(Dluhosch 2001, Giannetti 2002).
Assuming the above-mentioned intra-industry trade structure with similar demand
patterns and the dependence on similar intermediate goods used in the manufacturing
process, prevailing transnational co-movements of business cycles are usually expected.
Market integration through increased intra-European trade, as well as institutional
integration through a common refinancing basis interest rate within the European
monetary union, should lower the risk of asymmetric shocks, implying an enhanced
symmetry of business cycles between the member states (Furceri and Karrass 2008).
However, a common monetary policy does not necessarily imply symmetry of the
members’ business cycles (Dorrucci et al. 2004). Since national inflation rates still differ
between the member states, their real interest rates and real exchange rates are diverging.
Different real interest rates imply different investment opportunities; diverging real
exchange rates indicate differences in international competitiveness. Both will exert
diverging impacts on macroeconomic performance.
Hence, both market integration and institutional integration can be captured by
direct and indirect indicators. Cross-border market interrelations and contractual
agreements at the EU-level can be treated as direct measurements of economic
integration. Indicators measuring economic convergence (resp. homogeneity) and the
symmetry of business cycles reflect indirect effects of economic integration.
With respect to these considerations we have chosen 25 indicators that need to be
accounted for in the EU-Index and grouped them into four dimensions of European
economic integration:
1) EU Single market (for goods, services, capital and labor)
2) EU homogeneity (level of convergence)
3) EU symmetry (of business cycles)
4) EU conformity (to EU law and institutional participation)
6
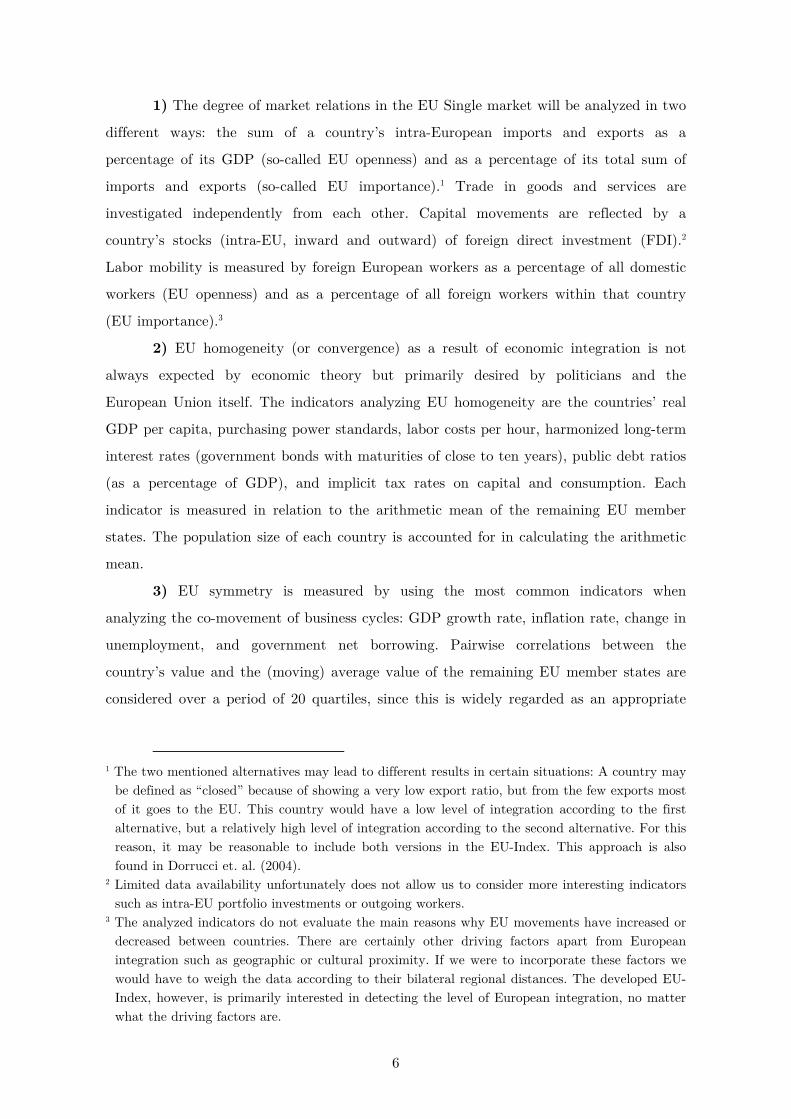
1) The degree of market relations in the EU Single market will be analyzed in two
different ways: the sum of a country’s intra-European imports and exports as a
percentage of its GDP (so-called EU openness) and as a percentage of its total sum of
imports and exports (so-called EU importance).1 Trade in goods and services are
investigated independently from each other. Capital movements are reflected by a
country’s stocks (intra-EU, inward and outward) of foreign direct investment (FDI).2
Labor mobility is measured by foreign European workers as a percentage of all domestic
workers (EU openness) and as a percentage of all foreign workers within that country
(EU importance).3
2) EU homogeneity (or convergence) as a result of economic integration is not
always expected by economic theory but primarily desired by politicians and the
European Union itself. The indicators analyzing EU homogeneity are the countries’ real
GDP per capita, purchasing power standards, labor costs per hour, harmonized long-term
interest rates (government bonds with maturities of close to ten years), public debt ratios
(as a percentage of GDP), and implicit tax rates on capital and consumption. Each
indicator is measured in relation to the arithmetic mean of the remaining EU member
states. The population size of each country is accounted for in calculating the arithmetic
mean.
3) EU symmetry is measured by using the most common indicators when
analyzing the co-movement of business cycles: GDP growth rate, inflation rate, change in
unemployment, and government net borrowing. Pairwise correlations between the
country’s value and the (moving) average value of the remaining EU member states are
considered over a period of 20 quartiles, since this is widely regarded as an appropriate
1 The two mentioned alternatives may lead to different results in certain situations: A country may
be defined as “closed” because of showing a very low export ratio, but from the few exports most of it goes to the EU. This country would have a low level of integration according to the first alternative, but a relatively high level of integration according to the second alternative. For this reason, it may be reasonable to include both versions in the EU-Index. This approach is also found in Dorrucci et. al. (2004).
2 Limited data availability unfortunately does not allow us to consider more interesting indicators such as intra-EU portfolio investments or outgoing workers.
3 The analyzed indicators do not evaluate the main reasons why EU movements have increased or decreased between countries. There are certainly other driving factors apart from European integration such as geographic or cultural proximity. If we were to incorporate these factors we would have to weigh the data according to their bilateral regional distances. The developed EU-Index, however, is primarily interested in detecting the level of European integration, no matter what the driving factors are.

7
length for detecting business cycles.4 The average value of the remaining EU members is
again weighted by the respective population size. Data in the time series is seasonally and
trend adjusted (using Hodrick-Prescott filter with そ=1600).
4) EU conformity is captured through the member states’ participation in
economically relevant steps of European institutional integration and through their
compliance with economically relevant EU law. Since most institutional steps were
ratified uniformly across the EU member states, the major remaining disagreement relates
to participation in the Schengen area and to membership of the European Monetary
Union. Participation in the European Exchange Rate Mechanism (ERM II) is treated as
“half-integration” towards EMU. Moreover, de jure agreement on the regulatory
framework provided by the EU does not necessarily mean de facto compliance. In these
cases, the European Commission (EC) is able to start infringement proceedings against
countries violating EU law. The proceedings begin with the pre-litigation phase, where
countries are urged through a so-called “reminder” to correct their violating behavior.
The amount of new reminders per year is incorporated into our index. If member states
do not act on the reminder and the following proceedings, the European Court of Justice
(ECJ) finally decides on the case by verdict. All verdicts enter the ECJ’s statistical
database “InfoCuria”. For the EU-Index, the convictions were gathered and assigned
according to the following groups: “single market”, “environment and consumer
protection”, and “other sectors”.5
The EU-Index covers those member states that entered the European Union no
later than 1995 (so-called EU-15), due to data restrictions. Indicators referring to “intra-
EU” thus consider transnational movements between the EU-15. Since Luxembourg
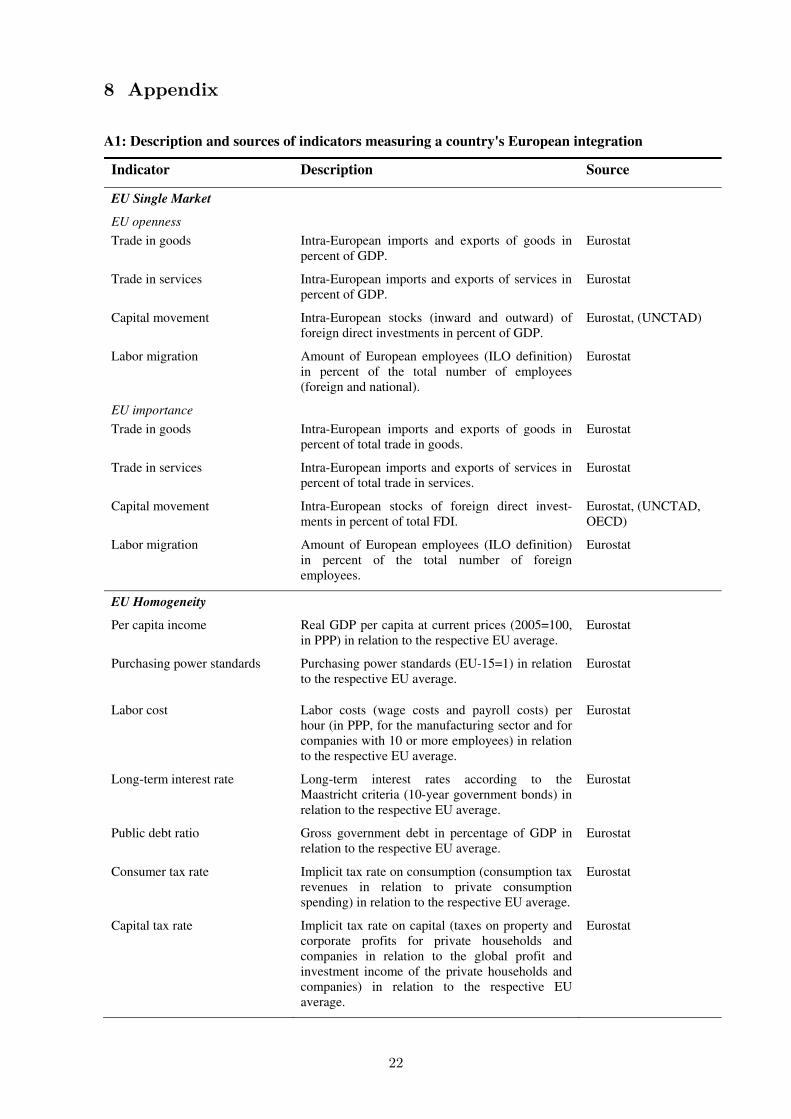
contains many extreme values, it is not considered in the index.6 Table A1 in the
appendix gives a short description of the indicators and their source used for the EU-
Index.
4 See Buch et al. (2005). Kitchin (1923) found evidence for a short business cycle of about 3 to 4
years, whereas investment cycles detected by Juglar (1862) cover at least 6 to 7 years. 5 See Busch (2009) for the assignment of groups. 6 An alternative approach for treating outliers is the application of percentiles in the normalization
process, as done, for instance, by Dreher et al. (2008). However, then the index values will be distributed too smoothly within the designed scale, which leads to another distortion of the original data structure.
8
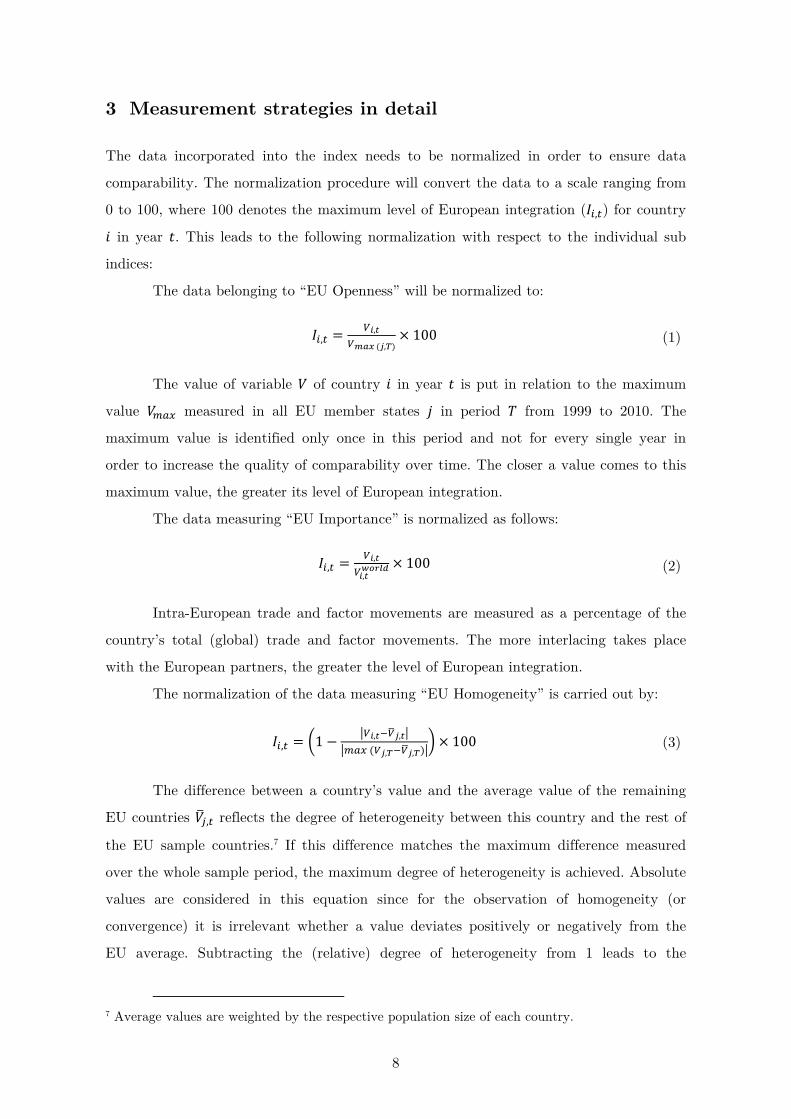
3 Measurement strategies in detail
The data incorporated into the index needs to be normalized in order to ensure data
comparability. The normalization procedure will convert the data to a scale ranging from
0 to 100, where 100 denotes the maximum level of European integration (荊沈┸痛) for country 件 in year 建. This leads to the following normalization with respect to the individual sub
indices:
The data belonging to “EU Openness” will be normalized to:
荊沈┸痛 噺 蝶日┸禰蝶尿尼猫 岫乳┸畷岻 抜 などど (1)
The value of variable 撃 of country 件 in year 建 is put in relation to the maximum
value 撃陳銚掴 measured in all EU member states 倹 in period 劇 from 1999 to 2010. The
maximum value is identified only once in this period and not for every single year in
order to increase the quality of comparability over time. The closer a value comes to this
maximum value, the greater its level of European integration.
The data measuring “EU Importance” is normalized as follows:
荊沈┸痛 噺 蝶日┸禰蝶日┸禰葱任認如匂 抜 などど (2)
Intra-European trade and factor movements are measured as a percentage of the
country’s total (global) trade and factor movements. The more interlacing takes place
with the European partners, the greater the level of European integration.
The normalization of the data measuring “EU Homogeneity” is carried out by:
荊沈┸痛 噺 磐な 伐 弁蝶日┸禰貸蝶拍乳┸禰弁弁陳銚掴 岫蝶乳┸畷貸蝶拍乳┸畷岻弁卑 抜 などど (3)
The difference between a country’s value and the average value of the remaining
EU countries 撃博珍┸痛 reflects the degree of heterogeneity between this country and the rest of
the EU sample countries.7 If this difference matches the maximum difference measured
over the whole sample period, the maximum degree of heterogeneity is achieved. Absolute
values are considered in this equation since for the observation of homogeneity (or
convergence) it is irrelevant whether a value deviates positively or negatively from the
EU average. Subtracting the (relative) degree of heterogeneity from 1 leads to the
7 Average values are weighted by the respective population size of each country.
9
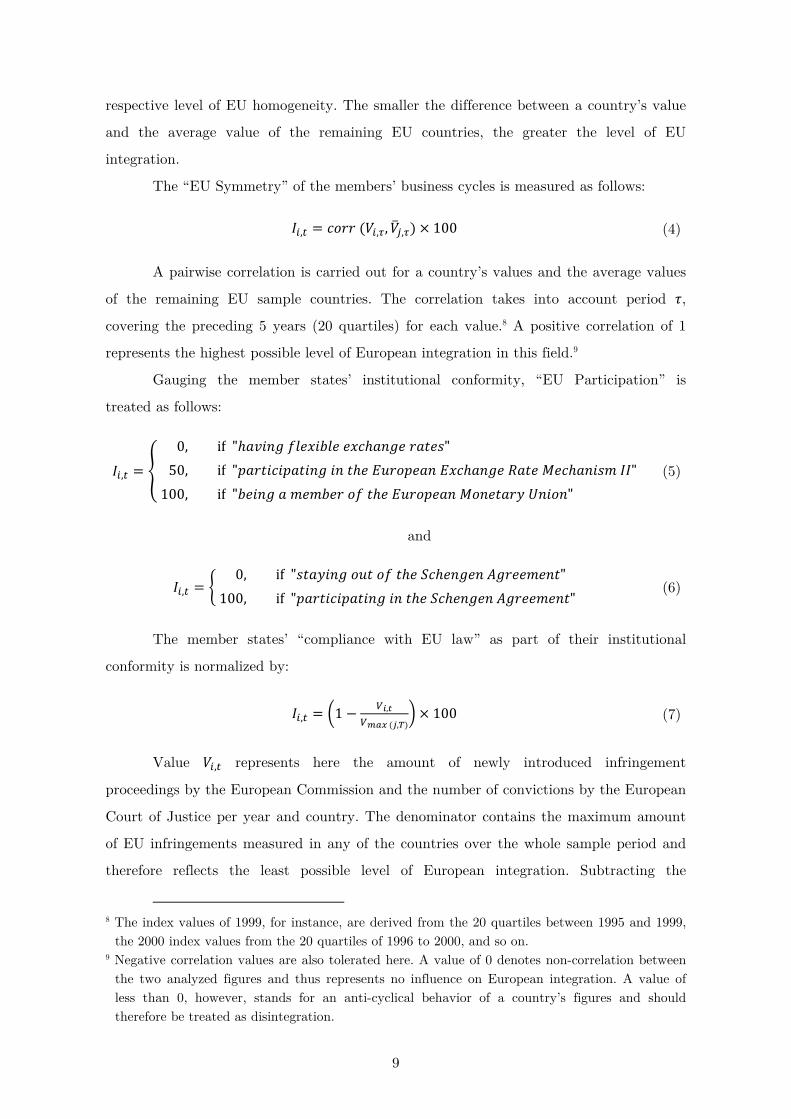
respective level of EU homogeneity. The smaller the difference between a country’s value
and the average value of the remaining EU countries, the greater the level of EU
integration.
The “EU Symmetry” of the members’ business cycles is measured as follows:
荊沈┸痛 噺 潔剣堅堅 岫撃沈┸邸┸ 撃博珍┸邸岻 抜 などど (4)
A pairwise correlation is carried out for a country’s values and the average values
of the remaining EU sample countries. The correlation takes into account period 酵,
covering the preceding 5 years (20 quartiles) for each value.8 A positive correlation of 1
represents the highest possible level of European integration in this field.9
Gauging the member states’ institutional conformity, “EU Participation” is
treated as follows:
荊沈┸痛 噺 畔 ど┸ if g月欠懸件券訣 血健結捲件決健結 結捲潔月欠券訣結 堅欠建結嫌gのど┸ if g喧欠堅建件潔件喧欠建件券訣 件券 建月結 継憲堅剣喧結欠券 継捲潔月欠券訣結 迎欠建結 警結潔月欠券件嫌兼 荊荊g などど┸ if g決結件券訣 欠 兼結兼決結堅 剣血 建月結 継憲堅剣喧結欠券 警剣券結建欠堅検 戟券件剣券g (5)
and
荊沈┸痛 噺 崕 ど┸ if g嫌建欠検件券訣 剣憲建 剣血 建月結 鯨潔月結券訣結券 畦訣堅結結兼結券建g などど┸ if g喧欠堅建件潔件喧欠建件券訣 件券 建月結 鯨潔月結券訣結券 畦訣堅結結兼結券建g (6)
The member states’ “compliance with EU law” as part of their institutional
conformity is normalized by:
荊沈┸痛 噺 磐な 伐 蝶日┸禰蝶尿尼猫 岫乳┸畷岻卑 抜 などど (7)
Value 撃沈┸痛 represents here the amount of newly introduced infringement
proceedings by the European Commission and the number of convictions by the European
Court of Justice per year and country. The denominator contains the maximum amount
of EU infringements measured in any of the countries over the whole sample period and
therefore reflects the least possible level of European integration. Subtracting the
8 The index values of 1999, for instance, are derived from the 20 quartiles between 1995 and 1999,
the 2000 index values from the 20 quartiles of 1996 to 2000, and so on. 9 Negative correlation values are also tolerated here. A value of 0 denotes non-correlation between
the two analyzed figures and thus represents no influence on European integration. A value of less than 0, however, stands for an anti-cyclical behavior of a country’s figures and should therefore be treated as disintegration.
10
(relative) number of EU infringements from 1 leads to the respective level of EU
compliance. Committing no infringements would thus yield the highest possible level of
EU integration in this field.
Before the 25 normalized indicators are entered into the EU-index, they will be
weighted according to their statistical relevance with respect to European integration.
The selection of an appropriate weighting and aggregation procedure is crucial to the
development process of an index, since it has a direct effect on the outcome of the overall
index-values and country rankings. The weights are to be derived from statistical models
that respect both the underlying theoretical framework and the data properties. The
weights then reflect their relative importance to European integration and the dimensions
of the overall composite (OECD and JRC 2008).
Multivariate analysis using principal components is an appropriate weighting and
aggregation technique that has gained increasing popularity with academics in recent
years. In academic literature, principal component analysis (PCA) is used in different
ways in order to develop a composite indicator. Some studies such as Lockwood (2001),
Gwartney and Lawson (2001) and Dreher (2006) use PCA to derive the weights from the
first component, irrespective of the overall suitability of the data set performing PCA and
independent from the size of the eigenvalues and factor loadings of the remaining
components. Our study, in contrast, uses PCA in a way similar to Noorbakhsh (1998)
and Nicoletti et al. (2000), where the information received from the data before and after
performing PCA is gathered and employed as much as possible. Building on this
approach, the correlation structure of the data set will be considered in order to assess
the suitability of the indicators that will perform a PCA. The computed components will
then be analyzed to derive the optimum size of components to be retained. Rotation of
the factor loadings will reassess the intended structure of the index and will finally assign
adequate weights to the individual indicators. Our final weighting procedure differs from
that of Noorbakhsh (1998) and Nicoletti et al. (2000) as we use oblique rotation instead
of orthogonal rotation, thereby allowing for correlations between the factors, which takes
into account the nature of the index variables in a more realistic manner.10
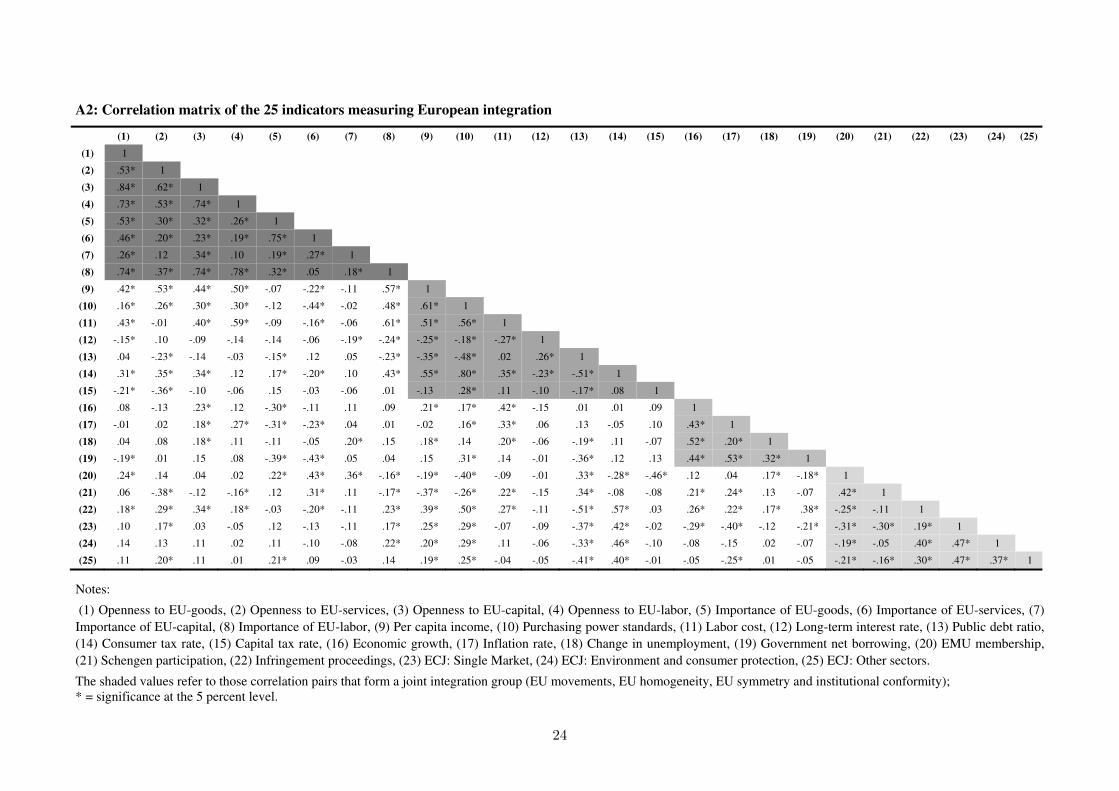
The matrix shown in Table A2 mostly reveals statistically significant correlations
between the individual indicators. Especially within the designed groups of indicators, the
correlation values are high and statistically significant. This gives a first statistical
10 Simple PCA is used rather than polychoric PCA since only eight percent of the data is discrete
in nature.
11
reassurance that the underlying theoretical framework is well chosen and the indicators
belong to the correct group.11 The coefficient alpha, developed by Cronbach (1951) to
estimate the reliability of measurement instruments by analyzing the internal consistency
for composite scores, of 0.82 underpins the quality of the data. Bartlett’s test of sphericity
(chi2: 3525.038, p-value: 0.000) and Kaiser-Meyer-Olkin’s measure of sampling adequacy
(KMO: 0.62) also support the overall suitability of the data set.
It should be noted that the indicators measuring EU homogeneity enter PCA in
terms of 撃沈┸痛【撃博珍┸痛, as their previously presented normalization method for measuring the
index-values heavily changes their original characteristics by restricting the maximum
value attainable to the average value of the remaining member states. Only for
performing PCA, a country’s value is therefore relativized by the average value of the
remaining member states, which in turn allows the quotient to be greater than 1.12
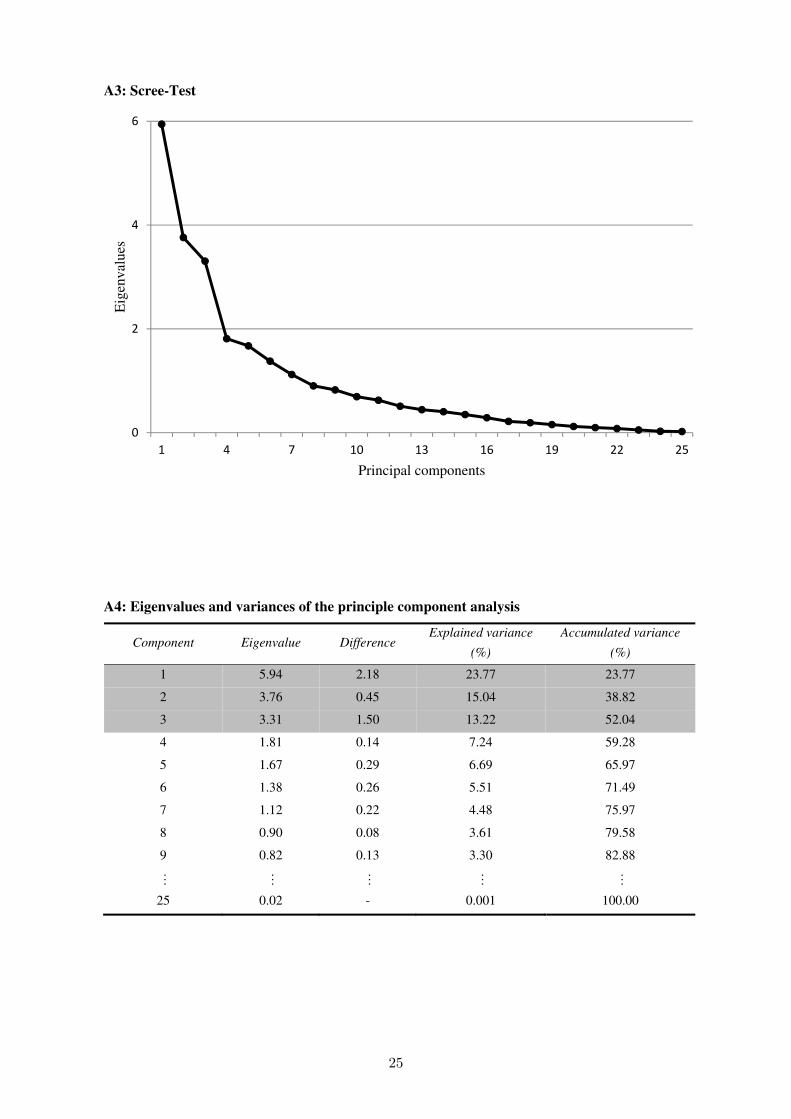
The performed PCA suggests an extraction of three components. The scree test,
first proposed by Cattell (1966), illustrates in Figure A3 a smooth decrease of eigenvalues
after the fourth component, meaning that the eigenvalues could have the status of
random correlations and should therefore be neglected. Besides, considering only those
components that explain more than ten percentage points of total variance would also
suggest an extraction of three components, as Table A4 demonstrates.13
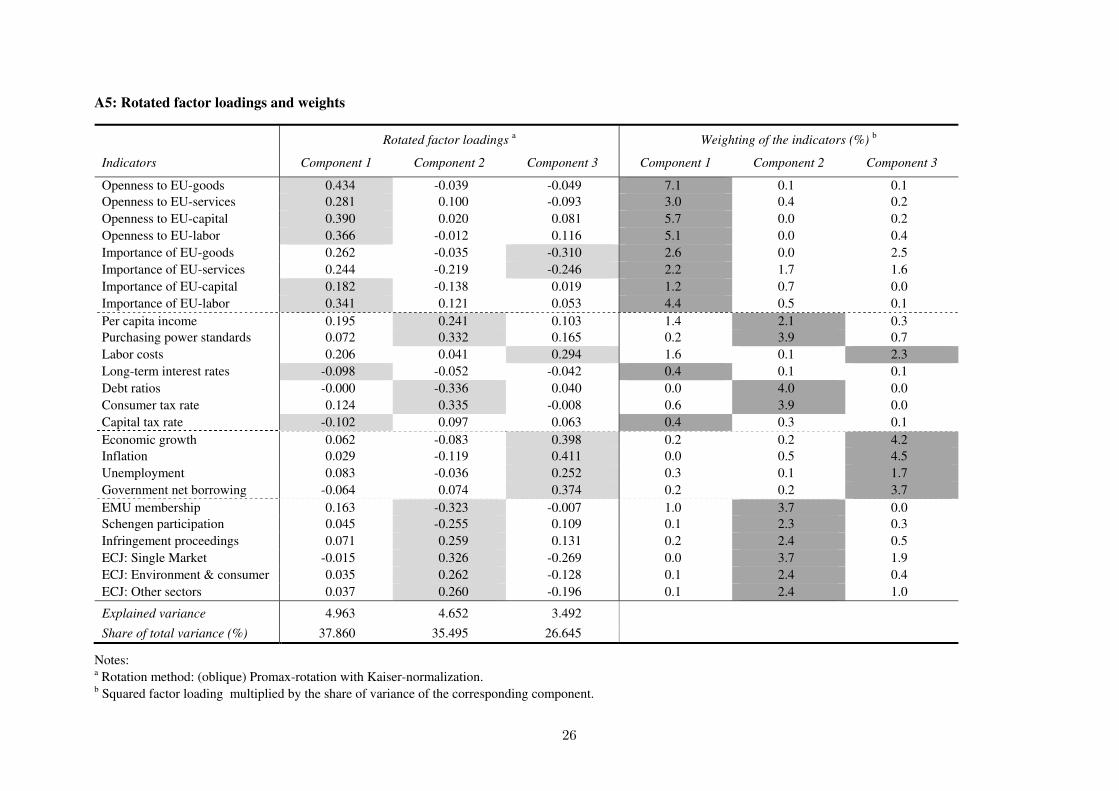
Following Noorbakhsh (1998) and Nicoletti et al. (2000), the three extracted
components will be rotated in order to reveal a simple structure in the pattern of factor
loadings. In Table A5 the rotated factors with the highest loadings are highlighted.
Considering the squared factor loadings multiplied by the share of variance explained by
the corresponding component underlines again the well suited structure of the indicators.
Indicators representing EU single market, EU symmetry and institutional conformity hold
their highest value in the same respective component. Only the indicators reflecting EU
homogeneity cannot simply be put into one component, but this is due to the limitation
of three components.
11 On the one hand, statistically significant correlations are a necessary precondition for performing
a PCA. On the other hand, correlation values between two variables must not be too high (collinear) in order to avoid the inclusion of double counting into the index, which is not the case here.
12 Comparability between the indicators is still assured since PCA uses standardized z-scores for all indicators, where the expected value is zero and the standard deviation and variance is one.
13 Parallel analysis and the Kaiser-Guttman criterion reveal unpractical and statistically non-efficient results of six and seven components.
12
The horizontal sum of the squared factor loadings multiplied by the share of
variance explained by the corresponding component eventually assigns the weight to each
indicator. In contrast to Noorbakhsh (1998) and Nicoletti et al. (2000), where only the
highest factor loadings are used to calculate the individual weights, we incorporate the
sum of all three factor loadings into our calculation. By disregarding the remaining factor
loadings for each indicator, one has to accept a certain loss of information with regard to
the total variance explained. Since both studies use orthogonal rotation each component
explains one independent (uncorrelated) dimension of the total variance. Combining
factor loadings would therefore harm this independent structure.
The analysis of European integration, however, does not exhibit dimensions that
are considered to be independent from each other. The dimensions derived in this study
(EU single market, EU homogeneity, EU symmetry and institutional conformity) do have
an effect on each other’s performance. They also have a mutual underlying motivation in
disclosing the nature of European integration. An uncorrelated and thus isolated
consideration of these dimensions would not reflect the intended pattern of European
integration. Therefore, this study allows for correlation between the components by using
oblique rotation of the factor loadings.
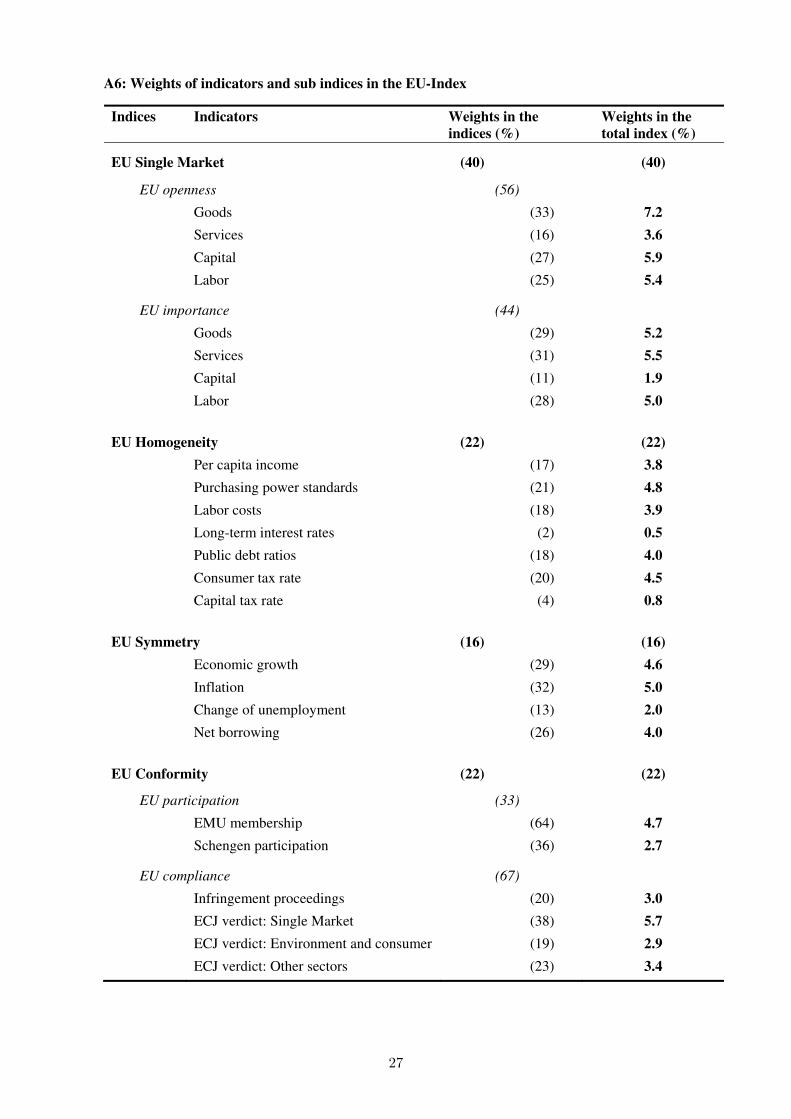
The correspondingly calculated weights for each indicator and dimension (sub
index) are illustrated in Table A6. Sensitivity analysis was performed to assess the
robustness of the calculated weights. Including and excluding single indicators, years and
countries from the sample shows no significant effect on the composite values and their
weighting scheme.
13
4 Results of the EU-Index
The EU-Index presented in Table 1 reveals country rankings and index points for the EU-
15 (without Luxembourg) for the years 1999 and 2010. Belgium with 77.33 index points
has the highest level of European integration in 2010, whereas Greece with only 43.65
index points is at the very bottom of the ranking. These figures demonstrate a large
discrepancy between the most and least integrated countries in the European Union. This
discrepancy was already present in 1999, but with lower index points. Apart from Spain,
whose level of integration remained nearly the same, all the investigated EU member
states were able to increase their level of European integration.
Table 1: Results of the EU-Index for 1999 and 2010
EU-Index 1999 EU-Index 2010
Rank Country Index points Rank Country Index points1 Belgium 68.42 1 Belgium 77.332 Ireland 60.93 2 Austria 65.743 France 59.36 3 Netherlands 64.544 Netherlands 59.03 4 France 64.245 Spain 57.23 5 Germany 64.086 Austria 56.97 6 Ireland 62.387 Germany 52.86 7 Finland 61.548 Sweden 49.96 8 Sweden 57.229 Portugal 49.13 9 Spain 57.16
10 Finland 48.82 10 Italy 56.0811 Italy 46.09 11 Portugal 55.8612 United Kingdom 44.62 12 Denmark 55.7213 Denmark 44.17 13 United Kingdom 52.1714 Greece 33.09 14 Greece 43.65
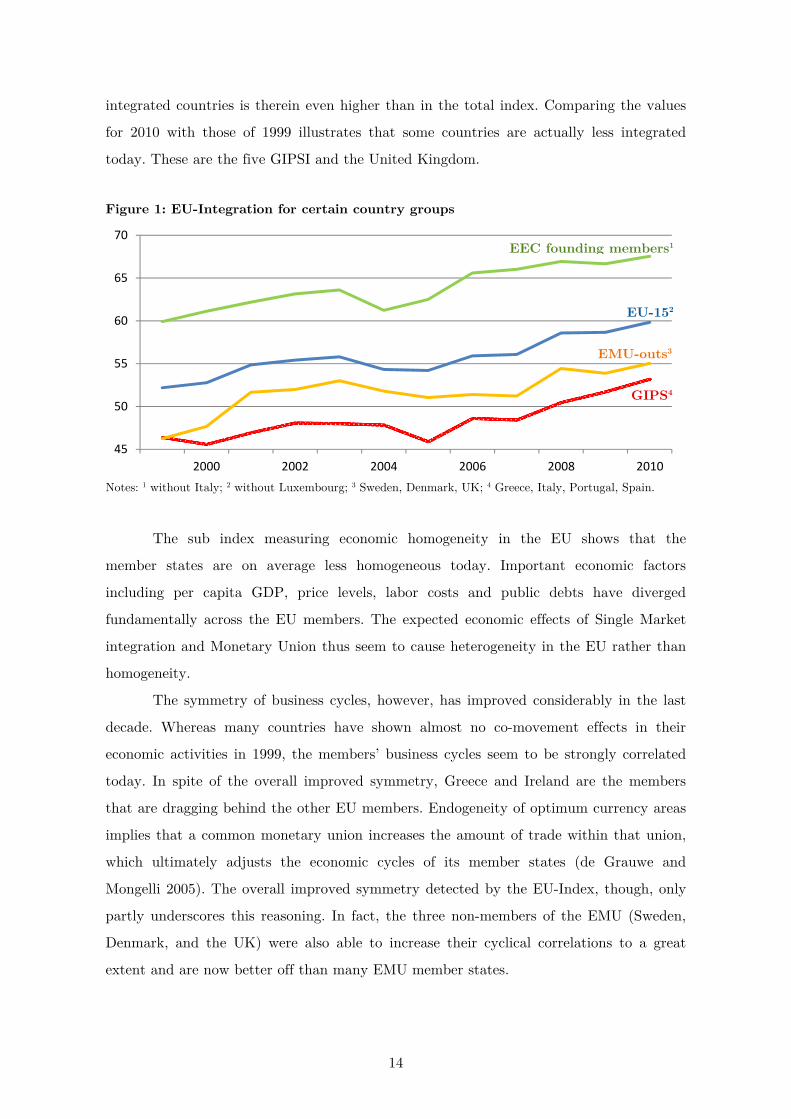
Most of the founding members of the European Economic Community (EEC) are
placed among the five most integrated countries in 2010, and only Italy demonstrates a
low integration level. With respect to the euro zone, the EU-Index identifies four of the
five "GIPSI" (Greece, Italy, Portugal, Spain, and Ireland) to be in the lower part of the
ranking. The three non-members of EMU (Sweden, Denmark, and UK) also appear in the
lower part. These differences in the level of European integration hold for the entire
period since 1999, as Figure 1 shows.
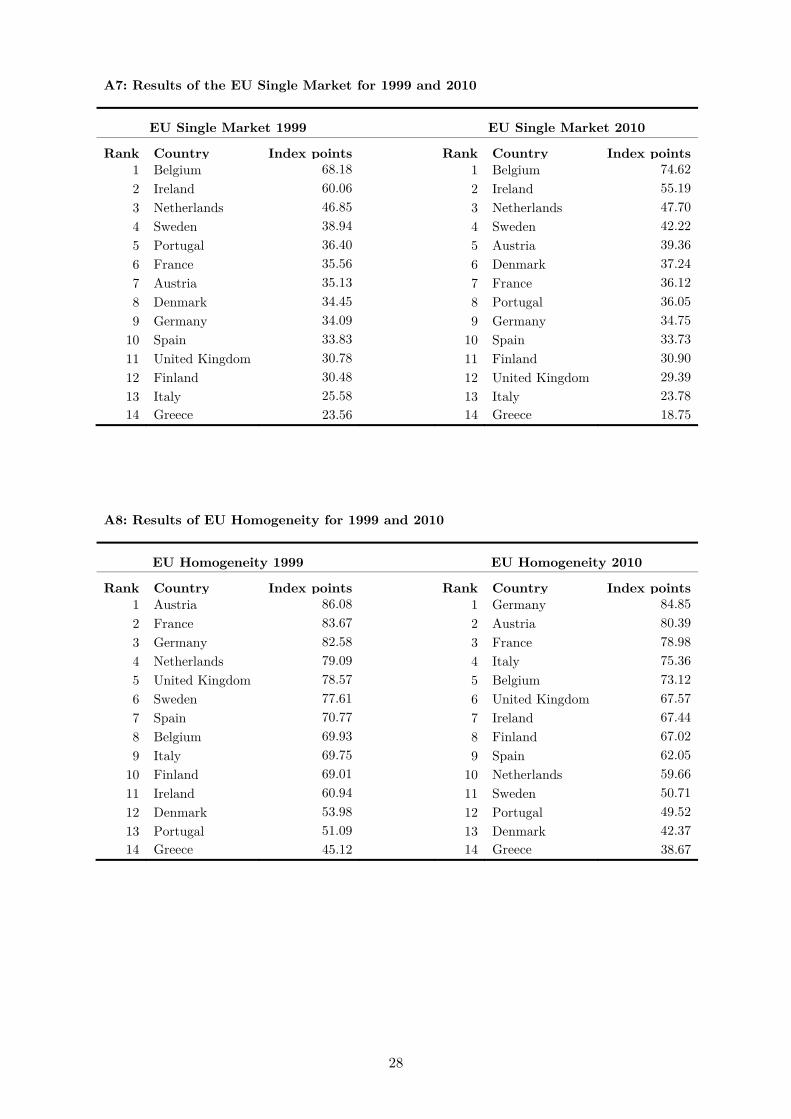
In order to interpret these developments more closely, the sub indices representing
the four dimensions of European integration need to be analyzed. The relevant tables are
presented in the appendix. The sub index representing the Single Market accounts for
nearly 40 percent of the EU-Index. The discrepancy between the most and least
14
integrated countries is therein even higher than in the total index. Comparing the values
for 2010 with those of 1999 illustrates that some countries are actually less integrated
today. These are the five GIPSI and the United Kingdom.
Figure 1: EU-Integration for certain country groups
Notes: 1 without Italy; 2 without Luxembourg; 3 Sweden, Denmark, UK; 4 Greece, Italy, Portugal, Spain.
The sub index measuring economic homogeneity in the EU shows that the
member states are on average less homogeneous today. Important economic factors
including per capita GDP, price levels, labor costs and public debts have diverged
fundamentally across the EU members. The expected economic effects of Single Market
integration and Monetary Union thus seem to cause heterogeneity in the EU rather than
homogeneity.
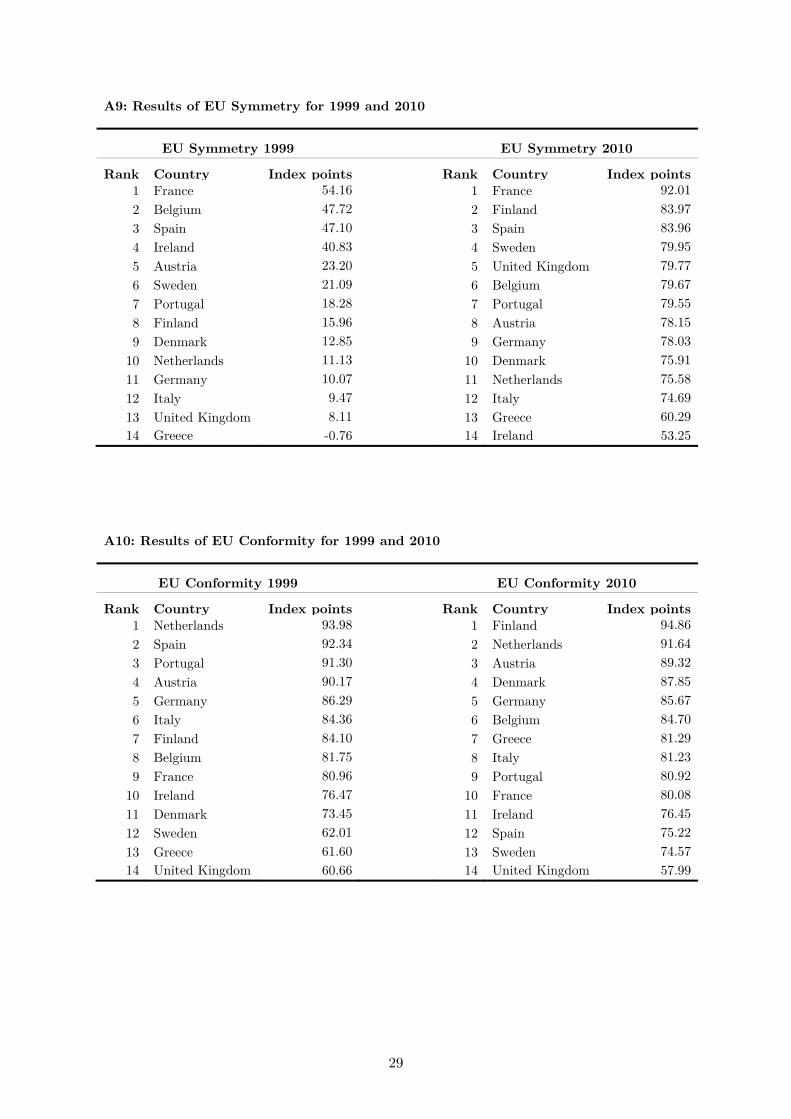
The symmetry of business cycles, however, has improved considerably in the last
decade. Whereas many countries have shown almost no co-movement effects in their
economic activities in 1999, the members’ business cycles seem to be strongly correlated
today. In spite of the overall improved symmetry, Greece and Ireland are the members
that are dragging behind the other EU members. Endogeneity of optimum currency areas
implies that a common monetary union increases the amount of trade within that union,
which ultimately adjusts the economic cycles of its member states (de Grauwe and
Mongelli 2005). The overall improved symmetry detected by the EU-Index, though, only
partly underscores this reasoning. In fact, the three non-members of the EMU (Sweden,
Denmark, and the UK) were also able to increase their cyclical correlations to a great
extent and are now better off than many EMU member states.
45
50
55
60
65
70
2000 2002 2004 2006 2008 2010
GIPS4
EU-152
EMU-outs3
EEC founding members1
15
The sub index on institutional conformity shows no great changes in index values
between 1999 and 2010. Although not a member of EMU, Denmark raised its level of
institutional integration due to its low amount of infringement proceedings and ECJ
verdicts and its participation in ERM II. Spain and Portugal, on the other hand,
decreased their level of integration due to relatively high non-compliance with EU law.
The United Kingdom is far behind the remaining EU member states when it comes to
overall institutional conformity.
5 Heterogeneity in the light of cluster analysis
The EU-Index captures the member states’ different levels of European
integration. As shown above, the same countries often appear to be in either the upper or
lower part of the various sub index rankings. The EEC founding members usually show
high levels of European integration, whereas the GIPSI and the non-members of the EMU
generally show integration levels below the EU average. Thus, the European Union seems
to be a heterogeneous community, but with several homogeneous country groups. In
principle, homogeneous countries are more likely to take similar integration steps based
on common preferences. The identification of homogeneous country groups may therefore
enhance the opportunity for these countries to undertake further (flexible) integration
into the EU. The EU has laid down general arrangements for the principle of “enhanced
cooperation” for this purpose, because growing economic heterogeneity among the
member states is seen as one key problem to European integration in the future.14
To identify homogeneous country groups, a hierarchical cluster analysis (using
Ward’s clustering) is performed with the 25 indicators of the EU-Index representing
European economic integration. The cluster analysis allows us to clearly uncover those
countries that are most closely linked to each other. Squared Euclidean distances are used
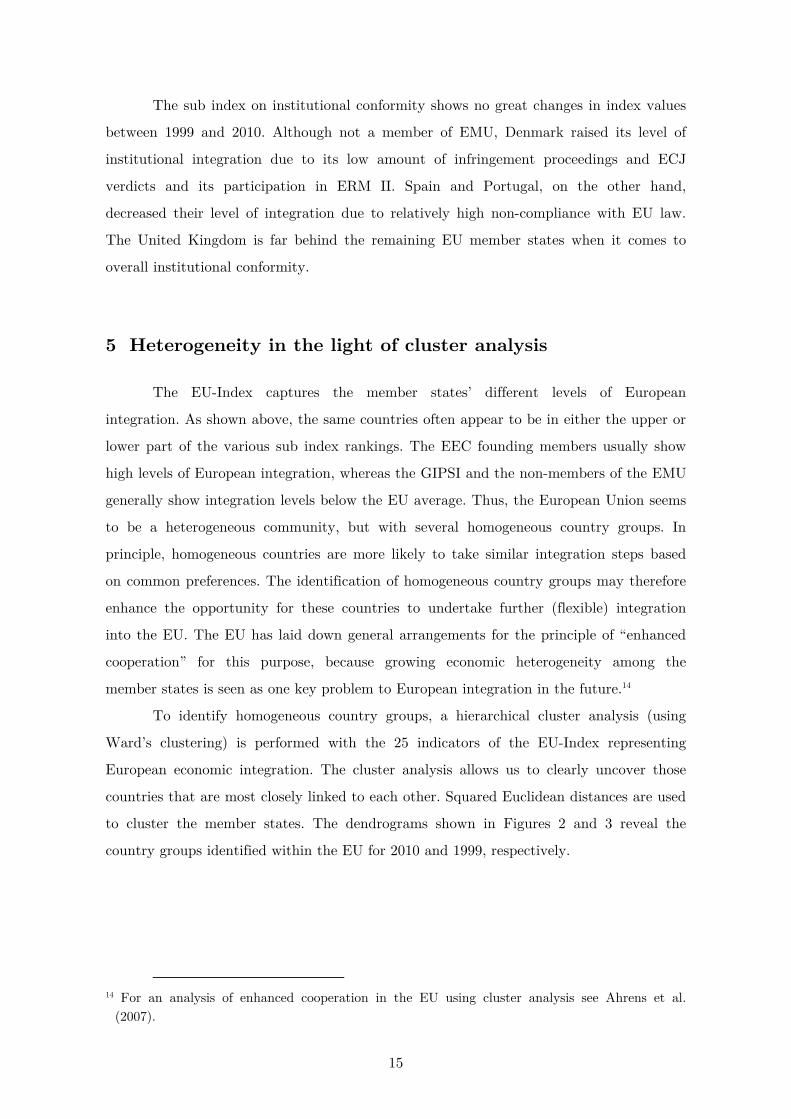
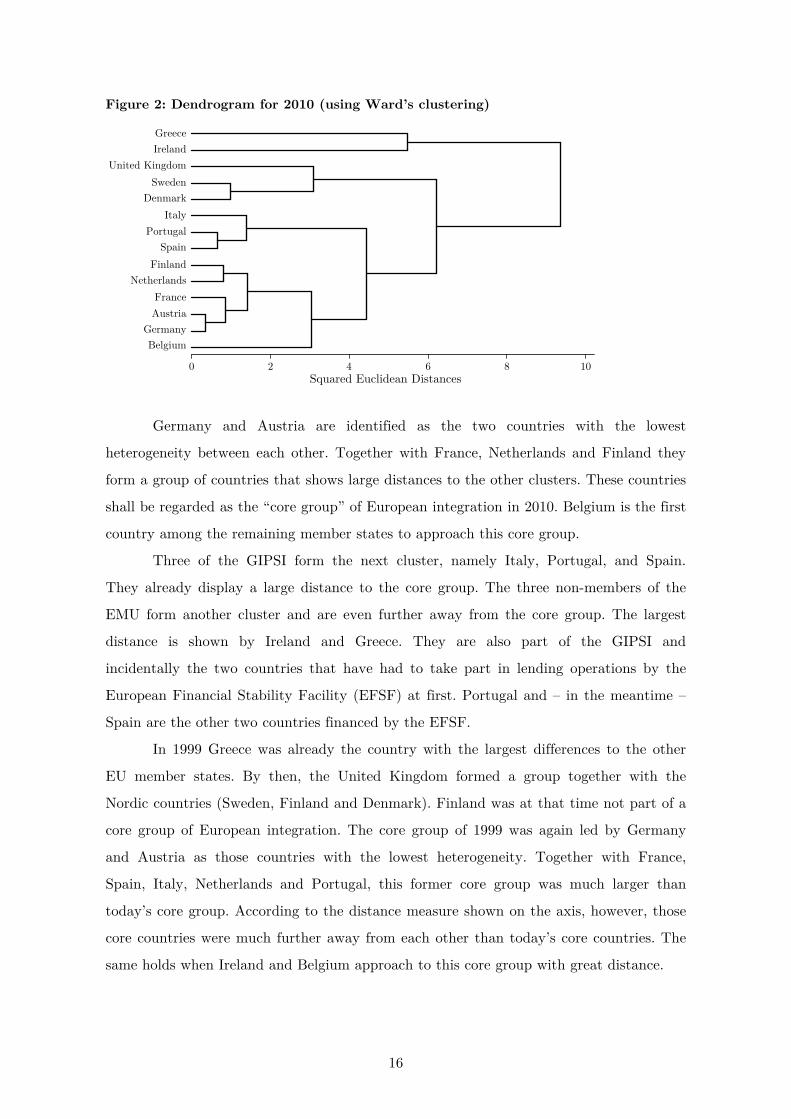
to cluster the member states. The dendrograms shown in Figures 2 and 3 reveal the
country groups identified within the EU for 2010 and 1999, respectively.
14 For an analysis of enhanced cooperation in the EU using cluster analysis see Ahrens et al.
(2007).
16
Figure 2: Dendrogram for 2010 (using Ward’s clustering)
Germany and Austria are identified as the two countries with the lowest
heterogeneity between each other. Together with France, Netherlands and Finland they
form a group of countries that shows large distances to the other clusters. These countries
shall be regarded as the “core group” of European integration in 2010. Belgium is the first
country among the remaining member states to approach this core group.
Three of the GIPSI form the next cluster, namely Italy, Portugal, and Spain.
They already display a large distance to the core group. The three non-members of the
EMU form another cluster and are even further away from the core group. The largest
distance is shown by Ireland and Greece. They are also part of the GIPSI and
incidentally the two countries that have had to take part in lending operations by the
European Financial Stability Facility (EFSF) at first. Portugal and – in the meantime –
Spain are the other two countries financed by the EFSF.
In 1999 Greece was already the country with the largest differences to the other
EU member states. By then, the United Kingdom formed a group together with the
Nordic countries (Sweden, Finland and Denmark). Finland was at that time not part of a
core group of European integration. The core group of 1999 was again led by Germany
and Austria as those countries with the lowest heterogeneity. Together with France,
Spain, Italy, Netherlands and Portugal, this former core group was much larger than
today’s core group. According to the distance measure shown on the axis, however, those
core countries were much further away from each other than today’s core countries. The
same holds when Ireland and Belgium approach to this core group with great distance.
Squared Euclidean Distances0 2 4 6 8 10
Finland
Greece
United Kingdom
Ireland
Sweden
Denmark
Italy
Portugal
Spain
Netherlands
France
Austria
Germany
Belgium
17
Figure 3: Dendrogram for 1999 (using Ward’s clustering)
Thus, today’s core group seems to be much more homogeneous than that of 1999.
Whereas European integration was characterized mainly by two different country clusters
in 1999, today’s integration level reveals the formation of at least three clusters: a core
group around Germany, Austria and France; a group of GIPSI; and a group of non-EMU
states.
6 Conclusion
The EU-Index measures the individual level of economic integration for the member
states of the European Union. It verifies that the member states indeed hold different
levels of economic integration. Within the past decade, however, the EU countries were
able to increase their individual integration level, except Spain.
By considering the overall index as well as the sub indices representing the four
dimensions of European integration, one may assume that the EU countries form a
heterogeneous community rather than a homogeneous group of countries with similar
integration levels. Using cluster analysis confirms this assumption. Today’s European
integration is driven by a core group. To this core group belong Germany, Austria,
France, Netherlands, Finland and – at some distance – Belgium. The GIPSI are far away
from this core group, with Portugal, Italy and Spain forming one group and Greece and
Ireland forming another group with the greatest distance to the other EU members. The
Squared Euclidean Distances0 2 4 6 8 10
Greece
Sweden
United Kingdom
Finland
Denmark
France
Spain
Italy
Netherlands
Portugal
Austria
Germany
Ireland
Belgium
18
three non-EMU member states (Sweden, Denmark and the United Kingdom) are
clustered together and also show great distances from the EU core group of countries.
The large economic heterogeneities and the strong and growing clustering of the
EU members may create fundamental difficulties for negotiating further integration steps
in the European Union and it may even put existing integration steps (such as the
European Monetary Union) into question. Missing economic homogeneity is usually
caused or accompanied by heterogeneous economic preferences and interests and
unsuitable common policies. Moreover, it can increase the trade-off between integration
and enlargement of the European Union, since future members of the EU and the EMU
might be even more heterogeneous to this core group.
Thus, the EU-Index sheds light on the complexity of European integration,
captures the content of the integration process, and offers a solid and statistical base for
both political discussions and empirical investigations, since now the degree of European
economic integration is numerically tangible and can be determined individually for each
country.
19
7 References
Ahrens, J. / Ohr, R. / Zeddies, G. (2007). Enhanced Cooperation in an Enlarged EU.
Jahrbuch für Wirtschaftswissenschaften, Vol. 58, 130-150.
Badinger, H. (2005). Growth Effects of Economic Integration: Evidence from the EU
Member States. Review of World Economics, Vol. 141 (1).
Baele, L. / Ferrando, A. / Hördahl, P. / Krylova, E. / Monnet, C. (2004). Measuring
Financial Integration in the Euro Area. ECB Occasional Paper Series, No. 14.
Baldwin, R. (2006). In or Out: Does it Matter? An Evidence-Based Analysis of the Euro’s
Trade Effects. Center for Economic Policy Research, London.
Balassa, B. (1961). The Theory of Economic Integration. Irwin: Homewood, Illinois.
Buch, C. / Döpke, J. / Pierdzioch, C. (2005). Financial openness and business cycle
volatility. Journal of International Money and Finance, Vol. 24 (5), 744-765.
Busch, B. (2009). Der EU-Binnenmarkt: Anspruch und Wirklichkeit. IW-Positionen, Nr.
39.
Cattell, R. B. (1966). The scree test for the number of factors. Multivariate Behavioral
Research, Vol. 1, 245-276.
Cronbach, L. J. (1951). Coefficient alpha and the internal structure tests. Psychometrika,
Vol. 16, 297-334.
De Grauwe, P. / Mongelli, F. (2005). Endogeneities of Optimum Currency Areas: What
Brings Countries Sharing a Single Currency Together? ECB Working Paper, No.
468.
De Grauwe, P. (2006). What Have We Learnt about Monetary Integration since the
Maastricht Treaty? Journal of Common Market Studies, Vol. 44, 711-730.
Dluhosch, B. (2001). Industrial Location and Economic Integration. Edward Elgar:
Cheltenham.
Dorrucci, E. / Firop, S. / Fratzscher, M. / Mongelli, F. (2004). The Link Between
Institutional and Economic Integration: Insights for Latin America from the
European Experience, Open Economies Review, Vol. 15, 239-260.
Dreher, A. (2006). Does Globalization Affect Growth? Evidence from a new Index of
Globalization. Applied Economics, Vol. 38 (10), 1091-1110.
20
Dreher, A. / Gaston, N. / Martens, P. (2008). Measuring Globalization – Gauging its
Consequences, New York: Springer.
European Commission (2002). 20th Annual Report on Monitoring the Application of EU
Law – Statistical Annexes I – III.
European Commission (2004). 22nd Annual Report on Monitoring the Application of EU
Law – Statistical Annexes I – III.
European Commission (2009). 27th Annual Report on Monitoring the Application of EU
Law – Statistical Annexes I – III.
European Commission (2010). 28th Annual Report on Monitoring the Application of EU
Law – Statistical Annexes I – III.
Frankel, J. / Rose, A. (1998). The Endogeneity of the Optimum Currency Area Criteria.
The Economic Journal, Vol. 108 (449), 1009-1025.
Furceri, D. / Karrass, G. (2008). Business-cycle synchronization in the EMU. Applied
Economics, Vol. 40 (12), 1491-1501.
Giannetti, M. (2002). The Effects of Integration on Regional Disparities: Convergence,
Divergence or both? European Economic Review, Vol. 46 (3), 539-567.
Gwartney, J. / Lawson, R. (2001). Economic Freedom of the World: 2001 Annual Report.
The Fraser Institute: Vancouver.
Juglar, C. (1862). Des Crises Commerciales et leur Retour Périodique en France, en
Angleterre, et aux États-Unis. Paris: Libraire Guillaumin.
Kitchin, J. (1923). Cycles and Trends in Economic Factors. Review of Economic
Statistics, Vol. 5 (1), 10-16.
Krugman, P. (1979). Increasing Returns, Monopolistic Competition, and International
Trade. Journal of International Economics, Vol. 9, 469-479.
Krugman, P. (1991). Increasing Returns and Economic Geography. Journal of Political
Economy, Vol. 99 (3), 183-499.
Lockwood, B. (2001). How Robust is the Foreign Policy/Kearney Index of Globalisation?
Center for the Study of Globalisation and Regionalisation Working Paper, No.
79/01.
21
Lucas, R. (1990). Why Doesn’t Capital Flow from Rich to Poor Countries?. American
Economic Review, Vol. 80, 92-96.
Molle, W. (1990). Will the Completion of the Internal Market Lead to Regional
Divergences? in: Siebert, H. (ed.), The Completion of the Internal Market.
Tübingen: Mohr Verlag, 174-196.
Mongelli, F. P. / Dorrucci, E. / Agur, I. (2007). What does European Institutional
Integration tell us about Trade Integration? Integration and Trade, Vol. 11 (26),
151-200.
Mongelli, F. P. / Vega, J. L. (2006). What Effects is EMU Having on the Euro Area and
its Member Countries? An Overview. ECB Working Paper, No. 599.
Nicoletti, G. / Scarpetta, S. / Boylaud, O. (2000). Summary Indicators of Product Market
Regulation with an Extension to Employment Protection Legislation. OECD
Economics Department Working Papers, No. 226.
Noorbakhsh, F. (1998). The human development index: some technical issues and
alternative indices. Journal of International Development, Vol. 10 (5), 589-605.
Nowotny, E. / Mooslechner, P. / Ritzberger-Grünwald, D. (2009). The integration of
European labour markets. Edward Elgar: Cheltenham.
OECD / JRC (2008). Handbook on Constructing Composite Indicators: Methodology and
Users Guide. Paris: OECD-Publishing.
Viner, J. (1950). The Customs Union Issue. New York: Carnegie Endowment for
International Peace.
22
8 Appendix
A1: Description and sources of indicators measuring a country's European integration
Indicator Description Source
EU Single Market
EU openness
Trade in goods Intra-European imports and exports of goods in percent of GDP.
Eurostat
Trade in services Intra-European imports and exports of services in percent of GDP.
Eurostat
Capital movement Intra-European stocks (inward and outward) of foreign direct investments in percent of GDP.
Eurostat, (UNCTAD)
Labor migration Amount of European employees (ILO definition) in percent of the total number of employees (foreign and national).
Eurostat
EU importance
Trade in goods Intra-European imports and exports of goods in percent of total trade in goods.
Eurostat
Trade in services Intra-European imports and exports of services in percent of total trade in services.
Eurostat
Capital movement Intra-European stocks of foreign direct invest-ments in percent of total FDI.
Eurostat, (UNCTAD, OECD)
Labor migration Amount of European employees (ILO definition) in percent of the total number of foreign employees.
Eurostat
EU Homogeneity
Per capita income Real GDP per capita at current prices (2005=100, in PPP) in relation to the respective EU average.
Eurostat
Purchasing power standards
Purchasing power standards (EU-15=1) in relation to the respective EU average.
Eurostat
Labor cost Labor costs (wage costs and payroll costs) per hour (in PPP, for the manufacturing sector and for companies with 10 or more employees) in relation to the respective EU average.
Eurostat
Long-term interest rate Long-term interest rates according to the Maastricht criteria (10-year government bonds) in relation to the respective EU average.
Eurostat
Public debt ratio Gross government debt in percentage of GDP in relation to the respective EU average.
Eurostat
Consumer tax rate Implicit tax rate on consumption (consumption tax revenues in relation to private consumption spending) in relation to the respective EU average.
Eurostat
Capital tax rate Implicit tax rate on capital (taxes on property and corporate profits for private households and companies in relation to the global profit and investment income of the private households and companies) in relation to the respective EU average.
Eurostat
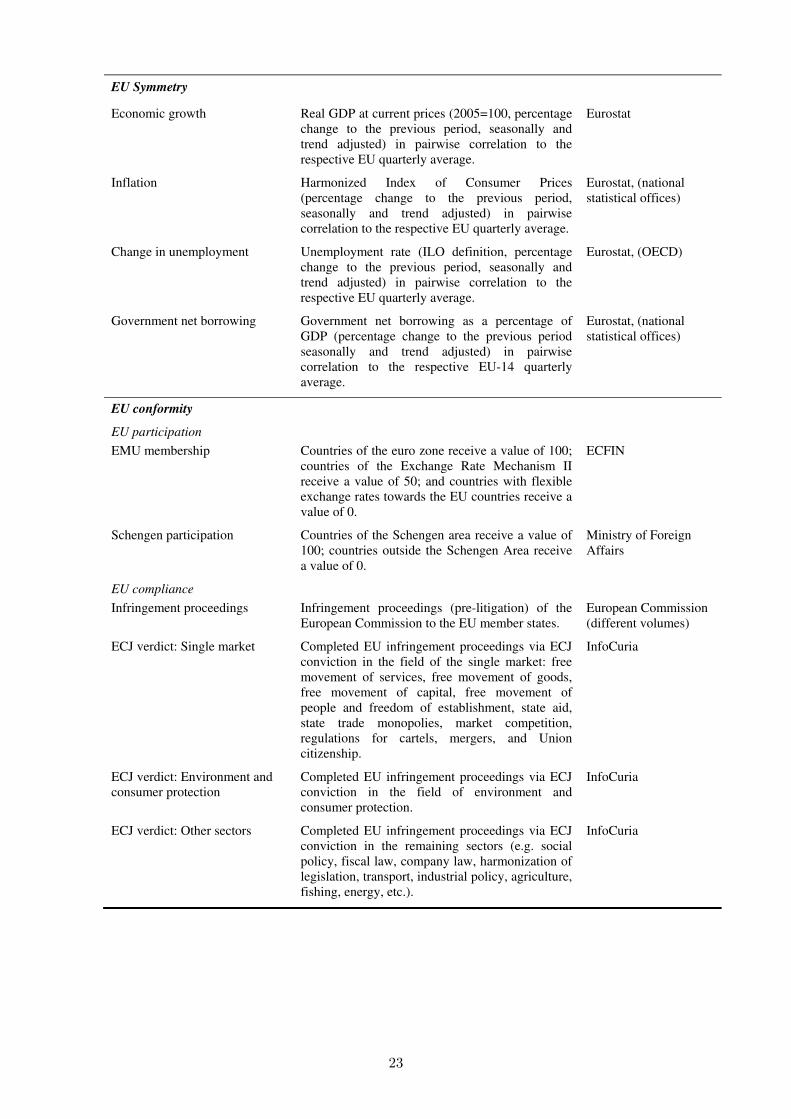
23
EU Symmetry
Economic growth Real GDP at current prices (2005=100, percentage change to the previous period, seasonally and trend adjusted) in pairwise correlation to the respective EU quarterly average.
Eurostat
Inflation Harmonized Index of Consumer Prices (percentage change to the previous period, seasonally and trend adjusted) in pairwise correlation to the respective EU quarterly average.
Eurostat, (national statistical offices)
Change in unemployment Unemployment rate (ILO definition, percentage change to the previous period, seasonally and trend adjusted) in pairwise correlation to the respective EU quarterly average.
Eurostat, (OECD)
Government net borrowing Government net borrowing as a percentage of GDP (percentage change to the previous period seasonally and trend adjusted) in pairwise correlation to the respective EU-14 quarterly average.
Eurostat, (national statistical offices)
EU conformity
EU participation
EMU membership Countries of the euro zone receive a value of 100; countries of the Exchange Rate Mechanism II receive a value of 50; and countries with flexible exchange rates towards the EU countries receive a value of 0.
ECFIN
Schengen participation Countries of the Schengen area receive a value of 100; countries outside the Schengen Area receive a value of 0.
Ministry of Foreign Affairs
EU compliance
Infringement proceedings Infringement proceedings (pre-litigation) of the European Commission to the EU member states.
European Commission (different volumes)
ECJ verdict: Single market Completed EU infringement proceedings via ECJ conviction in the field of the single market: free movement of services, free movement of goods, free movement of capital, free movement of people and freedom of establishment, state aid, state trade monopolies, market competition, regulations for cartels, mergers, and Union citizenship.
InfoCuria
ECJ verdict: Environment and consumer protection
Completed EU infringement proceedings via ECJ conviction in the field of environment and consumer protection.
InfoCuria
ECJ verdict: Other sectors Completed EU infringement proceedings via ECJ conviction in the remaining sectors (e.g. social policy, fiscal law, company law, harmonization of legislation, transport, industrial policy, agriculture, fishing, energy, etc.).
InfoCuria
24
A2: Correlation matrix of the 25 indicators measuring European integration
(1) (2) (3) (4) (5) (6) (7) (8) (9) (10) (11) (12) (13) (14) (15) (16) (17) (18) (19) (20) (21) (22) (23) (24) (25)
(1) 1
(2) .53* 1
(3) .84* .62* 1
(4) .73* .53* .74* 1
(5) .53* .30* .32* .26* 1
(6) .46* .20* .23* .19* .75* 1
(7) .26* .12 .34* .10 .19* .27* 1
(8) .74* .37* .74* .78* .32* .05 .18* 1
(9) .42* .53* .44* .50* -.07 -.22* -.11 .57* 1
(10) .16* .26* .30* .30* -.12 -.44* -.02 .48* .61* 1
(11) .43* -.01 .40* .59* -.09 -.16* -.06 .61* .51* .56* 1
(12) -.15* .10 -.09 -.14 -.14 -.06 -.19* -.24* -.25* -.18* -.27* 1
(13) .04 -.23* -.14 -.03 -.15* .12 .05 -.23* -.35* -.48* .02 .26* 1
(14) .31* .35* .34* .12 .17* -.20* .10 .43* .55* .80* .35* -.23* -.51* 1
(15) -.21* -.36* -.10 -.06 .15 -.03 -.06 .01 -.13 .28* .11 -.10 -.17* .08 1
(16) .08 -.13 .23* .12 -.30* -.11 .11 .09 .21* .17* .42* -.15 .01 .01 .09 1
(17) -.01 .02 .18* .27* -.31* -.23* .04 .01 -.02 .16* .33* .06 .13 -.05 .10 .43* 1
(18) .04 .08 .18* .11 -.11 -.05 .20* .15 .18* .14 .20* -.06 -.19* .11 -.07 .52* .20* 1
(19) -.19* .01 .15 .08 -.39* -.43* .05 .04 .15 .31* .14 -.01 -.36* .12 .13 .44* .53* .32* 1
(20) .24* .14 .04 .02 .22* .43* .36* -.16* -.19* -.40* -.09 -.01 .33* -.28* -.46* .12 .04 .17* -.18* 1
(21) .06 -.38* -.12 -.16* .12 .31* .11 -.17* -.37* -.26* .22* -.15 .34* -.08 -.08 .21* .24* .13 -.07 .42* 1
(22) .18* .29* .34* .18* -.03 -.20* -.11 .23* .39* .50* .27* -.11 -.51* .57* .03 .26* .22* .17* .38* -.25* -.11 1
(23) .10 .17* .03 -.05 .12 -.13 -.11 .17* .25* .29* -.07 -.09 -.37* .42* -.02 -.29* -.40* -.12 -.21* -.31* -.30* .19* 1
(24) .14 .13 .11 .02 .11 -.10 -.08 .22* .20* .29* .11 -.06 -.33* .46* -.10 -.08 -.15 .02 -.07 -.19* -.05 .40* .47* 1
(25) .11 .20* .11 .01 .21* .09 -.03 .14 .19* .25* -.04 -.05 -.41* .40* -.01 -.05 -.25* .01 -.05 -.21* -.16* .30* .47* .37* 1
Notes:
(1) Openness to EU-goods, (2) Openness to EU-services, (3) Openness to EU-capital, (4) Openness to EU-labor, (5) Importance of EU-goods, (6) Importance of EU-services, (7) Importance of EU-capital, (8) Importance of EU-labor, (9) Per capita income, (10) Purchasing power standards, (11) Labor cost, (12) Long-term interest rate, (13) Public debt ratio, (14) Consumer tax rate, (15) Capital tax rate, (16) Economic growth, (17) Inflation rate, (18) Change in unemployment, (19) Government net borrowing, (20) EMU membership, (21) Schengen participation, (22) Infringement proceedings, (23) ECJ: Single Market, (24) ECJ: Environment and consumer protection, (25) ECJ: Other sectors.
The shaded values refer to those correlation pairs that form a joint integration group (EU movements, EU homogeneity, EU symmetry and institutional conformity); * = significance at the 5 percent level.
25
A3: Scree-Test
A4: Eigenvalues and variances of the principle component analysis
Component Eigenvalue Difference Explained variance
(%)
Accumulated variance
(%)
1 5.94 2.18 23.77 23.77
2 3.76 0.45 15.04 38.82
3 3.31 1.50 13.22 52.04
4 1.81 0.14 7.24 59.28
5 1.67 0.29 6.69 65.97
6 1.38 0.26 5.51 71.49
7 1.12 0.22 4.48 75.97
8 0.90 0.08 3.61 79.58
9 0.82 0.13 3.30 82.88
…
…
…
…
…
25 0.02 - 0.001 100.00
0
2
4
6
1 4 7 10 13 16 19 22 25
Eig
enva
lues
Principal components
26
A5: Rotated factor loadings and weights
Rotated factor loadings a Weighting of the indicators (%)
b
Indicators Component 1 Component 2 Component 3 Component 1 Component 2 Component 3
Openness to EU-goods 0.434 -0.039 -0.049 7.1 0.1 0.1 Openness to EU-services 0.281 0.100 -0.093 3.0 0.4 0.2 Openness to EU-capital 0.390 0.020 0.081 5.7 0.0 0.2 Openness to EU-labor 0.366 -0.012 0.116 5.1 0.0 0.4 Importance of EU-goods 0.262 -0.035 -0.310 2.6 0.0 2.5 Importance of EU-services 0.244 -0.219 -0.246 2.2 1.7 1.6 Importance of EU-capital 0.182 -0.138 0.019 1.2 0.7 0.0 Importance of EU-labor 0.341 0.121 0.053 4.4 0.5 0.1
Per capita income 0.195 0.241 0.103 1.4 2.1 0.3 Purchasing power standards 0.072 0.332 0.165 0.2 3.9 0.7 Labor costs 0.206 0.041 0.294 1.6 0.1 2.3 Long-term interest rates -0.098 -0.052 -0.042 0.4 0.1 0.1 Debt ratios -0.000 -0.336 0.040 0.0 4.0 0.0 Consumer tax rate 0.124 0.335 -0.008 0.6 3.9 0.0 Capital tax rate -0.102 0.097 0.063 0.4 0.3 0.1
Economic growth 0.062 -0.083 0.398 0.2 0.2 4.2 Inflation 0.029 -0.119 0.411 0.0 0.5 4.5 Unemployment 0.083 -0.036 0.252 0.3 0.1 1.7 Government net borrowing -0.064 0.074 0.374 0.2 0.2 3.7
EMU membership 0.163 -0.323 -0.007 1.0 3.7 0.0 Schengen participation 0.045 -0.255 0.109 0.1 2.3 0.3 Infringement proceedings 0.071 0.259 0.131 0.2 2.4 0.5 ECJ: Single Market -0.015 0.326 -0.269 0.0 3.7 1.9 ECJ: Environment & consumer 0.035 0.262 -0.128 0.1 2.4 0.4 ECJ: Other sectors 0.037 0.260 -0.196 0.1 2.4 1.0
Explained variance 4.963 4.652 3.492
Share of total variance (%) 37.860 35.495 26.645
Notes: a Rotation method: (oblique) Promax-rotation with Kaiser-normalization. b Squared factor loading multiplied by the share of variance of the corresponding component.
27
A6: Weights of indicators and sub indices in the EU-Index
Indices
Indicators
Weights in the
indices (%)
Weights in the
total index (%)
EU Single Market (40) (40)
EU openness (56)
Goods (33) 7.2
Services (16) 3.6
Capital (27) 5.9
Labor (25) 5.4
EU importance (44)
Goods (29) 5.2
Services (31) 5.5
Capital (11) 1.9
Labor (28) 5.0
EU Homogeneity (22) (22)
Per capita income (17) 3.8
Purchasing power standards (21) 4.8
Labor costs (18) 3.9
Long-term interest rates (2) 0.5
Public debt ratios (18) 4.0
Consumer tax rate (20) 4.5
Capital tax rate (4) 0.8
EU Symmetry (16) (16)
Economic growth (29) 4.6
Inflation (32) 5.0
Change of unemployment (13) 2.0
Net borrowing (26) 4.0
EU Conformity (22) (22)
EU participation (33)
EMU membership (64) 4.7
Schengen participation (36) 2.7
EU compliance (67)
Infringement proceedings (20) 3.0
ECJ verdict: Single Market (38) 5.7
ECJ verdict: Environment and consumer (19) 2.9
ECJ verdict: Other sectors (23) 3.4
28
A7: Results of the EU Single Market for 1999 and 2010
EU Single Market 1999 EU Single Market 2010
Rank Country Index points Rank Country Index points1 Belgium 68.18 1 Belgium 74.62
2 Ireland 60.06 2 Ireland 55.19
3 Netherlands 46.85 3 Netherlands 47.70
4 Sweden 38.94 4 Sweden 42.22
5 Portugal 36.40 5 Austria 39.36
6 France 35.56 6 Denmark 37.24
7 Austria 35.13 7 France 36.12
8 Denmark 34.45 8 Portugal 36.05
9 Germany 34.09 9 Germany 34.75
10 Spain 33.83 10 Spain 33.73
11 United Kingdom 30.78 11 Finland 30.90
12 Finland 30.48 12 United Kingdom 29.39
13 Italy 25.58 13 Italy 23.7814 Greece 23.56 14 Greece 18.75
A8: Results of EU Homogeneity for 1999 and 2010
EU Homogeneity 1999 EU Homogeneity 2010
Rank Country Index points Rank Country Index points1 Austria 86.08 1 Germany 84.85
2 France 83.67 2 Austria 80.39
3 Germany 82.58 3 France 78.98
4 Netherlands 79.09 4 Italy 75.36
5 United Kingdom 78.57 5 Belgium 73.12
6 Sweden 77.61 6 United Kingdom 67.57
7 Spain 70.77 7 Ireland 67.44
8 Belgium 69.93 8 Finland 67.02
9 Italy 69.75 9 Spain 62.05
10 Finland 69.01 10 Netherlands 59.66
11 Ireland 60.94 11 Sweden 50.71
12 Denmark 53.98 12 Portugal 49.52
13 Portugal 51.09 13 Denmark 42.3714 Greece 45.12 14 Greece 38.67
29
A9: Results of EU Symmetry for 1999 and 2010
EU Symmetry 1999 EU Symmetry 2010
Rank Country Index points Rank Country Index points1 France 54.16 1 France 92.01
2 Belgium 47.72 2 Finland 83.97
3 Spain 47.10 3 Spain 83.96
4 Ireland 40.83 4 Sweden 79.95
5 Austria 23.20 5 United Kingdom 79.77
6 Sweden 21.09 6 Belgium 79.67
7 Portugal 18.28 7 Portugal 79.55
8 Finland 15.96 8 Austria 78.15
9 Denmark 12.85 9 Germany 78.03
10 Netherlands 11.13 10 Denmark 75.91
11 Germany 10.07 11 Netherlands 75.58
12 Italy 9.47 12 Italy 74.69
13 United Kingdom 8.11 13 Greece 60.2914 Greece -0.76 14 Ireland 53.25
A10: Results of EU Conformity for 1999 and 2010
EU Conformity 1999 EU Conformity 2010
Rank Country Index points Rank Country Index points1 Netherlands 93.98 1 Finland 94.86
2 Spain 92.34 2 Netherlands 91.64
3 Portugal 91.30 3 Austria 89.32
4 Austria 90.17 4 Denmark 87.85
5 Germany 86.29 5 Germany 85.67
6 Italy 84.36 6 Belgium 84.70
7 Finland 84.10 7 Greece 81.29
8 Belgium 81.75 8 Italy 81.23
9 France 80.96 9 Portugal 80.92
10 Ireland 76.47 10 France 80.08
11 Denmark 73.45 11 Ireland 76.45
12 Sweden 62.01 12 Spain 75.22
13 Greece 61.60 13 Sweden 74.5714 United Kingdom 60.66 14 United Kingdom 57.99
Bisher erschienene Diskussionspapiere
Nr. 138: König, Jörg; Ohr, Renate: Homogeneous groups within a heterogeneous community -Evidence from an index measuring European economic integration, August 2012
Nr. 137: Schwager, Robert: Student Loans in a Tiebout Model of Higher, July 2012
Nr. 136: Martínez-Zarzoso, Inmaculada: Exporting and Productivity: Evidence for Egypt and Morocco, April 2012
Nr. 135: König, Jörg; Ohr, Renate: Messung ökonomischer Integration in der Europäischen Union –Entwicklung eines EU-Integrationsindexes -, April 2012
Nr. 134: Gehringer, Agnieszka: Financial liberalization, growth, productivity and capital accumulation: The case of European integration, März 2012
Nr. 133: Berner, Eike; Birg, Laura: Retailers and Consumers. The pass-through of import price changes, März 2012
Nr. 132: Gehringer, Angnieszka: Current accounts in Europe: implications of the external imbalances for the future of the common monetary policy, März 2012
Nr. 131: Ohr, Renate; Özalbayrak, Mehmet: The Euro – A „MUST“ for Small European States?, Januar 2012
Nr. 130: Zeddies, Götz: Der Euro als Triebfeder des deutschen Exports?, November 2011
Nr. 129: Geishecker, Ingo; Siedler, Thomas: Job Loss Fears and (Extreme) Party Identification: First Evidence from Panel Data, Oktober 2011
Nr. 128: König, Jörg; Ohr, Renate: Small but Beautiful? Economic Impacts of the Size of Nations in the European Union, August 2011
Nr. 127: Schüder, Stefan: Monetary Policy Trade-Offs in a Portfolio Model with Endogenous Asset Supply, Juni 2011
Nr. 126: Hiller, Sanne: The Export Promoting Effect of Emigration: Evidence from Denmark, Juni 2011
Nr. 125: Martínez-Zarzoso, Inmaculada; Voicu, Anca M.; Vidovic, Martina: CEECs Integration into Regional and Global Production Networks, Mai 2011
Nr. 124: Roth, Felix; Gros, Daniel; Nowak-Lehmann D., Felicitas: Has the Financial Crisis eroded Citizens’ Trust in the European Central Bank? Panel Data Evidence for the Euro Area, 1999-2011, Mai 2011, Revised Version März 2012
Nr. 123 Dreher, Axel; Vreeland, James Raymond : Buying Votes and International Organizations, Mai 2011
Nr. 122: Schürenberg-Frosch, Hannah: One Model fits all? Determinants of Transport Costs across Sectors and Country Groups, April 2011
Nr. 121: Verheyen, Florian: Bilateral Exports from Euro Zone Countries to the US - Does Exchange Rate Variability Play a Role?, April 2011
Nr. 120: Ehlers, Tim: University Graduation Dependent on Family’s Wealth, Ability and Social Status, April 2011
Nr. 119: Cho, Seo-Young; Dreher, Axel; Neumayer, Eric: The Spread of Anti-trafficking Policies – Evidence from a New Index, März 2011
Nr. 118: Cho, Seo-Young; Vadlamannati, Krishna Chaitanya: Compliance for Big Brothers: An Empirical Analysis on the Impact of the Anti-trafficking Protocol, Februar 2011
Nr. 117: Nunnenkamp, Peter; Öhler, Hannes: Donations to US based NGOs in International Development Cooperation: How (Un-)Informed Are Private Donors?, Februar 2011
Nr. 116: Geishecker, Ingo; Riedl, Maximilian: Ordered Response Models and Non-Random Personality Traits: Monte Carlo Simulations and a Practical Guide, Revised Version Februar 2012
Nr. 115: Dreher, Axel; Gassebner, Martin; Siemers, Lars-H. R.: Globalization, Economic Freedom and Human Rights, Oktober 2010
Nr. 114: Dreher, Axel; Mikosch, Heiner; Voigt, Stefan: Membership has its Privileges – The Effect of Membership in International Organizations on FDI, Oktober 2010
Nr. 113: Fuchs, Andreas; Klann, Nils-Hendrik: Paying a Visit: The Dalai Lama Effect on International Trade, Oktober 2010
Nr. 112: Freitag, Stephan: Choosing an Anchor Currency for the Pacific, Oktober 2010
Nr. 111: Nunnenkamp, Peter; Öhler, Hannes: Throwing Foreign Aid at HIV/AIDS in Developing Countries: Missing the Target?, August 2010
Nr. 110: Ohr, Renate; Zeddies, Götz: „Geschäftsmodell Deutschland“ und außenwirtschaftliche Ungleichgewichte in der EU, Juli 2010
Nr. 109: Nunnenkamp, Peter; Öhler, Hannes: Funding, Competition and the Efficiency of NGOs: An Empirical Analysis of Non-charitable Expenditure of US NGOs Engaged in Foreign Aid, Juli 2010
Nr. 108: Krenz, Astrid: La Distinction reloaded: Returns to Education, Family Background, Cultural and Social Capital in Germany, Juli 2010
Nr. 107: Krenz, Astrid: Services sectors' agglomeration and its interdependence with industrial agglomeration in the European Union, Juli 2010
Nr. 106: Krenz, Astrid; Rübel, Gerhard: Industrial Localization and Countries' Specialization in the European Union: An Empirical Investigation, Juli 2010
Nr. 105: Schinke, Jan Christian: Follow the Sun! How investments in solar power plants in Sicily can generate high returns of investments and help to prevent global warming, Juni 2010
Nr. 104: Dreher, Axel; Sturm, Jan-Egbert; Vreeland, James Raymon: Does membership on the Security Council influence IMF conditionality?, Juni 2010
Nr. 103: Öhler, Hannes; Nunnenkamp, Peter; Dreher, Axel: Does Conditionality Work? A Test for an Innovative US Aid Scheme, Juni 2010
Nr. 102: Gehringer, Agnieszka: Pecuniary Knowledge Externalities in a New Taxonomy: Knowledge Interactions in a Vertically Integrated System, Juni 2010
Nr. 101: Gehringer, Agnieszka: Pecuniary Knowledge Externalities across European Countries – are there leading Sectors?, Juni 2010
Nr. 100: Gehringer, Agnieszka: Pecuniary Knowledge Externalities and Innovation: Intersectoral Linkages and their Effects beyond Technological Spillovers, Juni 2010
Nr. 99: Dreher, Axel; Nunnenkamp, Peter; Öhler, Hannes: Why it pays for aid recipients to take note of the Millennium Challenge Corporation: Other donors do!, April 2010
Nr. 98: Baumgarten, Daniel; Geishecker, Ingo; Görg, Holger: Offshoring, tasks, and the skill-wage pattern, März 2010
Nr. 97: Dreher, Axel; Klasen, Stephan; Raymond, James; Werker, Eric: The costs of favoritism: Is politically-driven aid less effective?, März 2010
Nr. 96: Dreher, Axel; Nunnenkamp, Peter; Thiele, Rainer: Are ‘New’ Donors Different? Comparing the Allocation of Bilateral Aid between Non-DAC and DAC Donor Countries, März 2010
Nr. 95: Lurweg, Maren; Westermeier, Andreas: Jobs Gained and Lost through Trade – The Case of Germany, März 2010
Nr. 94: Bernauer, Thomas; Kalbhenn, Anna; Koubi, Vally; Ruoff, Gabi: On Commitment Levels and Compliance Mechanisms – Determinants of Participation in Global Environmental Agreements, Januar 2010
Nr. 93: Cho, Seo-Young: International Human Rights Treaty to Change Social Patterns – The Convention on the Elimination of All Forms of Discrimination against Women, Januar 2010
Nr. 92: Dreher, Axel; Nunnenkamp, Peter; Thiel, Susann; Thiele, Rainer: Aid Allocation by German NGOs: Does the Degree of Public Refinancing Matter?, Januar 2010
Nr. 91: Bjørnskov, Christian; Dreher, Axel; Fischer, Justina A. V.; Schnellenbach, Jan: On the relation between income inequality and happiness: Do fairness perceptions matter?, Dezember 2009
Nr. 90: Geishecker, Ingo: Perceived Job Insecurity and Well-Being Revisited: Towards Conceptual Clarity, Dezember 2009
Nr. 89: Kühl, Michael: Excess Comovements between the Euro/US dollar and British pound/US dollar exchange rates, November 2009
Nr. 88: Mourmouras, Alex, Russel, Steven H.: Financial Crises, Capital Liquidation and the Demand for International Reserves, November 2009
Nr. 87: Goerke, Laszlo, Pannenberg, Markus: An Analysis of Dismissal Legislation: Determinants of Severance Pay in West Germany, November 2009
Nr. 86: Marchesi, Silvia, Sabani, Laura, Dreher, Axel: Read my lips: the role of information transmission in multilateral reform design, Juni 2009
Nr. 85: Heinig, Hans Michael: Sind Referenden eine Antwort auf das Demokratiedilemma der EU?, Juni 2009
Nr. 84: El-Shagi, Makram: The Impact of Fixed Exchange Rates on Fiscal Discipline, Juni 2009
Nr. 83: Schneider, Friedrich: Is a Federal European Constitution for an Enlarged European Union Necessary? Some Preliminary Suggestions using Public Choice Analysis, Mai 2009
Nr. 82: Vaubel, Roland: Nie sollst Du mich befragen? Weshalb Referenden in bestimmten Politikbereichen – auch in der Europapolitik – möglich sein sollten, Mai 2009
Nr. 81: Williamson, Jeffrey G.: History without Evidence: Latin American Inequality since 1491, Mai 2009
Nr. 80: Erdogan, Burcu: How does the European Integration affect the European Stock Markets?, April 2009
Nr. 79: Oelgemöller, Jens; Westermeier, Andreas: RCAs within Western Europe, März 2009
Nr. 78: Blonski, Matthias; Lilienfeld-Toal, Ulf von: Excess Returns and the Distinguished Player Paradox, Oktober 2008
Nr. 77: Lechner, Susanne; Ohr, Renate: The Right of Withdrawal in the Treaty of Lisbon: A game theoretic reflection on different decision processes in the EU, Oktober 2008
Nr. 76: Kühl, Michael: Strong comovements of exchange rates: Theoretical and empirical cases when currencies become the same asset, Juli 2008
Nr. 75: Höhenberger, Nicole; Schmiedeberg, Claudia: Structural Convergence of European Countries, Juli 2008
Nr. 74: Nowak-Lehmann D., Felicitas; Vollmer, Sebastian; Martinez-Zarzoso, Inmaculada: Does Comparative Advantage Make Countries Competitive? A Comparison of China and Mexico, Juli 2008
Nr. 73: Fendel, Ralf; Lis, Eliza M.; Rülke, Jan-Christoph: Does the Financial Market Believe in the Phillips Curve? – Evidence from the G7 countries, Mai 2008
Nr. 72: Hafner, Kurt A.: Agglomeration Economies and Clustering – Evidence from German Firms, Mai 2008
Nr. 71: Pegels, Anna: Die Rolle des Humankapitals bei der Technologieübertragung in Entwicklungsländer, April 2008
Nr. 70: Grimm, Michael; Klasen, Stephan: Geography vs. Institutions at the Village Level, Februar 2008
Nr. 69: Van der Berg, Servaas: How effective are poor schools? Poverty and educational outcomes in South Africa, Januar 2008
Nr. 68: Kühl, Michael: Cointegration in the Foreign Exchange Market and Market Efficiency since the Introduction of the Euro: Evidence based on bivariate Cointegration Analyses, Oktober 2007
Nr. 67: Hess, Sebastian; Cramon-Taubadel, Stephan von: Assessing General and Partial Equilibrium Simulations of Doha Round Outcomes using Meta-Analysis, August 2007
Nr. 66: Eckel, Carsten: International Trade and Retailing: Diversity versus Accessibility and the Creation of “Retail Deserts”, August 2007
Nr. 65: Stoschek, Barbara: The Political Economy of Enviromental Regulations and Industry Compensation, Juni 2007
Nr. 64: Martinez-Zarzoso, Inmaculada; Nowak-Lehmann D., Felicitas; Vollmer, Sebastian: The Log of Gravity Revisited, Juni 2007
Nr. 63: Gundel, Sebastian: Declining Export Prices due to Increased Competition from NIC – Evidence from Germany and the CEEC, April 2007
Nr. 62: Wilckens, Sebastian: Should WTO Dispute Settlement Be Subsidized?, April 2007
Nr. 61: Schöller, Deborah: Service Offshoring: A Challenge for Employment? Evidence from Germany, April 2007
Nr. 60: Janeba, Eckhard: Exports, Unemployment and the Welfare State, März 2007
Nr. 59: Lambsdoff, Johann Graf; Nell, Mathias: Fighting Corruption with Asymmetric Penalties and Leniency, Februar 2007
Nr. 58: Köller, Mareike: Unterschiedliche Direktinvestitionen in Irland – Eine theoriegestützte Analyse, August 2006
Nr. 57: Entorf, Horst; Lauk, Martina: Peer Effects, Social Multipliers and Migrants at School: An International Comparison, März 2007 (revidierte Fassung von Juli 2006)
Nr. 56: Görlich, Dennis; Trebesch, Christoph: Mass Migration and Seasonality Evidence on Moldova’s Labour Exodus, Mai 2006
Nr. 55: Brandmeier, Michael: Reasons for Real Appreciation in Central Europe, Mai 2006
Nr. 54: Martínez-Zarzoso, Inmaculada; Nowak-Lehmann D., Felicitas: Is Distance a Good Proxy for Transport Costs? The Case of Competing Transport Modes, Mai 2006
Nr. 53: Ahrens, Joachim; Ohr, Renate; Zeddies, Götz: Enhanced Cooperation in an Enlarged EU, April 2006
Nr. 52: Stöwhase, Sven: Discrete Investment and Tax Competition when Firms shift Profits, April 2006
Nr. 51: Pelzer, Gesa: Darstellung der Beschäftigungseffekte von Exporten anhand einer Input-Output-Analyse, April 2006
Nr. 50: Elschner, Christina; Schwager, Robert: A Simulation Method to Measure the Tax Burden on Highly Skilled Manpower, März 2006
Nr. 49: Gaertner, Wulf; Xu, Yongsheng: A New Measure of the Standard of Living Based on Functionings, Oktober 2005
Nr. 48: Rincke, Johannes; Schwager, Robert: Skills, Social Mobility, and the Support for the Welfare State, September 2005
Nr. 47: Bose, Niloy; Neumann, Rebecca: Explaining the Trend and the Diversity in the Evolution of the Stock Market, Juli 2005
Nr. 46: Kleinert, Jörn; Toubal, Farid: Gravity for FDI, Juni 2005
Nr. 45: Eckel, Carsten: International Trade, Flexible Manufacturing and Outsourcing, Mai 2005
Nr. 44: Hafner, Kurt A.: International Patent Pattern and Technology Diffusion, Mai 2005
Nr. 43: Nowak-Lehmann D., Felicitas; Herzer, Dierk; Martínez-Zarzoso, Inmaculada; Vollmer, Sebastian: Turkey and the Ankara Treaty of 1963: What can Trade Integration Do for Turkish Exports, Mai 2005
Nr. 42: Südekum, Jens: Does the Home Market Effect Arise in a Three-Country Model?, April 2005
Nr. 41: Carlberg, Michael: International Monetary Policy Coordination, April 2005
Nr. 40: Herzog, Bodo: Why do bigger countries have more problems with the Stability and Growth Pact?, April 2005
Nr. 39: Marouani, Mohamed A.: The Impact of the Mulitfiber Agreement Phaseout on Unemployment in Tunisia: a Prospective Dynamic Analysis, Januar 2005
Nr. 38: Bauer, Philipp; Riphahn, Regina T.: Heterogeneity in the Intergenerational Transmission of Educational Attainment: Evidence from Switzerland on Natives and Second Generation Immigrants, Januar 2005
Nr. 37: Büttner, Thiess: The Incentive Effect of Fiscal Equalization Transfers on Tax Policy, Januar 2005
Nr. 36: Feuerstein, Switgard; Grimm, Oliver: On the Credibility of Currency Boards, Oktober 2004
Nr. 35: Michaelis, Jochen; Minich, Heike: Inflationsdifferenzen im Euroraum – eine Bestandsaufnahme, Oktober 2004
Nr. 34: Neary, J. Peter: Cross-Border Mergers as Instruments of Comparative Advantage, Juli 2004
Nr. 33: Bjorvatn, Kjetil; Cappelen, Alexander W.: Globalisation, inequality and redistribution, Juli 2004
Nr. 32: Stremmel, Dennis: Geistige Eigentumsrechte im Welthandel: Stellt das TRIPs-Abkommen ein Protektionsinstrument der Industrieländer dar?, Juli 2004
Nr. 31: Hafner, Kurt: Industrial Agglomeration and Economic Development, Juni 2004
Nr. 30: Martinez-Zarzoso, Inmaculada; Nowak-Lehmann D., Felicitas: MERCOSUR-European Union Trade: How Important is EU Trade Liberalisation for MERCOSUR’s Exports?, Juni 2004
Nr. 29: Birk, Angela; Michaelis, Jochen: Employment- and Growth Effects of Tax Reforms, Juni 2004
Nr. 28: Broll, Udo; Hansen, Sabine: Labour Demand and Exchange Rate Volatility, Juni 2004
Nr. 27: Bofinger, Peter; Mayer, Eric: Monetary and Fiscal Policy Interaction in the Euro Area with different assumptions on the Phillips curve, Juni 2004
Nr. 26: Torlak, Elvisa: Foreign Direct Investment, Technology Transfer and Productivity Growth in Transition Countries, Juni 2004
Nr. 25: Lorz, Oliver; Willmann, Gerald: On the Endogenous Allocation of Decision Powers in Federal Structures, Juni 2004
Nr. 24: Felbermayr, Gabriel J.: Specialization on a Technologically Stagnant Sector Need Not Be Bad for Growth, Juni 2004
Nr. 23: Carlberg, Michael: Monetary and Fiscal Policy Interactions in the Euro Area, Juni 2004
Nr. 22: Stähler, Frank: Market Entry and Foreign Direct Investment, Januar 2004
Nr. 21: Bester, Helmut; Konrad, Kai A.: Easy Targets and the Timing of Conflict, Dezember 2003
Nr. 20: Eckel, Carsten: Does globalization lead to specialization, November 2003
Nr. 19: Ohr, Renate; Schmidt, André: Der Stabilitäts- und Wachstumspakt im Zielkonflikt zwischen fiskalischer Flexibilität und Glaubwürdigkeit: Ein Reform-ansatz unter Berücksichtigung konstitutionen- und institutionenökonomischer Aspekte, August 2003
Nr. 18: Ruehmann, Peter: Der deutsche Arbeitsmarkt: Fehlentwicklungen, Ursachen und Reformansätze, August 2003
Nr. 17: Suedekum, Jens: Subsidizing Education in the Economic Periphery: Another Pitfall of Regional Policies?, Januar 2003
Nr. 16: Graf Lambsdorff, Johann; Schinke, Michael: Non-Benevolent Central Banks, Dezember 2002
Nr. 15: Ziltener, Patrick: Wirtschaftliche Effekte des EU-Binnenmarktprogramms, November 2002
Nr. 14: Haufler, Andreas; Wooton, Ian: Regional Tax Coordination and Foreign Direct Investment, November 2001
Nr. 13: Schmidt, André: Non-Competition Factors in the European Competition Policy: The Necessity of Institutional Reforms, August 2001
Nr. 12: Lewis, Mervyn K.: Risk Management in Public Private Partnerships, Juni 2001
Nr. 11: Haaland, Jan I.; Wooton, Ian: Multinational Firms: Easy Come, Easy Go?, Mai 2001
Nr. 10: Wilkens, Ingrid: Flexibilisierung der Arbeit in den Niederlanden: Die Entwicklung atypischer Beschäftigung unter Berücksichtigung der Frauenerwerbstätigkeit, Januar 2001
Nr. 9: Graf Lambsdorff, Johann: How Corruption in Government Affects Public Welfare – A Review of Theories, Januar 2001
Nr. 8: Angermüller, Niels-Olaf: Währungskrisenmodelle aus neuerer Sicht, Oktober 2000
Nr. 7: Nowak-Lehmann, Felicitas: Was there Endogenous Growth in Chile (1960-1998)? A Test of the AK model, Oktober 2000
Nr. 6: Lunn, John; Steen, Todd P.: The Heterogeneity of Self-Employment: The Example of Asians in the United States, Juli 2000
Nr. 5: Güßefeldt, Jörg; Streit, Clemens: Disparitäten regionalwirtschaftlicher Entwicklung in der EU, Mai 2000
Nr. 4: Haufler, Andreas: Corporate Taxation, Profit Shifting, and the Efficiency of Public Input Provision, 1999
Nr. 3: Rühmann, Peter: European Monetary Union and National Labour Markets, September 1999
Nr. 2: Jarchow, Hans-Joachim: Eine offene Volkswirtschaft unter Berücksichtigung des Aktienmarktes, 1999
Nr. 1: Padoa-Schioppa, Tommaso: Reflections on the Globalization and the Europeanization of the Economy, Juni 1999
Alle bisher erschienenen Diskussionspapiere zum Download finden Sie im Internet unter: http://www.uni-goettingen.de/de/60920.html.