Homicides in Ohio 2000 - 2012 · This report was supported by Award #2013-BJ-CX-K005, ... provide...
28
HOMICIDES IN OHIO 2000-2012 Ohio Office of Criminal Justice Services 1970 West Broad Street Columbus, OH 43223 Toll-Free: (800) 448-4842 Telephone: (614) 466-7782 Fax: (614) 728-8330 www.ocjs.ohio.gov This report was supported by Award #2013-BJ-CX-K005, 2012 State Justice Program, awarded by the Bureau of Justice Statistics, Office of Justice Programs, Department of Justice.
-
Upload
trannguyet -
Category
Documents
-
view
215 -
download
0
Transcript of Homicides in Ohio 2000 - 2012 · This report was supported by Award #2013-BJ-CX-K005, ... provide...

HOMICIDES IN OHIO 2000-2012
Ohio Office of Criminal Justice Services 1970 West Broad Street Columbus, OH 43223 Toll-Free: (800) 448-4842 Telephone: (614) 466-7782 Fax: (614) 728-8330 www.ocjs.ohio.gov
This report was supported by Award #2013-BJ-CX-K005, 2012 State Justice Program, awarded by the Bureau of Justice Statistics, Office of Justice Programs,
Department of Justice.
1
Since 1930, the Federal Bureau of Investigation (FBI) has annually collected data on crime in the United
States through its Uniform Crime Reporting (UCR) Program. The UCR Program collects only those data
that come to the attention of law enforcement through victim reports or observation. Reporting is
voluntary for law enforcement agencies active in the UCR Program.
Data are collected on the eight Index offenses of murder, forcible rape, robbery, aggravated assault,
burglary, larceny-theft, motor vehicle theft, and arson. In addition to collecting summary data on the
eight Index crimes, the FBI collects detailed data on homicides. Supplementary Homicide Reports (SHR)
provide incident-based information on criminal homicides, including information describing the
victim(s), the offender(s), the relationship between victim and offender, when the incident occurred, the
weapon used, and the circumstances leading to the homicide incident. Law enforcement agencies in
Ohio voluntarily report SHR data directly to the Federal Bureau of Investigation as part of the UCR
Program.
The following report is based on Ohio homicides reported by law enforcement to the FBI from 2000 to
2012. Unless otherwise stated, data come from SHR.
2
Table of Contents
Part I: Homicides in Ohio and the U.S.
Homicides Rates in Ohio and the U.S…………………………………………………………………………………………. 3
U.S. Regional Homicide Rates……………………………………………………………………………………………………. 4
Part II: Homicides in Ohio 2000-2012
Number of Homicide Incidents………………………………………………………………………………………………….. 5
Monthly Homicide Incident Occurrences………………………………………………………………………………….. 6
Homicide Incident Victims…………………………………………………………………………………………………………. 7
Victim Gender ……………………………………………………………………………………………………………... 7
Victim Age…………………………………………………………………………………………………………………….. 8
Victim Race…………………………………………………………………………………………………………………. 10
Homicide Incident Offenders………………………………………………………………………………………………….. 12
Offender Gender………………………………………………………………………………………………………… 12
Offender Age………………………………………………………………………………………………………………. 13
Offender Race…………………………………………………………………………………………………………….. 15
Characteristics of Victim-Offender Relationship……………………………………………………………………. 17
Weapons Used in Homicide Incidents……………………………………………………………………………………… 21
Part III: Ohio Homicide Incidents by City
Homicide Incidents by City……………………………………………………………………………………………………. 23
Ohio Homicide Incidents by City: Victims’ Gender and Race……………………………………….. 25
Ohio Homicide Incidents by City: Offenders’ Gender and Race…….…………………………… 26
Ohio Homicide Incidents by City: Characteristics of Victim-Offender Relationship..……. 27

3
Part I: Homicides in Ohio and the U.S.
Homicides in Ohio and the U.S. 2000-2012
Homicides in Ohio occurred at a rate of between four and five per 100,000 population. Over the past 30
years both the numbers and rate of homicides has fluctuated. Highs occurred in the late 1970s and early
1980s and again in the early-1990s. While homicides in recent years are lower than in the past decades,
there was a slight upswing in the early 2000s and since 2006, the rate continues to decrease.
A comparison of Ohio’s homicide rate to that of the U.S. suggests that Ohio is not unique with regard to this crime. Ohio’s Homicide rate patterns vary similarly to that of the U.S., although at a lower rate. The rates do show a convergence, however.
Source: FBI’s Crime in the United States, 1979-2012
Source: FBI’s Crime in the United States, 1979-2012
0
2
4
6
8
10
12
1979 1983 1987 1991 1995 1999 2003 2007 2011Rat
e p
er
10
0,0
00
po
pu
lati
on
Homicides in the U.S. and Ohio 1979-2012
U.S. Ohio
0
200
400
600
800
1000
1979 1983 1987 1991 1995 1999 2003 2007 2011
Tota
l Nu
mb
er
of
Ho
mic
ide
s
Homicides in Ohio 1979-2012
4
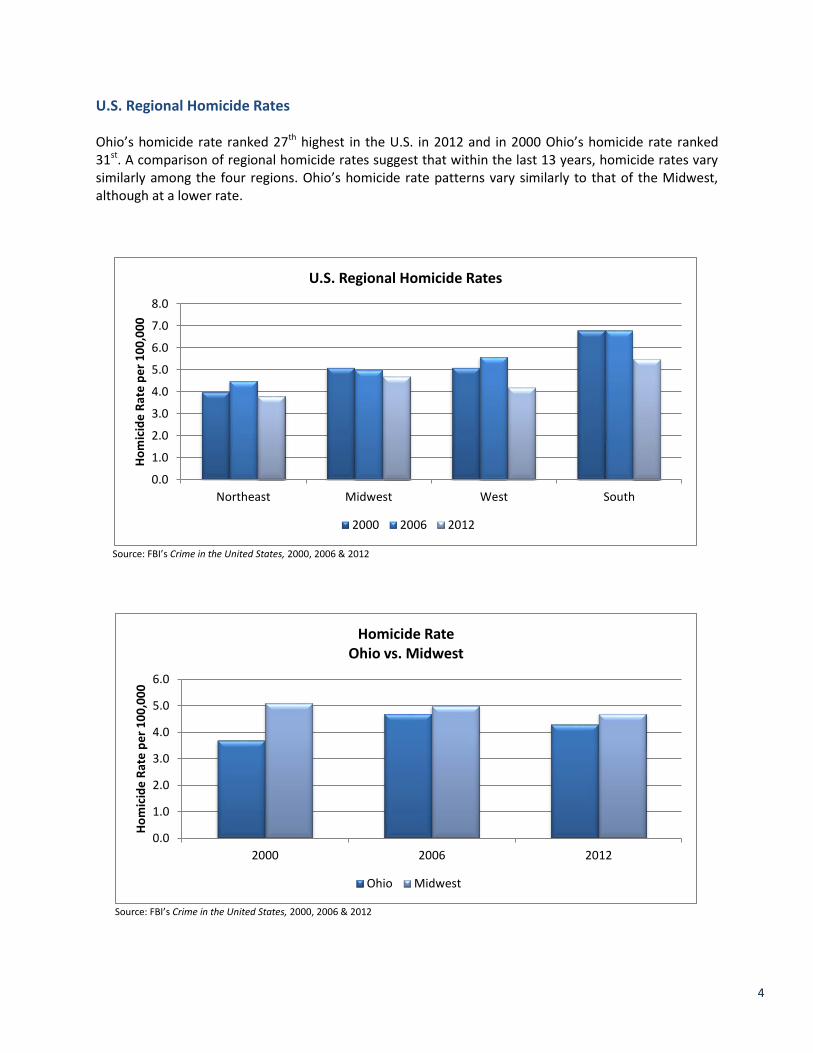
U.S. Regional Homicide Rates
Ohio’s homicide rate ranked 27th highest in the U.S. in 2012 and in 2000 Ohio’s homicide rate ranked 31st. A comparison of regional homicide rates suggest that within the last 13 years, homicide rates vary similarly among the four regions. Ohio’s homicide rate patterns vary similarly to that of the Midwest, although at a lower rate.
Source: FBI’s Crime in the United States, 2000, 2006 & 2012
Source: FBI’s Crime in the United States, 2000, 2006 & 2012
0.0
1.0
2.0
3.0
4.0
5.0
6.0
7.0
8.0
Northeast Midwest West South
Ho
mic
ide
Rat
e p
er
10
0,0
00
U.S. Regional Homicide Rates
2000 2006 2012
0.0
1.0
2.0
3.0
4.0
5.0
6.0
2000 2006 2012
Ho
mic
ide
Rat
e p
er
10
0,0
00
Homicide Rate Ohio vs. Midwest
Ohio Midwest
5
From 2000 to 2012, Ohio law enforcement agencies reported a total of 6,622 homicides to the FBI in its annual Crime in the United States publication. In the FBI’s Supplementary Homicide Report (SHR), 6,346 homicides were reported. This discrepancy can occur when one data reporting deadline is earlier or later than another reporting deadline or when the SHR form, which is separate, is not completed by the law enforcement agency. Given the more complete information provided in the SHR, this report is based on data of the 6,346 homicides.
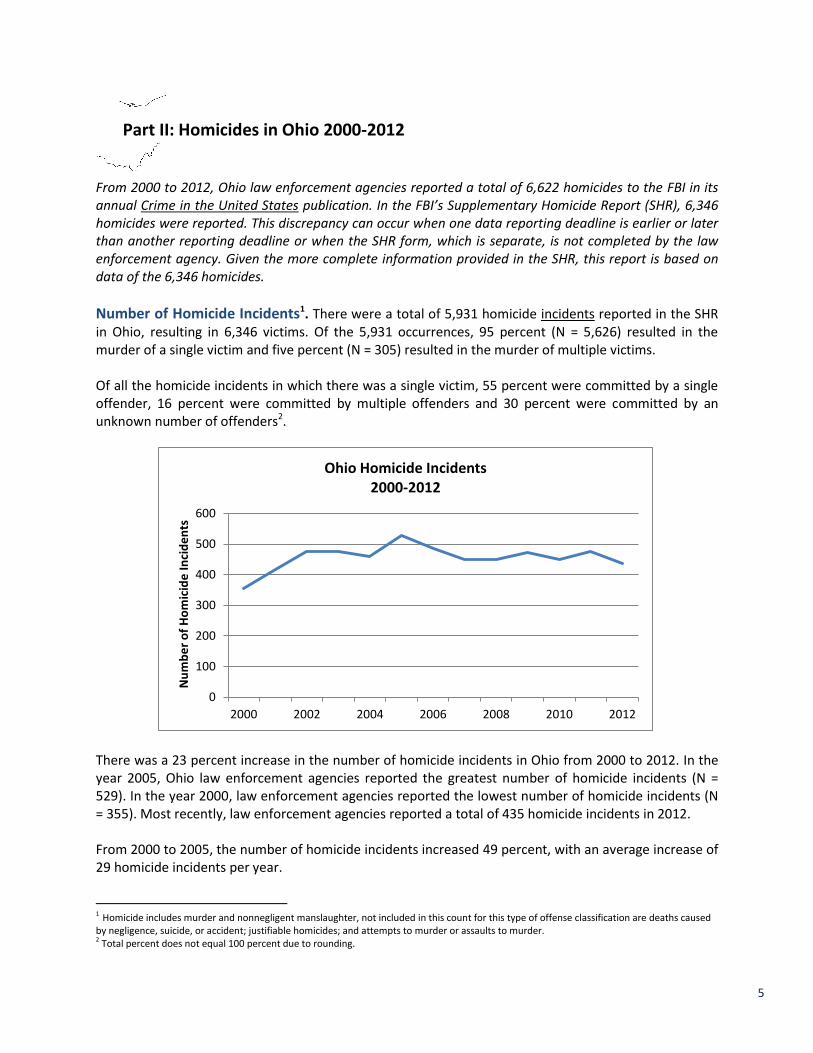
Number of Homicide Incidents1. There were a total of 5,931 homicide incidents reported in the SHR in Ohio, resulting in 6,346 victims. Of the 5,931 occurrences, 95 percent (N = 5,626) resulted in the murder of a single victim and five percent (N = 305) resulted in the murder of multiple victims. Of all the homicide incidents in which there was a single victim, 55 percent were committed by a single offender, 16 percent were committed by multiple offenders and 30 percent were committed by an unknown number of offenders2.
There was a 23 percent increase in the number of homicide incidents in Ohio from 2000 to 2012. In the year 2005, Ohio law enforcement agencies reported the greatest number of homicide incidents (N = 529). In the year 2000, law enforcement agencies reported the lowest number of homicide incidents (N = 355). Most recently, law enforcement agencies reported a total of 435 homicide incidents in 2012. From 2000 to 2005, the number of homicide incidents increased 49 percent, with an average increase of 29 homicide incidents per year.
1 Homicide includes murder and nonnegligent manslaughter, not included in this count for this type of offense classification are deaths caused by negligence, suicide, or accident; justifiable homicides; and attempts to murder or assaults to murder. 2 Total percent does not equal 100 percent due to rounding.
0
100
200
300
400
500
600
2000 2002 2004 2006 2008 2010 2012
Nu
mb
er
of
Ho
mic
ide
In
cid
en
ts
Ohio Homicide Incidents 2000-2012
Part II: Homicides in Ohio 2000-2012

6
Monthly Homicide Incident Occurrences The summer and fall months of July, August, September and October had the largest number of homicide incidents, accounting for about 36 percent of all reported homicide incidents from 2000 to 2012. In each of the 13 years, the summer and fall months showed the highest number of homicide incidents.
Total Number of Homicide Incidents in Ohio, by Month per Year
2000 2001 2002 2003 2004 2005 2006 2007 2008 2009 2010 2011 2012 TOTAL
January 26 31 52 36 42 46 42 41 29 47 27 37 39 495
February 31 17 41 35 32 36 33 31 24 27 28 27 25 387
March 32 27 43 47 40 37 42 36 40 31 54 42 33 504
April 30 33 45 36 42 32 37 33 37 32 46 42 38 483
May 27 33 37 28 34 47 33 31 35 46 29 34 45 459
June 26 37 29 32 31 48 37 39 40 42 41 36 40 478
July 28 48 33 39 40 56 43 48 49 46 43 40 42 555
August 39 42 42 41 40 59 49 35 51 32 42 44 34 550
September 27 33 31 52 52 50 40 38 42 31 35 50 31 512
October 36 31 37 34 30 48 48 43 40 53 46 47 37 530
November 26 45 42 38 35 43 41 40 32 35 27 37 46 487
December 27 39 45 58 42 27 40 36 31 48 32 41 25 491
TOTAL 355 416 477 476 460 529 485 451 450 470 450 477 435 5931
0
100
200
300
400
500
600
Jan Feb Mar Apr May Jun Jul Aug Sep Oct Nov Dec
Nu
mb
er
of
Ho
mic
ide
In
cid
en
ts
Total Number of Homicide Incidents in Ohio, by Month 2000-2012

7
Homicide Incident Victims
The following data were reported for the victims for whom all or some demographic information was available. There are some incidents in which little or no demographic data, such as age, gender, or race data, were available for the victims. This data covers the years 2000 to 2012.
Victim Gender Of the victims whose genders were identified, 76 percent (N = 4,813) were male and 24 percent (N = 1,490) were female. Over the last 13 years, on average, there have been 3 times as many male victims of homicide as female victims of homicide.
The number of male and female homicide victims peaked in 2005, with a total number of 421 male victims and 136 female victims. From 2000 to 2012, the number of male victims increased 36%. The number of female homicide victims has remained relatively steady over this 13 year period.
0
50
100
150
200
250
300
350
400
450
2000 2002 2004 2006 2008 2010 2012
Tota
l Nu
mb
er
of
Vic
tim
s
Male & Female Homicide Victims 2000-2012
Male Female

8
Victim Age Of the homicide victims whose ages were reported, certain age groups appeared to be more frequent targets of homicide than others. Thirty-eight percent (N = 2,381) were between the ages of 18 and 29 years old. Across each year, the 18-29 age group had the highest number of homicide victims. Overall, the average age of homicide victims was 33 years. The average age of victims remained fairly consistent over the last 13 years, with the average age being between 32 and 353.
There were a total of 859 (14%) victims of homicide between zero (newborn) and 18 years. Of those 859 homicide victims, 385 (45%) were between the ages of 16 and 18 years and 310 (36%) were between the ages of zero and five. Of the homicide victims in the zero to five age group, 109 (35%) were under one year of age and 240 (77%) were between the ages of zero and two years.
3 To calculate the mean age of the victims, newborns (birth to one week old) and babies (one week to 12 months old) ages were converted to
one year.
0
200
400
600
800
1000
1200
1400
0-5 6-11 12-17 18-23 24-29 30-35 36-41 42-47 48-53 54-59 60-65 66-71 72+
Nu
mb
er
of
Vic
tim
s
Homicide Victims by Age Range 2000-2012
9
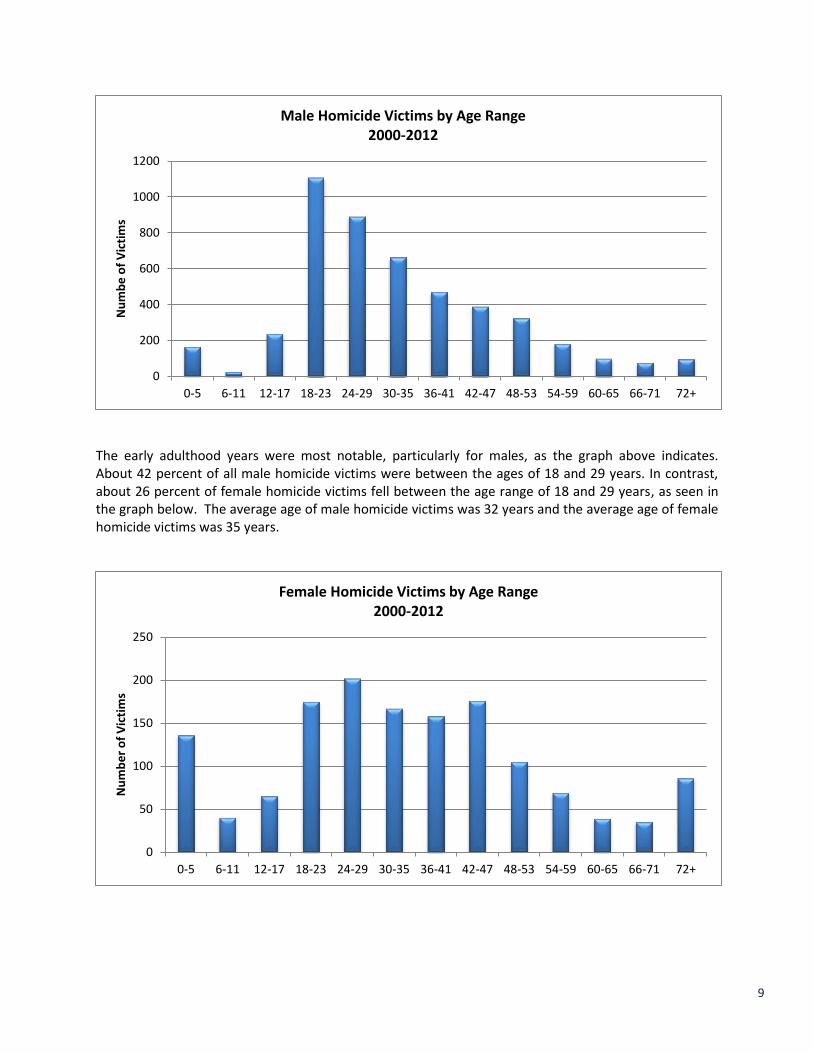
The early adulthood years were most notable, particularly for males, as the graph above indicates. About 42 percent of all male homicide victims were between the ages of 18 and 29 years. In contrast, about 26 percent of female homicide victims fell between the age range of 18 and 29 years, as seen in the graph below. The average age of male homicide victims was 32 years and the average age of female homicide victims was 35 years.
0
200
400
600
800
1000
1200
0-5 6-11 12-17 18-23 24-29 30-35 36-41 42-47 48-53 54-59 60-65 66-71 72+
Nu
mb
e o
f V
icti
ms
Male Homicide Victims by Age Range 2000-2012
0
50
100
150
200
250
0-5 6-11 12-17 18-23 24-29 30-35 36-41 42-47 48-53 54-59 60-65 66-71 72+
Nu
mb
er
of
Vic
tim
s
Female Homicide Victims by Age Range 2000-2012
10
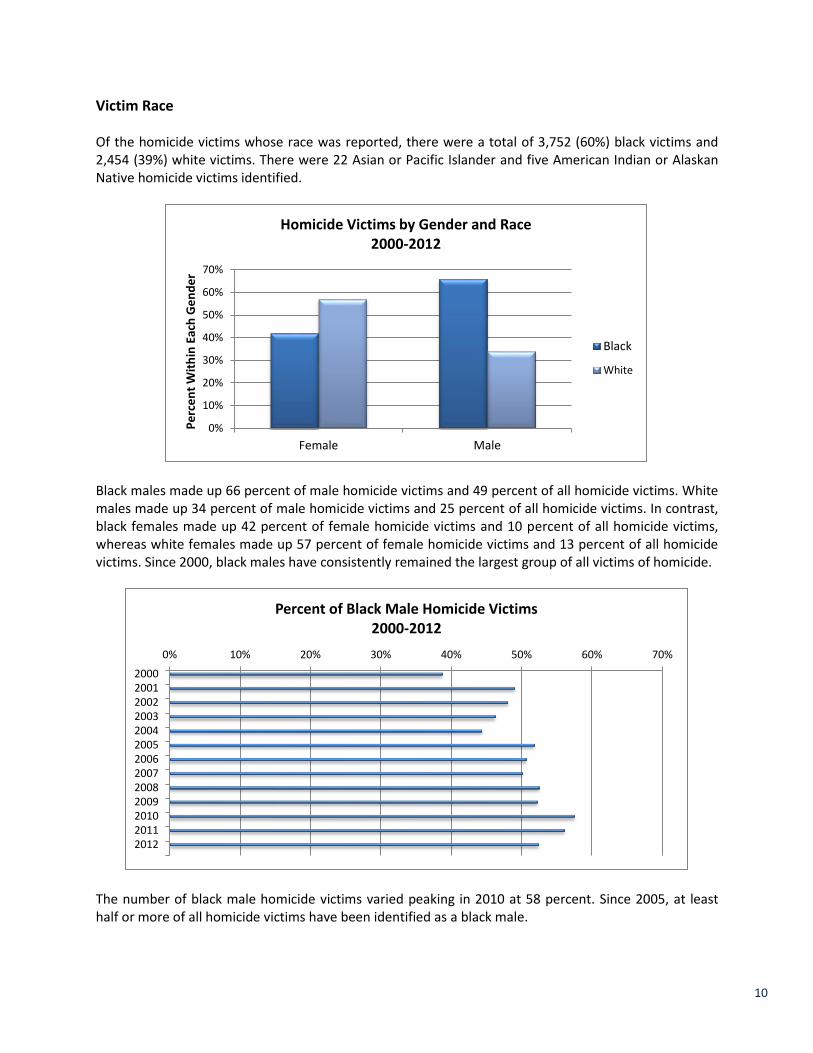
Victim Race Of the homicide victims whose race was reported, there were a total of 3,752 (60%) black victims and 2,454 (39%) white victims. There were 22 Asian or Pacific Islander and five American Indian or Alaskan Native homicide victims identified.
Black males made up 66 percent of male homicide victims and 49 percent of all homicide victims. White males made up 34 percent of male homicide victims and 25 percent of all homicide victims. In contrast, black females made up 42 percent of female homicide victims and 10 percent of all homicide victims, whereas white females made up 57 percent of female homicide victims and 13 percent of all homicide victims. Since 2000, black males have consistently remained the largest group of all victims of homicide.
The number of black male homicide victims varied peaking in 2010 at 58 percent. Since 2005, at least half or more of all homicide victims have been identified as a black male.
0%
10%
20%
30%
40%
50%
60%
70%
Female Male
Pe
rce
nt
Wit
hin
Eac
h G
en
de
r
Homicide Victims by Gender and Race 2000-2012
Black
White
0% 10% 20% 30% 40% 50% 60% 70%
2000200120022003200420052006200720082009201020112012
Percent of Black Male Homicide Victims 2000-2012
11
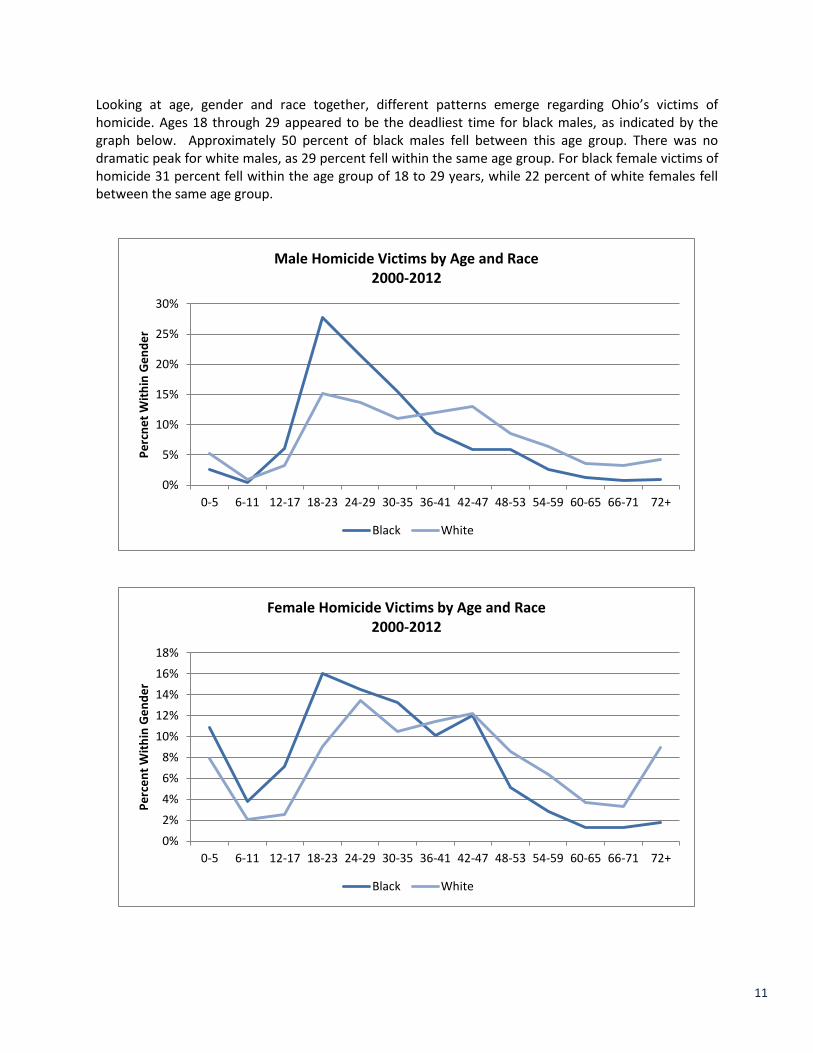
Looking at age, gender and race together, different patterns emerge regarding Ohio’s victims of homicide. Ages 18 through 29 appeared to be the deadliest time for black males, as indicated by the graph below. Approximately 50 percent of black males fell between this age group. There was no dramatic peak for white males, as 29 percent fell within the same age group. For black female victims of homicide 31 percent fell within the age group of 18 to 29 years, while 22 percent of white females fell between the same age group.
0%
5%
10%
15%
20%
25%
30%
0-5 6-11 12-17 18-23 24-29 30-35 36-41 42-47 48-53 54-59 60-65 66-71 72+
Pe
rcn
et
Wit
hin
Ge
nd
er
Male Homicide Victims by Age and Race 2000-2012
Black White
0%
2%
4%
6%
8%
10%
12%
14%
16%
18%
0-5 6-11 12-17 18-23 24-29 30-35 36-41 42-47 48-53 54-59 60-65 66-71 72+
Pe
rce
nt
Wit
hin
Ge
nd
er
Female Homicide Victims by Age and Race 2000-2012
Black White

12
Homicide Incident Offenders Demographically, Ohio’s homicide offenders were similar to Ohio’s homicide victims. The following 2000 to 2012 data are reported only for those offenders for whom all or some demographic information was available.
Offender Gender Male homicide offenders outnumbered female homicide offenders nearly eight to one. There were 4,809 male homicide offenders and 634 female homicide offenders. The number of reported male homicide offenders peaked in 2005, with a total number of 428 and again in 2009 with the same number of offenders.
From 2000 to 2005, the number of identified male homicide offenders increased 78 percent. Due to the low number of female homicide offenders, no patterns based on gender were identifiable.
0
50
100
150
200
250
300
350
400
450
2000 2002 2004 2006 2008 2010 2012
Tota
l Nu
mb
er
of
Off
en
de
rs
Male & Female Homicide Offenders 2000-2012
Male Female

13
Offender Age Of the homicide offenders whose ages were reported, 54 percent (N = 2,755) were between the ages of 18 and 29 years old. The average age for homicide offenders in Ohio was 29 years.
Sixty-seven percent of homicide victims between the ages of 18 and 29 were killed by an offender between the same age ranges. This has remained fairly consistent over the past 13 years, with the highest peaking at 73 percent in 2009 and the lowest at 62 percent in 2000. Twenty-five percent of offenders were known non-family members of the victim within this same age range. Of the known non-family members, 80 percent of offenders were identified as an acquaintance to the victim.
0
200
400
600
800
1000
1200
1400
1600
1800
6-11 12-17 18-23 24-29 30-35 36-41 42-47 48-53 54-59 60-65 66-71 72+
Nu
mb
er
of
Off
en
de
rs
Homicide Offenders by Age Range 2000-2012
0%
5%
10%
15%
20%
25%
30%
35%
2000 2002 2004 2006 2008 2010 2012
Pe
rce
nt
of
Off
en
de
rs
Homicide Offenders Ages 18-29 with Victims Ages 18-29 2000-2012

14
Similar to Ohio’s homicide victims, early adulthood years were most notable, particularly for males, as the graph above indicates. About 55 percent of all male homicide offenders were between the ages of 18 and 29 years. In contrast, about 46 percent of female homicide offenders fell between the age range of 18 and 29 years, as seen in the graph below. The average age of male homicide offenders was 29 years and the average age of female homicide offenders was 31 years.
0
200
400
600
800
1000
1200
1400
1600
1800
6-11 12-17 18-23 24-29 30-35 36-41 42-47 48-53 54-59 60-65 66-71 72+
Nu
mb
er
of
Off
en
de
rs
Male Homicide Offenders by Age Range 2000-2012
0
20
40
60
80
100
120
140
160
180
6-11 12-17 18-23 24-29 30-35 36-41 42-47 48-53 54-59 60-65 66-71 72+
Nu
mb
er
of
Off
en
de
rs
Female Homicide Offenders by Age Range 2000-2012
15
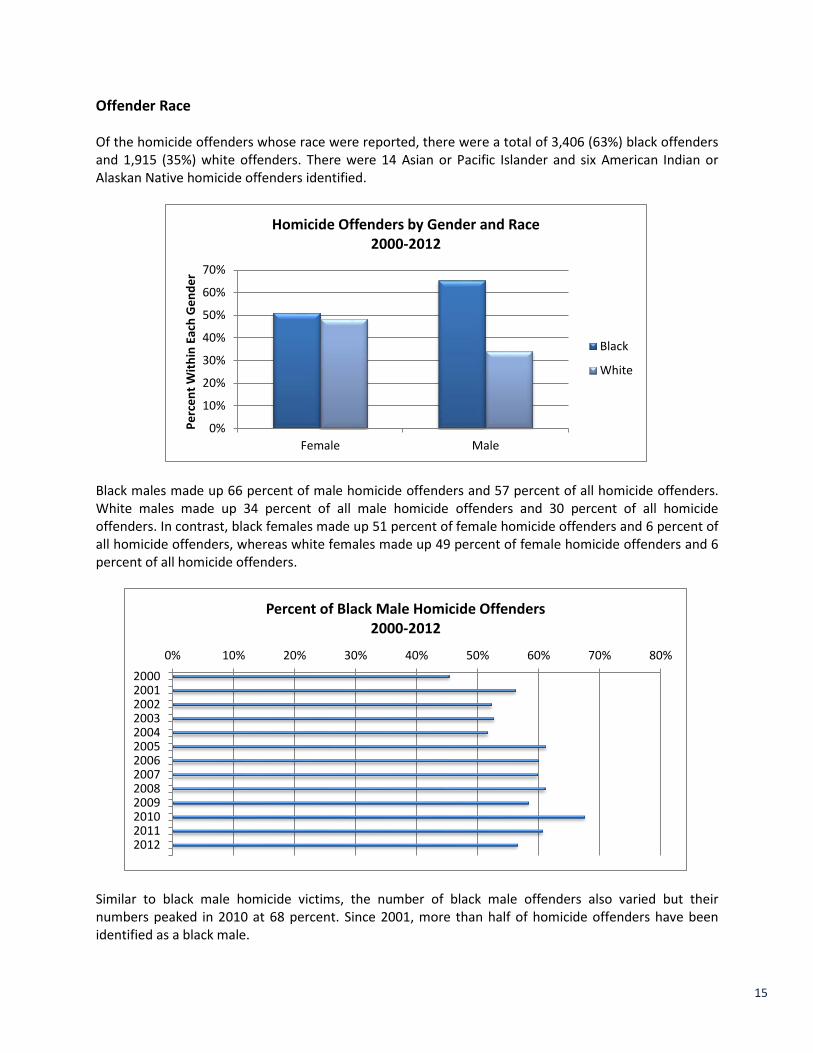
Offender Race Of the homicide offenders whose race were reported, there were a total of 3,406 (63%) black offenders and 1,915 (35%) white offenders. There were 14 Asian or Pacific Islander and six American Indian or Alaskan Native homicide offenders identified.
Black males made up 66 percent of male homicide offenders and 57 percent of all homicide offenders. White males made up 34 percent of all male homicide offenders and 30 percent of all homicide offenders. In contrast, black females made up 51 percent of female homicide offenders and 6 percent of all homicide offenders, whereas white females made up 49 percent of female homicide offenders and 6 percent of all homicide offenders.
Similar to black male homicide victims, the number of black male offenders also varied but their numbers peaked in 2010 at 68 percent. Since 2001, more than half of homicide offenders have been identified as a black male.
0%
10%
20%
30%
40%
50%
60%
70%
Female Male
Pe
rce
nt
Wit
hin
Eac
h G
en
de
r
Homicide Offenders by Gender and Race 2000-2012
Black
White
0% 10% 20% 30% 40% 50% 60% 70% 80%
2000200120022003200420052006200720082009201020112012
Percent of Black Male Homicide Offenders 2000-2012

16
Looking at age, gender and race together, different patterns emerge regarding Ohio’s offenders of homicide. Ages 18 through 29 shows the most number of black male homicide offenders, as indicated by the dramatic peak in the graph below. Approximately 63 percent of black males fell between this age group. There was also a less dramatic peak for white males, as 42 percent fell within the same age group. Black females also saw a similar increase for the same age range; approximately 52 percent fell within this age range of 18-29, while 41 percent of white females fell within this same rage.
0%
5%
10%
15%
20%
25%
30%
35%
40%
45%
6-11 12-17 18-23 24-29 30-35 36-41 42-47 48-53 54-59 60-65 66-71 72+
Pe
rce
nt
Wit
hin
Ge
nd
er
Male Homicide Offenders by Age and Race 2000-2012
Black White
0%
5%
10%
15%
20%
25%
30%
6-11 12-17 18-23 24-29 30-35 36-41 42-47 48-53 54-59 60-65 66-71 72+
Pe
rce
nt
Wit
hin
Ge
nd
er
Female Homicide Offenders by Age and Race 2000-2012
Black White

17
Characteristics of Victim-Offender Relationship The majority of homicide victims (81%) knew their offender, either as a family member, an acquaintance, or an intimate/former intimate partner. Given that most homicides involve an offender known to the victim, clear patterns of gender and racial relationships are also found between victims and their offenders. The following 2000 to 2012 statistics were obtained from those incidents in which relationship information could be determined.
Victim-Offender Gender Eighty-eight percent of female homicides and 90 percent of male homicides were perpetrated by a male offender. Since 2000, more than 80 percent of male victims were killed by a male offender. Across all male and female homicides, about 11 percent were perpetrated by a female offender.
Gender Relationship between Victim and Offender
Female Offender Male Offender Female Victim 12% 88% Male Victim 10% 90%
0%
10%
20%
30%
40%
50%
60%
70%
80%
90%
2000 2002 2004 2006 2008 2010 2012
Pe
rce
nt
of
Ho
mic
ide
Vic
tim
s
Relationship between Male Offenders and Homicide Victims 2000-2012
Female Victims Male Victims
18
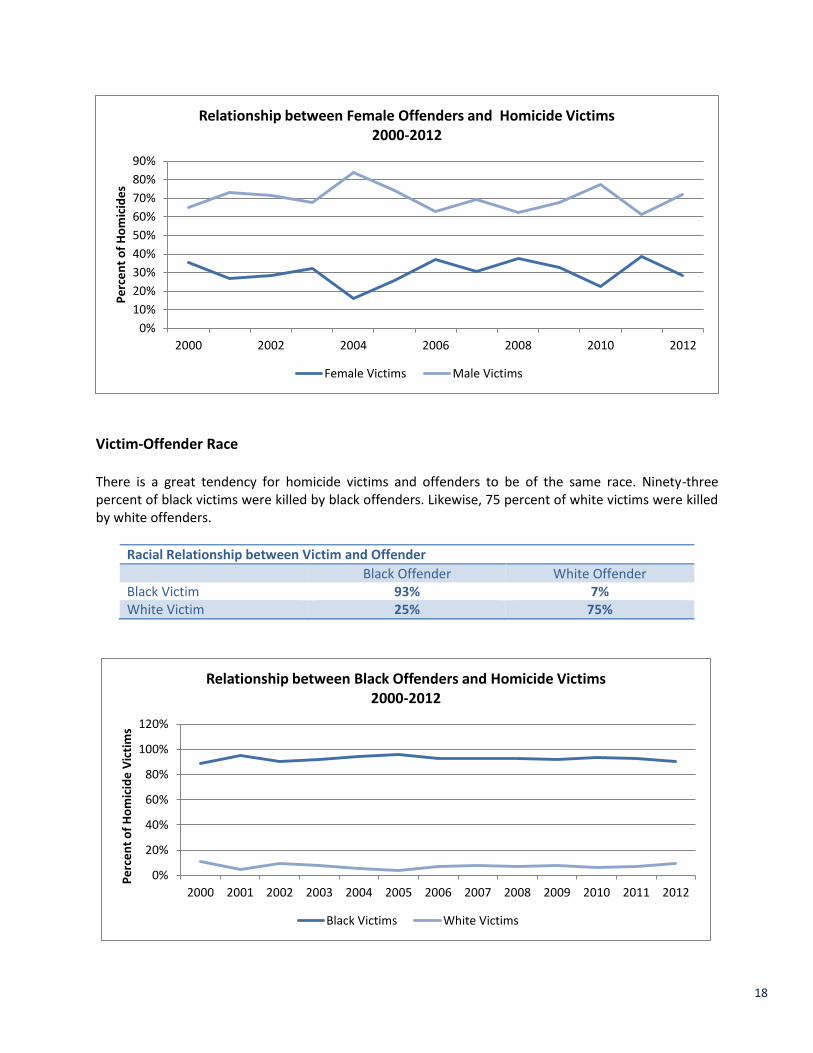
Victim-Offender Race There is a great tendency for homicide victims and offenders to be of the same race. Ninety-three percent of black victims were killed by black offenders. Likewise, 75 percent of white victims were killed by white offenders.
Racial Relationship between Victim and Offender
Black Offender White Offender Black Victim 93% 7% White Victim 25% 75%
0%
10%
20%
30%
40%
50%
60%
70%
80%
90%
2000 2002 2004 2006 2008 2010 2012
Pe
rce
nt
of
Ho
mic
ide
s Relationship between Female Offenders and Homicide Victims
2000-2012
Female Victims Male Victims
0%
20%
40%
60%
80%
100%
120%
2000 2001 2002 2003 2004 2005 2006 2007 2008 2009 2010 2011 2012
Pe
rce
nt
of
Ho
mic
ide
Vic
tim
s
Relationship between Black Offenders and Homicide Victims 2000-2012
Black Victims White Victims

19
Single Victim-Single Offender Incidents Ninety-five percent of homicide incidents involved a single victim. Of these, 55 percent involved a single identified offender. Sixteen percent were committed by multiple offenders. Thirty percent were committed by an unknown4 offender. The single victim-single offender data were analyzed to gain a better understanding of the relationship between victim and offender. Of the single victim-single offender incidents for which relationship data were known, the overwhelming proportion of offenders were known to the victim. As the following graph shows, only 10 percent of homicide offenders were identified as being strangers. For 86 percent homicides, for which relationship data was available, the victim knew the offender and often the perpetrator was a known non-family member or an intimate/former intimate partner5.
4 Note the distinction between ‘unknown’ and ‘stranger’. ‘Unknown’ means that there is no information on the relationship between victim and offender. ‘Stranger’ means that the victim and offender did not know each other. 5 Individuals are placed in only one category. For the purposes of this document, ‘intimate or former intimate’ refers to husband, wife,
boyfriend, girlfriend, ex-husband, ex-wife, common-law husband, common-law wife and homosexual relationship.
0%
10%
20%
30%
40%
50%
60%
70%
80%
90%
2000 2001 2002 2003 2004 2005 2006 2007 2008 2009 2010 2011 2012
Pe
rdce
nt
of
Ho
mic
ide
Vic
tim
s Relationship between White Offenders and Homicide Victims
2000-2012
Black Victims White Victims

20
That the victim knew the offender was especially true for female victims. Of the single victim-single offender incidents in which the relationship was known, six percent of females (out of all female victims) were murdered by someone identified as a stranger, compared to 22 percent of male victims (out of all male victims). Additionally, 31 percent of females were murdered by an intimate partner or former intimate partner, in contrast to three percent of male victims.
Family 11%
Known non- family 34%
Intimate or former intimate
16%
Stranger 10%
Unknown 29%
Relationship of Victim to Offender Single Victim-Single Offender Data
0%
10%
20%
30%
40%
50%
60%
70%
Family Known non-family
Intimate orformer intimate
Stranger Unknown
Pe
rce
nt
Wit
hin
Eac
h G
en
de
r
Victim-Offender Relationship (Victim was __ to Offender)
Female Victims Male Victims
21
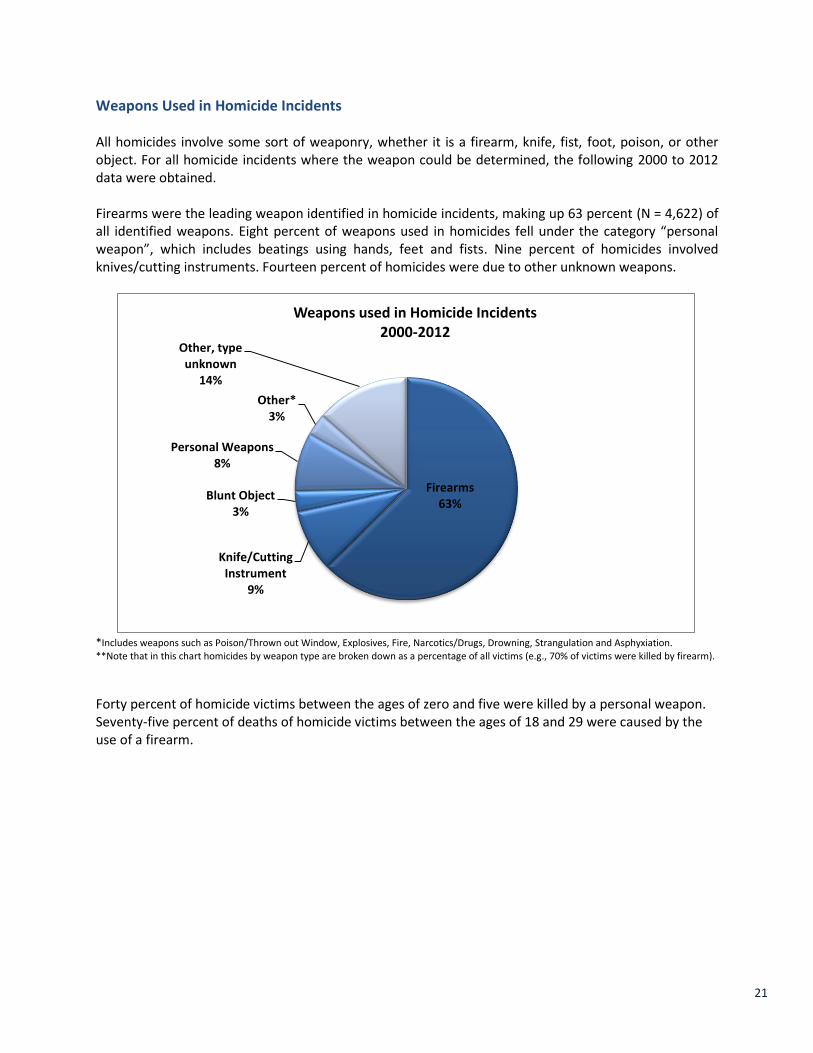
Weapons Used in Homicide Incidents All homicides involve some sort of weaponry, whether it is a firearm, knife, fist, foot, poison, or other object. For all homicide incidents where the weapon could be determined, the following 2000 to 2012 data were obtained. Firearms were the leading weapon identified in homicide incidents, making up 63 percent (N = 4,622) of all identified weapons. Eight percent of weapons used in homicides fell under the category “personal weapon”, which includes beatings using hands, feet and fists. Nine percent of homicides involved knives/cutting instruments. Fourteen percent of homicides were due to other unknown weapons.
*Includes weapons such as Poison/Thrown out Window, Explosives, Fire, Narcotics/Drugs, Drowning, Strangulation and Asphyxiation. **Note that in this chart homicides by weapon type are broken down as a percentage of all victims (e.g., 70% of victims were killed by firearm).
Forty percent of homicide victims between the ages of zero and five were killed by a personal weapon. Seventy-five percent of deaths of homicide victims between the ages of 18 and 29 were caused by the use of a firearm.
Firearms 63%
Knife/Cutting Instrument
9%
Blunt Object 3%
Personal Weapons 8%
Other* 3%
Other, type unknown
14%
Weapons used in Homicide Incidents 2000-2012

22
The number of firearms used in a homicide peaked in 2011 (N = 463). This is a 114 percent increase in the number of firearms reported since 2000. However, there was a 17 percent decrease in the number of firearms used in a homicide from 2011 to 2012.
Differences in weapon usage emerge as a function of gender. Sixty-five percent of male offenders used a firearm to commit homicide, as opposed to 34 percent of females. Knives and cutting instruments were used by a higher percentage of females than males, although the overall number of homicides committed by females using these weapons remains low.
0
50
100
150
200
250
300
350
400
450
500
2000 2002 2004 2006 2008 2010 2012
Nu
mb
er
of
Fire
arm
s U
sed
Firearms used in Homicides 2000-2012
0%
10%
20%
30%
40%
50%
60%
70%
Firearms Knife/CuttingInstrument
Blunt Object PersonalWeapons
Other* Other, typeunknown
Pe
rce
nt
Wit
hin
Ge
nd
er
Weapon Use by Gender 2000-2012
Female Male

23
Homicide Incidents by City From 2000 to 2012, Ohio’s three largest police departments – Cincinnati, Cleveland and Columbus – reported 48 percent (N = 2,830) of Ohio’s homicide incidents.
As depicted in the chart below, the rate of homicides within these three cities has fluctuated over the past 13 years. The homicide rate of Cincinnati peaked in 2006 at 28.1 homicide incidents per 100,000 population. Columbus has maintained the lowest rate of homicide over this 13 year period in comparison to the other cities.
0
200
400
600
800
1000
1200
Akron Cincinnati Cleveland Columbus Dayton Toledo Youngstown
Nu
mb
er
of
Ho
mic
ide
In
cid
en
ts
Ohio Homicide Incidents by City 2000-2012
0.0
5.0
10.0
15.0
20.0
25.0
30.0
2000 2001 2002 2003 2004 2005 2006 2007 2008 2009 2010 2011 2012
Rat
e p
er
10
0,0
00
po
pu
lati
on
Ohio Homicide Incident Rates by City and State 2000-2012
Cincinnati Cleveland Columbus Ohio
Part III: Ohio Homicide Incidents by City

24
Most significant of the data below is that Cincinnati experienced a 232% increase in the number of homicide incidents from 2000 to 2006. Columbus experienced a 50 percent increase in the number of homicide incidents from 2000 to 2003. Cleveland experienced a 42 percent decrease in the number of homicides between 2005 and 2008. All three cities reported a lower number of homicide incidents in 2012 in comparison to 2011 data.
0
20
40
60
80
100
120
2000 2001 2002 2003 2004 2005 2006 2007 2008 2009 2010 2011 2012
Tota
l Nu
mb
er
of
Ho
mic
ide
Inci
de
nts
Ohio Homicide Incidents by City 2000-2012
Cincinnati Cleveland Columbus
25
Ohio Homicides by City: Victims’ Gender and Race
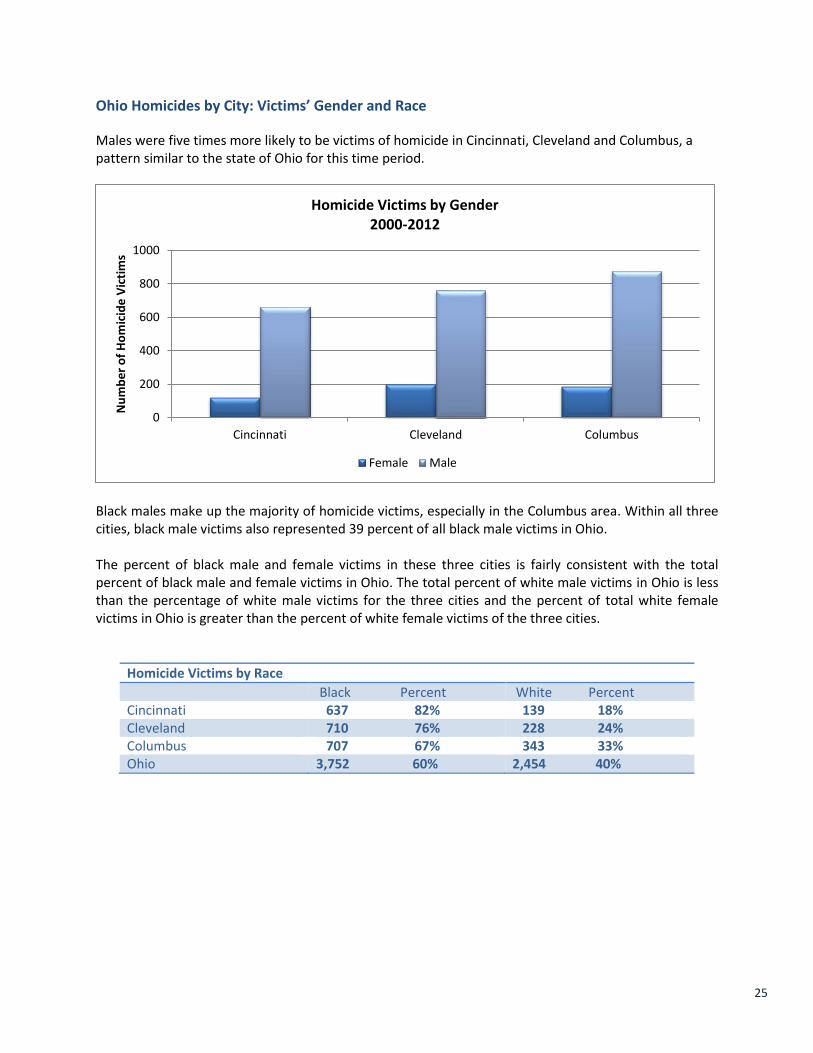
Males were five times more likely to be victims of homicide in Cincinnati, Cleveland and Columbus, a pattern similar to the state of Ohio for this time period.
Black males make up the majority of homicide victims, especially in the Columbus area. Within all three cities, black male victims also represented 39 percent of all black male victims in Ohio. The percent of black male and female victims in these three cities is fairly consistent with the total percent of black male and female victims in Ohio. The total percent of white male victims in Ohio is less than the percentage of white male victims for the three cities and the percent of total white female victims in Ohio is greater than the percent of white female victims of the three cities.
Homicide Victims by Race
Black Percent White Percent Cincinnati 637 82% 139 18% Cleveland 710 76% 228 24% Columbus 707 67% 343 33% Ohio 3,752 60% 2,454 40%
0
200
400
600
800
1000
Cincinnati Cleveland Columbus
Nu
mb
er
of
Ho
mic
ide
Vic
tim
s
Homicide Victims by Gender 2000-2012
Female Male
26
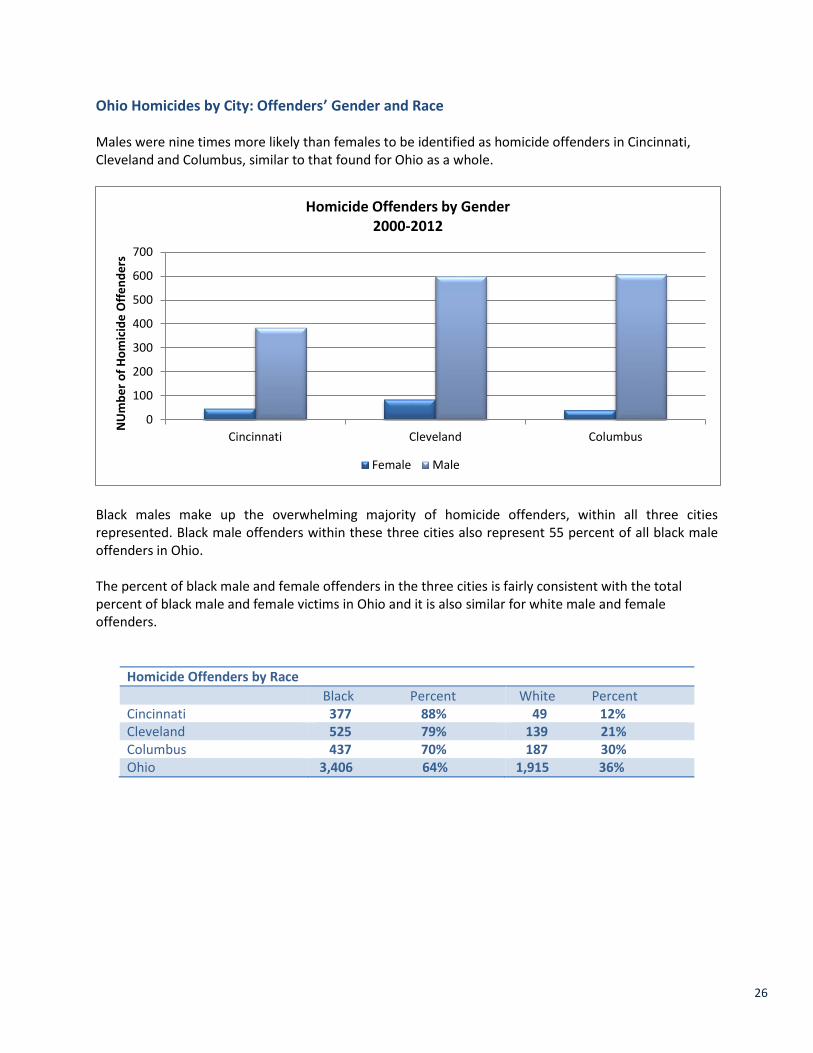
Ohio Homicides by City: Offenders’ Gender and Race Males were nine times more likely than females to be identified as homicide offenders in Cincinnati, Cleveland and Columbus, similar to that found for Ohio as a whole.
Black males make up the overwhelming majority of homicide offenders, within all three cities represented. Black male offenders within these three cities also represent 55 percent of all black male offenders in Ohio. The percent of black male and female offenders in the three cities is fairly consistent with the total percent of black male and female victims in Ohio and it is also similar for white male and female offenders.
Homicide Offenders by Race
Black Percent White Percent Cincinnati 377 88% 49 12% Cleveland 525 79% 139 21% Columbus 437 70% 187 30% Ohio 3,406 64% 1,915 36%
0
100
200
300
400
500
600
700
Cincinnati Cleveland Columbus
NU
mb
er
of
Ho
mic
ide
Off
en
de
rs
Homicide Offenders by Gender 2000-2012
Female Male

27
Ohio Homicides by City: Characteristics of Victim-Offender Relationship
From 2000 to 2012, of the single victim-single offender incidents for which relationship data were known, the overwhelming percent of offenders within these identified cities were known to the victim. For Cleveland and Columbus, in 77 percent of homicides the victim knew the offender and in Cincinnati, 82 percent of victims knew the offender. Often the perpetrator was a known non-family member or intimate/former intimate partner.
0% 10% 20% 30% 40% 50% 60%
Family
Known non-Family
Intimate or Former Intimate
Stranger
Relationship of Victim to Offender Single Victim-Single Offender Data
Columbus Cleveland Cincinnati