Homes for Californians in the New Century Challenges and Opportunities February 7, 2003 Presented by...
86
Homes for Homes for Californians in the Californians in the New Century New Century Challenges and Challenges and Opportunities Opportunities February 7, 2003 February 7, 2003 Presented by Henry Cisneros Presented by Henry Cisneros
-
Upload
helena-blake -
Category
Documents
-
view
215 -
download
1
Transcript of Homes for Californians in the New Century Challenges and Opportunities February 7, 2003 Presented by...

Homes for Homes for Californians in the Californians in the
New CenturyNew CenturyChallenges and Challenges and Opportunities Opportunities
February 7, 2003February 7, 2003
Presented by Henry Cisneros Presented by Henry Cisneros

Demographic Change in California

Population Distribution
Year TotalWhite /
Non-Latino LatinoAfrican
AmericanAmerican
IndianAsian-
American
1995262,82
0193,566 26,936 31,598 1,931 8,788
2000281,42
2194,553 35,306 34,658 2,476 10,243
2020 E
324,926
207,145 55,156 44,735 3,207 19,589
2050 E
403,686
212,990 98,228 59,239 4,405 37,589
Source: U.S. 2000 Census & U.S. Census Bureau Population Division, Population Projections of the U.S., Total Population by Race, Hispanic Origin, & Nativity

Population Projections for California
Year Department of Finance Census Bureau Preferred
1990 29,942 -
1995 32,063 31,589
1996 32,384 31,758
1997 32,957 31,925
1998 33,506 32,100
2000 34,653 34,441
2005 37,372 37,644
2010 39,958 41,373
2015 42,371 45,278
2020 45,449 49,285
2025 48,626 -
2030 51,869 -
2035 55,210 -
2040 58,731 -
Source: Public Policy Institute of California
In Thousands

California Population by Race / Ethnic Distribution
Source: Public Policy Institute of California
1995
Latino28%
Asian & Pacific
Islander10%
African American
7%American
Indian1%
White54%
DOF, 2025
Latino41%
Asian & Pacific
Islander15%
African American
6%
American Indian
1%
White37%

Population Projections by Race / Ethnicity
1995 2000 2005 2010 2015 2020 2025 2030 2035 2040
White 17,180 17,422 17,731 17,902 17,969 18,123 18,216 18,222 18,141 18,005
Latino 9,101 10,689 12,301 13,964 15,643 17,778 20,085 22,547 25,199 28,091
Asian & Pacific Islander
3,338 3,999 4,684 5,314 5,815 6,474 7,128 7,786 8,441 9,092
African American
2,251 2,338 2,343 2,541 2,691 2,806 2,918 3,024 3,128 3,234
American Indian
193 206 222 237 253 266 279 290 300 309
Source: Public Policy Institute of California
In Thousands (DOF)

Minority Populations Are Young
25.7%
32.1%35.0%
38.7%
White Non-Latino Asian-American African-American Latino
% of population under 20
Source: Market Segment Research; Population Report, Middle Series, 1996
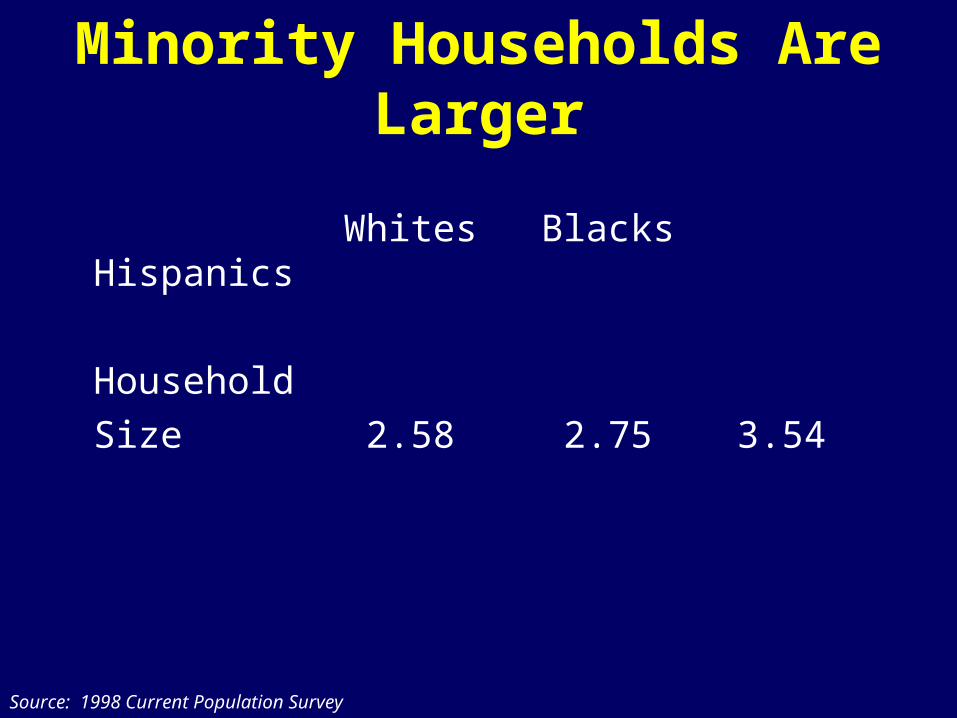
Minority Households Are Larger
Whites Blacks Hispanics
HouseholdSize 2.58 2.75 3.54
Source: 1998 Current Population Survey
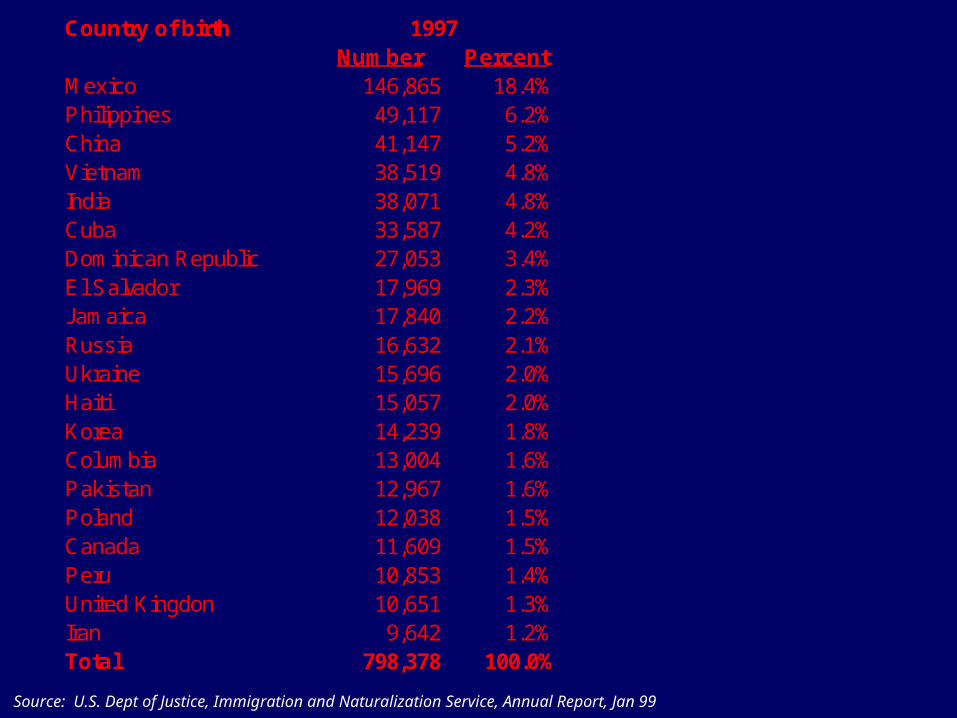
Country of birthNumber Percent
Mexico 146,865 18.4%Philippines 49,117 6.2%China 41,147 5.2%Vietnam 38,519 4.8%India 38,071 4.8%Cuba 33,587 4.2%Dominican Republic 27,053 3.4%El Salvador 17,969 2.3%Jamaica 17,840 2.2%Russia 16,632 2.1%Ukraine 15,696 2.0%Haiti 15,057 2.0%Korea 14,239 1.8%Columbia 13,004 1.6%Pakistan 12,967 1.6%Poland 12,038 1.5%Canada 11,609 1.5%Peru 10,853 1.4%United Kingdon 10,651 1.3%Iran 9,642 1.2%Total 798,378 100.0%
1997
Source: U.S. Dept of Justice, Immigration and Naturalization Service, Annual Report, Jan 99
Over 249,000Over 249,000
--31%----31%--
come from come from
Spanish-Spanish-
speaking speaking
countriescountries

Country of birthNumber Percent
Mexico 146,865 18.4%Philippines 49,117 6.2%China 41,147 5.2%Vietnam 38,519 4.8%India 38,071 4.8%Cuba 33,587 4.2%Dominican Republic 27,053 3.4%El Salvador 17,969 2.3%Jamaica 17,840 2.2%Russia 16,632 2.1%Ukraine 15,696 2.0%Haiti 15,057 2.0%Korea 14,239 1.8%Columbia 13,004 1.6%Pakistan 12,967 1.6%Poland 12,038 1.5%Canada 11,609 1.5%Peru 10,853 1.4%United Kingdon 10,651 1.3%Iran 9,642 1.2%Total 798,378 100.0%
1997
Source: U.S. Dept of Justice, Immigration and Naturalization Service, Annual Report, Jan 99
Over 194,000Over 194,000
--24%----24%--
come from come from
AsianAsian
countriescountries

StatesNumber Percent Number Percent
Entire nation 798,378 11 Michigan 14,727 1.8%1 California 203,305 25.5% 12 Pennsylvania 14,553 1.8%2 New York 123,716 15.5% 13 Georgia 12,623 1.6%3 Florida 82,318 10.3% 14 Conecticut 9,528 1.2%4 Texas 57,897 7.3% 15 Arizona 8,632 1.1%5 New Jersey 41,184 5.2% 16 Minnesota 8,233 1.0%6 Illinois 38,128 4.8% 17 Ohio 8,189 1.0%7 Virginia 19,277 2.4% 18 Oregon 7,699 1.0%8 Maryland 19,090 2.4% 19 Colorado 7,506 0.9%9 Washington 18,656 2.3% 20 Hawaii 6,867 0.9%
10 Massachuestts 17,317 2.2% Total top 20 states 719,445 90.2%
1997 1997
Source: U.S. Dept of Justice, Immigration and Naturalization Service, Annual Report, Jan 99

Number Percent Number PercentAll Metropolitan Areas 798,378 13 Dallas, TX 11,061 1.4%
1 New York, NY 107,434 13.5% 14 Philadelphia, PA-NJ 10,858 1.4%2 Los Angeles-Long Beach, CA 62,314 7.8% 15 Newark, NJ 10,801 1.4%3 Miami, FL 45,707 5.7% 16 Seattle-Bellevue-Everett, WA 10,692 1.3%4 Chicago, IL 35,386 4.4% 17 Fort Lauderdale, FL 10,646 1.3%5 Washington, DC-MD-VA 31,444 3.9% 18 Detroit, MI 10,019 1.3%6 Orange County, CA 18,190 2.3% 19 Atlanta, GA 9,823 1.2%7 Houston, TX 17,439 2.2% 20 Bergan-Passaic, NJ 9,788 1.2%8 San Jose, CA 17,374 2.2% 21 Riverside-San Bernadino, CA 9,518 1.2%9 San Francisco, CA 16,892 2.1% 22 Nassau-Suffolk, NY 9,167 1.1%
10 Oakland, CA 15,723 2.0% 23 Sacramento, CA 7,654 1.0%11 San Diego, CA 14,758 1.8% 24 Jersey City, NJ 7,529 0.9%12 Boston-Lawrence, MA 13,937 1.7% 25 Minneapolis-St. Paul, MN-WI 6,859 0.9%
1997 1997
Source: U.S. Dept of Justice, Immigration and Naturalization Service, Annual Report, Jan 99

Fact: Minority Families Have More Workers Per Household
25.6%
52.5%
13.5% 14.0%19.4%
15.3%
27.2%
U.S. BornLatino
Foreign-BornLatino
U.S. BornWhite
Foreign-BornWhite
African-American
U.S. BornAsian
Foreign-BornAsian
Households with Three or More Workers, 1990The Middle Class - 5 County Area
Source: Pepperdine University Institute for Public Policy “The Emerging Latino Middle Class” 1997

Growth of the Middle Class: 1989-1999
Source: U.S. Census Bureau
29.5% 32.3%
72.3%64.6%
Total Households
African American
Households
Hispanic Households
Asian Households
Middle Class Defined:
1989: $23,663 - $36,2011999: $33,001 - $52,174

Projected Owner Occupied Household Growth in Millions 2000 - 2010
African Asian/ Total Total American Hispanic Other
Minority
10.9 m. 1.8 m. 2.2 m. 1.0 m. 5.0 m.
Source: 1998 Current Population Survey

There Is Still a Significant Gap in the Rate of Home
Ownership74.4%
48.7% 48.8%
White Black Hispanic
Home Ownership Rate: 4th Quarter - 2001
Source: Department of Housing and Urban Development – Office of Policy Development & Research, US Housing Market Conditions, 4th Quarter 2001

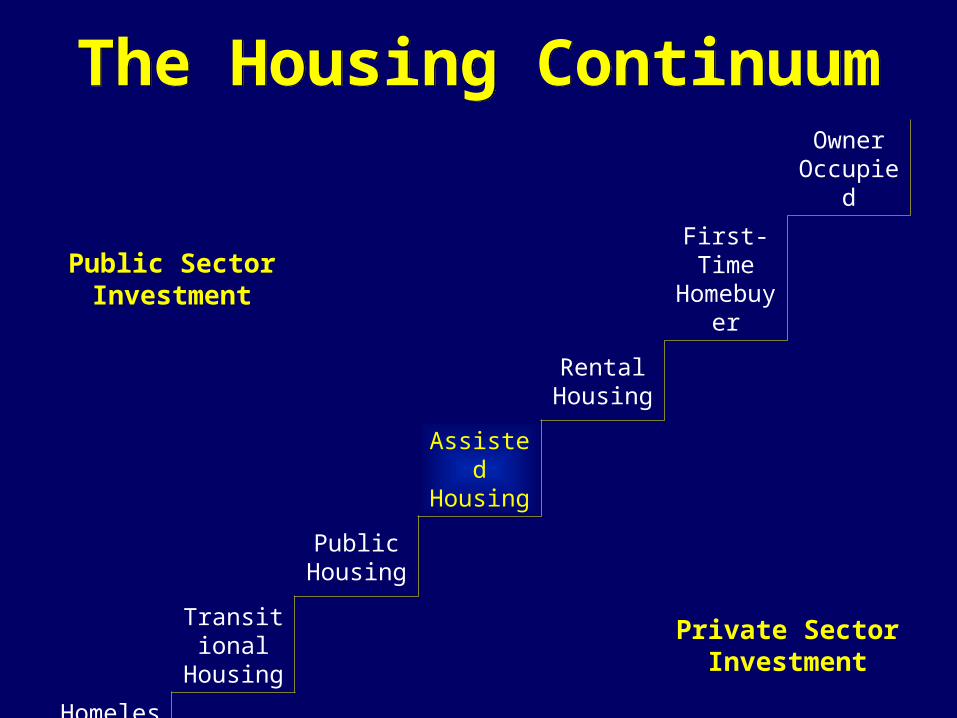
The Housing ContinuumThe Housing ContinuumOwner
Occupied
Public Sector Investment
First-Time Homebuyer
Rental Housing
Assisted Housing
Public Housing
Transitional Housing
Private Sector Investment
Homeless Shelter

The Housing ContinuumThe Housing ContinuumOwner
Occupied
Public Sector Investment
First-Time Homebuyer
Rental Housing
Assisted Housing
Public Housing
Transitional Housing
Private Sector Investment
Homeless Shelter

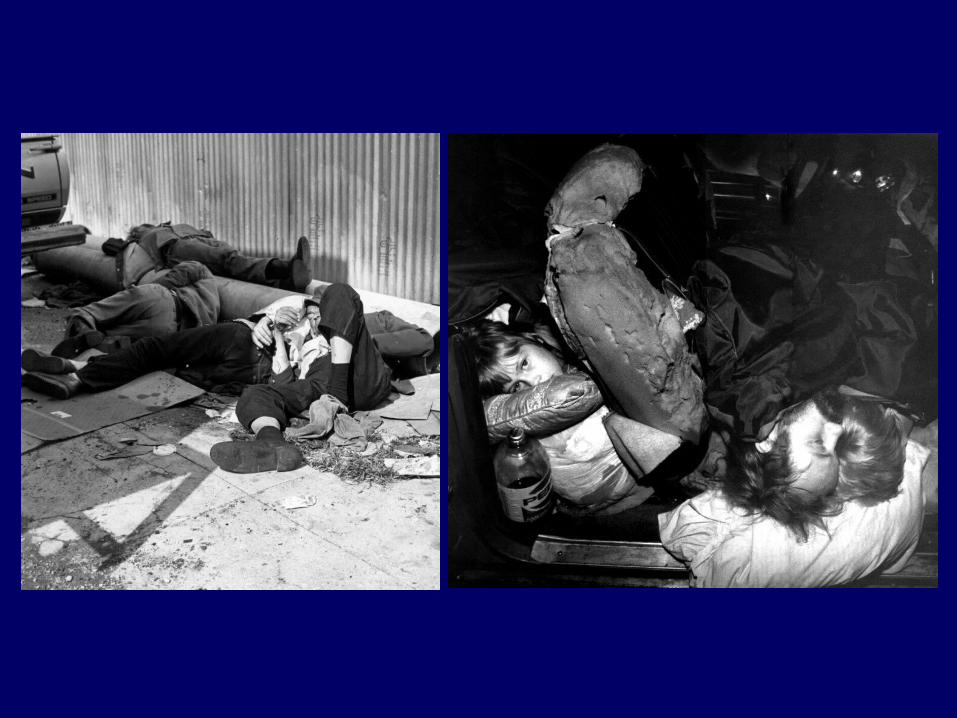
•More homeless facilities are needed and more beds at existing sites.
•Concerted efforts are required to bring homeless people in from the streets to safe, clean, and well-managed emergency shelters.
• Interventions must extend from street outreach to mental health and substance abuse programs.
•More homeless facilities are needed and more beds at existing sites.
•Concerted efforts are required to bring homeless people in from the streets to safe, clean, and well-managed emergency shelters.
• Interventions must extend from street outreach to mental health and substance abuse programs.


The Housing ContinuumThe Housing ContinuumOwner
Occupied
Public Sector Investment
First-Time Homebuyer
Rental Housing
Assisted Housing
Public Housing
Transitional Housing
Private Sector Investment
Homeless Shelter

More units are needed to provide decent apartments for persons with AIDS, persons with medical and emotional disabilities, and
mothers with children.
That means at least 150,000 units of suitable housing over ten
years, or 15,000 incremental units of supportive housing each
year.
More units are needed to provide decent apartments for persons with AIDS, persons with medical and emotional disabilities, and
mothers with children.
That means at least 150,000 units of suitable housing over ten
years, or 15,000 incremental units of supportive housing each
year.


The Housing ContinuumThe Housing ContinuumOwner
Occupied
Public Sector Investment
First-Time Homebuyer
Rental Housing
Assisted Housing
Public Housing
Transitional Housing
Private Sector Investment
Homeless Shelter

Continue large-scale renovation of deteriorated, overly dense public housing through full funding
of HOPE VI.
Reduce concentrations of poverty by creating smaller-scaled mixed-income developments matched to Section 8 and other programs, to
open housing opportunities in neighborhoods with stronger
economic prospects.

Horner NeighborhoodHorner NeighborhoodHorner NeighborhoodHorner Neighborhood
Old
New
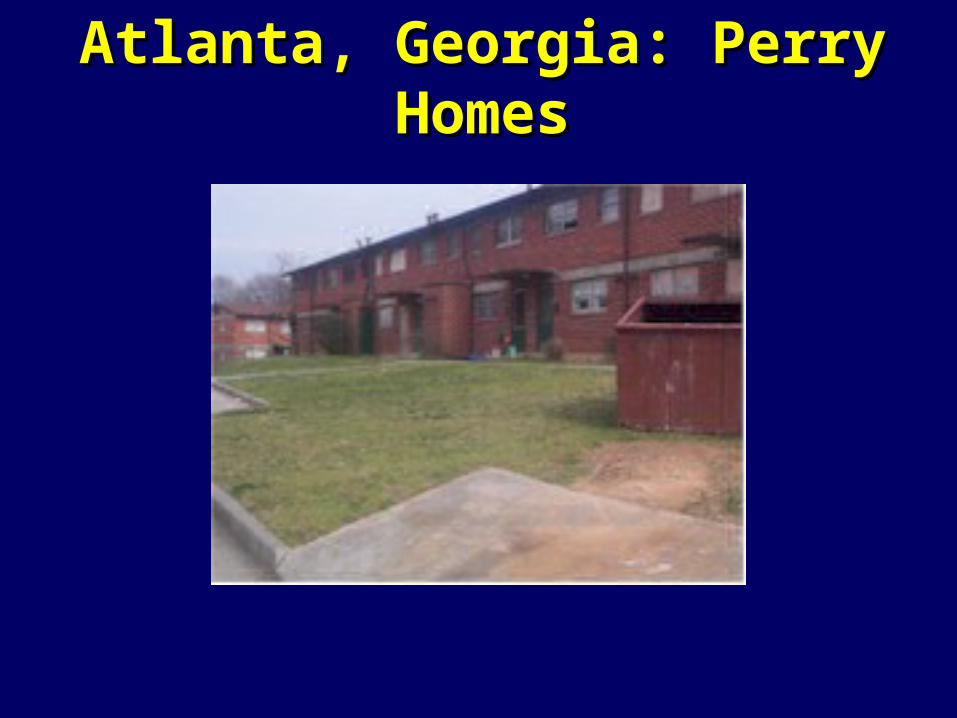
Atlanta, Georgia: Perry Atlanta, Georgia: Perry HomesHomes

Atlanta, Georgia: Centennial Atlanta, Georgia: Centennial PlacePlace

Harbor PointHarbor PointHarbor PointHarbor Point

Norfolk: Diggs TownNorfolk: Diggs TownNorfolk: Diggs TownNorfolk: Diggs Town
The Housing ContinuumThe Housing ContinuumOwner
Occupied
Public Sector Investment
First-Time Homebuyer
Rental Housing
Assisted Housing
Public Housing
Transitional Housing
Private Sector Investment
Homeless Shelter
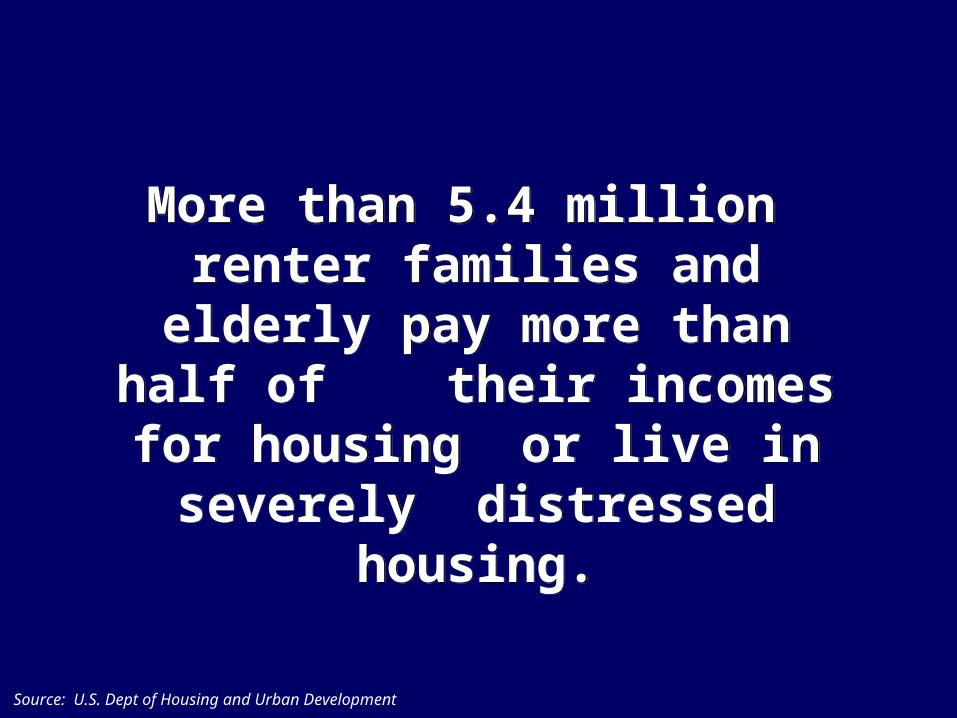
More than 5.4 million renter families and
elderly pay more than half of their incomes for
housing or live in severely distressed
housing.
More than 5.4 million renter families and
elderly pay more than half of their incomes for
housing or live in severely distressed
housing.
Source: U.S. Dept of Housing and Urban Development

57% of all renters – or 20 million households – earn less than $30,000 annually.
For them, affordable rent is $750/month or less.
Median asking rent for a new apartment is $920/month.
57% of all renters – or 20 million households – earn less than $30,000 annually.
For them, affordable rent is $750/month or less.
Median asking rent for a new apartment is $920/month.

In order to build units for the 6.4 million households with severe affordability problems, provide
capital subsidies for the production of units for occupancy
by extremely low-income households.
To preserve the current stock of subsidized rental housing, enact exit tax relief via a preservation
tax incentive to transfer properties to preservation entities.
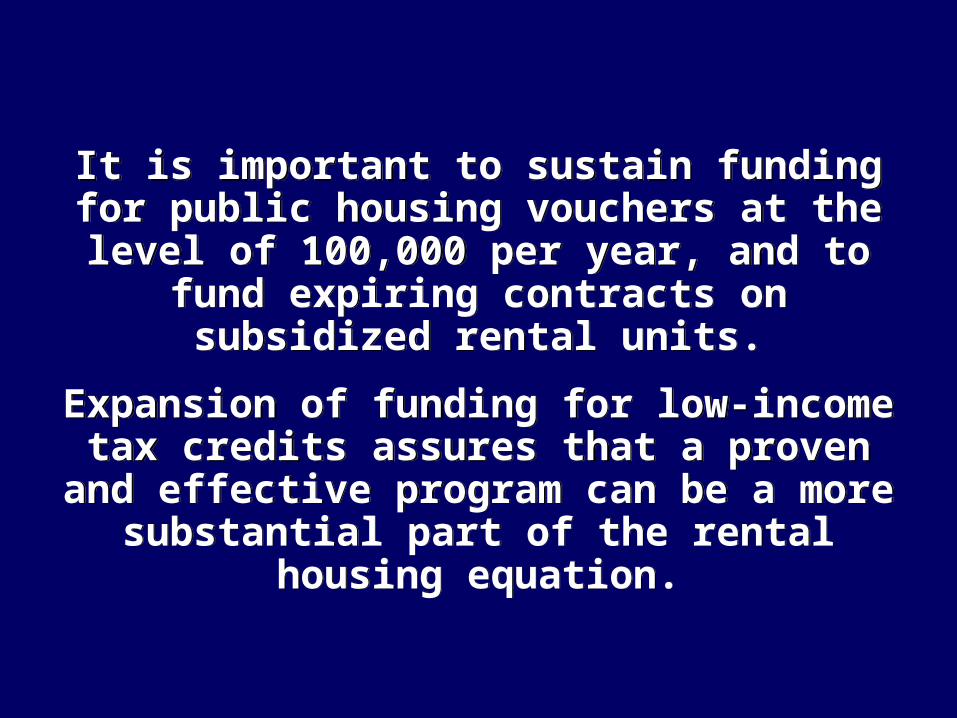
It is important to sustain funding for public housing vouchers at the level of 100,000 per year, and to
fund expiring contracts on subsidized rental units.
Expansion of funding for low-income tax credits assures that a proven and effective program can be a
more substantial part of the rental housing equation.

Specialized rental housing, such as the Senior 202
Program, warrants expansion.
The national network of highly capable non-profit housing providers is an essential extension of
Federal capability to address specific demographic needs.
Specialized rental housing, such as the Senior 202
Program, warrants expansion.
The national network of highly capable non-profit housing providers is an essential extension of
Federal capability to address specific demographic needs.

The Housing ContinuumThe Housing ContinuumOwner
Occupied
Public Sector Investment
First-Time Homebuyer
Rental Housing
Assisted Housing
Public Housing
Transitional Housing
Private Sector Investment
Homeless Shelter

Affordability Pressures Are Mounting as the Moderate-Income
Rental Supply Plummets
Source: HUD tabulations of the American Housing Survey, prepared for the Millennial Housing Commission Report
Change in Affordable Units 1985-99, in Millions
Note: HUD income limits are adjusted for inflation and real income growth for both 1985 and 1999.
Under 30% of AMI
30-50% of AMI
50-60% of AMI
60-80% of AMI
80-100% of AMI
100-120% of AMI
Over 120% of AMI
-2.0
-1.5
-1.0
-0.5
0.0
0.5
1.0
1.5
2.0
2.5
3.0
ExtremelyLow
Very Low Low HighModerate

A family with one full-time worker earning the
minimum wage cannot afford the local fair-market
rent for a two-bedroom apartment anywhere in the
country.
A family with one full-time worker earning the
minimum wage cannot afford the local fair-market
rent for a two-bedroom apartment anywhere in the
country.

In 24 states, households with
two full-time minimum wage earners lack the
income to cover fair-market rents on such a unit without
exceeding the “30% of income” threshold which
defines affordability.
In 24 states, households with
two full-time minimum wage earners lack the
income to cover fair-market rents on such a unit without
exceeding the “30% of income” threshold which
defines affordability.

Multifamily construction slowed in the 1990s despite
a population increase.
1970s – 5 million units
1990s – 2.5 million units
Multifamily construction slowed in the 1990s despite
a population increase.
1970s – 5 million units
1990s – 2.5 million units

Attract private capital to the production of mixed-
income, multi-family rental housing through state bond programs.
Attract private capital to the production of mixed-
income, multi-family rental housing through state bond programs.

The Housing ContinuumThe Housing ContinuumOwner
Occupied
Public Sector Investment
First-Time Homebuyer
Rental Housing
Assisted Housing
Public Housing
Transitional Housing
Private Sector Investment
Homeless Shelter

Allocate a flexible new tax credit to stimulate
the production of affordable units for
homeownership.
Allocate a flexible new tax credit to stimulate
the production of affordable units for
homeownership.

The Housing ContinuumThe Housing ContinuumOwner
Occupied
Public Sector Investment
First-Time Homebuyer
Rental Housing
Assisted Housing
Public Housing
Transitional Housing
Private Sector Investment
Homeless Shelter

Projected Homeownership Rate: 2000 - 2010
2000 2010Projected Change
U.S. Total 66.4 % 69.1 % + 2.7 %
African American
46.2 % 51.1 % + 4.9 %
Hispanic 44.5 % 49.1 % + 4.6 %
Asian 52.6 % 55.9 % + 3.3 %
Source: U.S. 2000 Census

Fannie Mae and Freddie Mac have set homeownership goals
for target populations.
Fannie Mae and Freddie Mac have set homeownership goals
for target populations.
• Minorities• New Immigrants• Female heads of household• Young households• Families in redevelopment areas• Families in rural areas
For example, Fannie Mae’s American Dream Commitment targets:
For example, Fannie Mae’s American Dream Commitment targets:

AFFORDABILITY
AND HOMEOWNERSHIP
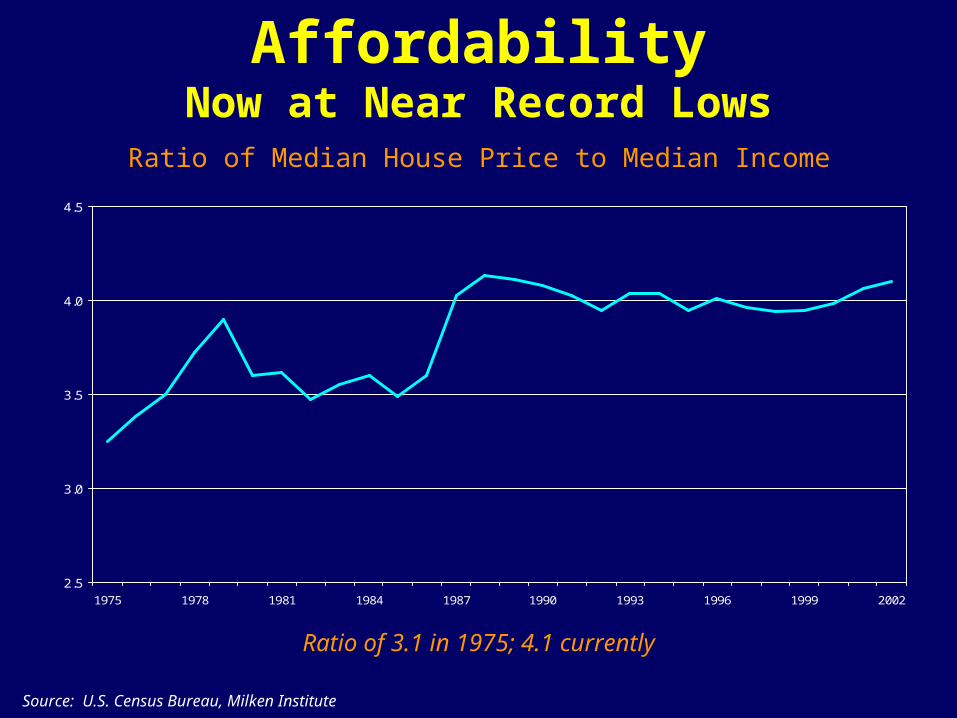
AffordabilityNow at Near Record Lows
2.5
3.0
3.5
4.0
4.5
1975 1978 1981 1984 1987 1990 1993 1996 1999 2002
Source: U.S. Census Bureau, Milken Institute
Ratio of Median House Price to Median Income
Ratio of 3.1 in 1975; 4.1 currently

Affordability: Three Dimensions
• Mortgage Interest Rates
• Income
• Home Prices

Mortgage Interest Rates
The decline from 8.05% in June, 2000 to 6.5% currently gives the median income household an 18% increase in its purchasing power.
Source: Federal Housing Finance Board (Bloomberg)
0
2
4
6
8
10
12
14
16
18
1975 1978 1981 1984 1987 1990 1993 1996 1999 2002
National Average 30 Year Conventional Fixed Rate Home Mortgage

Household Income
Over the last 25 years, incomes have increased steadily.
0
50
100
150
200
1975 1978 1981 1984 1987 1990 1993 1996 1999 2002
Median Household Income
Source: U.S. Census Bureau, Milken Institute.
Thousa
nds
of
$

Household Income vs. Home Prices
But in that time period, incomes have grown slower than home prices. Median home prices increased at an average annual rate of 5.9 percent.
When home prices rise faster than incomes, affordability suffers.
0
50
100
150
200
1975 1978 1981 1984 1987 1990 1993 1996 1999 2002
Median House Price Median Household Income
Source: U.S. Census Bureau, Milken Institute.
Thousa
nds
of
$

Home Prices
The price of homes is a function of supply and demand: the problems of producing homes constrain the supply of new housing units.
Source: U.S. Census Bureau
500
1,000
1,500
2,000
2,500
1975 1978 1981 1984 1987 1990 1993 1996 1999 2002New
Pri
vate
ly O
wned H
ousi
ng U
nit
s (I
n T
housa
nds)

Recommended Ratio:Recommended Ratio:1 new housing unit
for every 1.5 jobs created
In Fact:In Fact:California: 1 to 3.6Los Angeles: 1 to 5San Jose: 1 to 7.8

Affordability of Housing by Minorities
Median home price, June 2002:$182,600
Source: Bloomberg, U.S. Census Bureau, Milken Institute
How much Home can the median
household income support?
10th Percentil
e30th
Percentile50th
Percentile70th
Percentile90th
Percentile
U.S. Average $ 49,438 $ 122,912 $ 205,521 $ 318,894 $ 687,091
African Americans
$ 30,954 $ 83,182 $ 147,345 $ 231,385 $ 479,081
Hispanics $ 43,665 $ 100,638 $ 161,977 $ 244,771 $ 477,752
Home Price is calculated assuming a 20% down payment on a 30 Year Fixed Rate Mortgage with payments equal to 30% of gross annual household.

CityOccupatio
nAverage Income
Median Home Price
Qualifying Income
Downtown Los
AngelesTeacher $ 38,570 $ 333,250 $ 111,083
Yorba Linda
(Orange County)
Firefighter $ 42,300 $ 338,500 $ 112,883
Palo AltoPolice
Detective$ 62,230 $ 815,000 $ 270,667
San JoseRegistered
Nurse$ 56,650 $ 430,000 $ 143,333
Home Prices are Beyond the Reach of California’s Middle-
Class
Home Prices are Beyond the Reach of California’s Middle-
Class

Affordability
• Land Cost
• Public Role
• Fiscal Issues
• Financial Institutions
• Gentrification
• Homebuyers Assistance
• Local Government Homeownership Priorities


Work with local governments who declare homeownership a priority
to review land use policies and fiscal structure for middle class
and entry level affordability.
Consider incentives to encourage states and local governments to create housing trust funds with their own funds and with private
resources, in order to supplement Federal programs for
homeownership.
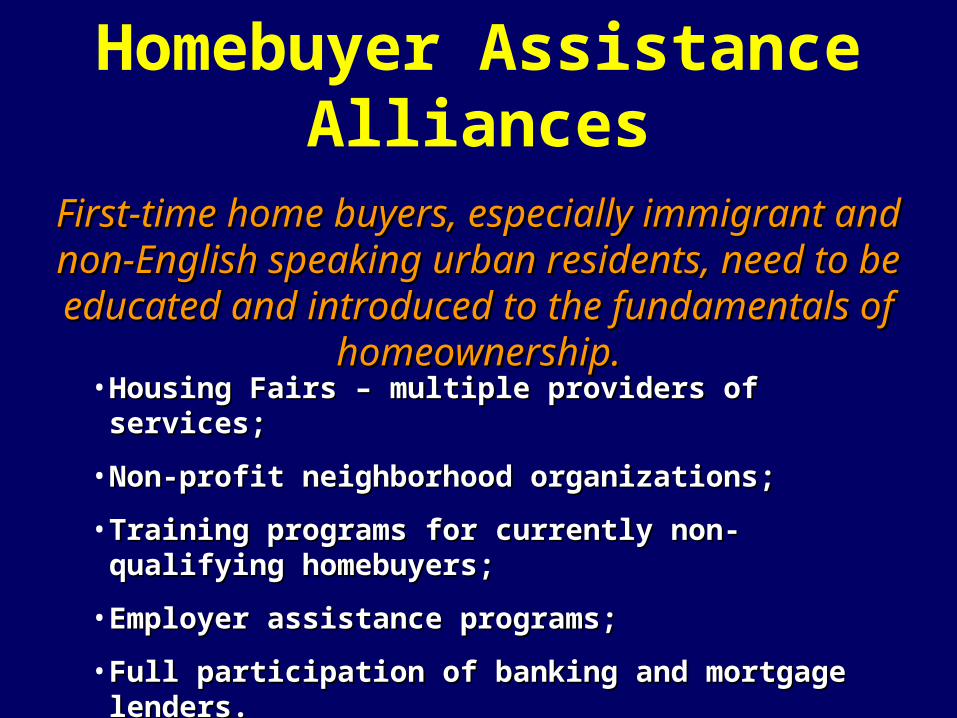
First-time home buyers, especially immigrant and non-First-time home buyers, especially immigrant and non-English speaking urban residents, need to be educated English speaking urban residents, need to be educated and introduced to the fundamentals of homeownership.and introduced to the fundamentals of homeownership.
• Housing Fairs – multiple providers of services;Housing Fairs – multiple providers of services;
• Non-profit neighborhood organizations;Non-profit neighborhood organizations;
• Training programs for currently non-qualifying homebuyers;Training programs for currently non-qualifying homebuyers;
• Employer assistance programs;Employer assistance programs;
• Full participation of banking and mortgage lenders.Full participation of banking and mortgage lenders.
Homebuyer Assistance Alliances

•Professional & Business Groups
•In Cooperation With Employers as Employee Benefits
•Immigrant Self-help Advocacy Groups
•Community-based Organizations
•Church Communities
•Person-to-person Explanations
Homebuyer Assistance Alliances

Targeted Mortgage Products
• First-time Homebuyer Mortgage Assistance• Down Payment Assistance;• Zero Down-Payment with Fannie Mae and KB Mortgage
Company for Teachers, Nurses, Policemen, & Firefighters;• “1% down-payment” and low-interest loans sponsored by
Fannie Mae or other financial institutions;• Bond financing to create low interest loans for
moderately-low income families.• New ACV initiated and targeted products …
SPECIAL LOAN PROGRAMSSPECIAL LOAN PROGRAMS::
The Key to Affordable Urban Home The Key to Affordable Urban Home OwnershipOwnership
The Key to Affordable Urban Home The Key to Affordable Urban Home OwnershipOwnership

An Exclusive Financing Option Through Fannie Mae & KB Mortgage Company
- Firefighters
- Healthcare Professionals
- Teachers
- Police Officers
• Zero Down
• Zero Closing Cost
• Targets:
Targeted Mortgage Products
Targeted Mortgage Products

URBAN PROGRESS
AND HOMEOWNERSHIP

Homeownership
•Traditional Infill Approach
•Large Sites:– Military Facilities, i.e., Mather AFB
– Brownfields
– Large tracts,
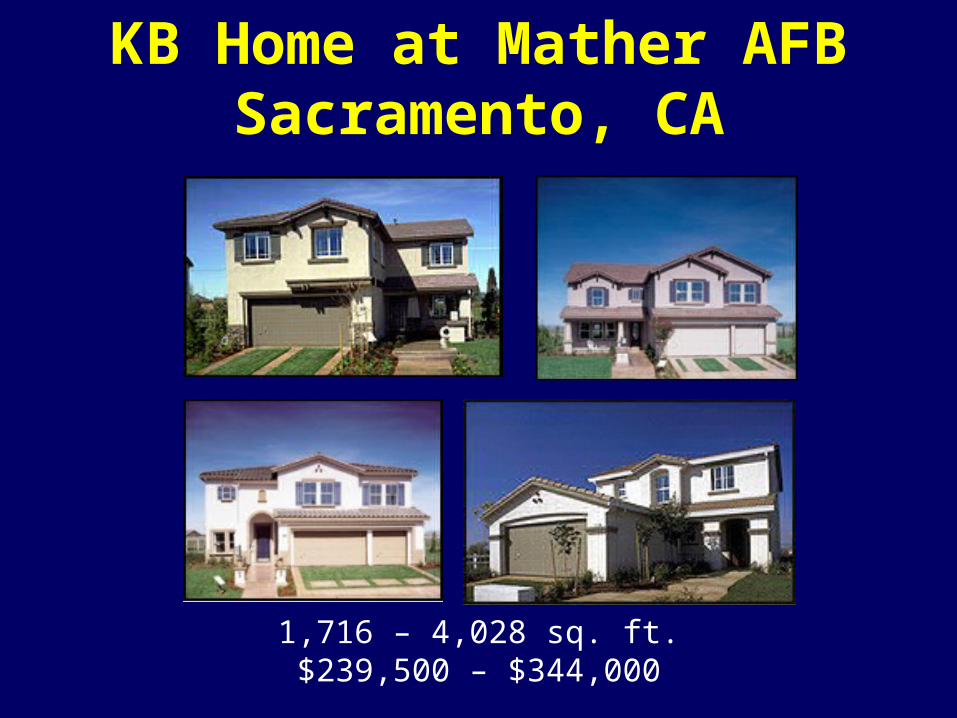
KB Home at Mather AFBSacramento, CA
1,716 – 4,028 sq. ft.$239,500 – $344,000

Urban RealitiesUrban Realities
• Land cost can be substantially higher than regional suburban alternatives; land configuration and previous uses increase costs
• Smaller & difficult to develop sitesSmaller & difficult to develop sites
• Costs and entitlement processes dictate more expensive and/or higher density products

•Social conditions can be as complex as the physical sites
•Older, poorer and more diverse educational institutions
Urban RealitiesUrban Realities

Yet, More American Homeowners Are Seeking
Central Locations
Yet, More American Homeowners Are Seeking
Central Locations• To Avoid Congestion, Traffic, and Long Commutes
• To Enjoy a Metropolitan Lifestyle With Downtown Amenities
• To Be Near Employment Centers
• To Be Near Familiar Neighborhoods and Close to Family and Community Roots
• To Participate in Civic Involvements and Greater Citizen Interactions
• To Have a Distinctive “Village Within the City” Experience with New Home Comforts and Technologies
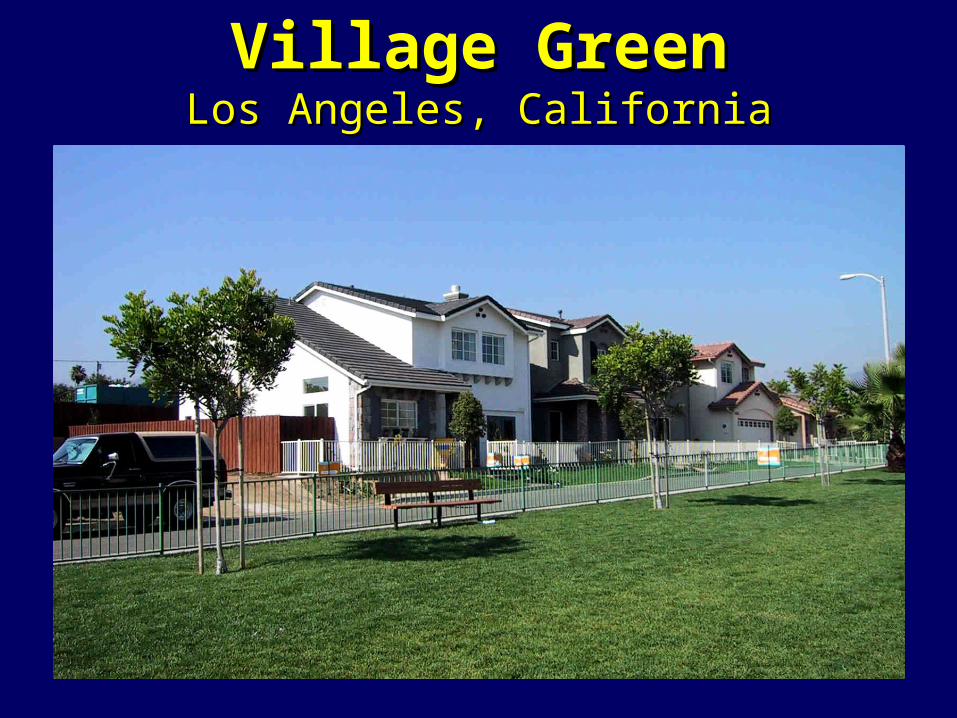
Village GreenVillage GreenLos Angeles, CaliforniaLos Angeles, California

Targeted Consumers Want
Location and Convenience
Targeted Consumers Want
Location and Convenience • Young Professionals
• Empty nesters and retirees• First-time homeowners with
young families• Immigrants• Minority homeowners• Working families• Multigenerational
households

Many City & County Governments Have
Established the Construction of Homes in Central Areas as a Priority
Many City & County Governments Have
Established the Construction of Homes in Central Areas as a Priority
GOVERNMENTS CAN BE HELPFUL:• Identifying Sites in Priority Areas
• Helping Assemble Complex Sites
• Assuring the Adequacy of Needed Utilities, Transportation, and Other Public Infrastructure
• Working to Meet Local “Affordability” Objectives
• Expediting the Approval and Entitlement Process
• Working with Neighborhood and Community Leaders

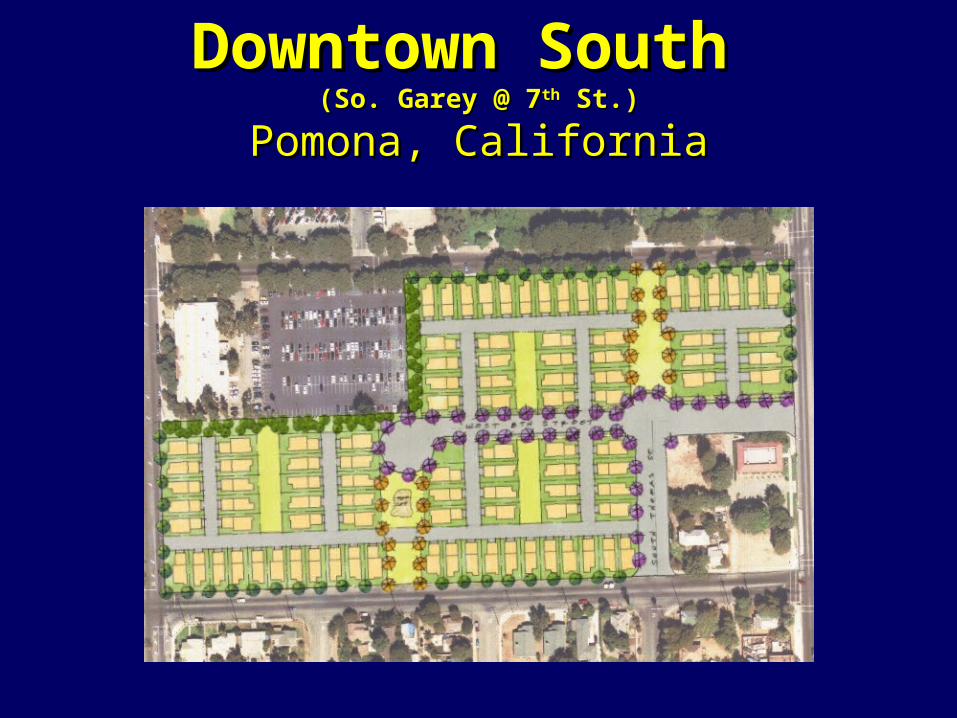
Downtown South Downtown South (So. Garey @ 7(So. Garey @ 7thth St.) St.)
Pomona, CaliforniaPomona, California
Downtown South Downtown South (So. Garey @ 7(So. Garey @ 7thth St.) St.)
Pomona, CaliforniaPomona, California

Downtown South Downtown South (So. Garey @ 7(So. Garey @ 7thth St.) St.)
Pomona, CaliforniaPomona, California

• School districtsSchool districts• Neighborhood leadersNeighborhood leaders• Local businessLocal business• PolicePolice• Community collegesCommunity colleges• Corporate partners – i.e. telecom/digitalCorporate partners – i.e. telecom/digital• Financial institutions - make Financial institutions - make
homeownership a realityhomeownership a reality
Strategic Partnerships:Strategic Partnerships:The Key to Urban The Key to Urban
ProjectsProjects


Expand the concept of empowerment or enterprise zones to create “homeownership zones.”
Encourage local governments to Encourage local governments to assemble sites, clean up assemble sites, clean up
brownfields, create land banks, brownfields, create land banks, rehabilitate properties, reconstruct rehabilitate properties, reconstruct infrastructure, and prepare land for infrastructure, and prepare land for
large-scale infill neighborhoods.large-scale infill neighborhoods.

1. The availability of quality, affordable rental units is important to creating a pipeline of future homeowners:
1. The availability of quality, affordable rental units is important to creating a pipeline of future homeowners:
Concluding Points
- Preserve and expand the subsidized stock
- Expand the availability of affordable market units
- Preserve and expand the subsidized stock
- Expand the availability of affordable market units

2. In order to enhance affordability, it is critical to expand the supply of affordable for-sale homes:
2. In order to enhance affordability, it is critical to expand the supply of affordable for-sale homes:- National Policy: Homeownership
Tax Credits
- Local Governments: Identify and assist in assembly of sites
- Private Builders: Target median price and below
- National Policy: Homeownership Tax Credits
- Local Governments: Identify and assist in assembly of sites
- Private Builders: Target median price and below
3. Mortgage products must be addressed to high growth homeownership markets:
3. Mortgage products must be addressed to high growth homeownership markets:
- Effective outreach to minority populations
- Design of targeted financial products
- Give core business priority to the new demographics of homeownership
- Effective outreach to minority populations
- Design of targeted financial products
- Give core business priority to the new demographics of homeownership