Holland BPW - RAP Workbook - P21 Decision
32
Holland BPW - RAP Workbook RAP SESSION I September 28, 2011
Transcript of Holland BPW - RAP Workbook - P21 Decision

Holland BPW - RAP Workbook
RAP SESSION I
September 28, 2011
Prepared By:
HDR
This workbook was provided to participants at the R.A.P. session to review preliminary costs and benefit categories. Participants were asked to add to, change, and comment on the
proposed categories, and their structure and logic.

Table of Contents
Risk Analysis Process (RAP) Session Holland BPW – September 28th 2011 .................................................. 1
Topic .......................................................................................................................................................... 1
Purpose ..................................................................................................................................................... 1
Introductions and Review of Agenda ........................................................................................................ 1
John Parker ............................................................................................................................................... 1
HDR Presentation by John Parker ............................................................................................................. 1
Panel review and modification of business case model structure and logic for costs of options ............ 1
Panel review and modification of business case model structure and logic for costs of options ............ 1
Lunch Break ............................................................................................................................................... 2
Panel review and modification of business case model structure and logic for benefits ........................ 2
Panel review and modification of business case model structure and logic for benefits ........................ 2
Wrap-Up .................................................................................................................................................... 2
Introduction .................................................................................................................................................. 3
Options .......................................................................................................................................................... 6
Cost and Benefit Categories ........................................................................................................................ 10
Structure and Logic Diagrams ..................................................................................................................... 15
Overview ................................................................................................................................................. 16
Costs ........................................................................................................................................................ 17
Benefits ................................................................................................................................................... 17
Private Costs ........................................................................................................................................... 18
Fixed Costs .............................................................................................................................................. 19
Variable Costs ......................................................................................................................................... 20
Consumables ........................................................................................................................................... 21
Emissions ................................................................................................................................................. 22
Revenue .................................................................................................................................................. 23
External Benefits ..................................................................................................................................... 24
Reliability ................................................................................................................................................. 25
External Costs .......................................................................................................................................... 26

List of Figures and Tables Figure 1 - Holland BPW Peak Electricity Capacity ......................................................................................... 3
Table 1 - Cost Benefit Analysis Cost and Benefit Categories ...................................................................... 11
Figure 2 - Option-Benefit Matrix ................................................................................................................. 13
Table 2 - Investment Scenarios ................................................................................................................... 14
Table 3 - Omitted Costs & Benefits ............................................................................................................. 27

HDR Corporation Page ● 1
Risk Analysis Process (RAP) Session Holland BPW – September 28th 2011
DoubleTree Hotel – 650 East 24th Street, Holland MI
Note: proceedings will be recorded as an aid to our note taking.
Topic
Purpose
Facilitation
Time
(Minutes)
Start and End
Times
Introductions and Review of Agenda
Welcome and self-introduction of panelists; rules of engagement; role of panelists, opportunities for public input and questions during the day.
John Parker 30 9:00am-9:30am
Overview of the options Under Consideration
Project background; opportunities for public input and questions after today; describe 8 options at a high-level.
Holland BPW – To be determined.
30 9:30am-10:00am
Overview of the RAP Process
Explanation of RAP objectives and process, and: role of panelists: role of observers: role of facilitator.
HDR Presentation by John Parker
20
10:00am-10:20am
Questions from panel on RAP session
Clarification of RAP Session.
Panel Questions and HDR Answers.
10 10:20am-10:30am
RAP Session #1 - Structure and Logic of the Business Case Model
Panel review and modification of business case model structure and logic for costs of options.
HDR facilitation (Ewa Tomaszewska) of panel review, analysis and modification of model.
45
10:30am-11:15am
Morning Break
15 11:15am-11:30am
RAP Session #1 – Continued (Costs)
Panel review and modification of business case model structure and logic for costs of options.
HDR facilitation (Ewa Tomaszewska) of panel review, analysis and modification of model.
45 11:30am-12:15pm
Observers Questions and Answers
Solicit Questions from Observers.
John Parker 15 12:15pm-12:30pm

HDR Corporation Page ● 2
Lunch Break Opportunity for observers to talk with panelists.
60
12:30pm-1:30pm
RAP Session #1 – Continued (Benefits)
Panel review and modification of business case model structure and logic for benefits.
HDR facilitation (John Parker) of panel review, analysis and modification of model.
60 1:30pm-2:30pm
Afternoon Break
30 2:30pm-3:00pm
RAP Session #1 – Continued (Benefits)
Panel review and modification of business case model structure and logic for benefits.
HDR facilitation (John Parker) of panel review, analysis and modification of model.
45 3:00pm-3:45pm
Wrap-Up
Plans for next RAP session and panel observations or comments.
John Parker 15 3:45pm-4:00pm
Observers Questions and Answers
Solicit Questions from Observers.
John Parker 30 4:00pm-4:30pm
~6.5 hours

HDR Corporation Page ● 3
Introduction This Risk Assessment Process (RAP) workbook provides an overview of the sustainable return on investment (SROI) framework for assessing the costs and benefits of the proposed changes to the Holland BPW power generation system. The workbook provides an overview of the options, and the costs and benefits that result from each option. The methodology used to calculate costs and benefits is then displayed visually in a series of structure and logic (S&L) diagrams.
Energy consumption has steadily risen in Holland in the past thirty years, and this trend is expected to continue despite demand-side management efforts. Figure 1 shows that Holland BPW’s current electric load capacity of 277 megawatts (MW) will be inadequate in the upcoming years.
Figure 1 - Holland BPW Peak Electricity Capacity
“The recession our country experienced over the past decade slowed our need for further expansion, but it didn’t reverse it. In spite of the recession Holland continued to grow, including the recent addition of two large investments in our community by LG Chem and Johnson Controls. These two facilities alone will require more energy than is currently used by all our residential customers combined.”1
1 http://p21decision.com/p21-start-thinking/whats-the-problem/ - “On July 21, 2011 the maximum hourly Peak Demand was 225 MW. With a 12% reserve margin, that puts required capacity at 252 MW, putting current
0
50
100
150
200
250
300
350
2000
2001
2002
2003
2004
2005
2006
2007
2008
2009
2010
2011
2012
2013
2014
2015
2016
2017
2018
2019
2020
2021
2022
2023
2024
2025
2026
2027
2028
2029
2030
Year
MW
Existing Resources - Coal Existing Resources- GasPeak Demand Adjusted for RAP DSM Savings" Historical Peak DemandPeak Demand Including Reserve Margin (12%)

HDR Corporation Page ● 4
In addition to increases in forecasted energy load, Holland BPW acknowledges that: “The greater Holland community is at a crossroads in determining how best to meet its future power needs. Factors at work are long-term growth in power demand, regulatory requirements for the use of renewable energy sources, rising demand for power world wide and the cost and difficulty of maintaining the aging equipment at the De Young plant, which currently produces a significant portion of the community’s electricity.”2
In order to stay abreast of these future conditions, Holland BPW has proposed several options to replace and augment its generation portfolio. The options under consideration are:
1. James DeYoung Circulating Fluidized Bed Solid Fuel Plant 2. LM2500+ (G4) Combined Heat and Power Plant 3. 2 x 1 LM2500+ Combined Cycle Plant 4. James DeYoung Unit 5 Repowering with 1 x 6FA Combustion Turbine Generator 5. James DeYoung Unit 5 Biomass Retrofit 6. Solar Photovoltaic 7. Wind Generation 8. Digester Gas Combined Heat and Power Plant
These options will be described in further detail in the following section. Each option will be assessed individually in terms of its costs, benefits, and risks. The options will then be combined into portfolios of generation options. These portfolios will reflect the scenarios considered in the Community Energy Efficiency and Conservation Strategy Plan. The scenarios will be evaluated using HDR’s Sustainable Return on Investment (SROI) methodology.
SROI is an approach to determine the public value of a project or initiative and to determine if the project is worthwhile. It answers the question of whether a project provides benefits (net of its costs) and therefore should be undertaken:
• Is the public value sufficient to justify the money required to develop the project? • Which option provides greatest return relative to the project cost?
generation capacity close to maximum. Holland’s electric usage is growing: A single new industry like LG Chem adds approximately 20 MW of demand.” 2 Holland BPW Press Release: “Air Quality Permit Allows Holland Board of Public Works to Move Ahead with Power Options Evaluation” February 11, 2011.

HDR Corporation Page ● 5
This public value includes not just the financial or net “cash” benefits of each option, but also incorporates the value of broader social and environmental impacts that may be in some stakeholders’ opinion, the primary reason for undertaking the project.

HDR Corporation Page ● 6
Options 1. James DeYoung Circulating Fluidized Bed Solid Fuel Plant
This option involves installing a circulating fluidized bed (CFB) solid fuel plant at the existing James DeYoung (JDY) site. The fuel used to generate power will be a mixture of petroleum coke, biomass, tire-derived fuel, and biosolids. The plant will produce approximately 70 megawatts (MW) of power. In the base generation case, the plant will also send hot, circulating, water to the snow melt system. The base generation case does not provide process steam for district heating. Additional options include: - Installing a heat pump on the back end of the snow melt system to extract additional
energy out of the circulating water for district heating. - Extracting steam off of the steam turbine for district heating.
2. LM2500+ (G4) Combined Heat and Power Plant
Option 2 is to install a combined heat and power (CHP) plant. The plant would utilize a LM2500+ (G4) combined gas turbine to generate power. A single-pressure heat recovery steam generator (HRSG) will be installed in the city’s industrial park, making use of the exhaust produced by the gas turbine. The CHP plant will produce approximately 30 MW
of power. The steam produced by the turbine will be used for district heating in the base generation case. The base generation case does not provide water to the snow melt system.
Additional options include: - Installing a Heat Recovery Steam Generator (HRSG) stack water heater, to add to the
district heating and/or snow melt systems. If both district heating and snow melt were provided, a heat pump would be required.
3. 2 x 1 LM2500+ Combined Cycle Plant
Here, two LM2500+ combined gas turbines will be installed in a 2 x 1 combined cycle plant. Additionally, two triple-pressure HRSGs will be installed at the existing JDY site. The plant will produce approximately 77 MW of power. In the base generation case, hot circulating water will be sent to the snow melt system. No process steam for district heating will be provided in the base generation case.

HDR Corporation Page ● 7
Additional options include: - Additional energy could be extracted from the circulating water by installing a heat
pump. The pump would be installed to the back-end of the snow melt system, and the additional energy would be used for district heating.
- Extracting steam off of the ST for district heating.
Installation of Snowmelt on 8th Street at Marketplace
4. James DeYoung Unit 5 Repowering with 1 x 6FA Combustion Turbine Generator Unit 5 at the JDY site will be repowered with one 6FA combustion turbine generator, and will utilize the existing steam turbine and condenser. This option will produce approximately 100 MW of power, netting 75 MW after loss of existing power is factored in. This new power rating falls in line with options 1 and 3. In the base case, hot circulating water will be sent to the snow melt system and no steam will be processed for district heating.

HDR Corporation Page ● 8
Additional options include: - Installing a heat pump on the back end of the snow melt system to extract additional
energy out of the circulating water. This energy would be used for district heating. - Installing an HRSG stack water heater for the district heating and/or snow melt
systems. Providing heat to both systems would require a heat pump. - Extracting steam off of the ST for district heating.
5. James DeYoung Unit 5 Biomass Retrofit The existing Unit 5 boiler at the JDY site will be retrofitted to burn woody biomass. This option will produce approximately 24 MW of power. In the base generation case, hot circulating water will be sent to the snow melt system and process steam will not be provided for district heating. Additional options include:
- Installing a heat pump on the back end of the snow melt system to extract additional energy out of the circulating water. This energy would be used for district heating.
6. Solar Photovoltaic 24 MW of solar energy will be harnessed by installing photovoltaic (PV) panels.
7. Wind Generation Erecting wind turbines will result in 37 MW of wind capacity.
8. Digester Gas Combined Heat and Power Plant A digester gas combustion turbine generator and single-pressure HRSG will be installed at either the waste treatment facility or existing JDY site. The sites are relatively close to one another. This option will produce approximately 4 MW of power and steam for district heating in the base generation case. The base generation option does not provide water to the snow melt system.

HDR Corporation Page ● 9
Additional options include: - Installing an HRSG stack water heater for the district heating and/or snow melt
systems. Providing heat to both systems would require a heat pump.

HDR Corporation Page ● 10
Cost and Benefit Categories Table 1 below provides the proposed cost and benefit categories for assessing the eight generation options. The specific impacts are based on consultation with the project team and other stakeholders, best-practices, and feedback from today’s RAP session.
The cost and benefit categories have been separated into two categories – financial and social. Financial costs and benefits calculate actual cash flows accruing to Holland BPW or the community of Holland.3 These revenues and financial costs are the basis of a traditional return on investment (ROI) analysis. Social costs and benefits are externalities that are not usually captured in ROI analyses, and do not have a price set by a market. An example is the benefit of a snow melt system. The Unit 3 electric generator waste heat goes into the condenser water used to cool the unit. In the winter, this water with excess waste heat is directed to the snow melt system before being discharged into Lake Macatawa. The benefit to the community has no price but the benefits include no salting, no plowing, no slipping or sliding, no track-in to store carpeting, and the sidewalk bricks are not prone to frost heave throughout the winter months.
Adding these non-cash costs and benefits allows us to evaluate how each option will impact society at large, and reveal the “hidden” value of the option. Social benefits and costs that do not involve actual cash flows will be monetized so they may be evaluated alongside the financial cost and benefits. Together, the net financial and social costs and benefits give the option’s SROI.
These costs and benefits are listed and described in Table 1. Structure and logic diagrams show how each of these items are calculated, and are provided on Page 15.
3 We propose calculating the benefits to both Holland BPW and its clients and owners, the Holland community. In the aggregate analysis, the costs and benefits will net out since the costs to one group are revenue to another (for example higher costs of generation result in higher electricity rates).

HDR Corporation Page ● 11
Table 1 - Cost Benefit Analysis Cost and Benefit Categories
Name Impact Type
Description Category
Renewable Energy Credit Benefit Those options that are eligible to receive RECs will generate revenue through the sale of the credits. Options that are not classified as renewable will require credits to be purchased.
Financial
Energy Market Revenue Benefit Revenue Holland BPW receives from selling generated energy Financial
Capacity Market Revenue Benefit The plant’s capacity may potentially be contracted out. This represents an option value which has financial worth.
Financial
Ancillary Market Revenue Benefit Some options may be able to provide ancillary services such as reserves, regulation, and black start capability. Revenue is generated when these services are provided.
Financial
Incentive Tax Credits Benefit Some generation modes are eligible for Federal and State financial incentives. Applicable grants and/or credits are calculated in this benefit.
Financial
District Heating Revenue Benefit Quantifies the increase in revenue attributed to increased district heating service.
Financial
Water Quality Improvements Benefit Some options will reduce the amount of thermal discharge into the lake, which is expected to improve water quality. Improved water quality is a social benefit, and can be monetized.
Social
Generation Reliability Benefit By increasing generation capacity on the grid, the likelihood of power outages decreases. Power outages are a cost on society, and reducing the number of outages brings about a social cost-savings.
Social
District Heating Social Benefit Benefit
By channeling heat into the district heating system, the additional energy that would have otherwise been generated to produce this heat is no longer required. The reduction in generation also brings about a reduction in emissions, which will be monetized. Furthermore, there is a reduction in heating costs to those who receive the service.
Social
Snow Melting Benefit Heat produced by the plant can be used to heat sidewalks downtown, and melt snow. The social benefit gained through this system is monetized.
Social
Fixed Costs Cost Fixed costs are those financial costs that do not fluctuate with equipment usage.
Financial
Variable Costs Cost Represent equipment maintenance costs that are primarily dependent upon the hours the equipment are operating.
Financial

HDR Corporation Page ● 12
Consumable Costs Cost Consumables refer to the cost of delivered materials consumed, disposal of byproducts produced, startup fuel, and spare parts.
Financial
Renewable Energy Credits Cost Similar to the REC benefit, only some options are not eligible to receive credit, and RECs must be purchased to meet Michigan renewable portfolio standards.
Financial
Other Costs Cost Additional financial costs that are not captured in the other cost categories fall under “Other Costs.”
Financial
Water Consumption Cost Water has value above and beyond what is charged by a utility. The social cost of water is applied to the volume consumed in each option.
Social
Emissions Cost Different methods of generating electricity produce pollutants at different rates. Emissions produced may be quantified and monetized.
Social
Not all benefits are applicable to each option. For example, wind and solar power do not produce heat that can be used in the snow melt or district heating systems. Figure 2 maps the benefits to each proposed option. A means that the row’s option has the ability to produce the benefit in the corresponding column.

HDR Corporation Page ● 13
Figure 2 - Option-Benefit Matrix

HDR Corporation Page ● 14
The options will be combined into scenarios similar to the Holland Community Energy Efficiency and Conservation Strategy Plan. These are reproduced below in Table 2.
Table 2 - Investment Scenarios Item Base Case
$M Scenario A
$M Scenario B
$M Scenario C
$M Scenario D
$M 70 MW Solid Fuel $270 $270 $270 20 MW Industrial CHP $40 $40 $40 $40 55 MW CCGT $90 $90 Industrial DH Network $10 $10 $10 $10 Downtown DH Network $10 $10 $10 $10 SFH Retrofit - Toal Investment $125 $125 $125 $125 SFH Retrofit Owner Share -$63 -$63 -$63 -$63 Refrigerator Incentives $0 $1 $1 $1 $1 AC Buyback (7,500) $0 $2 $2 $2 $2 Industrial Efficiency $0 $0 $0 $0 Solar PV (8 of 24MW) $32 $32 37 MWnom Wind $111 $111 Additional Snow-Melt
Total 2030 Investment $270 $215 $358 $538 $395
Total Additional Capacity 70MW 55MW 100MW 170MW 125MW
Investment / Capacity $3.86/MW $3.91/MW $3.58/MW $3.16/MW $3.16/MW

HDR Corporation Page ● 15
Structure and Logic Diagrams Structure and logic (S&L) diagrams illustrate how an impact is quantified. S&L diagrams are the graphical representation of an equation, where each box is a variable (input, intermediate output, output) and the links between boxes are operations (add, multiply, divide, etc.). S&L diagrams differ from a flowchart, influence diagram, or decision tree, as they provide us with the framework to understand and calculate the potential impacts to be evaluated.
S&L diagrams allow the project team to think through a problem. They provide the ability to communicate with and seek feedback from others on the project team and peer reviewers. In this section, S&L diagrams have been included for all the costs and benefits listed in Table 1.
The following legend applies to all the S&Ls presented in this section. Those elements contained in rounded-boxes are exogenous variables inserted into the model. Their values may be the result of research, expert opinion, and other external sources. Elements contained in squared-boxes are calculated endogenously within the model.
Output
Legend
Input

HDR Corporation Page ● 16
Overview

HDR Corporation Page ● 17
Costs
Option i
Option iOption i...
...
Total Costs, Option 1
($)
...
Private Costs, Option 1
($)
External Costs, Option 1
($)
See “External Costs”
See “Private Costs”
Benefits
Option i
Option iOption i...…
...
Total Benefits, Option 1
($)
Revenue,Option 1
($)
External Benefits, Option 1
($)
See “Revenue” See “External Benefits”

HDR Corporation Page ● 18
Private Costs
Option i...
Option i...
Option Costs, Option 1
($)
Consumable Costs,Option 1
($)
See “Consumable”
Option i...
Renewable Energy Credit Cost,
Option 1 ($)
Calculated in same manner as “REC
Revenue”See “Variable Costs”See “Fixed Costs”
Option i...
Fixed Costs,Option 1
($)
Option i...
Variable Costs,Option 1
($)
Option i...
Other Costs,Option 1
($)
Option i...
Capital Costs,Option 1
(#)

HDR Corporation Page ● 19
Fixed Costs
Option i...
Option i...
Fixed Costs,Option1
($)
Option i...
Insurance Option 1
($)
Option i...
Option i...
Property TaxOption 1
($)
EPC Project Cost Option 1
($)
Site/Building Maintenance Costs
Option 1 ($)
Option i...
Insurance Rate per EPC Cost
Option 1 (% of EPC)
Option i...
Property Tax Rate per EPC Cost Option 1
(% of EPC)
Annual Cost for Salaried/Hourly Staff
($)
Option i...
Number of Salaried/Hourly Staff,
Option 1(#)
Option i...
Plant StaffingOption 1
($)
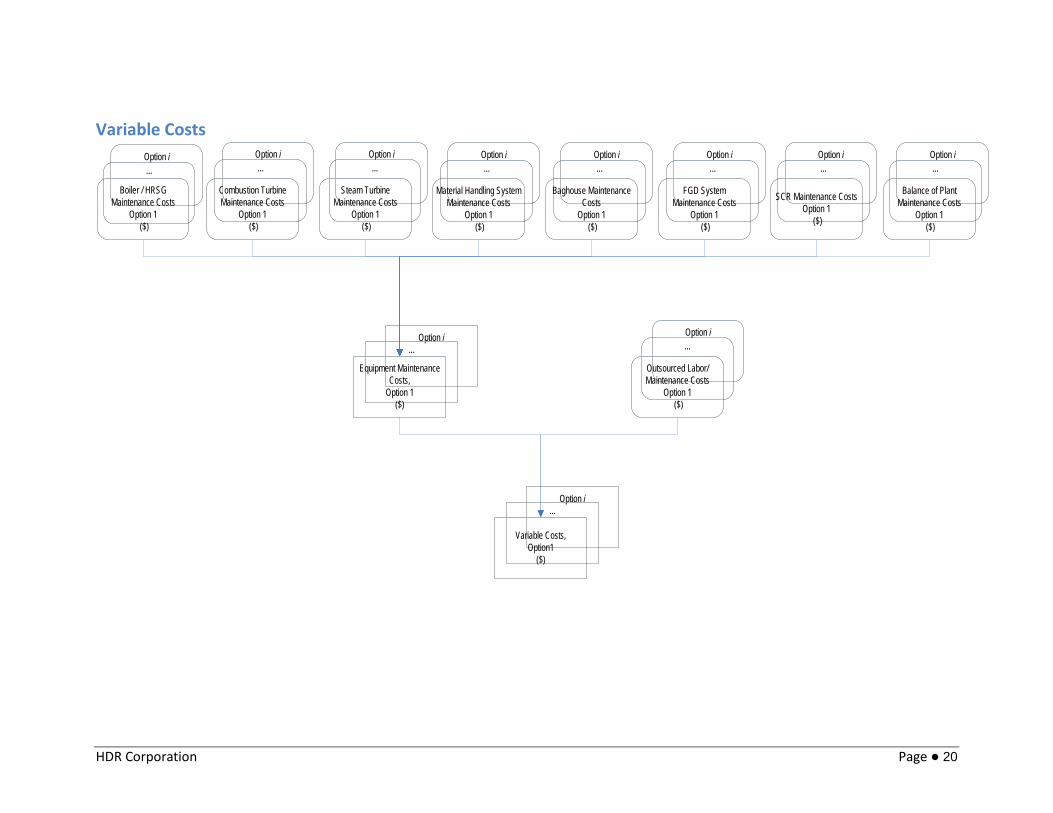
HDR Corporation Page ● 20
Variable Costs
Option i...
Variable Costs,Option1
($)
Option i...
Outsourced Labor/ Maintenance Costs
Option 1 ($)
Option i...
Equipment Maintenance Costs,
Option 1($)
Option i...
Boiler / HRSG Maintenance Costs
Option 1 ($)
Option i...
Combustion Turbine Maintenance Costs
Option 1 ($)
Option i...
Steam Turbine Maintenance Costs
Option 1 ($)
Option i...
Material Handling System Maintenance Costs
Option 1 ($)
Option i...
Baghouse Maintenance Costs
Option 1 ($)
Option i...
FGD System Maintenance Costs
Option 1 ($)
Option i...
SCR Maintenance CostsOption 1
($)
Option i...
Balance of Plant Maintenance Costs
Option 1 ($)

HDR Corporation Page ● 21
Consumables
{
Option i...
Consumables Costs,Option 1
($)
Option i...
Spare Parts CostOption 1
($)
Option i...
Startup Fuel CostsOption 1
($)
Option i...
Cost of Disposal of Byproducts Produced
Option 1 ($)
Consumable Unit Price($/ton) or ($/kgal)
Option i...
Amount of Consumable Used
Option 1 (ton) or (kgal)
-Ammonia-Clarified Water-Demineralized Water-Cycle Chemical Feed-Waste Water Treatment-Limestone-Lime-PAC-Fuel used for generation
Option i...
Cost of Delivered Materials Consumed,
Option 1($)
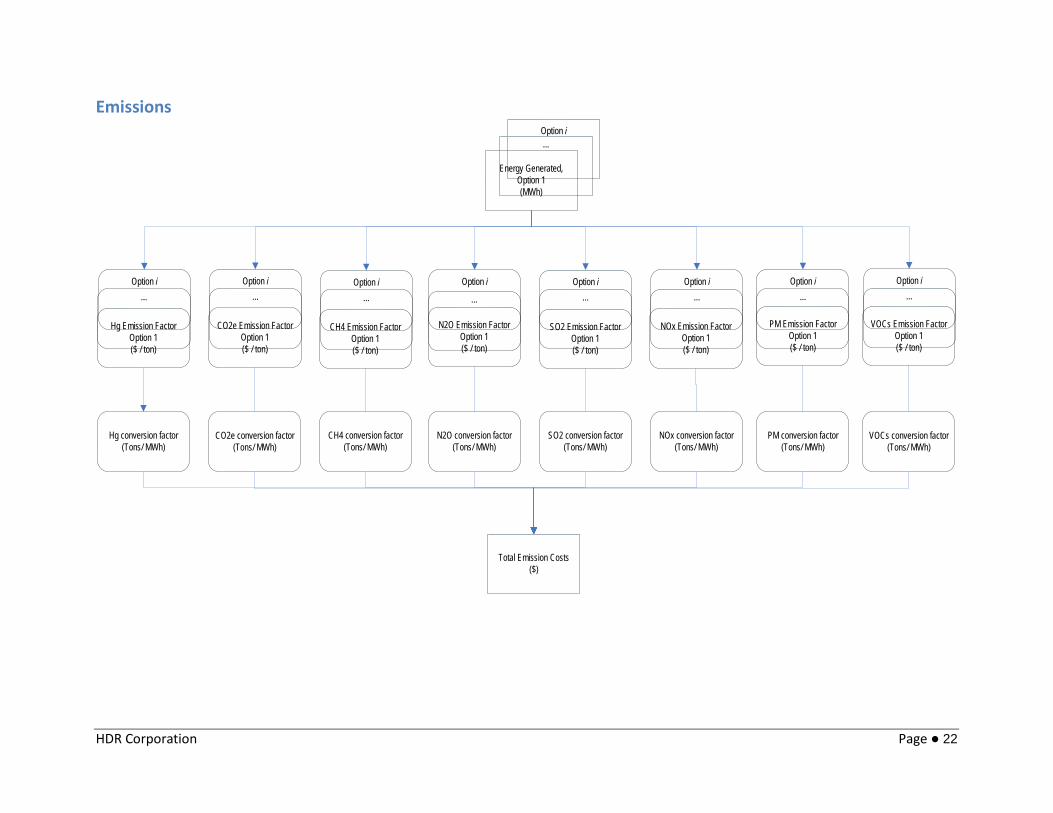
HDR Corporation Page ● 22
Emissions Option i...
CO2e conversion factor (Tons/ MWh)
CH4 conversion factor (Tons/ MWh)
N2O conversion factor (Tons/ MWh)
SO2 conversion factor (Tons/ MWh)
NOx conversion factor (Tons/ MWh)
PM conversion factor (Tons/ MWh)
VOCs conversion factor (Tons/ MWh)
Option i...
CO2e Emission Factor Option 1($ / ton)
Option i...
Option i
...
Option i...
Option i...
Option i...
Option i...
CH4 Emission Factor Option 1($ / ton)
N2O Emission Factor Option 1($ / ton)
SO2 Emission Factor Option 1($ / ton)
NOx Emission Factor Option 1($ / ton)
PM Emission Factor Option 1($ / ton)
VOCs Emission Factor Option 1($ / ton)
Energy Generated,Option 1(MWh)
Total Emission Costs($)
Option i...
Hg Emission Factor Option 1($ / ton)
Hg conversion factor (Tons/ MWh)

HDR Corporation Page ● 23
Revenue
Option i...
Option i...
Option i...
Option i...
Option i...
Option i
Option i
Option iOption i
…
......
...
Energy Market Revenue, Option 1, for site i
($)
Capacity Market Benefits, Option 1
($)
Capacity or wind integration charge
($/MW)
Revenue, Option 1,
($)
Capacity provided to capacity market, Option 1
(MW)
Expected ancillary price($/MWh)
Capacity provided to ancillary market,
Option 1(MW)
Hours providing to ancillary market,
Option 1, (hours)
Ancillary Market Benefits, Option 1
($)
Investment Tax Credit Benefits, Option 1
($)
ITC Rate(%)
Capital Costs, Option 1
($)
Option i...
Option i...
Expected electricity price($/MWh)
Percentage of Capacity Used,
Option 1(%)
Hours generating, Option 1(hours)
Option i...
Hours providing to capacity market,
Option 1(hours)
Option i...
Capacity provided to electricity market,
Option 1(MW)
Option i...
District Heating Revenue, Option 1
($)
Option i...
Renewable Energy Credit Revenue, Option 1
($)
Expected REC Price($/REC)
Option i...
Snow Melt Revenue, Option 1
($)

HDR Corporation Page ● 24
External Benefits
Option i…
External Benefits, Option 1
($)
Social value of fishing/boating,($ / day)
Option i...
Generation Reliability Benefit,Option 1
($)
Option i...
District Heating Environmental Benefit,
Option 1($)
Option i...
Snow Melting Benefit,Option 1
($)
Option i...
Water Quality Improvement Benefit,
Option 1($)
Option i...
Recreation Benefits, Option 1
($)
Option i...
Willingness to pay OR Option Value,
Option 1, ($)
Option i...
Existence value, Option 1,
($)
See “Reliability”
Option i...
Incremental fIshing/boating days,
Option 1(days)
Option i...
Capital Cost of Snow Clearing, Option 1,
($)
Option i...
Operating Cost of Snow Clearing,
Option 1($)
State Social Cost of Emissions per
Megawatt Generated ($ / MW)
Option i...
Heating Energy Saved,Option 1,
(MW)Building Floor Space,
(Sq-ft)
Option i...
District Heating Rate, after investment,
Option 1 ($ / sq-ft)
Option i...
Heating Cost Savings per Area,Option 1($ / sq-ft)
Option i...
District Heating,Cost Savings
Option 1($)
District Heating Rate, current
($ / sq-ft)
Option i...
District Heating Social Benefit,Option 1
($)

HDR Corporation Page ● 25
Reliability
Option i...
Generation Reliability Benefit,Option 1
($)
Number of Customers within Affected Area
(#)
Option i...
Social Cost Avoided due to Increased
Reliability, Option 1($)
Average Cost of Outage, Current
($ / year per Customer)
Option i...
Average Cost of Outage, After
Improvement, Option 1($ / year per customer)

HDR Corporation Page ● 26
External Costs
Option i…
External Costs,Option 1
($)
Option i…
Emission Cost,Option 1
($)
Option i…
Social Value of Water Consumption Cost,
Option 1($)
See “Emissions”
Option i...
Water ConsumptionOption 1 (gallons)
Option i...
Water Consumption,(Gallons/MWh)
Social Value of Water,($ / gallon)
Option i...
Energy Generated,Option 1(MWh)

HDR Corporation Page ● 27
Some costs and benefits were considered by HDR, but were deemed unrealistic or their monetized value would be a double-count of other costs or benefits. As such, they will not be included in the SROI analysis. A preliminary version of the omitted elements is shown in Table 3.
Table 3 - Omitted Costs & Benefits
Name Impact Type
Description
Fuel Flexibility Benefit Measures the benefit of being able to use many different types of fuels when conditions are suitable to each
Energy Security Benefit ---
Cost of Delay Cost The cost incurred because of schedule delays in project construction

HDR Corporation Page ● 28