HOKKAIDO SET NET FISHERY S EFFORTS TOWARD ......FISHERMEN IN HOKKAIDO The number of fishermen in...
23
HOKKAIDO SET NET FISHERY’S EFFORTS TOWARD ECO-LABEL Februay 2015 Hokkaido gyoren
Transcript of HOKKAIDO SET NET FISHERY S EFFORTS TOWARD ......FISHERMEN IN HOKKAIDO The number of fishermen in...

HOKKAIDO SET NET FISHERY’SEFFORTS TOWARD ECO-LABEL
Februay 2015Hokkaido gyoren

FISHERY IN HOKKAIDO

FISHERY IN HOKKAIDO
Fishery production in 2013:1,3 million tons (80% of 1993)
286.4 billion yen (88% of 1993)
20% of total Japanese fishery production amount
Scallop, salmon, and kelp account for 53 %.Majority is stock enhancement fishery, which supports fishery by releasing artificially raised fry.
1,5001,7001,9002,1002,3002,5002,7002,9003,1003,3003,500
0200400600800
1,0001,2001,4001,6001,8002,000
1993
1994
1995
1996
1997
1998
1999
2000
2001
2002
2003
2004
2005
2006
2007
2008
2009
2010
2011
2012
2013
生産量 金額catch value
Scallop, 53.7
Salmon, 53.2
Kelp, 25.2
Squid, 17.9Alaska pollack,
13.0
Saury, 10.5
Octopus, 10.3
Cod, 6.6
Sea cucumber, 5.9
Crabs, 5.9
Atka mackerel, 5.7
Others, 40.0
catch value (billion yen)
Scallop
Salmon
Kelp
Squid
Alaska pollack
Saury
Octopus
Cod
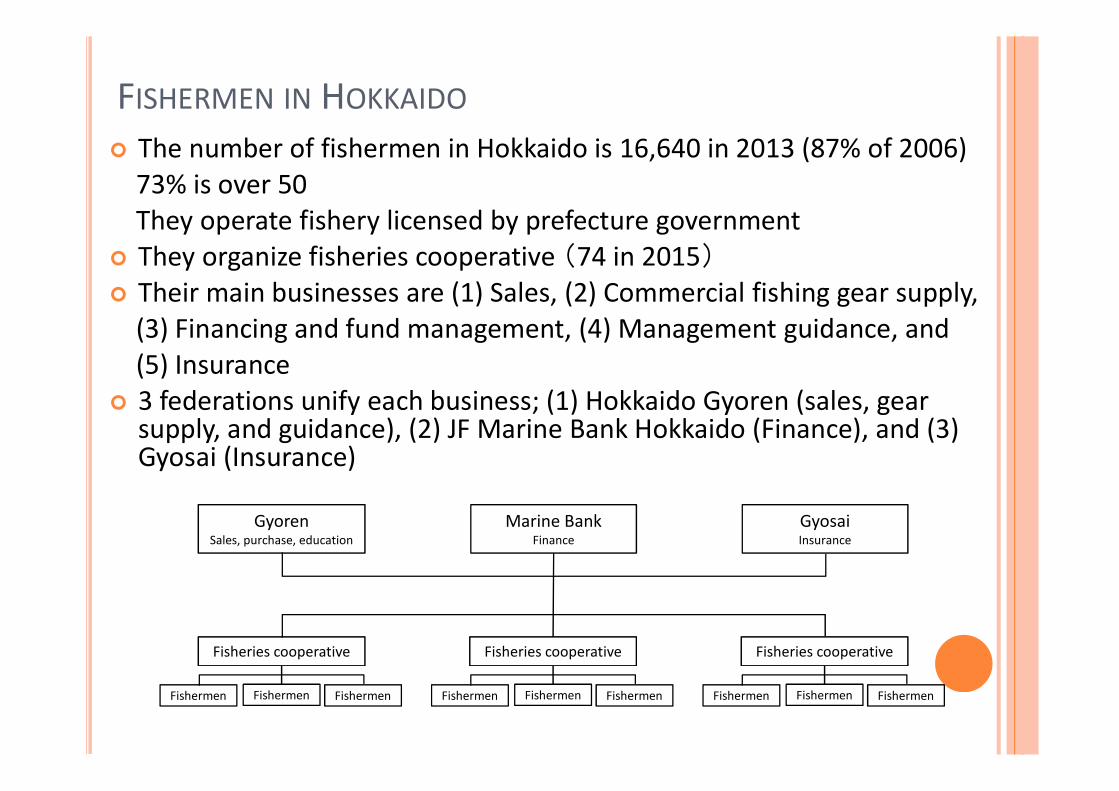
FISHERMEN IN HOKKAIDO The number of fishermen in Hokkaido is 16,640 in 2013 (87% of 2006)
73% is over 50They operate fishery licensed by prefecture government
They organize fisheries cooperative (74 in 2015) Their main businesses are (1) Sales, (2) Commercial fishing gear supply,
(3) Financing and fund management, (4) Management guidance, and (5) Insurance
3 federations unify each business; (1) Hokkaido Gyoren (sales, gear supply, and guidance), (2) JF Marine Bank Hokkaido (Finance), and (3) Gyosai (Insurance)
Fisheries cooperative
Fishermen Fishermen Fishermen
Fisheries cooperative
Fishermen Fishermen Fishermen
Fisheries cooperative
Fishermen Fishermen Fishermen
GyorenSales, purchase, education
Marine BankFinance
GyosaiInsurance

ABOUT US
Establishment 1949 Subscription 5.04 billion yen Gross sales 326.2 billion yen (Mar 2014) Our role(Sales/Marketing)Fishery products and processed products(Purchasing)Fishing materials and marine fuel(Education)Management guidance, lobby for seafood measures, environmental operation to protect resources
Japan’s largest prefectural fisheries federation of economic and educational activity
http://www.gyoren.or.jp
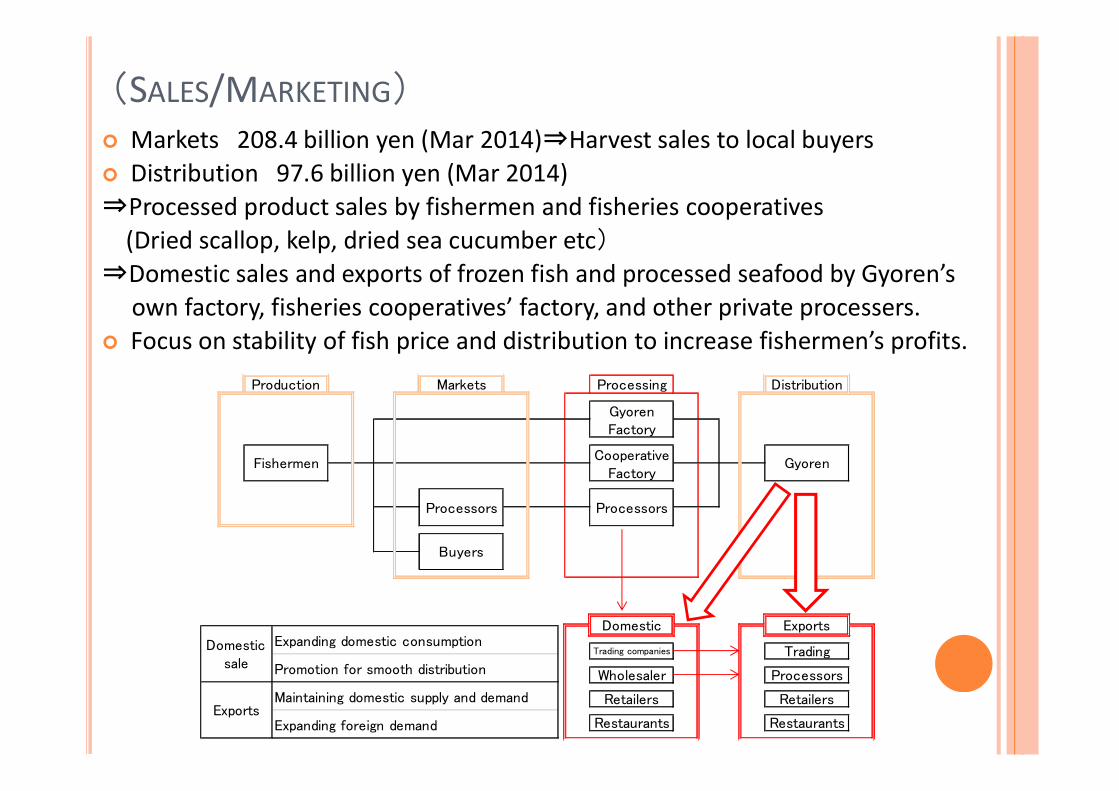
(SALES/MARKETING) Markets 208.4 billion yen (Mar 2014)⇒Harvest sales to local buyers Distribution 97.6 billion yen (Mar 2014)⇒Processed product sales by fishermen and fisheries cooperatives
(Dried scallop, kelp, dried sea cucumber etc)⇒Domestic sales and exports of frozen fish and processed seafood by Gyoren’s
own factory, fisheries cooperatives’ factory, and other private processers. Focus on stability of fish price and distribution to increase fishermen’s profits.
GyorenFactory
CooperativeFactory
Processors
Wholesaler
Retailers
Restaurants
Processors
Retailers
Restaurants
Production Markets Processing Distribution
Exports
TradingTrading companies
Domestic
Buyers
Processors
GyorenFishermen
Expanding domestic consumption
Promotion for smooth distribution
Maintaining domestic supply and demand
Expanding foreign demandExports
Domesticsale
CHUM SALMON SET NET FISHERYIN HOKKAIDO

ABOUT THE FISHERY
A fishery licensed by Hokkaido governor.Valid for 5 years.(924 nets are licensed in 2015)
The fishing gear is set during chum salmon’s run season.Fixed with sand bags and never changes its position.
A passive fishing method which attracts migrating salmon into the gear.The vessel catches the fish alive.Non-target species are released on site.Impacts on both fish body and environment is much smaller than active fisheries like trolling.
Set net model
Folding up the net

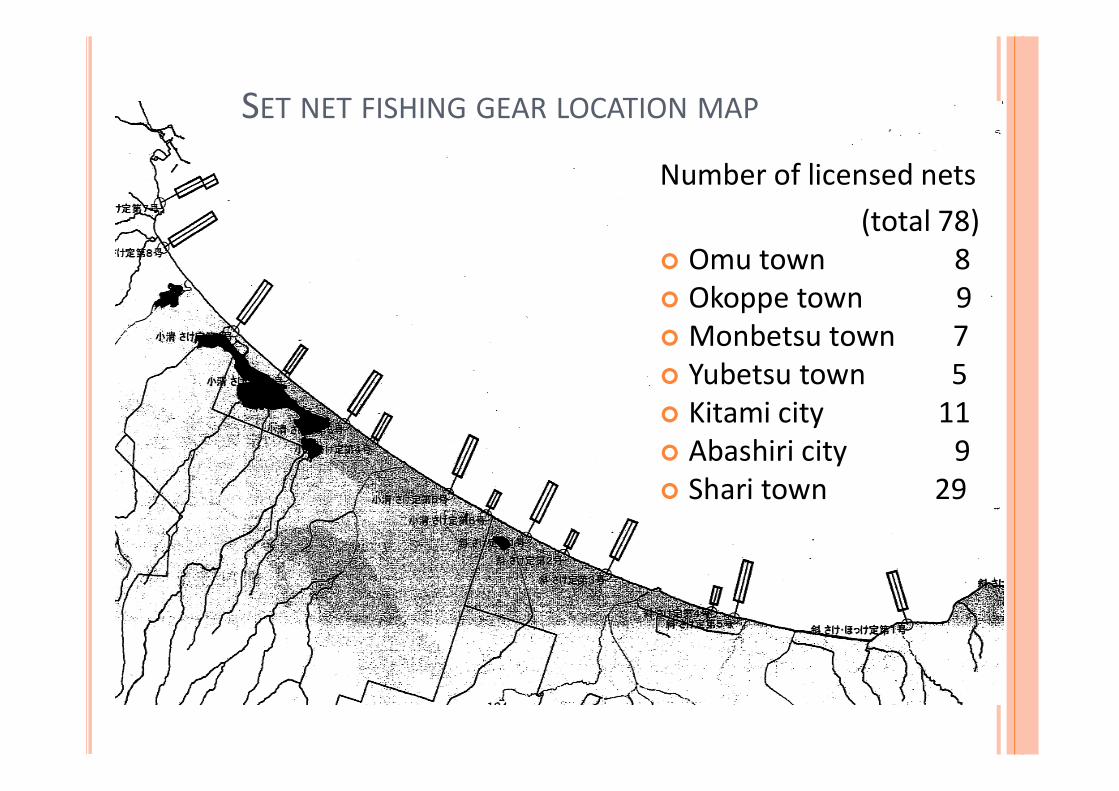
定置網敷設位置例示
定置免許統数(78ヵ統)雄武町 8ヵ統興部町 9ヵ統紋別市 7ヵ統湧別町 5ヵ統北見市 11ヵ統網走市 9ヵ統斜里町 29ヵ統
SET NET FISHING GEAR LOCATION MAP
Number of licensed nets(total 78)
Omu town 8 Okoppe town 9 Monbetsu town 7 Yubetsu town 5 Kitami city 11 Abashiri city 9 Shari town 29

STOCK MANAGEMENTOF CHUM SALMON IN HOKKAIDO

◎Appropriate management of marine resource
⇒Planned management of catch and target based on local ordinance(Production goal is set every 5 years by academic experts’ consultation)
◎Stock management plan development by Hokkaido Government
⇒Rationale: Information from official research institutes including run predict and medium- to long-term resource use goal
⇒Agreement: Local salmon enhancement associations and fishery adjustment commisions
◎Guideline toward appropriate resource use and reproduction
⇒Rationale:Information from official research institutes including run predict and medium- to long-term resource use goal
⇒Measures:Autonomous regulation including fishery stop according to salmon run to coastal area and rivers
⇒Operation:Decided at resource users(fishers) meeting, operated in each area

1.Pre-season
Predicts salmon run ofcoastal area and river
・Develop hatchery management plan according to medium-to long-term stock management goal・Decide operation guideline for appropriate resource use and reproduction
民間増殖団体
漁業者
地区組織
漁業協同組合
漁業者
漁業者
漁業者
Decision ofManagement plan and operation guideline
agreement
2.In-season
Analyzes salmon run
If short of the target
Discuss regulations and report the result
Local organs
Local organs
漁業者の代表
民間増殖団体 地区行政機関
公的研究機関
Discuss regulations
Instruction漁業者
漁業協同組合
漁業者
漁業者
漁業者
Implements regurationsEx. Net removal, season shortening
Official institute
Official institute
Government,commision
Government,organs concerned
Private hatchery
Official institutes Fisheries representatives
Private hatchery Local governments
Local organs
Fisheries cooperative
Fishermen Fishermen Fishermen
Fisheries cooperative
Fishermen Fishermen Fishermen

DISTRIBUTION OF HOKKAIDO CHUM SALMONAND WORLD SALMON PRODUCTION

0t
50,000t
100,000t
150,000t
200,000t
250,000t
k@0
k@100
k@200
k@300
k@400
k@500
k@600
1992 1993 1994 1995 1996 1997 1998 1999 2000 2001 2002 2003 2004 2005 2006 2007 2008 2009 2010 2011 2012 2013 2014
Hokkaido chum salmon harvest and average price chart 全道水揚 全道単価catch price
0t
50,000t
100,000t
150,000t
200,000t
250,000t
1992 1993 1994 1995 1996 1997 1998 1999 2000 2001 2002 2003 2004 2005 2006 2007 2008 2009 2010 2011 2012 2013 2014
Hokkaido chum salmon product chart
ミール
輸出向
すり身
冷凍向
塩蔵向
生鮮向
meal
export
mince
frozen
salted
fresh
k@0
k@100
k@200
k@300
k@400
0t
20,000t
40,000t
60,000t
80,000t
1992 1993 1994 1995 1996 1997 1998 1999 2000 2001 2002 2003 2004 2005 2006 2007 2008 2009 2010 2011 2012 2013 2014
Japanese exports of salmon その他(t) 中国(t) 単価(k@)ChinaOthers price
0t
100,000t
200,000t
300,000t
400,000t
500,000t
600,000t
1992 1993 1994 1995 1996 1997 1998 1999 2000 2001 2002 2003 2004 2005 2006 2007 2008 2009 2010 2011 2012 2013 2014
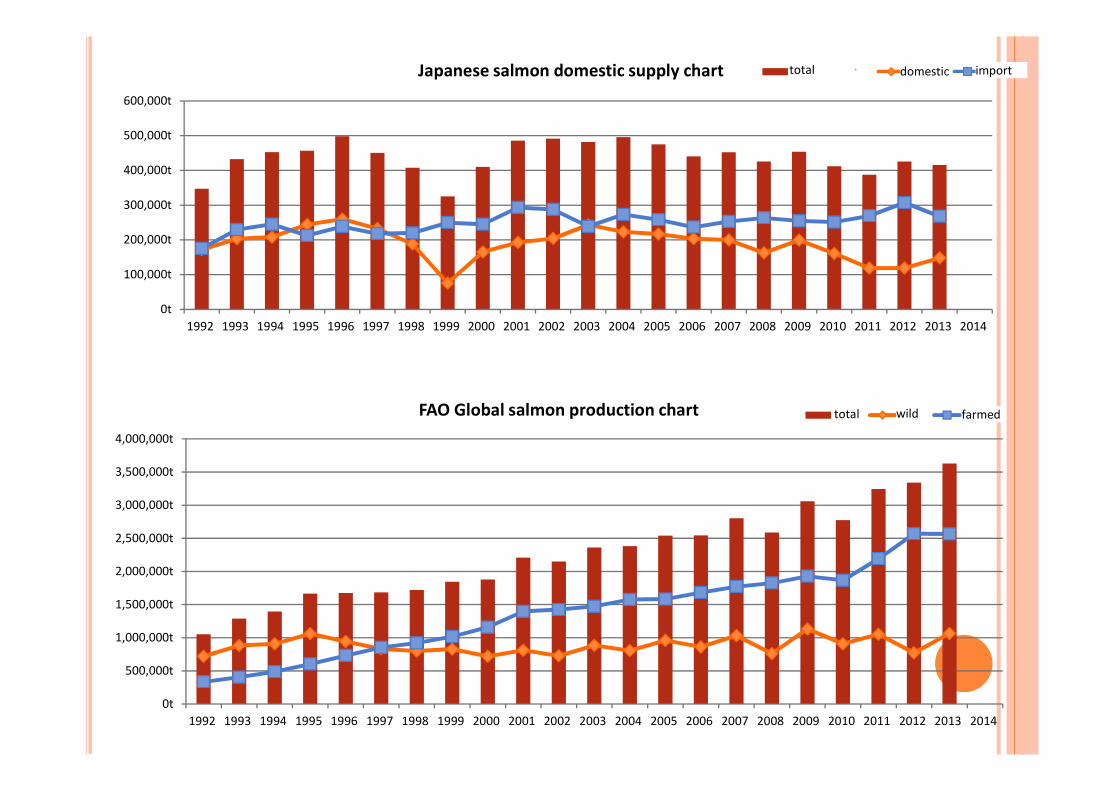
Japanese salmon domestic supply chart 国内供給計 国産 輸入total domestic import
0t
500,000t
1,000,000t
1,500,000t
2,000,000t
2,500,000t
3,000,000t
3,500,000t
4,000,000t
1992 1993 1994 1995 1996 1997 1998 1999 2000 2001 2002 2003 2004 2005 2006 2007 2008 2009 2010 2011 2012 2013 2014
FAO Global salmon production chart 合計 天然 養殖total wild farmed

1992~1999
0t
50,000t
100,000t
150,000t
200,000t
250,000t
k@0
k@100
k@200
k@300
k@400
k@500
k@600
1992 1993 1994 1995 1996 1997 1998 1999
全道水揚 全道単価catch price
0t
50,000t
100,000t
150,000t
200,000t
250,000t
1992 1993 1994 1995 1996 1997 1998 1999
ミール
輸出向
すり身
冷凍向
塩蔵向
生鮮向
meal
export
mince
frozen
salted
fresh
k@0
k@100
k@200
k@300
k@400
0t10,000t20,000t30,000t40,000t50,000t60,000t70,000t
1992 1993 1994 1995 1996 1997 1998 1999
中国(t) その他(t) 単価(k@)OthersChina price
0t
100,000t
200,000t
300,000t
400,000t
500,000t
600,000t
1992 1993 1994 1995 1996 1997 1998 1999
国内供給計 国産 輸入total domestic import
0t500,000t
1,000,000t1,500,000t2,000,000t2,500,000t3,000,000t3,500,000t4,000,000t
1992 1993 1994 1995 1996 1997 1998 1999
合計 天然 養殖total wild farmed
・Hokkaido: catch increase, price down*fish meal, export, and fresh sales increased as countermeasures・Japan: Domestic and import roughly the same level・Global salmon: 1.5 million tons*Farmed surpasses wild in 1997
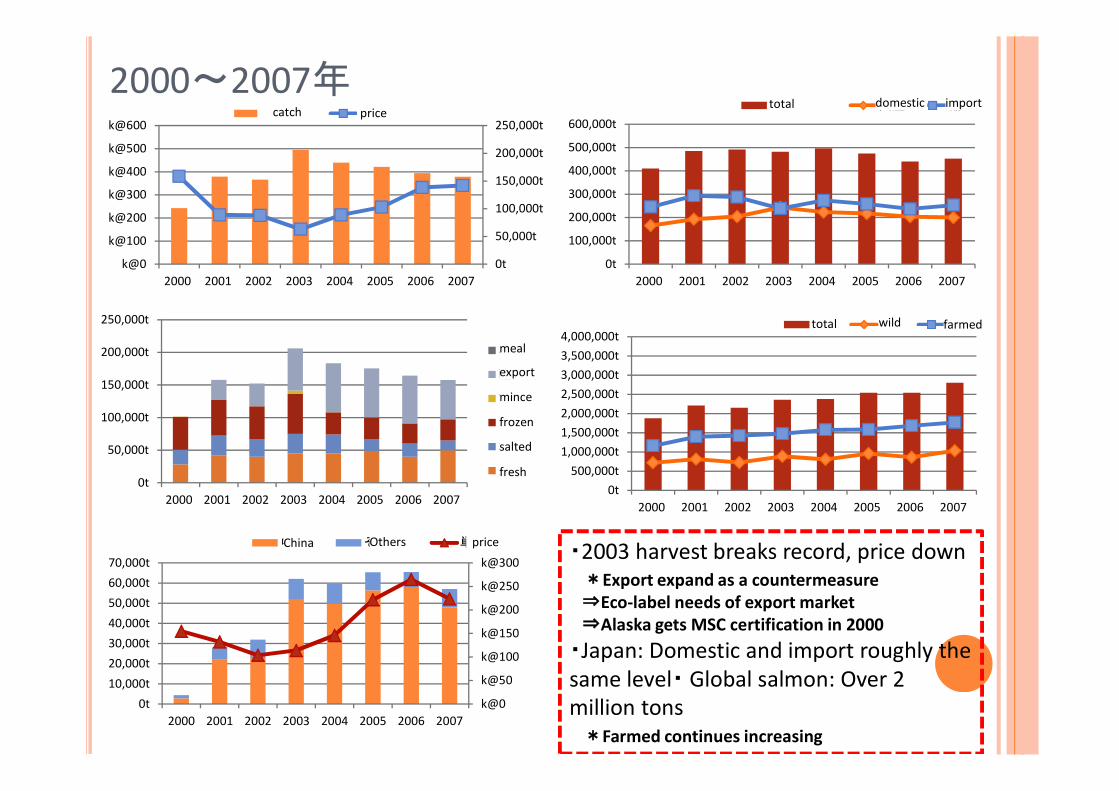
2000~2007年
0t
50,000t
100,000t
150,000t
200,000t
250,000t
k@0
k@100
k@200
k@300
k@400
k@500
k@600
2000 2001 2002 2003 2004 2005 2006 2007
全道水揚 全道単価catch price
0t
50,000t
100,000t
150,000t
200,000t
250,000t
2000 2001 2002 2003 2004 2005 2006 2007
ミール
輸出向
すり身
冷凍向
塩蔵向
生鮮向
meal
export
mince
frozen
salted
fresh
k@0
k@50
k@100
k@150
k@200
k@250
k@300
0t10,000t20,000t30,000t40,000t50,000t60,000t70,000t
2000 2001 2002 2003 2004 2005 2006 2007
中国(t) その他(t) 単価(k@)OthersChina price
0t
100,000t
200,000t
300,000t
400,000t
500,000t
600,000t
2000 2001 2002 2003 2004 2005 2006 2007
国内供給計 国産 輸入total domestic import
0t500,000t
1,000,000t1,500,000t2,000,000t2,500,000t3,000,000t3,500,000t4,000,000t
2000 2001 2002 2003 2004 2005 2006 2007
合計 天然 養殖total wild farmed
・2003 harvest breaks record, price down*Export expand as a countermeasure⇒Eco-label needs of export market⇒Alaska gets MSC certification in 2000・Japan: Domestic and import roughly the same level・ Global salmon: Over 2 million tons*Farmed continues increasing

2008~2014年
0t
50,000t
100,000t
150,000t
200,000t
250,000t
k@0
k@100
k@200
k@300
k@400
k@500
k@600
2008 2009 2010 2011 2012 2013 2014
全道水揚 全道単価catch price
0t
50,000t
100,000t
150,000t
200,000t
250,000t
2008 2009 2010 2011 2012 2013 2014
ミール
輸出向
すり身
冷凍向
塩蔵向
生鮮向
meal
export
mince
frozen
salted
fresh
k@0
k@50
k@100
k@150
k@200
k@250
k@300
k@350
0t
10,000t
20,000t
30,000t
40,000t
50,000t
60,000t
70,000t
2008 2009 2010 2011 2012 2013 2014
中国(t) その他(t) 単価(k@)OthersChina price
0t
100,000t
200,000t
300,000t
400,000t
500,000t
600,000t
2008 2009 2010 2011 2012 2013 2014
国内供給計 国産 輸入total domestic import
0t
1,000,000t
2,000,000t
3,000,000t
4,000,000t
2008 2009 2010 2011 2012 2013 2014
合計 天然 養殖total wild farmed
・Catch remains 100-120 thousand tons, price high*Earthquake reduced export sharply in 2011・Japan: Domestic and import roughly the same level*Substantial Chilean coho enters at low price in
2011-2012・Global salmon: Over 3 million tons*More increase of farmed salmon
HOKKAIDO CHUM SALMON FISHERY’SEFFORTS TOWARD ECO-LABEL

2007Start looking into eco-label certificationMSC pre-assessment in whole area of Hokkaido(objective)- Improvement of chum salmon price and value,- global promotion,- response to export counterpart’s needs and competitor,including Alaska
2011Start MCS full-assessment in Kitami region
2012-13Two on-site assessments and meetings with assessment bodyFailed to arrive at a consensusPeer review
2014Still dissensus after peer reviewDeem inevitable impact on current fishery and hatchery if continueWithdraw from MSC assessment
EFFORTS TOWARD ECO-LABEL
<Kitami region>Hokkaido’s largest landing
region, facing the Okhotsk sea
2013 54,161t (45 % of Hokkaido share)
2014 38,348t (36 %)

CURRENT STATUS OF OUR ACTIVITY It is still important to ensure Hokkaido chum salmon
consumption in Japan and abroad for stable distribution. While global farmed salmon production is increasing and now
over 3.5 million tons, wild caught has remained steady at 1 million tons.
Since worldwide demand for seafood is increasing, the global value of Hokkaido chum salmon as wild is supposed to be on a upward trend.
Now, global promotion tools including eco-label and FIPs will lead to not only further value improvement, but also stock stabilization.
It is difficult to make foreign assessment body understand Japanese fishery management and hatchery project.
Currently we are now considering eco-label which fits reality of Japanese fishery.

(APPENDIX)HOKKAIDO SCALLOP MSC CERTIFICATION
2010 Apr Full-assessment, Jul On-site assessment 2012 Feb-Nov Peer review 2013 Apr Public review May Certification 2014 Mar Annual audit
Scope: 98 % of Hokkaido scallop (83% of Japan)①Okhotsk sea, Nemuro strait: seabed fishery②Funka bay, Lake Saroma: hanging enhancement
Japanese share of international market:Wild 40 %, farmed 10 % (FAO statistics)
Exports to US, China are on the increasing(scallop meat etc)