
HMS Group 6m 2012 resultsgrouphms.com/upload/grouphms/pdf/6m_HMS_2013.pdfSource: Frost & Sullivan...
43
HMS Group Investor Presentation October 2013
Transcript of HMS Group 6m 2012 resultsgrouphms.com/upload/grouphms/pdf/6m_HMS_2013.pdfSource: Frost & Sullivan...

HMS Group Investor Presentation
October 2013

WHO WE ARE
2
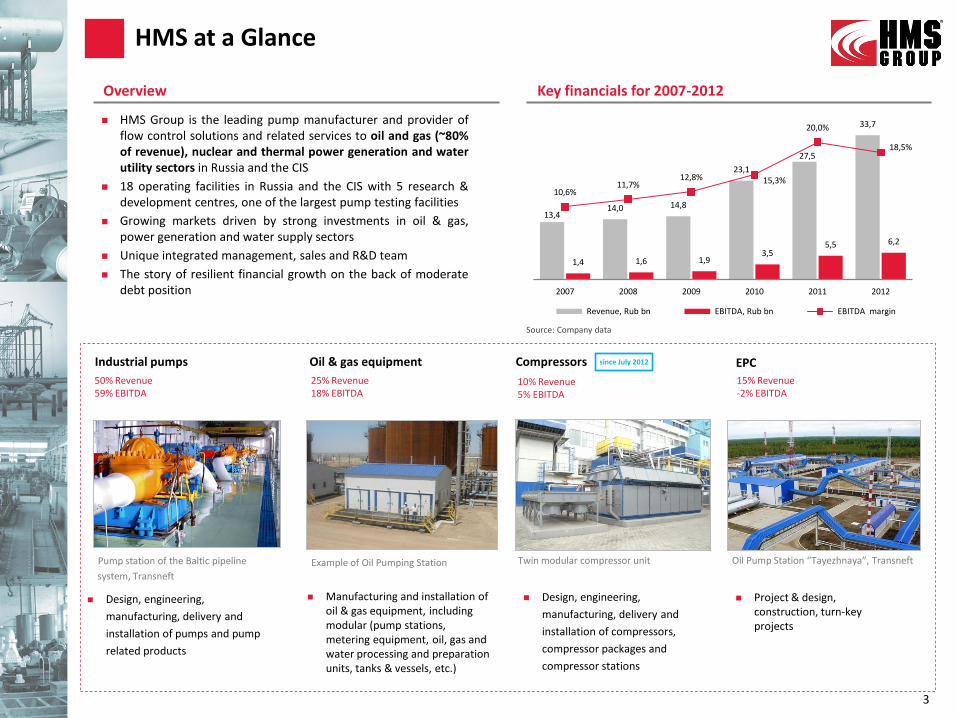
13,4 14,0 14,8
23,1
27,5
33,7
1,4 1,6 1,9 3,5
5,5 6,2
10,6% 11,7%
12,8% 15,3%
20,0%
18,5%
2007 2008 2009 2010 2011 2012
Revenue, Rub bn EBITDA, Rub bn EBITDA margin
HMS at a Glance
3
HMS Group is the leading pump manufacturer and provider of flow control solutions and related services to oil and gas (~80% of revenue), nuclear and thermal power generation and water utility sectors in Russia and the CIS
18 operating facilities in Russia and the CIS with 5 research & development centres, one of the largest pump testing facilities
Growing markets driven by strong investments in oil & gas, power generation and water supply sectors
Unique integrated management, sales and R&D team
The story of resilient financial growth on the back of moderate debt position
Key financials for 2007-2012 Overview
Source: Company data
EPC Oil & gas equipment Industrial pumps
Pump station of the Baltic pipeline
system, Transneft
Example of Oil Pumping Station Oil Pump Station “Tayezhnaya”, Transneft
Design, engineering,
manufacturing, delivery and
installation of pumps and pump
related products
Manufacturing and installation of oil & gas equipment, including modular (pump stations, metering equipment, oil, gas and water processing and preparation units, tanks & vessels, etc.)
Project & design, construction, turn-key projects
Compressors
Twin modular compressor unit
since July 2012
Design, engineering,
manufacturing, delivery and
installation of compressors,
compressor packages and
compressor stations
50% Revenue 59% EBITDA
25% Revenue 18% EBITDA
15% Revenue -2% EBITDA
10% Revenue 5% EBITDA

Way of the market consolidator – from pumps to integrated solutions based on excellent R&D base
Significant demand on the key market Leading installed base in Russia Exposure to key growth markets
CAPEX of Russian oil majors 2012-2020F more than $50 bn Revenue breakdown by segments, 2012 Installed pumps and units
upstream
7%
9%
11%
9%
2% 2% 2%
-1%
1%2%
1%0% 0% 0%
1% 1%
0% 0% 0% 0%
0
100
200
300
400
500
600
2000 2002 2004 2006 2008 2010 2012F 2014F 2016F 2018F 2020F
mn
to
nn
es
Greenfield, 2009-2020F
Traditional oil regions, 2009-2020F
Total production, 2000-2008
Production growth, % YoY
2009–2012
Pump-based Integrated Solutions
2007–2008
Construction
2004–2006
Modular Equipment Design
&
Manufacturing
2003
Pump Design
&
Manufacturing
1993–2002
Pump Trading
Unique Business Model
4
Water Thermal energy midstream
Nuclear energy
Source: Company data Source: Company data Source: REnergyCo, Rosstat
2012 Revenue
Rub 33.7 bn
Pump- and Compressor-based Integrated Solutions
2012–Today
Oil industry
INVESTMENT HIGHLIGHTS
5

33 68 109 165 173
291 87 90
151
121 214
380
92
86
158
117
126
200
76
69
97
93
114
195
2008 2012 2017E
Tanks & Vessels Tubular Furnaces & Line Heaters Oil, Gas, Water Processing Units Oil & Gas Metering Units Associated Gas Processing & Transport Units AGMUs Pump Stations Other Equipment
970 1662
3771
166
259
482
224
269
462
2008 2012 2017E
Refrigeration
General Service (Air)
Gas Processing
Oil & Gas Production and Transportation
473 494 938
485 455
976
110 193
315
889 1 101
1 665
180
484
499
2008 2012 2017E
Oil & Gas (surface)
Oil & Gas (submersible)
Power Generation
Municipal Water
Other
Modernization of basic industries, backed by state development programs
leads to expenditure on equipment, including specialized pumps
Pumps for water injection, oil refineries and municipal water are expected
to demonstrate the highest growth rate
Modest growth in surface pumps for oil and gas industry is largely explained
by diminished growth in the segment of pumps for oil transportation due to
the completion of major pipeline project (ESPO), after an explosive
expansion over 2008-2012
Oil and gas equipment is expected to grow with double-digit pace driven by
modernization of the current and development of new oilfields, increase of
associated gas utilization ratio, installation of modern metering units
Compressors are expected to grow with CAGR of 17.8% thanks to a number
of new pipelines development programs, increase of associated gas
utilization ratio
6,686
1,847
Supportive Industry Fundamentals
6
4,393
2,727
Pump market revenues in Russia, US mn
Source: Frost & Sullivan research
1
2,137
1,655
784
O&G equipment market revenues, US mn
Comments
CAGR 2008-12 2012-17E
O&G surface includes:
Water injection -4.2% 13.6%
Oil transportation 59.5% -12.6%
Oil downstream 12.4% 15.6%
Municipal water -1.6% 16.5%
Power generation 15.0% 10.3%
Total 6.3% 10.0%
940
CAGR 2008-12 2012-17E
Pump stations 1.2% 11.0%
AGMUs 1.0% 11.2%
Associated gas processing & transport units
15.3% 12.7%
Total 4.6% 12.0%
2,950
CAGR 2008-12 2012-17E
Oil & gas production and transportation
13.6% 19.1%
Gas processing 12.0% 1303%
General service 5.3% 11.7%
Refrigeration 20.2% 16.3%
Total 12.4% 17.8%
Compressor market revenues, US mn

2,7 2,8 2,7
1,3 1,8 2,0
4,0
4,6 4,7
2010 2011 2012
Other players revenue, Rub bn
HMS Group revenue, Rub bn
7,4 12,6 14,5
10,1
13,9 15,4 17,5
26,5
29,9
2010 2011 2012
Other players revenue, Rub bn
HMS Group revenue, Rub bn
1,6 2,1 2,2
0,9
1,0 1,3
2,4
3,1 3,5
2010 2011 2012
Other players revenue, Rub bn
HMS Group revenue, Rub bn
Pumps and Oil & gas equipment
Oil and gas industry
The Leading Provider of Flow Control Solutions
Leading market share in key markets
HMS Group has leading positions in almost every core target market, and managed to expand its market share in 2012
The Group’s market share in the pumps and equipment for the oil & gas industry remained flat, with overall growth on par with the market
In the pumps for water utilities and power generation applications segment, HMS outperformed market growth thanks to strong demand for water utilities pumps and higher revenue from pumps for nuclear application (contracts signed in previous years)
Summary
2
Source: Company data
Water utilities Power generation
Industrial pumps only Industrial pumps only
7
CAGR 2010-2012 Market 31%
HMS 24%
CAGR 2010-2012 Market 7%
HMS 24%
CAGR 2010-2012 Market 20%
HMS 23%

Source: Frost & Sullivan report 2009, Transneft website (www.transneft.ru)
Novorossiysk
Moscow
Unecha
Primorsk
Kozmino
Skovorodino
Verkhnechonskoye
Tengiz
Timano-Pechora basin
Caspian Pipeline Consortium expansion (35 MMt, 1,510 km)
Baltic Pipeline System-II (50 MMt, 1,000 km)
ESPO-I and ESPO-I capacity expansion (50 MMt, 2,694 km)
Russia
ESPO-II and ESPO-II capacity expansion (47 MMt, 2,046 km)
Talakanskoye
Purpe-Samotlor (25 MMt, 430 km)
Vankor
Salymskoye
Samotlor
Nizhnevartovsk
Priobskoye
Purpe
Tyamkinskoye
Russkoye
Taishet
Zapolyarnoye-Purpe (45 MMt, 536 km)
Syzran
Tikhoretsk-Tuapse 2 (12 MMt, 295 km)
Haryaga Yuzhny
Khylchuyu
Haryaga-Yuzhny Khylchuyu (8 MMt, 160 km)
Yurubcheno-Tokhomskoe
Yurubcheno-Tokhomskoe-Taishet (18 MMt, 600 km)
Tuapse
Tikhoretsk
Komsomolsky NPZ -port De-Kastry (9 MMt, 313 km)
Oil pipeline projects
Mature oil producing regions
Underdeveloped oil producing regions
Developing oil fields
HMS participation confirmed
Oil products pipeline projects
Komsomolsky NPZ
De-Kastri
“Yug” (South) (9 MMt, 1,465 km)
Komsomolsky NPZ -De-Kastry (n.d., 300 km)
Milestone Projects in the Oil&Gas
Zapolyarnoye
> 3 bn tons of oil reserves to be
developed in the next several
years
Oil production development
> 10,000 km of pipelines to be constructed or
replaced
> 140 of pump stations to be constructed or
reconstructed
> 550 reservoirs with total capacity of almost 10
mln m3 to be reconstructed
Transneft investment program 2010-2017
Iraq
Significant installed base of HMS pumps from Soviet and post Soviet periods
Currently undertaking projects for Oil Ministry and BP
Export markets
26 oil refineries to be
reconstructed & modernized
Oil refining development
8
Trebs & Titov (140 MMt, 2,151 km)
Prirazlomnoye
Taas-Yuryakh
Verkhne-Shapshinskoe
Oil & gas production and oil transportation
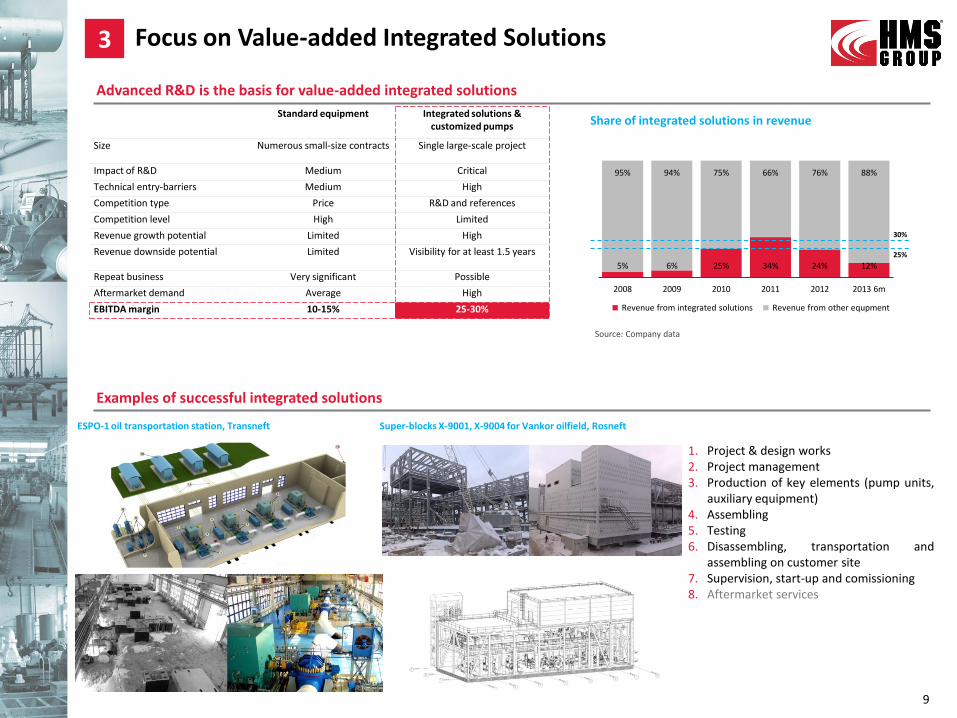
5% 6% 25% 34% 24% 12%
95% 94% 75% 66% 76% 88%
2008 2009 2010 2011 2012 2013 6m
Revenue from integrated solutions Revenue from other equpment
Share of integrated solutions in revenue
Focus on Value-added Integrated Solutions
Source: Company data
Advanced R&D is the basis for value-added integrated solutions
9
Standard equipment Integrated solutions & customized pumps
Size Numerous small-size contracts Single large-scale project
Impact of R&D Medium Critical
Technical entry-barriers Medium High
Competition type Price R&D and references
Competition level High Limited
Revenue growth potential Limited High
Revenue downside potential Limited Visibility for at least 1.5 years
Repeat business Very significant Possible
Aftermarket demand Average High
EBITDA margin 10-15% 25-30%
3
Super-blocks X-9001, X-9004 for Vankor oilfield, Rosneft ESPO-1 oil transportation station, Transneft
Examples of successful integrated solutions
25%
30%
1. Project & design works 2. Project management 3. Production of key elements (pump units,
auxiliary equipment) 4. Assembling 5. Testing 6. Disassembling, transportation and
assembling on customer site 7. Supervision, start-up and comissioning 8. Aftermarket services

Industry HMS IGSS Eurasia Drilling
Weir Flowserve Dresser
Rand Sulzer KSB Grundfos Technip Shlumberger
Baker Hughes
Gea Grasso
Above ground
Pumps
Power generation
Oil and Gas
Water
Oil & gas equipment
Equipment
Repair
EPC Project & design
Construction
Compressors
Oil up- & midstream
Natural gas
Metals & mining
Under ground
Service
Seismic research
Well service
Drilling
Oil product increase
Operations on Protected Markets in Russia
Source: Company data
4
10
Where we compete…
Russian International
Limited R&D
Small scale of operations
Pump manufacturing is a non-core business for many players (Votkinsk Plant, Uralhydromash, Katasky Plant)
Products are often not in direct competition with HMS product line
Not well-positioned in terms of operational efficiency due to limited scale of operations
No single competitor in all key segments
Global players Lack of local engineering expertise (Weir, KSB, Sulzer, Grundfos, Flowserve)
Lack of references with Russian clients
Not well-positioned in terms of price of products
Chinese players Lack of relevant technologies to produce customized pumps
Lack of references
Inapplicable for mission-critical applications
No brand names
No established relationships with Russian clients
Customized Equipment Standard Equipment
Russian players
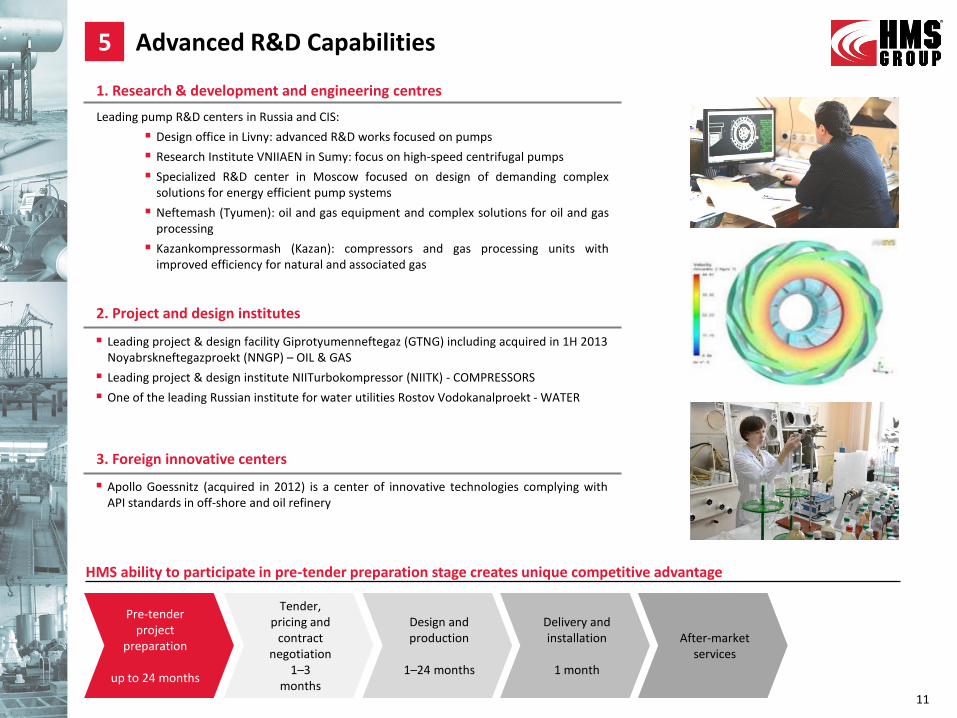
Apollo Goessnitz (acquired in 2012) is a center of innovative technologies complying with API standards in off-shore and oil refinery
3. Foreign innovative centers
2. Project and design institutes
Leading project & design facility Giprotyumenneftegaz (GTNG) including acquired in 1H 2013 Noyabrskneftegazproekt (NNGP) – OIL & GAS
Leading project & design institute NIITurbokompressor (NIITK) - COMPRESSORS
One of the leading Russian institute for water utilities Rostov Vodokanalproekt - WATER
11
1. Research & development and engineering centres
Leading pump R&D centers in Russia and CIS:
Design office in Livny: advanced R&D works focused on pumps
Research Institute VNIIAEN in Sumy: focus on high-speed centrifugal pumps
Specialized R&D center in Moscow focused on design of demanding complex solutions for energy efficient pump systems
Neftemash (Tyumen): oil and gas equipment and complex solutions for oil and gas processing
Kazankompressormash (Kazan): compressors and gas processing units with improved efficiency for natural and associated gas
Tender, pricing and
contract negotiation
1–3 months
Design and production
1–24 months
Delivery and installation
1 month
After-market services
HMS ability to participate in pre-tender preparation stage creates unique competitive advantage
Pre-tender project
preparation
up to 24 months
Advanced R&D Capabilities 5
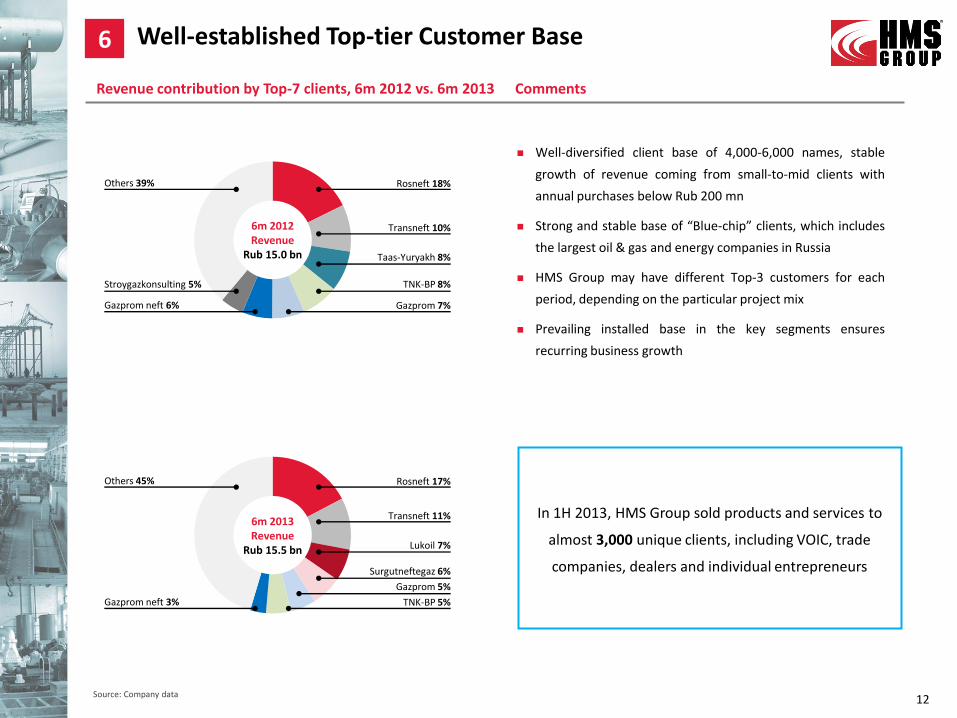
6m 2012 Revenue
Rub 15.0 bn
Well-diversified client base of 4,000-6,000 names, stable
growth of revenue coming from small-to-mid clients with
annual purchases below Rub 200 mn
Strong and stable base of “Blue-chip” clients, which includes
the largest oil & gas and energy companies in Russia
HMS Group may have different Top-3 customers for each
period, depending on the particular project mix
Prevailing installed base in the key segments ensures
recurring business growth
Source: Company data 12
Well-established Top-tier Customer Base 6
Revenue contribution by Top-7 clients, 6m 2012 vs. 6m 2013 Comments
In 1H 2013, HMS Group sold products and services to
almost 3,000 unique clients, including VOIC, trade
companies, dealers and individual entrepreneurs
6m 2013 Revenue
Rub 15.5 bn
Others 39%
Gazprom 7%
Stroygazkonsulting 5%
Gazprom neft 6%
TNK-BP 8%
Taas-Yuryakh 8%
Transneft 10%
Rosneft 18%
Others 45%
TNK-BP 5% Gazprom neft 3%
Surgutneftegaz 6%
Lukoil 7%
Transneft 11%
Rosneft 17%
Gazprom 5%

Vladimir Lukyanenko Non-executive Director
Shareholder In company since 2005
Artem Molchanov Managing Director (CEO)
Shareholder In company since 1993
Shareholders Run the Business
The Board is comprised of professionals with significant
experience in flow control and oil and gas industries
It includes founders, who has led HMS since its
inception
HMS is the core business of the largest shareholders
Dividend policy: pay out not less than 25% of profit for
the year
Source: Company data as of 30 September, 2013
7
Board of Directors Comments
Shareholders Structure
Kirill Molchanov First Deputy CEO (CFO)
Shareholder In company since 1993
German Tsoy Chairman of the Board
Shareholder In company since 1993
Yury Skrynnik Head of Compressors Business
segment Shareholder
In company since 2005
Nikolay Yamburenko Head of Industrial Pumps
Shareholder In company since 2003
Philippe Delpal Independent
Chairman Audit Committee
Andreas Petrou Non-executive
Gary Yamamoto Independent
Chairman Remuneration Committee
13
Treasury shares 1.5%
Free-float 26.9%
Vladimir Lukyanenko 27.4%
German Tsoy 19.8%
Managers 24.4%
Hold thru HMS Technologies (71.5%)
Key Investment Highlights
14
Supportive Industry Fundamentals 1
The Leading Provide of Flow Control Solutions 2
Operating on Protected Markets in Russia 4
Advanced Research & Development Capabilities 5
Shareholders Run the Business 7
Well-established Top-tier Customer Base 6
Focus on Value-added Integrated Solutions 3

FINANCIAL PERFORMANCE
15

Source: Company data * Hereinafter, read EBITDA as EBITDA adjusted, Net income as Profit for the period / year, EBITDA margin as EBITDA adjusted margin ** Operating profit and Profit for the period (Net income) include Excess of fair value, i.e. gain occurring when the price paid for the company acquired is less than the Group’s share in the fair value of net assets acquired. This gain is recognized immediately in profit or loss as a bargain purchase gain 1 Net debt = Total debt – Cash & cash equivalents 2 ROCE = EBIT LTM / average capital employed 3 ROE = total equity period average / profit for the year
6m’13 6m’12 chg, qoq 2Q’13 2Q’12 chg, yoy
Revenue 15,455 14,939 +3.5% 8,170 7,632 +7.1%
Gross profit 4,022 4,236 -5.1% 2,348 2,198 +6.8%
EBITDA * 2,172 2,472 -12.1% 1,319 1,105 +19.4%
Operating profit ** 1,847 1,679 +10.0% 1,460 845 +72.7%
Net income ** 914 966 -5.4% 888 481 +84.6%
Total debt 17,319 11,921 +45.3% 17,319 11,921 +45.3%
Net debt 1 14,900 10,668 +39.7% 14,900 10,668 +39.7%
EBITDA LTM 5,932 4,848 +22.4% 6,445 5,069 +27.1%
Net debt to EBITDA LTM 2.51 2.20 2.31 2.10
Gross margin 26.0% 28.4% -233 bps 28.7% 28.8% -6 bps
EBITDA margin * 14.1% 16.5% -249 bps 16.1% 14.5% +166 bps
Operating margin 12.0% 11.2% +71 bps 17.9% 11.1% +679 bps
Net income margin 5.9% 6.5% -55 bps 10.9% 6.3% +457 bps
ROCE 2 14.4% 18.1% -365 bps
ROE 3 7.5% 9.1% -160 bps
Financial Highlights
16
Financial highlights, Rub mn

Last 12 month (LTM) comparison represents sustainability and trends of HMS’ business performance better than quarterly one
26 286 27 778 27 473 27 496 27 751 28 577
30 498
33 656 33 633 34 172
1Q'11 2Q'11 3Q'11 4Q'11 1Q'12 2Q'12 3Q'12 4Q'12 1Q'13 2Q'13
Revenue LTM, Rub mn Линейная ( Revenue LTM, Rub mn)
4 721
5 512 5 666 5 509 5 287 4 848
5 132
6 231 5 718 5 932
18,0%
19,8% 20,6% 20,0%
19,1%
17,0% 16,8%
18,5% 17,0% 17,4%
1Q'11 2Q'11 3Q'11 4Q'11 1Q'12 2Q'12 3Q'12 4Q'12 1Q'13 2Q'13
EBITDA LTM, Rub mn EBITDA margin
Financial Highlights: LTM vs. Quarterly
17 Source: Company data
7 051 6 806 6 703 6 935 7 307 7 632
8 624 10 093
7 285 8 170
1 588 1 545 1 265 1 111 1 367 1 105 1 550 2 210 854 1 319
22,5% 22,7%
18,9%
16,0%
18,7%
14,5%
18,0%
21,9%
11,7%
16,1%
1Q'11 2Q'11 3Q'11 4Q'11 1Q'12 2Q'12 3Q'12 4Q'12 1Q'13 2Q'13
Revenue, Rub mn EBITDA, Rub mn EBITDA margin
EBITDA LTM performance, 2010 – 6m 2013 Revenue LTM performance, 2010 – 6m 2013
Revenue and EBITDA performance quarterly, 2011 – 6m 2013
Source: Company data
Source: Company data
Note: LTM calculation is based on periodic not quarterly one, i.e. 2q13 = 6m13+FY12-6m12, and 3q12 = 9m12+FY11-9m11, etc. both for Revenue LTM and EBITDA LTM
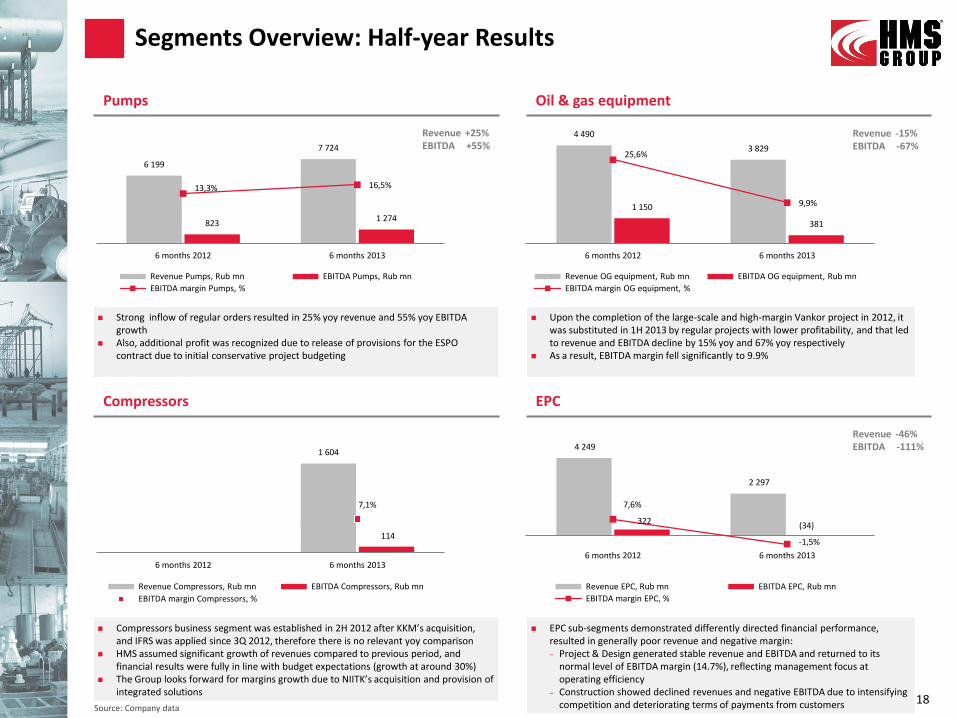
4 249
2 297
322 (34)
7,6%
-1,5%
6 months 2012 6 months 2013
Revenue EPC, Rub mn EBITDA EPC, Rub mn
EBITDA margin EPC, %
1 604
114
7,1%
6 months 2012 6 months 2013
Revenue Compressors, Rub mn EBITDA Compressors, Rub mn
EBITDA margin Compressors, %
4 490
3 829
1 150
381
25,6%
9,9%
6 months 2012 6 months 2013
Revenue OG equipment, Rub mn EBITDA OG equipment, Rub mn
EBITDA margin OG equipment, %
6 199
7 724
823 1 274
13,3% 16,5%
6 months 2012 6 months 2013
Revenue Pumps, Rub mn EBITDA Pumps, Rub mn
EBITDA margin Pumps, %
Oil & gas equipment Pumps
Segments Overview: Half-year Results
18
Revenue +25% EBITDA +55%
Revenue -15% EBITDA -67%
Revenue -46% EBITDA -111%
EPC Compressors
Strong inflow of regular orders resulted in 25% yoy revenue and 55% yoy EBITDA growth
Also, additional profit was recognized due to release of provisions for the ESPO contract due to initial conservative project budgeting
Upon the completion of the large-scale and high-margin Vankor project in 2012, it was substituted in 1H 2013 by regular projects with lower profitability, and that led to revenue and EBITDA decline by 15% yoy and 67% yoy respectively
As a result, EBITDA margin fell significantly to 9.9%
Compressors business segment was established in 2H 2012 after KKM’s acquisition, and IFRS was applied since 3Q 2012, therefore there is no relevant yoy comparison
HMS assumed significant growth of revenues compared to previous period, and financial results were fully in line with budget expectations (growth at around 30%)
The Group looks forward for margins growth due to NIITK’s acquisition and provision of integrated solutions
EPC sub-segments demonstrated differently directed financial performance, resulted in generally poor revenue and negative margin: – Project & Design generated stable revenue and EBITDA and returned to its
normal level of EBITDA margin (14.7%), reflecting management focus at operating efficiency
– Construction showed declined revenues and negative EBITDA due to intensifying competition and deteriorating terms of payments from customers Source: Company data
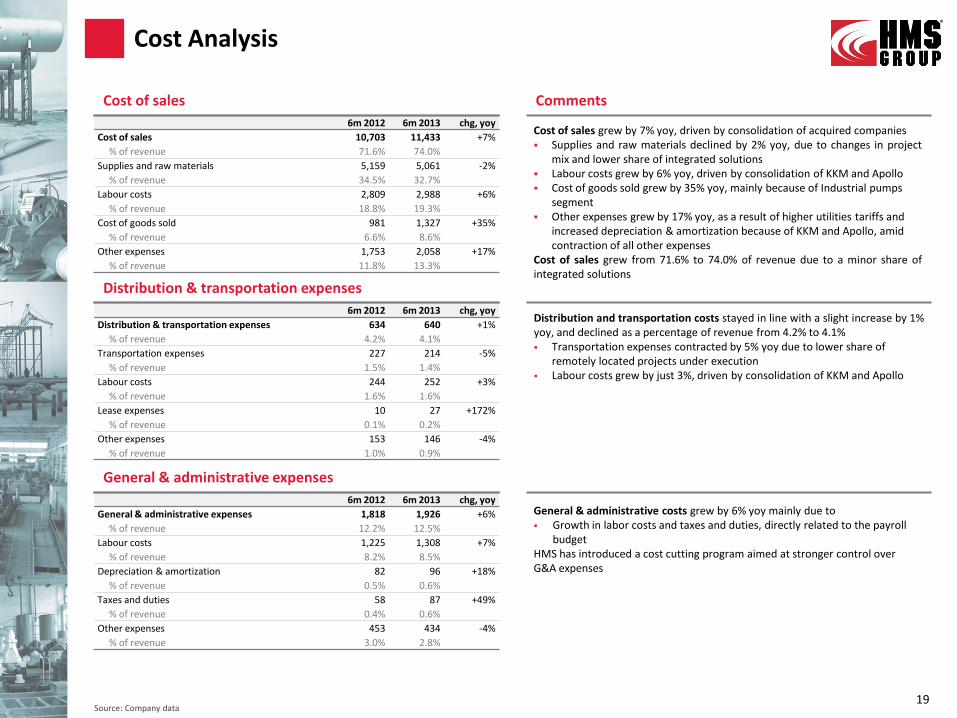
6m 2012 6m 2013 chg, yoy
Cost of sales 10,703 11,433 +7%
% of revenue 71.6% 74.0%
Supplies and raw materials 5,159 5,061 -2%
% of revenue 34.5% 32.7%
Labour costs 2,809 2,988 +6%
% of revenue 18.8% 19.3%
Cost of goods sold 981 1,327 +35%
% of revenue 6.6% 8.6%
Other expenses 1,753 2,058 +17%
% of revenue 11.8% 13.3%
Cost Analysis
19
Cost of sales Comments
6m 2012 6m 2013 chg, yoy
Distribution & transportation expenses 634 640 +1%
% of revenue 4.2% 4.1%
Transportation expenses 227 214 -5%
% of revenue 1.5% 1.4%
Labour costs 244 252 +3%
% of revenue 1.6% 1.6%
Lease expenses 10 27 +172%
% of revenue 0.1% 0.2%
Other expenses 153 146 -4%
% of revenue 1.0% 0.9%
Distribution & transportation expenses
6m 2012 6m 2013 chg, yoy
General & administrative expenses 1,818 1,926 +6%
% of revenue 12.2% 12.5%
Labour costs 1,225 1,308 +7%
% of revenue 8.2% 8.5%
Depreciation & amortization 82 96 +18%
% of revenue 0.5% 0.6%
Taxes and duties 58 87 +49%
% of revenue 0.4% 0.6%
Other expenses 453 434 -4%
% of revenue 3.0% 2.8%
General & administrative expenses
General & administrative costs grew by 6% yoy mainly due to Growth in labor costs and taxes and duties, directly related to the payroll
budget HMS has introduced a cost cutting program aimed at stronger control over G&A expenses
Cost of sales grew by 7% yoy, driven by consolidation of acquired companies Supplies and raw materials declined by 2% yoy, due to changes in project
mix and lower share of integrated solutions Labour costs grew by 6% yoy, driven by consolidation of KKM and Apollo Cost of goods sold grew by 35% yoy, mainly because of Industrial pumps
segment Other expenses grew by 17% yoy, as a result of higher utilities tariffs and
increased depreciation & amortization because of KKM and Apollo, amid contraction of all other expenses
Cost of sales grew from 71.6% to 74.0% of revenue due to a minor share of integrated solutions
Distribution and transportation costs stayed in line with a slight increase by 1% yoy, and declined as a percentage of revenue from 4.2% to 4.1% Transportation expenses contracted by 5% yoy due to lower share of
remotely located projects under execution Labour costs grew by just 3%, driven by consolidation of KKM and Apollo
Source: Company data
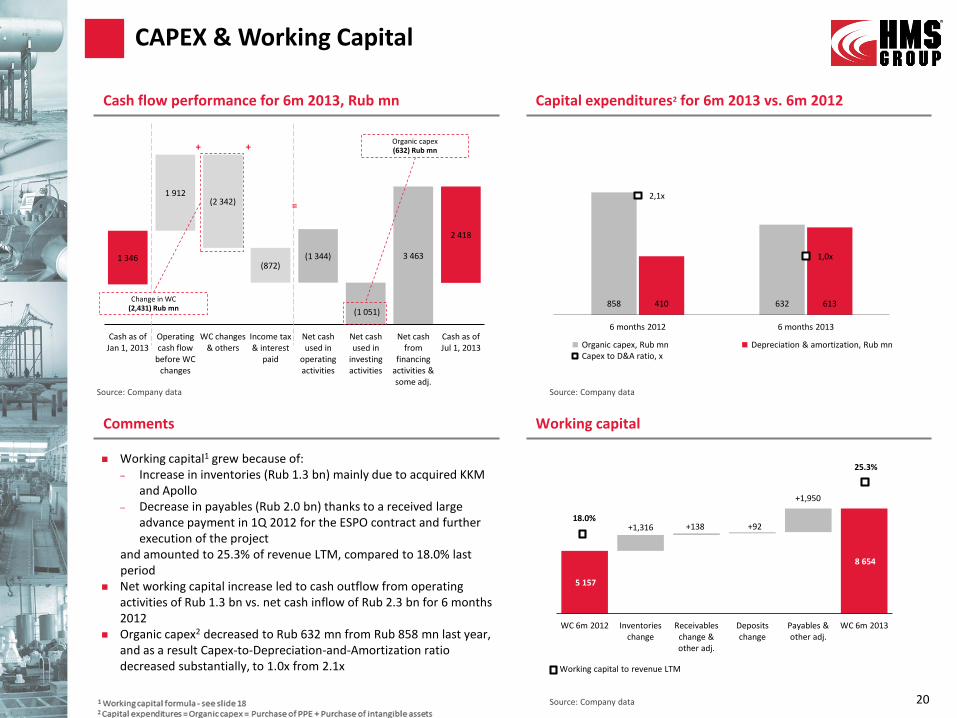
5 157
+1,316 +138 +92
+1,950
8 654
WC 6m 2012 Inventories change
Receivables change & other adj.
Deposits change
Payables & other adj.
WC 6m 2013
858 632 410 613
2,1x
1,0x
6 months 2012 6 months 2013
Organic capex, Rub mn Depreciation & amortization, Rub mn Capex to D&A ratio, x
1 346
1 912 (2 342)
(872) (1 344)
(1 051)
3 463
2 418
Cash as of Jan 1, 2013
Operating cash flow
before WC changes
WC changes & others
Income tax & interest
paid
Net cash used in
operating activities
Net cash used in
investing activities
Net cash from
financing activities & some adj.
Cash as of Jul 1, 2013
Comments Working capital
Cash flow performance for 6m 2013, Rub mn Capital expenditures2 for 6m 2013 vs. 6m 2012
Working capital1 grew because of: – Increase in inventories (Rub 1.3 bn) mainly due to acquired KKM
and Apollo – Decrease in payables (Rub 2.0 bn) thanks to a received large
advance payment in 1Q 2012 for the ESPO contract and further execution of the project
and amounted to 25.3% of revenue LTM, compared to 18.0% last period
Net working capital increase led to cash outflow from operating activities of Rub 1.3 bn vs. net cash inflow of Rub 2.3 bn for 6 months 2012
Organic capex2 decreased to Rub 632 mn from Rub 858 mn last year, and as a result Capex-to-Depreciation-and-Amortization ratio decreased substantially, to 1.0x from 2.1x
CAPEX & Working Capital
Source: Company data
Source: Company data
20
6%
28%
9M 2010 9M 2011
Working capital to Revenue LTM
25.3%
Source: Company data
+ +
=
Organic capex (632) Rub mn
6%
28%
9M 2010 9M 2011
Working capital to Revenue LTM
18.0%
6%
28%
9M 2010 9M 2011
Working capital to Revenue LTM
Working capital to revenue LTM
Change in WC (2,431) Rub mn

2 574 3 413 4 551 4 288 4 809 12 064 14 900 10 668 14 900
1,81
2,08
2,41
1,22
0,87
1,94
2,51
2,20
2,51
2007 2008 2009 2010 2011 2012 6m 2013 6m 2012 6m 2013
Net Debt, Rub mn Net Debt to EBITDA LTM ratio
247 4 250 4 237 4 398 286 2 116 286 2 565
2013E 2014E 2015E 2016E 2017E 2018E 2019E
Debt to be repaid, Rub mn Undrawn credit lines, Rub mn
Short-term debt 16.1%
Comments
Comfortable repayment schedule
Cash 1,405
S&P corporate credit rating : B+ Outlook: Stable Reaffirmed in July 2013
21 Source: Company data as of 01 September, 2013
Financial Position
Source: Company data Source: Company data as of 24 September, 2013
Maturity payment of 3 Rub bn bonds 03
Available liquidity 4.0 Rub bn
Maturity payment of 3 Rub bn bonds 02
Net debt to EBITDA LTM ratio
Fixed rate 99.8%
Floating rate 0.2%
Long-term debt 83.9%
Credits in Rub 85.7%
Euro 8.6%
Others 5.7%
Net debt 40% yoy expansion occurred due to bank loans, attracted for acquisitions of Apollo and NIITK, and growing needs in working capital financing
Net Debt to EBITDA LTM ratio increased to 2.51x from 2.20x
6 months 2013 Interest coverage ratio1 equals 2.6x
Available liquidity of Rub 4.0 bn fully covers 2013E repayments
Average interest rate was 9.3% on 24 September 2013 for all loans, including FX-denominated
Low currency and maturity risks
In Aug – Sep 2013, HMS Group signed agreements for refinancing of Rub 4.58 bn As a result, the company has more comfortable and smooth debt repayment schedule (see Figure “Comfortable repayment schedule)
STRATEGY & OUTLOOK
22
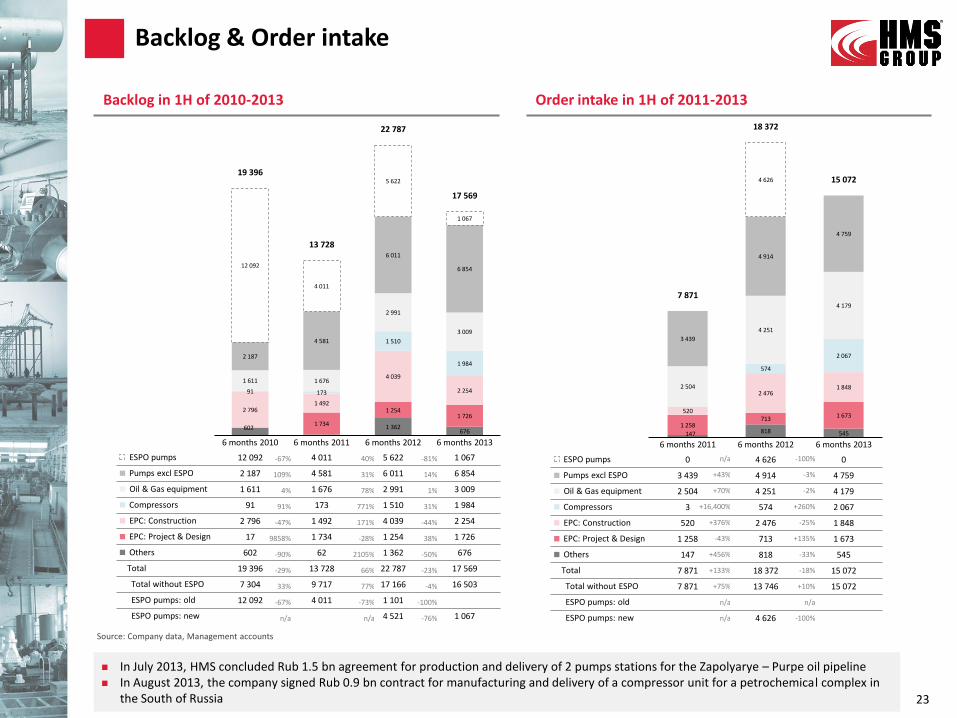
602 1 362 676
1 734
1 254 1 726
2 796 1 492
4 039
2 254 91 173
1 510
1 984
1 611 1 676
2 991
3 009
2 187
4 581
6 011
6 854 12 092
4 011
5 622
1 067
19 396
13 728
22 787
17 569
6 months 2010 6 months 2011 6 months 2012 6 months 2013
ESPO pumps 12 092 4 011 5 622 1 067
Pumps excl ESPO 2 187 4 581 6 011 6 854
Oil & Gas equipment 1 611 1 676 2 991 3 009
Compressors 91 173 1 510 1 984
EPC: Construction 2 796 1 492 4 039 2 254
EPC: Project & Design 17 1 734 1 254 1 726
Others 602 62 1 362 676
Total 19 396 13 728 22 787 17 569
Total without ESPO 7 304 9 717 17 166 16 503
ESPO pumps: old 12 092 4 011 1 101
ESPO pumps: new 4 521 1 067
147 818 545 1 258
713 1 673 520
2 476 1 848
574
2 067
2 504
4 251
4 179
3 439
4 914
4 759
4 626
7 871
18 372
15 072
6 months 2011 6 months 2012 6 months 2013
ESPO pumps 0 4 626 0
Pumps excl ESPO 3 439 4 914 4 759
Oil & Gas equipment 2 504 4 251 4 179
Compressors 3 574 2 067
EPC: Construction 520 2 476 1 848
EPC: Project & Design 1 258 713 1 673
Others 147 818 545
Total 7 871 18 372 15 072
Total without ESPO 7 871 13 746 15 072
ESPO pumps: old
ESPO pumps: new 4 626
Backlog & Order intake
Source: Company data, Management accounts
23
n/a -100%
+43% -3%
+70% -2%
+16,400% +260%
+376% -25%
-43% +135%
+456% -33%
+133% -18%
+75% +10%
n/a n/a
n/a -100%
Backlog in 1H of 2010-2013 Order intake in 1H of 2011-2013
In July 2013, HMS concluded Rub 1.5 bn agreement for production and delivery of 2 pumps stations for the Zapolyarye – Purpe oil pipeline In August 2013, the company signed Rub 0.9 bn contract for manufacturing and delivery of a compressor unit for a petrochemical complex in
the South of Russia
-67% 40% -81%
109% 31% 14%
4% 78% 1%
91% 771% 31%
-47% 171% -44%
9858% -28% 38%
-90% 2105% -50%
-29% 66% -23%
33% 77% -4%
-67% -73% -100%
n/a n/a -76%

4 657
3 586
5 131
1 313
3 200
1 313
(60)
42 376
(181)
310
(181)
-1,3% 1,2%
7,3%
-13,8%
9,7%
-13,8%
2010 2011 2012 6m 2013 6m 2012 6m 2013
Revenue, Rub mn EBITDA, Rub mn EBITDA margin, %
Construction sub-segment performance, 2010 – 6m 2013 Comments
Construction Sub-segment Overview and Prospects
Source: Company data
24
Construction backlog performance, 2010 – 6m 2013
Source: Company data
2 653
3 469
3 293
1 895
-42%
31%
-5%
-42%
2010 2011 2012 6m 2013
Backlog, Rub mn Backlog change yoy, %
The Group acquired construction assets in 2007-2008, targeting large-scale integrated EPC projects with a high proportion of HMS’ made components. However, in Russia’s upstream practice, most projects are done under “EP” (engineering & procurement) and “C” (construction) terms separately. And in current practice, availability of construction assets is not required for execution of such EP projects as ESPO and Vankor
Construction business requires an expertise different from the one, essential for flow control research & development and manufacturing
HMS’ core machinery business units generate the Group’s bulk of revenue and EBITDA
Construction assets demonstrate relatively low EBITDA margin, thus lowering the company’s total EBITDA margin
Construction contracts, besides execution risks, are more exposed to project cancellation risks than machine-building are
High risk of further accelerated deterioration of construction market conditions such as competition and delays in payment
Poor performance of construction sub-segment, so much different from sound performance of the company’s core businesses (flow control machine-building and engineering), made HMS Group to consider several options of construction business development strategy, including its disposal

NIITurbokompressor is the largest applied center for compressor technology in Russia: 35 testing units, 300 patents, 310 specialists where 3 with doctor degree and 10 with PhD
In 1H 2013, HMS Group acquired 95.03% of the shares (95.38% of the voting shares) for Rub 321 mn, where Rub 279 mn was paid in cash and Rub 42 mn was recognized in accounts payable
Acquisition of NIITK is a part of the Group’s strategy aimed at enhancing competencies in compressor business (see below a Figure “Main factors of revenue and profitability growth in compressors segment”)
A gain of Rub 521 mn, representing the amount of HMS’ share in the fair value of net assets acquired in excess of the acquisition cost*, has been recorded in the comprehensive income statement. This excess amount resulted from:
– The close association with KKM, as the R&D center holds 14.98 (15.77% of the voting shares) of KKM
– 80% of KKM’s innovative production is based on design documentation prepared by the institute, i.e. KKM is the largest client of NIITK
– The Group’s strong negotiating position as there were a lot of small selling shareholders (more than 200 individuals)
From legal point of view, acquisitions of KKM and NIITK didn’t have any connections, but both deals are core for HMS’ compressor solutions development strategy
The overall cost of the compressor business unit’s establishment consists of acquisitions’ costs of KKM and NIITK. Therefore, excess of fair value** from NIITK’s purchase, from managerial account perspective, offsets the cost of KKM’s acquisition,
HMS Group completed two acquisitions in 1H 2013: NIITurbokompressor named after V.B.Shnepp (NIITK) for Rub 321 mn Noyabrskneftegazproekt (NNGP), the project institute, which renders design & engineering services in Yamal for oil & gas companies. The
purchase for Rub 9.5 mn improved HMS’ position on the oil & gas market and strengthened relationship with one of its key clients (as part of a strategic agreement)
M&A Deals in 1H 2013
25
Rationale and accounting of NIITK’s acquisition
1. Capability to secure large contracts for compressor-based integrated solutions Current status: HMS has a strong track record with Russian
majors Several relatively large contracts signed since
the acquisition of KKM
2. Competences in project & design of compressor-based integrated solutions
– Technical solutions, more profitable for a producer – Strong negotiation power towards suppliers
Current status:
NIITK, the compressor design center, acquired in 1H 2013
3. Competences in large flow control project management Current status: ESPO, Vankor, Turkmenistan
All 3 factors, brought together, should lead to revenue and EBITDA growth even in 2014
Main factors of revenue and profitability growth in compressors segment
* A gain occurring when the price paid for the company acquired is less than the Group’s share in the fair value of net assets acquired. This gain is recognized immediately in profit or loss as a bargain purchase gain ** The assessment was not completed at the time of finalizing 6 months 2013 financial information, and can be revised by 2013-end

Project Brief description
Rosneft
Komsomolskiy refinery Oil product pipeline from the refinery to De-Kastri harbor. Delivery of pumps and pump units
Yurubcheno-Tokhomsk oilfield Start of oil production in 2016. Oil reserves & resources 513mt. Delivery of pumps and oil&gas equipment
TNK-BP
Russkoe, Tagulskoe and Suzunskoe oilfields Oilfields in Yamal region with specific oil. Assets of TNK-BP. Can be developed using Vankor’s infrastructure. Production start is planned in 2015-2016
Lodochnoe oil-gas condensate field Discovered in Eastern Siberia in 1985. Recoverable oil reserves C1 10.5mt, C2 32.6mt. Next to Vankor. Production engineering in 2013
Uvat 22 oilfields in Tyumen region , including Protozanovskoe and Tyamkinskoe fields. Production 7mtpa in 2012. Planned production 7.5mtpa in 2015
East- and Novo- Urengoy gas & condensate fields
Rospan International project. Total reserves of 2 deposits 890bcm of gas and 133mt of gas condensate. Total development investments US$ 6bn. Current production 3.5bcm. Planned production 8.6bcm in 2015, and 16bcm in 2017
Bashneft
Trebs and Titov fields JV with Lukoil. Project development stage. Reserves C1 142mt. Oil production in 2013 Transneft
ESPO Capacity expansion of ESPO-1 and ESPO-2
Zapolyarye – Purpe pipeline Oil transportation from YANAO and Northern Krasnoyarsk region to ESPO pipeline. Total investments Rub 199 bn, investments since 2014 Rub 95 bn
Modernization of the current pipelines Ongoing inflow of contracts
Yurubcheno-Takhomskoe-Taishet pipeline Oil transportation from Yurubcheno-Tokhomsk and Kuyumbinsk oilfields to ESPO-1. Length ~703 km. Capacity ~15mtpa
Gazprom
Kovyktinskoe gas field Total reserves of gas 1.5trncm and gas condensate 77mt. Currently in exploration program development stage. By 2016 Gazprom plans to shoot 1,300m2 and drill 10 exploration wells
Chayandinskoe oil-gas condensate field Base for creation of Yakutsk gas production center. Reserves of gas 1.2trncm and oil & gas condensate 79mt. Next to Kovyktinskoe field. Commencement planned in 2014 for oil and 2017 for gas. Field infrastructure development 2014-2017
Urengoy oil-gas condensate field The 3rd world largest with gas reserves over 10trncm, located in Tyumen region. Development of oil rims. Production plans in 2015
Mylzhinskoe OGF – Kazan OGCF – Kuybyshev trunk oil product pipeline
Pipeline construction in 2013-2014
South Stream (KMPO) Gas pipeline, which is planned to be laid on the seafloor of the Black sea from Russia to Italy and Austria thru Bulgaria, Balkan Peninsula, and other countries. Construction started in Dec 2012, completion in 2015. Total investments €16bn
Gazprom neft
Novoport (Novy port) field Recoverable reserves C1+C2 230mt of oil and 270bcm of gas. First oil in 2012. Start of year-round production in 2014 at 400-500ktpa. Planned production 6-9mtpa in 2020.
Etypurovskoe field Further development of the field
Iraq
Rumania brownfield Consortium headed by BP
Projects with South Oil Company of Iraq International oil majors
Water utilities
Central Asia Irrigation stations for Uzbekistan and Turkmenia
Russia & the CIS Modernization of outdated equipment
Nuclear
Rosatom Pumps and other equipment for new nuclear power plants and modernization of the old ones
Selected End-market Projects for Mid-term
Our current priorities for 2013 (filled pink)
26 Sources: Public information, Company’s data Prioritized projects
signed
Contacts and HMS Group Key Details
27
Company address:
7 Chayanova Str.
Moscow 125047
Russia
Investor Relations
Phone +7 (495) 730-66-01
http://grouphms.com/shareholders_and_investors/
Twitter HMSGroup and HMSGroup_Rus
Vera Timoshenko, Head of Investor Relations
HMS Hydraulic Machines & Systems Group Plc is listed on the London Stock Exchange (Main market, IOB):
Identifier Number Number of shares outstanding
ISIN US40425X2099 117,163,427
Ticker HMSG
Bloomberg HMSG LI
Reuters HMSGq.L
APPENDIX
28

Consolidated statement of financial position 6 months 2013
29
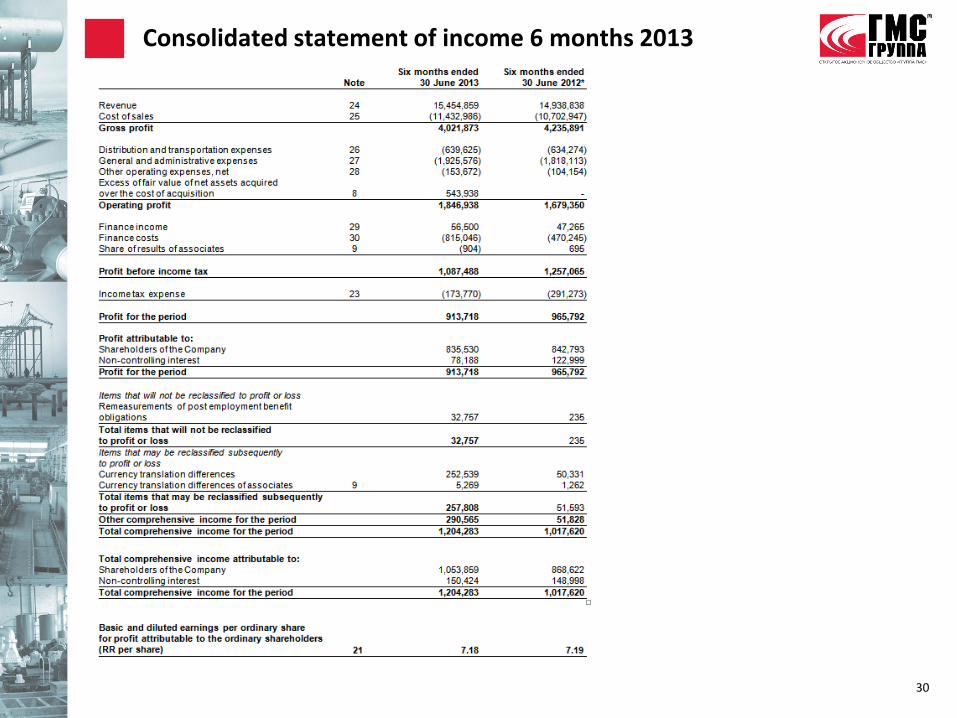
Consolidated statement of income 6 months 2013
30

Consolidated statement of cash flows 6 months 2013
31

New Projects
32

33
Russia
China
Kazakhstan
Belarus
Ukraine
India
UAE
Uzbekistan
Turkmenistan
Iraq
Vietnam
Kyrgyzstan
Tajikistan
Export Markets
Central Asia
Recently undertook turnkey construction of pumping station on Amu Darya river in Turkmenistan and construction of pumping station on water-storage basin Arnasai in Uzbekistan
Rapidly growing sales of modular equipment to oil and gas sector in Kazakhstan
Presence in water markets of Tajikistan and Kyrgyzstan
Offices in Ashkhabad (Turkmenistan) and Tashkent (Uzbekistan)
Europe
Office in Milan
Iraq
Significant installed base of HMS pumps, particularly in oil and gas, from Soviet and post Soviet periods
Office in Baghdad diversifies customer base, currently undertakes projects for Oil Ministry and BP
The UAE
Office in Dubai
Nuclear Exports
Long history of HMS involvement in Rosatom’s foreign as well as domestic projects
International agreements in place for the construction of 19 reactors in China, India, Belarus, Turkey, Ukraine, Armenia, Slovakia, Bulgaria and Vietnam using Russian technology
― Current tenders for development of 16 other reactors worldwide
Source: Company data, media sources
HMS office
Italy Bulgaria
Turkey
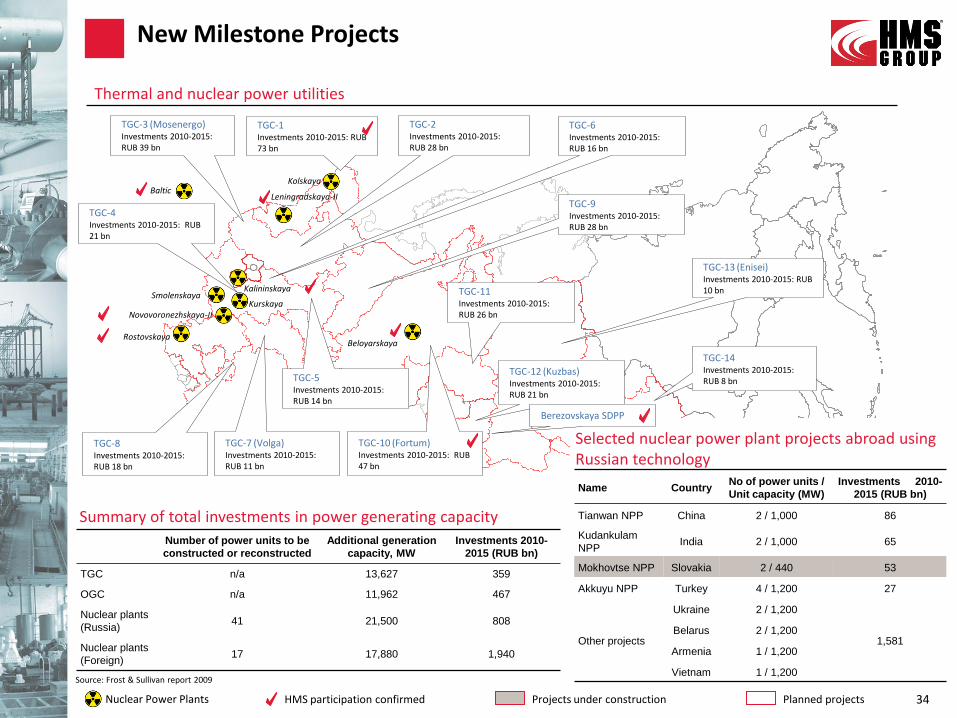
TGC-13 (Enisei) Investments 2010-2015: RUB 10 bn
TGC-9 Investments 2010-2015: RUB 28 bn
TGC-8 Investments 2010-2015: RUB 18 bn
TGC-7 (Volga) Investments 2010-2015: RUB 11 bn
TGC-6 Investments 2010-2015: RUB 16 bn
TGC-5 Investments 2010-2015: RUB 14 bn
TGC-3 (Mosenergo) Investments 2010-2015: RUB 39 bn
TGC-14 Investments 2010-2015: RUB 8 bn
TGC-12 (Kuzbas) Investments 2010-2015: RUB 21 bn
TGC-11 Investments 2010-2015: RUB 26 bn
TGC-10 (Fortum) Investments 2010-2015: RUB 47 bn
TGC-4 Investments 2010-2015: RUB 21 bn
TGC-2 Investments 2010-2015: RUB 28 bn
TGC-1 Investments 2010-2015: RUB 73 bn
Source: Frost & Sullivan report 2009
Nuclear Power Plants HMS participation confirmed Projects under construction Planned projects
Leningradskaya-II
Kalininskaya
Rostovskaya
Novovoronezhskaya-II
Beloyarskaya
Kurskaya Smolenskaya
Kolskaya
New Milestone Projects
Rostovskaya
Summary of total investments in power generating capacity
Selected nuclear power plant projects abroad using Russian technology
Number of power units to be
constructed or reconstructed
Additional generation
capacity, MW
Investments 2010-
2015 (RUB bn)
TGC n/a 13,627 359
OGC n/a 11,962 467
Nuclear plants
(Russia) 41 21,500 808
Nuclear plants
(Foreign) 17 17,880 1,940
Name Country No of power units /
Unit capacity (MW)
Investments 2010-
2015 (RUB bn)
Tianwan NPP China 2 / 1,000 86
Kudankulam
NPP India 2 / 1,000 65
Mokhovtse NPP Slovakia 2 / 440 53
Akkuyu NPP Turkey 4 / 1,200 27
Other projects
Ukraine 2 / 1,200
1,581 Belarus 2 / 1,200
Armenia 1 / 1,200
Vietnam 1 / 1,200
34
Baltic
Berezovskaya SDPP
Thermal and nuclear power utilities

Zapolyarnoe-Pur-pe pipeline
Projected Zapolyarnoe–Pur-pe pipeline
Inlet pipelines from main perspective oilfields (with production level over 2mln tons in 2020)
New OPS
Maximum level of pumping capacity by 2020, mtpa
Main OPS – main oil-pumping station of the future Zapolyarnoe-Pur-per pipeline
OPS – oil-pumping station
Legend
Inlet pipelines
Inlet point Oilfield License holder Max capacity in
2020, mt
Main OPS 1 Vostochno-Messoyakhinskoe Slavneft * 10.9
Main OPS 1 Zapadno-Messoyakhinskoe Slvaneft 2.4
Total Main OPS 1 13.3
OPS 2 Russkoe TNK-BP 6.8
OPS 2 Zapolyarnoe Gazprom 2.3
OPS 2 Tazovskoe Gazprom 1.0
OPS 2 Northern Urengoyskoe Gazprom n/a
OPS 2 Salekaptskoe Lukoil 0.3
Total OPS 2 10.9
OPS 3 Urengoyskoe Gazprom 7.4
OPS 3 Pestsovoe Gazprom n/a
OPS 3 En-Yakhinskoe Gazprom n/a
OPS 3 Samburgskoe SeverEnergiya ** 0.2
OPS 3 Yaro-Yakhinskoe SeverEnergiya 0.5
OPS 3 License plot of Western Urengoyskoe TNK-BP 1.1
Total OPS 3 9.7
Total capacity to Pur-pe 34.0-45.0
* TNK-BP and Gazprom Neft have per 50% share ** Gazprom holds 51%; this shareholding should be sold to Novatek
Source: Public sources, Transneft site
Capacity, mtpa up to 45
Total length, km 488
Projected cost, RUB bn 120
Total length of inlet pipelines, km 1,200
Project figures Construction period 2012-2016
1st stage 2014
2nd stage 2015
3rd stage 2016
Implementation
1st stage
2nd stage
3rd stage
35

Kuyumba - Taishet pipeline
Main OPS: Kuyumba
36
OPS 3
OPS 4
OPS 2
Main OPS: Taishet
Capacity, mtpa 15
Total length, km 703
Projected cost, RUB bn 97
Start of project implementation 2012
Completion 2016
Project figures
Krasnoyarsk region
1 2
3 4
ESPO
8
10
5
6
7
11
9
12 13 14
4
3
2
Verkhnechonskoe oil field
Danilovskoe oil field
Dulisminskoe oil field
Talakanskoe oil field
Srednebotuobinskoe oil field
Taas-Yuryakhskoe oil field
Kuyumbinskoe oil field
Yurubcheno-Tokhomskoe oil field 1
Kuyumba - Taishet
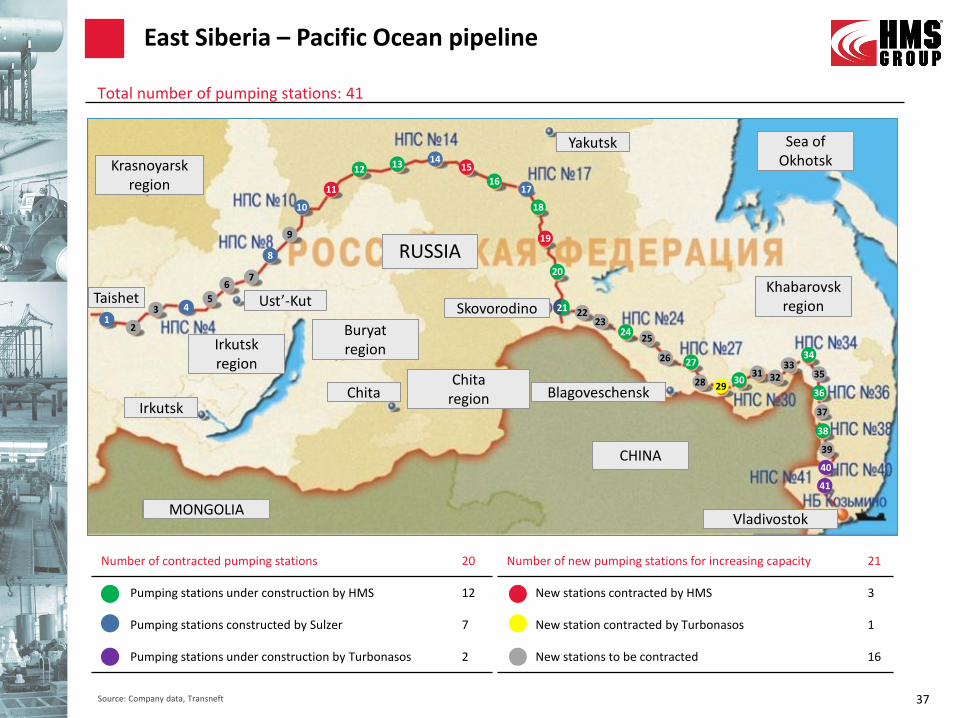
Number of new pumping stations for increasing capacity 21
New stations contracted by HMS 3
New station contracted by Turbonasos 1
New stations to be contracted 16
Number of contracted pumping stations 20
Pumping stations under construction by HMS 12
Pumping stations constructed by Sulzer 7
Pumping stations under construction by Turbonasos 2
East Siberia – Pacific Ocean pipeline
Source: Company data, Transneft
Krasnoyarsk region
1 2
3 4 5
6 7
8
9
10
11
12 13 14 15
16 17
18
19
20
23 24
25
26 27
28 29 30
31 32 33
34
35
36
37
38
39
40
41
Buryat region
Chita region
RUSSIA
MONGOLIA
Irkutsk Chita
Ust’-Kut
Yakutsk
Skovorodino
Blagoveschensk
Vladivostok
Taishet
Irkutsk region
Khabarovsk region
Sea of Okhotsk
CHINA
Total number of pumping stations: 41
22 21
37

M&A Policy
38

Main rationale of M&As M&A approach
M&A Strategy
39 Source: Company data (RAS accounts)
Sectors: pumps, compressors, oil & gas equipment, project & design
Region: Russia and the CIS
Target revenue within US$ 20-100 mn
Strong business model
Friendly management
TRADING COMPANY
Broadening of HMS Group’s product portfolio with complementary equipment
Potential growth of revenues and EBITDA margin of acquired companies:
Sales power and R&D capability of HMS Group
Well-known brands and/or technical equipment base of acquired companies
Potential growth of revenues and EBITDA margin of the whole Group through integrated solutions
Yea
r o
f ac
qu
isit
ion
O&G EQUIPMENT PRODUCERS
Note: Trading Company, established in 2002, is a profit center that represents the Group in a number of large-scale contracts, which are executed by production facilities afterwards
• Proven track record of a market consolidator with 21 completed acquisition in Russia, CIS and abroad
• HMS Group expands to adjacent segments seeking complimentary technologies and R&D facilities
• High-growth sectors where HMS has limited presence are the Groups’ focus area
• M&A experience converts to synergies - strong and sustainable double digit annual EBITDA growth after acquisition
CAGR since the acquisition year to 2012A: Selected companies
How we expand acquired businesses
41%
15%
18%
16%
25%
11%
31%
30%
23%
21%
14%
18%
31%
9%
23%
30%
HMS Neftemash
Sibneftemash
Sibna
HMS Pumps
Nasosenegomash
Livnynasos
DGHM
HMS Trading Company
200
4 20
11
2
009
200
3 20
05
200
6 2
007
200
2
Revenue CAGR EBITDA CAGR
PUMP PRODUCERS
Production Assets
40
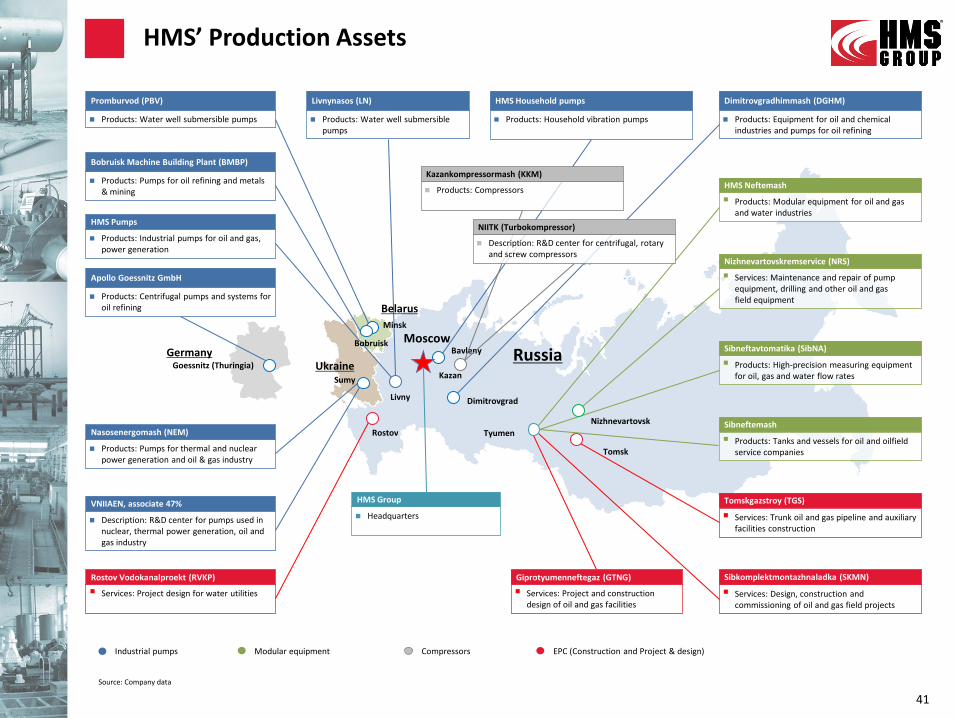
Livny
Russia Ukraine
Tomsk
Nizhnevartovsk
Tyumen
Dimitrovgrad
Nizhnevartovskremservice (NRS)
Services: Maintenance and repair of pump equipment, drilling and other oil and gas field equipment
HMS Neftemash
Products: Modular equipment for oil and gas and water industries
Sibneftavtomatika (SibNA)
Products: High-precision measuring equipment for oil, gas and water flow rates
Tomskgazstroy (TGS)
Services: Trunk oil and gas pipeline and auxiliary facilities construction
Sibkomplektmontazhnaladka (SKMN)
Services: Design, construction and commissioning of oil and gas field projects
Rostov Vodokanalproekt (RVKP)
Services: Project design for water utilities
Rostov
Sumy
41
HMS Household pumps
Products: Household vibration pumps
Promburvod (PBV)
Products: Water well submersible pumps
Livnynasos (LN)
Products: Water well submersible pumps
Nasosenergomash (NEM)
Products: Pumps for thermal and nuclear power generation and oil & gas industry
VNIIAEN, associate 47%
Description: R&D center for pumps used in nuclear, thermal power generation, oil and gas industry
Dimitrovgradhimmash (DGHM)
Products: Equipment for oil and chemical industries and pumps for oil refining
HMS Pumps
Products: Industrial pumps for oil and gas, power generation
Giprotyumenneftegaz (GTNG)
Services: Project and construction design of oil and gas facilities
Belarus
Minsk
Moscow Bavleny
Industrial pumps Modular equipment EPC (Construction and Project & design) Compressors
Source: Company data
HMS’ Production Assets
Bobruisk Machine Building Plant (BMBP)
Products: Pumps for oil refining and metals & mining
Bobruisk
Sibneftemash
Products: Tanks and vessels for oil and oilfield service companies
Products: Compressors
Kazan
Kazankompressormash (KKM)
Apollo Goessnitz GmbH
Products: Centrifugal pumps and systems for oil refining
Germany Goessnitz (Thuringia)
Description: R&D center for centrifugal, rotary and screw compressors
NIITK (Turbokompressor)
HMS Group
Headquarters

Calculations and formulas
42
All figures in millions of Russian Rubles, unless otherwise stated
Management of the Group assesses the performance of operating segments based on a measure of adjusted EBITDA, which is derived from the consolidated financial statements prepared in accordance with IFRS
EBITDA is defined as operating profit/loss adjusted for other operating income/expenses, depreciation and amortization, impairment of assets, provision for obsolete inventory, provision for impairment of accounts receivable, unused vacation allowance, defined benefits scheme expense, warranty provision, provision for legal claims, provision for VAT and other taxes receivable, other provisions, excess of fair value of net assets acquired over the cost of acquisition. This measurement basis excludes the effects of non-recurring income and expenses on the results of the operating segments
EBIT is calculated as Gross margin minus Distribution & transportation expenses minus General & administrative expenses minus Other operating expenses
Total debt is calculated as Long-term borrowings plus Short-term borrowings
Net debt is calculated as Total debt minus Cash & cash equivalents at the end of the period
Working capital is calculated as Inventories plus Trade and other receivables, excluding Short-term loans issued, Bank deposits and Promissory notes receivable, plus Current income tax receivable minus Trade and other payables minus Short-term provisions for liabilities and charges minus Current income tax payable minus Other taxes payable. In 2011, Working capital was adjusted for working capital of acquired DGHM (Rub 309 mn)
ROCE is calculated as EBIT LTM divided by Average Capital Employed (Total debt + Total equity)
Backlog is calculated as the preceding backlog plus new or additional customer orders booked during the reporting period, less amounts of contract value booked as revenue under ‘‘Russian GAAP’’ on an unconsolidated basis under the relevant contracts, plus or minus adjustments made in the judgment of the Group’s management. The Group may also make certain adjustments to bookings to reflect amendment, expiry or termination of contracts, cancellation of orders, changes in price terms under contracts or orders, or other factors affecting the amount of potential revenue which the Group believes may be recognized under such contracts. The Group’s backlog estimates are not an indication of potential revenues. Actual revenues and other measures of financial performance under IFRS may differ materially from any estimate of backlog, and changes in backlog between periods may have limited or no correlation to changes in revenue or any other measure of financial performance under IFRS
Notes to the presentation and formulas used for some figures’ calculations
The information contained herein has been prepared using information available to HMS Group (“HMS” or
“Group” or “Company”) at the time of preparation of the presentation. External or other factors may have
impacted on the business of HMS Group and the content of this presentation, since its preparation. In addition all
relevant information about HMS Group may not be included in this presentation. No representation or warranty,
expressed or implied, is made as to the accuracy, completeness or reliability of the information.
Any forward looking information herein has been prepared on the basis of a number of assumptions which may
prove to be incorrect. Forward looking statements, by the nature, involve risk and uncertainty and HMS Group
cautions that actual results may differ materially from those expressed or implied in such statements. Reference
should be made to the most recent Annual Report for a description of the major risk factors. This presentation
should not be relied upon as a recommendation or forecast by HMS Group, which does not undertake an
obligation to release any revision to these statements.
This presentation does not constitute or form part of any advertisement of securities, any offer or invitation to
sell or issue or any solicitation of any offer to purchase or subscribe for, any shares in HMS Group, nor shall it or
any part of it nor the fact of its presentation or distribution form the basis of, or be relied on in connection with,
any contract or investment decision.
Disclaimer
43