HLNG 2014 Q4 Presentation · LNG bonds GasLog Golar LNG Partners HLNG Teekay LNG 17 Note: Arctic...
23
Höegh LNG – The floating LNG services provider 3Q 2016 Presentation of financial results 17 November 2016
Transcript of HLNG 2014 Q4 Presentation · LNG bonds GasLog Golar LNG Partners HLNG Teekay LNG 17 Note: Arctic...

Höegh LNG – The floating LNG services provider
3Q 2016 Presentation of financial results
17 November 2016
Forward looking statements
2
This presentation contains forward-looking statements which reflects management’s current expectations, estimates and projections about
its operations. All statements, other than statements of historical facts, that address activities and events that will, should, could or may
occur in the future are forward-looking statements. Words such as “may,” “could,” “should,” “would,” “expect,” “plan,” “anticipate,” “intend,”
“forecast,” “believe,” “estimate,” “predict,” “propose,” “potential,” “continue” or the negative of these terms and similar expressions are
intended to identify such forward-looking statements. These statements are not guarantees of future performance and are subject to
certain risks, uncertainties and other factors, some of which are beyond our control and are difficult to predict. Therefore, actual outcomes
and results may differ materially from what is expressed or forecasted in such forward-looking statements. You should not place undue
reliance on these forward-looking statements, which speak only as of the date of this presentation. Unless legally required, Höegh LNG
undertakes no obligation to update publicly any forward-looking statements whether as a result of new information, future events or
otherwise.
Among the important factors that could cause actual results to differ materially from those in the forward-looking statements are: changes
in LNG transportation and regasification market trends; changes in the supply and demand for LNG; changes in trading patterns; changes
in applicable maintenance and regulatory standards; political events affecting production and consumption of LNG and Höegh LNG’s
ability to operate and control its vessels; change in the financial stability of clients of the Company; Höegh LNG’s ability to win upcoming
tenders and securing employment for the FSRUs on order; changes in Höegh LNG’s ability to convert LNG carriers to FSRUs including
the cost and time of completing such conversions; changes in Höegh LNG’s ability to complete and deliver projects awarded; increases in
the Company’s cost base; changes in the availability of vessels to purchase; failure by yards to comply with delivery schedules; changes
to vessels’ useful lives; changes in the ability of Höegh LNG to obtain additional financing, in particular, currently, in connection with the
turmoil in financial markets; the success in achieving commercial success for the projects being developed by the Company; changes in
applicable regulations and laws; and unpredictable or unknown factors herein also could have material adverse effects on forward-looking
statements.

Höegh LNG Holdings - Agenda for presentation of 3Q 2016 financial results
3
Sveinung J.S. Støhle
President & CEO
Highlights / Markets / Summary
Appendix
Steffen Føreid
CFO
Financials
Dedededw
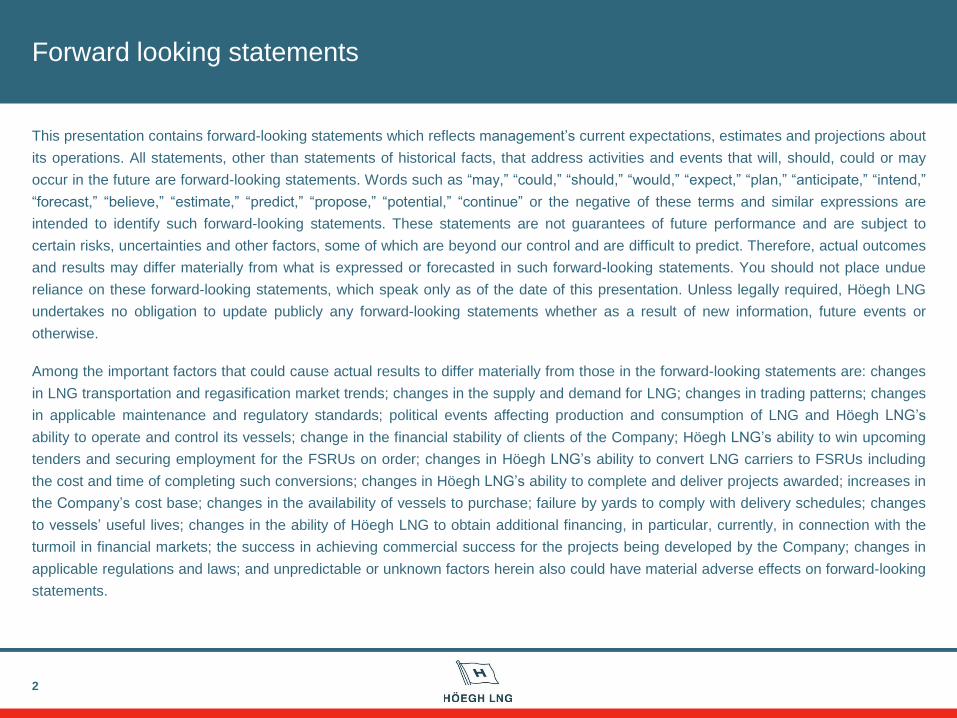
3Q 2016 highlights and subsequent events
Stable financial results: EBITDA USD 26.5 million and profit after tax USD 3.3 million
Maintaining dividend of USD 0.10 per share for Q4 2016
Höegh Grace has entered the commissioning phase in Colombia
Höegh LNG Partners made a shelf registration filing with the SEC
4
27 25
27 27 27
3Q15 4Q15 1Q16 2Q16 3Q16
EBITDA (USDm)
10 10 10 10 10
3Q15 4Q15 1Q16 2Q16 3Q16
Dividend (Cent/share)
99.95 100.00 99.89 99.93
2015 1Q16 2Q16 3Q16
Technical fleet availability (%)

Short/medium term focus
5
Operations
Project
execution
Commercial
Financial
To operate all FSRUs and LNGCs according to contract
Maintain ~100% technical fleet availability
Complete SPEC/Colombia commissioning for start-up early
December 2016
Construct and deliver FSRU#8 according to Penco LNG contract
Secure long-term contracts for:
FSRU#7 (March 2017 delivery)
FSRU Conversion project (end 2017 delivery)
Newbuilding Program ( 2019 1st delivery)
Refinance the first bond (HLNG01)
Secure debt financing for FSRU#8
Drop-down Höegh Grace to HMLP
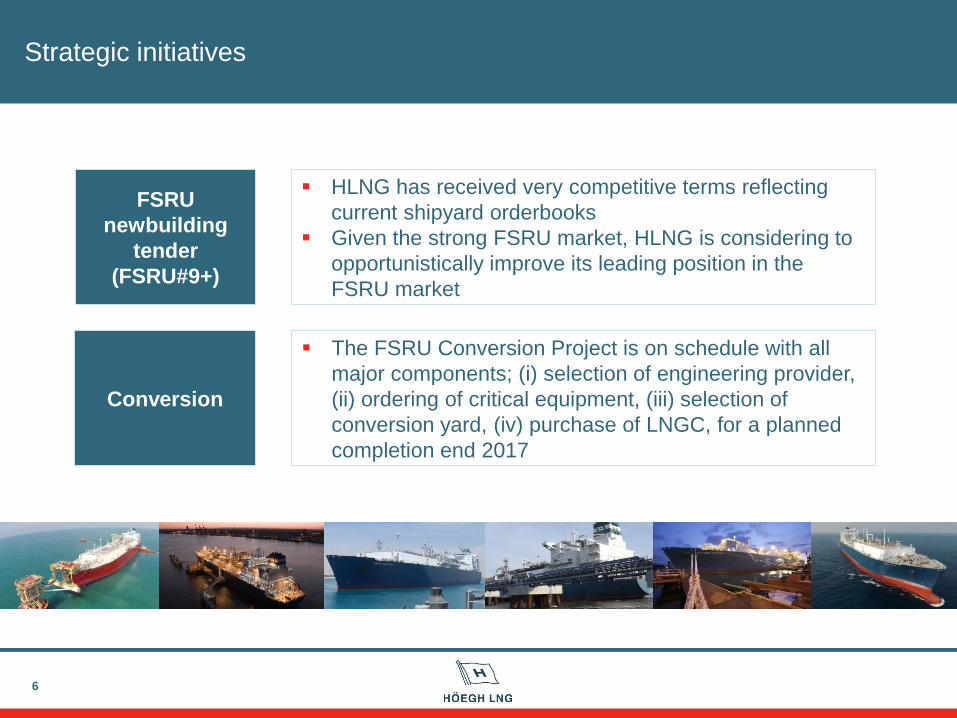
Strategic initiatives
6
FSRU
newbuilding
tender
(FSRU#9+)
Conversion
HLNG has received very competitive terms reflecting
current shipyard orderbooks
Given the strong FSRU market, HLNG is considering to
opportunistically improve its leading position in the
FSRU market
The FSRU Conversion Project is on schedule with all
major components; (i) selection of engineering provider,
(ii) ordering of critical equipment, (iii) selection of
conversion yard, (iv) purchase of LNGC, for a planned
completion end 2017

Höegh Grace/Colombia update
7
Project on
schedule
Start-up is
a value
generating
trigger
Received commissioning cargo
Entered the commissioning phase
Commercial start-up of 20-year
contract early December
Increasing EBITDA by
approximately USD 40 million
Next planned drop-down to HMLP
Strategic
rationale
for SPEC
LNG needed to meet increasing
demand for electricity in Colombia
Ensures security of supply during
periods of drought
Back-up for
hydro
New gas fired
generation
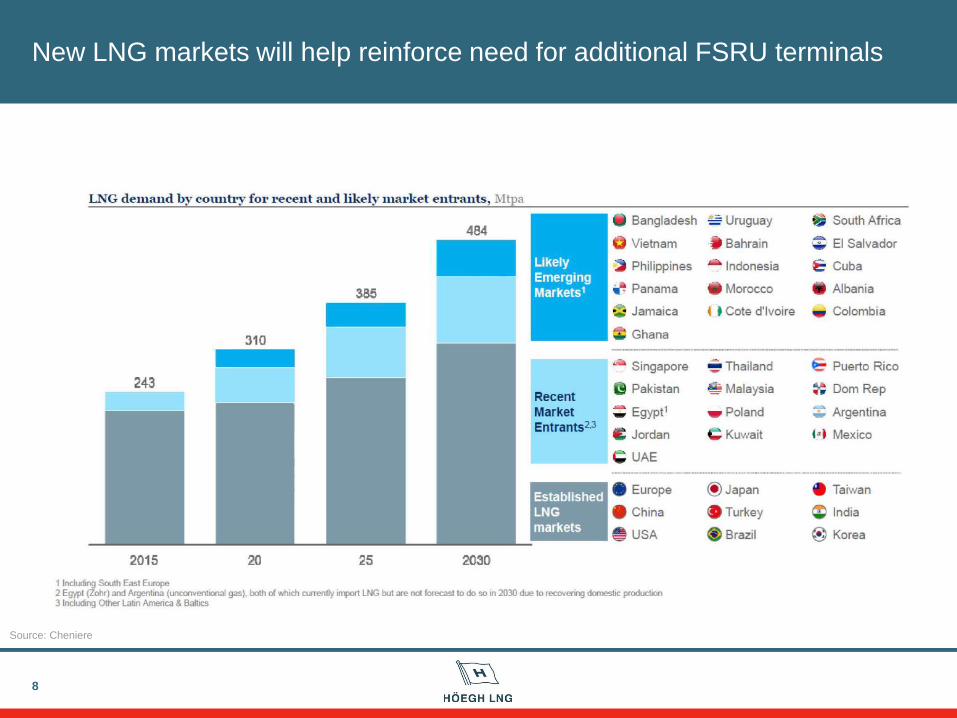
New LNG markets will help reinforce need for additional FSRU terminals
8
Source: Cheniere
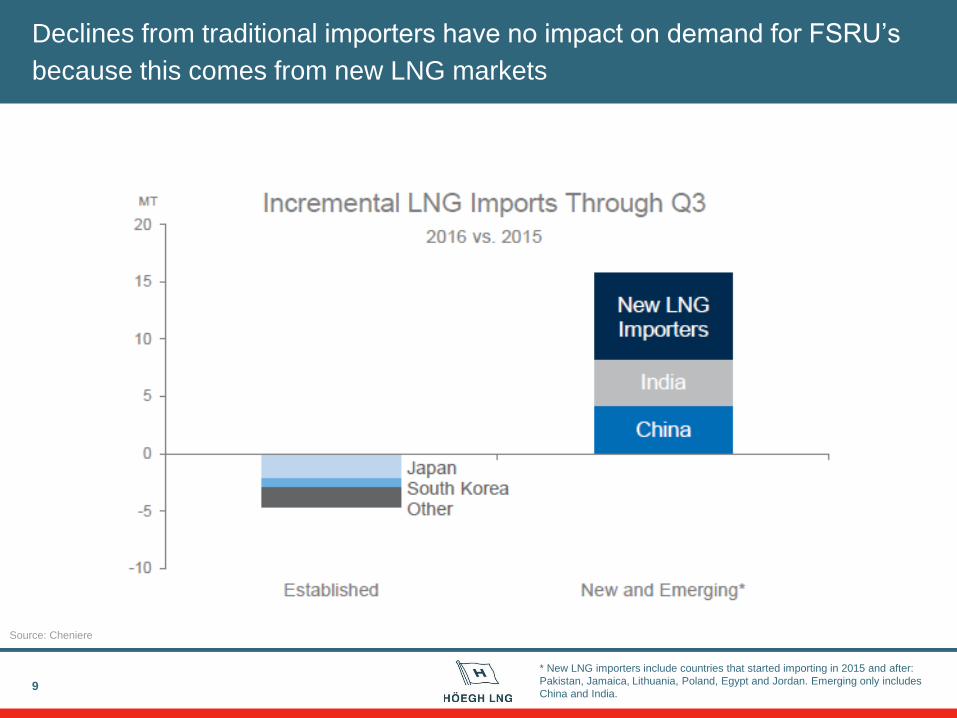
Declines from traditional importers have no impact on demand for FSRU’s
because this comes from new LNG markets
9
Source: Cheniere
* New LNG importers include countries that started importing in 2015 and after:
Pakistan, Jamaica, Lithuania, Poland, Egypt and Jordan. Emerging only includes
China and India.
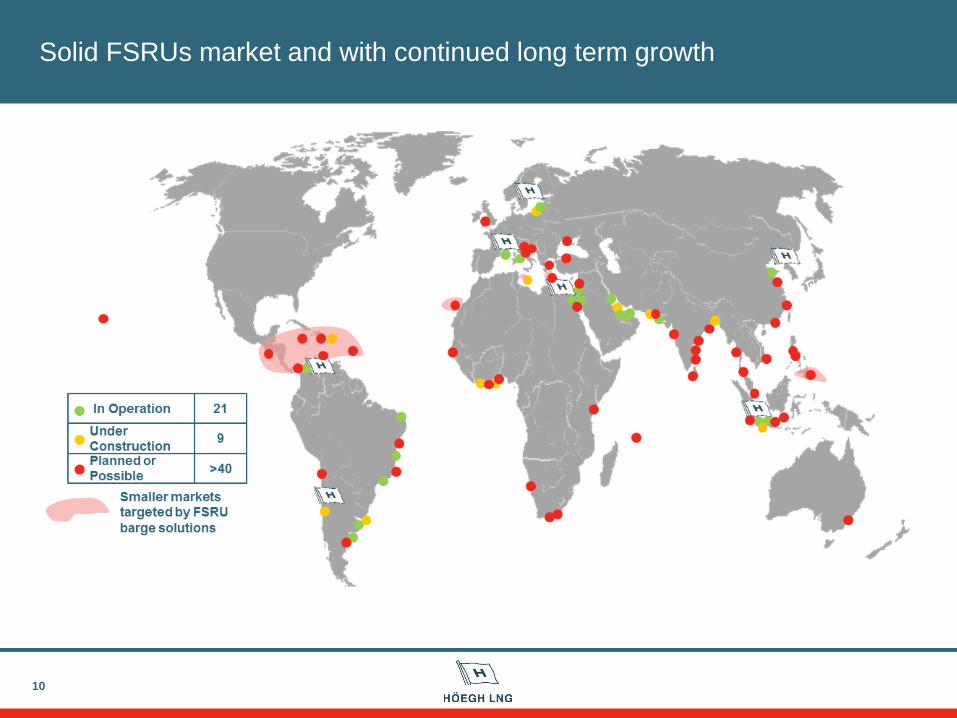
Solid FSRUs market and with continued long term growth
10

Stable competitive landscape
2011 2012 2013 2014 2015 2016
BW Gas
Excelerate
Golar LNG
11
Long-term FSRU contract award1
1 Do not include cancelled projects, contract renewals and sublets.

12
Höegh Grace in operation for commercial start in Colombia early December
Very competitive terms received for next round of FSRU newbuilding order(s)
Summary
Maintaining dividend payment of USD 0.1 per share for 4Q 2016
Continued steady operating performance – EBITDA of USD 26.5 million
Höegh LNG Holdings - Agenda for presentation of 3Q 2016 financial results
13
Sveinung J.S. Støhle
President & CEO
Highlights / Markets / Summary
Appendix
Steffen Føreid
CFO
Financials
Dedededw
Stable financial results in 3Q16
14
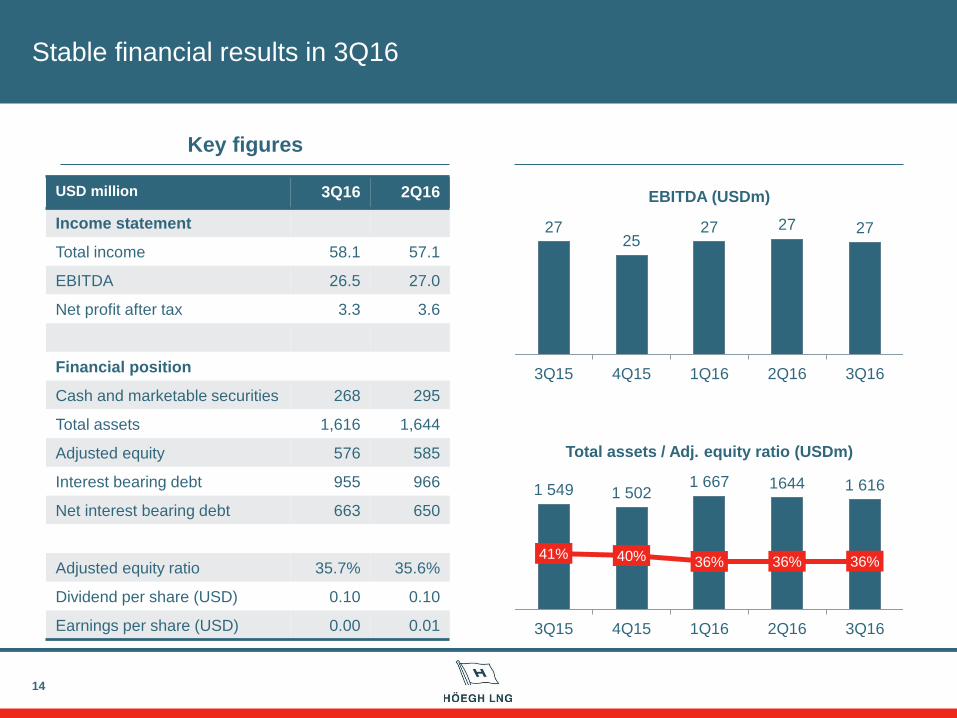
USD million 3Q16 2Q16
Income statement
Total income 58.1 57.1
EBITDA 26.5 27.0
Net profit after tax 3.3 3.6
Financial position
Cash and marketable securities 268 295
Total assets 1,616 1,644
Adjusted equity 576 585
Interest bearing debt 955 966
Net interest bearing debt 663 650
Adjusted equity ratio 35.7% 35.6%
Dividend per share (USD) 0.10 0.10
Earnings per share (USD) 0.00 0.01
Key figures
27 25
27 27 27
3Q15 4Q15 1Q16 2Q16 3Q16
EBITDA (USDm)
1 549 1 502 1 667 1644 1 616
41% 40% 36% 36% 36%
3Q15 4Q15 1Q16 2Q16 3Q16
Total assets / Adj. equity ratio (USDm)
Debt financing process for FSRU#8 initiated, expected close mid-2017
15
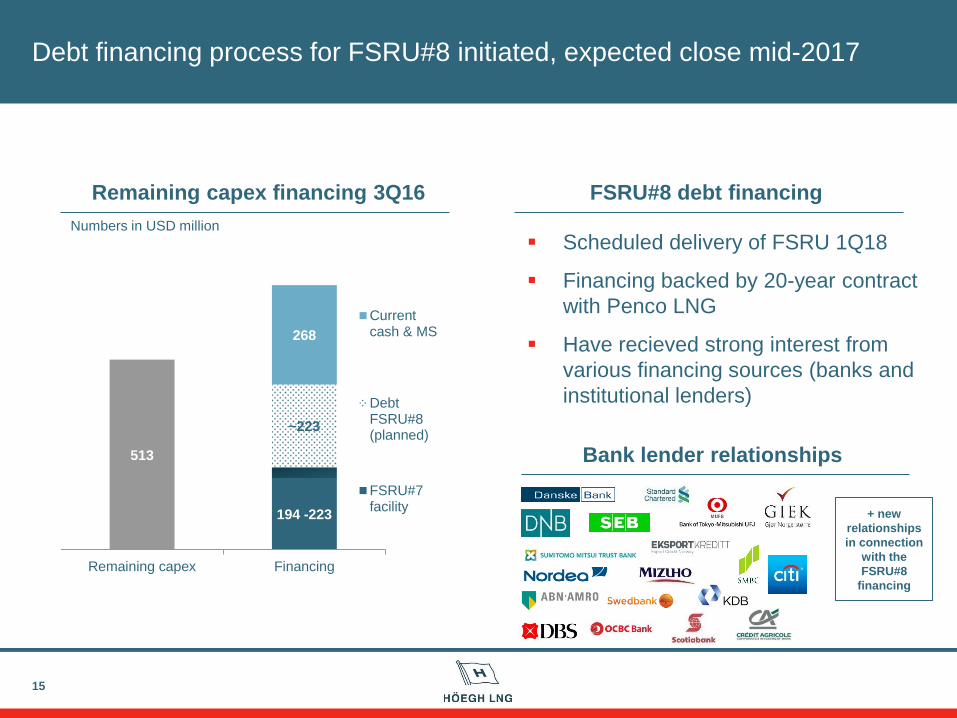
513
194 -223
~223
268
Remaining capex Financing
Currentcash & MS
DebtFSRU#8(planned)
FSRU#7facility
FSRU#8 debt financing
Numbers in USD million
Scheduled delivery of FSRU 1Q18
Financing backed by 20-year contract
with Penco LNG
Have recieved strong interest from
various financing sources (banks and
institutional lenders)
Remaining capex financing 3Q16
Bank lender relationships
+ new
relationships
in connection
with the
FSRU#8
financing

HMLP unit price up 26% LTM
16
+26%
+6%
-4%
0
50
100
150
200
250
300
350
400
0
2
4
6
8
10
12
14
16
18
20
No
v-1
5
De
c-1
5
De
c-1
5
Ja
n-1
6
Feb
-16
Feb
-16
Ma
r-1
6
Ap
r-1
6
Ma
y-1
6
Ma
y-1
6
Ju
n-1
6
Ju
l-1
6
Ju
l-1
6
Au
g-1
6
Se
p-1
6
Se
p-1
6
Oct-
16
No
v-1
6
Volume (000’) USD HMLP unit price development
HMLP volume HMLP
Alerian MLP index (rebased) S&P500 (rebased)
HMLP units key figures1:
Last close (15 Nov): USD 18.75
Market cap: USD 493 million
52 week high: USD 19.23
52 week low: USD 12.55
Current distribution: 0.4125 USD/unit
Current dividend yield: 8.8%
Höegh LNG ownership: 58%
HMLP has filed a shelf registration
Allows HMLP to issue new equity at
short notice with limited documentation
1 As of close 15.11.16

Preparations made for refinancing of HLNG01 maturing 2017
0
100
200
300
400
500
600
700
0 1 2 3 4 5
Ind
ica
tive
cre
dit
sp
rea
d (
bp
s)
Years to maturity
LNG bonds
GasLog
Golar LNG Partners
HLNG
Teekay LNG
17
Note: Arctic Securities indicative prices, as of 16 Nov 2016
Source: Arctic Securities
Bond Maturity Years to
maturity
Rank Coupon Currency Indicative price Indicative
spread
HLNG01 03.10.2017 0.88 Sr unsecured NIBOR3M+600 NOK 103.5 202
HLNG02 05.06.2020 3.56 Sr Unsecured LIBOR3M+500 USD 100.0 500

18
Debt financing process for FSRU#8 initiated
Preparing for dropdown of Höegh Grace to HMLP
Summary
Stable financial performance
Preparations made for refinancing of NOK 750m bond

19
Q&A session Call-in details:
Norway +47 23 50 01 87
United Kingdom +44 (0)20 3364 5726
United States +1 719-325-2340
Participant passcode: 201425

Höegh LNG Holdings - Agenda for presentation of 3Q 2016 financial results
20
Sveinung J.S. Støhle
President & CEO
Highlights / Markets / Summary
Appendix
Steffen Føreid
CFO
Financials
Dedededw

Income Statement – Joint Ventures according to equity method
21
USD million 3Q2016 2Q2016 1Q2016 4Q2015 3Q2015
Freight revenues 53.6 52.3 51.1 51.3 54.1
Management and other income 1.0 1.5 1.0 3.9 1.4
Share of results from investments in joint ventures 3.5 3.3 3.3 3.5 2.8
TOTAL INCOME 58.1 57.1 55.4 58.7 58.3
Charterhire expenses (8.9) (8.8) (8.8) (8.9) (8.9)
Bunker expenses (0.2) (0.1) (0.0) (1.8) (0.1)
Operating expenses (12.1) (11.7) (9.3) (10.0) (11.5)
Project administrative expenses (2.9) (2.9) (3.0) (3.2) (2.3)
Group administrative expenses (5.2) (4.8) (4.8) (4.1) (4.8)
Business development expenses (2.3) (1.8) (2.9) (6.0) (4.2)
EBITDA 26.5 27.0 26.6 24.6 26.6
Depreciation (9.2) (9.2) (7.3) (6.9) (6.9)
Reversal of impairment (impairment) - - - (37.0) -
EBIT 17.3 17.8 19.3 (19.3) 19.7
Interest income 0.3 0.4 0.5 0.4 0.4
Interest expenses (14.3) (14.6) (12.9) (12.6) (12.6)
Other financial items 1.1 0.4 0.2 (0.4) (5.4)
PROFIT (LOSS) BEFORE TAX 4.4 4.0 7.1 (32.0) 2.1
Taxes (1.1) (0.5) (0.8) (1.0) 0.4
NET PROFIT (LOSS) 3.3 3.5 6.3 (33.0) 2.5
-

Financial position- Joint Ventures according to equity method
22
USD million 30.09.2016 30.06.2016 31.03.2016 31.12.2015 30.09.2015
Licences, design and other intangibles 0 0 0 0 37
Newbuildings under construction and vessels 1 245 1 247 1 225 1 033 1 036
Shareholder loans to joint ventures 9 10 13 14 15
Mark-to-market on hedging instruments 0 0 0 3 0
Other assets 71 73 66 71 55
Restricted cash (non-current) 23 20 20 20 17
Current cash and marketable securities 268 294 343 344 371
Asset held for sale 0 0 0 18 18
TOTAL ASSETS 1 616 1 644 1 667 1 503 1 549
Total equity 442 434 456 492 510
Investments in joint ventures 76 85 83 74 90
Interest bearing debt 955 966 979 787 801
Mark-to-market on hedging instruments 72 86 76 68 74
Other liabilities 71 72 73 83 74
TOTAL EQUITY AND LIABILITIES 1 616 1 643 1 667 1 503 1 549
Total equity adjusted for hedging reserves 576 585 592 598 642
Equity ratio adjusted for hedging reserves 36 % 36 % 36 % 40 % 41 %
Net interest bearing debt 663 650 616 423 413
Cash flow statement- Joint Ventures according to equity method
23
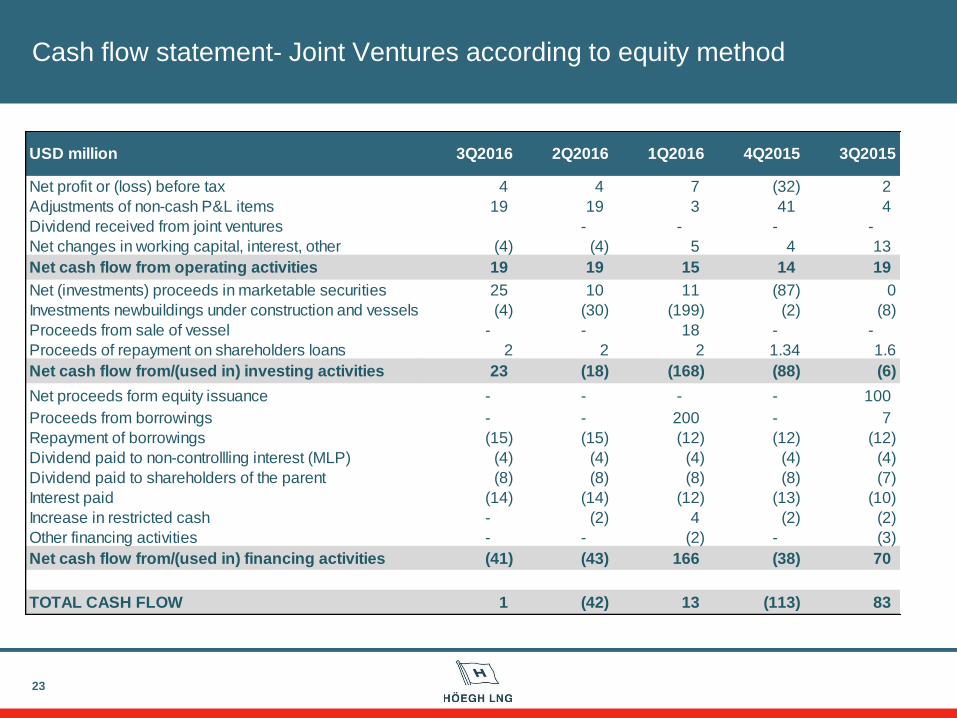
USD million 3Q2016 2Q2016 1Q2016 4Q2015 3Q2015
Net profit or (loss) before tax 4 4 7 (32) 2
Adjustments of non-cash P&L items 19 19 3 41 4
Dividend received from joint ventures - - - -
Net changes in working capital, interest, other (4) (4) 5 4 13
Net cash flow from operating activities 19 19 15 14 19
Net (investments) proceeds in marketable securities 25 10 11 (87) 0
Investments newbuildings under construction and vessels (4) (30) (199) (2) (8)
Proceeds from sale of vessel - - 18 - -
Proceeds of repayment on shareholders loans 2 2 2 1.34 1.6
Net cash flow from/(used in) investing activities 23 (18) (168) (88) (6)
Net proceeds form equity issuance - - - - 100
Proceeds from borrowings - - 200 - 7
Repayment of borrowings (15) (15) (12) (12) (12)
Dividend paid to non-controllling interest (MLP) (4) (4) (4) (4) (4)
Dividend paid to shareholders of the parent (8) (8) (8) (8) (7)
Interest paid (14) (14) (12) (13) (10)
Increase in restricted cash - (2) 4 (2) (2)
Other financing activities - - (2) - (3)
Net cash flow from/(used in) financing activities (41) (43) 166 (38) 70
TOTAL CASH FLOW 1 (42) 13 (113) 83