ENABLING A REGIONAL LNG PLATFORM SERVING THE INDIAN … · 2020-01-09 · The Global LNG Play...
16
ENABLING A REGIONAL LNG PLATFORM SERVING THE INDIAN OCEAN ISLAND NATIONS CONTACT: Eyob Easwaran Lender Transaction Advisor, Deal Structuring & Financial Modelling Email: [email protected] Office: +230 467 6016
Transcript of ENABLING A REGIONAL LNG PLATFORM SERVING THE INDIAN … · 2020-01-09 · The Global LNG Play...
ENABLING A REGIONAL LNG PLATFORM SERVING THE INDIAN
OCEAN ISLAND NATIONS
CONTACT: Eyob EaswaranLender Transaction Advisor, Deal Structuring & Financial ModellingEmail: [email protected]: +230 467 6016

THE GLOBAL LNG PLAY
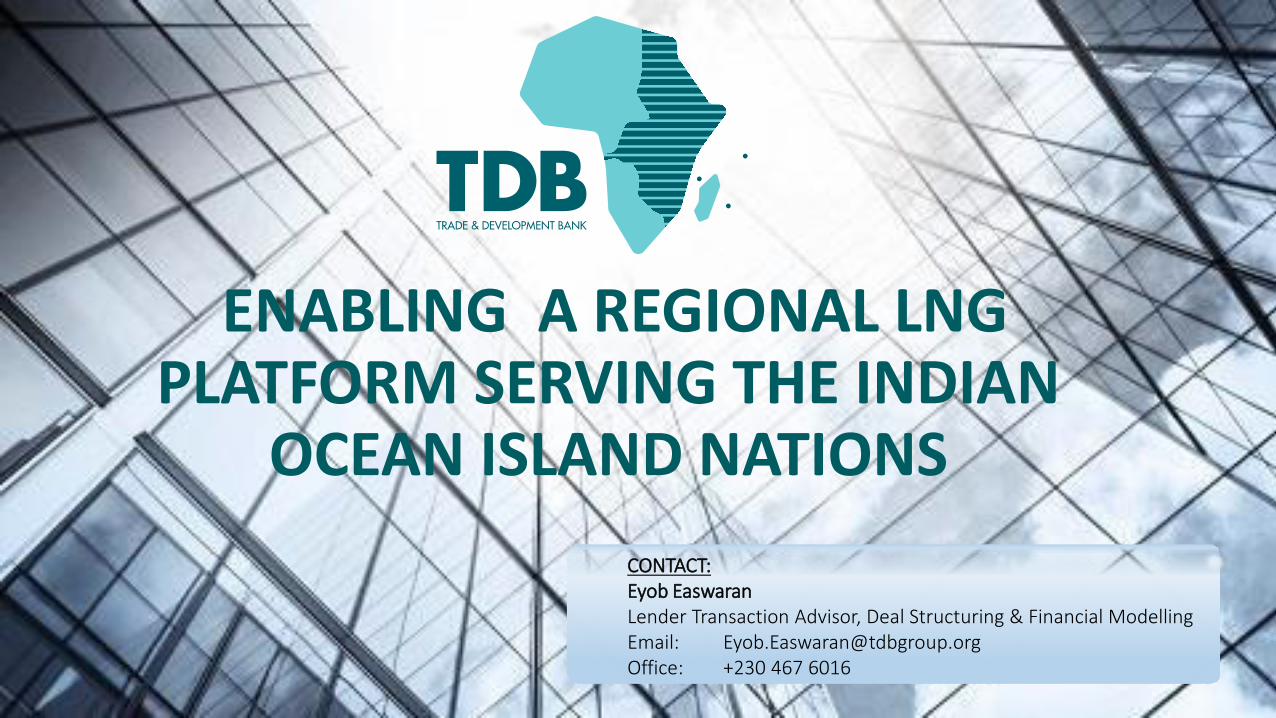
The Global LNG Play – The State of the LNG Market
➢ The state of the LNG industry according to the 2017 IGU World LNG Report:
➢ 258 million tons of global trade in 2016
➢ 72 million tons of non long-term trade in 2016
➢ $5.52/MMBtu average spot price in Northeast Asia in 2016 ($9.55/MMBtu in February 2017)
➢ 340 MTPA global nominal liquefaction capacity in 2017
➢ 879 MTPA proposed liquefaction capacity in 2017
➢ 114.6 MTPA global liquefaction capacity under construction in 2017
➢ 795 MTPA global nominal regasification capacity in 2017
➢ 83 MTPA FSRU capacity in 2017
➢ 156.9 MTPA proposed FLNG capacity as of January 2017
➢ 439 vessels consist LNG fleet in 2017
➢ 4.4 MT re-exported LNG volumes in 2016
➢ LNG 10% of global gas supply in 2015
Source : International Gas Union (IGU) 2017 World LNG Report
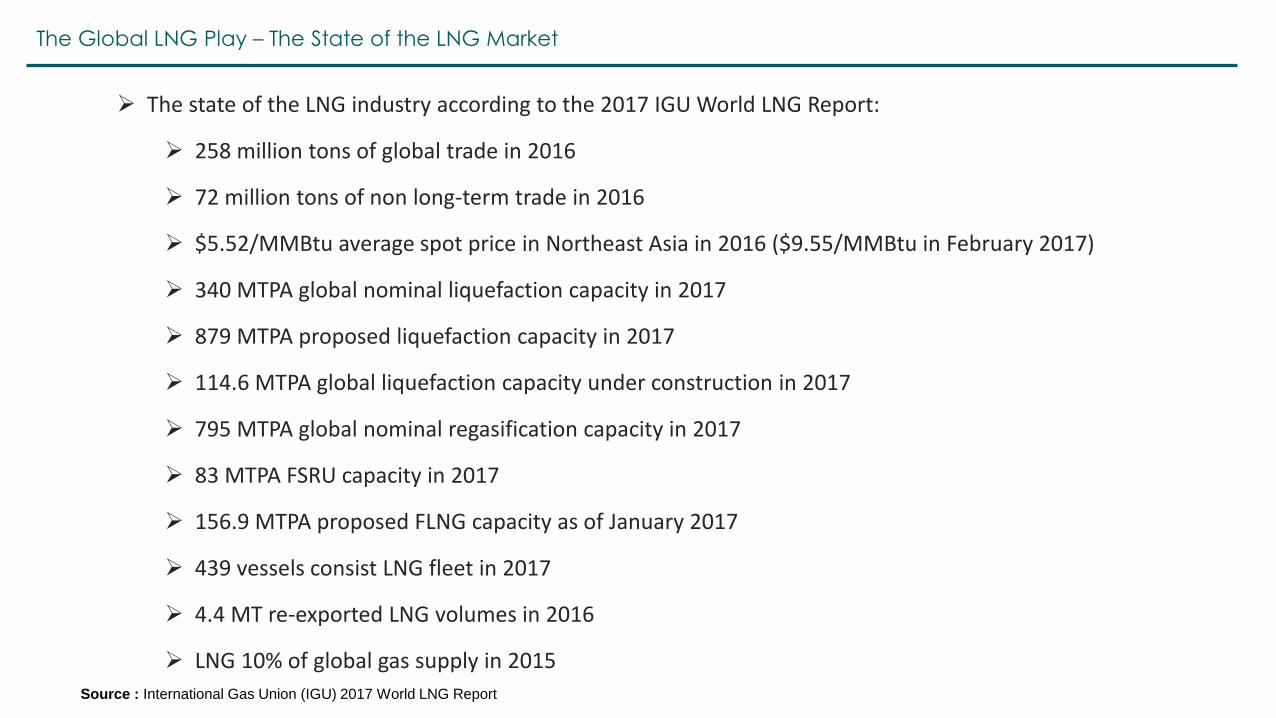
The Global LNG Play – Continuous increase in resource discovery and export market
LNG Export Market Share by Country (%) Qatar 29.9% Australia 17.2%
Malaysia 9.7% Nigeria 7.2%
Indonesia 6.4% Algeria 4.5%
Russia 4.2% Trinidad 4.1%
Oman 3.2% PNG 2.9%
Brunei 2.4% UAE 2.2%
Norway 1.7% Peru 1.6%
Eq. Guinea 1.3% US 1.1%
Angola 0.3% Egypt 0.2%
Source : International Gas Union (IGU) 2017 World LNG Report
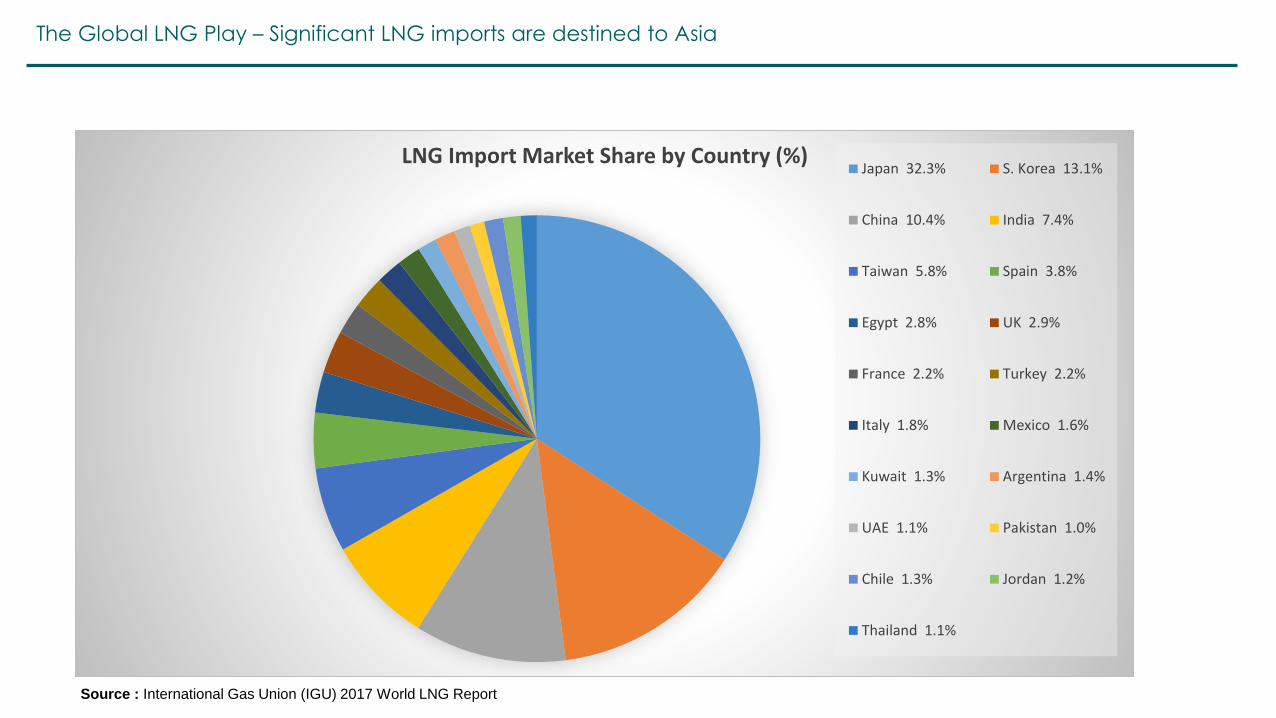
The Global LNG Play – Significant LNG imports are destined to Asia
LNG Import Market Share by Country (%)Japan 32.3% S. Korea 13.1%
China 10.4% India 7.4%
Taiwan 5.8% Spain 3.8%
Egypt 2.8% UK 2.9%
France 2.2% Turkey 2.2%
Italy 1.8% Mexico 1.6%
Kuwait 1.3% Argentina 1.4%
UAE 1.1% Pakistan 1.0%
Chile 1.3% Jordan 1.2%
Thailand 1.1%
Source : International Gas Union (IGU) 2017 World LNG Report

The Global LNG Play – Smaller scale technologies accommodating smaller markets
➢ Growing number of LNG suppliers and advances in small-scale technology are enabling LNG delivery to small
island nations
➢ FSRU new builds and conversions are expanding access for emerging LNG markets
➢ Developers pushing to locate small pockets of demand and aggregate volumes
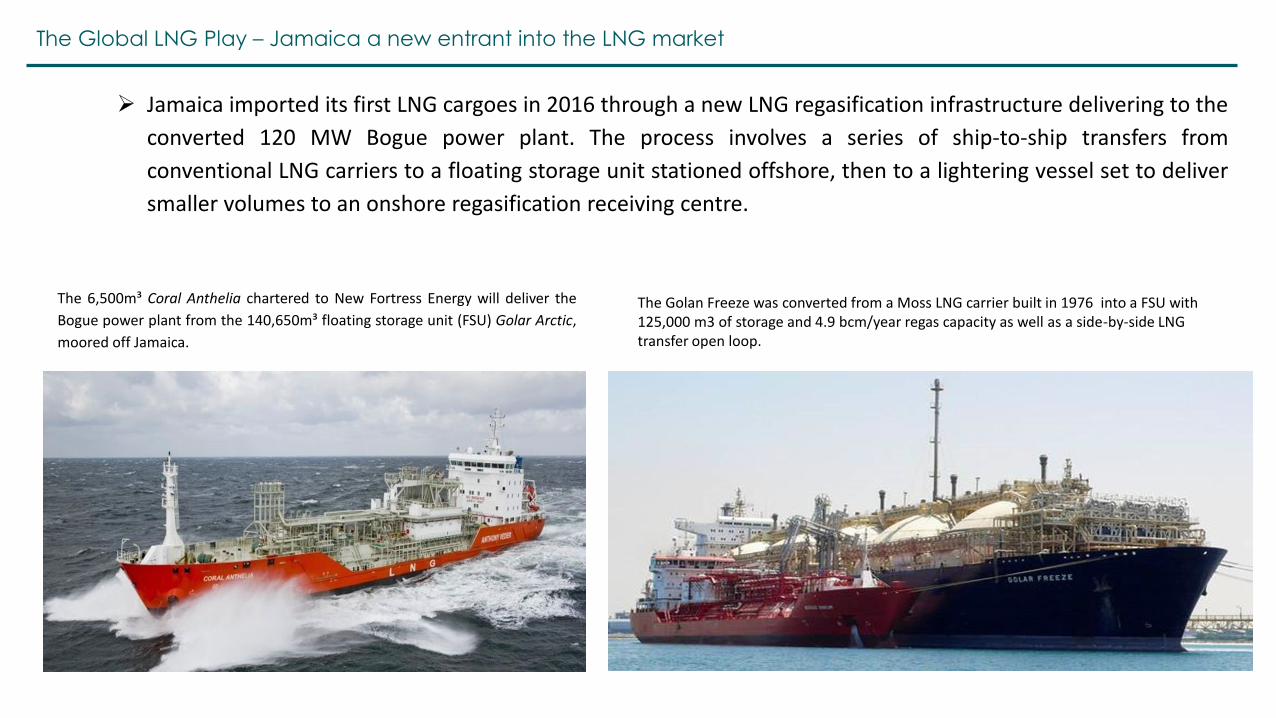
The Global LNG Play – Jamaica a new entrant into the LNG market
➢ Jamaica imported its first LNG cargoes in 2016 through a new LNG regasification infrastructure delivering to the
converted 120 MW Bogue power plant. The process involves a series of ship-to-ship transfers from
conventional LNG carriers to a floating storage unit stationed offshore, then to a lightering vessel set to deliver
smaller volumes to an onshore regasification receiving centre.
The 6,500m³ Coral Anthelia chartered to New Fortress Energy will deliver the
Bogue power plant from the 140,650m³ floating storage unit (FSU) Golar Arctic,
moored off Jamaica.
The Golan Freeze was converted from a Moss LNG carrier built in 1976 into a FSU with 125,000 m3 of storage and 4.9 bcm/year regas capacity as well as a side-by-side LNG transfer open loop.

TheGlobal LNG Paly – Malta a new entrant to the LNG market
➢ Malta became an LNG importer in January 2017 by converting an older tanker as a floating storage unit and
then sending volumes onshore to a small-scale regasification terminal. Built under a $300 million contract in
2015, the FSU is a conversion of a 125,000-cbm MOSS LNG carrier. The FSU delivers LNG to the onshore
regasification plant feeding natural gas to the 200 MW Delimara 4 power plant.

The Global LNG Play – The capital cost for gas to power the lowest among other technologies
Source URL: https://www.e-education.psu.edu/eme801/node/530
Technology Capital Cost ($/kW) Operating Cost ($/kWh)
Coal-fired combustion turbine $500 — $1,000 0.20 — 0.04
Natural gas combustion turbine $400 — $800 0.04 — 0.10
Coal gasification combined-cycle (IGCC) $1,000 — $1,500 0.04 — 0.08
Natural gas combined-cycle $600 — $1,200 0.04 — 0.10
Wind turbine (includes offshore wind) $1,200 — $5,000 Less than 0.01
Nuclear $1,200 — $5,000 0.02 — 0.05
Photovoltaic Solar $4,500 and up Less than 0.01
Hydroelectric $1,200 — $5,000 Less than 0.01
Typical capital and operating costs for power plants. Note that these costs do not include subsidies, incentives, or any "social costs" (e.g., air or water emissions)
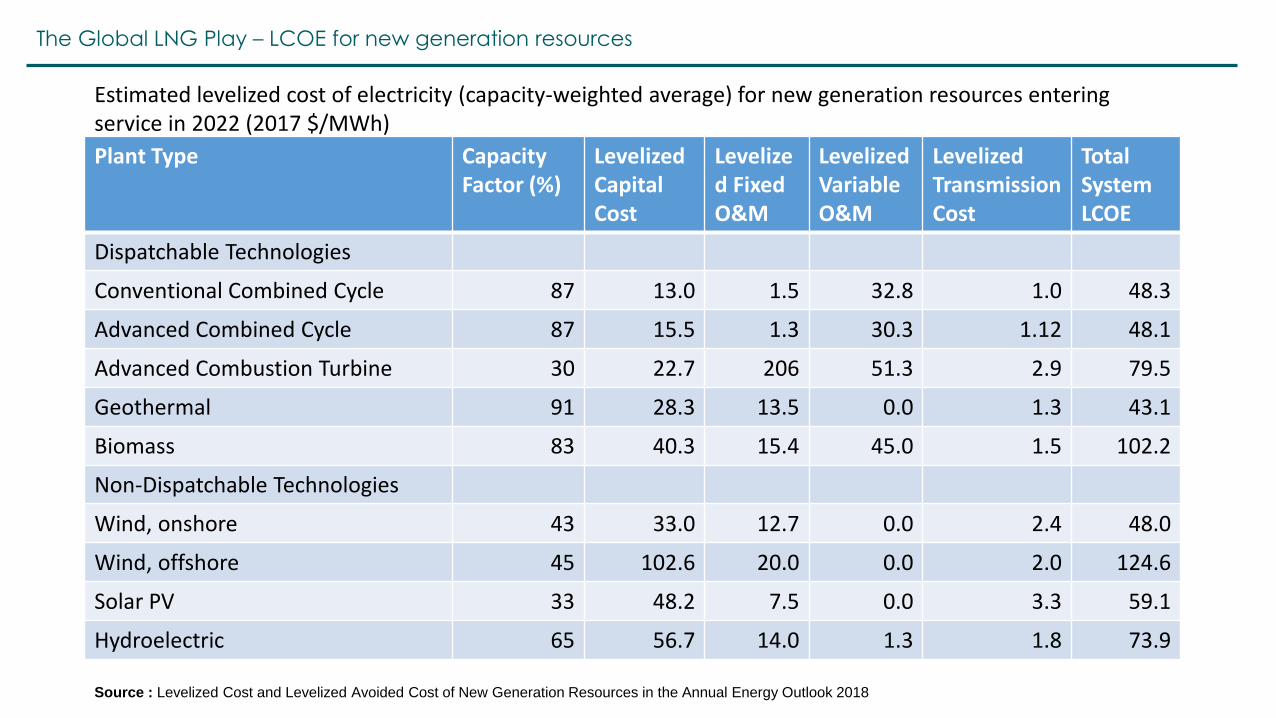
The Global LNG Play – LCOE for new generation resources
Source : Levelized Cost and Levelized Avoided Cost of New Generation Resources in the Annual Energy Outlook 2018
Plant Type Capacity Factor (%)
Levelized Capital Cost
Levelized Fixed O&M
Levelized Variable O&M
Levelized Transmission Cost
Total System LCOE
Dispatchable Technologies
Conventional Combined Cycle 87 13.0 1.5 32.8 1.0 48.3
Advanced Combined Cycle 87 15.5 1.3 30.3 1.12 48.1
Advanced Combustion Turbine 30 22.7 206 51.3 2.9 79.5
Geothermal 91 28.3 13.5 0.0 1.3 43.1
Biomass 83 40.3 15.4 45.0 1.5 102.2
Non-Dispatchable Technologies
Wind, onshore 43 33.0 12.7 0.0 2.4 48.0
Wind, offshore 45 102.6 20.0 0.0 2.0 124.6
Solar PV 33 48.2 7.5 0.0 3.3 59.1
Hydroelectric 65 56.7 14.0 1.3 1.8 73.9
Estimated levelized cost of electricity (capacity-weighted average) for new generation resources entering service in 2022 (2017 $/MWh)

The Global LNG Play – LNG Landed Prices
11
Cove Point$2.82
Altamira$9.60
Canaport$2.56
UK $7.60
Lake Charles$2.68
Bahia Blanca$9.72
Spain$8.25
Belgium$10:00
India$10:00
Korea$10:05
China$10:05
World LNG Estimated Landed Prices: August 2018
Federal Energy Regulatory Commission - Market Oversight – www.ferc.gov/oversight

The Global LNG Play – Clean Source of Fuel
➢ Natural gas is the cleanest form of burning hydrocarbon fuel.
➢ Natural gas enables compliance with new environmental standards.
➢ Compared with diesel, natural gas fuel represents the following reductions:
➢ 25% reduction in carbon dioxide (CO2),
➢ 80% reduction in nitrogen oxide (NOx), and
➢ 97% reduction in carbon monoxide (CO) emissions.
➢ Natural gas-fired generation has the potential to:
➢ Reduce carbon monoxide (CO) and emissions of particulates by 90%
➢ Emit 80% less nitrogen oxide (NOx) than burning coal
➢ Emit virtually no SO2 or Mercury
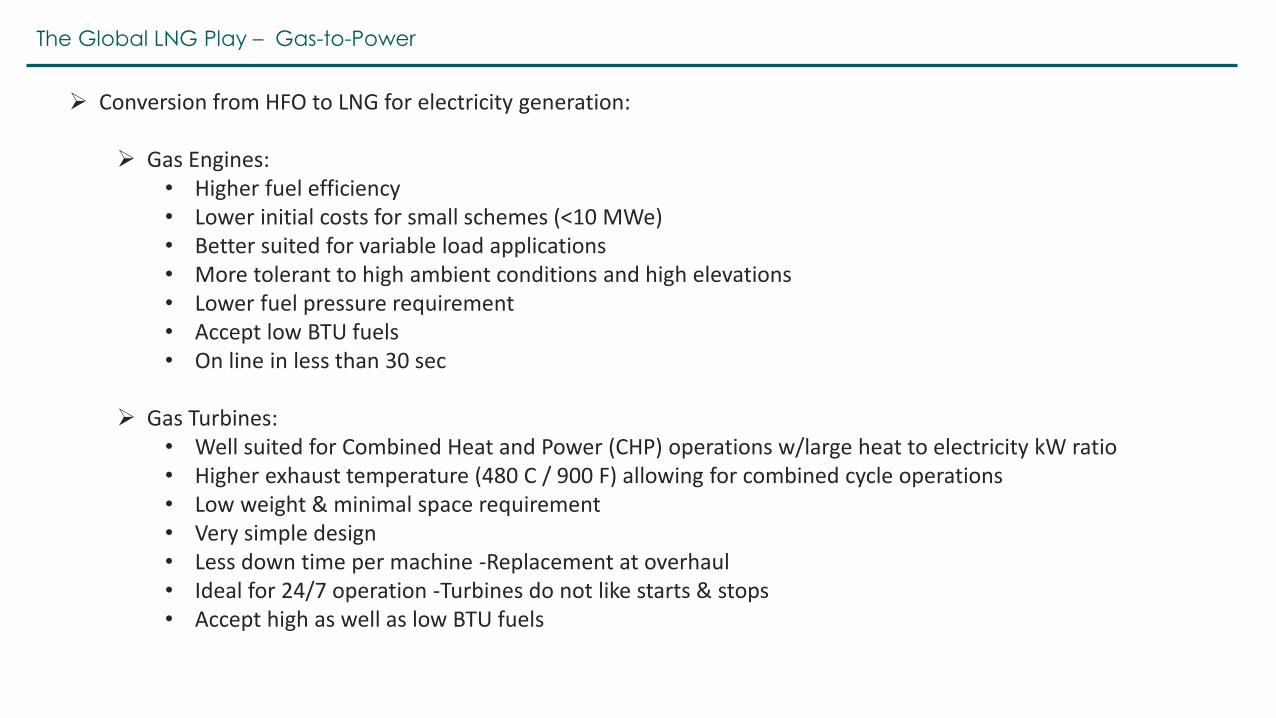
The Global LNG Play – Gas-to-Power
➢ Conversion from HFO to LNG for electricity generation:
➢ Gas Engines:• Higher fuel efficiency • Lower initial costs for small schemes (<10 MWe) • Better suited for variable load applications • More tolerant to high ambient conditions and high elevations • Lower fuel pressure requirement • Accept low BTU fuels • On line in less than 30 sec
➢ Gas Turbines:• Well suited for Combined Heat and Power (CHP) operations w/large heat to electricity kW ratio • Higher exhaust temperature (480 C / 900 F) allowing for combined cycle operations • Low weight & minimal space requirement • Very simple design• Less down time per machine -Replacement at overhaul • Ideal for 24/7 operation -Turbines do not like starts & stops• Accept high as well as low BTU fuels
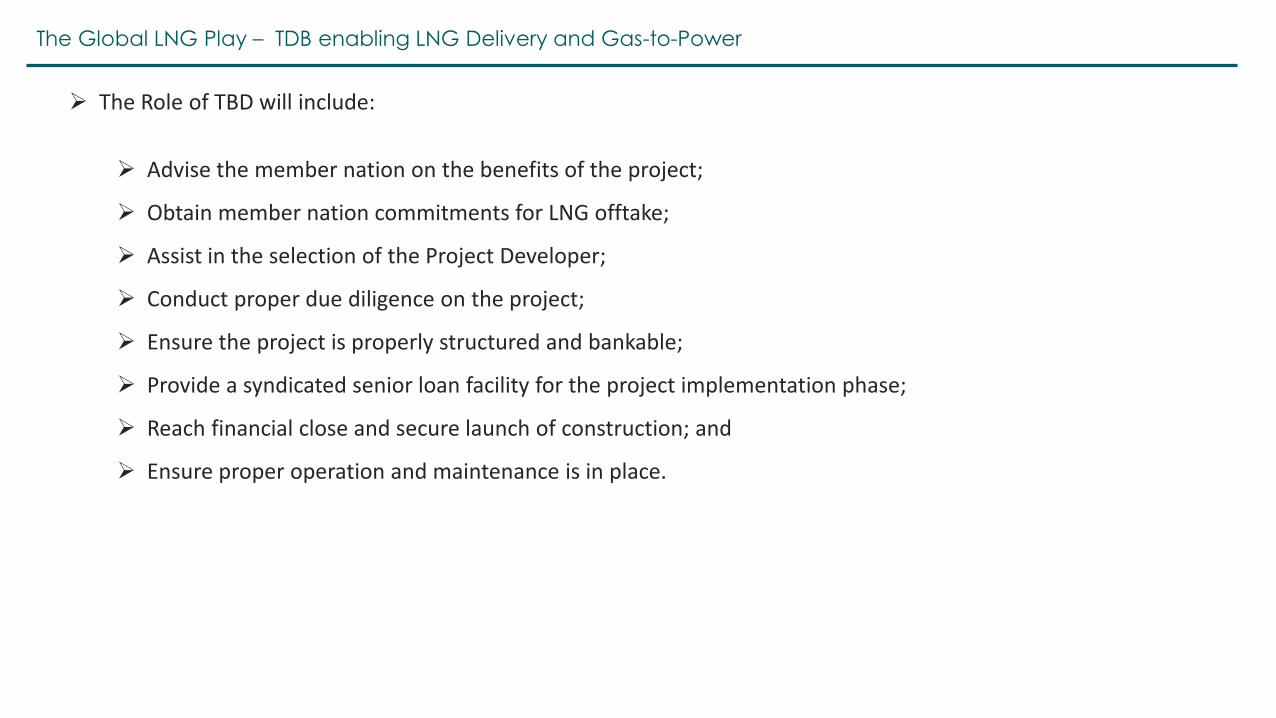
The Global LNG Play – TDB enabling LNG Delivery and Gas-to-Power
➢ The Role of TBD will include:
➢ Advise the member nation on the benefits of the project;
➢ Obtain member nation commitments for LNG offtake;
➢ Assist in the selection of the Project Developer;
➢ Conduct proper due diligence on the project;
➢ Ensure the project is properly structured and bankable;
➢ Provide a syndicated senior loan facility for the project implementation phase;
➢ Reach financial close and secure launch of construction; and
➢ Ensure proper operation and maintenance is in place.
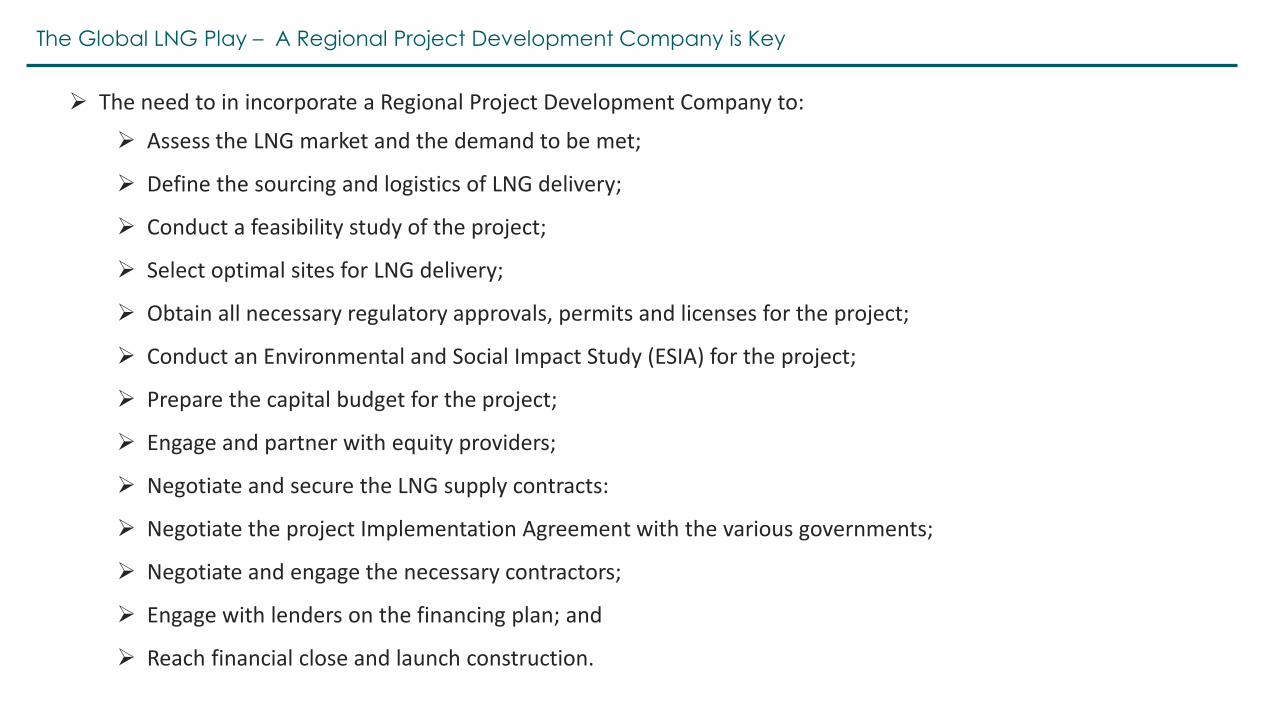
The Global LNG Play – A Regional Project Development Company is Key
➢ The need to in incorporate a Regional Project Development Company to:
➢ Assess the LNG market and the demand to be met;
➢ Define the sourcing and logistics of LNG delivery;
➢ Conduct a feasibility study of the project;
➢ Select optimal sites for LNG delivery;
➢ Obtain all necessary regulatory approvals, permits and licenses for the project;
➢ Conduct an Environmental and Social Impact Study (ESIA) for the project;
➢ Prepare the capital budget for the project;
➢ Engage and partner with equity providers;
➢ Negotiate and secure the LNG supply contracts:
➢ Negotiate the project Implementation Agreement with the various governments;
➢ Negotiate and engage the necessary contractors;
➢ Engage with lenders on the financing plan; and
➢ Reach financial close and launch construction.

DISCLAIMER
This document is confidential and should not be distributed, published or reproduced, in whole or in part, nor should its content be disclosed without the
TDB’s prior written consent. The following applies to this presentation, the oral presentation of the information in this document by Eastern and Southern
African Trade and Development Bank (the “Bank”) or any person on behalf of the Bank, and any question-and-answer session that follows the oral
presentation. By attending the meeting where this presentation is made, by attending any question-and-answer session or by reading the presentation
slides, you agree to be bound by the following limitations:
This presentation does not constitute or form part of and should not be constructed as, an offer to sell, or the solicitation or invitation of any offer to buy or
subscribe for, securities of the Bank in any jurisdiction or an inducement to enter into investment activity. This presentation and any materials distributed in
connection with this presentation are not directed to, or intended for distribution to or use by, any person or entity that is a citizen or resident or located in
any locality, state, country or other jurisdiction where such distribution, publication, availability or use would be contrary to law or regulation or which
would require any registration or licensing within such jurisdiction.
No representation, warranty or undertaking, expressed or implied, is made as to, and no reliance should be placed on, the fairness, accuracy, completeness
or correctness of the information or the opinions contained herein. Neither the Bank nor any of its respective affiliates, advisors or representatives nor any
other person shall have any liability whatsoever (in negligence or otherwise) for any loss however arising from any use of this presentation or its contents or
otherwise arising in connection with the presentation.
All statements other than statements of historical facts included in this presentation, including, without limitation, those regarding the Bank’s financial
position, business strategy, plans and objectives of management for future operations are forward-looking statements. These forward-looking statements
speak only as at the date of this presentation. The Bank expressly disclaims any obligation or undertaking to disseminate any updates or revisions to any
forward-looking statements contained herein to reflect any change in the Bank's expectations with regard thereto or any change in events, conditions or
circumstances on which any such statement is based.