HIV AND STIs IN MYSORE DISTRICT, - KHPT · HIV AND STIs IN MYSORE DISTRICT, KARNATAKA, INDIA A...
275
Transcript of HIV AND STIs IN MYSORE DISTRICT, - KHPT · HIV AND STIs IN MYSORE DISTRICT, KARNATAKA, INDIA A...

HIV AND STIs IN MYSORE DISTRICT, KARNATAKA, INDIA
A General Population Survey
Sangameshwar B. M. Pradeep B. S. Rajaram S.
Jaychandran A. A. Jan Bradley Michel Alary
Stephen Moses B. M. Ramesh
Reynold Washington
CHARME Working Paper No. 2 November 2008

i
CONTENTS List of Figures ................................................................................................................................ iii Abbreviations ...................................................................................................................................v Acknowledgements ....................................................................................................................... vii Chapter 1 Introduction ............................................................................................................1 Chapter 2 Household Census: Population and Housing Characteristics.................................7 Chapter 3 Characteristics of Survey Respondents ................................................................13 Chapter 4 HIV/AIDS and STI – Related Knowledge, Attitudes and Behaviour ..................19 Chapter 5 HIV and STI Prevalence.......................................................................................31 Chapter 6 Comparison of Face-to-Face Interview and Polling Booth Survey Data .............35 Chapter 7 Summary ..............................................................................................................41 Appendix A Detailed Tables.....................................................................................................47 Appendix B Estimates of Sampling Errors.............................................................................195 Appendix C Survey Instruments.............................................................................................203 Appendix D Project Team ......................................................................................................261

ii

iii
LIST OF FIGURES
Figure 2.1 Population Pyramid RURAL.....................................................................................8 Figure 2.2 Population Pyramid URBAN ....................................................................................8 Figure 2.3 Percentage literate by sex and place of residence......................................................9 Figure 3.1 Response rate (both interview & biological sample) by sex and place of
residence ..................................................................................................................13 Figure 3.2 Marital status by sex ................................................................................................14 Figure 4.1 Knowledge of modes of HIV/AIDS transmission after probing .............................20 Figure 4.2 Knowledge of prevention of HIV/AIDS after probing by place of residence .........21 Figure 4.3 Median age at first sexual intercourse by sex and place of residence .....................22 Figure 4.4 Percent of respondents who had more than one sexual partner ...............................23 Figure 4.5 Percent who have ever seen or heard of condoms by sex and place of residence ...25 Figure 4.6 Mean number of injections received in previous year.............................................28 Figure 5.1 HIV prevalence by sex and place of residence ........................................................31 Figure 6.1 Comparison of PBS and FTFI on selected indictors among married males ............36 Figure 6.2 Comparison of PBS and FTFI on selected indicators among married females .......37 Figure 6.3 Comparison of PBS and FTFI on selected indicators among unmarried males ......38

iv

v
ABBREVIATIONS
AIDS Acquired Immunodeficiency Syndrome BMGF Bill & Melinda Gates Foundation CHA Centre Hospitalier Affilié CHARME Centre Hospitalier Affilié HIV/AIDS Research Monitoring and Evaluation CT Chlamydia Trachomatis DBS Dried Blood Spot ELISA Enzyme- Linked Immunosorbent Assay FSW Female Sex Worker FTFI Face-To-Face Interview GPS General Population Survey HIV Human Immunodeficiency Virus HSV2 Herpes Simplex Virus Type 2 IPHCR Institute of Population Health and Clinical Research KHPT Karnataka Health Promotion Trust KSAPS Karnataka State AIDS Prevention Society MSM Men who have Sex with Men NG Neisseria Gonorrhoeae PBS Polling Booth Survey PPS Probability Proportional to Size RPR Rapid Plasma Reagin SBS Special Behavioural Survey SJMC St. John’s Medical College STI Sexually Transmitted Infection STD Sexually Transmitted Disease TPHA Treponema Pallidum Haemaglutination

vi

vii
ACKNOWLEDGEMENTS The General Population Survey (GPS) in Mysore district was successfully completed due to the efforts and involvement of numerous organizations and individuals at different stages of the survey. As far as possible, we would like to thank everyone who was involved in the survey and made it a success. First of all, we are grateful to the India AIDS initiative, Avahan, of the Bill & Melinda Gates Foundation for funding this study. We gratefully acknowledge the continuous guidance and support from the Karnataka Health Promotion Trust (KHPT) staff in Bangalore with this study and with preparation of the report. Our heartfelt thanks are due to the Institute of Population Health and Clinical Research (IPHCR) of St. John’s Medical College (SJMC), Bangalore for the difficult task of data collection, data entry, transportation of biological samples and laboratory testing. We are thankful to the Karnataka State AIDS Prevention Society, for extending their support. The assistance provided by the staff of J.S.S. Medical College Hospital, Mysore for the biological component of the survey is acknowledged with gratitude. We gratefully acknowledge the immense help received from Deputy Commissioner, District Health and Family Welfare Officer, Superintendent of Police and CEO Zilla Panchayat, Mysore district for providing the logistical support whenever possible. Special thanks go to the local officials in all of the sample areas for facilitating the data collection. In addition, we are also thankful to Dr. Sushena Reza Paul and Mysore KHPT team for their assistance during the field data collection. We appreciate and acknowledge the hard work put in by the supervisors, interviewers, and lab technicians in collecting data for GPS. Thanks are also due to the Rotary-TTK Blood Bank, Bangalore Medical Services Trust & Research Institute, Bangalore for assistance with laboratory testing. Finally, we acknowledge all the eligible women and men of Mysore district who spent their time and responded to the lengthy questionnaires with tremendous patience and grace.

viii

CHAPTER 1 INTRODUCTION
The CHARME Project is funded by a 7 year grant from the Bill & Melinda Gates Foundation (BMGF), to monitor and evaluate its Avahan HIV/AIDS programme in India. The Project is managed by the Centre Hospitalier Affilié universitaire de Quebec (CHA), Canada. The major goal of the project is to study HIV transmission dynamics among and between core, bridge and general population groups and to assess the impact of HIV preventive interventions, using a combination of mathematical modelling and empirical data. In addition, the CHARME Project has a component to assess the cost-effectiveness of interventions in the four southern states of India covered by Avahan.
In order to facilitate the mathematical modelling, the CHARME Project collects data on sexual behaviour through serial cross-sectional surveys of general populations (GPS). In these surveys, respondents are asked to respond to a face-to-face interview and to provide blood and urine samples for STI and HIV testing. In addition, and as part of the GPS, the Project conducts polling booth surveys (PBS) of a sample of randomly selected people in the same district to validate the findings of the face-to-face interviews. The Project also undertakes quantitative and qualitative research in special behavioural surveys (SBS) of vulnerable populations such as FSWs, MSM and their clients.
In India, the CHARME project is housed in the Karnataka Health Promotion Trust (KHPT) office and has an agreement with KHPT to provide administrative and logistical support to the project. In Karnataka, CHARME works closely with the University of Manitoba, the Karnataka State AIDS Prevention Society (KSAPS) and with the KHPT, who together are the key implementers of HIV/AIDS prevention and care programming in the state. The University of Manitoba and KHPT and CHA are committed to transferring knowledge gained into the global effort to limit the impact of HIV/AIDS.
This report presents the results of one aspect of the CHARME portfolio of work: the general population survey (GPS) carried out in the Mysore district, Karnataka. The GPS in Mysore was carried out in collaboration with Institute of Population Health and Clinical Research (IPHCR), St. John’s Medical College (SJMC), Bangalore, Karnataka. The following sections discuss the objectives and various aspects of the GPS in detail.
OBJECTIVES
The main objectives of the GPS are:
1. To provide data on key sexual behaviours among the adult male and female general population in the age group 15-49 years.
2
2. To provide data on the prevalence of STIs and HIV among the adult male and female general population in the age group 15-49 years.
3. To verify responses about sexual behaviour by conducting anonymous Polling Booth Surveys (PBS) in a sample of men and women of the same age in the district.
SAMPLE DESIGN The target sample size was 6,000 for males and females in the age group 15-49, with an equal 3,000 rural/urban split. The sample size of 6,000 was based on factors such as the expected level of non-response, cost and time of conducting such studies, and the desired level of precision in estimating the prevalence of HIV and STI in the general population at the district level. The urban (20 blocks) and rural (15 villages) samples were drawn separately. In rural areas, the 2001 Census list of villages served as the sampling frame. In urban areas, National Sample Survey Organization’s (NSSO) sampling frame of urban census enumeration blocks for the period 1997-2002, was used. The required number of rural areas was selected systematically using a probability proportional to size (PPS) method from the list of total villages. Similarly, the required number of urban areas was selected systematically using a selection interval calculated from the total number of urban census enumeration blocks. A complete census of households in the selected villages and urban blocks of Mysore district was undertaken during the period October 2005 to March 2006. The resulting household list was used as the sampling frame to select the required number of respondents in the age group 15-49. In each rural area, the number of individuals to be selected was fixed based on the population size in the age group 15-49 years. However, in urban areas the number of individuals to be selected was fixed at 150 per urban area. For each of the rural and urban areas, the list of persons in the age group 15-49 who were usual residents, as well as those who stayed in the household the night before the census, was arranged according to sex, age and marital status. The required number of individuals was then selected systematically with probability proportion to size. In the case of urban areas where the list contained less than 150 persons, the list was attached to another urban area with a larger population size and then 300 persons were selected from the combined list1.
In general, social desirability bias reduces the reliability of sexual behaviour data obtained by standard face-to-face interview (FTFI) techniques. Polling booth surveys (PBS) have been developed to obtain more accurate information on sexual behaviours. In Mysore, in addition to the face-to-face interview (FTFI), PBS sessions were conducted among a sample of adult males and females in the selected urban and rural areas. In the rural and urban areas, a total of 100 and 80 polling booth sessions, respectively, were organised. In the rural areas, each session we attempted to include 15 participants and in urban areas each session we attempted to include 20 participants. The number of sessions
1 In Mysore, we identified one such urban block and this urban block was attached to another urban block with a larger population size.

3
in each rural and urban area was decided based on the population size. Separate polling booth sessions were organised by demographic characteristics such as sex and marital status. In other words, separate polling booth sessions were conducted for unmarried males, unmarried females, married males and married females. The participants for each session were randomly selected from the same sampling frame as that for the main face-to-face interviews.
SAMPLE WEIGHTS
Sample weights were calculated based on design weights, adjusted for effect of different types of non-responses in each primary sampling unit. The method of calculating the weights is specified below: Let Ri be the proportion of the sample that was interviewed in each primary sampling unit. Then the sample weight wi was calculated as follows:
i
Dii R
Ww =
where, WDi is the design weight for the ith sampling unit and is given as:
iiDi ff
fW21 ×
=
where, f is the over all sampling fraction, f1i is the probability of selecting the íth primary sampling unit, f2i is the probability of selecting an individual from the íth primary sampling. After adjustment for non-response and design effect, the weights are normalized so that the total number of weighted cases is equal to the total number of unweighted cases. The final weight used for each primary sampling weight is given as:
iii
ii w
nwn
W ××Σ
Σ=
Where, ni refers to the actual number of cases who were interviewed in the ith primary sampling unit. Separate weights were calculated for any biological samples, serum samples and urine samples. BIOLOGICAL SAMPLES AND LABORATORY TESTING In this survey, venous blood serum or dried blood spot (DBS) samples and/or urine samples were collected for HIV/STI testing from the selected individuals who gave consent. Trained health investigators collected the biological samples. The tests for STIs used specific samples: urine for gonorrhoea and chlamydia; serum for syphilis and HSV-2. HSV2 testing was carried out on a sub-sample of 1:8 randomly selected serum

4
samples, and on all samples collected from men reporting having ever been a client of female sex workers. Serum samples were tested for HIV with a first Enzyme Immunoassay or Enzyme- Linked Immunosorbent Assay (ELISA) test (J Mitra, J. Mitra & Company Private Limited, New Delhi, India). All positive samples test were tested with a second ELISA (Genedia, Greencross Lifescience Corp, Kyunggi-do, South Korea). Similar testing procedures were used on DBS samples, after elution. However, the first ELISA used was Detect HIV (Adaltis Labs, USA) and if positive the sample was tested with a second ELISA (Genedia, Greencross Lifescience Corp, Kyunggi-do, South Korea). To be considered HIV positive, a sample needed to be positive by both ELISA tests. For those respondents who did not give a blood sample, but did give a urine sample, HIV tests on the urine samples were undertaken. Aliquots of urine samples were kept refrigerated at 4oC until tested for HIV-1 antibodies using an ELISA test, with confirmation of initially positive results by urine Western blot (Calypte Biomedical Corporation, Berkeley. California, USA). To test for Neisseria Gonorrhoeae (NG) and Chlamydia Trachomatis (CT), we used using nucleic acid amplification tests (Aptima Combo 2 Assay, Gen-Probe, San Diego, CA, USA) and Roche test. Serum samples were tested for syphilis antibodies using a Rapid Plasma Reagin (RPR) test (Span Diagnostics, Surat, India). All samples positive by RPR were then tested with a Treponema Pallidum Haemaglutination (TPHA) test (Glaxo-Omega, Alloa, Scotland, United Kingdom). A subject was considered as having active syphilis when both the RPR and TPHA tests were positive. HSV-2 testing on serum samples was carried out with the ELISA test from Kalon Biological (Surrey, United Kingdom). The laboratory tests were conducted in the Institute of Population Health and Clinical Research (IPHCR) of St. John’s Medical College (SJMC), Bangalore and Rotary-TTK Blood Bank, Bangalore Medical Services Trust & Research Institute, Bangalore. Both the HIV and STI testing was anonymous. No names or other contact information were recorded on the biological samples collected. Instead, a bar code label was pasted on the biological sample for linking with the questionnaire survey data.
QUESTIONNAIRES
Three types of questionnaires were used for the household component of the GPS: a household census form, a female questionnaire and a male questionnaire. The household census form was used for households in the selected villages and urban blocks as a means of creating a sampling frame for selecting the respondents for the face-to-face interviews. In the census, we collected data on housing conditions, and on selected characteristics of all the usual residents, as well as on individuals who stayed in the household the previous night. Individual characteristics included name, relationship to the head of the household, residential status of the person, age, sex, marital status, education and occupation. The

5
census also collected information on religion and caste/tribe of the household head, access to basic amenities and ownership of certain household assets. Details (name, age, sex and cause of death) were recorded for all deaths occurring during the three years preceding the enumeration. The female questionnaire and male questionnaires were employed to interview all sampled females and males aged 15-49 who were usual residents as well as those who stayed in the household the night before the census. The questionnaires covered mainly the following topics: Background characteristics: age, marital status, number of times married, caste/tribe, religion, education, occupation, travel due to work, place of residence, sexual partner’s background, children ever born, and use of family planning. Sexual life: sexual intercourse (first and recent intercourse), high-risk sexual behaviour, number of sexual partners, relationship with partner, age of partners, duration of sexual relationships, and condom use. HIV/AIDS and other sexually transmitted infections: knowledge of AIDS and the sources of knowledge, knowledge of modes of HIV/AIDS transmission, knowledge of ways to prevent HIV/AIDS, prior HIV testing, and knowledge and prevalence of other sexually transmitted infections. Information on personal habits: smoking, alcohol use, injecting drug use, and medical injections. SURVEY MANUALS To maintain standardized survey procedures across districts and to minimize non-sampling errors, two different manuals were prepared: a manual for the household census and a manual for the main field survey. The manual for the household census described the various procedures to be followed for completing the household census form. The manual for the main field survey described the interview techniques and instructions on how to complete the individual male and female questionnaires and how to undertake the PBS sessions. The manual also described the roles and responsibilities of supervisors, interviewers and laboratory technicians in the field data collection.
FIELD WORK Field work in Mysore district was carried out by four teams of interviewers. Each team consisted of one supervisor, two male field interviewers, two female field interviewers and one laboratory technician. In general, male and female interviewers were assigned to respondents of the same sex to ensure that respondents felt comfortable talking about potentially sensitive topics. The same field teams carried out the household census, the PBS and the main individual face-to-face interviews. Before the data collection, all the field staff attended field training for five days and refresher trainings for 2 days in the

6
middle of the survey. The household census was carried out during October 2005-February 2006 and the main field survey was carried out during March-November 2006. Four supervisors were appointed to mobilize and sensitize the community and to oversee the field data collection. In addition, one person was hired specifically to transport in cold boxes the biological samples collected in the field to the central labs at TTK blood bank and to St John’s IPHCR, Bangalore. A project coordinator was also involved in organizing, supervising and leading the teams for the entire duration of fieldwork. DATA PROCESSING All completed questionnaires were sent to the office of IPHCR for data entry and processing. Household census data were entered using Microsoft Access software. The individual data for females and males were entered also using Microsoft Access software. The data were entered directly from the pre-coded questionnaires to the micro-computers. The responses on the individual questionnaires were entered twice by separate data entry operators, and verification of these two entries was carried out by CHARME staff. If any mismatch was identified in these two entries, the data set was corrected based on the information recorded in the questionnaire. This process was continued until no data entry error was found in these the two entries. Computer-based checks were used to clean the data, and inconsistencies were resolved on the basis of actual information recorded in the questionnaires. The results were generated using a standard statistical package, STATA version 9.2 (Stata Corp., Texas, 77845, USA). A BRIEF PROFILE OF THE DISTRICT Mysore district is situated in the Southern part of Karnataka and is one of the four Divisional Headquarters of Karnataka. Mysore city, pronounced as Mysuru in Kannada is the second largest city in the state of Karnataka and is the administrative headquarters The name Mysore is an anglicised version of Mahishūru, which means the abode of Mahisha. Mahisha stands for Mahishasura, a demon from the Hindu mythology. Administratively, Mysore District is divided into 7 Taluks. It is bounded by Mandya district to the northeast, Chamrajanagar district to the southeast, Kerala state to the south, Kodagu district to the west, and Hassan district to the north. According to the 2001 Census, the district had a population of 2,641,027, of which 37 percent were urban and 63 percent were rural residents. The overall sex ratio was 964 females per 1000 males. Literacy rate among population aged 7 and above was 63 percent: 71 percent and 56 percent among males and females, respectively. According to the Census 2001, around 18 percent of the total population in the district belonged to scheduled castes and 10 percent belonged to scheduled tribes. According to the 2001 Census, 29 percent of the population were children (0-14 years), 8 percent were age 60 and over, and the remaining 63 percent were in the working age group (15-59 years).

CHAPTER 2 HOUSEHOLD CENSUS: POPULATION AND HOUSING
CHARACTERISTICS This chapter describes key characteristics of the households surveyed in the census and provides a profile of the demographic and socio-economic characteristics of the population. HOUSEHOLD COVERAGE Details of the number of households enumerated in the census and coverage are provided in Table 2.1. In total, 10,308 households were enumerated in the selected villages and urban blocks in the district, and the household census was completed for 9,255 households (90%). Of the 6,448 households enumerated in rural areas, a household census was completed for 6,151 households (95%). In the urban areas, on the other hand, household census forms were completed for 3,104 of the 3,860 households enumerated (80%). In urban areas, interviews could not be conducted mostly due to the house being vacant or locked (12%), or because of refusal (7%). Refusal cases were lower in rural areas than in urban areas. POPULATION AND HOUSEHOLD CHARACTERISTICS Table 2.2 shows the distribution of the de facto and de jure populations by sex, age and place of residence. Overall, 94 percent of the usual residents were present at the time of the household census. In both rural and urban areas, the percentage of visitors was found to be higher than the proportion of absent usual residents, among infants irrespective of sex. The proportion of visitors and proportion of usual residents absent at the time of survey was slightly higher among infants and women in the age group 15-49. This pattern possibly reflects the common practice of married women going to their parents’ house to give birth, where they typically remain throughout the postpartum period with their newborns.
Age-sex distribution of the household population The population pyramids (Figures 2.1 & 2.2) provide a clear depiction of the age-sex distribution of the enumerated populations in urban and rural areas. The age structure of the rural population is typical of a developing country, which has experienced declining mortality and a recent rapid decline in fertility. In the rural areas, more than one-fourth of the population (28%) was found to be below 15 years of age and 9 percent was above age 59 years, with the remaining 63 percent in the 15-59 age group. The pattern was more or less the same in urban areas, where about 28 percent of the population was below the age of 15 years. About two-thirds of the population (64%) in the urban areas were in the 15-59 age group and the remaining 8 percent were above 59 years of age.

8
0-4
5-9
10-14
15-19
20-24
25-29
30-34
35-39
40-44
45-49
50-54
55-59
60-64
65-69
70-74
75-79
80+
0-4
5-9
10-14
15-19
20-24
25-29
30-34
35-39
40-44
45-49
50-54
55-59
60-64
65-69
70-74
75-79
80+
Overall, the sex ratio (number of females per 1,000 males) in the district was 1,021. The sex ratio in rural areas was 1,014 females per 1,000 males and that in urban areas was 1,035 females per 1,000 males.
Marital status The household census gathered information on the marital status of all household members aged 6 years and above. Table 2.3 shows the marital status distribution of the de jure household population by age and sex according to residence. Among rural females aged 6 years and over, 54 percent were currently married and 32 percent were never married. In urban areas, rates were similar: those females currently or never married were 51 percent and 36 percent, respectively. Among males, 44 percent and 46 percent in rural and urban areas, respectively, reported being never married: 54 percent of rural men reported being currently married, compared to 52 percent of urban men. In both the rural and urban areas, the proportion of widowed people was much higher among females than among males. For instance, 5 percent of rural females aged 15-49 were widowed compared with less than 1 percent of rural males. Similarly, 54 percent of rural females age 50 and above were widowed compared to only 8 percent of rural males in the same age group. The higher percentage of older widowed women than widowed men possibly reflects sex differentials in age at marriage, increased longevity of females and differential remarriage rates.
Figure 2.2. Population Pyramid Urban Figure 2.1. Population Pyramid Rural
MALE FEMALE MALE FEMALE
9
63
78
5649
67
40
56
73
48
0102030405060708090
Rural Urban Total
Male Female Total
Table 2.4 presents the marital distribution among respondents aged 15-49 according to sex and place of residence. In the 15-19 age group, in both urban and rural areas, being married was more common among females than males. Also, in this age group, there were more “never married” persons in urban areas than in rural areas (91% compared to 85%), reflecting a lower age at marriage in rural than in urban areas. In the age group 20-29 too, a much higher proportion of urban people were never married” compared to rural people (43% compared to 38%). Among rural females in this age group, 82 percent were currently married, compared to 77 percent of urban women. In contrast, among 20-29 year old males, 37 percent in the rural areas and 32 percent in the urban areas were currently married.
Household composition Table 2.5 shows the distribution of households by various characteristics of the household head (sex, age, marital status and religion), the number of usual household members, separately for urban and rural areas. The proportion of female-headed households was found to be almost equal in rural and urban areas (15%). In both rural and urban areas, the majority of household heads were currently married (82% and 83% respectively) and Hindus (98% and 82% respectively). The proportion of Muslim households was higher in urban than in rural areas (17% compared with 2%). The mean household size in Mysore district was found to be 4.4 persons, and this was the same in rural and urban areas. Overall, 40 percent of households in rural areas and 39 percent of households in urban areas comprised a family of 5 people or more.
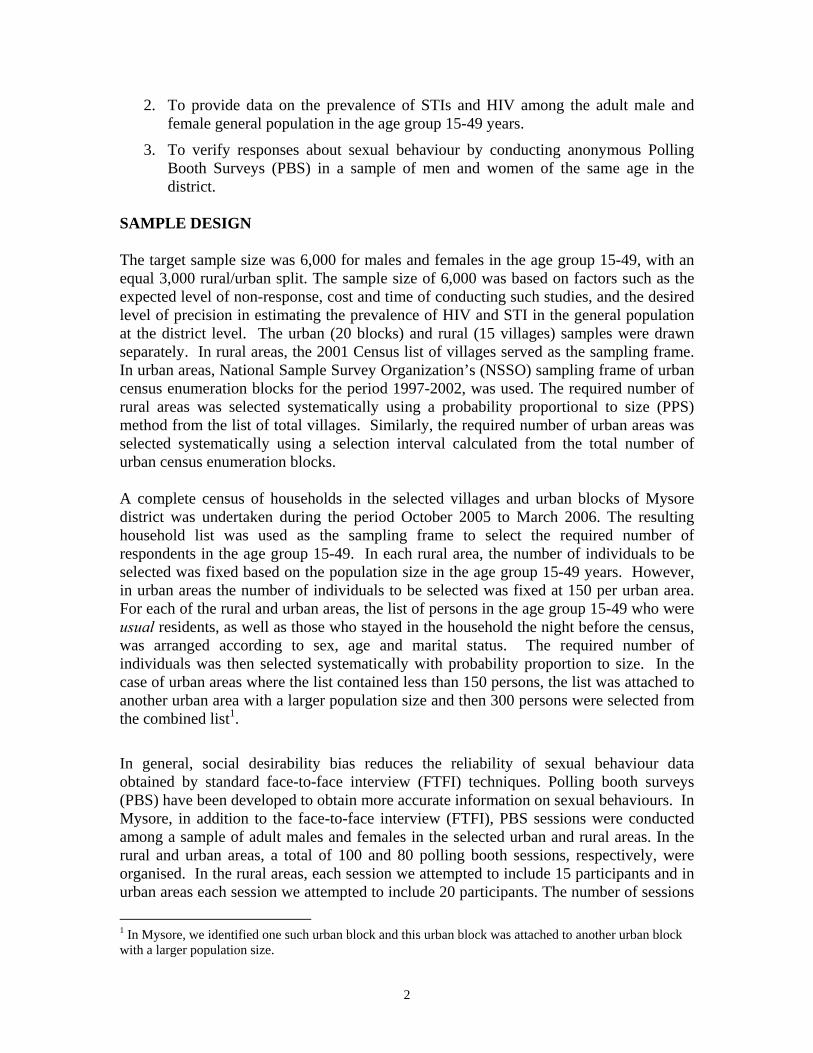
Literacy and educational attainment Table 2.6 shows details of the educational attainment among all usual residents aged 15 and over in the household according to sex and place of residence. The same is summarized in Figure 2.3 Overall, the literacy rate among persons aged 15 years and over was 56 percent, though the literacy rate was considerably higher in urban areas than in rural areas (73% compared with 48%). In both rural and urban, areas the literacy rate was higher among males than females. Furthermore, the sex differential in
Figure 2.3. Percentage literate by sex and place of residence

10
literacy was greater in rural areas than in urban areas. Table 2.6 also shows that almost one third (30%) of the population aged 15 and above had completed secondary level education, with a higher proportion of males than females (35% compared to 24%) reaching this level. Similarly, a higher percentage of urban than rural individuals had completed secondary school (45% compared to 22%), with again a greater sex differential observed in rural areas, where only 16 percent of females had managed to complete secondary school, compared to 27 percent of males. Almost half of males in urban areas had completed secondary school compared to 39 percent of females. One of the reasons for this sex differential has been early age at marriage for females and parental unwillingness to send girl children to school. This factor has an important bearing on the knowledge and awareness of females towards sexuality and sexually transmitted infections which will be discussed in later sections. Occupation Table 2.7 presents the occupational distribution of the de jure household population aged 15 years and above according to sex and residence. The majority of females were found to be engaged in housework irrespective of their place of residence. The table suggests that occupation varied greatly by urban and rural residence. In rural areas, most workers were in the agricultural sector, whereas in urban areas, business and other non-agricultural activities predominated. In rural areas, about 41 percent of the population reported being either agricultural workers or cultivators, with other occupations such as business, non-agricultural labourers and salaried employment accounting for 16 percent of the rural population economic activity. The remaining portion of the rural population constituted students (5%) and unemployed youth (7%). In urban areas, a few people (7%) were engaged in the agricultural sector, but around 47 percent of the population worked in non-agricultural activities such as salaried employment, non-agricultural labour and business. Another 6 percent of the urban populations were students. In the urban areas, the percent of population unemployed (7%) was almost same as in the rural area.
Mortality and crude death rates The rapporteur in each household was asked to specify whether any of its usual residents died during the three years preceding the survey. Details of sex, age at death, month and year of death as well as cause of death, were asked for every death in the household during the reference period. The crude death rate was calculated after adjusting the usual resident population based on the population growth rate reported in the 2001 Indian Census, separately for the urban and rural areas in the district. The death rate is expressed as the average number of deaths during the last three years per 1,000 usual residents during the middle of the three-year reference period. The crude death rates of rural and urban areas as well as the age-specific death rated for broader age groups are provided in Table 2.8. The estimated crude death rate for the entire study area was 6 deaths per 1,000 population, with the rural areas experiencing a slightly higher death rate than the urban areas (7 per 1,000 compared with 5 per 1,000). The age-specific death rates show that the

11
death rate was, as expected, higher in people over 50 years of age (25 per 1,000 population).
Deaths by cause of death For every death reported in the household, the cause of death was recorded verbatim as reported by the respondent, who was usually the head of the household. During the data analysis these responses were coded into certain meaningful categories. Table 2.9 displays the cause of death by age and place of residence. Overall, ageing was reported as the major cause of death, irrespective of place of residence. In total, the other major reported causes of death were cardio-vascular disease (13%), asthma (10%) and cancer (6%). Interestingly, AIDS was reported as a cause of death for less than 1% of rural deaths, while no deaths were reported due to AIDS in urban areas. Deaths due to AIDS in rural areas were as expected, reported mostly in the 15-49 years age group. In the urban areas, in addition to old age, the other major causes of death were cardio-vascular disease (15%) followed by asthma and respiratory illnesses (9%), cancer (5%) and suicides (4%). The age-specific distribution also shows that cardio-vascular disease (16%) and suicides (16%) were the major causes of deaths among young people aged 15-49 years. Cancer and tuberculosis were the next leading causes of deaths accounting for 8 percent and 7 percent of deaths in this age group. Only 2 percent of people in this age group had died as a result of AIDS, though it is possible that either the family did not know of, or did not want to reveal, such a diagnosis. Tuberculosis, which is the most common opportunistic infection in HIV, could be a proxy marker of prevalent HIV infection in this age group.

12

58
71 7180
6475
0
15
30
45
60
75
90
Rural Urban
Male Female Total
CHAPTER 3 CHARACTERISTICS OF SURVEY RESPONDENTS
This chapter presents a brief profile of the demographic and socio-economic characteristics of female and male respondents who were selected2 and completed an individual face-to-face interview in the General Population Survey (GPS) in Mysore district. SAMPLE COVERAGE Of the 5,996 respondents sampled from both rural and urban areas, 4,191 (70%) respondents gave an interview and also provided a biological sample, while 462 respondents (8%) gave only an interview (Table 3.1). Of the 3,000 rural respondents selected for inclusion, 82 percent of participants gave interviews, while 75 percent of respondents gave both interview and sample. The response rate in urban areas was slightly less than rural areas, with 73 percent of respondents giving interviews, and only 64 percent gave both interview and biological sample. The main reason for non-coverage was that the respondent was not available at home even after repeated visits by the field team (8% of cases overall) or that the participant refused to be interviewed (7% overall). Refusal to participate in the survey was higher in urban areas (10 %) than in rural areas (5%).
Sample coverage by selected background characteristics Characteristics of all those respondents interviewed and not interviewed are shown in Tables 3.2. The majority of the non- responses for interviews were among males who were not available at home, older respondents and unmarried females. In the rural areas, the timing of the survey coincided with the harvest season and many unmarried males could not be contacted. The participation rate was highest during holidays and festivals in the urban areas, while in rural areas, most respondents were available at home during market and fair days.
2 Only the usual residents, who slept in the house the night before, were selected.
Figure 3.1. Response rate (both interview & biological sample) by sex and place of residence

14
74
59
7
1
19
41
0
10
20
30
40
50
60
70
80
Male Female
Currently married Marriage dissolvedNever-married
SOCIO-ECONOMIC AND DEMOGRAPHIC CHARACTERISTICS The socio-economic and demographic characteristics of the 4,653 persons, who were interviewed3, are shown in Table 3.3.
Age In total 2,570 females and 2,083 males were interviewed. Of all respondents, 16 percent were below age 20, 35 percent were aged 20-29, 28 percent were aged 30-39 and the remaining 21 percent were aged 40-49. Sixteen percent of female respondents were below age 20; 33 percent were in the age group 20-29; 31 percent in the 30-39 years age group, and 20 percent of females were aged between 40-49 years. However, 17 percent of male respondents were below the age of 20, 37 percent were aged between 20-29 years, 25 percent were in the age group 30-39 years and the remaining 21 percent were aged 40-49 years.
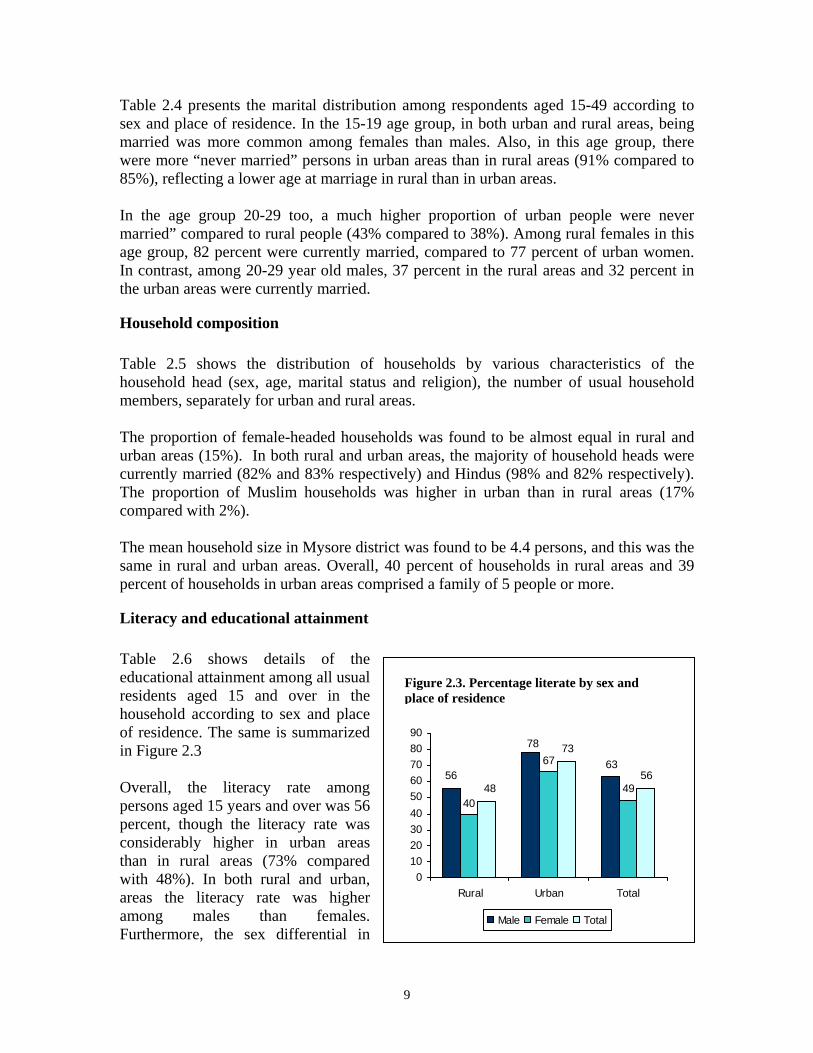
Marital status Since only women and men in the age group 15-49 were eligible for interview, it was expected that the majority of respondents would be married. In fact, nearly 74 percent of women and 59 percent of men were currently married (Table 3.3) and a further 7 percent of women and around 1 percent of men were widowed, divorced, separated or deserted. The greater share of never-married individuals was in the men’s sample (19% females, 40% males), a consequence of the relatively higher age at marriage among males. In all subsequent analyses, data for those respondents who were widowed, divorced, separated, or deserted, are grouped into one category and referred to as “marriage dissolved”. Among married respondents, the majority, irrespective of sex and place of residence, were living with their spouse at the time of the survey. The majority of married respondents also reported that they had only been married once. A slightly higher percentage of males than females were married more than once. The mean age at marriage among the currently married respondents was 19.6 years: 24.1 years for males and 16.7 years for females. The mean age at marriage for both sexes was lower in rural
3 Irrespective of whether they also gave a biological sample
Figure 3.2. Marital status by sex

15
than urban areas. For instance, the rural female respondents got married, on average, at the age of 15.9 years compared with their urban counterparts who got married, on average, at the age of 17.8 years. Children ever born All the ever married respondents were asked about their number of children ever born. Table 3.3 also provides the distribution of currently married respondents according to the children ever born. In total, 11 percent of currently married respondents said that they had no children, 17 percent reported one child, 39 percent reported having 2 children, 21 percent reported 3 children, while 12 percent had 4 or more children. The results also suggest that men tend to report fewer children than women (mean 2.0 compared to 2.3). As expected, women in urban areas reported less number of children ever born than those in rural areas. More than one fifth of urban currently married female respondents reported one child (22%) and less than one third reported 3 or more children (31%). This compares with 13 percent of rural currently married women having one child and 42% reporting 3 or more children.
Contraceptive use As shown in Table 3.3, 71 percent of the currently married respondents reported that they were using a contraceptive method at the time of the survey. Female sterilization seemed to be the preferred option for contraception in both urban and rural areas (59% and 71% respondents respectively). A few respondents, especially urban respondents, noted that they were currently using IUDs (2%). Similarly, overall, 2 percent of the respondents reported condom use and its use was much more likely to be mentioned by urban than rural respondents (5% compared to 1%) and more likely by men than women.
Literacy and education The distribution of the respondents by completed years of education reveals a low overall educational attainment among women and men in Mysore district, as well as clear gender inequality. Forty-five percent of the women and 36 percent of men age 15-49, reported having no education, and an additional 5 percent of women and men had been to school, but not completed primary school. However, one quarter of women reported 10 or more years of education, compared with 35 percent of men. As expected, a greater proportion of rural than urban respondents (50% versus 28%) were illiterate. Conversely the proportion of respondents who had 10 or more years of education was higher in urban than rural areas (43% and 20% respectively).
Occupation In total, 24 percent of the respondents were engaged in agriculture-based activities, such as cultivators or agricultural labourers and 8 percent of the respondents were students. The majority of both urban and rural female respondents reported being engaged in
16
housework (60% and 59% respectively). Among rural males, agriculture-related work was reported by a large proportion of men (56%), compared to 9 percent of urban males; in the urban areas, about 32 percent of males reported being engaged in business and another 22 percent in salaried employment.
Religion The respondents reported being mostly Hindu (91%), with the rest being Muslim (8%), or other religions (1%). There was major difference observed between urban and rural areas: in urban areas, nearly 79 percent of respondents were Hindu and almost 19 percent were Muslim, while in rural areas 99 percent were Hindu, and only 1 percent of respondents were reported as Muslim.
Caste Survey respondents were categorised into three groups: scheduled caste, scheduled tribe and other (not belonging to either scheduled caste or scheduled tribe). Overall, just under one fifth reported belonging to the scheduled castes (19%) and almost the same proportion (20%) reported being a member of a scheduled tribe, with the remaining 61 percent not belonging to either group. A significantly higher proportion of respondents in rural areas were reported to be belonging to either scheduled caste or scheduled tribe than in urban areas.
Travel due to work As it is thought that temporary absences from home might be a risk factor for acquisition of sexually transmitted infections, including HIV infection, respondents were asked about the frequency of their travels. Almost one fifth (20%) of the respondents reported that they were required to travel due to work: 8 percent reported daily travel, 4 percent had to travel weekly, 3 percent reported monthly travel, and the remaining 5% reported occasional travel. Travel for work reasons was more common among rural respondents than urban respondents (23% and 15% respectively). Also, a larger proportion of male respondents than female respondents reported travel due to work, irrespective of place of residence. Travel away from home for any reason during the last year was reported by 55% of respondents. Mostly this was reported as travel within the district (35%), although 17 percent reported travel outside the district and another 3% reported travel outside the state. There was little difference in the overall number of respondents who reported travel in the previous year between rural and urban areas. However, rural respondents were more likely to report travel within the district, whereas urban respondents were more likely to report travel outside the district or state. Women were slightly more likely to report travel for any reason during the previous year than men: rural women were more likely to have travelled within the district, compared to urban women who travelled more often outside the district. Urban men were more likely to have travelled than rural men:

17
rural men however, travelled mostly in the district, whereas urban men were more likely to have travelled outside the district or state.
Habits Information was collected from both females and males on certain habits such consumption of alcohol and smoking of cigarette or beedis. Table 3.4 shows the overall pattern of consumption. With similar rates in urban and rural areas, 19 percent of the respondents reported occasional or regular alcohol consumption. However, as expected, alcohol consumption was more commonly reported among males than females (41% males compared to 1% females). Twenty percent of respondents reported smoking cigarette or beedis, and as with alcohol consumption, males (44%) reported this more often than females (less than 1%). Also, rural males (47%) reported smoking slightly more than their urban counterparts (38%). Socio-economic and demographic characteristics of respondent spouses Certain socio-economic and demographic characteristics of the respondent’s spouse were also collected from currently married persons and the information is provided in Table 3.5. A comparison of the age distribution of the respondent and spouse indicates that men have spouses who are younger, while female respondents have older spouses. For male respondents, the mean age of spouses was 28, while for female respondents, the mean age of spouses was 40. Almost the same pattern was observed in rural and urban areas. Similarly, the study found that literacy and education levels of male respondents was higher than their spouses, while the literacy levels of female respondents was lower than their spouses. The majority of male respondents (87%) reported that their wife was solely engaged in housework, whereas the majority of the female respondents reported that their husband was a cultivator (35%). Other common spousal occupations reported by female respondents were non-agricultural labour (25%), business (21%) and salaried employment (13%). In the urban areas, the majority of female respondents reported that their husband was engaged in business or salaried employment. Overall, 15 percent of respondents mentioned that their spouses travelled because of work, and this was more often reported in urban than rural areas. As expected, overall, more female respondents than male respondents reported that their spouse travels due to work (24% and 2% respectively).

18
CHAPTER 4 HIV/AIDS AND STI - RELATED KNOWLEDGE,
ATTITUDES AND BEHAVIOUR This chapter provides findings on HIV/AIDS and STI knowledge, attitudes, and behaviour among males and females age 15-49.
KNOWLEDGE ABOUT HIV/AIDS All respondents were asked if they had ever heard of an illness called HIV/AIDS, and of those who answered in the affirmative, several more questions were posed to gauge the extent of their knowledge. Table 4.1 shows the percentage distribution of respondents’ knowledge on HIV/AIDS. As can be seen, the level of awareness about HIV/AIDS varied with respect to age, place of residence, marital status and literacy levels. Those respondents in the younger age group of 15-24 years were much more likely to have heard of HIV/AIDS than those in the oldest (45-49 years) age group (93% compared with 78%). Urban respondents (93%) were also more likely to be aware of HIV/AIDS than rural respondents (85%), as were men (91%) who were also more familiar with the disease than women (85%). Knowledge of the disease was higher among unmarried people and among those whose marriage was dissolved (combined 89%) compared to married people (87%); higher among educated people (92%) than illiterates (79%); and higher among salaried workers (97%) than either cultivators (81%) or non-agricultural labourers (80%).
Source of Knowledge The Government of India has been using mass media extensively, especially electronic media, to increase awareness of HIV/AIDS in the general population. Respondents who had heard of HIV/AIDS were asked to report the sources of their information, and results are presented in Table 4.2. Friends/ neighbours/ colleagues were the most common source of knowledge, reported by 78 percent of respondents (86% women and 68% men) Television was the second most common source of information on HIV/AIDS, reported by 65 percent of the respondents who had heard of HIV/AIDS (61% of women compared with 70% of men; and 82% of urban respondents compared with 53% of rural respondents). The other reported sources of information were newspapers/magazines (32%), radio (30%), followed by posters and hoardings (25%). Only 11 percent of respondents said they had heard about HIV/AIDS from a health worker.
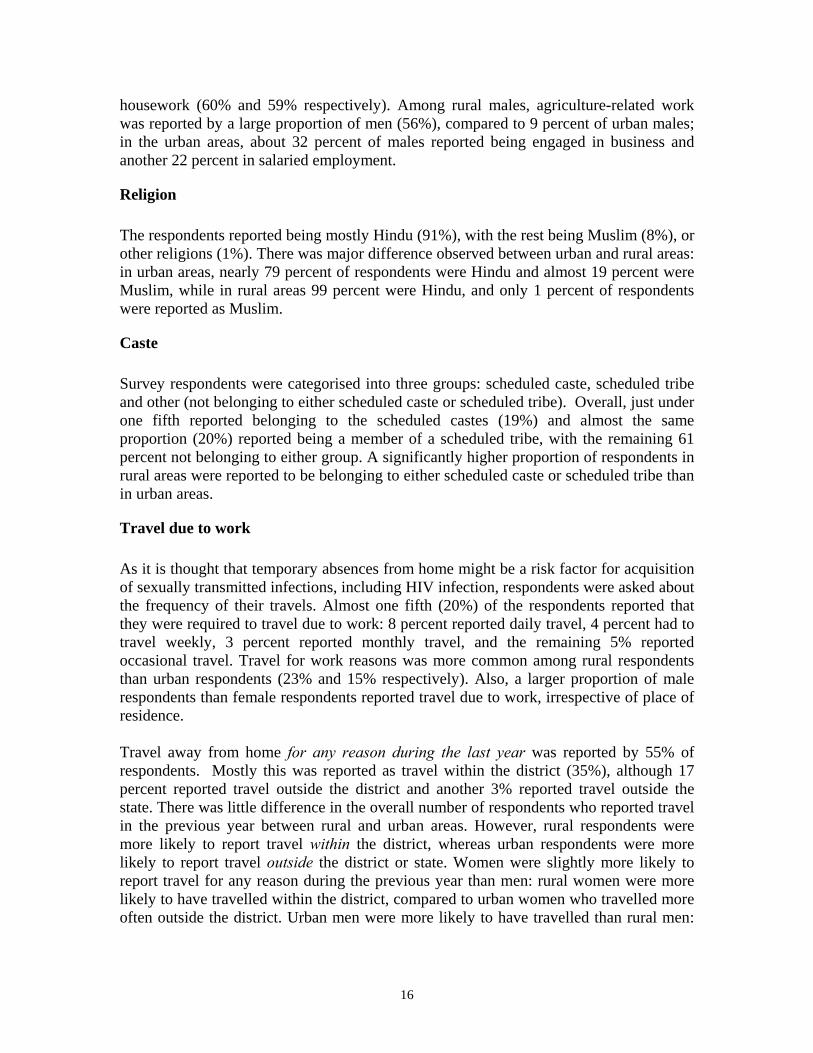
Knowledge about modes of transmission The survey included questions to assess knowledge about modes of HIV/AIDS transmission, knowledge noted spontaneously and after probing. The results are presented separately for males and females according to place of residence, shown in Table 4.3. Many respondents reported unprotected sexual contact, blood transfusion and mother to child as modes of transmission. Over 91 percent of men who had heard of HIV/AIDS

20
Figure 4.1. Knowledge of modes of HIV/AIDS transmission after probing
91
52
8088
71
88
0
20
40
60
80
100
Female Male
Unprotected sexual contact Blood transfusionMother to child
reported unprotected sexual contact as a mode of transmission, compared with 52 percent of females (Figure 4.1). Mother to child transmission was reported more by female respondents than male respondent (88% compared with 71%). Significantly higher percentage of respondents in urban areas than rural areas reported unprotected sexual contact as a mode of HIV/AIDS transmission (76% compared with 64%). Similarly, more urban respondents reported blood transfusion than rural respondents. However, knowledge of mother to child transmission was equal among rural and urban respondents.
Misconceptions around HIV transmission Respondents were asked specifically whether HIV/AIDS could be contracted through mosquito bites, shaking hands, swimming or bathing, sharing meals, saliva, tears, touching or hugging, and kissing. The results in Table 4.4 show the number of “yes” answers given either spontaneously or after probing. Surprisingly, 57 percent of the respondents who had heard of HIV/AIDS reported at least one of these misconceptions about the mode of HIV/AIDS transmission, and 38 percent reported at least two of the above misconceptions. Rural respondents reported them more than their urban counterparts. However, misconceptions about modes of transmission did not differ very much by sex of the respondent. Misconceptions regarding modes of transmission were high among older persons (45-49 age group), literate persons who were educated below middle school, agricultural labourers, Hindus and those belonging to scheduled castes.
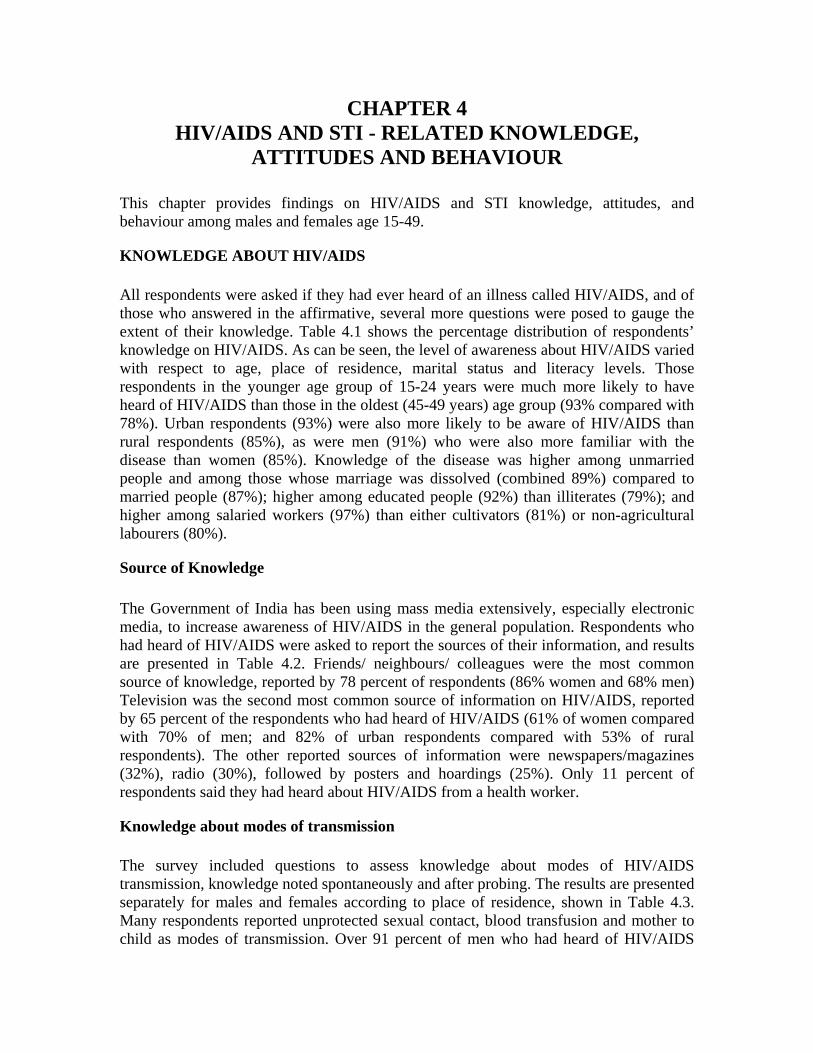
Knowledge about prevention of HIV/AIDS All respondents who reported having heard of HIV/AIDS were asked what ways they knew to prevent infection. The responses were recorded either spontaneously or after probing and are shown in Table 4.5. Of the 4,178 respondents who had heard of HIV/AIDS, only 41 percent reported prevention by using condoms (Figure 4.2). Always using condoms during sex was reported more by urban respondents than rural respondents and more by women than men. Overall, 53 percent of respondents knew that having sex with only one faithful partner could prevent HIV/AIDS transmission. Data on knowledge of two specific prevention methods (being faithful to one partner and using condoms) were analyzed and the results are presented in Table 4.6. Overall, 49 percent of the respondents knew at least one of these two preventive measures. Females (66%) seemed to have better knowledge about prevention than males (27%), and urban

21
4135
495351 56
0
10
20
30
40
50
60
Rural Urban Total
Always use condom Sex with one faithful partner
respondents (55%) had better knowledge than rural respondents (44%). Knowledge of at least one of these two preventive measures was lowest among older persons (45-49 age group), respondents who were never married, illiterate persons, non-agricultural labourers Muslims and those belonging to scheduled castes. Thirty five percent of respondents could name both the key ways of preventing HIV infection, and this proportion too was higher among females than males (44% compared with 24%). The proportion of respondents who knew both these preventive measures was slightly higher in urban than in rural areas (44% versus 29%). Knowledge of both the key preventive measures was again lowest among older persons (45-49 age group), illiterates, respondents whose marriage had dissolved, Muslims and people either belonging to scheduled castes or scheduled tribes.
Perceptions regarding chances of contracting HIV/AIDS All those respondents who had heard of HIV/AIDS, were asked their perception of their own risk of contracting HIV/AIDS (Table 4.7). The majority of respondents (96%) perceived themselves to be not at risk. Those who reported feeling at risk of contracting HIV/AIDS were asked to mention the reasons, although since the number of respondents is very small (26), the responses have to be interpreted with caution. Overall, about 18 percent of these 26 respondents reported they did not use condoms and so felt at risk of contacting HIV/AIDS.
Testing for HIV To obtain information on the prevalence of HIV testing, all respondents who had heard of HIV/AIDS were asked whether they had ever been tested for HIV and if so, whether they had been counseled during the last test, and if they had received the results (Table 4.8). Overall, 4 percent of respondents reported having had an HIV test, and this number was little higher in urban areas than in rural areas. Also more females in the urban areas than males had undergone HIV testing. However, in the rural areas a slightly higher percentage of males than females had undergone HIV testing. It is important to note that among females, HIV testing was most common in the 20-34 year age group and may be associated with testing as part of antenatal care. Overall, testing for HIV was comparatively higher among married people, those who were engaged in housework and those who travel regularly due to work.
Figure 4.2. Knowledge of prevention of HIV/AIDS after probing by place of residence

22
16.4
22.8
19.3
18.0
18.5
0 5 10 15 20 25
Female
Male
Urban
Rural
Total
Data on knowledge about the last HIV test result is presented in Table 4.9. Overall, 80 percent of those who had undergone HIV testing knew their test result, with those in urban areas more likely to know their test result than their rural counterparts (87% and 73% respectively). Similarly, more females than males reported receiving their test results. The number of respondents who received counseling during the last HIV test is given in Table 4.10. Only 40 percent of respondents who had an HIV test reported receiving counseling. Furthermore, 38 percent of rural respondents reported that they had received counseling during their last HIV test, compared with 43 percent of urban respondents. More females (49%) seem to have received counseling after an HIV test than males (29%).
SEXUAL BEHAVIOUR AND CONDOM USE Comprehensive knowledge about risky sexual behaviours and HIV transmission are basic pre-requisites for prevention. However, translation of knowledge into safe sex practices is influenced by a number of individual, social and contextual factors. A set of questions about sexual behaviour and condom use was collected. This section provides some of the information collected on sexual behaviour and attitudes towards safe sex. Pre-marital sex All respondents, irrespective of marital status were asked details about their sexual practices. First, details of pre-marital sex were asked of never-married people (Table 4.11). Overall, 5 percent of the never-married respondents reported that they had had sexual intercourse, with males more likely to report this than females (8% and 1% respectively). Rates of sex among never-married respondents varied little according to place of residence (5% in urban areas compared to 6% in rural areas). Rates of sex among never-married were highest in the 30-49 year age group, among illiterates, agricultural labourers, Hindus, people belonging to scheduled tribes and those who travel due to work.
Median age at first sexual intercourse Respondents who reported that they had ever had sexual intercourse were asked to specify their age at first sexual intercourse. The median age at first sexual intercourse is given in Table 4.12. Overall, the median age at first sexual intercourse was 18.5 years: 22.8 years for males and 16.4 years for females (Figure 4.3). Rural respondents were likely to have had their first sexual intercourse about a year earlier than their urban
Figure 4.3. Median age at first sexual intercourse by sex and place of residence

23
1
23
7
12
10
0 5 10 15 20 25
Female
Male
Urban
Rural
Total
counterparts (18 years and 19.3 years, respectively). The median age at first sexual intercourse was somewhat lower among people whose marriages were dissolved, illiterates, people engaged in housework, people belonging to scheduled castes and among those who do not travel due to work. Partners at first and last sex All sexually experienced respondents were asked about their first and last sexual partners. Data on first partners are shown in Table 4.13. Almost every female respondent reported her husband as the first sexual partner. However, among males only 76 percent reported their wife/cohabiting partner as the first sexual partner. Another 15 percent of males reported that a known woman was their first sexual partner. Few male respondents reported girl friend/fiancé (6 percent) or female sex worker (1 percent) as their first sexual partner. The identity of the last sexual partner is given in Table 4.14. Almost all the females reported that their husband was their last sexual partner. Similarly, 94 percent of males also reported that their wife/cohabiting partner was their last sexual partner and about 4 percent of men reported to have had sex last with a female friend or a known woman. Other relationship either before or after marriage All currently married respondents were asked to divulge whether their partner had any sexual relationship with others either before or after marriage (Table 4.15). About 3 percent of married respondents reported that, to their knowledge, their partner had sex with others either before or after marriage. However, this was negligible among male respondents, while about 5 percent of female respondents divulged that they knew their husband had other sexual partners either before or after marriage. Women in the age group 45-49, women working as non-agricultural labourers, women belonging to scheduled tribes and women who travelled due to work, were the most likely to report their husband had had other sexual partners at some time. Number of sexual partners The number of lifetime sexual partners of sexually experienced people is shown in Table 4.16. In total, 90 percent of respondents reported only ever having one partner. Reporting of lifetime multiple sexual partners (Figure 4.4) was rare among females (1%) but much higher in males (23%). Rural males (28%) were more likely to report more than one sexual partner than urban males (15%), though among women, this did not differ much. In rural areas, more
Figure 4.4. Percent of respondents who had more than one sexual partner

24
people said they had had multiple sexual partners (12%) than the urban areas (7%). In total, having had more than one sexual partner was highest in respondents in the 20-24 year age group, those never married, people who completed secondary education, those engaged in business, Hindus, people belonging to scheduled castes and among those who travel due to work. Table 4.17 shows the distribution of sexually experienced respondents according to the number of partners during the last year. Overall, about 91 percent of respondents reported having only one sexual partner during the last year, about 2 percent reported more than one sexual partner and the remaining 7 percent did not have sex with anyone: 92 percent of men and 90 percent of women had only had one sexual partner during the last year. About 10 percent of female respondents reported not having any sexual partner during the previous year, compared with only 4 percent of the male respondents. Frequency of sex with the last partner Respondents were also asked to divulge how often they have sex with their last partner (Table 4.18). In total, more than 78 percent of males reported that they had sex with their last partner more than once in a week, and another 12 percent reported sex once in a week. In contrast, 64 percent of females reported that they had sex with the last partner more than once per week and another 21 percent reported weekly sex. Among males, the most frequent sex (more than once a week) was in the 30-34 year age group, whereas in women this was more common in the 15-19 year age group, likely reflecting the habits of newly married couples, where males are a few years older than females. Anal sex The experience of anal sex with partners of the opposite sex is presented in Table 4.19 and with partners of the same sex (MSM) in Table 4.20. In total 3 per 1,000 females reported having had anal sex with their male partner; 26 per 1,000 men reported anal sex with a woman, and 6 per 1,000 men reported anal sex with another man at some time in their lives.
Multiple sexual partners and risky sex In the analysis, five important indicators are used to illustrate different types of risky sexual behaviour, and these are shown in Table 4.21. The data indicate that overall, 12 per 1,000 population reported having had sex with a non-regular partner during the past year and 9 per 1,000 population reported paying for or being paid for sex. Furthermore, 6 per 1,000 population had sex with more than one partner during the previous 3 months. About 72 per 1,000 population reported that they had at some time had more than 1 partner. Overall, 72 per 1,000 population reported ever having at least one of the risky behaviours.
25
0%
20%
40%
60%
80%
100%
RuralMale
RuralFemale
UrbanMale
UrbanFemale
Total
Seen Heard but not seen Neither heard nor seen
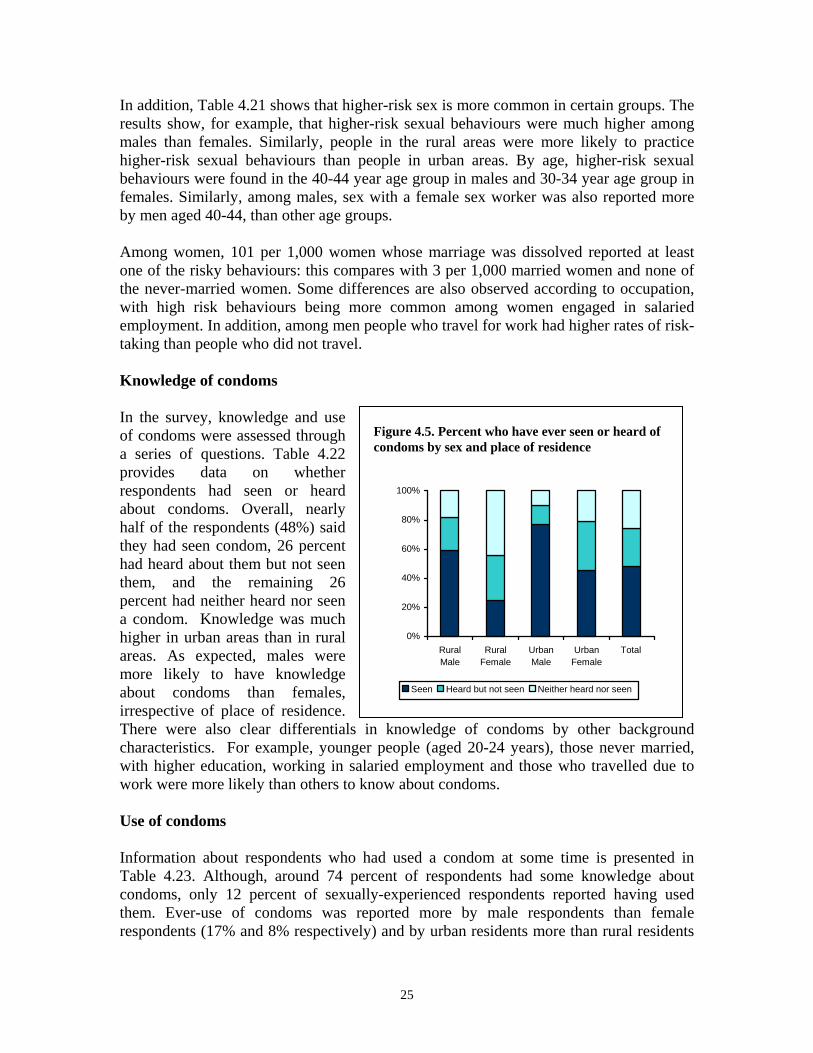
In addition, Table 4.21 shows that higher-risk sex is more common in certain groups. The results show, for example, that higher-risk sexual behaviours were much higher among males than females. Similarly, people in the rural areas were more likely to practice higher-risk sexual behaviours than people in urban areas. By age, higher-risk sexual behaviours were found in the 40-44 year age group in males and 30-34 year age group in females. Similarly, among males, sex with a female sex worker was also reported more by men aged 40-44, than other age groups. Among women, 101 per 1,000 women whose marriage was dissolved reported at least one of the risky behaviours: this compares with 3 per 1,000 married women and none of the never-married women. Some differences are also observed according to occupation, with high risk behaviours being more common among women engaged in salaried employment. In addition, among men people who travel for work had higher rates of risk-taking than people who did not travel. Knowledge of condoms In the survey, knowledge and use of condoms were assessed through a series of questions. Table 4.22 provides data on whether respondents had seen or heard about condoms. Overall, nearly half of the respondents (48%) said they had seen condom, 26 percent had heard about them but not seen them, and the remaining 26 percent had neither heard nor seen a condom. Knowledge was much higher in urban areas than in rural areas. As expected, males were more likely to have knowledge about condoms than females, irrespective of place of residence. There were also clear differentials in knowledge of condoms by other background characteristics. For example, younger people (aged 20-24 years), those never married, with higher education, working in salaried employment and those who travelled due to work were more likely than others to know about condoms. Use of condoms Information about respondents who had used a condom at some time is presented in Table 4.23. Although, around 74 percent of respondents had some knowledge about condoms, only 12 percent of sexually-experienced respondents reported having used them. Ever-use of condoms was reported more by male respondents than female respondents (17% and 8% respectively) and by urban residents more than rural residents
Figure 4.5. Percent who have ever seen or heard of condoms by sex and place of residence

26
(20% and 6% respectively). Nearly half of the never-married respondents had used a condom at some time. Similarly, ever-use of condoms was also high among those who completed secondary education and respondents who travel due to work. Condom use was found to be highest among students (42%).
Condom use during the first sexual intercourse All respondents who had ever had sex were asked whether they used condom during their first sexual intercourse (Table 4.24), and only 4 percent responded in the affirmative. Condom use during first intercourse was slightly higher among males (7%) than females (2%) and also among urban (6%) than rural (3%) residents. Condom use during first sexual intercourse was much more common among never married respondents (32%) than married respondents (3%). Similarly, more educated people, respondents engaged in salaried employment, respondents who travel due to work and respondents below age 25 reported having used a condom at the time of first sex. Condom use during the last sexual intercourse The proportion of respondents who reported using a condom during their last sexual act was almost the same as condom use during first intercourse (Table 4.25). In total, only about 3 percent of respondents reported having used a condom during their last sexual intercourse: more urban respondents reported this than rural respondents. Also, as expected, the reporting of condom use during the last sexual act was higher among males than females. More than one third of never-married (36%) respondents reported condom use during their last intercourse. Higher condom use during last sexual intercourse was reported among younger age groups (below age 25), respondents who completed secondary level schooling, respondents engaged in salaried employment, and respondents who travel for work. Source of condom at last use All respondents who had ever used a condom were asked the source of the condoms when they last had sex with a condom (Table 4.26). More than half of respondents (52%) reported a medical shop (pharmacy) as the source. Twenty percent of respondents reported that they obtained condoms from a public hospital. About 9 percent reported that their sexual partner was the condom source, and this was much higher among females than males. Similarly, about 10 percent of respondents reported to have obtained condoms from small shops such as paan shops. Reporting of a public hospital as the source of condom was more common among rural respondents (29%) than urban respondents (15%). Males more frequently than females, reported pharmacies as a key condom source.
KNOWLEDGE OF STI SYMPTOMS AND REPORTED STI The survey included questions on STI knowledge and personal experience of STI symptoms. Women were asked to report their experience of vaginal discharge, lower

27
abdominal pain (excluding diarrhoea and menses), and genital ulcers/sores. Males were asked about experience with urethral discharge and genital ulcers/sores. Similarly, to assess knowledge, females were asked about specific female STI symptoms and males were asked about specific male STI symptoms. Knowledge of STI symptoms The proportion of respondents who reported knowing symptoms of STIs is given in Table 4.27. Overall, 7 percent of female respondents and 62 percent of male respondents could not spontaneously name any signs or symptoms of an STI. Spontaneously or after prompting, approximately 34 percent of males mentioned discharge from the penis, and about 42 percent males reported sores, ulcers or blisters on or around the sex organ, as symptoms of STIs. Among females, 86 percent of the respondents mentioned vaginal discharge and another 65 percent reported sores, ulcers or blisters on or around the sex organ as symptoms of STIs. Burning pain during urination was more often mentioned as an STI symptom by women than men (70% and 33% respectively). Furthermore, about seventy percent of the females reported coital pain and lower abdominal pain as symptoms of STIs. Reported STI symptoms Respondents were asked to report whether, and when, they had experienced specific STI symptoms4 (Table 4.28). Since these results are based on self-reports and not on clinical tests or examinations, the results should be interpreted with caution. In total, 8 percent of respondents reported that they had at some time experienced one of these STI symptoms (3% in last year). Significantly more females had ever experienced these than men (13% and 1% respectively). There was no big difference between the urban and rural residents (8% and 7% respectively). Among women in particular, those aged 30-34 years, those currently married, those who had schooling up to primary grade or less, agricultural labourers, Muslim women, and women who travel due to work, tended to report a higher prevalence of STIs/STI symptoms during the last one year than women from other sub-groups. Source of treatment for STIs/STI symptoms Table 4.29 shows the source of treatment for STI symptoms experienced in the previous year. Overall, 41 percent did not seek any treatment, with males less likely to seek treatment than females and urban people, less likely to seek treatment (47%) than rural respondents (35%). For those who did seek medical attention, government clinics and hospitals were the most commonly visited, followed by private clinics or hospitals. Males were more likely to visit private clinics than women.
4 Women were asked about genital ulcers, vaginal discharge and lower abdominal pain unrelated to diarrhea or menstruation. Men were asked about genital ulcers and urethral discharge.

28
2.6 2.7 2.9
2.22.7
00.5
11.5
22.5
33.5
Male Female Rural Urbam Total
INJECTIONS & OTHER POTENTIAL RISK FACTORS FOR AQUIRING HIV Over-use of injections in health care settings can contribute to the transmission of blood-borne pathogens, because it can amplify the effect of any unsafe practices, such as the re-use of injection equipment without proper sterilization. The Government of India is committed to the policy of use of safe and disposal syringes in all its national health programmes. In this survey, all respondents were asked if they had ever received any injections after the age of 15. Respondents, who reported receiving injections, were asked about who had given the injections. In addition, information on the number of injections received during the last one year was also collected. Prevalence of injections The percentage distribution of respondents who had ever received injections and who had received an injection in the previous year (and mean number of injections) are shown in Table 4.30. Almost every person had received an injection at some time in their lives, and nearly 56 percent had received injections in the last year: there was little difference between rural and urban areas. The proportion of respondents who had received injections during the previous year was relatively higher among the following sub-groups of the population: females, respondents in the age group 20-24, currently married respondents, respondents who are literate but not completed primary, respondents who are engaged only in housework, Muslims and respondents who do not belong to either scheduled castes or scheduled tribes. Respondents received an average of 2.7 injections during the year preceding the survey (Figure 4.6): this number was highest among rural and female respondents, as well as among people in the 40-44 year age group, in people currently married, illiterates, cultivators and among scheduled tribes. In addition, the respondents who had ever received injections were asked about the practitioners who provided them (Table 4.31). The vast majority of respondents reported that they had at some time received injections from a qualified medical doctor. However, forty two percent of the respondents reported that a nurse had given them injections. About 1 percent of respondents reported to have received injections from a rural medical practitioner5.
5 Qualified Medical Practitioner-a person fully qualified and trained in the modern practice of medicine. Rural medical practitioners are usually trained in traditional and herbal medicines but also practice the modern system of medicine and have gained acceptance in rural areas, but often are not qualified.
Figure 4.6. Mean number of injections received in previous year
29
Male circumcision All the male respondents were asked if they were circumcised and the results are presented in Table 4.32. Overall, 8 percent of the males reported that they were circumcised, and this was higher in urban areas (18%) than rural areas (2%). Expectedly, circumcision was nearly universal among the Muslims, who represented 7 percent of the male respondents surveyed. Among the non-Muslims the circumcision rate was only 1 percent. The circumcision rate among males was relatively high in the age group 40-44, currently married persons, those who have completed primary school but not completed middle school and those engaged in business.
KNOWLEDGE OF HIV/AIDS AND STI PROGRAMMES All the interviewed respondents were asked questions related to specific HIV/AIDS and STI programmes in the district. One important question was whether the respondent was aware of “KEY” clinics, clinics run by private practitioners who have been trained to provide STI care, an Avahan funded-initiative in the district. Those who had heard of the clinics were asked whether they had ever visited one. Similarly, a question about awareness of any HIV/AIDS programmes in the area was asked to all the respondents. In addition, the female respondents were asked whether they knew about the “Namma” clinics run for female sex workers by Myrada, a partner NGO of KHPT in Mysore District. The words “Namma clinics” translate from Kannada into ‘our clinics’. The percentage of respondents who had ever heard of “KEY” clinics is presented in Table 4.33. In total, 23 percent of respondents had ever heard of “KEY” clinics; knowledge about the clinic was found to be much higher among respondents in urban areas than rural areas (37% compared to 14%). Knowledge about “KEY” clinics was more among males (26%) than females (20%) and decreased with age. Knowledge of “KEY” clinics was higher among unmarried persons; higher among educated than illiterate people; higher among students than other occupational groups and higher among those who travel due to work than those who do not travel. Among the respondents who had ever heard of “KEY” clinics, the distribution of those who had ever visited the clinics is provided in Table 4.34. Overall, less than one percent of those who had ever heard of “KEY” clinics reported to have ever visited one. Surprisingly, none of the respondents in rural areas visited “KEY” clinics. Similarly, none of the females visited the “KEY” clinics. The proportion of female respondents who had ever heard of the “Namma clinics”, clinics, is shown in Table 4.35. In total, about one percent of female respondents reported that they had ever heard of the “Namma clinics”. Awareness about the “Namma clinics” was slightly higher in urban areas than rural areas. It was also highest in the age group 25-29 years, in unmarried respondents, in those who have completed middle school but not secondary school, those who are in salaried employment and those who travel due to work.

30
The percentage of respondents who were aware of any HIV/AIDS programme in the district is given in Table 4.36. About 8 percent of the respondents reported knowing about HIV/AIDS programmes in the area. Surprisingly, knowledge of any HIV/AIDS programmes was slightly higher in rural areas than urban areas (9% compared to 7%). The number of males who reported being aware of HIV/AIDS programmes in the area was slightly more than the number of females (9% and 7% respectively). However, knowledge of any HIV/AIDS programme in the area was highest in the age group 15-19, among unmarried respondents, those who have completed secondary school, among students, scheduled tribes and those who travel due to work.

0.981.06
0.930.84
0.65
0.51
0.80
0.94
0.71
0
0.2
0.4
0.6
0.8
1
1.2
Rural Urban Total
Male Female Total
CHAPTER 5 HIV AND STI PREVALENCE
This chapter provides data on the prevalence of HIV and STIs and variations in HIV and STIs in key subgroups of the population. Caution is suggested in interpreting the differentials in HIV prevalence for categories with small sample sizes.
HIV prevalence by background characteristics Table 5.1 shows that in 2006, 0.80 percent of the adult population (aged 15-49) surveyed in Mysore was infected with HIV. As can be seen from Figure 5.1, HIV prevalence in urban areas was higher than that in the rural areas (0.94 compared with 0.71%). Similarly, the HIV prevalence was slightly higher among males (0.98%) than females (0.65%). In both urban and rural areas, males had a slightly higher HIV prevalence than females (1.06% compared with 0.84% in urban areas, and 0.93% compared with 0.51% in rural areas), Differences in HIV prevalence by age group were observed, with rates peaking at 1.45 percent in the 25-29 year old age group. Among men, HIV prevalence was highest in those aged 40-44 years (2.44%) and those aged 25-29 (2.08%). Among women, HIV prevalence was seen to peak at 1.39 percent in the 35-39 year age group. Marital status of the female respondents was significantly associated with HIV prevalence with the highest rate of 1.96 percent seen in those women whose marriage was dissolved (i.e. divorced, separated, deserted or widowed). Although HIV prevalence differed by education of the respondent, no consistent pattern was observed. For example, overall, prevalence was highest among the respondents who were illiterate and among those who had secondary or post-secondary education; and lowest among people with primary or middle school education. For females, the highest HIV prevalence rates were observed among illiterates and those with more than secondary education. A similar pattern was seen among men too, where the prevalence was high both among illiterates and among those with secondary school or above level of education.
Figure 5.1. HIV prevalence by sex and place of residence

32
All the people who tested positive for HIV were Hindus. Being a member of a particular caste was not found to be statistically associated with HIV prevalence, although those belonging to a scheduled tribe had a higher HIV prevalence (1.68%) than those belonging to a scheduled caste (0.50%). The results also show that HIV prevalence varied substantially by occupation of the respondent. The highest HIV prevalence was found among the salaried class (1.71%) and cultivators (1.60%) and the lowest rates were seen among students (0.4%) and non-agricultural labourers (0.40%). The number of lifetime sexual partners was an important indicator of the risk of HIV infection. In total, HIV prevalence increased from 0.63 percent for those who have had one or no lifetime sexual partners to 3.01 percent for those with two or more lifetime partners. Among females, HIV prevalence was 0.55 percent among those who reported one or no lifetime sexual partner, and 10.09 percent among those very few women with more than one sexual partner. Among men, HIV prevalence was 0.72 percent in those who reported one or no lifetime sexual partner, increasing to 2.46 percent among men reporting sex with two or more partners. Similarly, men who reported that they had ever paid for sex were much more likely to be HIV positive (5.41%) than those who said they had never paid for sex (0.90%). Those respondents who reported any of the risky sexual behaviours, such as sex with a non-regular partner during the previous year, or ever having sex with more than one partner or ever having paid/received payment for sex, were about more likely to be infected with HIV than respondents who reported no risky sexual behaviour(3.00% compared to 0.63%).
Prevalence of active syphilis by background characteristics Data on the prevalence of active syphilis by background characteristics are presented in Table 5.2. Overall, the prevalence of active syphilis for the entire sample was 1.36 percent: the prevalence among males was double than that of females (1.80% compared with 0.94%). Rates of active syphilis were found to be slightly higher in rural areas than urban areas. In rural areas, the rates for active syphilis among males was almost double than that of females. Overall, the age-specific prevalence rates indicate that active syphilis rates were highest among older persons (age group 45-49:3.), where 1.77 percent of females and 4.63 percent of males tested positive. For the majority of the other subgroups of the population, no significant differentials in the prevalence of active syphilis were observed with the exception of marital status, where overall it was found that those with a marriage dissolved had an active syphilis rate of 3.03 percent compared with 1.51 percent in the currently married group. The prevalence of active syphilis was found to be slightly higher among illiterates, businessmen, Hindus and among scheduled castes. The prevalence of active syphilis was also more common among respondents who travelled due to work,
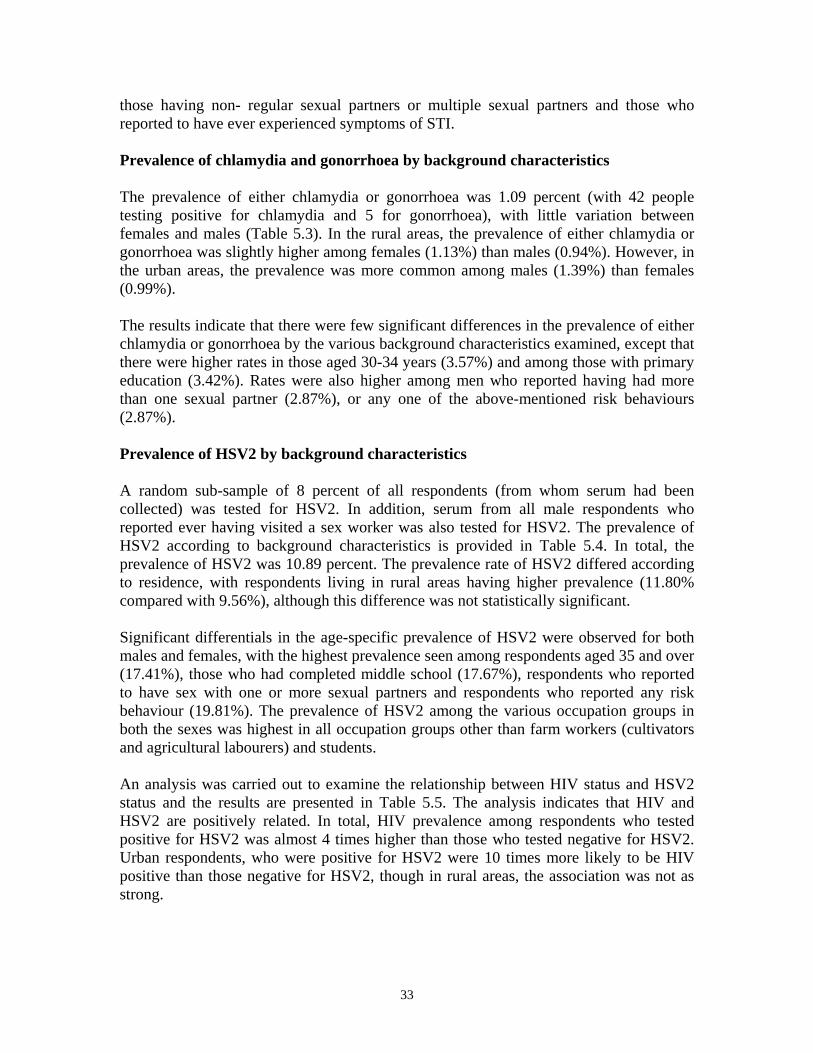
33
those having non- regular sexual partners or multiple sexual partners and those who reported to have ever experienced symptoms of STI. Prevalence of chlamydia and gonorrhoea by background characteristics The prevalence of either chlamydia or gonorrhoea was 1.09 percent (with 42 people testing positive for chlamydia and 5 for gonorrhoea), with little variation between females and males (Table 5.3). In the rural areas, the prevalence of either chlamydia or gonorrhoea was slightly higher among females (1.13%) than males (0.94%). However, in the urban areas, the prevalence was more common among males (1.39%) than females (0.99%). The results indicate that there were few significant differences in the prevalence of either chlamydia or gonorrhoea by the various background characteristics examined, except that there were higher rates in those aged 30-34 years (3.57%) and among those with primary education (3.42%). Rates were also higher among men who reported having had more than one sexual partner (2.87%), or any one of the above-mentioned risk behaviours (2.87%). Prevalence of HSV2 by background characteristics A random sub-sample of 8 percent of all respondents (from whom serum had been collected) was tested for HSV2. In addition, serum from all male respondents who reported ever having visited a sex worker was also tested for HSV2. The prevalence of HSV2 according to background characteristics is provided in Table 5.4. In total, the prevalence of HSV2 was 10.89 percent. The prevalence rate of HSV2 differed according to residence, with respondents living in rural areas having higher prevalence (11.80% compared with 9.56%), although this difference was not statistically significant. Significant differentials in the age-specific prevalence of HSV2 were observed for both males and females, with the highest prevalence seen among respondents aged 35 and over (17.41%), those who had completed middle school (17.67%), respondents who reported to have sex with one or more sexual partners and respondents who reported any risk behaviour (19.81%). The prevalence of HSV2 among the various occupation groups in both the sexes was highest in all occupation groups other than farm workers (cultivators and agricultural labourers) and students. An analysis was carried out to examine the relationship between HIV status and HSV2 status and the results are presented in Table 5.5. The analysis indicates that HIV and HSV2 are positively related. In total, HIV prevalence among respondents who tested positive for HSV2 was almost 4 times higher than those who tested negative for HSV2. Urban respondents, who were positive for HSV2 were 10 times more likely to be HIV positive than those negative for HSV2, though in rural areas, the association was not as strong.

34
PROFILE OF HIV POSITIVE PEOPLE The socio-economic and demographic profile of the 32 people who tested positive for HIV is presented in Table 5.6. The table indicates that in total, 57 percent of HIV-infected people surveyed were males and the remaining 43 percent were females. More than half of them (53%) were aged below 30 years. Respondents whose were currently married constituted nearly 66 percent of the HIV positive people while nearly a quarter of them were never-married. In terms of the educational profile of the HIV-infected respondents, more than half were illiterate and about one third of them had completed secondary level education. By occupation, around 39 percent of infected people were cultivators and 19 percent were engaged in housework. Twenty-eight percent of the HIV infected respondents were people who reported that they travel for work reasons.

CHAPTER 6 COMPARISON OF FACE-TO-FACE INTERVIEW (FTFI)
AND POLLING BOOTH SURVEY (PBS) DATA This chapter provides a comparison of responses given for selected questions in the face-to-face interviews (FTFI), reported in previous chapters, with those of the respondents participating in the Polling Booth Surveys (PBS)6. First, the reported responses from married males are presented followed by married females, unmarried males and unmarried females. MARRIED MALES In the PBS, all the selected married males aged 15-49 were asked nineteen questions on selected sensitive issues related to their sexual behaviour, HIV/AIDS and STI. The percentage of male married respondents who reported, “yes” to these questions in the PBS, and the corresponding percentages in the FTFI is given in Table 6.1. The table also provides the related Z-scores calculated based on the percentages from each survey type. The results suggest that a significantly higher percentage of married males who participated in the FTFI reported having heard of HIV/AIDS (83%), than married males who participated in the PBS (66%), though the percentage in urban areas for the two surveys were close and higher, than percentage in both surveys in rural areas. However, a little higher percentage of married male respondents in the PBS reported to have undergone an HIV test compared to respondents in FTFI (6% compared to 4%). In addition, all the selected married males were asked whether they had ever seen a condom and the answer to this question indicates that a higher proportion of males in FTFI reported ever having seen a condom as compared to the PBS respondents, although this difference was not statistically significant. However in the rural areas, a significant difference between PBS and FTFI respondents was observed for this question. For many of the sensitive questions related to sexual behaviour, a higher percentage of respondents answered positively in the PBS compared to the FTFI. For example, reporting of STI symptoms such as urethral discharge during the last 12 months among married males was more common in the PBS than in the FTFI (10.5% compared to 0.1%). The calculated Z-score value suggests that the responses from PBS and FTFI on these two aspects were significantly different. Also, 36 percent of married males in the PBS reported that they had ever had sex with women other than their wife and/or partner (Figure 6.1). By comparison, only 19 percent of married males in the FTFI reported such sexual behaviour. Similarly, other aspects of sensitive sexual behaviours such as ever (and in last 12 months) having had sex with 6 Other than sex and marital status, the socio-demographic characteristics of PBS respondents were not collected.

36
5.4
35.9
7.6
0.5
18.7
2.3
05
10152025303540
Had sex other thanwife/ partner
Had sex with FSW Anal sex with man
PBS FTFI
women other than wife/ or partner since marriage, were also reported more in the PBS than in the FTFI. A significantly higher proportion of married males in the PBS reported ever having had sex with a commercial sex worker compared to the FTFI (8% compared to 2%). The reporting of anal sex either with women or with men was also significantly higher in the PBS than in the FTFI. About 3 percent of married males in the PBS reported that their wife/or partner had had extra-marital relationships with other men, but in the FTFI less than 1 percent of the married males reported this. Both in the FTFI and the PBS, married males were asked about condom use during various types of sexual activity. As with other sensitive issues, condom use was reported more in the PBS than in the FTFI. For instance, 23 percent of married males in PBS reported ever having used a condom with wife or partner, compared to 15 percent of FTFI respondents. The analysis also reveals that use of condom during last sex with a female sex worker was reported much more in the PBS than in the FTFI (48% and 36% respectively). It is important to note that none of the married males who participated in the FTFI reported that they had ever injected drugs. However, in the PBS about 0.2 percent of married males reported this. MARRIED FEMALES In the PBS, married females were asked seventeen specific questions about their sexual behaviour, HIV/AIDS and STI. Table 6.2 shows the percentage distribution of married females who responded affirmatively to these specific questions in the PBS and in the FTFI. Overall, there was significant difference in the percentage of respondents who had ever heard of HIV/AIDS between FTFI and PBS with more participants in the PBS reporting this. Similarly, on the question of having ever undertaken an HIV test, nearly 15 percent of married females in the PBS compared to 6 percent married females in FTFI reported having undergone HIV testing. A significantly higher proportion of married females in the PBS reported STI symptoms (such as white discharge and genital ulcer) during the past 12 months than in the FTFI, irrespective of place of residence. Overall among married females, the reporting of ever having seen a condom was also found to be significantly higher in the PBS than in the FTFI (49% versus 39%), this difference was more pronounced in rural than in urban areas.
Figure 6.1. Comparison of PBS and FTFI on selected indicators among married males

37
29.9
10.3
3.1
10.3
0.8 0.30
4
8
12
16
20
24
28
32
Had sex with personother than
husband/partner
Had paid sex Extra-marital sex byhusband/ partner
PBS FTFI
Married female respondents reported considerably more extra-marital sex in the PBS than in the FTFI (8% compared to less than 1%). Similarly, a significantly higher proportion of married females in the PBS reported that they ever had received money in exchange for sex compared to the FTFI respondents (3% compared to less than 1% respectively). Sexual behaviours of the partner, such as having had extra-marital relationships or having visited sex workers were also reported more in the PBS than in the FTFI (Figure 6.2). For example, 30 percent of PBS respondents reported their husband having had extra-marital sex, compared to 10 percent of FTFI respondents. Similarly, 12 percent of PBS respondents reported that their husbands go to sex workers, compared to 2 percent of FTFI respondents. Reporting of ever having had anal sex was also significantly higher in the PBS compared to the FTFI (4% compared to less than 1% respectively). In the PBS, about 16 percent of married females said that their husband or partner had ever used a condom, which differed significantly from the FTFI, where 11 percent of married females in the FTFI reported such behaviour. However, for condom use by husband or partner during last sex, the difference was not statistically significant between the two groups. Among married females in the PBS who reported commercial sex, about 22 percent said they used a condom during the last commercial sex act. UNMARRIED MALES Unmarried males were asked sixteen specific questions related to sexual behaviour, HIV/AIDS and STI. The comparisons between the PBS and FTFI respondents are presented in Table 6.3. The percent of unmarried males who had ever heard of HIV/AIDS was significantly higher in the FTFI, compared to the PBS (92% in FTFI and 82% in PBS respectively). Overall, the reporting of ever having undergone an HIV test was higher in the PBS (5%) than in the FTFI (3%). Regarding STI symptoms, such as genital ulcers and urethral discharge in the last 12 months, more of the PBS respondents reported this than did the FTFI respondents. For instance, nearly 8 percent of unmarried males in the PBS reported having had a genital
Figure 6.2. Comparison of PBS and FTFI on selected indicators among married females

38
6.2
20.9
6.6
1.8
8.3
0.80
4
8
12
16
20
24
Had sex Had sex with FSW Anal sex with a man
PBS FTFI
ulcer compared to less than 1 percent of the FTFI respondents. Similarly, 8 percent of the unmarried males in the PBS reported having had a urethral discharge in the last 12 months, compared to less than 1 percent in the FTFI. In the PBS, more unmarried men reported ever having seen a condom than in the FTFI, and this difference was more pronounced in the urban areas. In addition, as can be seen from Figure 6.3, the proportion of unmarried males in the PBS who reported that they had ever had sex with women was significantly higher than the proportion of unmarried male FTFI respondents (21% compared to 8%). Similarly, a significantly higher proportion of unmarried males participating in the PBS reported ever having had sex with a female sex worker compared with the FTFI respondents (6% versus 2%). Furthermore, to the question of having sex with women (other than commercial sex workers) in the last 12 months, more PBS respondents reported this than FTFI respondents (10% versus 5%). In the FTFI, less than 1 percent of unmarried males admitted that they had had anal sex with men whereas in the PBS, 7 percent of unmarried males reported this. Reported condom use during commercial sex differed between PBS and FTFI respondents. Of those who had ever had such sexual encounters, ever use of condoms during commercial sex was reported by 73 percent of unmarried men in the PBS compared to 63 percent of unmarried men in FTFI. However, the condom usage in the last sexual encounter with a commercial sex worker did not vary between the two groups (63% each). For condom use ever with women (other than sex workers), there was little difference in responses between the two survey populations (PBS 32%; FTFI 38%). Similarly, the difference in condom use during last sex with non-commercial sex partners was also not significant with 25 percent for the PBS and 34 percent for the FTFI respondents answering in affirmative. The results also show that ever use of injected drugs was more likely to be reported in the PBS survey than in the FTFI, though numbers are small.
Figure 6.3. Comparison of PBS and FTFI on selected indicators among unmarried males

39
UNMARRIED FEMALES A set of thirteen specific questions related to sexual behaviour, HIV/AIDS and STI was asked to unmarried females; the results are shown in Table 6.4. The results suggest that, unlike married females, there was overall no significant difference between the proportions of respondents who had heard about HIV/AIDS in the FTFI and in the PBS. Similarly, there was little difference between the FTFI and the PBS in the reports of ever having undertaken an HIV test, both of which were low. STI symptoms (such as white discharge and genital ulcer) in the past 12 months were more commonly reported in the PBS than in the FTFI (21% of PBS respondents reported a white discharge compared to 3% of FTFI respondents). There was a significant difference in the reporting of ever having seen a condom between the two groups of respondents (30% FTFI and 48% PBS). A slightly higher percentage of unmarried females in the PBS than in the FTFI admitted that they had ever had sex with men (2% compared to less than 1% respectively); more respondents reported to have had sex with a male partner in the past 12 months in the PBS than in the FTFI. A few PBS respondents admitted having ever had sex for payment, compared to none of the young women interviewed in the FTFI. Similarly, in the FTFI none of the unmarried females reported anal sex, while in the PBS just under 1 percent reported this. Reported injection drug use was reported by a few women in the PBS but by none of the FTFI respondents.

40

CHAPTER 7 SUMMARY
General Population Surveys (GPS) are a key component of the CHARME Project’s effort to provide data for modeling of the AIDS epidemic, and for evaluation of the Avahan project in India. This chapter presents the summary of the GPS conducted in the Mysore district of Karnataka.
The survey was carried out in selected 15 villages and 20 urban blocks of Mysore district. After obtaining a list of people in these areas through the household census, the required number of adult males and females in the age group 15-49 was selected for individual interview and for giving biological samples.
HOUSEHOLD CENSUS
In total, 10,308 households were enumerated in the selected villages and urban blocks in the district, and a household census was completed for 9,255 households (90%). Overall, the sex ratio (number of females per 1,000 males) in the district was 1,021. In the rural areas, more than one-quarter of the population (28%) was found to be below 15 years of age and 9 percent was above age 59 years, with the remaining 63 percent in the 15-59 age groups. The pattern was more or less the same in urban areas, where about 28 percent of the population was below the age of 15 years. About two-thirds of the population (64%) in the urban areas were in the 15-59 age group and the remaining 8 percent were above 59 years of age.
The proportion of female-headed households was found to be almost equal in rural and urban areas (15%). In both rural and urban areas, the majority of household heads were currently married (82% and 83 respectively) and followed the Hindu religion (98% and 82% respectively). The proportion of Muslim households was higher in urban than in rural areas (17% compared with 2%).
The overall mean household size in Mysore district was found to be 4.4 persons with same rates in rural and urban areas. Overall, the literacy rate among persons aged 15 years and over, was 56 percent, though the literacy rate was higher in urban areas than in rural areas (73% compared with 48%). In both rural and urban areas, the literacy rate was higher among males than females. Furthermore, this sex differential in literacy was greater in rural areas than in urban areas. The estimated crude death rate for the entire study area was 6 deaths per 1,000 population, with the rural areas experiencing a slightly higher death rate than the urban areas (7 per 1,000 compared with 5 per 1,000). Overall, ageing was reported as the major

42
cause of death, irrespective of place of residence. In total, the other major reported causes of death were cardio-vascular disease (13%), asthma (10%) and cancer (6%). AIDS was reported as a cause of death for less than 1% of rural deaths, while no deaths were reported due to AIDS in urban areas.
SURVEY DATA
Socio-demographic profile
In total, 5,998 individuals were selected for interview, of whom approximately 78 percent were successfully interviewed, with biological samples obtained from nearly 70 percent. In total, 16 percent of the respondents were below age 20, 35 percent were aged 20-29, 28 percent were aged 30-39 and the remaining 21 percent were aged 40-49. In our sample, 74 percent of women and 59 percent of men were currently married; 7 percent of women and less than 1 percent of men were widowed, divorced, separated or deserted. Among the females, 19 percent were never-married: among the men, 41 percent were never-married. The mean age at marriage among the currently married respondents was 19.6 years: 24.1 years for males and 16.7 years for females. The mean age at marriage for both sexes was lower in rural than urban areas.
In our study, 45 percent of women, and 36 percent of men age 15-49, were illiterate, and an additional 5 percent of women and men had been to school but not completed primary school. Only 25 percent of women reported 10 or more years of education compared to 35 percent of men. In total, 24 percent of the respondents were engaged in agriculture-based activities, such as cultivators or as agricultural labourers and 8 percent of the respondents were students. The majority of both urban and rural female respondents reported being engaged in housework (60% and 59% respectively). Among rural males, agriculture-related work was reported by a large proportion of men (56%), while in the urban areas, about 32 percent of males reported being engaged in business.
A large majority of the respondents were Hindus (91%), with the rest being Muslims (8%), or to other religions (1%). There was a major difference observed between urban and rural areas: in urban areas, nearly 79 percent of respondents were Hindus and about 19 percent were Muslims, while in rural areas 99 percent were Hindus, and only 1 percent were Muslims. Overall, 19 percent of respondents belong to the scheduled castes and similarly, 20 percent belonged to the scheduled tribes: the remaining 61 percent did not belong to either group. Twenty percent of the respondents reported that they were required to travel due to work; 8 percent reported daily travel, 4 percent had to travel weekly, 3 percent monthly and the remaining 5 percent reported occasional travel. Travel for work reasons was more common among rural respondents than urban respondents (23% and 14% respectively). Also, a larger proportion of male respondents than female respondents reported travel due to work, irrespective of place of residence.

43
Among currently married women the mean number of children ever born was 2.3. Seventy two percent of currently married respondents reported that they were using a contraceptive method at the time of the survey. However, only 3 percent of married men and 2 percent of married women in the sample reported using condoms as their current contraceptive method. Knowledge of HIV/AIDS Eighty eight percent of respondents had heard of HIV/AIDS. Friends, neighbours or colleagues were the most common source of knowledge, reported by 78 percent of these respondents (86% women and 68% men). Television was the second most common source of information on HIV/AIDS, reported by 65 percent of the respondents who reported they had heard about HIV/AIDS. When asked about modes of HIV/AIDS transmission, over 90 percent of the men who had heard of HIV/AIDS reported unprotected sexual contact as a mode of transmission, compared with 52 percent of females. Mother-to-child transmission was reported more by female respondents than male respondent (88% compared with 71%). Respondents in urban areas were slightly more knowledgeable than their rural counterparts. However, over half of the respondents (57%) who had heard of HIV/AIDS reported at least one misconception about modes of HIV/AIDS transmission. Rural respondents were more likely to report various misconceptions of HIV/AIDS transmission than their urban counterparts. In terms of HIV/AIDS prevention, 41 percent of respondents who had heard of HIV/AIDS reported consistent condom use as a mode of prevention. Always using condoms during sex was reported more by urban respondents than rural respondents and more by women than men. Overall, 53 percent of respondents knew that having sex with only one faithful partner can prevent HIV/AIDS transmission. Overall, 4 percent of respondents reported having had an HIV test, and this percentage was a little higher in urban areas than in rural areas. Overall, 80 percent of those who had undergone HIV testing knew their test result, with those in urban areas more likely to know their test result than their rural counterparts (87% and 73% respectively). Similarly, two-fifths of the respondents who had undergone HIV testing reported that they had received counseling during their last HIV testing.
Sexual behaviour Overall, 5 percent of the never-married respondents reported that they had had sexual intercourse, with males more likely to report pre-marital sex than females (8% and less than 1% respectively). Overall, the median age at first sexual intercourse was 18.5 years: 22.8 years for males and 16.4 years for females. Almost every female respondent reported her husband as her first sexual partner. However, among males only 76 percent reported their wife/cohabiting partner as their first sexual partner. About 3 percent of married respondents reported that their partner had sex with others either before or after

44
marriage. Five percent of female respondents divulged that, to their knowledge, their husband had other sexual partners either before or after marriage. In total, 90 percent of respondents in the face-to-face interview who ever had sex, reported having ever had only one partner. Reporting of lifetime multiple sexual partners was rare among females (1%) but much higher in males (23%). However, 91 percent of respondents who ever had sex, reported having only had one sexual partner during the last one year, 2 percent reported more than one sexual partner and the remaining 7 percent did not have sex with anyone during that time. In total, more than 78 percent of males reported that they had sex with their last partner more than once in a week, and another 12 percent reported sex once in a week. In contrast, 64 percent of females reported that they had sex with the last partner more than once per week and another 21 percent reported weekly sex. In total 3 per 1,000 females reported having had anal sex with their male partner; 26 per 1,000 men reported anal sex with a woman, and 6 per 1,000 men reported anal sex with another man. Overall, 12 per 1,000 population reported that they had sex with a non-regular partner during the past one year and 9 per 1,000 population reported paying for, or being paid, for sex. Furthermore, 6 per 1,000 population had sex with more than one partner during the previous 3 months. About 72 per 1,000 population reported that they had at some time had more than 1 partner. Overall, 72 per 1,000 population reported having at least one of the risky behaviours. The anonymous PBS data suggest that risky behaviours are under-reported in face-to-face interviews. For example, a significantly higher proportion of married males in the PBS reported ever having had sex with a female sex worker compared to the FTFI (8% compared to 2%). Also, the proportion of unmarried males in the PBS who reported that they had ever had sex with women was significantly higher than the proportion of unmarried male FTFI respondents (21% compared to 8%). Furthermore, in the FTFI, less than 1 percent of unmarried males admitted that they had had anal sex with men whereas in the PBS, 7 percent of unmarried males reported this.
Condom knowledge and use Overall, nearly half of the respondents (48%) said they had seen condom, 26 percent had heard about them but not seen them, and the remaining 26 percent had neither heard nor seen a condom. Knowledge was much higher in urban areas than in rural areas. Males were more likely to have knowledge about condoms than females, irrespective of place of residence. Although, around 74 percent of respondents had some knowledge about condoms, only 12 percent of sexually experienced respondents reported having used them. Ever-use of condoms was reported more by male respondents than female respondents (17% and 8% respectively) and more by urban residents than rural residents (20% and 6% respectively). However, only about 3 percent of respondents reported having used a condom during their last sexual intercourse. As with other sensitive issues, condom use was reported more in the PBS than in the FTFI. For instance, 23 percent of married males in PBS reported ever having used a condom with wife or partner, compared to 15 percent

45
of FTFI respondents. Similarly, the analysis also reveals that use of condom during last sex with a female sex worker was reported much more in the PBS than in the FTFI (48% and 36% respectively).
Other potential risk factors Almost 56 percent of the respondents had received injections in the last year: this was slightly more common in rural areas than urban areas. Respondents received an average of 2.7 injections during the year preceding the survey. The majority of the respondents received the injections from medical doctors and more than two-fifths of the respondents received the injections from a nurse.
Knowledge of HIV clinics and programmes About 23 percent of the respondents had heard of “KEY” clinics and knowledge about these clinics was found to be much higher among respondents in urban areas than rural areas (37% compared to 14%). Knowledge about “KEY” clinics was more among males (26%) than females (20%). But, overall less than one percent of those who had heard of “KEY” clinics, reported to have ever visited one. Similarly, less than one percent of female respondents reported that they had ever heard of the “Namma clinics” in Mysore. In total, about 8 percent of the respondents were aware of any HIV/AIDS programme in the area.
Infection with HIV and other STIs In Mysore district, around 0.80 percent of the population in the age group 15-49 was infected with HIV. HIV prevalence in rural areas was slightly lesser than that in the urban areas (0.71% compared with 0.94%). Similarly, HIV prevalence was slightly higher among males (0.98%) than females (0.65%). Among men, HIV prevalence was highest in the age group 40-44 years (2.44%). Among women, HIV prevalence was seen to peak in the 35-39 year age group (1.39%). Marital status of the female respondents was significantly associated with HIV prevalence, with the highest rate (1.96%) seen in those women whose marriage was dissolved (i.e. divorced, separated, deserted or widowed). HIV prevalence was highest among respondents who were illiterate, engaged in salaried employment, and respondents belonging to scheduled tribes. Also, as the number of lifetime sexual partners increased, the likelihood of HIV infection also increased. Men who reported that they had ever-paid for sex were much more likely to be HIV positive than those who reported not doing so. Similarly, those respondents who reported any of the risky sexual behaviours, such as sex with a non-regular partner during the previous year, or ever having sex with more than one partner or ever having paid/received payment for sex, were more likely to be infected with HIV than respondents who reported no risky sexual behaviours (3.00% compared to 0.63%). Overall, the prevalence of active syphilis for the entire sample was 1.4 percent and this was twice as high among males as among females (1.8% compared with 0.9%). Rates of active syphilis were found to be slightly higher in rural areas than urban areas. Overall 42

46
people tested positive for chlamydia (1%) and 5 people tested positive for gonorrhoea (<1%), hardly varying between females and males. A random sub-sample of 8 percent of male and female respondents was tested for HSV2. In addition, serum from all male respondents who reported ever having visited a sex worker was also tested for HSV2. The prevalence of HSV2 among the random sub-sample was approximately 11 percent. The prevalence rate of HSV2 differed according to residence, with respondents living in rural areas having the higher prevalence (12% compared with 10%), although this difference was not statistically significant. The data also suggest that men who reported ever having visited a sex worker were nearly twice likely to be HSV2 positive as those men who reported never having visited a sex worker (22% compared to 12%). The analysis also indicates that HIV and HSV2 are positively related. In total, HIV prevalence among respondents who tested positive for HSV2 was 5 times higher than those who tested negative for HSV2.

APPENDIX A Detailed Tables∗
∗ Note: The results shown in Table 3.3 to Table 5.6 are based on sample weights. However, we have provided the un-weighted number of cases.

48

49
Table 2.1: Distribution of Households Enumerated in the Census by result of interview
Rural Urban Total Result of Interview Percent Number Percent Number Percent Number Households Enumerated 100.0 6448 100.0 3860 100.0 10308 Completed 95.4 6151 80.4 3104 89.8 9255 Vacant house 2.0 129 1.0 38 1.6 167 Locked house 2.1 137 10.5 404 5.2 541 Under Construction 0.2 15 0.3 10 0.2 25 Not covered 0.1 7 1.0 37 0.4 44 Refused 0.1 9 6.9 267 2.7 276

50
Table 2.2: Percent distribution of the de facto and de jure household populations by resident status in the household according to age, residence and sex Age De facto household population De jure household population
Usual resident
Visitor Total percent
Number Usual resident present
Usual resident absent
Total percent
Number
RURAL MALE <1 73.0 27.0 100.0 204 78.8 21.2 100.0 189 1-14 94.9 5.1 100.0 3372 90.5 9.5 100.0 3536 15-49 96.6 3.4 100.0 7306 93.6 6.4 100.0 7542 50+ 98.9 1.1 100.0 2185 96.8 3.2 100.0 2234 Total 96.2 3.8 100.0 13067 93.1 6.9 100.0 13501
RURAL FEMALE <1 76.7 23.3 100.0 176 81.8 18.2 100.0 165 1-14 94.9 5.1 100.0 3430 90.3 9.7 100.0 3603 15-49 93.5 6.5 100.0 7447 91.3 8.7 100.0 7633 50+ 97.8 2.2 100.0 2233 95.6 4.4 100.0 2284 Total 94.4 5.6 100.0 13286 91.6 8.4 100.0 13685
RURAL <1 74.7 25.3 100.0 380 80.2 19.8 100.0 354 1-14 94.9 5.1 100.0 6802 90.4 9.6 100.0 7139 15-49 95.0 5.0 100.0 14753 92.4 7.6 100.0 15175 50+ 98.4 1.6 100.0 4418 96.2 3.8 100.0 4518 Total 95.3 4.7 100.0 26353 92.3 7.7 100.0 27186
URBAN MALE <1 83.8 16.3 100.0 80 90.5 9.5 100.0 74 1-14 98.0 2.0 100.0 1742 96.5 3.5 100.0 1768 15-49 98.0 2.0 100.0 3823 97.7 2.3 100.0 3837 50+ 99.3 0.7 100.0 994 98.8 1.2 100.0 999 Total 98.0 2.0 100.0 6639 97.5 2.5 100.0 6678
URBAN FEMALE <1 90.8 9.2 100.0 87 89.8 10.2 100.0 88 1-14 98.3 1.7 100.0 1848 96.6 3.4 100.0 1881 15-49 96.9 3.1 100.0 3839 96.9 3.1 100.0 3839 50+ 98.3 1.7 100.0 1090 97.1 2.9 100.0 1104 Total 97.5 2.5 100.0 6864 96.8 3.2 100.0 6912
URBAN <1 87.4 12.6 100.0 167 90.1 9.9 100.0 162 1-14 98.2 1.8 100.0 3590 96.6 3.4 100.0 3649 15-49 97.5 2.5 100.0 7662 97.3 2.7 100.0 7676 50+ 98.8 1.2 100.0 2084 97.9 2.1 100.0 2103 Total 97.7 2.3 100.0 13503 97.1 2.9 100.0 13590
TOTAL MALE <1 76.1 23.9 100.0 284 82.1 17.9 100.0 263 1-14 95.9 4.1 100.0 5114 92.5 7.5 100.0 5304 15-49 97.1 2.9 100.0 11129 94.9 5.1 100.0 11379 50+ 99.1 0.9 100.0 3179 97.4 2.6 100.0 3233 Total 96.8 3.2 100.0 19706 94.5 5.5 100.0 20179
TOTAL FEMALE <1 81.4 18.6 100.0 263 84.6 15.4 100.0 253 1-14 96.1 3.9 100.0 5278 92.5 7.5 100.0 5484 15-49 94.7 5.3 100.0 11286 93.2 6.8 100.0 11472 50+ 98.0 2.0 100.0 3323 96.1 3.9 100.0 3388 Total 95.4 4.6 100.0 20150 93.4 6.6 100.0 20597
TOTAL <1 78.6 21.4 100.0 547 83.3 16.7 100.0 516 1-14 96.0 4.0 100.0 10392 92.5 7.5 100.0 10788 15-49 95.9 4.1 100.0 22415 94.0 6.0 100.0 22851 50+ 98.5 1.5 100.0 6502 96.7 3.3 100.0 6621 Total 96.1 3.9 100.0 39856 93.9 6.1 100.0 40776

51
Table 2.3: Percent distribution of de jure household population age 6 and above by marital status, according to age, sex and place of residence Current age
Current Marital Status 6-14 15-49 50+ Total RURAL MALE Currently married 0.5 60.1 91.0 54.0 Widowed 0.0 0.4 8.2 1.7 Divorced 0.0 0.3 0.3 0.2 Never married 99.5 39.3 0.5 44.0 Total percent 100.0 100.0 100.0 100.0 Number 2395 7542 2234 12171 RURAL FEMALE Currently married 0.4 73.9 43.6 53.7 Widowed 0.0 5.1 54.3 13.2 Divorced 0.0 2.0 1.2 1.4 Never married 99.6 19.0 0.9 31.7 Total percent 100.0 100.0 100.0 100.0 Number 2464 7633 2284 12381 RURAL Currently married 0.4 67.0 67.0 53.8 Widowed 0.0 2.7 31.5 7.5 Divorced 0.0 1.1 0.8 0.8 Never married 99.5 29.1 0.7 37.8 Total percent 100.0 100.0 100.0 100.0 Number 4859 15175 4518 24552 URBAN MALE Currently married 0.1 58.0 91.4 52.2 Widowed 0.0 0.3 7.0 1.3 Divorced 0.0 0.3 0.8 0.3 Never married 99.9 41.4 0.8 46.1 Total percent 100.0 100.0 100.0 100.0 Number 1176 3837 999 6012 URBAN FEMALE Currently married 0.2 70.6 45.8 51.4 Widowed 0.0 4.6 49.3 11.5 Divorced 0.0 1.3 2.4 1.2 Never married 99.8 23.4 2.4 35.9 Missing 0.0 0.0 0.1 0.0 Total percent 100.0 100.0 100.0 100.0 Number 1326 3839 1104 6269 URBAN Currently married 0.2 64.3 67.5 51.8 Widowed 0.0 2.5 29.2 6.5 Divorced 0.0 0.8 1.6 0.8 Never married 99.8 32.4 1.7 40.9 Total percent 100.0 100.0 100.0 100.0 Number 2502 7676 2103 12281

52
Table 2.4: Percent distribution of de jure household population aged 15-49 by marital status, according to age, sex and place of residence Current age
Current Marital Status 15-19 20-29 30-49 Total RURAL MALE Currently married 0.3 36.5 95.1 60.1 Widowed 0.0 0.1 0.6 0.4 Divorced 0.0 0.1 0.5 0.3 Never married 99.6 63.3 3.8 39.3 Missing 0.1 0.0 0.0 0.0 Total percent 100.0 100.0 100.0 100.0 Number 1235 2512 3795 7542 RURAL FEMALE Currently married 28.5 82.2 84.9 73.9 Widowed 0.1 1.9 9.2 5.1 Divorced 0.1 1.7 2.9 2.0 Never married 71.3 14.2 3.0 19.0 Total percent 100.0 100.0 100.0 100.0 Number 1356 2619 3658 7633 RURAL Currently married 15.1 59.8 90.1 67.0 Widowed 0.1 1.0 4.8 2.7 Divorced 0.0 0.9 1.7 1.1 Never married 84.8 38.2 3.4 29.1 Total percent 100.0 100.0 100.0 100.0 Number 2591 5131 7453 15175 URBAN MALE Currently married 0.5 31.9 94.9 58.0 Widowed 0.0 0.2 0.5 0.3 Divorced 0.0 0.3 0.4 0.3 Never married 99.5 67.6 4.2 41.4 Total percent 100.0 100.0 100.0 100.0 Number 650 1272 1915 3837 URBAN FEMALE Currently married 17.5 76.8 86.0 70.6 Widowed 0.0 1.1 9.2 4.6 Divorced 0.1 1.0 2.0 1.3 Never married 82.4 21.2 2.8 23.4 Total percent 100.0 100.0 100.0 100.0 Number 670 1403 1766 3839 URBAN Currently married 9.1 55.4 90.6 64.3 Widowed 0.0 0.6 4.7 2.5 Divorced 0.1 0.7 1.2 0.8 Never married 90.8 43.3 3.5 32.4 Total percent 100.0 100.0 100.0 100.0 Number 1320 2675 3681 7676

53
Table 2.5: Percent distribution of households by selected characteristics of household head and household size, according to residence Characteristic RURAL URBAN TOTAL Sex of the household head Male 84.8 85.7 85.1 Female 15.2 14.3 14.9 Age of the household head <20 0.1 0.3 0.2 20-29 6.7 8.6 7.3 30-49 51.5 53.4 52.1 50+ 41.7 37.8 40.4 Marital status of the household head Currently married 82.2 82.6 82.3 Widowed 14.5 13.0 14.0 Divorced 1.4 1.5 1.4 Never married 1.9 3.0 2.3 Religion of the household head Hindu 97.7 81.5 92.2 Muslim 2.2 16.9 7.1 Christian 0.0 0.4 0.1 Jain 0.1 1.3 0.5 Number of usual members 1 5.4 4.3 5.0 2 10.5 10.3 10.4 3 16.2 18.4 16.9 4 27.8 28.5 28.0 5 17.8 16.6 17.4 6 9.6 10.1 9.8 7 5.4 5.0 5.3 8 2.6 3.1 2.8 9+ 4.7 3.8 4.4 Mean 4.4 4.4 4.4 Total percent 100.0 100.0 100.0 Number 6151 3104 9255 Note: Total includes 3 households with missing information on religion.

54
Table 2.6: Percent distribution of household de jure population aged 15 years and over by educational level, according to sex and place of residence
Male Female Total Educational level RURAL Illiterate 44.0 60.5 52.3 Literate, <Primary complete 6.5 4.3 5.4 Primary complete, middle incomplete 10.8 9.2 10.0 Middle complete, secondary incomplete 11.3 9.7 10.5 Secondary complete 27.4 16.3 21.8 Total percent 100.0 100.0 100.0 Number 9776 9917 19693 URBAN Illiterate 21.5 33.3 27.5 Literate, <Primary complete 5.4 5.1 5.3 Primary complete, middle incomplete 12.5 12.2 12.3 Middle complete, secondary incomplete 10.7 10.0 10.3 Secondary complete 49.9 39.3 44.5 Total percent 100.0 100.0 100.0 Number 4836 4943 9779 TOTAL Illiterate 36.5 51.5 44.1 Literate, <Primary complete 6.1 4.5 5.3 Primary complete, middle incomplete 11.3 10.2 10.8 Middle complete, secondary incomplete 11.1 9.8 10.4 Secondary complete 34.8 24.0 29.4 Total percent 100.0 100.0 100.0 Number 14612 14860 29472
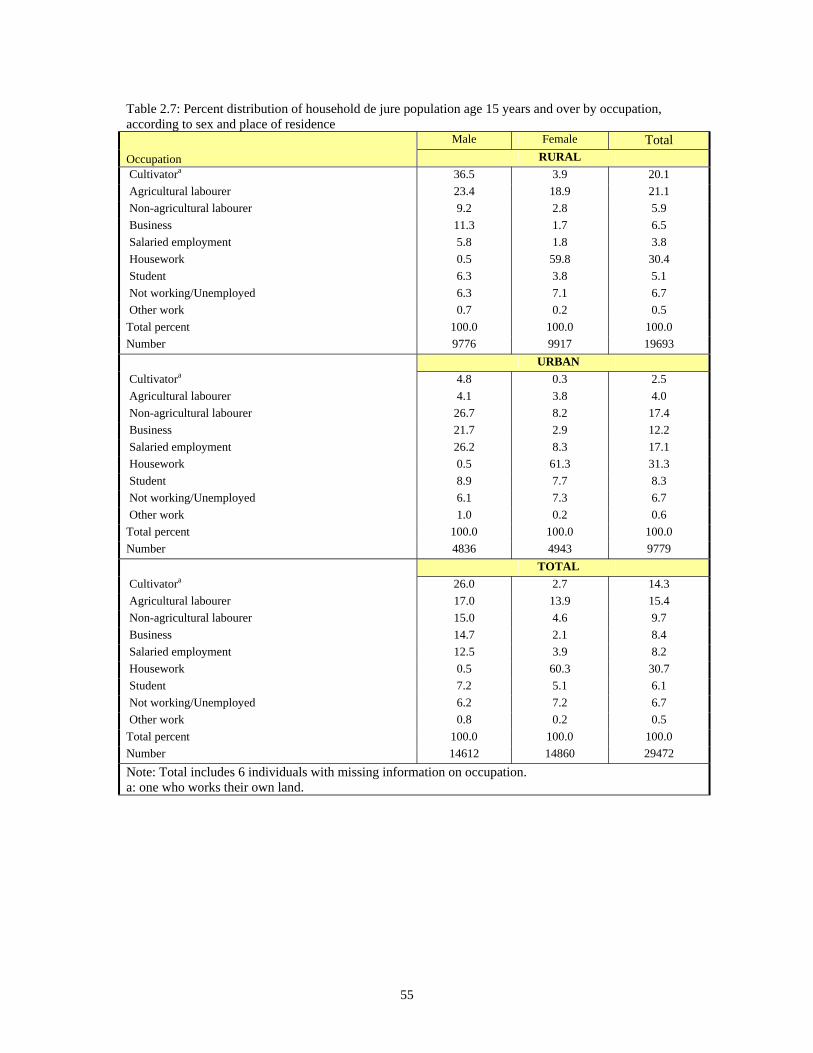
55
Table 2.7: Percent distribution of household de jure population age 15 years and over by occupation, according to sex and place of residence
Male Female Total Occupation RURAL Cultivatora 36.5 3.9 20.1 Agricultural labourer 23.4 18.9 21.1 Non-agricultural labourer 9.2 2.8 5.9 Business 11.3 1.7 6.5 Salaried employment 5.8 1.8 3.8 Housework 0.5 59.8 30.4 Student 6.3 3.8 5.1 Not working/Unemployed 6.3 7.1 6.7 Other work 0.7 0.2 0.5 Total percent 100.0 100.0 100.0 Number 9776 9917 19693 URBAN Cultivatora 4.8 0.3 2.5 Agricultural labourer 4.1 3.8 4.0 Non-agricultural labourer 26.7 8.2 17.4 Business 21.7 2.9 12.2 Salaried employment 26.2 8.3 17.1 Housework 0.5 61.3 31.3 Student 8.9 7.7 8.3 Not working/Unemployed 6.1 7.3 6.7 Other work 1.0 0.2 0.6 Total percent 100.0 100.0 100.0 Number 4836 4943 9779 TOTAL Cultivatora 26.0 2.7 14.3 Agricultural labourer 17.0 13.9 15.4 Non-agricultural labourer 15.0 4.6 9.7 Business 14.7 2.1 8.4 Salaried employment 12.5 3.9 8.2 Housework 0.5 60.3 30.7 Student 7.2 5.1 6.1 Not working/Unemployed 6.2 7.2 6.7 Other work 0.8 0.2 0.5 Total percent 100.0 100.0 100.0 Number 14612 14860 29472 Note: Total includes 6 individuals with missing information on occupation. a: one who works their own land.

56
Table 2.8: Estimated crude death rates (per 1,000 population) by residence and age Characteristics Crude Death Rate Place of Residence Rural 6.66 Urban 4.80 Age a <15 2.09 15-49 2.49 50+ 24.83 Total 6.05 Note: a Age at death was not reported for 5 deaths.
Table 2.9: Percent distribution of deaths during the three years preceding the census by reported cause of death, according to place of residence and age at death
Residence Age Reported cause of illness Rural Urban Total <15 15-49 50+ Ageing 17.7 17.5 17.6 0.0 0.0 26.3 Cardio vascular 12.1 14.6 12.8 9.3 16.0 12.1 Asthma 9.9 9.2 9.7 8.0 1.7 12.8 Cancer 6.9 4.9 6.4 1.3 8.3 6.3 Suicide 4.5 4.4 4.5 4.0 16.0 0.4 Accident 3.0 5.8 3.7 2.7 4.4 3.6 Fever 4.3 1.5 3.6 5.3 4.4 3.1 Diabetes 3.6 3.4 3.6 0.0 1.1 4.8 Tuberculosis 3.3 3.4 3.3 0.0 6.6 2.7 Paralysis 3.3 2.9 3.2 0.0 3.3 3.6 Alcoholism 2.8 2.9 2.8 0.0 5.0 2.5 Jaundice 1.6 2.9 1.9 2.7 4.4 1.0 Kidney problem 1.4 2.9 1.8 1.3 2.2 1.7 Stomach ache 1.7 1.5 1.7 4.0 1.7 1.3 Blood Pressure 1.2 2.4 1.5 0.0 0.0 2.3 Fits 1.2 1.0 1.2 0.0 2.8 0.8 Cough 1.2 0.5 1.0 6.7 0.0 0.6 Mentally ill 1.2 0.5 1.0 0.0 3.3 0.4 Diarrhoea 0.4 1.9 0.8 4.0 0.0 0.6 Maternal causes 0.9 0.0 0.6 0.0 1.7 0.4 Brain problem 0.7 0.0 0.5 1.3 0.6 0.4 AIDS 0.5 0.0 0.4 0.0 1.7 0.0 Homicide 0.4 0.5 0.4 0.0 1.7 0.0 Typhoid 0.4 0.5 0.4 0.0 1.7 0.0 Cause not known/reported 5.7 6.8 6.0 10.7 3.3 6.3 Other 10.2 8.3 9.7 38.7 8.3 6.1 Total 100.0 100.0 100.0 100.0 100.0 100.0 Number 577 206 783 75 181 522

57
Table 3.1: Sample results in rural and urban areas Rural Urban Total
Result Percent Number Percent Number Percent Number Persons selected 100 3000 100 2996 100 5996 Both interview and any biological sample 75.4 2263 64.4 1928 69.9 4191
Only interview without biological sample 6.8 204 8.6 258 7.7 462 Not covered at all 17.8 533 27.0 810 22.4 1343 Not at home 6.5 196 8.6 257 7.6 453 Refused 4.5 136 9.8 294 7.2 430 Partly completed 0.3 9 0.0 1 0.2 10 Other 6.4 192 8.6 258 7.5 450

58
Table 3.2RM: Percentage distribution of RURAL MALE sample by coverage, according to background characteristics
Any biological sample &
Interview only
Total percent
Characteristic Interview
Not interviewed
Number
Age 15-19 67.0 4.2 28.9 100 239 20-24 78.4 3.7 18.0 100 273 25-29 72.3 6.2 21.5 100 242 30-34 68.9 5.6 25.6 100 180 35-39 68.5 3.3 28.2 100 213 40-44 67.4 4.7 27.9 100 172 45-49 68.1 4.3 27.6 100 185 Marital status Currently married 69.9 4.6 25.6 100 900 Widowed 50.0 0.0 50.0 100 2 Divorced/separated/deserted 66.7 16.7 16.7 100 6 Never married 71.6 4.4 24.0 100 596 Literacy and education Illiterate 70.1 5.1 24.9 100 631 Literate, <Primary complete 74.8 0.0 25.3 100 99 Primary complete, middle incomplete 72.1 5.6 22.4 100 161 Middle complete, secondary incomplete 71.1 2.7 26.2 100 187 Secondary complete 69.5 5.2 25.4 100 426 Occupation Cultivator 77.7 4.6 17.7 100 627 Agricultural labourer 41.1 3.8 55.1 100 185 Non-agricultural labourer 72.3 5.3 22.5 100 209 Business 79.1 3.3 17.6 100 210 Salaried employment 68.3 7.9 23.8 100 101 Housework 75.0 0.0 25.0 100 4 Student 75.4 4.8 19.8 100 126 Not working/Unemployed 8.0 0.0 92.0 100 25 Other work 0.0 0.0 100.0 100 5 Religion Hindu 70.7 4.5 24.9 100 1461 Muslim 67.5 5.0 27.5 100 40 Other 33.3 33.3 33.3 100 3 Caste/Tribe Scheduled Caste 68.4 6.2 25.4 100 323 Scheduled Tribe 67.1 4.2 28.7 100 356 Other 72.9 4.0 23.2 100 825 Total 70.6 4.5 24.9 100 1504 Note: Total includes persons with missing information on occupation.

59
Table 3.2RF: Percentage distribution of RURAL FEMALE sample by coverage, according to background characteristics
Any biological sample &
Interview only
Total percent
Characteristic Interview
Not interviewed
Number
Age 15-19 81.8 8.7 9.5 100 252 20-24 74.5 6.7 18.8 100 239 25-29 82.2 7.0 10.9 100 258 30-34 82.0 8.1 10.0 100 211 35-39 81.9 10.6 7.6 100 237 40-44 81.0 10.9 8.2 100 147 45-49 79.0 14.5 6.6 100 152 Marital status Currently married 82.1 8.1 9.8 100 1084 Widowed 76.8 13.4 9.8 100 82 Divorced/separated/deserted 85.4 7.3 7.3 100 41 Never married 74.1 11.8 14.2 100 289 Literacy and education Illiterate 79.1 11.0 9.9 100 798 Literate, <Primary complete 80.6 6.9 12.5 100 72 Primary complete, middle incomplete 87.0 4.0 9.0 100 177 Middle complete, secondary incomplete 82.7 6.5 10.8 100 185 Secondary complete 78.0 9.1 12.9 100 264 Occupation Cultivator 91.3 4.7 3.9 100 127 Agricultural labourer 59.8 4.7 35.5 100 107 Non-agricultural labourer 81.4 16.1 2.5 100 199 Business 81.0 14.3 4.8 100 42 Salaried employment 88.0 0.0 12.0 100 25 Housework 81.4 8.1 10.5 100 898 Student 77.8 12.5 9.7 100 72 Not working/Unemployed 50.0 31.3 18.8 100 16 Religion Hindu 80.1 9.3 10.6 100 1468 Muslim 92.6 0.0 7.4 100 27 Caste/Tribe Scheduled Caste 79.8 9.2 11.0 100 347 Scheduled Tribe 73.6 15.1 11.3 100 337 Other 83.4 6.5 10.1 100 811 Total 80.4 9.1 10.6 100 1496 Note: Total includes persons with missing information on occupation, religion and caste/tribe.

60
Table 3.2R: Percentage distribution of RURAL sample by coverage, according to background characteristics
Any biological sample &
Interview only
Total percent
Characteristic Interview
Not interviewed
Number
Age 15-19 74.5 6.5 18.9 100 491 20-24 76.6 5.1 18.4 100 512 25-29 77.4 6.6 16.0 100 500 30-34 76.0 6.9 17.1 100 391 35-39 75.6 7.1 17.3 100 450 40-44 73.7 7.5 18.8 100 319 45-49 73.0 8.9 18.1 100 337 Marital status Currently married 76.6 6.5 16.9 100 1984 Widowed 76.2 13.1 10.7 100 84 Divorced/separated/deserted 83.0 8.5 8.5 100 47 Never married 72.4 6.8 20.8 100 885 Literacy and education Illiterate 75.1 8.4 16.5 100 1429 Literate, <Primary complete 77.2 2.9 19.9 100 171 Primary complete, middle incomplete 79.9 4.7 15.4 100 338 Middle complete, secondary incomplete 76.9 4.6 18.6 100 372 Secondary complete 72.8 6.7 20.6 100 690 Occupation Cultivator 80.0 4.6 15.4 100 754 Agricultural labourer 48.0 4.1 48.0 100 292 Non-agricultural labourer 76.7 10.5 12.8 100 408 Business 79.4 5.2 15.5 100 252 Salaried employment 72.2 6.4 21.4 100 126 Housework 81.4 8.1 10.5 100 902 Student 76.3 7.6 16.2 100 198 Not working/Unemployed 24.4 12.2 63.4 100 41 Other work 0.0 0.0 100.0 100 6 Religion Hindu 75.4 6.9 17.7 100 2929 Muslim 77.6 3.0 19.4 100 67 Other 33.3 33.3 33.3 100 3 Caste/Tribe Scheduled Caste 74.3 7.8 17.9 100 670 Scheduled Tribe 70.3 9.5 20.2 100 693 Other 78.1 5.3 16.7 100 1636 Total 75.4 6.8 17.8 100 3000 Note: Total includes persons with missing information on occupation, religion and caste/tribe.

61
Table 3.2UM: Percentage distribution of URBAN MALE sample by coverage, according to background characteristics
Any biological sample &
Interview only
Total percent
Characteristic Interview
Not interviewed
Number
Age 15-19 61.5 5.9 32.6 100 239 20-24 68.7 4.7 26.6 100 278 25-29 55.6 6.1 38.3 100 214 30-34 61.4 6.1 32.6 100 215 35-39 52.7 8.7 38.7 100 207 40-44 48.8 4.7 46.5 100 172 45-49 48.5 6.5 45.0 100 169 Marital status Currently married 54.6 6.6 38.9 100 854 Widowed 50.0 0.0 50.0 100 4 Divorced/separated/deserted 0.0 20.0 80.0 100 5 Never married 62.8 5.2 32.0 100 631 Literacy and education Illiterate 67.3 6.2 26.5 100 309 Literate, <Primary complete 68.5 3.7 27.8 100 54 Primary complete, middle incomplete 63.2 3.2 33.5 100 185 Middle complete, secondary incomplete 59.7 6.5 33.8 100 139 Secondary complete 51.9 6.7 41.4 100 807 Occupation Cultivator 82.8 6.9 10.3 100 58 Agricultural labourer 80.0 0.0 20.0 100 10 Non-agricultural labourer 54.6 3.2 42.3 100 374 Business 60.0 6.7 33.3 100 462 Salaried employment 53.4 6.8 39.8 100 367 Housework 50.0 0.0 50.0 100 4 Student 62.0 8.7 29.4 100 184 Not working/Unemployed 36.8 10.5 52.6 100 19 Other work 0.0 0.0 100.0 100 8 Religion Hindu 59.5 6.5 34.0 100 1163 Muslim 52.7 4.0 43.3 100 300 Other 46.7 6.7 46.7 100 30 Caste/Tribe Scheduled Caste 62.1 5.0 32.9 100 161 Scheduled Tribe 62.1 5.6 32.3 100 232 Other 56.6 6.3 37.1 100 1096 Total 57.8 6.0 36.1 100 1494 Note: Total includes persons with missing information on occupation, religion and caste/tribe.

62
Table 3.2UF: Percentage distribution of URBAN FEMALE sample by coverage, according to background characteristics
Any biological sample &
Interview only
Total percent
Characteristic Interview
Not interviewed
Number
Age 15-19 72.3 9.2 18.5 100 249 20-24 70.2 7.5 22.4 100 268 25-29 71.2 10.6 18.3 100 274 30-34 70.6 11.2 18.2 100 214 35-39 73.8 12.9 13.4 100 202 40-44 69.5 17.1 13.4 100 164 45-49 66.4 13.7 19.9 100 131 Marital status Currently married 73.1 10.7 16.2 100 1027 Widowed 73.6 8.3 18.1 100 72 Divorced/separated/deserted 82.1 10.7 7.1 100 28 Never married 63.2 13.1 23.7 100 375 Literacy and education Illiterate 82.8 5.4 11.8 100 349 Literate, <Primary complete 74.0 8.0 18.0 100 50 Primary complete, middle incomplete 76.9 9.6 13.5 100 229 Middle complete, secondary incomplete 78.0 7.6 14.5 100 159
Secondary complete 61.3 15.5 23.2 100 715 Occupation Cultivator 100.0 0.0 0.0 100 8 Agricultural labourer 81.8 4.6 13.6 100 22 Non-agricultural labourer 78.8 5.1 16.1 100 137 Business 80.2 11.2 8.6 100 116 Salaried employment 50.4 15.4 34.2 100 117 Housework 72.7 11.2 16.1 100 911 Student 61.7 14.8 23.5 100 162 Not working/Unemployed 45.5 9.1 45.5 100 22 Religion Hindu 70.2 12.2 17.6 100 1160 Muslim 74.9 6.8 18.3 100 311 Other 54.8 16.1 29.0 100 31 Caste/Tribe Scheduled Caste 75.0 9.0 16.0 100 156 Scheduled Tribe 75.6 9.5 14.9 100 221 Other 69.3 11.8 18.8 100 1125 Total 70.8 11.2 18.0 100 1502 Note: Total includes persons with missing information on occupation.

63
Table 3.2U: Percentage distribution of URBAN sample by coverage, according to background characteristics
Any biological sample &
Interview only
Total percent
Characteristic Interview
Not interviewed
Number
Age 15-19 67.0 7.6 25.4 100 488 20-24 69.4 6.0 24.5 100 546 25-29 64.3 8.6 27.1 100 488 30-34 66.0 8.6 25.4 100 429 35-39 63.1 10.8 26.2 100 409 40-44 58.9 10.7 30.4 100 336 45-49 56.3 9.7 34.0 100 300 Marital status Currently married 64.7 8.8 26.5 100 1881 Widowed 72.4 7.9 19.7 100 76 Divorced/separated/deserted 69.7 12.1 18.2 100 33 Never married 62.9 8.2 28.9 100 1006 Literacy and education Illiterate 75.5 5.8 18.7 100 658 Literate, <Primary complete 71.2 5.8 23.1 100 104 Primary complete, middle incomplete 70.8 6.8 22.5 100 414 Middle complete, secondary incomplete 69.5 7.1 23.5 100 298 Secondary complete 56.3 10.8 32.9 100 1522 Occupation Cultivator 84.9 6.1 9.1 100 66 Agricultural labourer 81.3 3.1 15.6 100 32 Non-agricultural labourer 61.1 3.7 35.2 100 511 Business 64.0 7.6 28.4 100 578 Salaried employment 52.7 8.9 38.4 100 484 Housework 72.6 11.2 16.3 100 915 Student 61.9 11.6 26.6 100 346 Not working/Unemployed 41.5 9.8 48.8 100 41 Other work 0.0 0.0 100.0 100 8 Religion Hindu 64.8 9.4 25.8 100 2323 Muslim 64.0 5.4 30.6 100 611 Other 50.8 11.5 37.7 100 61 Caste/Tribe Scheduled Caste 68.5 6.9 24.6 100 317 Scheduled Tribe 68.7 7.5 23.8 100 453 Other 63.0 9.1 27.9 100 2221 Total 64.4 8.6 27.0 100 2996 Note: Total includes persons with missing information on occupation, religion and caste/tribe.

64
Table 3.3: Percent distribution of respondents (who have given the interview) according to place of residence, sex and selected background characteristics
Rural Urban Total
Characteristic Male Female Total Male Female Total Male Female Total Age 15-19 17.3 15.5 16.4 17.1 15.9 16.5 17.2 15.7 16.4 20-24 20.5 13.9 17.0 20.6 17.9 19.1 20.5 15.6 17.8 25-29 17.3 17.2 17.2 13.9 18.3 16.4 16.0 17.7 16.9 30-34 11.0 14.7 13.0 15.7 14.5 15.0 12.8 14.6 13.8 35-39 11.3 18.2 15.0 13.8 14.4 14.1 12.3 16.6 14.6 40-44 8.9 9.1 9.0 9.5 10.8 10.2 9.1 9.8 9.5 45-49 13.7 11.4 12.5 9.5 8.2 8.7 12.1 10.1 11.0 Marital status Currently married 60.5 77.1 69.4 56.6 70.5 64.4 58.9 74.4 67.3 Widowed 0.0 4.5 2.4 0.4 4.8 2.9 0.2 4.6 2.6 Divorced 0.5 1.9 1.3 0.1 2.1 1.2 0.3 2.0 1.2 Never married 39.0 16.5 27.0 42.9 22.6 31.6 40.6 19.0 28.8 Literacy and education
Illiterate 42.7 56.1 49.9 26.7 29.2 28.1 36.4 44.9 41.1 Primary 5.9 6.4 6.2 4.4 3.6 3.9 5.3 5.2 5.3 Middle 11.4 13.0 12.3 13.1 15.8 14.6 12.1 14.2 13.2 Secondary 11.5 11.2 11.3 10.1 10.8 10.5 10.9 11.1 11.0 Secondary+ 28.5 13.3 20.4 45.8 40.6 42.9 35.3 24.6 29.5 Occupation Agricultural labourer
7.6 6.3 6.9 1.2 2.7 2.0 5.1 4.8 4.9
Business 12.3 3.0 7.3 32.3 9.3 19.4 20.1 5.6 12.2 Cultivator 48.4 13.3 29.7 7.3 1.0 3.8 32.4 8.2 19.2 House work 0.1 58.9 31.5 0.1 59.8 33.5 0.1 59.3 32.3 Non-agri. labourer 13.7 12.6 13.1 22.9 10.4 15.9 17.3 11.7 14.2 Not Working 0.2 0.3 0.3 1.3 0.9 1.1 0.6 0.6 0.6 Salaried Employment
5.3 1.3 3.1 21.8 5.8 12.9 11.7 3.2 7.1
Student 9.3 3.3 6.1 12.2 9.5 10.7 10.4 5.8 7.9 Missing 3.2 1.1 2.1 1.0 0.8 0.9 2.3 1.0 1.6 Religion Hindu 98.9 99.3 99.1 80.8 78.4 79.4 91.9 90.6 91.2 Muslim 1.0 0.7 0.9 17.5 19.7 18.7 7.4 8.6 8.1 Other 0.1 0.0 0.0 1.8 2.0 1.9 0.7 0.8 0.8 Caste/Tribe Scheduled Caste 25.3 25.5 25.4 10.6 10.1 10.3 19.6 19.1 19.3 Scheduled Tribe 23.0 23.8 23.4 16.4 13.6 14.8 20.4 19.5 19.9 Other 51.7 50.7 51.2 73.0 76.4 74.9 60.0 61.3 60.7 Total percent 100 100 100 100 100 100 100 100 100 Number 1129 1338 2467 954 1232 2186 2083 2570 4653

65
Table 3.3 (Contd.): Percent distribution of respondents (who have given the interview) according to place of residence, sex and background characteristics
Rural Urban Total Characteristic Male Female Total Male Female Total Male Female Total Travel due to work No 58.4 92.8 76.8 71.6 96.7 85.5 63.6 94.4 80.4 Yes, daily 16.1 3.1 9.2 10.9 2.3 6.1 14.1 2.8 7.9 Yes, weekly 9.4 0.6 4.7 5.2 0.7 2.7 7.7 0.6 3.9 Yes, monthly 7.1 0.2 3.4 5.9 0.1 2.7 6.6 0.2 3.1 Yes, once in a while 9.0 3.3 6.0 6.5 0.2 3.0 8.0 2.0 4.8 Travel in last 1 year No 47.7 41.8 44.6 54.3 37.5 44.9 50.3 40.0 44.7 Within district 32.2 46.7 40.0 19.2 34.0 27.5 27.1 41.4 34.9 Outside district/within state
18.3 9.7 13.7 21.9 24.2 23.2 19.7 15.7 17.5
Outside state 1.7 1.8 1.7 4.6 4.4 4.4 2.8 2.8 2.8 Total percent 100 100 100 100 100 100 100 100 100 Number 1129 1338 2467 954 1232 2186 2083 2570 4653
AMONG CURRENTLY MARRIED RESPONDENTS Currently living with spouse
Yes 99.9 98.8 99.3 99.9 99.4 99.6 99.9 99.0 99.4 No 0.1 1.2 0.8 0.1 0.6 0.4 0.1 1.0 0.6 Number of times married
Once 96.5 99.8 98.5 95.5 99.6 98.1 96.2 99.7 98.3 More than once 3.5 0.2 1.5 4.5 0.4 2.0 3.9 0.3 1.7 Age at marriage <18 years 1.2 66.9 40.2 0.5 46.9 28.9 0.9 59.1 35.9 18-20 years 17.0 29.1 24.2 19.0 33.8 28.0 17.8 30.9 25.7 21+ years 81.8 4.0 35.6 80.6 19.3 43.0 81.4 10.0 38.4 Mean 23.8 15.9 19.1 24.6 17.8 20.5 24.1 16.7 19.6 Number of children None 16.2 7.7 11.2 10.3 9.3 9.7 14.0 8.3 10.6 1 14.9 12.7 13.6 24.4 19.9 21.7 18.5 15.6 16.7 2 41.4 38.1 39.4 36.5 38.0 37.4 39.6 38.1 38.7 3 18.2 26.1 22.9 19.7 19.1 19.3 18.8 23.3 21.5 4+ 9.3 15.4 12.9 9.2 13.7 11.9 9.2 14.7 12.5 Mean 1.9 2.3 2.2 2.0 2.2 2.1 2.0 2.3 2.1 Current contraceptive use
None 32.6 23.5 27.2 34.0 27.8 30.2 33.1 25.2 28.4 Pill 0.1 0.2 0.1 0.7 1.4 1.1 0.3 0.7 0.5 Condom 1.1 0.5 0.8 6.3 4.0 4.9 3.1 1.9 2.4 IUD 1.9 0.5 1.1 3.5 3.4 3.4 2.5 1.7 2.0 Female sterilization 63.9 75.1 70.5 55.3 62.0 59.4 60.7 69.9 66.2 Male sterilization 0.3 0.0 0.2 0.0 0.0 0.0 0.2 0.0 0.1 Rhythm/Safe period 0.0 0.1 0.0 0.0 0.5 0.3 0.0 0.2 0.1 Other 0.0 0.0 0.0 0.0 0.3 0.2 0.0 0.1 0.1 Missing 0.1 0.1 0.1 0.2 0.6 0.4 0.1 0.3 0.2 Total percent 100 100 100 100 100 100 100 100 100 Number 670 978 1648 522 861 1383 1192 1839 3031
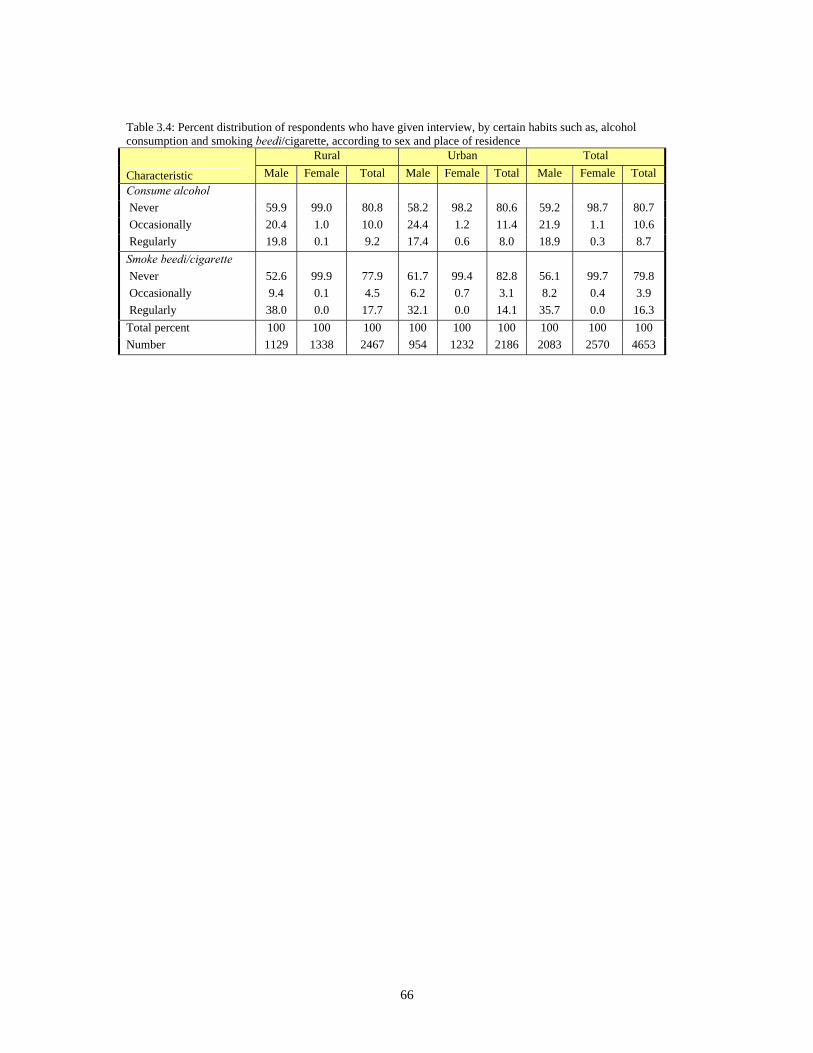
66
Table 3.4: Percent distribution of respondents who have given interview, by certain habits such as, alcohol consumption and smoking beedi/cigarette, according to sex and place of residence
Rural Urban Total
Characteristic Male Female Total Male Female Total Male Female Total Consume alcohol Never 59.9 99.0 80.8 58.2 98.2 80.6 59.2 98.7 80.7 Occasionally 20.4 1.0 10.0 24.4 1.2 11.4 21.9 1.1 10.6 Regularly 19.8 0.1 9.2 17.4 0.6 8.0 18.9 0.3 8.7 Smoke beedi/cigarette Never 52.6 99.9 77.9 61.7 99.4 82.8 56.1 99.7 79.8 Occasionally 9.4 0.1 4.5 6.2 0.7 3.1 8.2 0.4 3.9 Regularly 38.0 0.0 17.7 32.1 0.0 14.1 35.7 0.0 16.3 Total percent 100 100 100 100 100 100 100 100 100 Number 1129 1338 2467 954 1232 2186 2083 2570 4653

67
Table 3.5R: Percentage distribution of currently married RURAL respondents and their spouses, according to selected background characteristics
Male Female Total
Characteristic Respondent Spouse Respondent Spouse Respondent Spouse
Age <19 0.2 12.3 5.0 0.2 3.0 5.1 20-24 9.0 22.1 14.8 2.4 12.4 10.4 25-29 19.2 23.8 19.4 10.0 19.3 15.6 30-34 16.9 16.8 16.4 12.8 16.6 14.4 35-39 18.3 16.3 21.9 21.2 20.4 19.2 40-44 14.3 5.6 9.5 18.0 11.5 13.0 45-49 22.1 3.2 13.1 15.0 16.7 10.2 50+ 0.0 0.0 0.0 20.4 0.0 12.1 Missing 0.0 0.0 0.0 0.1 0.0 0.0 Literacy and education Illiterate 58.8 57.6 61.6 58.3 60.5 58.0 Primary 6.7 5.4 8.0 7.2 7.5 6.5 Middle 10.2 11.4 13.2 13.3 12.0 12.6 Secondary 9.5 9.5 9.6 5.9 9.6 7.4 Secondary+ 14.8 16.1 7.5 14.9 10.5 15.4 Missing 0.0 0.0 0.0 0.4 0.0 0.2 Occupation Cultivator 52.9 1.0 16.5 53.7 31.3 32.3 Agricultural labourer 9.3 3.2 7.2 4.6 8.1 4.0 Non-agricultural labourer 13.6 6.0 11.0 23.1 12.1 16.2 Business 14.2 1.2 2.2 9.2 7.0 6.0 Salaried employment 5.5 1.3 0.9 6.5 2.7 4.4 Housework 0.0 87.3 60.7 0.2 36.1 35.6 Student/Not working 0.0 0.0 0.2 1.3 0.1 0.8 Missing 4.4 0.0 1.4 1.3 2.6 0.8 Travel due to work Yes 39.5 2.0 7.1 22.7 20.2 14.3 No 60.5 98.0 92.9 77.3 79.7 85.7 Alcohol Never 47.4 98.9 54.0 78.0 Occasionally 23.7 1.0 16.5 10.2 Regularly 28.9 0.1 29.3 11.8 Don’t know 0.0 0.0 0.2 0.0 Smoking Never 39.9 99.8 48.0 75.5 Occasionally 11.1 0.2 7.8 4.6 Regularly 48.9 0.0 44.1 19.9 Don’t know 0.0 0.0 0.1 0.0 Total percent 100 100 100 100 100 100 Number 670 670 978 978 1648 1648

68
Table 3.5R (Contd.): Percentage distribution of currently married RURAL respondents and their spouses, according to selected background characteristics
Male Female Total
Characteristic Respondent Spouse Respondent Spouse Respondent Spouse
Extra-marital relationship Ever had 9.6 0.4 0.0 8.1 3.9 5.0 Never had 90.4 99.6 100.0 88.7 96.1 93.1 Don’t know 0.0 0.0 0.0 3.2 0.0 1.9 Commercial sex Ever had 1.4 0.0 2.4 0.6 Never had 98.6 100.0 95.3 99.4 Don’t know 0.0 0.0 2.2 0.0 Symptoms of STD Yes, ever had 0.8 14.0 2.2 8.6 No 99.2 86.0 97.8 91.4 Total percent 100 100 100 100 100 100 Number 670 670 978 978 1648 1648

69
Table 3.5U: Percentage distribution of currently married URBAN respondents and their spouses, according to selected background characteristics
Male Female Total
Characteristic Respondent Spouse Respondent Spouse Respondent Spouse
Age <19 0.3 6.6 2.8 0.0 1.9 2.6 20-24 4.0 21.5 16.9 2.6 11.9 9.9 25-29 14.4 29.5 23.5 11.4 20.0 18.4 30-34 24.6 18.2 17.7 20.0 20.3 19.3 35-39 24.1 15.3 17.6 19.5 20.1 17.9 40-44 15.8 7.4 12.4 15.7 13.7 12.5 45-49 16.8 0.9 9.1 14.5 12.1 9.2 50+ 0.0 0.2 0.0 16.1 0.0 9.9 Missing 0.0 0.3 0.0 0.2 0.0 0.2 Literacy and education Illiterate 36.8 35.3 33.7 27.0 34.9 30.2 Primary 6.3 4.6 3.9 7.6 4.8 6.4 Middle 15.0 16.0 17.1 16.7 16.3 16.4 Secondary 9.0 11.9 11.8 7.0 10.7 8.9 Secondary+ 33.0 32.2 33.5 41.5 33.3 37.9 Missing 0.0 0.0 0.0 0.1 0.0 0.1 Occupation Cultivator 9.0 2.1 1.2 5.6 4.2 4.2 Agricultural labourer 1.6 1.3 2.1 1.8 1.9 1.6 Non-agricultural labourer 24.7 3.3 10.9 27.4 16.2 18.1 Business 38.1 1.4 9.4 38.1 20.5 23.9 Salaried employment 24.4 4.3 5.9 23.5 13.0 16.1 Housework 0.1 86.8 69.3 0.2 42.5 33.7 Student/Not working 1.2 0.1 0.4 2.2 0.7 1.4 Missing 0.9 0.7 0.8 1.2 0.9 1.0 Travel due to work Yes 30.6 1.9 3.2 25.7 13.8 16.5 No 69.4 98.1 96.6 74.3 86.0 83.5 Alcohol Never 47.7 98.2 56.8 78.7 Occasionally 25.9 1.5 17.7 11.0 Regularly 26.4 0.3 25.3 10.4 Don’t know 0.0 0.0 0.2 0.0 Smoking Never 50.5 99.2 49.3 80.4 Occasionally 6.0 0.8 8.5 2.8 Regularly 43.5 0.0 41.2 16.9 Don’t know 0.0 0.0 0.9 0.0 Total percent 100 100 100 100 100 100 Number 522 522 861 861 1383 1383

70
Table 3.5U (Contd.): Percentage distribution of currently married URBAN respondents and their spouses, according to selected background characteristics
Male Female Total
Characteristic Respondent Spouse Respondent Spouse Respondent Spouse
Extra-marital relationship Ever had 5.9 0.6 0.2 5.9 2.4 3.8 Never had 94.1 96.8 99.9 91.8 97.6 93.7 Don’t know 2.6 2.4 2.4 Commercial sex Ever had 3.0 0.1 1.8 1.2 Never had 97.0 99.9 95.7 98.8 Don’t know 2.5 Symptoms of STD Yes, ever had 0.9 14.8 2.0 9.4 No 99.1 85.2 97.8 90.6 Total percent 100 100 100 100 100 100 Number 522 522 861 861 1383 1383

71
Table 3.5T: Percentage distribution of currently married TOTAL respondents and their spouses, according to selected background characteristics
Male Female Total
Characteristic Respondent Spouse Respondent Spouse Respondent Spouse
Age <19 0.2 10.2 4.1 0.1 2.6 4.1 20-24 7.1 21.9 15.6 2.5 12.2 10.2 25-29 17.4 25.9 21.0 10.6 19.6 16.7 30-34 19.8 17.3 16.9 15.6 18.0 16.3 35-39 20.5 15.9 20.2 20.5 20.3 18.7 40-44 14.9 6.3 10.6 17.1 12.3 12.8 45-49 20.1 2.3 11.5 14.8 15.0 9.8 50+ 0.0 0.1 0.0 18.7 0.0 11.3 Missing 0.0 0.1 0.0 0.1 0.0 0.1 Literacy and education Illiterate 50.6 49.2 50.6 46.0 50.6 47.3 Primary 6.6 5.1 6.4 7.4 6.5 6.5 Middle 12.0 13.2 14.8 14.7 13.6 14.1 Secondary 9.3 10.4 10.5 6.3 10.0 8.0 Secondary+ 21.6 22.1 17.7 25.3 19.3 24.0 Missing 0.0 0.0 0.0 0.3 0.0 0.2 Occupation Cultivator 36.5 1.4 10.5 34.8 20.8 21.5 Agricultural labourer 6.4 2.5 5.2 3.5 5.7 3.1 Non-agricultural labourer 17.8 5.0 11.0 24.8 13.7 16.9 Business 23.1 1.3 5.0 20.6 12.2 12.9 Salaried employment 12.6 2.5 2.8 13.2 6.7 8.9 Housework 0.1 87.1 64.1 0.2 38.6 34.8 Student/Not working 0.5 0.1 0.3 1.7 0.4 1.0 Missing 3.1 0.3 1.1 1.3 1.9 0.9 Travel due to work Yes 36.2 2.0 5.6 23.8 17.8 15.1 No 63.8 98.0 94.3 76.2 82.2 84.9 Alcohol Never 47.5 98.6 55.1 78.3 Occasionally 24.5 1.2 17.0 10.5 Regularly 28.0 0.1 27.7 11.2 Don’t know 0.0 0.0 0.2 0.0 Smoking Never 43.9 99.6 48.5 77.4 Occasionally 9.2 0.4 8.1 3.9 Regularly 46.9 0.0 43.0 18.7 Don’t know 0.0 0.0 0.4 0.0 Total percent 100 100 100 100 100 100 Number 1192 1192 1839 1839 3,031 3,031

72
Table 3.5T (Contd.): Percentage distribution of currently married TOTAL respondents and their spouses, according to selected background characteristics
Male Female Total
Characteristic Respondent Spouse Respondent Spouse Respondent Spouse
Extra-marital relationship Ever had 8.2 0.5 0.1 7.2 3.3 4.6 Never had 91.8 98.5 99.9 89.9 96.7 93.3 Don’t know 1.0 2.9 2.1 Commercial sex Ever had 2.0 0.0 2.2 0.8 Never had 98.0 100.0 95.5 99.2 Don’t know 0.0 0.0 2.3 0.0 Symptoms of STD Yes, ever had 0.8 14.3 2.1 8.9 No 99.2 85.7 97.0 91.1 Total percent 100 100 100 100 100 100 Number 1192 1192 1839 1839 3031 3031

73
Table 4.1: Percentage distribution of respondents who have ever heard of HIV/AIDS, according to selected background characteristics
Characteristic Yes No Don't know Total
percent Number Place of residence Rural 84.8 9.0 6.2 100 2467 Urban 93.4 4.2 2.4 100 2186 Sex Male 84.8 7.6 7.6 100 2083 Female 91.2 6.6 2.2 100 2570 Age 15-19 93.0 4.7 2.4 100 762 20-24 93.5 4.1 2.5 100 830 25-29 89.6 7.7 2.6 100 776 30-34 86.4 7.5 6.2 100 644 35-39 86.0 9.1 4.9 100 674 40-44 86.2 8.4 5.4 100 493 45-49 77.9 10.2 11.9 100 474 Marital status Currently married 86.6 8.1 5.4 100 3031 Marriage dissolved 85.6 10.2 4.3 100 206 Never married 92.6 4.4 3.0 100 1416 Literacy and education Illiterate 78.8 12.2 9.0 100 1728 Primary 87.2 8.0 4.9 100 217 Middle 92.1 5.3 2.6 100 607 Secondary 92.6 5.0 2.4 100 531 Secondary+ 98.4 1.3 0.3 100 1570 Occupation Cultivator 81.3 8.6 10.1 100 698 Agricultural labourer 77.5 10.9 11.6 100 179 Non-agricultural labourer 80.0 13.7 6.3 100 687 Business 88.7 8.1 3.2 100 627 Salaried employment 97.3 1.6 1.1 100 397 Housework 93.3 5.5 1.2 100 1573 Student 98.4 0.6 1.1 100 456 Religion Hindu 88.0 7.2 4.8 100 4134 Muslim 90.7 6.0 3.4 100 478 Other 92.9 2.9 4.2 100 40 Caste/Tribe Scheduled Caste 84.0 7.7 8.4 100 789 Scheduled Tribe 86.3 9.2 4.5 100 898 Other 90.3 6.2 3.5 100 2965 Total 88.3 7.1 4.7 100 4653 Note: Total includes cases with missing information on occupation, religion and caste/tribe.
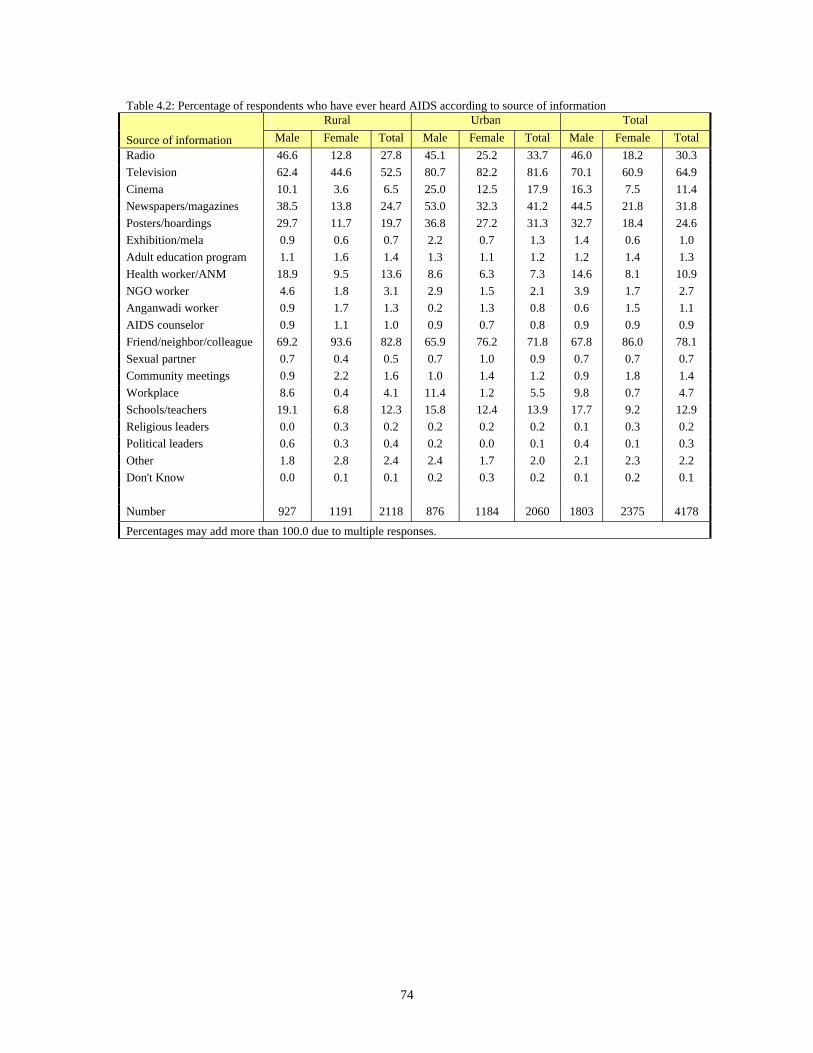
74
Table 4.2: Percentage of respondents who have ever heard AIDS according to source of information Rural Urban Total
Source of information Male Female Total Male Female Total Male Female Total Radio 46.6 12.8 27.8 45.1 25.2 33.7 46.0 18.2 30.3 Television 62.4 44.6 52.5 80.7 82.2 81.6 70.1 60.9 64.9 Cinema 10.1 3.6 6.5 25.0 12.5 17.9 16.3 7.5 11.4 Newspapers/magazines 38.5 13.8 24.7 53.0 32.3 41.2 44.5 21.8 31.8 Posters/hoardings 29.7 11.7 19.7 36.8 27.2 31.3 32.7 18.4 24.6 Exhibition/mela 0.9 0.6 0.7 2.2 0.7 1.3 1.4 0.6 1.0 Adult education program 1.1 1.6 1.4 1.3 1.1 1.2 1.2 1.4 1.3 Health worker/ANM 18.9 9.5 13.6 8.6 6.3 7.3 14.6 8.1 10.9 NGO worker 4.6 1.8 3.1 2.9 1.5 2.1 3.9 1.7 2.7 Anganwadi worker 0.9 1.7 1.3 0.2 1.3 0.8 0.6 1.5 1.1 AIDS counselor 0.9 1.1 1.0 0.9 0.7 0.8 0.9 0.9 0.9 Friend/neighbor/colleague 69.2 93.6 82.8 65.9 76.2 71.8 67.8 86.0 78.1 Sexual partner 0.7 0.4 0.5 0.7 1.0 0.9 0.7 0.7 0.7 Community meetings 0.9 2.2 1.6 1.0 1.4 1.2 0.9 1.8 1.4 Workplace 8.6 0.4 4.1 11.4 1.2 5.5 9.8 0.7 4.7 Schools/teachers 19.1 6.8 12.3 15.8 12.4 13.9 17.7 9.2 12.9 Religious leaders 0.0 0.3 0.2 0.2 0.2 0.2 0.1 0.3 0.2 Political leaders 0.6 0.3 0.4 0.2 0.0 0.1 0.4 0.1 0.3 Other 1.8 2.8 2.4 2.4 1.7 2.0 2.1 2.3 2.2 Don't Know 0.0 0.1 0.1 0.2 0.3 0.2 0.1 0.2 0.1 Number 927 1191 2118 876 1184 2060 1803 2375 4178
Percentages may add more than 100.0 due to multiple responses.
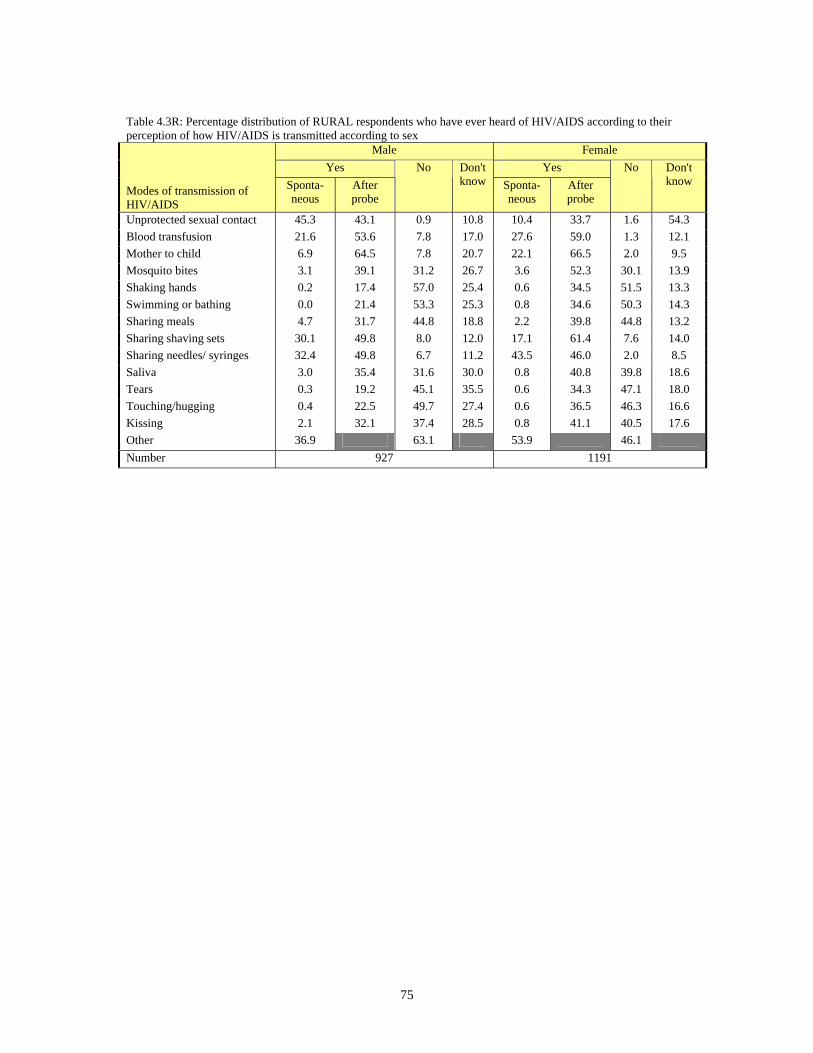
75
Table 4.3R: Percentage distribution of RURAL respondents who have ever heard of HIV/AIDS according to their perception of how HIV/AIDS is transmitted according to sex
Male Female Yes Yes
Modes of transmission of HIV/AIDS
Sponta-neous
After probe
No Don't know Sponta-
neous After probe
No Don't know
Unprotected sexual contact 45.3 43.1 0.9 10.8 10.4 33.7 1.6 54.3 Blood transfusion 21.6 53.6 7.8 17.0 27.6 59.0 1.3 12.1 Mother to child 6.9 64.5 7.8 20.7 22.1 66.5 2.0 9.5 Mosquito bites 3.1 39.1 31.2 26.7 3.6 52.3 30.1 13.9 Shaking hands 0.2 17.4 57.0 25.4 0.6 34.5 51.5 13.3 Swimming or bathing 0.0 21.4 53.3 25.3 0.8 34.6 50.3 14.3 Sharing meals 4.7 31.7 44.8 18.8 2.2 39.8 44.8 13.2 Sharing shaving sets 30.1 49.8 8.0 12.0 17.1 61.4 7.6 14.0 Sharing needles/ syringes 32.4 49.8 6.7 11.2 43.5 46.0 2.0 8.5 Saliva 3.0 35.4 31.6 30.0 0.8 40.8 39.8 18.6 Tears 0.3 19.2 45.1 35.5 0.6 34.3 47.1 18.0 Touching/hugging 0.4 22.5 49.7 27.4 0.6 36.5 46.3 16.6 Kissing 2.1 32.1 37.4 28.5 0.8 41.1 40.5 17.6 Other 36.9 63.1 53.9 46.1 Number 927 1191

76
Table 4.3U: Percentage distribution of URBAN respondents who have ever heard of HIV/AIDS according to their perception of how HIV/AIDS is transmitted according to sex
Male Female Yes Yes
Modes of transmission of HIV/AIDS
Sponta-neous
After probe
No Don't know Sponta-
neous After probe
No Don't know
Unprotected sexual contact 58.7 35.2 1.2 5.0 17.3 45.3 4.9 32.5 Blood transfusion 41.2 46.4 4.3 8.1 44.2 44.6 2.9 8.3 Mother to child 10.6 60.3 14.9 14.3 24.7 62.2 5.0 8.2 Mosquito bites 1.8 33.1 49.0 16.0 1.9 31.9 51.1 15.1 Shaking hands 0.1 9.4 77.2 13.3 1.1 18.1 69.1 11.7 Swimming or bathing 0.3 13.3 72.7 13.7 0.7 18.8 66.9 13.6 Sharing meals 1.2 17.5 69.0 12.3 2.1 21.7 63.4 12.9 Sharing shaving sets 36.0 49.4 9.2 5.4 20.8 56.3 10.8 12.1 Sharing needles/ syringes 48.0 44.3 4.1 3.6 59.8 31.0 2.2 7.0 Saliva 2.0 25.8 52.2 20.1 1.5 24.0 58.0 16.4 Tears 0.2 11.2 66.4 22.2 0.2 18.2 65.2 16.4 Touching/hugging 0.7 12.4 72.2 14.7 0.4 18.8 66.6 14.2 Kissing 1.2 20.4 62.0 16.4 0.6 23.7 58.1 17.7 Other 34.5 65.5 56.6 43.4 Number 876 1184

77
Table 4.3T: Percentage distribution of TOTAL respondents who have ever heard of HIV/AIDS according to their perception of how HIV/AIDS is transmitted according to sex
Male Female Yes Yes
Modes of transmission of HIV/AIDS
Sponta-neous
After probe
No Don't know Sponta-
neous After probe
No Don't know
Unprotected sexual contact 50.9 39.8 1.0 8.3 13.4 38.7 3.1 44.9 Blood transfusion 29.8 50.6 6.4 13.3 34.8 52.7 2.0 10.5 Mother to child 8.5 62.7 10.8 18.0 23.2 64.6 3.3 8.9 Mosquito bites 2.5 36.6 38.7 22.2 2.9 43.5 39.2 14.4 Shaking hands 0.2 14.1 65.5 20.3 0.8 27.4 59.2 12.6 Swimming or bathing 0.1 18.0 61.4 20.5 0.7 27.7 57.5 14.0 Sharing meals 3.2 25.7 54.9 16.1 2.1 32.0 52.9 13.1 Sharing shaving sets 32.6 49.7 8.5 9.2 18.7 59.2 9.0 13.2 Sharing needles/ syringes 38.9 47.5 5.6 8.0 50.6 39.5 2.1 7.8 Saliva 2.6 31.4 40.2 25.8 1.1 33.5 47.7 17.7 Tears 0.2 15.8 54.0 29.9 0.4 27.3 55.0 17.3 Touching/hugging 0.5 18.3 59.1 22.1 0.5 28.8 55.1 15.6 Kissing 1.7 27.2 47.7 23.4 0.7 33.5 48.1 17.7 Other 35.9 64.1 55.1 44.9 Number 1803 2375

78
Table 4.3T: Percentage distribution of TOTAL respondents who have ever heard of HIV/AIDS according to their perception of how HIV/AIDS is transmitted according to place of residence
Rural Urban Yes Yes
Modes of transmission of HIV/AIDS
Sponta-neous
After probe
No Don't know Sponta-
neous After probe
No Don't know
Unprotected sexual contact 25.9 37.9 1.3 35.0 35.0 41.0 3.3 20.7 Blood transfusion 24.9 56.6 4.2 14.3 42.9 45.4 3.5 8.2 Mother to child 15.3 65.6 4.6 14.5 18.6 61.4 9.2 10.8 Mosquito bites 3.4 46.4 30.6 19.6 1.9 32.4 50.2 15.5 Shaking hands 0.4 26.9 54.0 18.7 0.7 14.4 72.6 12.4 Swimming or bathing 0.4 28.7 51.7 19.2 0.5 16.4 69.4 13.7 Sharing meals 3.3 36.2 44.8 15.7 1.7 19.9 65.8 12.6 Sharing shaving sets 22.9 56.3 7.8 13.1 27.3 53.3 10.1 9.2 Sharing needles/ syringes 38.6 47.7 4.1 9.7 54.7 36.7 3.0 5.6 Saliva 1.8 38.4 36.1 23.7 1.7 24.8 55.5 18.0 Tears 0.5 27.6 46.2 25.8 0.2 15.2 65.7 18.9 Touching/hugging 0.5 30.3 47.8 21.4 0.5 16.0 69.0 14.4 Kissing 1.4 37.1 39.1 22.4 0.9 22.3 59.8 17.1 Other 46.4 53.6 47.1 52.9 Number 2118 2060

79
Table 4.4: Among the respondents who have some knowledge about HIV/AIDS, the percentage who have specific misconceptions about transmission of HIV/AIDS, according to selected background characteristics Characteristics
Any one misconception
Any two misconceptions
Any three misconceptions
More than three misconceptions
Number
Sex Male 57.0 38.4 30.0 23.8 1803 Female 57.4 37.5 33.1 30.4 2375 Place of residence Rural 64.6 45.4 39.2 34.1 2118 Urban 47.4 27.9 21.8 18.8 2060 Age 15-19 51.6 32.8 27.2 23.7 716 20-24 53.5 28.9 23.4 19.6 775 25-29 57.7 39.8 31.0 27.6 706 30-34 60.6 41.6 34.7 31.1 568 35-39 61.7 44.0 38.4 33.5 590 40-44 55.9 35.8 31.1 28.4 428 45-49 64.1 49.4 43.8 35.2 395 Marital status Currently married 60.8 41.0 35.1 30.7 2671 Marriage dissolved 60.9 45.5 42.3 40.4 182 Never married 49.0 30.2 23.2 19.0 1325 Literacy and education Illiterate 65.7 48.4 42.7 38.5 1381 Primary 67.2 53.1 45.9 43.4 189 Middle 60.7 38.9 32.3 29.3 563 Secondary 56.6 32.9 28.4 23.2 498 Secondary+ 45.0 25.2 18.2 13.6 1547 Occupation Cultivator 63.6 49.9 43.9 38.9 578 Agricultural labourer 75.1 56.1 55.4 39.4 131 Non-agricultural labourer 59.6 44.8 36.6 33.2 563 Business 53.7 29.6 23.1 19.7 562 Salaried employment 53.6 33.5 22.9 16.4 388 Housework 55.4 33.3 29.4 27.0 1478 Student 44.6 25.2 17.1 14.2 446 Religion Hindu 58.7 39.2 32.9 28.6 3706 Muslim 44.5 26.0 20.3 17.5 433 Other 28.7 13.4 13.4 6.7 38 Caste/Tribe Scheduled Caste 63.5 44.7 39.3 33.7 682 Scheduled Tribe 61.5 43.3 35.1 30.1 786 Other 54.1 34.2 28.5 24.9 2709 Total 57.3 37.9 31.7 27.5 4178 Note: Total includes cases with missing information on occupation, religion and caste/tribe. The misconceptions are: Mosquito bites, Shaking hands, Swimming or bathing, Sharing meals, Saliva, Tears, Touching or hugging and kissing

80
Table 4.5R: Percentage distribution of RURAL respondents who have ever heard of HIV/AIDS according to their perception of ways of preventing HIV/AIDS according to sex
Male Female Yes Yes
Modes of preventing HIV/AIDS
Sponta-neous
After probe
No Don't know Sponta-
neous After probe
No Don't know
Missing
Take medicine or herbal mixture before sex
0.9 2.7 39.0 57.4 0.9 15.6 30.1 53.4 0.0
Always use condoms 17.3 8.2 27.1 47.4 5.8 36.3 26.1 31.7 0.0 Avoid sharing injection needles
12.1 15.1 26.8 46.0 37.8 29.8 25.3 7.1 0.0
Don’t share clothes or eating utensils
0.1 8.3 41.4 50.3 0.6 21.2 68.8 9.4 0.0
Avoid mosquito/insect bites
0.1 9.9 40.5 49.5 1.3 37.9 49.8 11.0 0.0
Eat nutritious food 0.4 10.2 40.8 48.6 8.0 38.1 42.6 11.2 0.0 Have sex only with one faithful partner
13.4 14.0 26.7 45.9 65.7 4.5 24.9 4.8 0.1
Other 7.2 92.8 0.0 100.0 Number 927 1191

81
Table 4.5U: Percentage distribution of URBAN respondents who have ever heard of HIV/AIDS according to their perception of ways of preventing HIV/AIDS according to sex
Male Female Yes Yes
Modes of preventing HIV/AIDS
Spont-aneous
After probe
No Don't know
MissingSpont-aneous
After probe
No Don't know
Missing
Take medicine or herbal mixture before sex
0.6 3.6 43.5 52.2 0.2 0.9 15.5 37.7 45.9 0.0
Always use condoms 27.9 7.1 21.3 43.6 0.2 18.3 41.1 23.1 17.5 0.0 Avoid sharing injection needles
19.2 16.1 21.6 43.0 0.2 55.9 17.9 20.4 5.7 0.0
Don’t share clothes or eating utensils
0.1 3.5 49.9 46.4 0.2 1.2 13.5 76.2 9.1 0.0
Avoid mosquito/insect bites
0.3 7.2 46.3 46.0 0.2 1.9 22.2 65.2 10.8 0.0
Eat nutritious food 0.3 9.0 44.9 45.6 0.2 5.3 33.6 50.5 10.6 0.0 Have sex only with one faithful partner
17.1 18.0 21.3 43.4 0.2 59.6 12.8 21.6 5.8 0.2
Other 0.0 99.8 0.2 0.0 100.0 0.0 Number 876 1184

82
Table 4.5T: Percentage distribution of TOTAL respondents who have ever heard of HIV/AIDS according to their perception of ways of preventing HIV/AIDS according to sex
Male Female Yes Yes
Modes of preventing HIV/AIDS
Spont-aneous
After probe
No Don't know
MissingSpont-aneous
After probe
No Don't know
Missing
Take medicine or herbal mixture before sex
0.8 3.1 40.9 55.2 0.1 0.9 15.6 33.4 50.1 0.0
Always use condoms 21.7 7.8 24.7 45.8 0.1 11.2 38.4 24.8 25.6 0.0 Avoid sharing injection needles
15.1 15.5 24.6 44.8 0.1 45.7 24.7 23.2 6.5 0.0
Don’t share clothes or eating utensils
0.1 6.2 45.0 48.6 0.1 0.8 17.9 72.0 9.3 0.0
Avoid mosquito/insect bites
0.2 8.8 42.9 48.1 0.1 1.6 31.0 56.5 10.9 0.0
Eat nutritious food 0.3 9.7 42.5 47.4 0.1 6.8 36.2 46.1 10.9 0.0 Have sex only with one faithful partner
15.0 15.7 24.5 44.8 0.1 63.1 8.1 23.5 5.2 0.1
Other 4.2 95.8 0.1 0.0 100.0 0.0 Number 1803 2375

83
Table 4.5T: Percentage distribution of TOTAL respondents who have ever heard of HIV/AIDS according to their perception of ways of preventing HIV/AIDS according place of residence
Rural Urban Yes Yes
Modes of preventing HIV/AIDS
Spont-aneous
After probe
No Don't know
Missing Spont-aneous
After probe
No Don't know
Missing
Take medicine or herbal mixture before sex
0.9 9.9 34.1 55.2 0.0 0.8 10.4 40.2 48.6 0.1
Always use condoms 10.9 23.9 26.6 38.7 0.0 22.4 26.6 22.3 28.7 0.1 Avoid sharing injection needles
26.4 23.3 26.0 24.4 0.0 40.2 17.1 20.9 21.7 0.1
Don’t share clothes or eating utensils
0.4 15.5 56.7 27.5 0.0 0.7 9.2 64.9 25.1 0.1
Avoid mosquito/insect bites
0.8 25.4 45.7 28.1 0.0 1.2 15.8 57.1 25.9 0.1
Eat nutritious food 4.6 25.7 41.8 27.8 0.0 3.1 23.1 48.1 25.6 0.1 Have sex only with one faithful partner
42.5 8.7 25.7 23.0 0.0 41.4 15.0 21.5 21.9 0.2
Other 3.2 96.8 0.0 99.9 0.1 Number 2118 2060

84
Table 4.6: Percentage of respondents by their knowledge about prevention of HIV/AIDS transmission, according to selected background characteristics
Percent who know HIV/AIDS transmission can be prevented
Characteristic By having only one
faithful partner By using condom
every time
Knows the two ways
Know at least one Number
Sex Male 26.0 25.0 23.9 27.1 2083 Female 65.3 45.4 44.3 66.4 2570 Place of residence Rural 43.7 29.5 28.9 44.3 2467 Urban 52.8 45.9 44.0 54.7 2186 Age 15-19 46.6 36.7 34.2 49.1 762 20-24 51.2 44.8 43.9 52.1 830 25-29 49.9 39.9 38.6 51.2 776 30-34 47.9 35.9 34.6 49.2 644 35-39 48.4 34.5 34.1 48.8 674 40-44 50.2 32.8 32.2 50.8 493 45-49 34.0 20.9 20.5 34.4 474 Marital status Currently married 47.8 34.9 34.2 48.5 3031 Marriage dissolved 56.7 32.4 31.6 57.5 206 Never married 45.3 39.5 37.5 47.3 1416 Literacy and education Illiterate 36.6 20.1 19.9 36.7 1728 Primary 37.6 30.1 29.6 38.0 217 Middle 43.3 30.6 29.7 44.3 607 Secondary 53.5 42.8 41.3 54.9 531 Secondary+ 63.7 59.6 57.1 66.3 1570 Occupation Cultivator 30.7 23.1 22.4 31.4 698 Agricultural labourer 35.2 12.0 12.0 35.2 179 Non-agricultural labourer 29.2 19.2 18.5 30.0 687 Business 36.0 28.9 28.1 36.8 627 Salaried employment 53.3 51.7 49.4 55.6 397 Housework 67.5 49.8 48.7 68.6 1573 Student 58.4 52.8 49.5 61.7 456 Religion Hindu 48.0 36.3 35.3 49.0 4134 Muslim 36.9 30.7 28.1 39.5 478 Other 79.9 78.5 78.5 79.9 40 Caste/Tribe Scheduled Caste 43.1 32.5 32.0 43.6 789 Scheduled Tribe 45.9 32.6 32.0 46.5 898 Other 49.3 38.4 37.0 50.7 2965 Total 47.4 36.1 35.0 48.5 4653 Note: Total includes cases with missing information on occupation, religion and caste/tribe.

85
Table 4.7: Among respondents who have ever heard of HIV/AIDS, the percentage who feels that they are at risk of being infected with HIV
Characteristic Yes No Don't know Total
percent Number Place of residence Rural 1.0 95.8 3.2 100 2118 Urban 0.8 96.0 3.2 100 2059 Sex Male 0.7 97.0 2.3 100 1802 Female 1.0 95.0 4.0 100 2375 Age 15-19 0.4 95.5 4.1 100 716 20-24 0.9 97.3 1.8 100 775 25-29 2.3 95.1 2.5 100 705 30-34 0.9 94.9 4.2 100 568 35-39 0.3 96.6 3.2 100 590 40-44 0.4 94.1 5.5 100 428 45-49 0.5 97.4 2.1 100 395 Marital status Currently married 1.1 95.7 3.2 100 2670 Marriage dissolved 0.4 93.7 5.9 100 182 Never married 0.5 96.7 2.8 100 1325 Literacy and education Illiterate 0.4 95.5 4.1 100 1381 Primary 0.7 96.0 3.3 100 189 Middle 0.4 96.4 3.2 100 562 Secondary 3.7 92.8 3.5 100 498 Secondary+ 0.7 97.2 2.1 100 1547 Occupation Cultivator 0.7 96.3 2.9 100 578 Agricultural labourer 0.0 95.2 4.8 100 131 Non-agricultural labourer 0.7 95.3 4.0 100 563 Business 0.7 95.6 3.7 100 561 Salaried employment 0.6 96.4 3.0 100 388 Housework 1.5 95.2 3.3 100 1478 Student 0.5 98.2 1.4 100 446 Religion Hindu 0.9 96.0 3.1 100 3706 Muslim 0.6 94.6 4.9 100 432 Other 0.0 98.5 1.5 100 38 Caste/Tribe Scheduled Caste 1.3 96.8 1.9 100 682 Scheduled Tribe 0.4 95.9 3.6 100 786 Other 0.9 95.6 3.5 100 2708 Total 0.9 95.9 3.2 100 4177 Note: Total includes cases with missing information on occupation, religion and caste/tribe.

86
Table 4.8R: Percentage of RURAL respondents who have reported to have undergone an HIV test (among who have ever heard of HIV/AIDS), according to selected background characteristics
Male Female Total
Characteristic Percent Number Percent Number Percent Number Age 15-19 1.4 159 3.0 212 2.2 371 20-24 9.0 194 10.2 180 9.5 374 25-29 2.9 163 2.8 205 2.8 368 30-34 5.1 101 2.2 164 3.2 265 35-39 0.8 119 1.4 191 1.2 310 40-44 6.6 94 0.0 112 2.9 206 45-49 0.5 94 0.3 123 0.4 217 Marital status Currently married 5.0 516 3.5 861 4.1 1377 Marriage dissolved 0.0 4 2.3 95 2.2 99 Never married 2.8 404 1.3 231 2.3 635 Literacy and education Illiterate 6.0 324 1.7 596 3.2 920 Primary 0.0 59 2.6 55 1.5 114 Middle 2.2 107 3.7 153 3.1 260 Secondary 2.7 126 3.8 156 3.3 282 Secondary+ 3.9 308 7.1 227 5.0 535 Occupation Cultivator 2.3 420 0.0 107 1.8 527 Agricultural labourer 0.0 53 1.6 57 0.9 110 Non-agricultural labourer 0.0 114 0.0 152 0.0 266 Business 17.0 148 1.0 37 13.2 185 Salaried employment 5.3 75 4.3 21 5.1 96 Housework 0.0 3 4.7 731 4.7 734 Student 1.3 102 0.0 73 0.9 175 Religion Hindu 4.0 900 3.1 1164 3.5 2064 Muslim 3.8 22 4.1 22 3.9 44 Other 0.0 2 Nil Nil 0.0 2 Caste/Tribe Scheduled Caste 8.2 184 1.4 271 4.3 455 Scheduled Tribe 6.1 200 1.4 261 3.5 461 Other 1.3 540 4.6 654 3.1 1194 Travel due to work Yes 6.2 432 0.8 62 5.3 494 No 2.3 492 3.2 1124 2.9 1616 Total 4.0 924 3.1 1187 3.5 2111 Note: Total includes cases with missing information on occupation, religion, caste/tribe and travel due to work.

87
Table 4.8U: Percentage of URBAN respondents who have reported to have undergone an HIV test (among who have ever heard of HIV/AIDS), according to selected background characteristics
Male Female Total
Characteristic Percent Number Percent Number Percent Number Age 15-19 0.0 147 1.8 191 1.0 338 20-24 0.4 193 9.2 205 5.1 398 25-29 4.9 123 14.8 213 11.2 336 30-34 9.4 134 4.2 166 6.5 300 35-39 4.5 114 1.4 165 2.7 279 40-44 8.1 83 0.9 139 3.7 222 45-49 2.9 81 2.4 97 2.6 178 Marital status Currently married 5.6 468 7.9 819 7.0 1287 Marriage dissolved 0.0 3 2.0 80 1.9 83 Never married 1.8 404 0.6 277 1.3 681 Literacy and education Illiterate 1.9 178 2.0 277 1.9 455 Primary 4.2 37 1.8 38 3.0 75 Middle 3.1 112 5.5 185 4.6 297 Secondary 4.2 83 5.0 132 4.7 215 Secondary+ 4.9 465 8.9 544 7.0 1009 Occupation Cultivator 6.3 42 0.0 8 5.2 50 Agricultural labourer 0.0 4 0.0 17 0.0 21 Non-agricultural labourer 2.0 187 5.0 107 3.1 294 Business 4.7 279 5.0 97 4.8 376 Salaried employment 6.2 216 7.6 75 6.6 291 Housework 0.0 2 7.1 735 7.1 737 Student 0.6 137 0.7 131 0.6 268 Religion Hindu 4.2 712 5.8 918 5.1 1630 Muslim 2.2 148 5.3 237 4.1 385 Other 3.9 15 9.6 21 7.4 36 Caste/Tribe Scheduled Caste 5.3 98 3.7 126 4.4 224 Scheduled Tribe 4.0 144 5.6 176 4.8 320 Other 3.6 633 6.1 874 5.1 1507 Travel due to work Yes 6.6 225 8.7 34 6.9 259 No 2.8 650 5.6 1139 4.6 1789 Total 3.9 875 5.8 1176 5.0 2051 Note: Total includes cases with missing information on occupation and travel due to work.

88
Table 4.8T: Percentage of TOTAL respondents who have reported to have undergone an HIV test (among who have ever heard of HIV/AIDS), according to selected background characteristics
Male Female Total
Characteristic Percent Number Percent Number Percent Number Place of residence Rural 4.0 924 3.1 1187 3.5 2111 Urban 3.9 875 5.8 1176 5.0 2051 Age 15-19 0.9 306 2.5 403 1.7 709 20-24 5.6 387 9.7 385 7.6 772 25-29 3.6 286 8.2 418 6.2 704 30-34 7.4 235 3.1 330 4.8 565 35-39 2.5 233 1.4 356 1.8 589 40-44 7.3 177 0.5 251 3.3 428 45-49 1.4 175 1.0 220 1.2 395 Marital status Currently married 5.3 984 5.3 1680 5.3 2664 Marriage dissolved 0.0 7 2.2 175 2.0 182 Never married 2.4 808 0.9 508 1.8 1316 Literacy and education Illiterate 4.7 502 1.7 873 2.8 1375 Primary 1.6 96 2.4 93 2.0 189 Middle 2.6 219 4.5 338 3.7 557 Secondary 3.2 209 4.3 288 3.8 497 Secondary+ 4.4 773 8.4 771 6.2 1544 Occupation Cultivator 2.7 462 0.0 115 2.0 577 Agricultural labourer 0.0 57 1.2 74 0.8 131 Non-agricultural labourer 1.1 301 2.1 259 1.6 560 Business 9.0 427 3.7 134 7.7 561 Salaried employment 6.0 291 6.8 96 6.2 387 Housework 0.0 5 5.8 1466 5.7 1471 Student 0.9 239 0.4 204 0.7 443 Religion Hindu 4.1 1612 4.1 2082 4.1 3694 Muslim 2.3 170 5.3 259 4.1 429 Other 3.7 17 9.6 21 7.2 38 Caste/Tribe Scheduled Caste 7.5 282 1.9 397 4.3 679 Scheduled Tribe 5.4 344 2.7 437 3.9 781 Other 2.5 1173 5.4 1528 4.1 2701 Travel due to work Yes 6.3 657 2.7 96 5.7 753 No 2.5 1142 4.3 2263 3.7 3405 Total 4.0 1799 4.2 2363 4.1 4162 Note: Total includes cases with missing information on occupation, religion, caste/tribe and travel due to work.

89
Table 4.9R: Among RURAL respondents who ever taken HIV test, percent reported to know the result of last test, by sex and other background characteristics
Male Female Total
Characteristic Percent Number Percent Number Percent Number Age 15-19 100.0 1 93.7 6 95.7 7 20-24 17.1 6 98.0 19 55.7 25 25-29 100.0 4 68.9 5 83.3 9 30-34 86.5 6 71.0 6 79.6 12 35-39 100.0 1 100.0 2 100.0 3 40-44 100.0 3 Nil Nil 100.0 3 45-49 100.0 2 100.0 1 100.0 3 Marital status Currently married 42.6 11 91.1 35 69.0 46 Marriage dissolved Nil Nil 55.0 3 55.0 3 Never married 87.7 12 100.0 1 90.0 13 Literacy and education Illiterate 24.6 6 79.5 11 43.3 17 Primary Nil Nil 100.0 1 100.0 1 Middle 100.0 1 94.0 5 95.8 6 Secondary 100.0 5 100.0 6 100.0 11 Secondary+ 86.0 11 91.3 16 88.6 27 Occupation Cultivator 94.1 13 Nil Nil 94.1 13 Agricultural labourer Nil Nil 71.0 2 71.0 2 Non-agricultural labourer Nil Nil Nil Nil Nil Nil Business 27.3 3 0.0 1 26.9 4 Salaried employment 56.1 5 50.0 2 55.0 7 Housework Nil Nil 92.6 33 92.6 33 Student 100.0 1.0 Nil Nil 100.0 1 Religion Hindu 55.6 22 90.1 38 72.4 60 Muslim 100.0 1 100.0 1 100.0 2 Caste/Tribe Scheduled Caste 18.5 5 100.0 6 33.5 11 Scheduled Tribe 98.0 9 90.5 7 96.3 16 Other 73.8 9 88.7 26 85.9 35 Travel due to work Yes 37.6 10 50.0 2 38.0 12 No 94.8 13 91.0 37 92.0 50 Total 56.0 23 90.2 39 72.7 62 Note: Total includes cases with missing information on occupation.

90
Table 4.9U: Among URBAN respondents who ever taken HIV test, percent reported to know the result of last test, by sex and other background characteristics
Male Female Total
Characteristic Percent Number Percent Number Percent Number Age 15-19 Nil Nil 100.0 5 100.0 5 20-24 100.0 1 85.1 19 85.7 20 25-29 60.6 6 83.2 34 79.5 40 30-34 100.0 11 83.7 10 94.2 21 35-39 86.6 7 73.4 3 82.7 10 40-44 91.4 7 100.0 2 92.6 9 45-49 100.0 2 100.0 4 100.0 6 Marital status Currently married 92.6 26 84.4 73 86.8 99 Marriage dissolved Nil Nil 100.0 2 100.0 2 Never married 75.4 8 100.0 2 80.0 10 Literacy and education Illiterate 100.0 3 100.0 6 100.0 9 Primary 100.0 1.0 100.0 1 100.0 2 Middle 80.1 3 81.6 12 81.2 15 Secondary 80.7 5 88.9 7 86.0 12 Secondary+ 89.2 22 83.0 51 85.0 73 Occupation Cultivator 100.0 2 Nil Nil 100.0 2 Agricultural labourer Nil Nil Nil Nil Nil Nil Non-agricultural labourer 81.6 5 100.0 7 92.7 12 Business 95.6 14 100.0 4 96.8 18 Salaried employment 81.0 12 100.0 7 86.5 19 Housework Nil Nil 80.1 58 80.1 58 Student 100.0 1 100.0 1 100.0 2 Religion Hindu 89.7 31 83.2 63 85.5 94 Muslim 100.0 2 91.2 13 93.1 15 Other 0.0 1 100.0 1 79.3 2 Caste/Tribe Scheduled Caste 100.0 5 100.0 5 100.0 10 Scheduled Tribe 70.9 4 72.8 12 72.0 16 Other 91.4 25 86.0 60 87.6 85 Travel due to work Yes 96.5 16 100.0 4 97.0 20 No 82.1 18 84.3 72 83.8 90 Total 89.1 34 85.1 77 86.5 111 Note: Total includes cases with missing information on travel due to work.

91
Table 4.9T: Among TOTAL respondents who ever taken HIV test, percent reported to know the result of last test, by sex and other background characteristics
Male Female Total
Characteristic Percent Number Percent Number Percent Number
Place of residence
Rural 56.0 23 90.2 39 72.7 62
Urban 89.1 34 85.1 77 86.5 111 Age 15-19 100.0 1 95.7 11 96.7 12 20-24 19.4 7 92.0 38 64.7 45 25-29 80.5 10 80.5 39 80.5 49 30-34 95.7 17 78.6 16 89.1 33 35-39 88.8 8 90.2 5 89.5 13 40-44 95.7 10 100.0 2 96.0 12 45-49 100.0 4 100.0 5 100.0 9 Marital status Currently married 64.6 37 87.0 108 78.8 145 Marriage dissolved Nil Nil 74.5 5 74.5 5 Never married 83.7 20 100.0 3 86.8 23 Literacy and education Illiterate 34.5 9 86.1 17 55.1 26 Primary 100.0 1 100.0 2 100.0 3 Middle 89.7 4 87.1 17 87.8 21 Secondary 90.7 10 94.7 13 93.3 23 Secondary+ 87.8 33 85.2 67 86.2 100 Occupation Cultivator 95.3 15 Nil Nil 95.3 15 Agricultural labourer Nil Nil 71.0 2 71.0 2 Non-agricultural labourer 81.6 5 100.0 7 92.7 12 Business 50.4 17 91.8 5 55.5 22 Salaried employment 75.0 17 92.4 9 79.6 26 Housework Nil Nil 85.9 91 85.9 91 Student 100.0 2 100.0 1 100.0 3 Religion Hindu 68.7 53 86.4 101 78.5 154 Muslim 100.0 3 91.5 14 93.5 17 Other 0.0 1 100.0 1 79.3 2 Caste/Tribe Scheduled Caste 32.7 10 100.0 11 49.8 21 Scheduled Tribe 91.1 13 79.1 19 86.6 32 Other 86.7 34 87.1 86 87.0 120 Travel due to work Yes 57.2 26 88.3 6 59.5 32 No 88.2 31 87.1 109 87.3 140 Total 69.6 57 87.2 116 79.8 173 Note: Total includes cases with missing information on occupation and travel due to work.

92
Table 4.10R: Among RURAL respondents who ever taken HIV test, percent reported to have received counseling during the last test, by sex and other background characteristics
Male Female Total
Characteristic Percent Number Percent Number Percent Number Age 15-19 100.0 1 14.0 6 40.5 7 20-24 8.5 6 52.8 19 29.7 25 25-29 5.5 4 68.9 5 39.5 9 30-34 35.7 6 71.0 6 51.4 12 35-39 100.0 1 12.0 2 30.7 3 40-44 73.3 3 Nil Nil 73.3 3 45-49 100.0 2 0.0 1 60.0 3 Marital status Currently married 24.5 11 49.5 35 38.1 46 Marriage dissolved Nil Nil 77.5 3 77.5 3 Never married 42.0 12 0.0 1 34.1 13 Literacy and education Illiterate 24.6 6 34.2 11 27.9 17 Primary Nil Nil 100.0 1 100.0 1 Middle 100.0 1 66.6 5 76.5 6 Secondary 53.9 5 19.7 6 32.0 11 Secondary+ 17.5 11 51.8 16 34.6 27 Occupation Cultivator 41.2 13 Nil Nil 41.2 13 Agricultural labourer Nil Nil 71.0 2 71.0 2 Non-agricultural labourer Nil Nil Nil Nil Nil Nil Business 17.0 3 0.0 1 16.7 4 Salaried employment 28.4 5 100.0 2 41.6 7 Housework Nil Nil 45.2 33 45.2 33 Student 0.0 1 Nil Nil 0.0 1 Religion Hindu 29.0 22 46.6 38 37.6 60 Muslim 100.0 1 100.0 1 100.0 2 Caste/Tribe Scheduled Caste 6.0 5 50.2 6 14.1 11 Scheduled Tribe 70.0 9 14.2 7 57.6 16 Other 13.5 9 51.1 26 43.9 35 Travel due to work Yes 17.9 10 100.0 2 20.1 12 No 54.7 13 46.0 37 48.3 50 Total 29.7 23 47.1 39 38.2 62 Note: Total includes cases with missing information on occupation.

93
Table 4.10U: Among URBAN respondents who ever taken HIV test, percent reported to have received counseling during the last test, by sex and other background characteristics
Male Female Total
Characteristic Percent Number Percent Number Percent Number Age 15-19 Nil Nil 64.5 5 64.5 5 20-24 100.0 1 67.1 19 68.3 20 25-29 18.9 6 45.6 34 41.3 40 30-34 28.4 10 31.7 10 29.6 20 35-39 36.5 7 0.0 3 25.6 10 40-44 0.0 7 0.0 2 0.0 9 45-49 100.0 1 71.9 4 84.5 5 Marital status Currently married 27.5 24 50.3 73 43.7 97 Marriage dissolved Nil Nil 33.7 2 33.7 2 Never married 26.9 8 50.0 2 31.2 10 Literacy and education Illiterate 44.2 3 55.5 6 51.2 9 Primary 100.0 1.0 100.0 1 100.0 2 Middle 0.0 3 75.1 12 55.2 15 Secondary 0.0 5 36.4 7 23.1 12 Secondary+ 27.7 20 44.6 51 39.4 71 Occupation Cultivator 100.0 2 Nil Nil 100.0 2 Agricultural labourer Nil Nil Nil Nil Nil Nil Non-agricultural labourer 0.0 5 60.1 7 36.3 12 Business 23.7 12 62.9 4 35.4 16 Salaried employment 15.1 12 47.4 7 24.5 19 Housework 100.0 1 48.4 58 48.4 58 Student Nil Nil 0.0 1 46.8 2 Religion Hindu 30.9 29 41.4 63 37.7 92 Muslim 0.0 2 78.4 13 61.6 15 Other 0.0 1 100.0 1 79.3 2 Caste/Tribe Scheduled Caste 36.2 5 19.7 5 28.4 10 Scheduled Tribe 0.0 4 62.8 12 37.7 16 Other 32.6 23 50.3 60 45.1 83 Travel due to work Yes 22.6 14 80.8 4 32.3 18 No 31.4 18 49.0 72 45.2 90 Total 27.3 32 49.9 77 42.5 109 Note: Total includes cases with missing information on travel due to work.

94
Table 4.10T: Among TOTAL respondents who ever taken HIV test, percent reported to have received counseling during the last test, by sex and other background characteristics
Male Female Total
Characteristic Percent Number Percent Number Percent Number
Place of residence
Rural 29.7 23 47.1 39 38.2 62
Urban 27.3 32 49.9 77 42.5 109 Age 15-19 100.0 1 29.8 11 46.2 12 20-24 11.1 7 59.4 38 41.2 45 25-29 12.1 10 50.0 39 40.8 49 30-34 30.8 16 47.5 16 37.4 32 35-39 46.9 8 7.6 5 27.6 13 40-44 36.4 10 0.0 2 33.5 12 45-49 100.0 3 58.9 5 78.8 8 Marital status Currently married 25.8 35 50.0 108 41.1 143 Marriage dissolved Nil Nil 58.5 5 58.5 5 Never married 37.1 20 16.1 3 33.2 23 Literacy and education Illiterate 27.2 9 41.1 17 32.7 26 Primary 100.0 1 100.0 2 100.0 3 Middle 48.1 4 71.3 17 64.8 21 Secondary 28.0 10 27.7 13 27.8 23 Secondary+ 23.2 31 46.6 67 37.8 98 Occupation Cultivator 53.1 15 Nil Nil 53.1 15 Agricultural labourer Nil Nil 71.0 2 71.0 2 Non-agricultural labourer 0.0 5 60.1 7 36.3 12 Business 19.1 15 57.7 5 24.1 20 Salaried employment 18.4 17 55.4 9 28.2 26 Housework Nil Nil 46.9 91 46.9 91 Student 28.4 2 0.0 1 21.4 3 Religion Hindu 29.7 51 43.8 101 37.6 152 Muslim 12.5 3 79.2 14 63.8 17 Other 0.0 1 100.0 1 79.3 2 Caste/Tribe Scheduled Caste 11.2 10 36.3 11 17.6 21 Scheduled Tribe 52.2 13 45.4 19 49.7 32 Other 27.3 32 50.6 86 44.7 118 Travel due to work Yes 19.4 24 85.3 6 24.4 30 No 42.5 31 47.8 109 46.5 140 Total 28.8 55 48.8 116 40.4 171 Note: Total includes cases with missing information on occupation and travel due to work.

95
Table 4.11R: Percent of never married RURAL respondents who ever had sexual intercourse, by sex and other background characteristics
Male Female Total
Characteristic Percent Number Percent Number Percent Number Age 15-19 3.1 169 0.0 172 1.7 341 20-24 14.2 188 0.0 38 12.3 226 25-29 5.9 79 1.4 19 4.7 98 30-49 24.7 17 0.0 19 12.1 36 Literacy and education Illiterate 8.9 98 0.0 49 5.7 147 Primary 5.3 18 0.0 5 4.9 23 Middle 5.4 49 0.0 22 3.7 71 Secondary 1.6 74 0.0 52 0.9 126 Secondary+ 11.2 214 0.4 120 7.9 334 Occupation Cultivator 7.5 172 0.0 1 7.5 173 Agricultural labourer 12.7 27 12.7 27 Non-agricultural labourer 7.5 58 0.0 23 5.7 81 Business 3.9 60 0.0 11 3.3 71 Salaried employment 25.2 27 0.0 5 19.9 32 Housework 0.0 3 0.3 136 0.3 139 Student 8.3 103 0.0 71 5.8 174 Religion Hindu 7.9 443 0.0 240 5.3 683 Muslim 60.9 10 0.0 8 36.7 18 Caste/Tribe Scheduled Caste 6.7 109 0.0 71 4.7 180 Scheduled Tribe 15.7 108 0.0 58 9.6 166 Other 5.4 236 0.4 119 3.9 355 Travel due to work Yes 12.1 198 0.0 19 11.1 217 No 5.3 255 0.2 229 3.0 484 Total 8.4 453 0.2 248 5.7 701 Note: Total includes cases with missing information on occupation.

96
Table 4.11U: Percent of never married URBAN respondents who ever had sexual intercourse, by sex and other background characteristics
Male Female Total
Characteristic Percent Number Percent Number Percent Number Age 15-19 4.0 160 0.34 175 2.1 335 20-24 8.3 184 0.00 75 5.9 259 25-29 13.4 60 0.00 18 10.2 78 30-49 16.4 25 9.63 18 13.1 43 Literacy and education Illiterate 8.6 58 10.9 13 9.1 71 Primary 0.0 9 0.0 6 0.0 15 Middle 11.5 43 0.0 32 6.8 75 Secondary 4.9 47 0.0 27 3.2 74 Secondary+ 7.5 272 0.3 208 4.4 480 Occupation Cultivator 8.8 14 Nil Nil 8.8 14 Agricultural labourer 29.0 2 33.3 3 31.9 5 Non-agricultural labourer 9.7 89 0.0 10 8.7 99 Business 6.6 104 0.0 25 5.3 129 Salaried employment 15.5 80 0.0 15 13.1 95 Housework 0.0 1 0.6 99 0.6 100 Student 1.8 135 0.0 132 0.9 267 Religion Hindu 8.4 357 1.1 221 5.6 578 Muslim 3.5 65 0.0 58 1.9 123 Other 8.8 7 0.0 7 3.9 14 Caste/Tribe Scheduled Caste 5.4 56 0.0 44 3.0 100 Scheduled Tribe 11.0 75 1.7 43 7.8 118 Other 7.3 298 0.9 199 4.7 497 Travel due to work Yes 10.2 94 0.0 5 9.7 99 No 6.8 335 0.9 281 4.0 616 Total 7.6 429 0.9 286 4.9 715 Note: Total includes cases with missing information on occupation.

97
Table 4.11T: Percent of never married TOTAL respondents who ever had sexual intercourse, by sex and other background characteristics
Male Female Total
Characteristic Percent Number Percent Number Percent Number
Place of residence
Rural 8.4 453 0.2 248 5.7 701
Urban 7.6 429 0.9 286 4.9 715 Age 15-19 3.43 329 0.2 347 1.9 676 20-24 11.61 372 0.0 113 9.2 485 25-29 8.82 139 0.9 37 6.8 176 30-49 20.20 42 5.1 37 12.6 79 Literacy and education Illiterate 8.8 156 2.5 62 6.8 218 Primary 4.1 27 0.0 11 3.4 38 Middle 7.6 92 0.0 54 4.9 146 Secondary 2.8 121 0.0 79 1.7 200 Secondary+ 9.5 486 0.3 328 6.1 814 Occupation Cultivator 7.6 186 0.0 1 7.6 187 Agricultural labourer 14.0 29 33.3 3 16.9 32 Non-agricultural labourer 8.6 147 0.0 33 7.1 180 Business 5.7 164 0.0 36 4.6 200 Salaried employment 18.2 107 0.0 20 15.1 127 Housework 0.0 4 0.4 235 0.4 239 Student 5.3 238 0.0 203 3.1 441 Religion Hindu 8.1 800 0.6 461 5.4 1261 Muslim 8.1 75 0.0 66 4.5 141 Jain 8.8 7 0.0 7 3.9 14 Caste/Tribe Scheduled Caste 6.4 165 0.0 115 4.2 280 Scheduled Tribe 14.2 183 0.5 101 9.1 284 Other 6.3 534 0.7 318 4.3 852 Travel due to work Yes 11.5 292 0.0 24 10.7 316 No 6.0 590 0.5 510 3.5 1100 Total 8.1 882 0.5 534 5.3 1416 Note: Total includes cases with missing information on occupation.

98
Table 4.12R: Median age at first sexual intercourse among RURAL respondents by sex, according to selected background characteristics
Male Female Total
Characteristic Median
age Number Median
age Number Median
age Number
Age 15-19 16.3 7 16.8 56 16.7 63 20-24 19.3 61 16.7 155 17.6 216 25-29 22.4 117 15.6 212 18.4 329 30-34 23.4 126 16.0 181 18.2 307 35-39 24.3 151 14.8 212 16.5 363 40-44 23.5 123 15.7 133 19.3 256 45-49 21.6 133 15.5 140 19.1 273 Marital status Currently married 22.6 670 15.7 978 18.1 1648 Marriage dissolved 26.9 6 15.3 110 15.5 116 Never married 19.1 42 25.0 1 19.2 43 Literacy and education Illiterate 22.2 388 15.1 669 17.6 1057 Primary 21.6 58 15.1 58 17.7 116 Middle 22.4 80 16.7 138 17.9 218 Secondary 23.3 68 16.3 113 18.4 181 Secondary+ 23.5 124 18.1 111 20.4 235 Occupation Cultivator 22.9 359 14.9 121 20.7 480 Agricultural labourer 20.6 60 15.8 69 18.3 129 Non-agricultural labourer 21.8 110 14.8 170 17.3 280 Business 22.4 115 17.6 29 21.3 144 Salaried employment 22.6 58 16.9 17 21.8 75 Housework Nil Nil 16.1 668 16.1 668 Student 17.5 7 16.0 7 17.2 14 Religion Hindu 22.4 692 15.6 1071 18.0 1763 Muslim 22.1 24 17.9 17 18.9 41 Other 30.5 2 Nil Nil 30.5 2 Caste/Tribe Scheduled Caste 21.2 142 14.8 240 17.4 382 Scheduled Tribe 21.9 197 15.3 273 17.7 470 Other 23.1 379 16.3 575 18.5 954 Travel due to work Yes 22.2 321 14.9 51 21.3 372 No 22.6 397 15.7 1037 17.4 1434 Total 22.4 718 15.7 1089 18.0 1807 Note: Total includes cases with missing information on occupation, religion, caste/tribe and travel due to work.

99
Table 4.12U: Median age at first sexual intercourse among URBAN respondents by sex, according to selected background characteristics
Male Female Total
Characteristic Median
age Number Median
age Number Median
age Number
Age 15-19 17.9 5 16.8 29 17.1 34 20-24 20.9 35 17.6 133 18.2 168 25-29 23.5 79 17.6 206 18.8 285 30-34 24.4 129 17.6 169 20.0 298 35-39 24.7 125 16.8 167 20.0 292 40-44 24.8 90 17.7 140 20.2 230 45-49 24.2 93 17.0 104 20.6 197 Marital status Currently married 24.0 522 17.5 861 19.5 1383 Marriage dissolved 26.4 3 16.3 85 16.6 88 Never married 20.0 31 22.5 2 20.1 33 Literacy and education Illiterate 21.8 174 15.6 296 17.8 470 Primary 22.8 30 16.0 35 18.7 65 Middle 22.7 84 17.4 166 18.6 250 Secondary 24.1 48 17.6 109 19.1 157 Secondary+ 26.2 220 19.8 342 22.2 562 Occupation Cultivator 22.5 39 13.7 8 21.0 47 Agricultural labourer 21.1 7 15.5 17 17.7 24 Non-agricultural labourer 22.4 135 15.3 105 19.2 240 Business 24.3 212 17.4 81 22.1 293 Salaried employment 25.0 151 20.1 62 23.9 213 Housework 20.0 1 17.8 666 17.8 667 Student 23.5 7 17.7 4 19.9 11 Religion Hindu 24.1 438 17.3 737 19.4 1175 Muslim 22.7 108 17.8 196 18.9 304 Other 24.3 10 19.2 15 21.7 25 Caste/Tribe Scheduled Caste 23.8 61 17.3 91 18.9 152 Scheduled Tribe 22.9 111 16.3 175 19.1 286 Other 24.0 384 17.6 682 19.4 1066 Travel due to work Yes 24.1 162 16.5 33 23.3 195 No 23.6 394 17.5 912 18.8 1306 Total 23.8 556 17.4 948 19.3 1504 Note: Total includes cases with missing information on occupation and travel due to work.

100
Table 4.12T: Median age at first sexual intercourse among TOTAL respondents by sex, according to selected background characteristics
Male Female Total
Characteristic Median age Number Median
age Number Median
age Number
Place of residence
Rural 22.4 718 15.7 1089 18.0 1807
Urban 23.8 556 17.4 948 19.3 1504 Age 15-19 17.1 12 16.8 85 16.8 97 20-24 19.7 96 17.2 288 17.8 384 25-29 22.8 196 16.8 418 18.6 614 30-34 23.8 255 16.8 350 18.8 605 35-39 24.5 276 15.3 379 18.1 655 40-44 23.9 213 16.7 273 19.6 486 45-49 22.4 226 16.1 244 19.4 470 Marital status Currently married 23.0 1192 16.5 1839 18.6 3031 Marriage dissolved 26.7 9 15.6 195 15.8 204 Never married 19.6 73 22.9 3 19.7 76 Literacy and education Illiterate 22.1 562 15.3 965 17.7 1527 Primary 22.0 88 15.3 93 18.1 181 Middle 22.5 164 17.1 304 18.2 468 Secondary 23.6 116 17.0 222 18.7 338 Secondary+ 24.9 344 19.2 453 21.6 797 Occupation Cultivator 22.9 398 14.9 129 20.7 527 Agricultural labourer 20.6 67 15.7 86 18.2 153 Non-agricultural labourer 22.1 245 15.0 275 18.3 520 Business 23.4 327 17.5 110 21.7 437 Salaried employment 24.3 209 19.1 79 23.4 288 Housework 20.0 1 17.0 1334 17.0 1335 Student 19.5 14 17.2 11 18.9 25 Religion Hindu 21.6 1130 15.2 1808 17.7 2938 Muslim 22.2 132 15.6 213 18.1 345 Other 23.5 12 17.0 15 18.9 27 Caste/Tribe Scheduled Caste 21.7 203 15.2 331 17.7 534 Scheduled Tribe 22.1 308 15.5 448 18.0 756 Other 23.7 763 17.1 1257 19.0 2020 Travel due to work Yes 22.7 483 15.1 84 21.8 567 No 23.0 791 16.5 1949 17.9 2740 Total 22.8 1274 16.4 2037 18.5 3311 Note: Total includes cases with missing information on occupation, religion, caste/tribe and travel due to work.

101
Table 4.13TM: Percent of TOTAL MALE respondents who ever had sex according to the relationship of person to whom the respondent had sex for the first time, by background characteristics
Characteristics
Wife/ Cohabiting
partner
Girl Friend/ Fiance
Friend/ Known women
Commercial Sex worker
Other Number
Place of residence
Rural 71.0 8.4 17.8 1.1 1.7 718
Urban 85.4 2.3 9.4 1.8 1.1 556 Age 15-19 19.3 16.6 39.8 11.9 12.4 12 20-24 37.0 10.6 48.7 2.2 1.5 96 25-29 74.2 7.5 14.6 1.7 2.1 196 30-34 83.3 4.9 10.0 1.2 0.5 255 35-39 87.9 2.1 7.0 0.4 2.6 276 40-44 78.0 6.9 12.4 1.6 1.0 213 45-49 82.0 6.8 9.9 0.8 0.5 226 Marital status Currently married 80.5 5.5 11.9 1.0 1.2 1192 Marriage dissolved 94.4 0.0 0.0 5.6 0.0 9 Never married 0.0 19.2 66.5 7.2 7.2 73 Literacy and education Illiterate 80.2 5.9 11.5 1.3 1.0 562 Primary 81.0 1.2 12.6 0.0 5.2 88 Middle 79.2 5.9 12.2 2.3 0.4 164 Secondary 77.2 9.7 6.3 2.3 4.5 116 Secondary+ 65.7 6.7 25.9 0.9 0.9 344 Occupation Cultivator 75.3 7.3 15.0 1.3 1.1 398 Agricultural labourer 66.1 21.9 8.9 2.6 0.4 67 Non-agricultural labourer 82.9 4.1 11.3 0.7 1.0 245 Business 78.0 3.7 15.7 1.2 1.4 327 Salaried employment 80.9 2.6 12.1 1.7 2.8 209 Housework 100.0 0.0 0.0 0.0 0.0 1 Student 32.3 14.9 44.3 8.5 0.0 14 Religion Hindu 74.8 6.6 15.7 1.2 1.6 1130 Muslim 93.0 1.2 2.4 2.6 0.8 132 Other 94.8 0.0 5.2 0.0 0.0 12 Caste/Tribe Scheduled Caste 63.6 8.0 27.0 1.2 0.2 197 Scheduled Tribe 64.1 9.4 20.2 1.9 4.4 251 Other 84.5 4.5 8.9 1.2 0.9 826 Travel due to work Yes 72.5 6.0 16.8 2.0 2.7 483 No 78.6 6.2 13.4 1.0 0.8 791 Total 76.4 6.1 14.6 1.3 1.5 1274 Note: Total includes cases with missing information on occupation.

102
Table 4.13TF: Percent of TOTAL FEMALE respondents who ever had sex according to the relationship of person to whom the respondent had sex for the first time, by background characteristics
Characteristics
Husband/ Cohabiting partner
Friend/ Known man Number
Place of residence
Rural 100.0 0.0 1089
Urban 99.7 0.3 948 Age 15-19 99.4 0.6 85 20-24 100.0 0.0 288 25-29 99.9 0.1 418 30-34 99.4 0.6 350 35-39 100.0 0.0 379 40-44 100.0 0.0 273 45-49 100.0 0.0 244 Marital status Currently married 100.0 0.0 1839 Marriage dissolved 99.7 0.3 195 Never married 0.0 100.0 3 Literacy and education Illiterate 99.9 0.1 965 Primary 100.0 0.0 93 Middle 99.8 0.2 304 Secondary 100.0 0.0 222 Secondary+ 99.7 0.3 453 Occupation Cultivator 100.0 0.0 129 Agricultural labourer 98.7 1.3 86 Non-agricultural labourer 100.0 0.0 275 Business 99.6 0.4 110 Salaried employment 100.0 0.0 79 Housework 99.9 0.1 1334 Student 100.0 0.0 11 Religion Hindu 99.9 0.1 1808 Muslim 99.7 0.3 213 Jain 100.0 0.0 15 Caste/Tribe Scheduled Caste 100.0 0.0 325 Scheduled Tribe 99.9 0.1 386 Other 99.8 0.2 1325 Travel due to work Yes 100.0 0.0 84 No 99.9 0.1 1949 Total 99.9 0.1 2037 Note: Total includes cases with missing information on occupation, religion, caste/tribe and travel due to work.

103
Table 4.14TM: Percent of TOTAL MALE respondents who ever had sex according to the relationship of person to whom the respondent had sex for the last time, by background characteristics
Characteristics
Wife/ Cohabiting
partner
Girl Friend/ Fiancé
Friend/ Known women
Commercial Sex worker
Other Number
Place of residence
Rural 93.9 1.9 4.1 0.1 0.0 717
Urban 93.5 1.2 3.7 1.0 0.7 556 Age 15-19 19.3 16.6 51.7 0.0 12.4 12 20-24 68.7 8.6 19.2 2.9 0.5 96 25-29 93.4 2.0 3.8 0.6 0.2 196 30-34 96.9 1.0 1.8 0.0 0.3 255 35-39 99.4 0.0 0.6 0.0 0.0 276 40-44 98.2 0.3 1.2 0.3 0.0 213 45-49 99.0 0.2 0.9 0.0 0.0 225 Marital status Currently married 99.1 0.6 0.4 0.0 0.0 1191 Marriage dissolved 82.4 0.0 12.0 5.6 0.0 9 Never married 0.0 20.9 66.6 7.2 5.3 73 Literacy and education Illiterate 97.5 0.1 2.1 0.2 0.1 561 Primary 95.5 1.2 3.3 0.0 0.0 88 Middle 94.6 2.8 0.9 1.7 0.0 164 Secondary 97.4 0.2 1.0 0.2 1.1 116 Secondary+ 83.8 4.7 10.5 0.4 0.6 344 Occupation Cultivator 95.2 1.5 3.3 0.0 0.0 398 Agricultural labourer 95.6 1.1 2.6 0.7 0.0 67 Non-agricultural labourer 93.7 1.2 4.2 0.4 0.5 245 Business 95.9 0.5 2.6 0.2 0.9 327 Salaried employment 90.0 3.2 5.1 1.6 0.0 208 Housework 100.0 0.0 0.0 0.0 0.0 1 Student 32.3 20.0 44.3 3.3 0.0 14 Religion Hindu 93.6 1.7 4.1 0.4 0.3 1129 Muslim 95.4 1.2 1.8 1.3 0.4 132 Other 94.8 0.0 5.2 0.0 0.0 12 Caste/Tribe Scheduled Caste 95.4 1.3 3.3 0.0 0.0 197 Scheduled Tribe 88.7 2.4 8.3 0.5 0.0 251 Other 94.9 1.5 2.6 0.5 0.5 825 Travel due to work Yes 90.2 3.1 6.0 0.5 0.1 483 No 95.8 0.8 2.7 0.4 0.4 790 Total 93.7 1.6 3.9 0.4 0.3 1273 Note: Total includes cases with missing information on occupation.

104
Table 4.14TF: Percent of TOTAL FEMALE respondents who ever had sex according to the relationship of person to whom the respondent had sex for the last time, by background characteristics
Characteristics Husband/ Cohabiting
partner Friend/ Known man Number Place of residence
Rural 99.7 0.3 1089
Urban 98.7 1.3 948 Age 15-19 99.4 0.6 85 20-24 99.9 0.1 288 25-29 99.8 0.2 418 30-34 98.1 1.9 350 35-39 100.0 0.0 379 40-44 99.1 0.9 273 45-49 98.3 1.7 244 Marital status Currently married 100.0 0.0 1839 Marriage dissolved 92.9 7.1 195 Never married 0.0 100.0 3 Literacy and education Illiterate 99.3 0.7 965 Primary 100.0 0.0 93 Middle 98.5 1.5 304 Secondary 100.0 0.0 222 Secondary+ 99.3 0.7 453 Occupation Cultivator 99.8 0.2 129 Agricultural labourer 95.5 4.5 86 Non-agricultural labourer 99.3 0.7 275 Business 99.6 0.4 110 Salaried employment 94.6 5.4 79 Housework 99.7 0.3 1334 Student 100.0 0.0 11 Religion Hindu 99.3 0.7 1808 Muslim 99.4 0.6 213 Other 100.0 0.0 15 Caste/Tribe Scheduled Caste 99.7 0.3 325 Scheduled Tribe 99.6 0.4 386 Other 99.1 0.9 1325 Travel due to work Yes 98.8 1.2 84 No 99.3 0.7 1949 Total 99.3 0.7 2037 Note: Total includes cases with missing information on occupation, religion, caste/tribe and travel due to work.

105
Table 4.15R: Percent of currently married RURAL respondents who reported that their partner had sexual relationship with other person either before or after marriage, by sex and other background characteristics
Male Female Total
Characteristic Percent Number Percent Number Percent Number Age 15-19 0.0 1 0.0 56 0.0 57 20-24 1.3 36 5.8 147 4.5 183 25-29 0.0 111 5.5 203 3.3 314 30-34 0.2 122 6.9 156 4.1 278 35-39 1.6 148 3.0 189 2.5 337 40-44 0.0 120 9.5 110 4.7 230 45-49 0.0 132 6.7 117 3.1 249 Literacy and education Illiterate 0.3 371 5.8 580 3.6 951 Primary 0.0 56 0.0 56 0.0 112 Middle 2.8 75 6.0 130 4.9 205 Secondary 0.0 64 8.8 105 5.2 169 Secondary+ 0.0 104 4.1 107 1.7 211 Occupation Cultivator 0.5 343 2.0 111 1.0 454 Agricultural labourer 0.4 55 5.0 55 2.9 110 Non-agricultural labourer 0.0 102 9.2 131 5.0 233 Business 0.8 111 0.0 21 0.7 132 Salaried employment 0.0 50 0.0 13 0.0 63 Housework Nil Nil 5.9 632 5.9 632 Student Nil Nil 0.0 7 0.0 7 Religion Hindu 0.4 649 5.5 960 3.5 1609 Muslim 0.0 19 0.0 17 0.0 36 Other 0.0 2 Nil Nil 0.0 2 Caste/Tribe Scheduled Caste 1.3 131 7.1 212 4.8 343 Scheduled Tribe 0.6 143 7.1 205 4.4 348 Other 0.0 396 4.1 560 2.4 956 Travel due to work Yes 0.3 296 6.8 41 1.6 337 No 0.5 374 5.4 936 3.9 1310 Total 0.4 670 5.5 978 3.4 1648 Note: Total includes cases with missing information on occupation, religion, caste/tribe and travel due to work.

106
Table 4.15U: Percent of currently married URBAN respondents who reported that their partner had sexual relationship with other person either before or after marriage, by sex and other background characteristics
Male Female Total
Characteristic Percent Number Percent Number Percent Number Age 15-19 0 1 2.9 28 2.7 29 20-24 0.0 20 1.9 130 1.7 150 25-29 0.9 72 5.5 201 4.2 273 30-34 0.0 126 5.2 154 2.8 280 35-39 0.0 124 4.6 150 2.5 274 40-44 2.0 86 4.3 115 3.3 201 45-49 1.0 93 12.5 83 6.3 176 Literacy and education Illiterate 0.8 169 7.3 247 4.7 416 Primary 5.0 30 1.7 31 3.4 61 Middle 0.0 79 4.3 148 2.8 227 Secondary 0.0 44 3.2 106 2.1 150 Secondary+ 0.0 200 4.3 329 2.7 529 Occupation Cultivator 0.0 37 17.3 7 3.0 44 Agricultural labourer 0.0 6 0.0 11 0.0 17 Non-agricultural labourer 0.5 127 7.0 84 3.2 211 Business 0.0 202 2.3 71 0.6 273 Salaried employment 2.0 141 9.3 56 4.0 197 Housework 0.0 1 4.7 624 4.7 625 Student 0.0 4 0.0 3 0.0 7 Religion Hindu 0.6 408 5.1 666 3.3 1074 Muslim 0.9 105 5.6 180 3.8 285 Other 0.0 9 0.0 15 0.0 24 Caste/Tribe Scheduled Caste 0.0 51 8.8 78 5.3 129 Scheduled Tribe 0.0 82 8.8 128 5.0 210 Other 0.8 389 4.0 655 2.8 1044 Travel due to work Yes 1.6 150 7.3 26 2.4 176 No 0.2 372 5.0 832 3.5 1204 Total 0.6 522 5.1 861 3.4 1383 Note: Total includes cases with missing information on occupation and travel due to work.

107
Table 4.15T: Percent of currently married TOTAL respondents who reported that their partner had sexual relationship with other person either before or after marriage, by sex and other background characteristics
Male Female Total
Characteristic Percent Number Percent Number Percent Number
Place of residence
Rural 0.4 670 5.5 978 3.4 1648
Urban 0.6 522 5.1 861 3.4 1383 Age 15-19 0.0 2 0.8 84 0.7 86 20-24 1.0 56 4.2 277 3.4 333 25-29 0.3 183 5.5 404 3.7 587 30-34 0.1 248 6.2 310 3.5 558 35-39 0.9 272 3.6 339 2.5 611 40-44 0.8 206 7.1 225 4.1 431 45-49 0.3 225 8.5 200 4.1 425 Literacy and education Illiterate 0.4 540 6.2 827 3.9 1367 Primary 1.8 86 0.4 87 1.0 173 Middle 1.5 154 5.2 278 3.9 432 Secondary 0.0 108 6.3 211 4.0 319 Secondary+ 0.0 304 4.3 436 2.4 740 Occupation Cultivator 0.5 380 2.7 118 1.2 498 Agricultural labourer 0.4 61 4.2 66 2.5 127 Non-agricultural labourer 0.3 229 8.3 215 4.2 444 Business 0.3 313 1.7 92 0.7 405 Salaried employment 1.4 191 7.6 69 3.0 260 Housework 0.0 1 5.4 1256 5.4 1257 Student 0.0 4 0.0 10 0.0 14 Religion Hindu 0.5 1057 5.4 1626 3.4 2683 Muslim 0.8 124 5.3 197 3.6 321 Other 0.0 11 0.0 15 0.0 26 Caste/Tribe Scheduled Caste 1.1 182 7.4 290 4.9 472 Scheduled Tribe 0.4 225 7.6 333 4.6 558 Other 0.4 785 4.1 1215 2.6 2000 Travel due to work Yes 0.7 446 6.9 67 1.9 513 No 0.4 746 5.3 1768 3.7 2514 Total 0.5 1192 5.3 1839 3.4 3031 Note: Total includes cases with missing information on occupation, religion, caste/tribe and travel due to work.

108
Table 4.16R: Percent of RURAL respondents who ever had sex according to number of life time partner, by selected background characteristics
Male Female Total
Characteristic 1
partner >1
partners Number 1
partner>1
partners Number 1
partner >1
partners Number Age 15-19 59.1 40.9 7 99.5 0.5 56 94.4 5.6 63 20-24 49.4 50.6 61 99.8 0.2 155 81.7 18.3 216 25-29 73.5 26.5 117 99.9 0.1 212 89.2 10.8 329 30-34 74.7 25.3 126 96.7 3.3 181 88.0 12.0 307 35-39 83.8 16.2 151 100.0 0.0 212 94.3 5.7 363 40-44 66.3 33.7 123 98.3 1.7 133 83.7 16.3 256 45-49 75.1 24.9 133 99.6 0.4 140 87.1 12.9 273 Marital status Currently married 72.3 27.7 670 99.8 0.2 978 88.6 11.4 1648 Marriage dissolved 80.7 19.3 6 90.8 9.2 110 90.1 9.9 116 Never married 62.3 37.7 42 100.0 0.0 1 62.6 37.4 43 Literacy and education Illiterate 75.5 24.5 388 98.7 1.3 669 90.0 10.0 1057 Primary 70.7 29.3 58 99.7 0.3 58 89.1 10.9 116 Middle 77.3 22.7 80 100.0 0.0 138 92.1 7.9 218 Secondary 70.7 29.3 68 99.7 0.3 113 88.1 11.9 181 Secondary+ 57.9 42.1 124 100.0 0.0 111 73.8 26.2 235 Occupation Cultivator 77.2 22.8 359 99.8 0.2 121 84.3 15.7 480 Agricultural labourer 62.1 37.9 60 97.6 2.4 69 81.6 18.4 129 Non-agricultural labourer 81.8 18.2 110 96.2 3.8 170 90.3 9.7 280 Business 55.7 44.3 115 100.0 0.0 29 66.5 33.5 144 Salaried employment 64.0 36.0 58 100.0 0.0 17 71.1 28.9 75 Housework Nil Nil Nil 99.7 0.3 668 99.7 0.3 668 Student 82.0 18.0 7 100.0 0.0 7 85.0 15.0 14 Religion Hindu 71.7 28.3 692 99.1 0.9 1071 88.2 11.8 1763 Muslim 83.4 16.7 24 100.0 0.0 17 90.1 9.9 41 Other 100.0 0.0 2 Nil Nil Nil 100.0 0.0 2 Caste/Tribe Scheduled Caste 60.5 39.5 142 99.0 1.0 238 83.9 16.1 380 Scheduled Tribe 62.2 37.8 163 98.3 1.7 240 83.4 16.6 403 Other 81.6 18.4 413 99.5 0.5 610 92.3 7.7 1023 Travel due to work Yes 71.0 29.0 321 100.0 0.0 51 77.0 23.0 372 No 72.5 27.5 397 99.1 0.9 1037 91.1 8.9 1434 Total 71.9 28.1 718 99.1 0.9 1089 88.2 11.8 1807 Note: Total includes cases with missing information on occupation, religion, caste/tribe and travel due to work.

109
Table 4.16 U: Percent of URBAN respondents who ever had sex according to number of life time partner, by selected background characteristics
Male Female Total
Characteristic 1
partner >1
partners Number 1
partner >1
partners Number 1
partner >1
partners Number Age 15-19 100.0 0.0 5 100.0 0.0 29 100.0 0.0 34 20-24 83.7 16.3 35 100.0 0.0 133 96.8 3.2 168 25-29 85.7 14.3 79 99.6 0.4 206 95.5 4.5 285 30-34 83.1 16.9 129 95.7 4.3 169 90.1 9.9 298 35-39 88.8 11.2 125 100.0 0.0 167 95.1 4.9 292 40-44 82.7 17.3 90 98.8 1.2 140 92.2 7.8 230 45-49 80.6 19.4 93 95.4 4.6 104 88.3 11.7 197 Marital status Currently married 85.4 14.6 522 99.5 0.5 861 94.0 6.0 1383 Marriage dissolved 85.1 14.9 3 88.3 11.7 85 88.1 11.9 88 Never married 71.0 29.0 31 100.0 0.0 2 73.1 26.9 33 Literacy and education Illiterate 80.3 19.7 174 97.8 2.2 296 91.3 8.7 470 Primary 75.2 24.8 30 100.0 0.0 35 88.1 11.9 65 Middle 82.8 17.2 84 96.8 3.2 166 91.9 8.1 250 Secondary 85.8 14.2 48 100.0 0.0 109 95.3 4.7 157 Secondary+ 91.0 9.0 220 99.5 0.5 342 96.1 3.9 562 Occupation Cultivator 71.2 28.8 39 100.0 0.0 8 76.6 23.4 47 Agricultural labourer 91.5 8.5 7 93.9 6.1 17 93.3 6.7 24 Non-agricultural labourer 81.5 18.5 135 98.9 1.1 105 89.3 10.7 240 Business 87.3 12.7 212 98.7 1.3 81 90.6 9.4 293 Salaried employment 88.2 11.8 151 88.2 11.8 62 88.2 11.8 213 Housework 100.0 0.0 1 99.5 0.5 666 99.5 0.5 667 Student 92.3 7.7 7 100.0 0.0 4 94.8 5.2 11 Religion Hindu 82.5 17.5 438 98.4 1.6 737 92.3 7.7 1175 Muslim 93.6 6.4 108 98.8 1.2 196 96.9 3.1 304 Other 83.4 16.6 10 100.0 0.0 15 93.3 6.7 25 Caste/Tribe Scheduled Caste 76.7 23.3 55 100.0 0.0 87 90.9 9.1 142 Scheduled Tribe 84.9 15.1 88 97.3 2.7 146 92.0 8.0 234 Other 85.5 14.5 413 98.5 1.5 715 93.7 6.3 1128 Travel due to work Yes 81.6 18.4 162 95.4 4.6 33 83.8 16.2 195 No 86.0 14.0 394 98.6 1.4 912 94.7 5.3 1306 Total 84.6 15.4 556 98.5 1.5 948 93.2 6.8 1504 Note: Total includes cases with missing information on occupation and travel due to work.

110
Table 4.16T: Percent of TOTAL respondents who ever had sex according to number of life time partner, by selected background characteristics
Male Female Total
Characteristic 1
partner >1
partners Number 1
partner >1
partners Number 1
partner >1
partners Number Age 15-19 78.1 21.9 12 99.6 0.4 85 96.1 3.9 97 20-24 57.7 42.3 96 99.9 0.1 288 87.3 12.7 384 25-29 77.4 22.6 196 99.7 0.3 418 91.7 8.3 614 30-34 78.6 21.4 255 96.3 3.7 350 88.9 11.1 605 35-39 86.0 14.0 276 100.0 0.0 379 94.6 5.4 655 40-44 73.0 27.0 213 98.5 1.5 273 87.4 12.6 486 45-49 76.8 23.2 226 98.2 1.8 244 87.5 12.5 470 Marital status Currently married 77.2 22.8 1192 99.7 0.3 1839 90.7 9.3 3031 Marriage dissolved 82.4 17.6 9 89.7 10.3 195 89.3 10.7 204 Never married 65.7 34.3 73 100.0 0.0 3 66.9 33.1 76 Literacy and education Illiterate 76.8 23.2 562 98.5 1.5 965 90.3 9.7 1527 Primary 72.3 27.7 88 99.8 0.2 93 88.8 11.2 181 Middle 79.9 20.1 164 98.5 1.5 304 92.0 8.0 468 Secondary 76.4 23.6 116 99.9 0.1 222 91.1 8.9 338 Secondary+ 76.0 24.0 344 99.6 0.4 453 88.3 11.7 797 Occupation Cultivator 76.6 23.4 398 99.8 0.2 129 83.6 16.4 527 Agricultural labourer 64.9 35.1 67 96.8 3.2 86 83.5 16.5 153 Non-agricultural labourer 81.6 18.4 245 97.2 2.8 275 89.9 10.1 520 Business 75.4 24.7 327 99.1 0.9 110 81.8 18.2 437 Salaried employment 81.4 18.6 209 90.5 9.5 79 83.7 16.3 288 Housework 100.0 0.0 1 99.6 0.4 1334 99.6 0.4 1335 Student 86.4 13.6 14 100.0 0.0 11 89.8 10.2 25 Religion Hindu 75.2 24.8 1130 98.9 1.1 1808 89.6 10.4 2938 Muslim 92.5 7.5 132 98.9 1.1 213 96.5 3.5 345 Other 84.4 15.6 12 100.0 0.0 15 93.5 6.5 27 Caste/Tribe Scheduled Caste 63.3 36.7 197 99.2 0.8 325 85.1 14.9 522 Scheduled Tribe 69.1 30.9 251 98.0 2.0 386 86.0 14.0 637 Other 83.4 16.6 826 99.0 1.0 1325 93.0 7.0 2151 Travel due to work Yes 74.3 25.7 483 98.8 1.2 84 79.1 20.9 567 No 78.0 22.0 791 98.9 1.1 1949 92.6 7.4 2740 Total 76.7 23.3 1274 98.9 1.1 2037 90.1 9.9 3311 Note: Total includes cases with missing information on occupation, religion, caste/tribe and travel due to work.

111
Table 4.17R: Percent of RURAL respondents who ever had sex according to number of partners in the last one year, by selected background characteristics
Male Female Total
Characteristic 1
partner >1
partners Number 1 partner>1
partners Number 1 partner >1
partners Number Age 15-19 17.6 22.2 7 100.0 0.0 56 89.6 2.8 63 20-24 82.7 3.2 61 96.1 0.0 155 91.3 1.1 216 25-29 90.9 8.3 117 98.3 0.1 212 95.3 3.4 329 30-34 93.7 3.1 126 90.6 0.1 181 91.8 1.3 307 35-39 99.6 0.0 151 93.3 0.0 212 95.5 0.0 363 40-44 92.0 3.7 123 79.6 0.0 133 85.3 1.7 256 45-49 90.6 3.3 133 78.0 0.2 140 84.5 1.8 273 Marital status Currently married 95.0 3.2 670 96.8 0.0 978 96.1 1.3 1648 Marriage dissolved 22.9 0.0 6 17.7 0.7 110 18.0 0.6 116 Never married 32.3 16.0 42 100.0 0.0 1 32.9 15.9 43 Literacy and education Illiterate 94.3 2.6 388 88.1 0.1 669 90.5 1.0 1057 Primary 93.3 6.2 58 94.6 0.3 58 94.1 2.4 116 Middle 94.8 1.2 80 95.2 0.0 138 95.1 0.4 218 Secondary 96.4 3.2 68 97.1 0.0 113 96.8 1.3 181 Secondary+ 75.7 9.1 124 96.0 0.0 111 83.3 5.6 235 Occupation Cultivator 92.9 2.0 359 95.0 0.0 121 93.6 1.4 480 Agricultural labourer 93.3 5.5 60 89.9 0.3 69 91.4 2.6 129 Non-agricultural labourer 96.7 0.3 110 78.2 0.0 170 85.7 0.1 280 Business 92.6 5.0 115 68.3 0.0 29 86.7 3.8 144 Salaried employment 88.4 5.2 58 83.5 0.0 17 87.5 4.2 75 Housework Nil Nil Nil 94.0 0.1 668 94.0 0.1 668 Student 9.0 9.0 7 100.0 0.0 7 24.5 7.5 14 Religion Hindu 91.4 3.9 692 90.9 0.1 1071 91.1 1.6 1763 Muslim 84.6 2.6 24 94.8 0.0 17 88.8 1.6 41 Other 50.0 0.0 2 Nil Nil Nil 50.0 0.0 2 Caste/Tribe Scheduled Caste 93.2 5.5 142 94.3 0.2 238 93.9 2.3 380 Scheduled Tribe 83.4 6.3 163 81.6 0.1 240 82.3 2.6 403 Other 93.8 2.0 413 93.1 0.0 610 93.4 0.8 1023 Travel due to work Yes 89.9 4.7 321 87.7 0.0 51 89.4 3.7 372 No 92.2 3.3 397 91.1 0.1 1037 91.5 1.0 1434 Total 91.3 3.8 718 90.9 0.1 1089 91.0 1.6 1807 Note: Total includes cases with missing information on occupation, religion, caste/tribe and travel due to work.

112
Table 4.17U: Percent of URBAN respondents who ever had sex according to number of partners in the last one year, by selected background characteristics
Male Female Total
Characteristic 1
partner >1
partners Number 1 partner>1
partners Number 1 partner >1
partners NumberAge 15-19 73.3 0.0 5 93.8 0.0 29 88.7 0.0 34 20-24 87.8 3.0 35 97.6 0.0 133 95.7 0.6 168 25-29 89.1 5.6 79 97.0 0.0 206 94.7 1.7 285 30-34 89.9 7.0 129 89.6 1.9 169 89.7 4.2 298 35-39 96.8 1.9 125 88.6 0.0 167 92.2 0.8 292 40-44 95.5 0.8 90 79.0 0.0 140 85.7 0.3 230 45-49 97.6 1.5 93 65.8 2.4 104 81.1 2.0 197 Marital status Currently married 95.6 3.2 522 96.5 0.2 861 96.1 1.3 1383 Marriage dissolved 37.7 14.9 3 9.3 5.0 85 10.7 5.5 88 Never married 58.1 5.7 31 0.0 0.0 2 54.0 5.3 33 Literacy and education Illiterate 92.1 5.6 174 83.3 1.1 296 86.6 2.8 470 Primary 87.4 12.6 30 88.1 0.0 35 87.8 6.1 65 Middle 98.4 0.8 84 87.7 1.1 166 91.4 1.0 250 Secondary 92.3 3.3 48 92.2 0.0 109 92.2 1.1 157 Secondary+ 92.9 0.9 220 93.4 0.0 342 93.2 0.4 562 Occupation Cultivator 85.5 8.0 39 78.6 0.0 8 84.2 6.5 47 Agricultural labourer 83.8 8.5 7 63.6 6.1 17 68.5 6.7 24 Non-agricultural labourer 94.4 3.4 135 83.1 0.5 105 89.3 2.1 240 Business 93.8 3.0 212 88.2 0.0 81 92.2 2.1 293 Salaried employment 95.8 1.5 151 87.2 1.2 62 93.4 1.4 213 Housework 0.0 0.0 1 91.2 0.4 666 91.1 0.4 667 Student 86.4 0.0 7 84.0 0.0 4 85.6 0.0 11 Religion Hindu 92.5 3.7 438 87.7 0.7 737 89.5 1.9 1175 Muslim 95.5 2.7 108 90.9 0.0 196 92.6 1.0 304 Other 94.4 0.0 10 93.4 0.0 15 93.8 0.0 25 Caste/Tribe Scheduled Caste 93.7 6.3 55 81.6 0.0 87 86.4 2.5 142 Scheduled Tribe 91.7 3.5 88 89.4 1.0 146 90.3 2.0 234 Other 93.3 3.1 413 89.0 0.6 715 90.6 1.5 1128 Travel due to work Yes 92.1 4.0 162 83.4 0.0 33 90.7 3.3 195 No 93.5 3.2 394 88.6 0.6 912 90.1 1.4 1306 Total 93.0 3.5 556 88.5 0.6 948 90.2 1.7 1504 Note: Total includes cases with missing information on occupation and travel due to work.

113
Table 4.17T: Percent TOTAL respondents who ever had sex according to number of partners in the last one year, by selected background characteristics
Male Female Total
Characteristic 1
partner >1 partners Number 1 partner>1
partners Number 1 partner >1
partners NumberAge 15-19 43.5 11.9 12 98.3 0.0 85 89.3 1.9 97 20-24 83.9 3.1 96 96.7 0.0 288 92.9 0.9 384 25-29 90.3 7.4 196 97.7 0.1 418 95.1 2.7 614 30-34 91.9 4.9 255 90.2 0.9 350 90.9 2.6 605 35-39 98.4 0.8 276 91.6 0.0 379 94.2 0.3 655 40-44 93.4 2.5 213 79.4 0.0 273 85.5 1.1 486 45-49 92.8 2.7 226 73.9 0.9 244 83.4 1.8 470 Marital status Currently married 95.2 3.2 1192 96.6 0.1 1839 96.1 1.3 3031 Marriage dissolved 28.6 5.6 9 13.9 2.6 195 14.8 2.8 204 Never married 42.4 12.0 73 16.4 0.0 3 41.5 11.6 76 Literacy and education Illiterate 93.7 3.4 562 86.8 0.4 965 89.4 1.5 1527 Primary 91.2 8.5 88 93.0 0.2 93 92.3 3.5 181 Middle 96.5 1.0 164 91.6 0.5 304 93.3 0.7 468 Secondary 94.9 3.2 116 94.9 0.0 222 94.9 1.2 338 Secondary+ 85.1 4.6 344 94.1 0.0 453 89.8 2.2 797 Occupation Cultivator 92.2 2.6 398 94.1 0.0 129 92.8 1.8 527 Agricultural labourer 92.4 5.8 67 84.3 1.5 86 87.7 3.3 153 Non-agricultural labourer 95.5 1.9 245 80.1 0.2 275 87.3 1.0 520 Business 93.3 3.7 327 81.7 0.0 110 90.2 2.7 437 Salaried employment 93.7 2.5 209 86.5 1.0 79 91.8 2.1 288 Housework 0.0 0.0 1 92.8 0.2 1334 92.7 0.2 1335 Student 42.5 5.1 14 89.6 0.0 11 54.3 3.8 25 Religion Hindu 91.7 3.8 1130 89.8 0.3 1808 90.6 1.7 2938 Muslim 94.3 2.7 132 91.1 0.0 213 92.3 1.0 345 Other 91.7 0.0 12 93.4 0.0 15 92.7 0.0 27 Caste/Tribe Scheduled Caste 93.3 5.7 197 92.1 0.2 325 92.6 2.3 522 Scheduled Tribe 85.9 5.4 251 83.9 0.4 386 84.7 2.5 637 Other 93.6 2.5 826 91.1 0.3 1325 92.0 1.1 2151 Travel due to work Yes 90.6 4.5 483 86.6 0.0 84 89.8 3.6 567 No 92.8 3.3 791 90.1 0.3 1949 90.9 1.2 2740 Total 91.9 3.7 1274 89.9 0.3 2037 90.7 1.6 3311 Note: Total includes cases with missing information on occupation, religion, caste/tribe and travel due to work.

114
Table 4.18 TM: Percent of TOTAL MALE respondents who ever had sex according to frequency of sex with the last partner, by background characteristics
Characteristics
Once only
Few times only
Less than once in a
month
Once in a month
Less than once in a
week
Once in a week
More than once in a
week
Number
Place of residence
Rural 3.1 1.2 0.7 1.2 2.0 12.7 79.1 717
Urban 3.2 1.4 0.4 2.8 3.4 11.9 76.8 556 Age 15-19 45.8 19.5 0.0 5.9 9.5 9.9 9.4 12 20-24 19.3 7.3 1.1 0.2 2.1 2.9 67.0 96 25-29 1.9 1.0 0.0 1.0 0.4 11.3 84.0 196 30-34 0.8 0.3 0.1 0.4 1.1 8.6 88.7 255 35-39 0.0 0.0 0.0 2.0 2.0 16.1 79.9 276 40-44 1.8 0.3 1.5 3.0 2.0 9.1 82.4 213 45-49 0.0 0.3 1.2 3.2 6.6 21.0 67.7 225 Marital status Currently married 0.1 0.1 0.5 1.6 2.3 13.1 82.3 1191 Marriage dissolved 14.8 0.0 0.0 0.0 0.0 0.0 85.2 9 Never married 55.7 22.0 2.5 4.9 6.8 1.7 4.9 73 Literacy and education Illiterate 1.2 0.3 0.5 1.8 2.4 11.4 82.4 561 Primary 1.2 0.4 0.0 0.0 0.0 9.6 88.8 88 Middle 2.5 2.7 0.3 0.3 3.9 16.8 73.6 164 Secondary 1.3 0.8 0.2 1.0 2.3 20.8 73.5 116 Secondary+ 8.8 2.9 1.2 3.3 2.8 9.7 71.1 344 Occupation Cultivator 1.0 1.4 0.7 1.0 1.8 13.9 80.1 398 Agricultural labourer 4.0 0.0 0.7 1.8 0.0 5.7 87.7 67 Non-agricultural labourer 3.7 1.1 0.6 2.0 3.8 16.5 72.3 245 Business 2.2 0.7 0.8 2.1 2.5 9.8 81.8 327 Salaried employment 4.5 2.5 0.0 1.9 2.4 14.2 74.0 208 Housework 0.0 0.0 0.0 0.0 0.0 0.0 100.0 1 Student 57.4 5.1 0.0 15.8 8.2 2.8 10.7 14 Religion Hindu 3.1 1.2 0.6 1.8 2.6 12.3 78.2 1129 Muslim 3.5 2.2 0.0 1.3 1.4 14.4 77.2 132 Other 5.2 0.0 0.0 0.0 5.2 0.0 89.6 12 Caste/Tribe Scheduled Caste 3.1 0.5 0.1 1.7 2.0 6.8 85.8 197 Scheduled Tribe 4.9 2.7 0.1 3.6 3.6 10.1 74.6 251 Other 2.6 1.0 0.9 1.2 2.3 14.9 77.1 825 Travel due to work Yes 5.2 1.2 0.2 2.4 2.3 10.1 78.4 483 No 2.0 1.3 0.8 1.4 2.7 13.7 78.1 790 Total 3.1 1.2 0.6 1.8 2.5 12.4 78.3 1273 Note: Total includes cases with missing information on occupation.

115
Table 4.18TF: Percent of TOTAL FEMALE respondents who ever had sex according to frequency of sex with the last partner, by background characteristics
Characteristics
Once only
Few times only
Less than once in a
month
Once in a month
Less than once in a
week
Once in a week
More than once in a
week
Number
Place of residence
Rural 0.0 1.6 2.8 3.4 5.7 18.9 67.6 1089
Urban 0.1 2.3 6.2 4.1 4.5 24.2 58.5 948 Age 15-19 0.0 2.9 0.0 0.5 2.3 11.8 82.4 85 20-24 0.0 1.5 1.9 1.1 4.1 16.2 75.2 288 25-29 0.0 1.8 2.0 1.5 2.0 17.3 75.5 418 30-34 0.0 2.6 1.5 2.5 4.8 19.2 69.3 350 35-39 0.0 1.5 3.9 3.5 5.5 21.1 64.4 379 40-44 0.2 1.6 10.1 4.1 6.9 31.0 46.1 273 45-49 0.0 2.1 9.7 12.9 10.9 28.3 36.0 244 Marital status Currently married 0.0 1.2 3.7 3.6 4.8 20.8 65.9 1839 Marriage dissolved 0.0 8.5 8.6 5.2 9.4 24.2 43.7 195 Never married 0.0 100.0 0.0 0.0 0.0 0.0 0.0 3 Literacy and education Illiterate 0.1 1.9 5.0 4.2 5.4 21.3 62.1 965 Primary 0.0 1.6 0.5 1.5 2.1 18.3 76.1 93 Middle 0.0 1.4 4.0 4.9 5.0 19.4 65.0 304 Secondary 0.0 2.4 4.3 0.7 7.5 18.8 66.2 222 Secondary+ 0.0 2.0 2.5 3.7 4.5 23.9 63.4 453 Occupation Cultivator 0.0 0.0 1.4 2.8 3.0 20.0 72.9 129 Agricultural labourer 0.0 3.3 1.3 0.8 0.9 16.4 77.3 86 Non-agricultural labourer 0.0 1.9 5.1 6.5 8.8 16.5 61.3 275 Business 0.0 1.3 1.0 1.5 5.5 19.8 70.9 110 Salaried employment 0.0 8.4 8.0 2.5 1.6 27.7 51.7 79 Housework 0.0 1.7 4.8 3.8 5.3 22.7 61.6 1334 Student 0.0 20.0 0.0 0.0 0.0 10.0 70.0 11 Religion Hindu 0.0 2.1 3.9 3.7 5.4 20.8 64.0 1808 Muslim 0.0 0.0 5.8 3.1 3.3 21.8 66.0 213 Other 0.0 0.0 11.1 6.6 3.6 34.8 43.9 15 Caste/Tribe Scheduled Caste 0.0 1.0 2.9 3.0 5.5 15.1 72.4 325 Scheduled Tribe 0.0 1.7 4.2 5.6 7.9 18.4 62.1 386 Other 0.0 2.2 4.5 3.3 4.3 23.6 62.0 1325 Travel due to work Yes 0.0 1.8 0.4 2.4 6.9 16.9 71.7 84 No 0.0 1.9 4.4 3.8 5.1 21.3 63.5 1949 Total 0.0 1.9 4.1 3.7 5.2 21.0 64.0 2037 Note: Total includes cases with missing information on occupation, religion, caste/tribe and travel due to work.

116
Table 4.19T: Percent of TOTAL respondents who ever had anal sex with a partner among who ever had sex, by sex and background characteristics
Male Female Total
Characteristic
Anal sex with
woman
Number Anal sex Number Anal sex with a partner
Number
Place of residence
Rural 2.6 717 0.1 1041 1.1 1758
Urban 2.6 555 0.6 927 1.4 1482 Age 15-19 0.0 12 0.0 81 0.0 93 20-24 1.1 96 0.0 278 0.3 374 25-29 3.9 196 0.8 408 2.0 604 30-34 3.6 255 0.3 341 1.7 596 35-39 2.2 276 0.2 365 1.0 641 40-44 2.0 212 0.0 263 0.9 475 45-49 2.1 225 0.1 232 1.1 457 Marital status Currently married 2.6 1190 0.3 1778 1.2 2968 Marriage dissolved 0.0 9 0.5 187 0.5 196 Never married 3.0 73 0.0 3 2.9 76 Literacy and education Illiterate 1.7 561 0.2 918 0.8 1479 Primary 6.4 88 0.0 91 2.6 179 Middle 2.6 163 0.2 297 1.0 460 Secondary 3.2 116 0.7 218 1.7 334 Secondary+ 3.2 344 0.3 444 1.7 788 Occupation Cultivator 2.7 398 0.0 126 1.9 524 Agricultural labourer 1.4 67 0.0 84 0.6 151 Non-agricultural labourer 1.1 245 0.2 262 0.6 507 Business 2.2 326 0.4 108 1.7 434 Salaried employment 6.2 208 0.0 75 4.6 283 Housework 0.0 1 0.4 1296 0.4 1297 Student 0.0 14 0.0 5 0.0 19 Religion Hindu 2.6 1128 0.2 1741 1.1 2869 Muslim 1.5 132 1.2 211 1.3 343 Other 15.6 12 0.0 15 6.5 27 Caste/Tribe Scheduled Caste 3.5 197 0.1 313 1.4 510 Scheduled Tribe 1.4 249 0.3 361 0.8 610 Other 2.7 826 0.3 1293 1.3 2119 Travel due to work Yes 3.5 482 0.0 82 2.8 564 No 2.1 790 0.3 1882 0.8 2672 Total 2.6 1272 0.3 1968 1.2 3240 Note: Total includes cases with missing information on occupation, religion, caste/tribe and travel due to work.

117
Table 4.20T: Percent of TOTAL male respondents who ever had anal sex with a man, by background characteristics Total
Characteristic Percent Number
Place of residence
Rural 0.8 1127
Urban 0.2 939 Age 15-19 0.4 320 20-24 0.1 426 25-29 1.3 319 30-34 0.0 279 35-39 0.7 279 40-44 0.0 216 45-49 1.5 227 Marital status Currently married 0.7 1190 Marriage dissolved 0.0 9 Never married 0.4 867 Literacy and education Illiterate 0.4 696 Primary 0.0 112 Middle 2.2 246 Secondary 0.1 228 Secondary+ 0.4 784 Occupation Cultivator 1.1 567 Agricultural labourer 0.0 90 Non-agricultural labourer 0.3 373 Business 0.5 478 Salaried employment 0.0 298 Housework 0.0 5 Student 0.4 236 Religion Hindu 0.6 1856 Muslim 0.0 192 Other 0.0 18 Caste/Tribe Scheduled Caste 0.1 348 Scheduled Tribe 1.5 406 Other 0.4 1312 Travel due to work Yes 0.7 739 No 0.5 1327 Total 0.6 2066 Note: Total includes cases with missing information on occupation.

118
Table 4.21RM: Percent of RURAL MALES who have reported specific sexual behaviours, according to selected background characteristics
Characteristic
Had sex with a non-
regular partner during last 12 months
Had sex with more
than 1 partner during last 3
months
Had sex with more
than 1 partner during last 12 months
Ever had sex with
more than 1 partner
Ever paid/
received money for sex
Any of the risk
behavior Number Age 15-19 0.8 0.8 0.8 1.5 1.5 1.5 170 20-24 3.1 0.7 1.2 18.7 1.1 18.7 224 25-29 6.0 1.1 5.7 18.3 1.6 18.3 190 30-34 2.5 0.2 3.0 24.0 1.5 24.0 134 35-39 0.6 0.0 0.0 16.0 0.4 16.0 153 40-44 0.3 3.7 3.7 33.4 2.8 33.4 124 45-49 2.2 1.5 3.3 24.9 1.0 24.9 134 Marital status Currently married 2.5 1.0 3.2 27.7 1.4 27.7 670 Marriage dissolved 0.0 0.0 0.0 19.3 0.0 19.3 6 Never married 2.5 1.0 1.3 3.2 1.3 3.2 453 Literacy and education Illiterate 1.9 1.8 2.2 21.0 1.5 21.0 474 Primary 5.1 0.0 4.3 20.6 1.3 20.6 74 Middle 0.9 0.7 0.7 12.8 1.1 12.8 125 Secondary 0.6 0.0 1.6 14.9 2.9 14.9 138 Secondary+ 4.2 0.7 3.5 16.4 0.7 16.4 318 Occupation Cultivator 1.5 0.6 1.4 15.8 1.9 15.8 516 Agricultural labourer 4.3 4.3 4.3 29.7 1.2 29.7 83 Non-agricultural labourer 0.9 0.0 0.2 11.6 0.7 11.6 162 Business 1.5 2.4 3.6 31.7 0.4 31.7 173 Salaried employment 4.2 1.4 3.8 26.0 2.4 26.0 77 Housework 0.0 0.0 0.0 0.0 0.0 0.0 3 Student 1.5 0.7 0.7 1.5 0.7 1.5 103 Religion Hindu 2.4 1.1 2.5 18.1 1.3 18.1 1098 Muslim 8.3 0.0 2.3 14.3 5.3 14.3 29 Other 0.0 0.0 0.0 0.0 0.0 0.0 2 Caste/Tribe Scheduled Caste 3.9 0.3 3.5 25.2 0.9 25.2 241 Scheduled Tribe 3.0 3.2 4.0 24.1 2.4 24.1 254 Other 1.6 0.5 1.3 11.9 1.1 11.9 634 Travel due to work Yes 2.6 1.5 3.0 18.2 1.9 18.2 497 No 2.4 0.7 2.1 18.0 1.0 18.0 632 Total 2.5 1.0 2.5 18.1 1.4 18.1 1129 Note: Total includes cases with missing information on occupation.
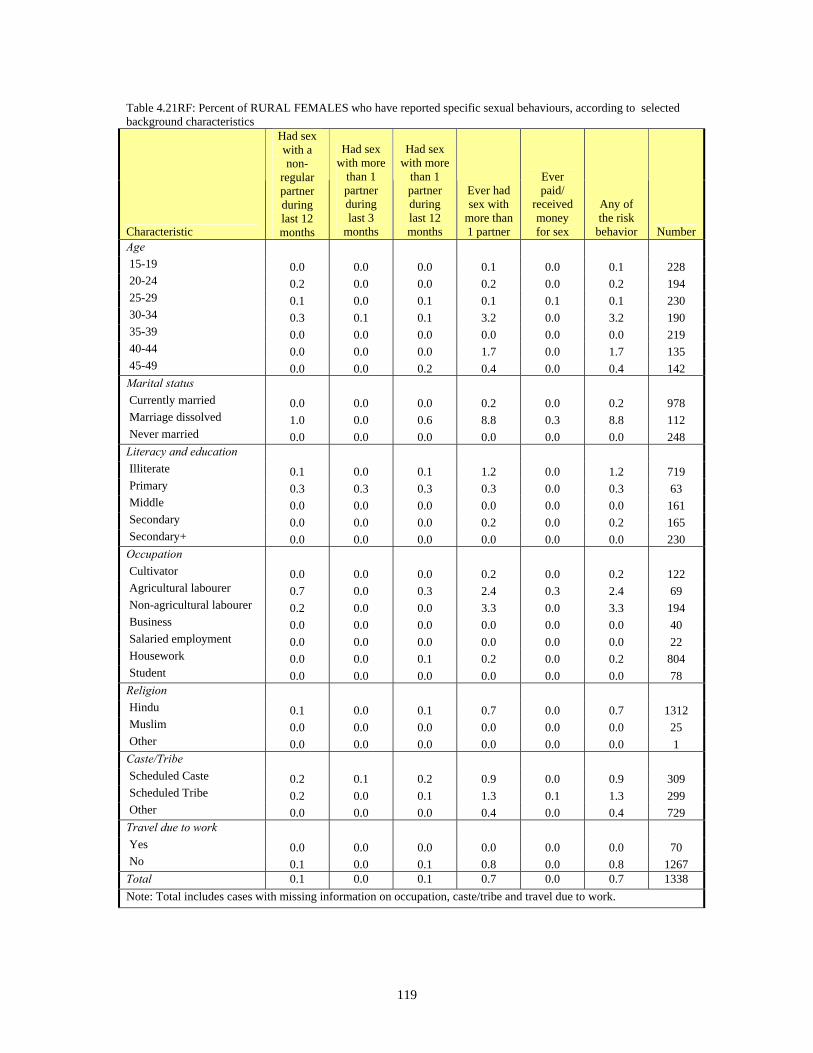
119
Table 4.21RF: Percent of RURAL FEMALES who have reported specific sexual behaviours, according to selected background characteristics
Characteristic
Had sex with a non-
regular partner during last 12 months
Had sex with more
than 1 partner during last 3
months
Had sex with more
than 1 partner during last 12 months
Ever had sex with
more than 1 partner
Ever paid/
received money for sex
Any of the risk
behavior Number Age 15-19 0.0 0.0 0.0 0.1 0.0 0.1 228 20-24 0.2 0.0 0.0 0.2 0.0 0.2 194 25-29 0.1 0.0 0.1 0.1 0.1 0.1 230 30-34 0.3 0.1 0.1 3.2 0.0 3.2 190 35-39 0.0 0.0 0.0 0.0 0.0 0.0 219 40-44 0.0 0.0 0.0 1.7 0.0 1.7 135 45-49 0.0 0.0 0.2 0.4 0.0 0.4 142 Marital status Currently married 0.0 0.0 0.0 0.2 0.0 0.2 978 Marriage dissolved 1.0 0.0 0.6 8.8 0.3 8.8 112 Never married 0.0 0.0 0.0 0.0 0.0 0.0 248 Literacy and education Illiterate 0.1 0.0 0.1 1.2 0.0 1.2 719 Primary 0.3 0.3 0.3 0.3 0.0 0.3 63 Middle 0.0 0.0 0.0 0.0 0.0 0.0 161 Secondary 0.0 0.0 0.0 0.2 0.0 0.2 165 Secondary+ 0.0 0.0 0.0 0.0 0.0 0.0 230 Occupation Cultivator 0.0 0.0 0.0 0.2 0.0 0.2 122 Agricultural labourer 0.7 0.0 0.3 2.4 0.3 2.4 69 Non-agricultural labourer 0.2 0.0 0.0 3.3 0.0 3.3 194 Business 0.0 0.0 0.0 0.0 0.0 0.0 40 Salaried employment 0.0 0.0 0.0 0.0 0.0 0.0 22 Housework 0.0 0.0 0.1 0.2 0.0 0.2 804 Student 0.0 0.0 0.0 0.0 0.0 0.0 78 Religion Hindu 0.1 0.0 0.1 0.7 0.0 0.7 1312 Muslim 0.0 0.0 0.0 0.0 0.0 0.0 25 Other 0.0 0.0 0.0 0.0 0.0 0.0 1 Caste/Tribe Scheduled Caste 0.2 0.1 0.2 0.9 0.0 0.9 309 Scheduled Tribe 0.2 0.0 0.1 1.3 0.1 1.3 299 Other 0.0 0.0 0.0 0.4 0.0 0.4 729 Travel due to work Yes 0.0 0.0 0.0 0.0 0.0 0.0 70 No 0.1 0.0 0.1 0.8 0.0 0.8 1267 Total 0.1 0.0 0.1 0.7 0.0 0.7 1338 Note: Total includes cases with missing information on occupation, caste/tribe and travel due to work.

120
Table 4.21R: Percent of RURAL respondents who have reported specific sexual behaviours, according to selected background characteristics
Characteristic
Had sex with a non-
regular partner during last 12 months
Had sex with more
than 1 partner during last 3
months
Had sex with more
than 1 partner during last 12 months
Ever had sex with
more than 1 partner
Ever paid/
received money for sex
Any of the risk
behavior Number Age 15-19 0.4 0.4 0.4 0.8 0.7 0.8 398 20-24 1.8 0.4 0.7 10.6 0.6 10.6 418 25-29 2.9 0.5 2.7 8.6 0.8 8.6 420 30-34 1.1 0.2 1.2 11.4 0.6 11.4 324 35-39 0.2 0.0 0.0 5.6 0.1 5.6 372 40-44 0.2 1.7 1.7 16.2 1.3 16.2 259 45-49 1.1 0.8 1.8 12.9 0.5 12.9 276 Marital status Currently married 1.0 0.4 1.3 11.4 0.6 11.4 1648 Marriage dissolved 1.0 0.0 0.6 9.5 0.3 9.5 118 Never married 1.7 0.7 0.9 2.1 0.9 2.1 701 Literacy and education Illiterate 0.8 0.7 0.9 9.1 0.6 9.1 1193 Primary 2.4 0.2 2.1 9.3 0.6 9.3 137 Middle 0.4 0.3 0.3 5.6 0.5 5.6 286 Secondary 0.3 0.0 0.8 7.1 1.4 7.1 303 Secondary+ 2.7 0.4 2.3 10.7 0.4 10.7 548 Occupation Cultivator 1.1 0.4 1.0 12.0 1.4 12.0 638 Agricultural labourer 2.6 2.2 2.4 16.4 0.8 16.4 152 Non-agricultural labourer 0.5 0.0 0.1 7.4 0.3 7.4 356 Business 1.2 1.9 2.8 24.8 0.3 24.8 213 Salaried employment 3.3 1.1 3.0 20.4 1.9 20.4 99 Housework 0.0 0.0 0.1 0.2 0.0 0.2 807 Student 1.0 0.5 0.5 1.0 0.5 1.0 181 Religion Hindu 1.2 0.5 1.2 8.8 0.6 8.8 2410 Muslim 4.5 0.0 1.2 7.8 2.9 7.8 54 Other 0.0 0.0 0.0 0.0 0.0 0.0 2 Caste/Tribe Scheduled Caste 1.9 0.2 1.7 12.1 0.4 12.1 550 Scheduled Tribe 1.5 1.4 1.9 11.7 1.1 11.7 553 Other 0.7 0.2 0.6 5.8 0.5 5.8 1363 Travel due to work Yes 2.2 1.2 2.5 15.2 1.6 15.2 567 No 0.9 0.3 0.8 6.9 0.4 6.9 1899 Total 1.2 0.5 1.2 8.8 0.6 8.8 2467 Note: Total includes cases with missing information on occupation, religion, caste/tribe and travel due to work.

121
Table 4.21UM: Percent of URBAN MALES who have reported specific sexual behaviours, according to selected background characteristics
Characteristic
Had sex with a non-
regular partner during last 12 months
Had sex with more
than 1 partner during last 3
months
Had sex with more
than 1 partner during last 12 months
Ever had sex with
more than 1 partner
Ever paid/
received money for sex
Any of the risk
behavior Number Age 15-19 0.0 0.0 0.0 0.0 0.0 0.0 161 20-24 2.3 0.2 0.6 3.0 2.3 3.3 204 25-29 3.8 1.4 3.6 9.2 2.1 9.2 132 30-34 4.2 5.0 6.4 15.4 1.8 15.4 145 35-39 1.9 1.9 1.9 11.1 4.0 11.1 127 40-44 0.8 0.0 0.8 17.0 3.8 17.0 92 45-49 0.0 4.0 1.5 19.4 5.4 19.4 93 Marital status Currently married 2.2 2.8 3.2 14.6 3.0 14.6 522 Marriage dissolved 14.9 0.0 14.9 14.9 14.9 14.9 3 Never married 1.5 0.1 0.4 2.2 1.6 2.4 429 Literacy and education Illiterate 3.1 2.9 4.5 15.7 2.4 15.7 227 Primary 8.1 10.3 10.3 20.3 6.8 20.3 39 Middle 1.9 1.8 0.6 11.9 4.7 12.5 123 Secondary 1.1 0.7 1.8 7.7 3.0 7.7 92 Secondary+ 1.0 0.3 0.4 4.1 1.3 4.1 473 Occupation Cultivator 6.0 3.6 6.0 21.5 0.0 21.5 52 Agricultural labourer 7.2 7.2 7.2 7.2 13.6 13.6 8 Non-agricultural labourer 1.7 2.5 2.2 12.0 1.9 12.0 216 Business 2.0 1.5 2.1 8.9 2.4 8.9 308 Salaried employment 2.0 0.3 1.0 8.1 4.6 8.1 221 Housework 0.0 0.0 0.0 0.0 0.0 0.0 2 Student 0.0 0.0 0.0 0.5 0.5 0.5 139 Religion Hindu 2.2 1.8 2.2 10.4 2.7 10.4 768 Muslim 1.2 1.1 1.7 4.1 1.4 4.5 170 Other 0.0 0.0 0.0 10.5 0.0 10.5 16 Caste/Tribe Scheduled Caste 1.6 3.1 3.1 11.7 0.8 11.7 108 Scheduled Tribe 4.3 0.0 2.1 9.3 2.5 9.3 157 Other 1.5 1.8 1.9 8.9 2.7 9.0 689 Travel due to work Yes 2.1 3.4 2.6 12.1 3.0 12.4 245 No 1.9 0.9 1.9 8.2 2.3 8.2 709 Total 2.0 1.7 2.1 9.3 2.5 9.4 954 Note: Total includes cases with missing information on occupation.

122
Table 4.21UF: Percent of URBAN FEMALES who have reported specific sexual behaviours, according to selected background characteristics
Characteristic
Had sex with a non-
regular partner during last 12 months
Had sex with more
than 1 partner during last 3
months
Had sex with more
than 1 partner during last 12 months
Ever had sex with
more than 1 partner
Ever paid/
received money for sex
Any of the risk
behavior Number Age 15-19 0.0 0.0 0.0 0.0 0.0 0.0 203 20-24 0.0 0.0 0.0 0.0 0.0 0.0 208 25-29 0.0 0.0 0.0 0.4 0.0 0.4 224 30-34 2.2 1.8 1.8 4.1 1.7 4.1 175 35-39 0.0 0.0 0.0 0.0 0.0 0.0 175 40-44 0.0 0.0 0.0 1.2 0.0 1.2 142 45-49 2.4 0.0 2.4 4.6 2.4 4.6 105 Marital status Currently married 0.2 0.1 0.2 0.5 0.1 0.5 861 Marriage dissolved 5.9 2.9 5.0 11.7 5.7 11.7 85 Never married 0.0 0.0 0.0 0.0 0.0 0.0 286 Literacy and education Illiterate 1.1 0.9 1.1 2.1 0.7 2.1 308 Primary 0.0 0.0 0.0 0.0 0.0 0.0 41 Middle 1.3 0.0 0.9 2.7 1.6 2.7 198 Secondary 0.0 0.0 0.0 0.0 0.0 0.0 136 Secondary+ 0.0 0.0 0.0 0.3 0.0 0.3 549 Occupation Cultivator 0.0 0.0 0.0 0.0 0.0 0.0 8 Agricultural labourer 5.4 0.0 5.4 5.4 5.4 5.4 19 Non-agricultural labourer 1.0 0.0 0.5 1.0 1.0 1.0 115 Business 0.0 0.0 0.0 1.0 0.5 1.0 106 Salaried employment 1.0 1.0 1.0 9.5 0.0 9.5 77 Housework 0.3 0.3 0.3 0.5 0.2 0.5 764 Student 0.0 0.0 0.0 0.0 0.0 0.0 136 Religion Hindu 0.6 0.3 0.6 1.3 0.4 1.3 956 Muslim 0.3 0.0 0.0 0.9 0.5 0.9 254 Other 0.0 0.0 0.0 0.0 0.0 0.0 22 Caste/Tribe Scheduled Caste 0.0 0.0 0.0 0.0 0.0 0.0 131 Scheduled Tribe 0.8 0.4 0.8 2.1 0.4 2.1 188 Other 0.5 0.3 0.5 1.2 0.5 1.2 913 Travel due to work Yes 0.0 0.0 0.0 4.0 0.0 4.0 38 No 0.5 0.3 0.5 1.1 0.5 1.1 1191 Total 0.5 0.3 0.5 1.2 0.4 1.2 1232 Note: Total includes cases with missing information on occupation and travel due to work.

123
Table 4.21U: Percent URBAN respondents who have reported specific sexual behaviours, according to selected background characteristics
Characteristic
Had sex with a non-
regular partner during last 12 months
Had sex with more
than 1 partner during last 3
months
Had sex with more
than 1 partner during last 12 months
Ever had sex with
more than 1 partner
Ever paid/
received money for sex
Any of the risk
behavior Number Age 15-19 0.0 0.0 0.0 0.0 0.0 0.0 364 20-24 1.1 0.1 0.3 1.4 1.1 1.6 412 25-29 1.4 0.5 1.4 3.7 0.8 3.7 356 30-34 3.1 3.3 3.9 9.3 1.7 9.3 320 35-39 0.8 0.8 0.8 4.8 1.7 4.8 302 40-44 0.3 0.0 0.3 7.7 1.5 7.7 234 45-49 1.2 1.9 2.0 11.7 3.8 11.7 198 Marital status Currently married 0.9 1.2 1.3 6.0 1.2 6.0 1383 Marriage dissolved 6.3 2.8 5.5 11.9 6.1 11.9 88 Never married 0.9 0.1 0.3 1.3 0.9 1.4 715 Literacy and education Illiterate 1.9 1.7 2.5 7.8 1.4 7.8 535 Primary 4.0 5.1 5.1 9.9 3.3 9.9 80 Middle 1.5 0.7 0.8 6.3 2.8 6.6 321 Secondary 0.5 0.3 0.8 3.3 1.3 3.3 228 Secondary+ 0.5 0.1 0.2 2.1 0.6 2.1 1022 Occupation Cultivator 5.1 3.1 5.1 18.4 0.0 18.4 60 Agricultural labourer 5.9 1.8 5.9 5.9 7.5 7.5 27 Non-agricultural labourer 1.4 1.6 1.6 8.0 1.6 8.0 331 Business 1.5 1.1 1.5 6.8 1.9 6.8 414 Salaried employment 1.7 0.5 1.0 8.5 3.5 8.5 298 Housework 0.3 0.3 0.3 0.5 0.2 0.5 766 Student 0.0 0.0 0.0 0.3 0.3 0.3 275 Religion Hindu 1.3 1.0 1.3 5.4 1.5 5.4 1724 Muslim 0.7 0.5 0.7 2.2 0.9 2.4 424 Other 0.0 0.0 0.0 4.3 0.0 4.3 38 Caste/Tribe Scheduled Caste 0.7 1.4 1.4 5.3 0.4 5.3 239 Scheduled Tribe 2.5 0.2 1.4 5.6 1.4 5.6 345 Other 1.0 0.9 1.1 4.5 1.4 4.5 1602 Travel due to work Yes 1.8 3.0 2.3 11.1 2.6 11.3 283 No 1.0 0.5 1.0 3.7 1.1 3.7 1900 Total 1.2 0.9 1.2 4.7 1.3 4.8 2186 Note: Total includes cases with missing information on occupation and travel due to index.

124
Table 4.21TM: Percent of TOTAL MALES who have reported specific sexual behaviours, according to selected background characteristics
Characteristic
Had sex with a non-
regular partner during last 12 months
Had sex with more
than 1 partner during last 3
months
Had sex with more
than 1 partner during last 12 months
Ever had sex with
more than 1 partner
Ever paid/
received money for sex
Any of the risk
behavior Number Place of residence Rural 2.5 1.0 2.5 18.1 1.4 18.1 1129 Urban 2.0 1.7 2.1 9.3 2.5 9.4 954 Age 15-19 0.5 0.5 0.5 0.9 0.9 0.9 331 20-24 2.8 0.5 0.9 12.5 1.6 12.7 428 25-29 5.3 1.2 5.0 15.2 1.7 15.2 322 30-34 3.3 2.5 4.6 19.9 1.6 19.9 279 35-39 1.2 0.8 0.8 13.9 2.0 13.9 280 40-44 0.5 2.2 2.5 26.8 3.2 26.8 216 45-49 1.5 2.3 2.7 23.2 2.4 23.2 227 Marital status Currently married 2.4 1.7 3.2 22.8 2.0 22.8 1192 Marriage dissolved 5.6 0.0 5.6 17.6 5.6 17.6 9 Never married 2.1 0.6 1.0 2.8 1.4 2.8 882 Literacy and education Illiterate 2.3 2.1 2.9 19.5 1.8 19.5 701 Primary 6.1 3.3 6.2 20.5 3.0 20.5 113 Middle 1.3 1.1 0.6 12.4 2.6 12.7 248 Secondary 0.8 0.3 1.7 12.3 2.9 12.3 230 Secondary+ 2.6 0.5 2.0 10.2 1.0 10.2 791 Occupation Cultivator 1.9 0.8 1.8 16.3 1.7 16.3 568 Agricultural labourer 4.5 4.5 4.5 27.7 2.3 28.2 91 Non-agricultural labourer 1.3 1.3 1.2 11.8 1.4 11.8 378 Business 1.8 1.8 2.6 17.4 1.6 17.4 481 Salaried employment 2.6 0.6 1.8 13.0 4.0 13.0 298 Housework 0.0 0.0 0.0 0.0 0.0 0.0 5 Student 0.8 0.4 0.4 1.0 0.6 1.0 242 Religion Hindu 2.4 1.3 2.4 15.5 1.8 15.5 1866 Muslim 1.8 1.0 1.8 4.9 1.7 5.3 199 Other 0.0 0.0 0.0 10.1 0.0 10.1 18 Caste/Tribe Scheduled Caste 3.4 0.9 3.4 22.3 0.8 22.3 349 Scheduled Tribe 3.4 2.2 3.4 19.4 2.4 19.4 411 Other 1.5 1.1 1.6 10.5 1.9 10.6 1323 Travel due to work Yes 2.5 2.1 2.8 16.4 2.2 16.4 742 No 2.2 0.8 2.0 13.7 1.5 13.7 1341 Total 2.3 1.3 2.3 14.6 1.8 14.7 2083 Note: Total includes cases with missing information on occupation.

125
Table 4.21TF: Percent of TOTAL FEMALES who have reported specific sexual behaviours, according to selected background characteristics
Characteristic
Had sex with a non-
regular partner during last 12 months
Had sex with more
than 1 partner during last 3
months
Had sex with more
than 1 partner during last 12 months
Ever had sex with
more than 1 partner
Ever paid/
received money for sex
Any of the risk
behavior Number Place of residence Rural 0.1 0.0 0.1 0.7 0.0 0.7 1338.0 Urban 0.5 0.3 0.5 1.2 0.4 1.2 1232.0 Age 15-19 0.0 0.0 0.0 0.1 0.0 0.1 431 20-24 0.1 0.0 0.0 0.1 0.0 0.1 402 25-29 0.1 0.0 0.1 0.2 0.1 0.2 454 30-34 1.1 0.8 0.8 3.5 0.7 3.5 365 35-39 0.0 0.0 0.0 0.0 0.0 0.0 394 40-44 0.0 0.0 0.0 1.5 0.0 1.5 277 45-49 0.8 0.0 0.9 1.8 0.8 1.8 247 Marital status Currently married 0.1 0.0 0.1 0.3 0.0 0.3 1839 Marriage dissolved 3.1 1.3 2.5 10.1 2.6 10.1 197 Never married 0.0 0.0 0.0 0.0 0.0 0.0 534 Literacy and education Illiterate 0.4 0.2 0.3 1.5 0.2 1.5 1027 Primary 0.2 0.2 0.2 0.2 0.0 0.2 104 Middle 0.6 0.0 0.4 1.3 0.7 1.3 359 Secondary 0.0 0.0 0.0 0.1 0.0 0.1 301 Secondary+ 0.0 0.0 0.0 0.2 0.0 0.2 779 Occupation Cultivator 0.0 0.0 0.0 0.2 0.0 0.2 130 Agricultural labourer 1.8 0.0 1.5 3.1 1.5 3.1 88 Non-agricultural labourer 0.5 0.0 0.2 2.5 0.4 2.5 309 Business 0.0 0.0 0.0 0.7 0.3 0.7 146 Salaried employment 0.8 0.8 0.8 7.3 0.0 7.3 99 Housework 0.2 0.2 0.2 0.3 0.1 0.3 1568 Student 0.0 0.0 0.0 0.0 0.0 0.0 214 Religion Hindu 0.3 0.1 0.2 0.9 0.2 0.9 2268 Muslim 0.3 0.0 0.0 0.9 0.5 0.9 279 Other 0.0 0.0 0.0 0.0 0.0 0.0 22 Caste/Tribe Scheduled Caste 0.1 0.1 0.1 0.7 0.0 0.7 440 Scheduled Tribe 0.4 0.1 0.3 1.5 0.2 1.5 487 Other 0.3 0.1 0.2 0.8 0.3 0.8 1642 Travel due to work Yes 0.0 0.0 0.0 1.0 0.0 1.0 108 No 0.3 0.1 0.2 0.9 0.2 0.9 2458 Total 0.3 0.1 0.2 0.9 0.2 0.9 2570 Note: Total includes cases with missing information on occupation, religion, caste/tribe and travel due to work.

126
Table 4.21T: Percent of TOTAL respondents who have reported specific sexual behaviours, according to selected background characteristics
Characteristic
Had sex with a non-
regular partner during last 12 months
Had sex with more
than 1 partner during last 3
months
Had sex with more
than 1 partner during last 12 months
Ever had sex with
more than 1 partner
Ever paid/
received money for sex
Any of the risk
behavior Number Place of residence Rural 1.2 0.5 1.2 8.8 0.6 8.8 2467 Urban 1.2 0.9 1.2 4.7 1.3 4.8 2186 Age 15-19 0.2 0.2 0.2 0.5 0.4 0.5 762 20-24 1.5 0.3 0.5 6.6 0.8 6.7 830 25-29 2.3 0.5 2.2 6.7 0.8 6.7 776 30-34 2.0 1.5 2.4 10.4 1.1 10.4 644 35-39 0.5 0.3 0.3 5.3 0.8 5.3 674 40-44 0.2 1.0 1.1 12.5 1.4 12.5 493 45-49 1.1 1.1 1.8 12.5 1.6 12.5 474 Marital status Currently married 1.0 0.7 1.3 9.3 0.8 9.3 3031 Marriage dissolved 3.3 1.2 2.7 10.5 2.8 10.5 206 Never married 1.3 0.4 0.6 1.8 0.9 1.8 1416 Literacy and education Illiterate 1.1 1.0 1.4 8.8 0.8 8.8 1728 Primary 2.9 1.6 3.0 9.5 1.4 9.5 217 Middle 0.9 0.5 0.5 5.9 1.5 6.0 607 Secondary 0.4 0.1 0.8 5.6 1.3 5.6 531 Secondary+ 1.4 0.3 1.1 5.7 0.5 5.7 1570 Occupation Cultivator 1.5 0.6 1.4 12.5 1.3 12.5 698 Agricultural labourer 3.1 2.1 2.9 14.7 1.9 14.9 179 Non-agricultural labourer 0.9 0.7 0.8 7.7 0.9 7.7 687 Business 1.4 1.4 2.0 13.2 1.3 13.2 627 Salaried employment 2.1 0.7 1.5 11.6 3.0 11.6 397 Housework 0.2 0.2 0.2 0.3 0.1 0.3 1573 Student 0.5 0.2 0.2 0.6 0.4 0.6 456 Religion Hindu 1.2 0.7 1.2 7.6 0.9 7.6 4134 Muslim 0.9 0.4 0.7 2.6 1.0 2.7 478 Other 0.0 0.0 0.0 4.2 0.0 4.2 40 Caste/Tribe Scheduled Caste 1.6 0.7 1.7 10.7 0.4 10.7 789 Scheduled Tribe 1.8 0.4 1.7 9.9 1.2 9.9 898 Other 0.8 0.0 0.8 5.2 1.0 5.2 2965 Travel due to work Yes 2.1 1.8 2.4 14.0 1.9 14.0 850 No 1.0 0.4 0.9 5.5 0.7 5.5 3799 Total 1.2 0.6 1.2 7.2 0.9 7.2 4653 Note: Total includes cases with missing information on occupation, religion, caste/tribe and travel due to work.

127
Table 4.22RM: Percent distribution of RURAL MALE respondents by whether seen or heard of a condom, according to selected background characteristics
Condom
Characteristic Seen Heard but not seen
Neither heard nor seen
Total percent Number
Age 15-19 56.6 33.4 10.0 100 170 20-24 66.7 22.1 11.2 100 224 25-29 69.5 19.0 11.5 100 190 30-34 62.3 19.3 18.4 100 134 35-39 55.9 18.0 26.2 100 153 40-44 60.3 14.6 25.1 100 124 45-49 38.9 26.3 34.8 100 134 Marital status Currently married 57.5 19.6 22.9 100 670 Marriage dissolved 13.9 66.9 19.3 100 6 Never married 62.8 26.8 10.4 100 453 Literacy and education Illiterate 44.3 26.0 29.8 100 474 Primary 56.8 22.6 20.6 100 74 Middle 71.6 19.6 8.8 100 125 Secondary 69.6 15.8 14.6 100 138 Secondary+ 73.4 21.7 4.9 100 318 Occupation Cultivator 59.6 21.4 19.0 100 516 Agricultural labourer 51.5 23.0 25.5 100 83 Non-agricultural labourer 52.4 23.1 24.6 100 162 Business 67.3 24.1 8.7 100 173 Salaried employment 71.4 19.2 9.4 100 77 Housework 56.8 43.2 0.0 100 3 Student 56.0 31.9 12.1 100 103 Religion Hindu 59.2 22.7 18.1 100 1098 Muslim 71.8 23.0 5.3 100 29 Other 100.0 0.0 0.0 100 2 Caste/Tribe Scheduled Caste 64.6 21.3 14.1 100 241 Scheduled Tribe 66.4 18.1 15.5 100 254 Other 53.7 25.3 21.0 100 634 Travel due to work Yes 58.7 25.0 16.3 100 497 No 59.8 21.0 19.2 100 632 Total 59.4 22.7 18.0 100 1129 Note: Total includes cases with missing information on occupation.

128
Table 4.22RF: Percent distribution of RURAL FEMALE respondents by whether seen or heard of a condom, according to selected background characteristics
Condom
Characteristic Seen Heard but not seen
Neither heard nor seen
Total percent Number
Age 15-19 19.5 41.2 39.3 100 228 20-24 46.1 33.3 20.6 100 194 25-29 24.2 34.1 41.7 100 230 30-34 27.9 21.2 51.0 100 190 35-39 21.3 27.8 50.9 100 219 40-44 16.4 29.8 53.8 100 135 45-49 16.1 27.1 56.8 100 142 Marital status Currently married 25.9 29.2 45.0 100 978 Marriage dissolved 17.9 30.2 51.9 100 112 Never married 23.3 39.0 37.7 100 248 Literacy and education Illiterate 13.9 28.8 57.3 100 719 Primary 21.0 24.1 54.9 100 63 Middle 38.5 28.4 33.1 100 161 Secondary 36.3 43.5 20.2 100 165 Secondary+ 50.7 34.3 15.0 100 230 Occupation Cultivator 15.6 23.2 61.1 100 122 Agricultural labourer 2.2 14.3 83.5 100 69 Non-agricultural labourer 13.9 22.6 63.5 100 194 Business 22.6 23.4 53.9 100 40 Salaried employment 84.8 5.9 9.3 100 22 Housework 30.1 36.9 33.0 100 804 Student 32.7 40.9 26.5 100 78 Religion Hindu 24.8 30.9 44.3 100 1312 Muslim 43.8 27.9 28.3 100 25 Caste/Tribe Scheduled Caste 18.7 25.2 56.1 100 309 Scheduled Tribe 21.5 33.0 45.5 100 299 Other 29.6 32.6 37.7 100 729 Travel due to work Yes 28.6 15.5 55.9 100 70 No 24.6 32.0 43.3 100 1267 Total 24.9 30.9 44.2 100 1338 Note: Total includes cases with missing information on occupation, religion, caste/tribe and travel due to work.
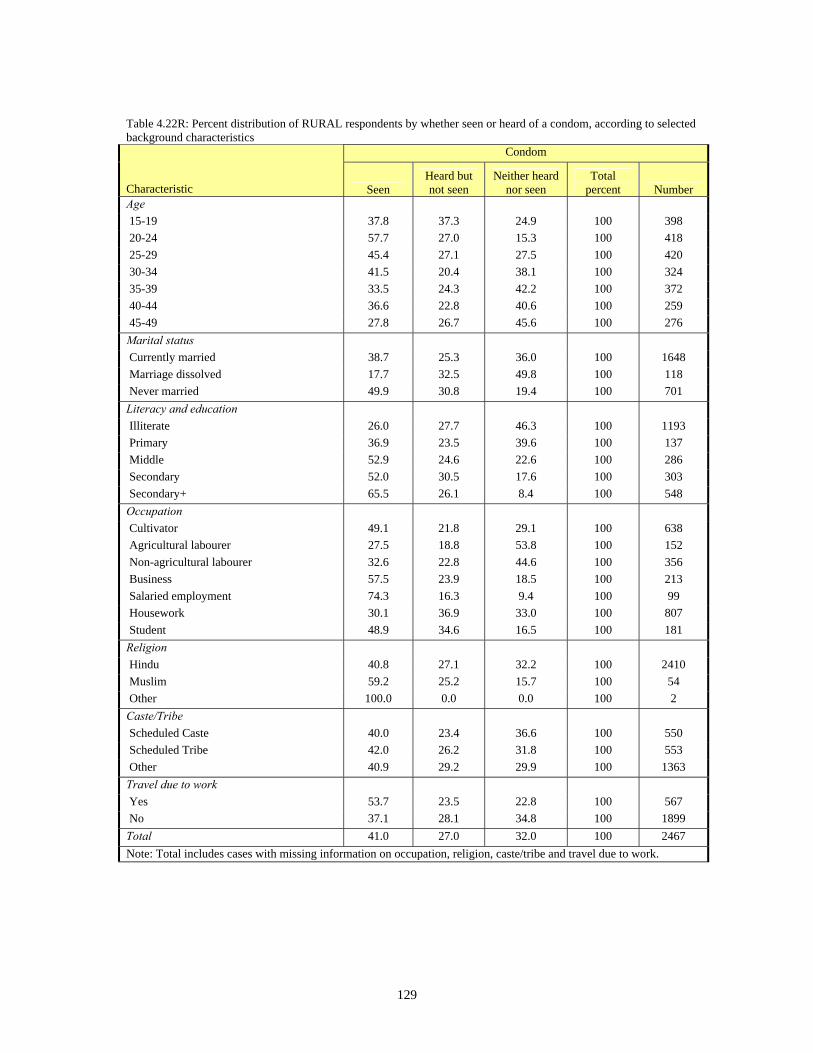
129
Table 4.22R: Percent distribution of RURAL respondents by whether seen or heard of a condom, according to selected background characteristics
Condom
Characteristic Seen Heard but not seen
Neither heard nor seen
Total percent Number
Age 15-19 37.8 37.3 24.9 100 398 20-24 57.7 27.0 15.3 100 418 25-29 45.4 27.1 27.5 100 420 30-34 41.5 20.4 38.1 100 324 35-39 33.5 24.3 42.2 100 372 40-44 36.6 22.8 40.6 100 259 45-49 27.8 26.7 45.6 100 276 Marital status Currently married 38.7 25.3 36.0 100 1648 Marriage dissolved 17.7 32.5 49.8 100 118 Never married 49.9 30.8 19.4 100 701 Literacy and education Illiterate 26.0 27.7 46.3 100 1193 Primary 36.9 23.5 39.6 100 137 Middle 52.9 24.6 22.6 100 286 Secondary 52.0 30.5 17.6 100 303 Secondary+ 65.5 26.1 8.4 100 548 Occupation Cultivator 49.1 21.8 29.1 100 638 Agricultural labourer 27.5 18.8 53.8 100 152 Non-agricultural labourer 32.6 22.8 44.6 100 356 Business 57.5 23.9 18.5 100 213 Salaried employment 74.3 16.3 9.4 100 99 Housework 30.1 36.9 33.0 100 807 Student 48.9 34.6 16.5 100 181 Religion Hindu 40.8 27.1 32.2 100 2410 Muslim 59.2 25.2 15.7 100 54 Other 100.0 0.0 0.0 100 2 Caste/Tribe Scheduled Caste 40.0 23.4 36.6 100 550 Scheduled Tribe 42.0 26.2 31.8 100 553 Other 40.9 29.2 29.9 100 1363 Travel due to work Yes 53.7 23.5 22.8 100 567 No 37.1 28.1 34.8 100 1899 Total 41.0 27.0 32.0 100 2467 Note: Total includes cases with missing information on occupation, religion, caste/tribe and travel due to work.

130
Table 4.22UM: Percent distribution of URBAN MALE respondents by whether seen or heard of a condom, according to selected background characteristics
Condom
Characteristic Seen Heard but not seen
Neither heard nor seen
Total percent Number
Age 15-19 57.6 25.4 17.0 100 161 20-24 83.5 7.9 8.6 100 204 25-29 81.0 14.4 4.7 100 132 30-34 80.9 10.6 8.6 100 145 35-39 79.7 9.2 11.1 100 127 40-44 87.1 6.0 6.9 100 92 45-49 68.5 16.1 15.4 100 93 Marital status Currently married 78.4 11.4 10.3 100 522 Marriage dissolved 100.0 0.0 0.0 100 3 Never married 74.2 15.3 10.5 100 429 Literacy and education Illiterate 59.3 17.8 22.9 100 227 Primary 75.7 14.0 10.4 100 39 Middle 75.3 12.8 11.9 100 123 Secondary 83.0 9.9 7.1 100 92 Secondary+ 85.9 10.9 3.2 100 473 Occupation Cultivator 56.2 20.6 23.3 100 52 Agricultural labourer 36.7 0.0 63.3 100 8 Non-agricultural labourer 69.7 13.3 17.0 100 216 Business 82.2 10.2 7.6 100 308 Salaried employment 86.6 10.7 2.7 100 221 Housework 100.0 0.0 0.0 100 2 Student 73.2 19.8 7.0 100 139 Religion Hindu 76.5 13.5 10.0 100 768 Muslim 77.5 11.6 11.0 100 170 Other 79.7 3.5 16.8 100 16 Caste/Tribe Scheduled Caste 75.9 15.8 8.4 100 108 Scheduled Tribe 74.6 13.7 11.6 100 157 Other 77.3 12.4 10.3 100 689 Travel due to work Yes 82.5 9.4 8.1 100 245 No 74.4 14.4 11.2 100 709 Total 76.7 13.0 10.3 100 954 Note: Total includes cases with missing information on occupation.

131
Table 4.22UF: Percent distribution of URBAN FEMALE respondents by whether seen or heard of a condom, according to selected background characteristics
Condom
Characteristic Seen Heard but not seen
Neither heard nor seen
Total percent Number
Age 15-19 27.6 51.1 21.2 100 203 20-24 51.4 34.6 14.0 100 208 25-29 57.1 23.0 20.0 100 224 30-34 45.2 38.3 16.6 100 175 35-39 51.5 26.1 22.4 100 175 40-44 42.6 34.4 22.9 100 142 45-49 34.6 26.3 39.1 100 104 Marital status Currently married 50.8 28.8 20.4 100 861 Marriage dissolved 25.8 33.8 40.4 100 84 Never married 34.7 49.0 16.2 100 286 Literacy and education Illiterate 27.6 33.2 39.3 100 307 Primary 21.2 49.8 29.0 100 41 Middle 39.3 34.0 26.7 100 198 Secondary 50.4 31.6 18.1 100 136 Secondary+ 61.5 33.2 5.4 100 549 Occupation Cultivator 28.9 13.4 57.8 100 8 Agricultural labourer 10.7 35.1 54.2 100 19 Non-agricultural labourer 21.1 43.5 35.4 100 115 Business 46.3 22.4 31.3 100 106 Salaried employment 62.8 27.4 9.9 100 77 Housework 51.2 31.4 17.4 100 763 Student 37.9 53.7 8.4 100 136 Religion Hindu 44.9 35.4 19.7 100 955 Muslim 43.7 29.2 27.1 100 254 Other 85.2 11.5 3.3 100 22 Caste/Tribe Scheduled Caste 41.6 36.2 22.3 100 131 Scheduled Tribe 38.6 37.7 23.7 100 187 Other 47.2 32.7 20.1 100 913 Travel due to work Yes 37.8 22.7 39.6 100 38 No 45.7 34.1 20.2 100 1190 Total 45.4 33.7 20.8 100 1231 Note: Total includes persons with missing information on occupation and travel due to work.

132
Table 4.22U: Percent distribution of URBAN respondents by whether seen or heard of a condom, according to selected background characteristics
Condom
Characteristic Seen Heard but not seen
Neither heard nor seen
Total percent Number
Age 15-19 41.3 39.4 19.3 100 364 20-24 66.6 21.9 11.4 100 412 25-29 66.0 19.8 14.3 100 356 30-34 61.5 25.6 12.9 100 320 35-39 63.7 18.8 17.5 100 302 40-44 60.8 22.8 16.4 100 234 45-49 50.9 21.4 27.7 100 197 Marital status Currently married 61.5 22.1 16.5 100 1383 Marriage dissolved 29.7 32.0 38.3 100 87 Never married 58.4 28.8 12.8 100 715 Literacy and education Illiterate 40.9 26.7 32.4 100 534 Primary 47.9 32.2 19.9 100 80 Middle 53.5 25.6 20.9 100 321 Secondary 64.2 22.4 13.4 100 228 Secondary+ 73.0 22.7 4.4 100 1022 Occupation Cultivator 52.2 19.5 28.3 100 60 Agricultural labourer 17.3 26.1 56.5 100 27 Non-agricultural labourer 51.9 24.4 23.7 100 331 Business 72.7 13.4 13.9 100 414 Salaried employment 80.5 14.9 4.5 100 298 Housework 51.3 31.3 17.3 100 765 Student 55.8 36.5 7.7 100 275 Religion Hindu 59.0 25.6 15.4 100 1723 Muslim 57.6 22.0 20.5 100 424 Other 82.9 8.3 8.8 100 38 Caste/Tribe Scheduled Caste 57.1 26.9 16.0 100 239 Scheduled Tribe 56.2 26.0 17.8 100 344 Other 60.1 24.0 15.9 100 1602 Travel due to work Yes 76.7 11.1 12.2 100 283 No 56.3 26.9 16.9 100 1899 Total 59.2 24.6 16.2 100 2185 Note: Total includes persons with missing information on occupation and travel due to work.

133
Table 4.24TM: Percent distribution of TOTAL MALE respondents by whether seen or heard of a condom, according to selected background characteristics
Condom
Characteristic Seen Heard but not seen
Neither heard nor seen
Total percent Number
Place of residence Rural 59.4 22.7 18.0 100 1129 Urban 76.7 13.0 10.3 100 954 Age 15-19 57.0 30.3 12.7 100 331 20-24 73.3 16.6 10.2 100 428 25-29 73.4 17.5 9.2 100 322 30-34 71.1 15.2 13.7 100 279 35-39 66.3 14.1 19.6 100 280 40-44 71.2 11.1 17.7 100 216 45-49 48.0 23.2 28.9 100 227 Marital status Currently married 65.3 16.5 18.1 100 1192 Marriage dissolved 46.6 41.5 12.0 100 9 Never married 67.5 22.0 10.5 100 882 Literacy and education Illiterate 48.6 23.6 27.8 100 701 Primary 62.9 19.8 17.3 100 113 Middle 73.2 16.7 10.1 100 248 Secondary 74.4 13.7 11.9 100 230 Secondary+ 79.8 16.2 4.0 100 791 Occupation Cultivator 59.3 21.3 19.4 100 568 Agricultural labourer 50.2 21.0 28.9 100 91 Non-agricultural labourer 61.3 18.0 20.7 100 378 Business 76.7 15.4 8.0 100 481 Salaried employment 82.4 13.0 4.6 100 298 Housework 74.6 25.4 0.0 100 5 Student 64.2 26.2 9.7 100 242 Religion Hindu 65.1 19.5 15.4 100 1866 Muslim 77.0 12.5 10.5 100 199 Other 80.5 3.4 16.1 100 18 Caste/Tribe Scheduled Caste 67.0 20.2 12.9 100 349 Scheduled Tribe 69.0 16.7 14.3 100 411 Other 64.9 19.2 15.9 100 1323 Travel due to work Yes 65.9 20.3 13.8 100 742 No 66.2 18.1 15.7 100 1341 Total 66.1 18.9 15.0 100 2083 Note: Total includes cases with missing information on occupation.
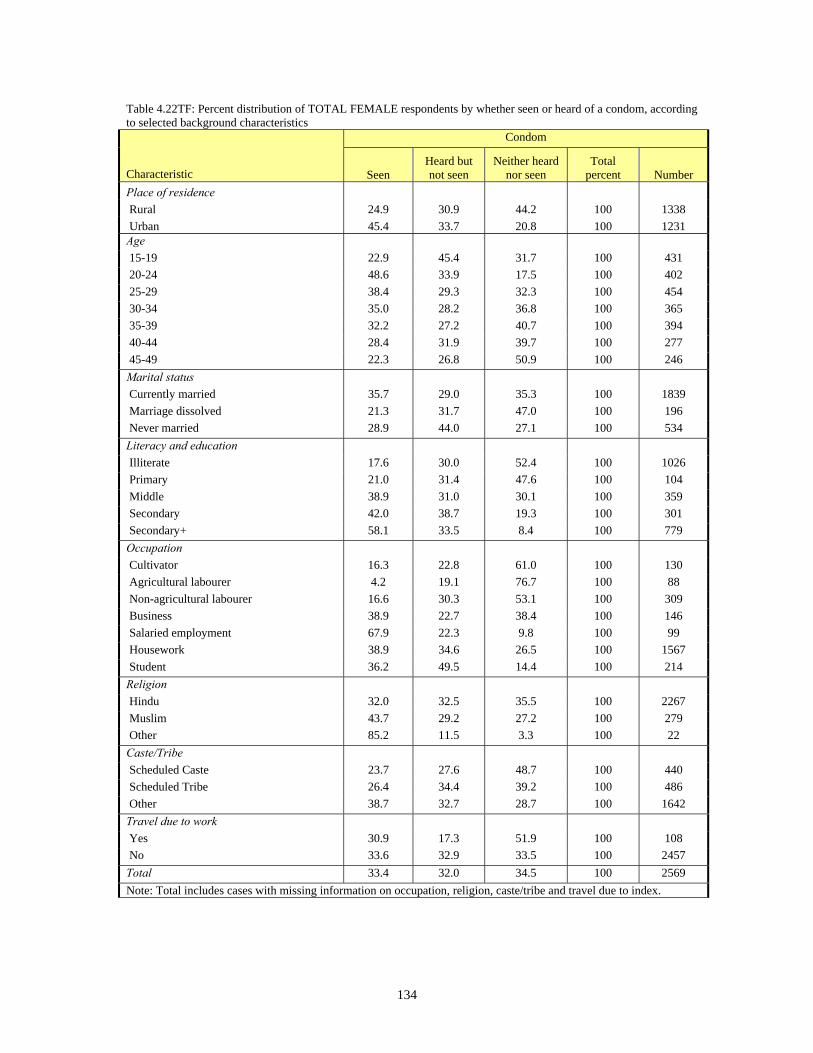
134
Table 4.22TF: Percent distribution of TOTAL FEMALE respondents by whether seen or heard of a condom, according to selected background characteristics
Condom
Characteristic Seen Heard but not seen
Neither heard nor seen
Total percent Number
Place of residence Rural 24.9 30.9 44.2 100 1338 Urban 45.4 33.7 20.8 100 1231 Age 15-19 22.9 45.4 31.7 100 431 20-24 48.6 33.9 17.5 100 402 25-29 38.4 29.3 32.3 100 454 30-34 35.0 28.2 36.8 100 365 35-39 32.2 27.2 40.7 100 394 40-44 28.4 31.9 39.7 100 277 45-49 22.3 26.8 50.9 100 246 Marital status Currently married 35.7 29.0 35.3 100 1839 Marriage dissolved 21.3 31.7 47.0 100 196 Never married 28.9 44.0 27.1 100 534 Literacy and education Illiterate 17.6 30.0 52.4 100 1026 Primary 21.0 31.4 47.6 100 104 Middle 38.9 31.0 30.1 100 359 Secondary 42.0 38.7 19.3 100 301 Secondary+ 58.1 33.5 8.4 100 779 Occupation Cultivator 16.3 22.8 61.0 100 130 Agricultural labourer 4.2 19.1 76.7 100 88 Non-agricultural labourer 16.6 30.3 53.1 100 309 Business 38.9 22.7 38.4 100 146 Salaried employment 67.9 22.3 9.8 100 99 Housework 38.9 34.6 26.5 100 1567 Student 36.2 49.5 14.4 100 214 Religion Hindu 32.0 32.5 35.5 100 2267 Muslim 43.7 29.2 27.2 100 279 Other 85.2 11.5 3.3 100 22 Caste/Tribe Scheduled Caste 23.7 27.6 48.7 100 440 Scheduled Tribe 26.4 34.4 39.2 100 486 Other 38.7 32.7 28.7 100 1642 Travel due to work Yes 30.9 17.3 51.9 100 108 No 33.6 32.9 33.5 100 2457 Total 33.4 32.0 34.5 100 2569 Note: Total includes cases with missing information on occupation, religion, caste/tribe and travel due to index.

135
Table 4.22T: Percent distribution of TOTAL respondents by whether seen or heard of a condom, according to selected background characteristics
Condom
Characteristic Seen Heard but not seen
Neither heard nor seen
Total percent Number
Place of residence Rural 41.0 27.0 32.0 100 2467 Urban 59.2 24.6 16.2 100 2185 Age 15-19 39.3 38.2 22.6 100 762 20-24 61.5 24.8 13.6 100 830 25-29 53.5 24.2 22.3 100 776 30-34 50.3 22.7 27.1 100 644 35-39 45.2 22.2 32.6 100 674 40-44 47.1 22.8 30.1 100 493 45-49 35.2 25.0 39.8 100 473 Marital status Currently married 47.5 24.0 28.5 100 3031 Marriage dissolved 22.8 32.3 44.9 100 205 Never married 53.7 29.9 16.5 100 1416 Literacy and education Illiterate 30.1 27.4 42.5 100 1727 Primary 40.2 26.1 33.7 100 217 Middle 53.2 25.0 21.8 100 607 Secondary 56.7 27.4 16.0 100 531 Secondary+ 69.9 24.1 6.0 100 1570 Occupation Cultivator 49.3 21.6 29.1 100 698 Agricultural labourer 25.8 20.0 54.2 100 179 Non-agricultural labourer 41.3 23.5 35.2 100 687 Business 67.3 17.2 15.6 100 627 Salaried employment 78.9 15.3 5.8 100 397 Housework 39.0 34.6 26.4 100 1572 Student 52.7 35.7 11.6 100 456 Religion Hindu 47.2 26.6 26.3 100 4133 Muslim 57.7 22.2 20.2 100 478 Other 83.2 8.1 8.7 100 40 Caste/Tribe Scheduled Caste 43.7 24.2 32.2 100 789 Scheduled Tribe 46.3 26.1 27.6 100 897 Other 50.5 26.6 22.9 100 2965 Travel due to work Yes 60.5 19.8 19.7 100 850 No 45.4 27.6 27.1 100 3798 Total 48.3 26.1 25.6 100 4652 Note: Total includes cases with missing information on occupation, religion, caste/tribe and travel due to work.

136
Table 4.23R: Percent of RURAL respondents who have ever used a condom (among those who ever had sexual intercourse), by sex and other background characteristics
Male Female Total
Characteristic Percent Number Percent Number Percent Number Age 15-19 3.6 7 0.0 56 0.5 63 20-24 18.4 61 4.8 155 9.7 216 25-29 13.4 117 3.2 212 7.3 329 30-34 12.2 126 4.3 181 7.4 307 35-39 11.5 151 1.3 212 4.9 363 40-44 12.4 123 1.7 133 6.6 256 45-49 8.4 133 0.6 140 4.6 273 Marital status Currently married 10.8 670 2.7 978 6.0 1648 Marriage dissolved 13.9 6 0.3 110 1.2 116 Never married 37.4 42 0.0 1 37.1 43 Literacy and education Illiterate 3.5 388 0.4 669 1.5 1057 Primary 16.6 58 4.5 58 8.9 116 Middle 22.9 80 2.1 138 9.3 218 Secondary 20.4 68 4.0 113 10.6 181 Secondary+ 28.6 124 19.0 111 25.0 235 Occupation Cultivator 13.8 359 0.5 121 9.6 480 Agricultural labourer 5.7 60 0.0 69 2.6 129 Non-agricultural labourer 8.3 110 0.4 170 3.6 280 Business 9.5 115 0.8 29 7.4 144 Salaried employment 16.2 58 7.4 17 14.5 75 Housework Nil Nil 3.7 668 3.7 668 Student 30.8 7 0.0 7 25.5 14 Religion Hindu 12.0 692 2.5 1071 6.3 1763 Muslim 25.0 24 10.3 17 19.1 41 Other 0.0 2 Nil Nil 0.0 2 Caste/Tribe Scheduled Caste 4.4 142 1.3 238 2.5 380 Scheduled Tribe 23.8 163 0.5 240 10.1 403 Other 10.9 413 4.0 610 6.8 1023 Travel due to work Yes 14.4 321 6.8 51 12.8 372 No 10.7 397 2.2 1037 4.8 1434 Total 12.2 718 2.5 1089 6.4 1807 Note: Total includes persons with missing information on occupation, religion, caste/tribe and travel due to work.

137
Table 4.23U: Percent of URBAN respondents who have ever used a condom (among those who ever had sexual intercourse), by sex and other background characteristics
Male Female Total
Characteristic Percent Number Percent Number Percent Number Age 15-19 37.8 5 12.9 29 19.1 34 20-24 35.0 35 19.4 133 22.4 168 25-29 19.6 79 25.1 206 23.5 285 30-34 23.6 129 18.1 169 20.6 298 35-39 29.0 125 14.9 167 21.1 292 40-44 30.6 90 7.8 140 17.1 230 45-49 17.4 93 5.2 104 11.0 197 Marital status Currently married 23.1 522 17.6 861 19.8 1383 Marriage dissolved 14.9 3 3.5 85 4.1 88 Never married 63.7 31 0.0 2 59.3 33 Literacy and education Illiterate 11.0 174 5.4 296 7.5 470 Primary 26.5 30 2.5 35 14.0 65 Middle 15.8 84 7.9 166 10.7 250 Secondary 26.1 48 25.6 109 25.8 157 Secondary+ 43.5 220 31.7 342 36.5 562 Occupation Cultivator 9.4 39 0.0 8 7.6 47 Agricultural labourer 16.2 7 0.0 17 4.0 24 Non-agricultural labourer 15.1 135 3.9 105 10.0 240 Business 26.7 212 16.2 81 23.7 293 Salaried employment 36.4 151 31.2 62 34.9 213 Housework 100.0 1 18.5 666 18.6 667 Student 74.6 7 25.6 4 58.3 11 Religion Hindu 26.1 438 15.8 737 19.7 1175 Muslim 20.3 108 18.0 196 18.8 304 Other 36.7 10 22.5 15 28.2 25 Caste/Tribe Scheduled Caste 18.2 55 8.7 87 12.4 142 Scheduled Tribe 25.1 88 19.1 146 21.6 234 Other 26.1 413 16.7 715 20.2 1128 Travel due to work Yes 31.1 162 14.9 33 28.5 195 No 22.6 394 16.4 912 18.3 1306 Total 25.3 556 16.3 948 19.7 1504 Note: Total includes persons with missing information on occupation and travel due to work.
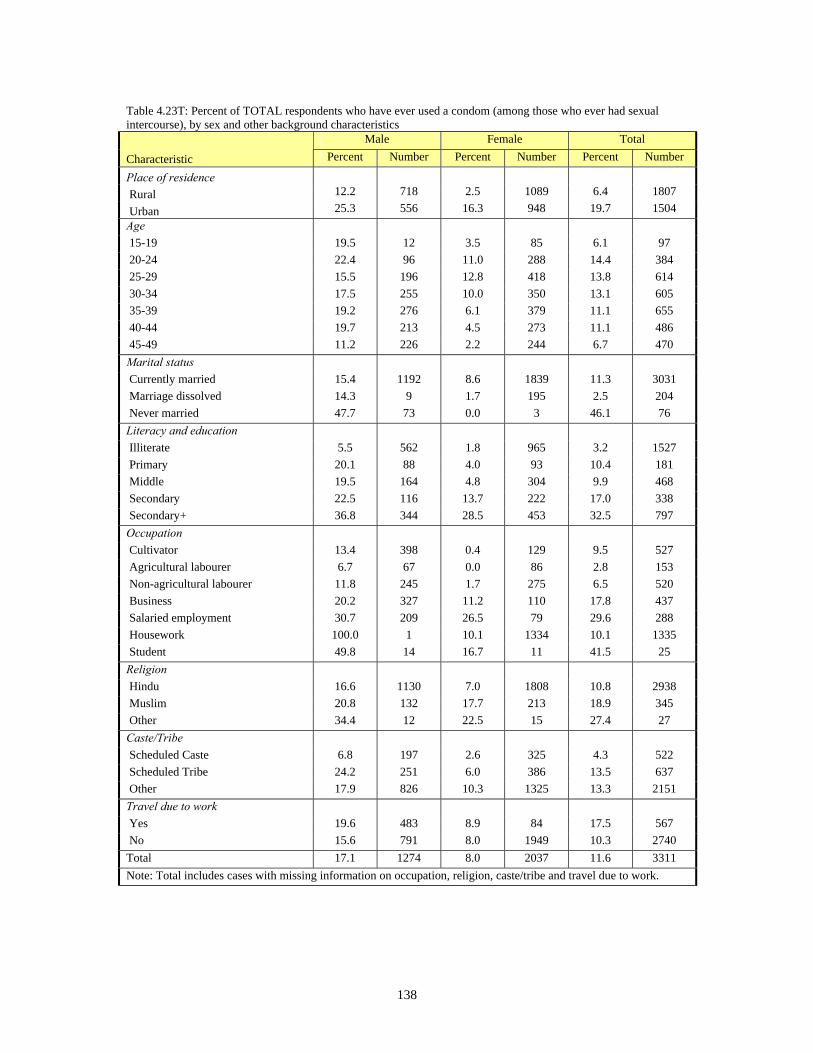
138
Table 4.23T: Percent of TOTAL respondents who have ever used a condom (among those who ever had sexual intercourse), by sex and other background characteristics
Male Female Total
Characteristic Percent Number Percent Number Percent Number
Place of residence
Rural 12.2 718 2.5 1089 6.4 1807
Urban 25.3 556 16.3 948 19.7 1504 Age 15-19 19.5 12 3.5 85 6.1 97 20-24 22.4 96 11.0 288 14.4 384 25-29 15.5 196 12.8 418 13.8 614 30-34 17.5 255 10.0 350 13.1 605 35-39 19.2 276 6.1 379 11.1 655 40-44 19.7 213 4.5 273 11.1 486 45-49 11.2 226 2.2 244 6.7 470 Marital status Currently married 15.4 1192 8.6 1839 11.3 3031 Marriage dissolved 14.3 9 1.7 195 2.5 204 Never married 47.7 73 0.0 3 46.1 76 Literacy and education Illiterate 5.5 562 1.8 965 3.2 1527 Primary 20.1 88 4.0 93 10.4 181 Middle 19.5 164 4.8 304 9.9 468 Secondary 22.5 116 13.7 222 17.0 338 Secondary+ 36.8 344 28.5 453 32.5 797 Occupation Cultivator 13.4 398 0.4 129 9.5 527 Agricultural labourer 6.7 67 0.0 86 2.8 153 Non-agricultural labourer 11.8 245 1.7 275 6.5 520 Business 20.2 327 11.2 110 17.8 437 Salaried employment 30.7 209 26.5 79 29.6 288 Housework 100.0 1 10.1 1334 10.1 1335 Student 49.8 14 16.7 11 41.5 25 Religion Hindu 16.6 1130 7.0 1808 10.8 2938 Muslim 20.8 132 17.7 213 18.9 345 Other 34.4 12 22.5 15 27.4 27 Caste/Tribe Scheduled Caste 6.8 197 2.6 325 4.3 522 Scheduled Tribe 24.2 251 6.0 386 13.5 637 Other 17.9 826 10.3 1325 13.3 2151 Travel due to work Yes 19.6 483 8.9 84 17.5 567 No 15.6 791 8.0 1949 10.3 2740 Total 17.1 1274 8.0 2037 11.6 3311 Note: Total includes cases with missing information on occupation, religion, caste/tribe and travel due to work.

139
Table 4.24R: Percent of RURAL respondents who used a condom in their first sexual intercourse (among those who ever had sexual intercourse), by sex, according to selected background characteristics
Male Female Total
Characteristic Percent Number Percent Number Percent Number Age 15-19 3.6 7 0.0 55 0.5 62 20-24 13.1 61 0.2 155 4.8 216 25-29 4.4 117 1.0 212 2.4 329 30-34 6.6 126 0.0 181 2.6 307 35-39 3.5 151 2.0 212 2.5 363 40-44 5.8 123 0.0 130 2.7 253 45-49 3.5 133 0.6 138 2.1 271 Marital status Currently married 4.9 670 0.7 973 2.4 1643 Marriage dissolved 0.0 6 1.1 109 1.0 115 Never married 20.1 42 0.0 1 19.9 43 Literacy and education Illiterate 1.0 388 0.9 665 0.9 1053 Primary 7.1 58 1.5 58 3.6 116 Middle 11.9 80 0.0 136 4.1 216 Secondary 11.6 68 0.0 113 4.6 181 Secondary+ 13.4 124 0.7 111 8.6 235 Occupation Cultivator 4.7 359 2.2 121 3.9 480 Agricultural labourer 4.1 60 0.0 68 1.9 128 Non-agricultural labourer 4.3 110 0.6 170 2.1 280 Business 3.8 115 0.8 29 3.1 144 Salaried employment 10.6 58 0.0 17 8.5 75 Housework Nil Nil 0.4 663 0.4 663 Student 30.8 7 14.3 7 28.0 14 Religion Hindu 5.6 692 0.7 1065 2.7 1757 Muslim 8.8 24 0.0 17 5.2 41 Other 0.0 2 Nil Nil 0.0 2 Caste/Tribe Scheduled Caste 1.2 142 0.2 238 0.6 380 Scheduled Tribe 11.2 163 0.4 240 4.8 403 Other 5.3 413 1.1 604 2.8 1017 Travel due to work Yes 7.4 321 0.8 1031 5.9 372 No 4.4 397 0.0 1 1.9 1428 Total 5.6 718 0.7 1083 2.7 1801 Note: Total includes cases with missing information on occupation, religion, caste/tribe and travel due to work.

140
Table 4.24U: Percent of URBAN respondents who used a condom in their first sexual intercourse (among those who ever had sexual intercourse), by sex, according to selected background characteristics
Male Female Total
Characteristic Percent Number Percent Number Percent Number Age 15-19 37.8 5 7.8 29 15.3 34 20-24 25.4 35 4.8 133 8.9 168 25-29 7.4 79 2.2 206 3.7 285 30-34 8.4 129 3.2 168 5.5 297 35-39 10.8 125 2.5 167 6.1 292 40-44 9.8 90 3.0 138 5.8 228 45-49 4.1 93 2.0 104 3.0 197 Marital status Currently married 7.4 522 3.3 859 4.9 1381 Marriage dissolved 0.0 3 0.7 84 0.7 87 Never married 52.8 31 0.0 2 49.1 33 Literacy and education Illiterate 3.4 174 0.3 294 1.5 468 Primary 3.4 30 2.5 35 2.9 65 Middle 5.7 84 1.5 165 3.0 249 Secondary 12.0 48 3.2 109 6.1 157 Secondary+ 18.6 220 7.1 342 11.7 562 Occupation Cultivator 0.0 39 0.0 8 0.0 47 Agricultural labourer 16.2 7 0.0 17 4.0 24 Non-agricultural labourer 7.3 135 0.0 104 4.0 239 Business 10.4 212 2.5 80 8.1 292 Salaried employment 13.5 151 6.6 62 11.5 213 Housework 0.0 1 3.6 665 3.6 666 Student 25.3 7 0.0 4 16.8 11 Religion Hindu 10.4 438 3.2 734 5.9 1172 Muslim 8.3 108 2.9 196 4.8 304 Jain 0.0 10 0.0 15 0.0 25 Caste/Tribe Scheduled Caste 8.1 55 4.5 87 5.9 142 Scheduled Tribe 13.0 88 1.0 144 6.1 232 Other 9.3 413 3.3 714 5.5 1127 Travel due to work Yes 11.4 162 1.7 31 9.9 193 No 9.1 394 3.1 911 4.9 1305 Total 9.8 556 3.1 945 5.6 1501 Note: Total includes cases with missing information on occupation and travel due to work.

141
Table 4.24T: Percent of TOTAL respondents who used a condom in their first sexual intercourse (among those who ever had sexual intercourse), by sex, according to selected background characteristics
Male Female Total
Characteristic Percent Number Percent Number Percent Number
Place of residence
Rural 5.6 718 0.7 1083 2.7 1801
Urban 9.8 556 3.1 945 5.6 1501 Age 15-19 19.5 12 2.2 84 5.0 96 20-24 16.1 96 2.1 288 6.3 384 25-29 5.4 196 1.5 418 2.9 614 30-34 7.4 255 1.3 349 3.9 604 35-39 6.7 276 2.1 379 3.9 655 40-44 7.4 213 1.4 268 4.0 481 45-49 3.6 226 1.1 242 2.4 468 Marital status Currently married 5.8 1192 1.7 1832 3.4 3024 Marriage dissolved 0.0 9 0.9 193 0.9 202 Never married 32.9 73 0.0 3 31.8 76 Literacy and education Illiterate 1.7 562 0.7 959 1.1 1521 Primary 5.8 88 1.8 93 3.4 181 Middle 9.0 164 0.7 301 3.6 465 Secondary 11.7 116 1.4 222 5.3 338 Secondary+ 16.2 344 5.5 453 10.6 797 Occupation Cultivator 4.3 398 2.1 129 3.6 527 Agricultural labourer 5.2 67 0.0 85 2.2 152 Non-agricultural labourer 5.9 245 0.4 274 3.0 519 Business 7.9 327 1.9 109 6.3 436 Salaried employment 12.6 209 5.3 79 10.7 288 Housework 0.0 1 1.8 1328 1.8 1329 Student 28.4 14 5.0 11 22.6 25 Religion Hindu 7.1 1130 1.6 1799 3.8 2929 Muslim 8.3 132 2.8 213 4.9 345 Jain 0.0 12 0.0 15 0.0 27 Caste/Tribe Scheduled Caste 2.4 197 0.9 325 1.5 522 Scheduled Tribe 11.8 251 0.5 384 5.2 635 Other 7.1 826 2.2 1318 4.1 2144 Travel due to work Yes 8.7 483 0.4 82 7.1 565 No 6.3 791 1.7 1942 3.1 2733 Total 7.2 1274 1.7 2028 3.8 3302 Note: Total includes cases with missing information on occupation and travel due to work.

142
Table 4.25R: Percent of RURAL respondents who used a condom during their last sexual intercourse (among those who ever had sexual intercourse), by sex, according to selected background characteristics
Male Female Total
Characteristic Percent Number Percent Number Percent Number Age 15-19 3.6 7 0.5 56 0.9 63 20-24 10.2 61 2.9 155 5.5 216 25-29 2.7 117 0.0 212 1.1 329 30-34 0.9 126 0.1 181 0.5 307 35-39 2.8 151 0.0 212 1.0 363 40-44 2.1 123 0.0 133 1.0 256 45-49 2.2 133 0.2 139 1.2 272 Marital status Currently married 2.0 670 0.5 977 1.1 1647 Marriage dissolved 0.0 6 0.3 110 0.3 116 Never married 24.6 42 0.0 1 24.3 43 Literacy and education Illiterate 0.9 388 0.1 668 0.4 1056 Primary 3.4 58 0.0 58 1.2 116 Middle 3.4 80 0.0 138 1.2 218 Secondary 1.7 68 2.3 113 2.1 181 Secondary+ 11.0 124 3.2 111 8.1 235 Occupation Cultivator 3.8 359 0.0 121 2.6 480 Agricultural labourer 0.4 60 0.3 69 0.4 129 Non-agricultural labourer 2.0 110 0.2 170 0.9 280 Business 2.8 115 0.0 29 2.2 144 Salaried employment 2.0 58 0.0 17 1.6 75 Housework Nil Nil 0.8 668 0.8 668 Student 30.8 7 0.0 6 26.2 13 Religion Hindu 3.1 692 0.5 1070 1.5 1762 Muslim 6.1 24 0.0 17 3.7 41 Other 0.0 2 Nil Nil 0.0 2 Caste/Tribe Scheduled Caste 2.1 142 0.2 238 0.9 380 Scheduled Tribe 5.5 163 0.0 240 2.2 403 Other 2.6 413 0.8 609 1.6 1022 Travel due to work Yes 4.3 321 0.0 51 3.4 372 No 2.4 397 0.5 1036 1.1 1433 Total 3.1 718 0.5 1088 1.6 1806 Note: Total includes cases with missing information on occupation, religion, caste/tribe and travel due to work.

143
Table 4.25U: Percent of URBAN respondents who used a condom in their last sexual intercourse (among those who ever had sexual intercourse), by sex, according to selected background characteristics
Male Female Total
Characteristic Percent Number Percent Number Percent Number Age 15-19 37.8043 5 2.7821 29 11.5209 34 20-24 23.3991 35 6.2079 133 9.5826 168 25-29 9.386 79 6.0227 206 7.0084 285 30-34 5.6296 129 2.8386 169 4.0874 298 35-39 5.4686 125 2.162 167 3.607 292 40-44 9.4584 90 2.0542 140 5.078 230 45-49 3.6911 93 0 104 1.7715 197 Marital status Currently married 5.1 522 3.8 861 4.3 1383 Marriage dissolved 14.9 3 0.8 85 1.6 88 Never married 56.4 31 0.0 2 52.5 33 Literacy and education Illiterate 3.4 174 1.2 296 2.0 470 Primary 0.0 30 1.9 35 1.0 65 Middle 6.5 84 2.1 166 3.7 250 Secondary 6.8 48 3.6 109 4.7 157 Secondary+ 15.0 220 7.2 342 10.3 562 Occupation Cultivator 3.3 39 0.0 8 2.6 47 Agricultural labourer 7.7 7 0.0 17 1.9 24 Non-agricultural labourer 6.2 135 0.6 105 3.7 240 Business 8.6 212 1.8 81 6.7 293 Salaried employment 8.4 151 8.0 62 8.3 213 Housework 0.0 1 4.2 666 4.2 667 Student 49.9 7 0.0 4 33.3 11 Religion Hindu 7.9 438 3.4 737 5.1 1175 Muslim 7.8 108 4.5 196 5.7 304 Other 15.2 10 0.0 15 6.1 25 Caste/Tribe Scheduled Caste 4.8 55 2.7 87 3.6 142 Scheduled Tribe 3.7 88 4.5 146 4.2 234 Other 9.3 413 3.4 715 5.6 1128 Travel due to work Yes 9.7 162 3.3 33 8.7 195 No 7.2 394 3.5 912 4.7 1306 Total 8.0 556 3.5 948 5.2 1504 Note: Total includes cases with missing information on occupation and travel due to work.

144
Table 4.25T: Percent of TOTAL respondents who used a condom during their last sexual intercourse (among those who ever had sexual intercourse), by sex, according to selected background characteristics
Male Female Total
Characteristic Percent Number Percent Number Percent Number
Place of residence
Rural 3.1 718 0.5 1088 1.6 1806
Urban 8.0 556 3.5 948 5.2 1504 Age 15-19 19.5 12 1.1 85 4.1 97 20-24 13.4 96 4.3 288 7.0 384 25-29 4.9 196 2.6 418 3.5 614 30-34 3.1 255 1.3 350 2.0 605 35-39 4.0 276 0.8 379 2.0 655 40-44 5.1 213 0.9 273 2.8 486 45-49 2.7 226 0.1 243 1.4 469 Marital status Currently married 3.2 1192 1.8 1838 2.4 3030 Marriage dissolved 5.6 9 0.5 195 0.9 204 Never married 37.1 73 0.0 3 35.8 76 Literacy and education Illiterate 1.6 562 0.4 964 0.8 1526 Primary 2.2 88 0.5 93 1.2 181 Middle 4.9 164 1.0 304 2.4 468 Secondary 3.6 116 2.9 222 3.2 338 Secondary+ 13.2 344 6.2 453 9.5 797 Occupation Cultivator 3.7 398 0.0 129 2.6 527 Agricultural labourer 1.1 67 0.3 86 0.6 153 Non-agricultural labourer 4.2 245 0.3 275 2.1 520 Business 6.4 327 1.2 110 5.0 437 Salaried employment 6.6 209 6.4 79 6.5 288 Housework 0.0 1 2.2 1334 2.2 1335 Student 39.1 14 0.0 10 29.7 24 Religion Hindu 4.7 1130 1.5 1807 2.7 2937 Muslim 7.6 132 4.3 213 5.5 345 Other 14.3 12 0.0 15 5.9 27 Caste/Tribe Scheduled Caste 2.6 197 0.6 325 1.4 522 Scheduled Tribe 4.9 251 1.3 386 2.8 637 Other 5.7 826 2.1 1324 3.5 2150 Travel due to work Yes 6.0 483 0.9 84 5.0 567 No 4.4 791 1.8 1948 2.5 2739 Total 5.0 1274 1.7 2036 3.0 3310 Note: Total includes cases with missing information on occupation, religion, caste/tribe and travel due to work.

145
Table 4.26: Percentage distribution of respondents who have ever used a condom, by the source of condom at last use, according to sex and place of residence
Rural Urban Total
Source of condom Male Female Total Male Female Total Male Female Total Shop/Paan shop 9.2 0.0 7.0 15.3 7.5 11.3 12.6 6.1 9.8 Medical shop 42.2 45.7 43.0 61.2 50.8 55.8 52.7 49.8 51.5 Private clinic 0.0 6.8 1.6 0.0 2.6 1.4 0.0 3.4 1.4 Public hospital 30.3 23.8 28.8 18.2 11.4 14.7 23.6 13.8 19.5 Health educator/worker/ANM 3.7 12.0 5.7 2.1 1.0 1.5 2.8 3.1 2.9 Anganwadi Worker 1.0 0.0 0.7 0.0 0.5 0.2 0.4 0.4 0.4 Friends 7.9 0.0 6.0 0.0 0.7 0.4 3.5 0.6 2.3 Sexual partner 0.0 7.6 1.8 1.3 24.6 13.3 0.7 21.4 9.4 Other 4.3 4.0 4.3 2.0 0.9 1.4 3.0 1.5 2.4 Missing 1.5 0.0 1.2 0.0 0.0 0.0 0.7 0.0 0.4 Total percent 100 100 100 100 100 100 100 100 100 Number 94 43 137 148 170 318 242 213 455

146
Table 4.27R: Percent of RURAL respondents who are aware of the symptoms of STI among men and women, by sex of the respondent
Yes
Symptoms of STI Spontaneous After Probe No Don't know Male Discharge from penis 6.2 26.9 8.3 58.7 Sores/ulcers/ blisters on or around the sex organ 12.6 30.2 4.7 52.6 Swelling in the groin 9.2 29.4 5.8 55.6 Painful swelling of the genitals/scrotum 6.7 30.5 5.6 57.3 Burning pain while passing urine 5.4 29.0 9.5 56.1 Other 19.6 No symptoms 0.4 6.8 8.6 84.2 Don’t know 63.7 Number 1129 Female Sores/ulcers/blisters on or around the sex organ 5.4 57.1 6.7 30.8 Vaginal discharge 52.2 32.9 2.8 12.1 Painful swelling of the groin/vagina 7.0 60.5 9.3 23.2 Burning pain on urination 11.9 55.8 11.9 20.4 Pain when having sex 9.1 59.8 9.7 21.4 Chronic pain in the lower abdomen 13.8 55.4 8.0 22.5 Other 5.1 No symptoms 0.4 8.6 24.8 65.0 Don’t know 6.9 Number 1338

147
Table 4.27U: Percent of URBAN respondents who are aware of the symptoms of STI among men and women, by sex of the respondent
Yes Symptoms of STI Spontaneous After Probe No Don't know Male Discharge from penis 11.3 24.5 7.7 56.5 Sores/ulcers/ blisters on or around the sex organ 12.5 29.2 6.7 51.6 Swelling in the groin 7.0 23.2 10.2 59.6 Painful swelling of the genitals/scrotum 7.0 23.4 11.0 58.5 Burning pain while passing urine 9.3 21.5 14.5 54.7 Other 20.3 No symptoms 0.2 5.2 13.1 81.6 Don’t know 59.4 Number 954 Female Sores/ulcers/ blisters on or around the sex organ 4.9 64.5 11.1 19.5 Vaginal discharge 51.1 35.9 2.8 10.1 Painful swelling of the groin/vagina 6.9 65.1 11.8 16.1 Burning pain on urination 14.8 58.8 11.7 14.7 Pain when having sex 9.7 60.8 11.4 18.0 Chronic pain in the lower abdomen 14.1 59.8 9.6 16.1 Other 5.79 No symptoms 1.4 7.9 17.4 72.1 Don’t know 8.1 Number 1232

148
Table 4.27T: Percent of TOTAL respondents who are aware of the symptoms of STI among men and women, by sex of the respondent
Yes Symptoms of STI Spontaneous After Probe No Don't know Male Discharge from penis 8.2 26.0 8.0 57.8 Sores/ulcers/ blisters on or around the sex organ 12.6 29.8 5.5 52.2 Swelling in the groin 8.3 27.0 7.5 57.2 Painful swelling of the genitals/scrotum 6.8 27.7 7.7 57.8 Burning pain while passing urine 6.9 26.1 11.4 55.5 Other 19.9 No symptoms 0.4 6.2 10.3 83.2 Don’t know 62.0 Number 2083 Female Sores/ulcers/ blisters on or around the sex organ 5.2 60.2 8.5 26.1 Vaginal discharge 51.7 34.2 2.8 11.3 Painful swelling of the groin/vagina 7.0 62.4 10.3 20.3 Burning pain on urination 13.1 57.0 11.8 18.0 Pain when having sex 9.4 60.2 10.4 20.0 Chronic pain in the lower abdomen 14.0 57.2 8.7 19.8 Other 5.4 No symptoms 0.8 8.3 21.7 67.9 Don’t know 7.4 Number 2570

149
Table 4.28R: Percent of RURAL respondents who ever had selected symptoms of STI or had selected symptoms of STI during the year preceding the survey, according to selected background characteristics
Male Female Total
Characteristic Ever Last 1 year Number Ever
Last 1 year Number Ever
Last 1 year Number
Age 15-19 0.4 0.4 170 6.8 3.9 228 3.7 2.2 398 20-24 1.6 0.7 224 12.2 6.0 194 6.3 3.0 418 25-29 1.9 0.4 190 21.9 4.1 230 12.6 2.4 420 30-34 0.0 0.0 134 19.9 11.1 190 12.0 6.8 324 35-39 0.5 0.0 153 9.0 2.2 219 6.0 1.4 372 40-44 0.3 0.0 124 9.1 1.0 135 5.0 0.5 259 45-49 1.5 0.0 134 7.3 3.4 142 4.3 1.6 276 Marital status Currently married 0.8 0.1 670 14.0 5.1 978 8.6 3.1 1648 Marriage dissolved 0.0 0.0 6 8.4 4.7 112 7.8 4.4 118 Never married 1.4 0.6 453 8.6 2.6 248 3.8 1.2 701 Literacy and education Illiterate 0.6 0.2 474 11.9 2.6 719 7.4 1.6 1193 Primary 0.5 0.0 74 24.8 22.0 63 14.0 12.2 137 Middle 0.0 0.0 125 12.1 4.8 161 6.8 2.7 286 Secondary 2.3 0.0 138 13.1 4.2 165 8.0 2.2 303 Secondary+ 1.7 0.8 318 10.9 5.4 230 4.9 2.4 548 Occupation Cultivator 1.0 0.0 516 13.4 2.4 122 4.0 0.6 638 Agricultural labourer 1.6 1.0 83 26.7 17.8 69 13.8 9.2 152 Non-agricultural labourer 1.5 0.5 162 9.4 5.8 194 5.5 3.3 356 Business 0.7 0.0 173 22.0 9.8 40 5.3 2.1 213 Salaried employment 1.3 1.3 77 34.8 22.5 22 8.6 5.9 99 Housework 0.0 0.0 3 11.5 2.9 804 11.5 2.9 807 Student 0.7 0.7 103 6.2 5.4 78 2.4 2.2 181 Religion Hindu 1.0 0.3 1098 12.8 4.6 1312 7.3 2.6 2410 Muslim 3.0 0.0 29 7.3 3.7 25 4.9 1.6 54 Other 0.0 0.0 2 Nil Nil Nil 0.0 0.0 2 Caste/Tribe Scheduled Caste 1.3 0.6 241 9.2 0.8 309 5.6 0.7 550 Scheduled Tribe 2.4 0.6 254 12.3 4.7 299 7.8 2.8 553 Other 0.3 0.0 634 14.7 6.6 729 7.9 3.5 1363 Travel due to work Yes 1.5 0.5 497 24.8 19.7 70 5.4 3.7 567 No 0.7 0.1 632 11.8 3.5 1267 7.9 2.3 1899 Total 1.0 0.3 1129 12.7 4.7 1338 7.3 2.6 2467 Note: Total includes cases with missing information on occupation, religion, caste/tribe and travel due to work.

150
Table 4.28 U: Percent of URBAN respondents who ever had selected symptoms of STI or had selected symptoms of STI during the year preceding the survey, according to selected background characteristics
Male Female Total
Characteristic Ever Last 1 year Number Ever
Last 1 year Number Ever
Last 1 year Number
Age 15-19 0.5 0.5 161 8.3 4.4 203 4.7 2.6 364 20-24 0.8 0.4 204 13.2 7.8 208 7.3 4.3 412 25-29 2.3 1.8 132 20.4 6.5 224 13.6 4.7 356 30-34 1.1 0.0 145 16.0 8.7 175 9.2 4.7 320 35-39 0.9 0.0 127 11.5 5.3 175 7.0 3.0 302 40-44 0.6 0.0 92 13.1 4.6 142 8.0 2.7 234 45-49 0.0 0.0 93 5.8 3.1 105 3.0 1.6 198 Marital status Currently married 0.9 0.1 522 14.8 6.9 861 9.4 4.3 1383 Marriage dissolved 0.0 0.0 3 17.3 5.0 85 16.4 4.7 88 Never married 1.0 0.8 429 7.3 3.8 286 3.5 2.0 715 Literacy and education Illiterate 0.5 0.3 227 13.2 5.7 308 7.9 3.4 535 Primary 0.0 0.0 39 19.3 7.5 41 9.8 3.8 80 Middle 1.7 1.3 123 21.1 12.3 198 13.4 8.0 321 Secondary 0.7 0.0 92 13.8 8.0 136 8.3 4.6 228 Secondary+ 1.0 0.4 473 9.6 3.3 549 5.6 1.9 1022 Occupation Cultivator 0.0 0.0 52 0.0 0.0 8 0.0 0.0 60 Agricultural labourer 0.0 0.0 8 27.0 10.7 19 20.1 7.9 27 Non-agricultural labourer 1.2 1.0 216 14.8 3.3 115 6.2 1.8 331 Business 0.5 0.3 308 13.8 8.9 106 4.1 2.6 414 Salaried employment 1.8 0.0 221 10.2 4.4 77 3.9 1.1 298 Housework 0.0 0.0 2 14.0 6.7 764 14.0 6.7 766 Student 0.6 0.6 139 6.4 3.5 136 3.5 2.0 275 Religion Hindu 1.1 0.5 768 12.2 5.2 956 7.2 3.1 1724 Muslim 0.3 0.0 170 18.5 10.3 254 11.0 6.1 424 Other 0.0 0.0 16 3.2 0.0 22 1.9 0.0 38 Caste/Tribe Scheduled Caste 1.6 1.6 108 6.9 0.7 131 4.5 1.1 239 Scheduled Tribe 0.4 0.4 157 11.0 6.5 188 5.8 3.5 345 Other 0.9 0.2 689 14.5 6.7 913 8.7 3.9 1602 Travel due to work Yes 0.0 0.0 245 20.2 3.2 38 2.6 0.4 283 No 1.3 0.6 709 13.1 6.2 1191 8.7 4.1 1900 Total 0.9 0.4 954 13.3 6.1 1232 7.8 3.6 2186 Note: Total includes cases with missing information on occupation and travel due to work.

151
Table 4.28T: Percent of TOTAL respondents who ever had selected symptoms of STI or had selected symptoms of STI during the year preceding the survey, according to selected background characteristics
Male Female Total
Characteristic Ever
Last 1
year Number Ever Last 1 year Number Ever
Last 1
year Number Place of residence Rural 1.0 0.3 1129 12.7 4.7 1338 7.3 2.6 2467 Urban 0.9 0.4 954 13.3 6.1 1232 7.8 3.6 2186 Age 15-19 0.5 0.5 331 7.4 4.1 431 4.1 2.4 762 20-24 1.3 0.6 428 12.7 6.9 402 6.7 3.6 830 25-29 2.1 0.9 322 21.3 5.2 454 13.0 3.3 776 30-34 0.5 0.0 279 18.3 10.2 365 10.8 5.9 644 35-39 0.7 0.0 280 9.9 3.3 394 6.4 2.1 674 40-44 0.4 0.0 216 10.9 2.6 277 6.3 1.5 493 45-49 1.0 0.0 227 6.8 3.3 247 3.9 1.6 474 Marital status Currently married 0.8 0.1 1192 14.3 5.8 1839 8.9 3.5 3031 Marriage dissolved 0.0 0.0 9 12.2 4.8 197 11.5 4.6 206 Never married 1.2 0.7 882 7.9 3.2 534 3.6 1.6 1416 Literacy and education Illiterate 0.6 0.2 701 12.2 3.4 1027 7.5 2.1 1728 Primary 0.4 0.0 113 23.2 17.9 104 12.7 9.7 217 Middle 0.7 0.5 248 16.2 8.3 359 9.8 5.0 607 Secondary 1.7 0.0 230 13.4 5.8 301 8.1 3.2 531 Secondary+ 1.4 0.6 791 10.0 4.0 779 5.3 2.1 1570 Occupation Cultivator 0.9 0.0 568 12.7 2.3 130 3.7 0.5 698 Agricultural labourer 1.5 0.9 91 26.7 16.1 88 14.8 9.0 179 Non-agricultural labourer 1.4 0.8 378 11.4 4.9 309 5.8 2.6 687 Business 0.6 0.2 481 16.4 9.2 146 4.5 2.4 627 Salaried employment 1.7 0.4 298 15.9 8.7 99 5.1 2.4 397 Housework 0.0 0.0 5 12.6 4.5 1568 12.5 4.5 1573 Student 0.7 0.7 242 6.3 4.1 214 3.0 2.1 456 Religion Hindu 1.0 0.4 1866 12.6 4.8 2268 7.3 2.8 4134 Muslim 0.5 0.0 199 18.0 10.0 279 10.6 5.8 478 Other 0.0 0.0 18 3.2 0.0 22 1.9 0.0 40 Caste/Tribe Scheduled Caste 1.4 0.8 349 8.7 0.8 440 5.3 0.8 789 Scheduled Tribe 1.8 0.6 411 11.9 5.2 487 7.2 3.0 898 Other 0.6 0.1 1323 14.6 6.6 1642 8.3 3.7 2965 Travel due to work Yes 1.1 0.4 742 23.7 15.6 108 4.6 2.7 850 No 0.9 0.3 1341 12.3 4.6 2458 8.2 3.1 3799 Total 1.0 0.3 2083 13.0 5.2 2570 7.5 3.0 4653 Note: Total includes cases with missing information on occupation, religion, caste/tribe and travel due to work.

152
Table 4.29T: Percent distribution of respondents who reported any symptoms of STI during the year preceding the survey by source of treatment, according to place of residence and sex
Rural Urban Total Source of treatment Male Female Total Male Female Total Male Female Total Govt. clinic/ hospital 0.0 55.3 52.5 41.5 15.2 16.5 19.8 36.0 35.2 Pvt. clinic/doctor 25.7 20.6 20.9 43.8 34.5 34.9 34.4 27.3 27.6 Pharmacy 0.0 0.0 0.0 0.0 3.0 2.8 0.0 1.4 1.4 Home Remedy 0.0 1.4 1.3 0.0 0.0 0.0 0.0 0.7 0.7 Other 0.0 1.4 1.3 0.0 0.0 0.0 0.0 0.7 0.7 No treatment 74.3 33.3 35.4 14.7 49.1 47.3 45.8 40.8 41.1 Total percent 100.0 100.0 100.0 100.0 100.0 100.0 100.0 100.0 100.0 Number 4 55 59 5 72 77 9 127 136
Note: STI symptoms for females are: Vaginal discharge, lower abdominal pain without diarrhoea and not during a period, and genital ulcer/sore STI symptoms for males are: Urethral discharge, and genital ulcer/sore Percent may add more than 100.0 due to multiple responses.

153
Table 4.30T: Percentage of respondents who have ever received an injection after age 15, to have received an injection in the year prior to survey, and mean number of injections during last year, according to selected background characteristics
Characteristic Ever had
injections Injections in the
last one year Mean number
of injections Number Sex Male 94.1 52.6 2.6 2081 Female 95.4 58.1 2.7 2569 Place of residence Rural 93.8 56.2 2.9 2465 Urban 96.3 54.6 2.2 2185 Age 15-19 91.0 49.1 1.5 762 20-24 96.6 60.0 2.4 830 25-29 94.9 55.7 2.6 775 30-34 95.9 59.6 2.6 644 35-39 95.5 52.7 2.8 672 40-44 94.1 52.5 4.0 493 45-49 96.1 59.1 3.5 474 Marital status Currently married 95.5 58.0 3.0 3028 Marriage dissolved 91.9 50.4 2.9 206 Never married 93.8 50.6 1.9 1416 Literacy and education Illiterate 94.3 57.2 3.2 1726 Primary 95.7 59.7 3.1 217 Middle 93.7 59.2 2.6 607 Secondary 95.0 56.2 2.5 530 Secondary+ 95.9 50.7 1.9 1570 Occupation Cultivator 96.9 57.6 3.4 698 Agricultural labourer 89.3 56.5 1.8 179 Non-agricultural labourer 90.2 51.7 2.4 685 Business 96.1 53.7 3.0 627 Salaried employment 95.7 56.7 2.6 397 Housework 95.2 59.6 2.7 1572 Student 96.4 48.9 1.7 456 Religion Hindu 94.5 54.6 2.6 4131 Muslim 98.5 67.4 3.0 478 Other 100.0 44.9 2.9 40 Caste/Tribe Scheduled Caste 92.0 47.3 1.9 789 Scheduled Tribe 94.2 56.6 3.0 897 Other 96.0 57.9 2.8 2963 Total 94.8 55.6 2.7 4650 Note: Total includes cases with missing information on occupation, religion and caste/tribe.

154
Table 4.31TM: Percent of TOTAL MALE respondents who ever received injections according to type of person who had given the injections, by background characteristics
Characteristics
Medical Doctor
Nurse RMP Traditional Medical
Practitioner
Number
Place of residence
Rural 97.3 43.1 0.8 0.5 1066
Urban 98.5 41.4 2.9 1.0 911 Age 15-19 96.5 42.1 1.0 0.2 313 20-24 95.9 39.4 0.5 0.6 410 25-29 98.4 41.5 3.2 1.5 306 30-34 98.6 41.5 1.3 0.4 263 35-39 98.6 45.5 2.3 0.3 266 40-44 99.2 47.0 3.0 1.5 200 45-49 99.4 43.8 1.1 0.6 219 Marital status Currently married 97.4 43.8 1.8 0.7 1125 Marriage dissolved 100.0 79.4 0.0 0.0 9 Never married 98.3 39.9 1.4 0.6 843 Literacy and education Illiterate 96.4 42.3 2.2 0.3 659 Primary 100.0 36.9 0.6 1.9 106 Middle 99.4 43.8 1.5 1.1 232 Secondary 98.2 50.6 1.0 1.4 220 Secondary+ 98.3 40.4 1.5 0.6 760 Occupation Cultivator 98.6 44.4 0.8 0.2 540 Agricultural labourer 99.2 39.4 0.0 2.7 83 Non-agricultural labourer 99.5 41.3 1.9 0.8 354 Business 94.2 38.3 3.4 0.6 458 Salaried employment 98.4 43.5 1.8 1.5 284 Housework 100.0 52.0 0.0 0.0 5 Student 98.0 44.3 1.0 0.4 233 Religion Hindu 97.8 42.6 1.3 0.6 1767 Muslim 97.5 39.3 4.4 1.6 192 Other 100.0 48.9 9.3 0.0 18 Caste/Tribe Scheduled Caste 94.2 48.2 0.9 0.8 320 Scheduled Tribe 96.4 46.8 2.8 0.2 388 Other 99.3 39.2 1.5 0.8 1269 Total 97.8 42.4 1.6 0.7 1977 Note: Percentage may add more than 100 due to multiple responses. Total includes cases with information on occupation.

155
Table 4.31TF: Percent of TOTAL FEMALE respondents who ever received injections according to type of person who had given the injections, by background characteristics
Characteristics
Medical Doctor
Nurse RMP Traditional Medical
Practitioner
Number
Place of residence
Rural 98.9 43.9 0.3 0.6 1251
Urban 99.4 38.4 0.0 0.1 1193 Age 15-19 97.5 43.8 0.0 1.1 400 20-24 98.6 34.7 0.4 0.0 385 25-29 99.8 40.9 0.1 0.9 434 30-34 99.2 43.3 0.0 0.1 351 35-39 99.5 49.4 0.3 0.1 375 40-44 99.6 38.4 0.6 0.1 260 45-49 99.6 37.8 0.0 0.0 239 Marital status Currently married 99.6 41.5 0.2 0.3 1758 Marriage dissolved 99.2 43.5 0.3 0.0 184 Never married 97.1 41.2 0.0 0.9 502 Literacy and education Illiterate 99.6 43.7 0.1 0.0 966 Primary 100.0 47.6 1.1 0.0 99 Middle 98.5 39.7 0.6 1.1 348 Secondary 97.4 36.6 0.0 0.1 289 Secondary+ 99.0 39.7 0.0 0.9 742 Occupation Cultivator 100.0 68.3 0.0 0.0 130 Agricultural labourer 98.7 40.8 0.8 0.0 88 Non-agricultural labourer 99.7 54.9 0.1 0.0 281 Business 100.0 55.9 0.0 0.0 144 Salaried employment 98.2 32.9 0.0 4.9 97 Housework 99.0 34.8 0.2 0.1 1493 Student 96.8 38.9 0.0 2.7 196 Religion Hindu 99.1 41.1 0.2 0.4 2143 Muslim 99.0 45.3 0.0 0.0 278 Other 100.0 49.3 0.0 0.0 22 Caste/Tribe Scheduled Caste 99.6 44.5 0.0 0.1 415 Scheduled Tribe 96.9 42.1 0.2 1.7 456 Other 99.6 40.5 0.2 0.1 1572 Total 99.1 41.6 0.2 0.4 2444 Note: Percentage may add more than 100 due to multiple responses. Total includes cases with information on occupation, religion and caste/tribe.

156
Table 4.31T: Percent of TOTAL respondents who ever received injections according to type of person who had given the injections, by background characteristics
Characteristics
Medical Doctor
Nurse RMP Traditional Medical
Practitioner
Number
Place of residence
Rural 98.2 43.5 0.6 0.5 2317
Urban 99.0 39.7 1.3 0.5 2104 Age 15-19 97.0 43.0 0.5 0.7 713 20-24 97.2 37.2 0.4 0.3 795 25-29 99.2 41.1 1.4 1.1 740 30-34 99.0 42.5 0.5 0.2 614 35-39 99.1 47.9 1.1 0.2 641 40-44 99.4 42.1 1.7 0.7 460 45-49 99.5 40.7 0.5 0.3 458 Marital status Currently married 98.7 42.4 0.9 0.5 2883 Marriage dissolved 99.2 45.8 0.2 0.0 193 Never married 97.9 40.4 0.9 0.7 1345 Literacy and education Illiterate 98.3 43.1 0.9 0.1 1625 Primary 100.0 42.8 0.9 0.8 205 Middle 98.8 41.3 1.0 1.1 580 Secondary 97.8 43.0 0.4 0.7 509 Secondary+ 98.6 40.1 0.8 0.7 1502 Occupation Cultivator 98.9 50.1 0.6 0.2 670 Agricultural labourer 98.9 40.2 0.5 1.1 171 Non-agricultural labourer 99.6 47.4 1.1 0.5 635 Business 95.7 42.7 2.6 0.5 602 Salaried employment 98.3 40.9 1.3 2.4 381 Housework 99.0 34.9 0.2 0.1 1498 Student 97.5 42.1 0.6 1.3 429 Religion Hindu 98.5 41.8 0.7 0.5 3910 Muslim 98.3 42.8 1.8 0.7 470 Other 100.0 49.1 3.9 0.0 40 Caste/Tribe Scheduled Caste 97.3 46.1 0.4 0.4 735 Scheduled Tribe 96.6 44.3 1.4 1.0 844 Other 99.5 39.9 0.8 0.4 2841 Total 98.5 41.9 0.8 0.5 4421 Note: Percentage may add more than 100 due to multiple responses. Total includes cases with information on occupation, religion and caste/tribe.

157
Table 4.32TM: Percent of TOTAL MALE respondents who had circumcision by selected background characteristics Rural Urban Total
Characteristic Percent Number Percent Number Percent Number Age 15-19 1.9 170 19.6 161 8.8 331 20-24 1.6 224 19.2 204 8.5 428 25-29 1.5 190 18.2 132 7.2 322 30-34 2.2 134 16.7 145 9.1 279 35-39 1.3 153 20.2 127 9.6 280 40-44 3.6 124 20.3 92 10.3 216 45-49 2.2 134 7.9 93 3.9 227 Marital status Currently married 1.7 670 19.5 522 8.4 1192 Marriage dissolved 57.8 6 0.0 3 35.9 9 Never married 1.5 453 16.0 429 7.5 882 Literacy and education Illiterate 2.3 474 25.7 227 9.0 701 Primary 1.6 74 19.9 39 7.4 113 Middle 3.8 125 28.1 123 14.1 248 Secondary 0.5 138 13.1 92 5.1 230 Secondary+ 1.2 318 11.3 473 6.4 791 Occupation Cultivator 0.8 516 0.0 52 0.8 568 Agricultural labourer 1.5 83 6.5 8 1.9 91 Non-agricultural labourer 3.1 162 14.4 216 8.9 378 Business 3.6 173 33.1 308 22.2 481 Salaried employment 5.3 77 8.4 221 7.6 298 Housework 0.0 3 55.1 2 22.7 5 Student 2.3 103 10.9 139 6.4 242 Religion Hindu 0.9 1098 1.3 768 1.0 1866 Muslim 97.0 29 96.8 170 96.8 199 Other 0.0 2 0.0 16 0.0 18 Caste/Tribe Scheduled Caste 0.0 241 1.6 108 0.3 349 Scheduled Tribe 2.8 254 2.4 157 2.6 411 Other 2.5 634 23.8 689 12.6 1323 Total 1.9 1129 17.9 954 8.2 2083 Note: Total includes cases with missing information on occupation.

158
Table 4.33R: Percent of RURAL respondents who have ever heard of KEY clinic by sex and other background characteristics
Male Female Total
Characteristic Percent Number Percent Number Percent Number Age 15-19 18.4 168 27.9 228 23.2 396 20-24 30.4 224 20.9 194 26.3 418 25-29 14.7 189 8.4 230 11.3 419 30-34 11.8 134 9.2 190 10.2 324 35-39 13.7 153 3.6 219 7.2 372 40-44 7.4 124 1.9 135 4.4 259 45-49 4.3 134 5.1 142 4.7 276 Marital status Currently married 14.8 670 8.2 978 10.9 1648 Marriage dissolved 0.0 6.0 10.4 112 9.7 118 Never married 18.1 450 27.1 248 21.1 698 Literacy and education Illiterate 7.4 474 3.0 719 4.7 1193 Primary 15.9 74 3.4 63 8.9 137 Middle 8.3 124 14.1 161 11.6 285 Secondary 18.2 137 21.1 165 19.7 302 Secondary+ 31.2 317 40.3 230 34.4 547 Occupation Cultivator 13.5 514 1.4 122 10.6 636 Agricultural labourer 0.6 83 1.8 69 1.2 152 Non-agricultural labourer 10.7 162 4.9 194 7.7 356 Business 27.6 173 17.5 40 25.4 213 Salaried employment 24.6 77 31.0 22 26.0 99 Housework 18.5 3.0 13.3 804 13.3 807 Student 34.7 102 42.9 78 37.2 180 Religion Hindu 16.0 1095 11.4 1312 13.5 2407 Muslim 22.5 29 11.0 25 17.3 54 Other 50.0 2 Nil Nil 50.0 2 Caste/Tribe Scheduled Caste 20.0 241 5.8 309 12.4 550 Scheduled Tribe 13.9 254 12.0 299 12.9 553 Other 15.1 631 14.0 729 14.5 1360 Travel due to work Yes 22.2 496 16.9 70 21.3 566 No 11.7 630 11.0 1267 11.2 1897 Total 16.0 1126 11.4 1338 13.6 2464 Note: Total includes cases with missing information on occupation, religion, caste/tribe and travel due to work.

159
Table 4.33U: Percent of URBAN respondents who have ever heard of KEY clinic by sex and other background characteristics
Male Female Total
Characteristic Percent Number Percent Number Percent Number Age 15-19 49.7 161 43.6 203 46.4 364 20-24 50.5 204 37.3 208 43.5 412 25-29 39.8 131 33.7 224 36.0 355 30-34 41.6 145 31.5 175 36.1 320 35-39 36.4 127 23.4 175 29.0 302 40-44 37.8 92 27.8 142 31.9 234 45-49 29.8 93 24.0 105 26.8 198 Marital status Currently married 35.8 521 29.1 861 31.7 1382 Marriage dissolved 47.4 3 18.3 85 19.8 88 Never married 50.9 429 48.2 286 49.8 715 Literacy and education Illiterate 16.8 227 10.4 308 13.1 535 Primary 43.4 39 16.4 41 29.6 80 Middle 39.2 122 24.2 198 30.1 320 Secondary 44.5 92 36.5 136 39.9 228 Secondary+ 57.6 473 52.4 549 54.9 1022 Occupation Cultivator 14.3 52 14.7 8 14.4 60 Agricultural labourer 0.0 8.0 10.9 19 8.1 27 Non-agricultural labourer 38.2 216 15.4 115 29.8 331 Business 41.4 307 15.6 106 34.5 413 Salaried employment 46.0 221 44.5 77 45.6 298 Housework 44.9 2 35.3 764 35.4 766 Student 62.8 139 53.3 136 58.1 275 Religion Hindu 42.8 768 37.9 956 40.1 1724 Muslim 38.7 169 13.8 254 24.0 423 Other 59.4 16 17.0 22 34.4 38 Caste/Tribe Scheduled Caste 39.6 108 47.6 131 44.0 239 Scheduled Tribe 41.3 157 31.6 188 36.3 345 Other 43.0 688 30.9 913 36.1 1601 Travel due to work Yes 41.6 244 36.9 38 41.0 282 No 42.7 709 32.5 1191 36.3 1900 Total 42.4 953 32.7 1232 37.0 2185 Note: Total includes cases with missing information on occupation and travel due to work.

160
Table 4.33T: Percent of TOTAL respondents who have ever heard of KEY clinic by sex and other background characteristics
Male Female Total
Characteristic Percent Number Percent Number Percent Number
Place of residence
Rural 16.0 1126 11.4 1338 13.6 2464
Urban 42.4 953 32.7 1232 37.0 2185 Age 15-19 30.7 329 34.5 431 32.7 760 20-24 38.3 428 28.7 402 33.7 830 25-29 23.2 320 19.3 454 21.0 774 30-34 26.0 279 18.4 365 21.6 644 35-39 23.6 280 10.7 394 15.7 674 40-44 19.7 216 13.7 277 16.3 493 45-49 12.1 227 11.5 247 11.8 474 Marital status Currently married 22.7 1191 16.4 1839 18.9 3030 Marriage dissolved 18.0 9 13.8 197 14.1 206 Never married 31.7 879 37.5 534 33.8 1413 Literacy and education Illiterate 10.1 701 5.0 1027 7.0 1728 Primary 24.7 113 7.0 104 15.1 217 Middle 21.4 246 18.8 359 19.9 605 Secondary 27.7 229 27.4 301 27.5 530 Secondary+ 44.6 790 48.6 779 46.4 1569 Occupation Cultivator 13.6 566 2.1 130 10.9 696 Agricultural labourer 0.6 91 3.9 88 2.3 179 Non-agricultural labourer 24.9 378 8.8 309 17.7 687 Business 36.3 480 16.2 146 31.3 626 Salaried employment 40.1 298 41.4 99 40.4 397 Housework 29.4 5 22.5 1568 22.5 1573 Student 48.2 241 49.9 214 48.9 455 Religion Hindu 25.2 1863 20.9 2268 22.9 4131 Muslim 37.3 198 13.6 279 23.5 477 Other 59.1 18 17.0 22 34.6 40 Caste/Tribe Scheduled Caste 24.1 349 14.9 440 19.2 789 Scheduled Tribe 22.5 411 17.7 487 19.9 898 Other 28.4 1319 22.7 1642 25.3 2961 Travel due to work Yes 28.1 740 21.9 108 27.1 848 No 25.3 1339 20.1 2458 22.0 3797 Total 26.3 2079 20.3 2570 23.0 4649 Total includes cases with missing information on occupation, religion, caste/tribe and travel due to work.

161
Table 4.34U: Percent of URBAN respondents who have ever visited KEY clinic by sex and other background characteristics
Male Female Total Characteristic Percent Number Percent Number Percent Number Age 15-19 0.0 91 0.0 91 0.0 182 20-24 0.4 115 0.0 85 0.2 200 25-29 2.0 59 0.0 83 0.8 142 30-34 1.8 70 0.0 56 1.0 126 35-39 5.2 53 0.0 45 2.8 98 40-44 1.1 37 0.0 43 0.5 80 45-49 0.0 33 0.0 25 0.0 58 Marital status Currently married 2.6 214 0.0 271 1.1 485 Marriage dissolved 0.0 1 0.0 15 0.0 16 Never married 0.2 243 0.0 142 0.1 385 Literacy and education Illiterate 0.0 49 0.0 32 0.0 81 Primary 0.0 19 0.0 7 0.0 26 Middle 0.0 49 0.0 43 0.0 92 Secondary 1.6 47 0.0 51 0.8 98 Secondary+ 1.9 294 0.0 295 0.9 589 Occupation Cultivator 0.0 11 0.0 1 0.0 12 Agricultural labourer 0.0 89 0.0 2 0.0 2 Non-agricultural labourer 1.6 143 0.0 19 0.0 108 Business 3.6 114 0.0 19 1.4 162 Salaried employment 0.0 1 0.0 36 2.7 150 Housework 0.0 95 0.0 274 0.0 275 Student Nil Nil 0.0 77 0.0 172 Religion Hindu 1.3 381 0.0 388 0.6 769 Muslim 1.6 67 0.0 37 1.1 104 Other 0.0 10 0.0 3 0.0 13 Caste/Tribe Scheduled Caste 1.0 47 0.0 62 0.4 109 Scheduled Tribe 0.0 79 0.0 64 0.0 143 Other 1.7 332 0.0 302 0.9 634 Travel due to work Yes 1.5 111 0.0 14 1.3 125 No 1.3 347 0.0 413 0.6 760 Total 1.3 458 0.0 428 0.7 886 Note: Total includes cases with missing information on occupation and travel due to work.
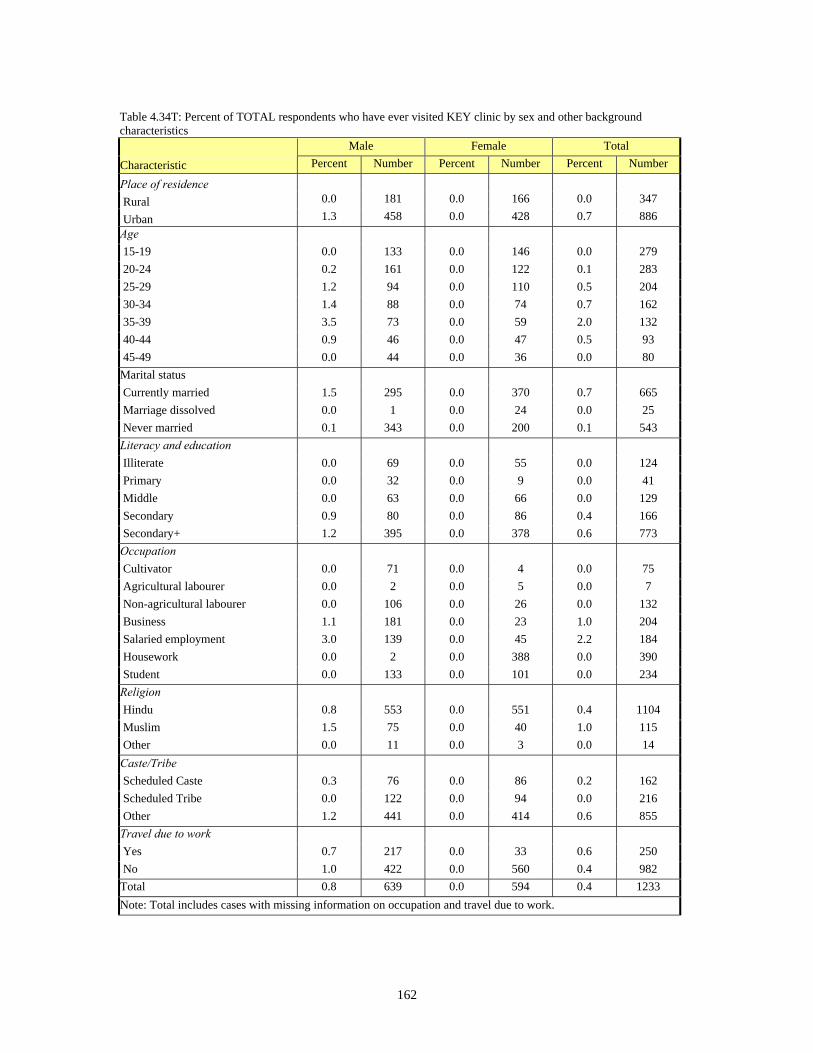
162
Table 4.34T: Percent of TOTAL respondents who have ever visited KEY clinic by sex and other background characteristics
Male Female Total Characteristic Percent Number Percent Number Percent Number
Place of residence
Rural 0.0 181 0.0 166 0.0 347
Urban 1.3 458 0.0 428 0.7 886 Age 15-19 0.0 133 0.0 146 0.0 279 20-24 0.2 161 0.0 122 0.1 283 25-29 1.2 94 0.0 110 0.5 204 30-34 1.4 88 0.0 74 0.7 162 35-39 3.5 73 0.0 59 2.0 132 40-44 0.9 46 0.0 47 0.5 93 45-49 0.0 44 0.0 36 0.0 80 Marital status Currently married 1.5 295 0.0 370 0.7 665 Marriage dissolved 0.0 1 0.0 24 0.0 25 Never married 0.1 343 0.0 200 0.1 543 Literacy and education Illiterate 0.0 69 0.0 55 0.0 124 Primary 0.0 32 0.0 9 0.0 41 Middle 0.0 63 0.0 66 0.0 129 Secondary 0.9 80 0.0 86 0.4 166 Secondary+ 1.2 395 0.0 378 0.6 773 Occupation Cultivator 0.0 71 0.0 4 0.0 75 Agricultural labourer 0.0 2 0.0 5 0.0 7 Non-agricultural labourer 0.0 106 0.0 26 0.0 132 Business 1.1 181 0.0 23 1.0 204 Salaried employment 3.0 139 0.0 45 2.2 184 Housework 0.0 2 0.0 388 0.0 390 Student 0.0 133 0.0 101 0.0 234 Religion Hindu 0.8 553 0.0 551 0.4 1104 Muslim 1.5 75 0.0 40 1.0 115 Other 0.0 11 0.0 3 0.0 14 Caste/Tribe Scheduled Caste 0.3 76 0.0 86 0.2 162 Scheduled Tribe 0.0 122 0.0 94 0.0 216 Other 1.2 441 0.0 414 0.6 855 Travel due to work Yes 0.7 217 0.0 33 0.6 250 No 1.0 422 0.0 560 0.4 982 Total 0.8 639 0.0 594 0.4 1233 Note: Total includes cases with missing information on occupation and travel due to work.

163
Table 4.35F: Percent of FEMALE respondents who have heard of "Namma" clinic by background characteristics
Rural Urban Total
Characteristic Percent Number Percent Number Percent Number Age 15-19 0.9 228 1.3 203 1.1 431 20-24 0.5 194 2.7 208 1.5 402 25-29 1.1 230 2.1 224 1.5 454 30-34 0.7 190 0.7 175 0.7 365 35-39 0.1 219 0.5 175 0.3 394 40-44 0.0 135 1.3 142 0.6 277 45-49 0.0 142 0.6 105 0.2 247 Marital status Currently married 0.2 978 1.4 861 0.7 1839 Marriage dissolved 0.0 112 1.0 85 0.4 197 Never married 2.1 248 1.7 286 1.9 534 Literacy and education Illiterate 0.0 719 0.3 308 0.1 1027 Primary 0.0 63 0.0 41 0.0 104 Middle 0.2 161 0.4 198 0.3 359 Secondary 2.5 165 2.4 136 2.5 301 Secondary+ 1.6 230 2.5 549 2.2 779 Occupation Cultivator 0.0 122 0.0 8 0.0 130 Agricultural labourer 0.0 69 0.0 19 0.0 88 Non-agricultural labourer 0.0 194 1.0 115 0.4 309 Business 0.0 40 0.9 106 0.6 146 Salaried employment 14.5 22 3.7 77 6.2 99 Housework 0.2 804 1.3 764 0.7 1568 Student 3.5 78 2.1 136 2.5 214 Religion Hindu 0.5 1312 1.6 956 0.9 2268 Muslim 0.0 25 0.8 254 0.8 279 Other Nil Nil 0.0 22 0.0 22 Caste/Tribe Scheduled Caste 0.1 309 1.8 131 0.5 440 Scheduled Tribe 0.7 299 1.6 188 1.0 487 Other 0.6 729 1.4 913 1.0 1642 Travel due to work Yes 1.7 70 2.9 38 2.0 108 No 0.4 1267 1.4 1191 0.8 2458 Total 0.5 1338 1.4 1232 0.9 2570 Note: Total includes cases with missing information on occupation, religion, caste/tribe and travel due to work.

164
Table 4.36R: Percent of RURAL respondents who are aware of HIV/AIDS programmes in the area by sex and other background characteristics
Male Female Total
Characteristic Percent Number Percent Number Percent Number Age 15-19 16.6 170 14.2 228 15.4 398 20-24 7.8 224 8.5 194 8.1 418 25-29 15.8 190 6.8 230 11.0 420 30-34 3.5 134 7.9 190 6.1 324 35-39 3.7 153 5.9 219 5.2 372 40-44 6.9 124 11.1 135 9.2 259 45-49 2.2 134 2.9 142 2.6 276 Marital status Currently married 6.2 670 5.9 978 6.0 1648 Marriage dissolved 0.0 6 10.1 112 9.5 118 Never married 13.3 453 17.6 248 14.7 701 Literacy and education Illiterate 3.3 474 5.2 719 4.4 1193 Primary 3.8 74 1.5 63 2.5 137 Middle 7.5 125 7.6 161 7.6 286 Secondary 2.7 138 11.2 165 7.2 303 Secondary+ 21.4 318 21.8 230 21.6 548 Occupation Cultivator 7.0 516 5.5 122 6.7 638 Agricultural labourer 6.0 83 3.6 69 4.8 152 Non-agricultural labourer 1.5 162 4.8 194 3.2 356 Business 9.1 173 2.5 40 7.6 213 Salaried employment 5.0 77 59.2 22 16.6 99 Housework 18.5 3.0 7.5 804 7.5 807 Student 28.5 103 37.0 78 31.1 181 Religion Hindu 9.0 1098 8.1 1312 8.5 2410 Muslim 3.0 29 11.0 25 6.6 54 Other 0.0 2 Nil Nil 0.0 2 Caste/Tribe Scheduled Caste 13.0 241 6.1 309 9.3 550 Scheduled Tribe 6.4 254 11.3 299 9.1 553 Other 8.0 634 7.7 729 7.8 1363 Travel due to work Yes 9.3 497 12.2 70 9.8 567 No 8.7 632 7.8 1267 8.1 1899 Total 8.9 1129 8.1 1338 8.5 2467 Note: Total includes cases with missing information on occupation, religion, caste/tribe and travel due to work.

165
Table 4.36U: Percent of URBAN respondents who are aware of HIV/AIDS programmes in the area by sex and other background characteristics
Male Female Total
Characteristic Percent Number Percent Number Percent Number Age 15-19 9.3 161 8.7 203 9.0 364 20-24 9.2 204 4.7 208 6.9 412 25-29 6.8 132 7.8 224 7.4 356 30-34 7.8 145 5.6 175 6.6 320 35-39 8.7 127 7.4 175 7.9 302 40-44 12.2 92 5.2 142 8.1 234 45-49 4.4 93 2.0 105 3.2 198 Marital status Currently married 7.4 522 5.7 861 6.4 1383 Marriage dissolved 0.0 3 2.6 85 2.5 88 Never married 9.9 429 9.0 286 9.5 715 Literacy and education Illiterate 5.3 227 4.0 308 4.6 535 Primary 12.0 39 0.0 41 5.9 80 Middle 5.5 123 5.2 198 5.3 321 Secondary 8.8 92 8.1 136 8.4 228 Secondary+ 10.6 473 8.3 549 9.4 1022 Occupation Cultivator 4.4 52 0.0 8 3.8 60 Agricultural labourer 15.8 8 5.4 19 8.1 27 Non-agricultural labourer 9.4 216 2.5 115 6.9 331 Business 7.9 308 4.4 106 7.0 414 Salaried employment 8.8 221 16.8 77 10.8 298 Housework 0.0 2 5.9 764 5.9 766 Student 9.5 139 9.3 136 9.4 275 Religion Hindu 8.5 768 6.6 956 7.5 1724 Muslim 7.9 170 3.1 254 5.1 424 Other 9.8 16 21.6 22 16.8 38 Caste/Tribe Scheduled Caste 5.6 108 7.7 131 6.8 239 Scheduled Tribe 10.7 157 8.0 188 9.3 345 Other 8.3 689 5.7 913 6.9 1602 Travel due to work Yes 6.5 245 4.6 38 6.2 283 No 9.2 709 6.3 1191 7.4 1900 Total 8.4 954 6.2 1232 7.2 2186 Note: Total includes cases with missing information on occupation and travel due to work.
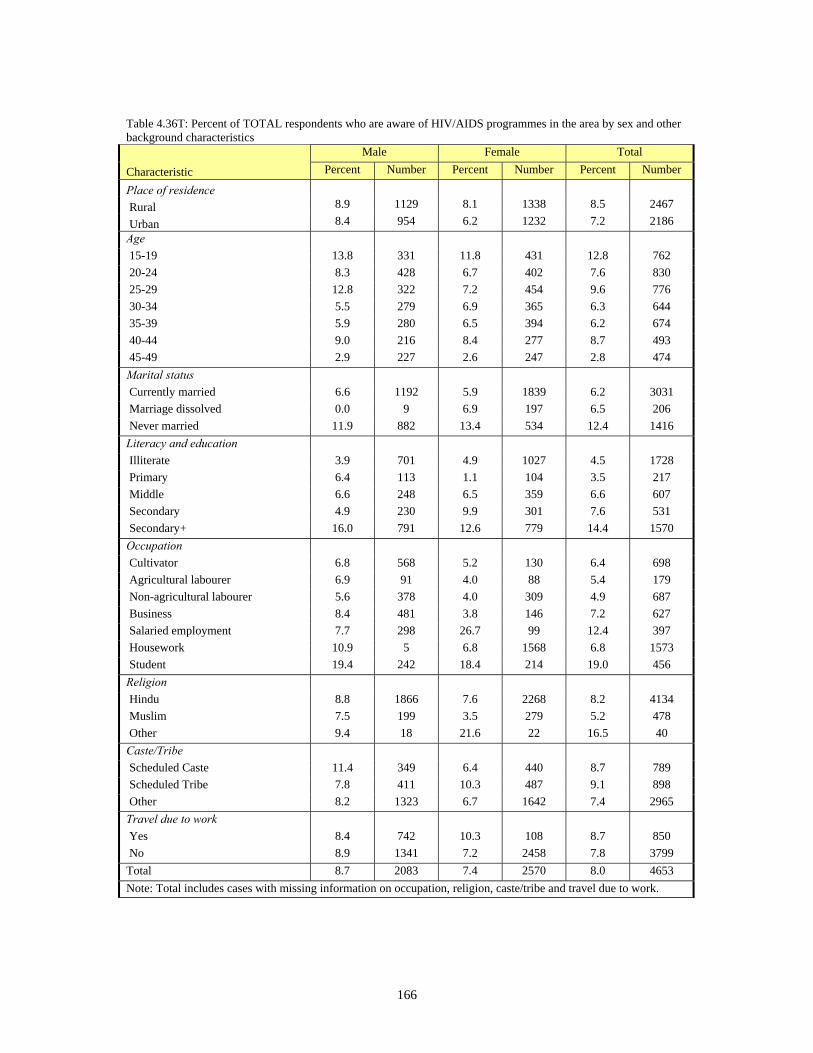
166
Table 4.36T: Percent of TOTAL respondents who are aware of HIV/AIDS programmes in the area by sex and other background characteristics
Male Female Total
Characteristic Percent Number Percent Number Percent Number
Place of residence
Rural 8.9 1129 8.1 1338 8.5 2467
Urban 8.4 954 6.2 1232 7.2 2186 Age 15-19 13.8 331 11.8 431 12.8 762 20-24 8.3 428 6.7 402 7.6 830 25-29 12.8 322 7.2 454 9.6 776 30-34 5.5 279 6.9 365 6.3 644 35-39 5.9 280 6.5 394 6.2 674 40-44 9.0 216 8.4 277 8.7 493 45-49 2.9 227 2.6 247 2.8 474 Marital status Currently married 6.6 1192 5.9 1839 6.2 3031 Marriage dissolved 0.0 9 6.9 197 6.5 206 Never married 11.9 882 13.4 534 12.4 1416 Literacy and education Illiterate 3.9 701 4.9 1027 4.5 1728 Primary 6.4 113 1.1 104 3.5 217 Middle 6.6 248 6.5 359 6.6 607 Secondary 4.9 230 9.9 301 7.6 531 Secondary+ 16.0 791 12.6 779 14.4 1570 Occupation Cultivator 6.8 568 5.2 130 6.4 698 Agricultural labourer 6.9 91 4.0 88 5.4 179 Non-agricultural labourer 5.6 378 4.0 309 4.9 687 Business 8.4 481 3.8 146 7.2 627 Salaried employment 7.7 298 26.7 99 12.4 397 Housework 10.9 5 6.8 1568 6.8 1573 Student 19.4 242 18.4 214 19.0 456 Religion Hindu 8.8 1866 7.6 2268 8.2 4134 Muslim 7.5 199 3.5 279 5.2 478 Other 9.4 18 21.6 22 16.5 40 Caste/Tribe Scheduled Caste 11.4 349 6.4 440 8.7 789 Scheduled Tribe 7.8 411 10.3 487 9.1 898 Other 8.2 1323 6.7 1642 7.4 2965 Travel due to work Yes 8.4 742 10.3 108 8.7 850 No 8.9 1341 7.2 2458 7.8 3799 Total 8.7 2083 7.4 2570 8.0 4653 Note: Total includes cases with missing information on occupation, religion, caste/tribe and travel due to work.
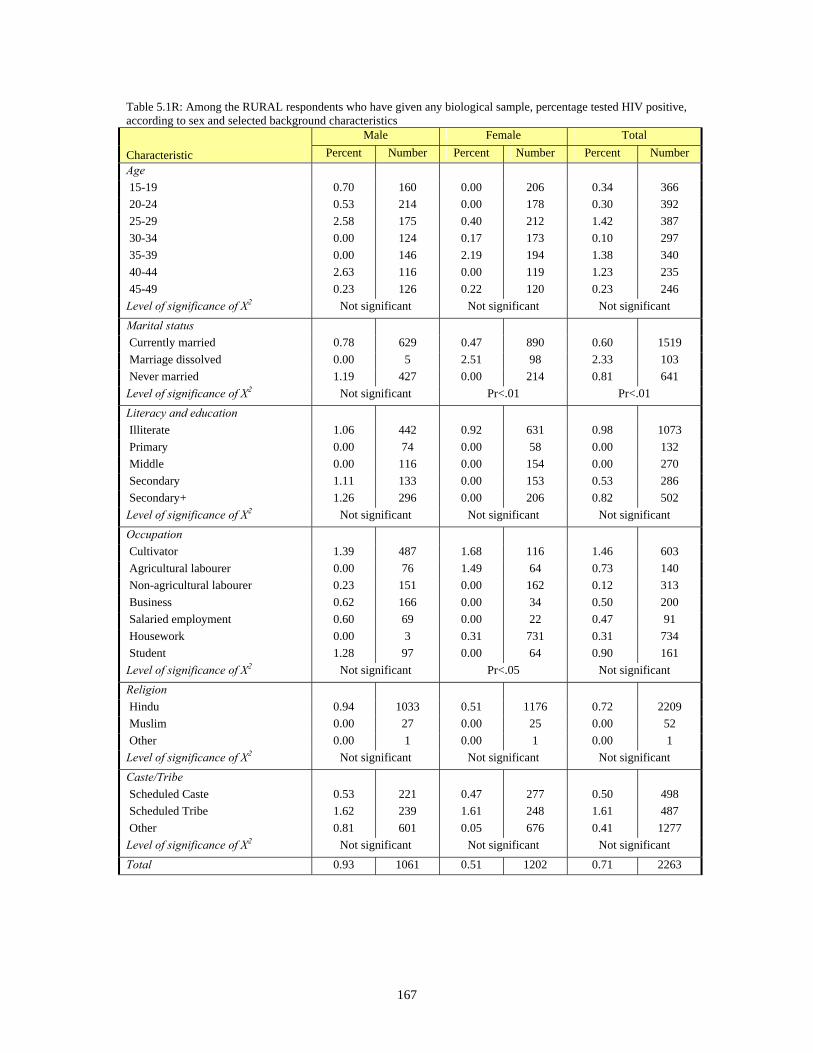
167
Table 5.1R: Among the RURAL respondents who have given any biological sample, percentage tested HIV positive, according to sex and selected background characteristics
Male Female Total
Characteristic Percent Number Percent Number Percent Number Age 15-19 0.70 160 0.00 206 0.34 366 20-24 0.53 214 0.00 178 0.30 392 25-29 2.58 175 0.40 212 1.42 387 30-34 0.00 124 0.17 173 0.10 297 35-39 0.00 146 2.19 194 1.38 340 40-44 2.63 116 0.00 119 1.23 235 45-49 0.23 126 0.22 120 0.23 246 Level of significance of X2 Not significant Not significant Not significant Marital status Currently married 0.78 629 0.47 890 0.60 1519 Marriage dissolved 0.00 5 2.51 98 2.33 103 Never married 1.19 427 0.00 214 0.81 641 Level of significance of X2 Not significant Pr<.01 Pr<.01 Literacy and education Illiterate 1.06 442 0.92 631 0.98 1073 Primary 0.00 74 0.00 58 0.00 132 Middle 0.00 116 0.00 154 0.00 270 Secondary 1.11 133 0.00 153 0.53 286 Secondary+ 1.26 296 0.00 206 0.82 502 Level of significance of X2 Not significant Not significant Not significant Occupation Cultivator 1.39 487 1.68 116 1.46 603 Agricultural labourer 0.00 76 1.49 64 0.73 140 Non-agricultural labourer 0.23 151 0.00 162 0.12 313 Business 0.62 166 0.00 34 0.50 200 Salaried employment 0.60 69 0.00 22 0.47 91 Housework 0.00 3 0.31 731 0.31 734 Student 1.28 97 0.00 64 0.90 161 Level of significance of X2 Not significant Pr<.05 Not significant Religion Hindu 0.94 1033 0.51 1176 0.72 2209 Muslim 0.00 27 0.00 25 0.00 52 Other 0.00 1 0.00 1 0.00 1 Level of significance of X2 Not significant Not significant Not significant Caste/Tribe Scheduled Caste 0.53 221 0.47 277 0.50 498 Scheduled Tribe 1.62 239 1.61 248 1.61 487 Other 0.81 601 0.05 676 0.41 1277 Level of significance of X2 Not significant Not significant Not significant
Total 0.93 1061 0.51 1202 0.71 2263

168
Table 5.1R (Contd.): Among the RURAL respondents who have given any biological sample, percentage tested HIV positive, according to sex and selected background characteristics
Male Female Total
Characteristic Percent Number Percent Number Percent Number Travel due to work Yes 1.61 462 0.00 64 1.35 526 No 0.46 599 0.55 1137 0.52 1736 Level of significance of X2 Not significant Not significant Not significant
Sex with a non-regular partner in last 1 year
No 0.96 1035 0.51 1198 0.72 2233 Yes 0.00 26 0.00 4 0.00 30 Level of significance of X2 Not significant Not significant Not significant
Ever had sex with more than one partner
No 0.60 891 0.49 1189 0.54 2080 Yes 2.38 170 3.05 13 2.41 183 Level of significance of X2 Not significant Pr<.01 Pr<.01
Ever paid/received money for sex No 0.95 1040 0.51 1201 0.72 2241 Yes 0.00 21 0.00 1 0.00 22 Level of significance of X2 Not significant Not significant Not significant
Ever had any risk behaviour1 No 0.60 891 0.49 1189 0.54 2080 Yes 2.38 170 3.05 13 2.41 183 Level of significance of X2 Not significant Pr<.01 Pr<.01 Ever had symptoms of STI No 0.94 1043 0.59 1048 0.77 2091 Yes 0.00 18 0.00 154 0.00 172 Level of significance of X2 Not significant Not significant Not significant Whether circumcised Yes 0.00 31 No 0.95 1030 Level of significance of X2 Not significant
Total 0.93 1061 0.51 1202 0.71 2263 1 Either had sex with a non-regular partner in the last 1 year, or ever had sex with more than one partner, or ever paid/received money for sex Total includes cases with missing information on occupation, religion, caste/tribe and travel due to work.
Pr<.01: Pearson Chi-square is significant below .01 level Pr<.05: Person Chi-square is significant below .05 level

169
Table 5.1U: Among the URBAN respondents who have given any biological sample, percentage tested HIV positive, according to sex and selected background characteristics
Male Female Total
Characteristic Percent Number Percent Number Percent Number Age 15-19 0.49 147 0.67 180 0.58 327 20-24 1.20 191 0.83 188 1.01 379 25-29 1.11 119 1.76 194 1.51 313 30-34 0.42 132 1.86 151 1.18 283 35-39 2.33 109 0.00 149 0.97 258 40-44 2.16 84 0.00 114 0.94 198 45-49 0.00 82 0.00 87 0.00 169 Level of significance of X2 Not significant Not significant Not significant Marital status Currently married 1.15 466 1.05 750 1.09 1216 Marriage dissolved 0.00 2 1.33 76 1.26 78 Never married 0.97 396 0.00 237 0.61 633 Level of significance of X2 Not significant Not significant Not significant Literacy and education Illiterate 1.93 208 0.88 289 1.31 497 Primary 0.00 37 0.00 37 0.00 74 Middle 0.49 117 0.00 176 0.20 293 Secondary 1.17 83 1.36 124 1.28 207 Secondary+ 0.83 419 1.08 437 0.96 856 Level of significance of X2 Not significant Not significant Not significant Occupation Cultivator 3.88 48 0.00 8 3.26 56 Agricultural labourer 0.00 8 0.00 18 0.00 26 Non-agricultural labourer 0.39 204 1.07 108 0.64 312 Business 1.09 277 1.05 93 1.08 370 Salaried employment 1.66 196 3.84 59 2.18 255 Housework 0.00 2 0.70 661 0.70 663 Student 0.00 121 0.00 110 0.00 231 Level of significance of X2 Not significant Not significant Not significant
Religion Hindu 1.31 692 1.07 813 1.18 1505 Muslim 0.00 158 0.00 233 0.00 391 Other 0.00 14 0.00 17 0.00 31 Level of significance of X2 Not significant Not significant Not significant Caste/Tribe Scheduled Caste 0.00 100 0.92 116 0.49 216 Scheduled Tribe 1.30 144 2.31 167 1.81 311 Other 1.17 620 0.57 780 0.83 1400 Level of significance of X2 Not significant Not significant Not significant Total 1.06 864 0.84 1063 0.94 1927

170
Table 5.1U (Contd.): Among the URBAN respondents who have given any biological sample, percentage tested HIV positive, according to sex and selected background characteristics
Male Female Total
Characteristic Percent Number Percent Number Percent Number Travel due to work Yes 0.74 223 0.00 32 0.65 255 No 1.19 641 0.87 1028 0.99 1669 Level of significance of X2 Not significant Not significant Not significant Sex with a non-regular partner in last 1 year
No 1.09 848 0.85 1057 0.95 1905 Yes 0.00 16 0.00 6 0.00 22 Level of significance of X2 Not significant Not significant Not significant Ever had sex with more than one partner
No 0.89 790 0.64 1051 0.75 1841 Yes 2.71 74 16.13 12 4.65 86 Level of significance of X2 Not significant Pr<.01 Pr<.05 Ever paid/received money for sex No 0.83 843 0.85 1058 0.84 1901 Yes 10.16 21 0.00 5 8.25 26 Level of significance of X2 Pr<.01 Not significant Pr<.01 Ever had any risk behaviour1 No 0.89 789 0.64 1051 0.75 1840 Yes 2.69 75 16.13 12 4.62 87 Level of significance of X2 Not significant Pr<.01 Pr<.05 Ever had symptoms of STI No 0.93 853 0.92 920 0.92 1773 Yes 13.55 11 0.39 143 1.14 154 Level of significance of X2 Pr<.05 Not significant Not significant Whether circumcised Yes 0.00 162 No 1.30 702 Level of significance of X2 Not significant Total 1.06 864 0.84 1063 0.94 1927 1 Either had sex with a non-regular partner in the last 1 year, or ever had sex with more than one partner, or ever paid/received money for sex Total includes cases with missing information on occupation and travel due to work. Pr<.01: Pearson Chi-square is significant below .01 level Pr<.05: Person Chi-square is significant below .05 level

171
Table 5.1T: Among the TOTAL respondents who have given any biological sample, percentage tested HIV positive, according to sex and selected background characteristics
Male Female Total
Characteristic Percent Number Percent Number Percent Number Age 15-19 0.61 307 0.28 386 0.44 693 20-24 0.80 405 0.40 366 0.61 771 25-29 2.08 294 0.97 406 1.45 700 30-34 0.20 256 0.86 324 0.57 580 35-39 0.96 255 1.39 343 1.22 598 40-44 2.44 200 0.00 233 1.11 433 45-49 0.16 208 0.15 207 0.15 415 Level of significance of X2 Not significant Not significant Not significant Marital status Currently married 0.91 1095 0.70 1640 0.78 2735 Marriage dissolved 0.00 7 1.96 174 1.84 181 Never married 1.10 823 0.00 451 0.72 1274 Level of significance of X2 Not significant Pr<.01 Pr<.01 Literacy and education Illiterate 1.30 650 0.91 920 1.07 1570 Primary 0.00 111 0.00 95 0.00 206 Middle 0.21 233 0.00 330 0.09 563 Secondary 1.13 216 0.57 277 0.82 493 Secondary+ 1.04 715 0.73 643 0.90 1358 Level of significance of X2 Not significant Not significant Not significant Occupation Cultivator 1.60 535 1.59 124 1.60 659 Agricultural labourer 0.00 84 1.15 82 0.61 166 Non-agricultural labourer 0.31 355 0.42 270 0.36 625 Business 0.91 443 0.74 127 0.87 570 Salaried employment 1.37 265 2.85 81 1.71 346 Housework 0.00 5 0.47 1392 0.47 1397 Student 0.66 218 0.00 174 0.40 392 Level of significance of X2 Not significant Not significant Not significant
Religion Hindu 1.07 1725 0.71 1989 0.88 3714 Muslim 0.00 185 0.00 258 0.00 443 Other 0.00 15 0.00 17 0.00 32 Level of significance of X2 Not significant Not significant Not significant
Caste/Tribe Scheduled Caste 0.41 321 0.57 393 0.50 714 Scheduled Tribe 1.52 383 1.83 415 1.68 798 Other 0.98 1221 0.31 1456 0.62 2677 Level of significance of X2 Not significant Not significant Not significant Total 0.98 1925 0.65 2265 0.80 4190 Note: Total includes cases with missing information on education, occupation and standard of living.

172
Table 5.1T (Contd.): Among the TOTAL respondents who have given any biological sample, percentage tested HIV positive, according to sex and selected background characteristics
Male Female Total
Characteristic Percent Number Percent Number Percent Number Travel due to work Yes 1.34 685 0.00 96 1.14 781 No 0.78 1240 0.69 2165 0.72 3405 Level of significance of X2 Not significant Not significant Not significant Sex with a non-regular partner in last 1 year
No 1.01 1883 0.65 2255 0.81 4138 Yes 0.00 42 0.00 10 0.00 52 Level of significance of X2 Not significant Not significant Not significant Ever had sex with more than one partner
No 0.72 1681 0.55 2240 0.63 3921 Yes 2.46 244 10.09 25 3.01 269 Level of significance of X2 Not significant Pr<.01 Pr<.01 Ever paid/received money for sex No 0.90 1883 0.65 2259 0.77 4142 Yes 5.41 42 0.00 6 4.78 48 Level of significance of X2 Pr<.01 Not significant Pr<.01 Ever had any risk behaviour1 No 0.72 1680 0.55 2240 0.63 3920 Yes 2.45 245 10.09 25 3.00 270 Level of significance of X2 Not significant Pr<.01 Pr<.01
Ever had symptoms of STI No 0.94 1896 0.73 1968 0.83 3864 Yes 5.07 29 0.16 297 0.48 326 Level of significance of X2 Not significant Not significant Not significant Whether circumcised Yes 0.00 193 No 1.07 1732 Level of significance of X2 Not significant Total 0.98 1925 0.65 2265 0.80 4190 1 Either had sex with a non-regular partner in the last 1 year, or ever had sex with more than one partner, or ever paid/received money for sex Total includes cases with missing information on occupation, religion, caste/tribe and travel due to work. Pr<.01: Pearson Chi-square is significant below .01 level Pr<.05: Person Chi-square is significant below .05 level

173
Table 5.2R: Among the RURAL respondents who have given blood sample, percentage tested for active syphilis, according to sex and selected background characteristics
Male Female Total
Characteristic Percent Number Percent Number Percent Number Age 15-19 5.01 142 0.00 164 2.54 306 20-24 0.42 190 0.00 142 0.24 332 25-29 0.00 161 2.37 169 1.18 330 30-34 1.17 106 0.99 140 1.06 246 35-39 0.00 132 0.44 157 0.27 289 40-44 0.00 99 2.12 92 1.01 191 45-49 5.76 114 0.89 84 3.74 198 Level of significance of X2 Not significant Not significant Not significant Marital status Currently married 1.69 559 0.89 701 1.25 1260 Marriage dissolved 0.00 5 3.99 73 3.54 78 Never married 2.19 380 0.00 174 1.52 554 Level of significance of X2 Not significant Pr<.01 Pr<.01 Literacy and education Illiterate 2.37 397 1.65 472 1.98 869 Primary 0.00 66 0.00 45 0.00 111 Middle 0.00 103 0.00 128 0.00 231 Secondary 0.28 112 0.25 131 0.27 243 Secondary+ 2.82 266 0.00 172 1.93 438 Level of significance of X2 Not significant Not significant Not significant Occupation Cultivator 0.25 435 0.00 92 0.20 527 Agricultural labourer 0.00 66 0.00 50 0.00 116 Non-agricultural labourer 0.00 136 3.13 122 1.43 258 Business 7.26 147 1.54 26 6.40 173 Salaried employment 0.00 63 0.00 15 0.00 78 Housework 0.00 1 0.86 582 0.85 583 Student 8.61 86 0.00 55 6.08 141 Level of significance of X2 Not significant Pr<.05 Not significant
Religion Hindu 1.89 919 0.91 926 1.40 1845 Muslim 0.00 24 0.00 21 0.00 45 Other 0.00 1 0.00 1 0.00 1 Level of significance of X2 Not significant Not significant Not significant
Caste/Tribe Scheduled Caste 7.42 186 1.15 208 4.12 394 Scheduled Tribe 0.69 216 2.37 186 1.44 402 Other 0.00 542 0.21 553 0.11 1095 Level of significance of X2 Pr<.05 Not significant Pr<.01 Total 1.87 944 0.90 948 1.39 1892

174
Table 5.2 R(Contd.): Among the RURAL respondents who have given blood sample, percentage tested for active syphilis, according to sex and selected background characteristics
Male Female Total
Characteristic Percent Number Percent Number Percent Number Travel due to work Yes 2.27 414 1.18 49 2.12 463 No 1.58 530 0.88 898 1.15 1428 Level of significance of X2 Not significant Not significant Not significant Sex with a non-regular partner in last 1 year
No 1.92 921 0.90 945 1.41 1866 Yes 0.00 23 0.00 3 0.00 26 Level of significance of X2 Not significant Not significant Not significant Ever had sex with more than one partner
No 2.23 792 0.77 938 1.43 1730 Yes 0.43 152 14.69 10 1.08 162 Level of significance of X2 Not significant Pr<.01 Not significant Ever paid/received money for sex No 1.90 923 0.90 948 1.40 1871 Yes 0.00 21 Nil Nil 0.00 21 Level of significance of X2 Not significant NE Not significant Ever had any risk behaviour1 No 2.23 792 0.77 938 1.43 1730 Yes 0.43 152 14.69 10 1.08 162 Level of significance of X2 Not significant Pr<.01 Not significant Ever had symptoms of STI No 1.89 927 0.59 813 1.29 1740 Yes 0.00 17 2.69 135 2.49 152 Level of significance of X2 Not significant Not significant Not significant Whether circumcised Yes 0.00 28 No 1.91 916 Level of significance of X2 Not significant Total 1.87 944 0.90 948 1.39 1892 1 Either had sex with a non-regular partner in the last 1 year, or ever had sex with more than one partner, or ever paid/received money for sex Total includes cases with missing information on occupation, religion, caste/tribe and travel due to work. Pr<.01: Pearson Chi-square is significant below .01 level Pr<.05: Person Chi-square is significant below .05 level

175
Table 5.2U: Among the URBAN respondents who have given blood sample, percentage tested for active syphilis, according to sex and selected background characteristics
Male Female Total
Characteristic Percent Number Percent Number Percent Number Age 15-19 0.00 127 0.00 151 0.00 278 20-24 0.00 171 0.00 147 0.00 318 25-29 0.38 109 1.96 160 1.31 269 30-34 4.82 119 1.22 125 2.97 244 35-39 3.98 96 1.29 128 2.39 224 40-44 2.10 65 0.00 90 0.93 155 45-49 1.86 71 3.32 66 2.58 137 Level of significance of X2 Pr<.05 Not significant Pr<.01 Marital status Currently married 3.08 407 1.14 611 1.92 1018 Marriage dissolved 0.00 2 2.66 61 2.50 63 Never married 0.00 349 0.00 195 0.00 544 Level of significance of X2 Pr<.01 Not significant Pr<.01 Literacy and education Illiterate 1.84 185 2.15 234 2.02 419 Primary 4.31 35 0.00 30 2.28 65 Middle 1.53 110 1.05 142 1.27 252 Secondary 1.52 72 1.00 103 1.21 175 Secondary+ 1.42 356 0.20 358 0.80 714 Level of significance of X2 Not significant Not significant Not significant Occupation Cultivator 2.83 43 0.00 6 2.45 49 Agricultural labourer 0.00 8 0.00 16 0.00 24 Non-agricultural labourer 1.78 185 2.73 89 2.11 274 Business 1.45 239 0.83 72 1.30 311 Salaried employment 1.88 171 2.89 49 2.12 220 Housework 0.00 2 0.75 537 0.75 539 Student 0.00 103 0.00 95 0.00 198 Level of significance of X2 Not significant Not significant Not significant
Religion Hindu 1.88 613 1.03 668 1.43 1281 Muslim 0.93 132 0.91 185 0.92 317 Other 0.00 13 0.00 14 0.00 27 Level of significance of X2 Not significant Not significant Not significant
Caste/Tribe Scheduled Caste 1.30 88 1.18 93 1.24 181 Scheduled Tribe 2.03 134 1.05 140 1.56 274 Other 1.66 536 0.95 634 1.27 1170 Level of significance of X2 Not significant Not significant Not significant Total 1.69 758 0.99 867 1.31 1625

176
Table 5.2U (Contd.): Among the URBAN respondents who have given blood sample, percentage tested for active syphilis, according to sex and selected background characteristics
Male Female Total
Characteristic Percent Number Percent Number Percent Number Travel due to work Yes 1.89 191 0.00 20 1.70 211 No 1.61 567 1.02 845 1.25 1412 Level of significance of X2 Not significant Not significant Not significant Sex with a non-regular partner in last 1 year
No 1.37 742 0.99 861 1.17 1603 Yes 15.50 16 0.00 6 11.52 22 Level of significance of X2 Pr<.01 Not significant Pr<.01 Ever had sex with more than one partner
No 1.09 690 1.00 856 1.04 1546 Yes 7.06 68 0.00 11 6.03 79 Level of significance of X2 Pr<.05 Not significant Pr<.01 Ever paid/received money for sex No 1.42 737 0.99 862 1.19 1599 Yes 10.86 21 0.00 5 8.85 26 Level of significance of X2 Pr<.05 Not significant Pr<.01 Ever had any risk behaviour1 No 1.09 689 1.00 856 1.04 1545 Yes 7.00 69 0.00 11 5.98 80 Level of significance of X2 Pr<.05 Not significant Pr<.01 Ever had symptoms of STI No 1.54 748 1.00 753 1.27 1501 Yes 14.18 10 0.90 114 1.80 124 Level of significance of X2 Not significant Not significant Not significant Whether circumcised Yes 0.88 136 No 1.86 622 Level of significance of X2 Not significant Total 1.69 758 0.99 867 1.31 1625 1 Either had sex with a non-regular partner in the last 1 year, or ever had sex with more than one partner, or ever paid/received money for sex Total includes cases with missing information on occupation and travel due to work. Pr<.01: Pearson Chi-square is significant below .01 level Pr<.05: Person Chi-square is significant below .05 level

177
Table 5.2T: Among the TOTAL respondents who have given blood sample, percentage tested for active syphilis, according to sex and selected background characteristics
Male Female Total
Characteristic Percent Number Percent Number Percent Number Age 15-19 2.97 269 0.00 315 1.46 584 20-24 0.24 361 0.00 289 0.14 650 25-29 0.14 270 2.18 329 1.23 599 30-34 3.03 225 1.09 265 1.95 490 35-39 1.63 228 0.78 285 1.12 513 40-44 0.82 164 1.12 182 0.97 346 45-49 4.63 185 1.77 150 3.37 335 Level of significance of X2 Pr<.01 Not significant Pr<.01
Marital status Currently married 2.21 966 0.99 1312 1.51 2278 Marriage dissolved 0.00 7 3.31 134 3.03 141 Never married 1.23 729 0.00 369 0.82 1098 Level of significance of X2 Pr<.01 Pr<.01 Pr<.01
Literacy and education Illiterate 2.22 582 1.80 706 1.99 1288 Primary 1.37 101 0.00 75 0.69 176 Middle 0.74 213 0.47 270 0.59 483 Secondary 0.74 184 0.57 234 0.65 418 Secondary+ 2.11 622 0.14 530 1.27 1152 Level of significance of X2 Not significant Not significant Not significant
Occupation Cultivator 0.47 478 0.00 98 0.38 576 Agricultural labourer 0.00 74 0.00 66 0.00 140 Non-agricultural labourer 0.99 321 2.96 211 1.77 532 Business 3.62 386 1.00 98 3.05 484 Salaried employment 1.34 234 2.42 64 1.57 298 Housework 0.00 3 0.81 1119 0.81 1122 Student 4.52 189 0.00 150 2.72 339 Level of significance of X2 Not significant Pr<.05 Pr<.05 Religion Hindu 1.89 1532 0.96 1594 1.41 3126 Muslim 0.85 156 0.86 206 0.86 362 Other 0.00 14 0.00 14 0.00 28 Level of significance of X2 Not significant Not significant Not significant Caste/Tribe Scheduled Caste 5.95 274 1.16 301 3.43 575 Scheduled Tribe 1.09 350 1.93 326 1.48 676 Other 0.80 1078 0.60 1187 0.69 2265 Level of significance of X2 Not significant Not significant Not significant Total 1.80 1702 0.94 1815 1.36 3517

178
Table 5.2T (Contd.): Among the TOTAL respondents who have given blood sample, percentage tested for active syphilis, according to sex and selected background characteristics
Male Female Total
Characteristic Percent Number Percent Number Percent Number Travel due to work Yes 2.16 605 0.91 69 2.00 674 No 1.60 1097 0.94 1743 1.20 2840 Level of significance of X2 Not significant Not significant Not significant
Sex with a non-regular partner in last 1 year
No 1.70 1663 0.94 1806 1.31 3469 Yes 5.35 39 0.00 9 4.68 48 Level of significance of X2 Pr<.05 Not significant Pr<.05 Ever had sex with more than one partner
No 1.74 1482 0.87 1794 1.26 3276 Yes 2.09 220 6.66 21 2.42 241 Level of significance of X2 Not significant Not significant Pr<.05 Ever paid/received money for sex No 1.71 1660 0.94 1810 1.31 3470 Yes 5.71 42 0.00 5 5.10 47 Level of significance of X2 Pr<.05 Not significant Pr<.05 Ever had any risk behaviour1 No 1.74 1481 0.87 1794 1.26 3275 Yes 2.08 221 6.66 21 2.42 242 Level of significance of X2 Not significant Not significant Pr<.05 Ever had symptoms of STI No 1.75 1675 0.77 1566 1.28 3241 Yes 5.45 27 1.95 249 2.20 276 Level of significance of X2 Not significant Not significant Not significant Whether circumcised Yes 0.74 164 No 1.89 1538 Level of significance of X2 Not significant
Total 1.80 1702 0.94 1815 1.36 3517 1 Either had sex with a non-regular partner in the last 1 year, or ever had sex with more than one partner, or ever paid/received money for sex Total includes cases with missing information on occupation, religion, caste/tribe and travel due to work. Pr<.01: Pearson Chi-square is significant below .01 level Pr<.05: Person Chi-square is significant below .05 level

179
Table 5.3R: Among the RURAL respondents who have given urine sample, percentage tested positive for chlamydia and/or gonorrhoeae, according to sex and selected background characteristics
Male Female Total
Characteristic Percent Number Percent Number Percent Number Age 15-19 0.16 154 0.00 191 0.08 345 20-24 0.00 203 0.53 174 0.23 377 25-29 0.51 165 2.29 203 1.47 368 30-34 5.79 118 3.12 168 4.18 286 35-39 0.28 140 0.54 193 0.44 333 40-44 0.96 108 1.12 112 1.05 220 45-49 0.56 119 0.00 116 0.30 235 Level of significance of X2 Not significant Not significant Pr<.01 Marital status Currently married 1.50 599 1.18 860 1.31 1459 Marriage dissolved 0.00 5 1.00 95 0.92 100 Never married 0.07 403 0.95 202 0.35 605 Level of significance of X2 Not significant Not significant Not significant Literacy and education Illiterate 0.67 417 1.13 612 0.94 1029 Primary 3.86 68 1.07 56 2.32 124 Middle 1.56 114 1.08 142 1.30 256 Secondary 0.28 127 0.00 150 0.13 277 Secondary+ 0.75 281 2.22 197 1.25 478 Level of significance of X2 Not significant Not significant Not significant Occupation Cultivator 1.47 465 1.00 115 1.35 580 Agricultural labourer 0.00 72 0.00 62 0.00 134 Non-agricultural labourer 0.62 142 1.90 155 1.25 297 Business 0.92 154 0.00 33 0.73 187 Salaried employment 0.00 65 4.30 21 0.98 86 Housework 0.00 3 0.92 702 0.92 705 Student 0.30 96 0.00 60 0.21 156 Level of significance of X2 Not significant Pr<.05 Not significant
Religion Hindu 0.95 982 1.14 1131 1.05 2113 Muslim 0.00 25 0.00 25 0.00 50 Level of significance of X2 Not significant Not significant Not significant Caste/Tribe Scheduled Caste 0.00 204 0.60 266 0.32 470 Scheduled Tribe 0.69 227 1.28 237 0.99 464 Other 1.50 576 1.33 653 1.41 1229 Level of significance of X2 Not significant Not significant Not significant Total 0.94 1007 1.13 1157 1.04 2164

180
Table 5.3R (Contd.): Among the RURAL respondents who have given urine sample, percentage tested positive for chlamydia and/ or gonorrhoeae, according to sex and selected background characteristics
Male Female Total
Characteristic Percent Number Percent Number Percent Number Travel due to work Yes 0.96 435 2.72 58 1.24 493 No 0.93 572 1.01 1098 0.98 1670 Level of significance of X2 Not significant Not significant Not significant Sex with a non-regular partner in last 1 year
No 1.14 1153 0.95 2134 99.05 2134 Yes 0.00 4 8.14 30 91.86 30 Level of significance of X2 Not significant Not significant Not significant
Ever had sex with more than one partner
No 0.45 843 1.11 1145 0.83 1988 Yes 3.10 164 4.15 12 3.15 176 Level of significance of X2 Pr<.05 Pr<.05 Pr<.05
Ever paid/received money for sex
No 0.95 987 1.13 1156 1.05 2143 Yes 0.00 20 0.00 1 0.00 21 Level of significance of X2 Not significant Not significant Not significant Ever had any risk behaviour1
No 0.45 843 1.11 1145 0.83 1988 Yes 3.10 164 4.15 12 3.15 176 Level of significance of X2 Pr<.05 Pr<.05 Pr<.05 Ever had symptoms of STI No 0.87 991 1.10 1004 0.98 1995 Yes 8.09 16 1.38 153 1.81 169 Level of significance of X2 Pr<.05 Not significant Not significant Whether circumcised Yes 0.00 29 No 0.96 978 Level of significance of X2 Not significant Total 0.94 1007 1.13 1157 1.04 2164 1 Either had sex with a non-regular partner in the last 1 year, or ever had sex with more than one partner, or ever paid/received money for sex Total includes cases with missing information on occupation, religion, caste/tribe and travel due to work. Pr<.01: Pearson Chi-square is significant below .01 level Pr<.05: Person Chi-square is significant below .05 level

181
Table 5.3U: Among the URBAN respondents who have given urine sample, percentage tested positive for chlamydia and/ or gonorrhoeae, according to sex and selected background characteristics
Male Female Total
Characteristic Percent Number Percent Number Percent Number Age 15-19 1.51 144 0.00 178 0.70 322 20-24 0.00 188 0.92 187 0.48 375 25-29 1.49 111 0.45 195 0.83 306 30-34 3.75 128 1.94 149 2.79 277 35-39 1.57 103 1.99 142 1.82 245 40-44 1.49 84 1.72 110 1.61 194 45-49 0.00 79 0.00 84 0.00 163 Level of significance of X2 Not significant Not significant Not significant
Marital status Currently married 1.84 446 0.99 737 1.31 1183 Marriage dissolved 0.00 2 1.16 73 1.10 75 Never married 0.88 389 0.91 235 0.89 624 Level of significance of X2 Not significant Not significant Not significant
Literacy and education Illiterate 1.27 199 1.85 279 1.61 478 Primary 11.88 36 0.00 36 6.06 72 Middle 0.00 115 0.00 173 0.00 288 Secondary 2.58 83 1.29 123 1.83 206 Secondary+ 0.60 404 0.74 434 0.67 838 Level of significance of X2 Pr<.01 Not significant Pr<.01
Occupation Cultivator 0.00 46 0.00 8 0.00 54 Agricultural labourer 0.00 8 0.00 18 0.00 26 Non-agricultural labourer 1.38 198 3.55 105 2.17 303 Business 2.98 266 0.00 91 2.20 357 Salaried employment 0.00 191 0.00 59 0.00 250 Housework 0.00 2 1.02 649 1.01 651 Student 0.86 118 0.00 110 0.44 228 Level of significance of X2 Not significant Not significant Not significant Religion Hindu 1.57 672 1.13 800 1.33 1472 Muslim 0.69 151 0.49 229 0.57 380 Other 0.00 14 0.00 16 0.00 30 Level of significance of X2 Not significant Not significant Not significant Caste/Tribe Scheduled Caste 0.00 99 2.29 114 1.24 213 Scheduled Tribe 0.00 141 0.78 164 0.40 305 Other 1.92 597 0.85 767 1.32 1364 Level of significance of X2 Not significant Not significant Not significant Total 1.39 837 0.99 1045 1.17 1882

182
Table 5.3U (Contd.): Among the URBAN respondents who have given urine sample, percentage tested positive for chlamydia and/ or gonorrhoeae, according to sex and selected background characteristics
Male Female Total
Characteristic Percent Number Percent Number Percent Number Travel due to work Yes 1.18 213 0.00 32 1.02 245 No 1.48 624 1.02 1011 1.19 1635 Level of significance of X2 Not significant Not significant Not significant Sex with a non-regular partner in last 1 year
No 1.22 822 0.99 1039 1.09 1861 Yes 10.48 15 0.00 6 7.66 21 Level of significance of X2 Pr<.05 Not significant Not significant
Ever had sex with more than one partner
No 1.32 767 1.00 1033 1.13 1800 Yes 2.15 70 0.00 12 1.83 82 Level of significance of X2 Not significant Not significant Not significant
Ever paid/received money for sex
No 1.43 817 0.99 1040 1.18 1857 Yes 0.00 20 0.00 5 0.00 25 Level of significance of X2 Not significant Not significant Not significant Ever had any risk behaviour1 No 1.32 766 1.00 1033 1.13 1799 Yes 2.13 71 0.00 12 1.82 83 Level of significance of X2 Not significant Not significant Not significant
Ever had symptoms of STI No 1.41 827 0.92 902 1.15 1729 Yes 0.00 10 1.41 143 1.34 153 Level of significance of X2 Not significant Not significant Not significant Whether circumcised Yes 0.67 154 No 1.55 683 Level of significance of X2 Not significant Total 1.39 837 0.99 1045 1.17 1882 1 Either had sex with a non-regular partner in the last 1 year, or ever had sex with more than one partner, or ever paid/received money for sex Total includes cases with missing information on occupation and travel due to work. Pr<.01: Pearson Chi-square is significant below .01 level Pr<.05: Person Chi-square is significant below .05 level

183
Table 5.3T: Among the TOTAL respondents who have given urine sample, percentage tested positive for chlamydia and/ or gonorrhoeae, according to sex and selected background characteristics
Male Female Total
Characteristic Percent Number Percent Number Percent Number Age 15-19 0.70 298 0.00 369 0.34 667 20-24 0.00 391 0.72 361 0.34 752 25-29 0.84 276 1.50 398 1.22 674 30-34 4.81 246 2.64 317 3.57 563 35-39 0.80 243 1.05 335 0.95 578 40-44 1.18 192 1.39 222 1.29 414 45-49 0.39 198 0.00 200 0.20 398 Level of significance of X2 Pr<.01 Pr<.05 Pr<.01 Marital status Currently married 1.62 1045 1.11 1597 1.31 2642 Marriage dissolved 0.00 7 1.07 168 1.00 175 Never married 0.42 792 0.93 437 0.59 1229 Level of significance of X2 Not significant Not significant Not significant Literacy and education Illiterate 0.84 616 1.33 891 1.13 1507 Primary 6.44 104 0.78 92 3.42 196 Middle 0.89 229 0.58 315 0.72 544 Secondary 1.11 210 0.54 273 0.80 483 Secondary+ 0.68 685 1.21 631 0.91 1316 Level of significance of X2 Pr<.05 Not significant Not significant Occupation Cultivator 1.35 511 0.95 123 1.25 634 Agricultural labourer 0.00 80 0.00 80 0.00 160 Non-agricultural labourer 1.02 340 2.54 260 1.68 600 Business 2.21 420 0.00 124 1.68 544 Salaried employment 0.00 256 1.10 80 0.26 336 Housework 0.00 5 0.96 1351 0.96 1356 Student 0.56 214 0.00 170 0.34 384 Level of significance of X2 Not significant Not significant Not significant
Religion Hindu 1.16 1654 1.14 1931 1.15 3585 Muslim 0.63 176 0.46 254 0.53 430 Other 0.00 14 0.00 16 0.00 30 Level of significance of X2 Not significant Not significant Not significant
Caste/Tribe Scheduled Caste 0.00 303 0.97 380 0.52 683 Scheduled Tribe 0.47 368 1.13 401 0.81 769 Other 1.70 1173 1.09 1420 1.36 2593 Level of significance of X2 Not significant Not significant Not significant Total 1.12 1844 1.07 2202 1.09 4046

184
Table 5.3T (Contd.): Among the TOTAL respondents who have given urine sample, percentage tested positive for chlamydia and/ or gonorrhoeae, according to sex and selected background characteristics
Male Female Total
Characteristic Percent Number Percent Number Percent Number Travel due to work Yes 1.02 648 2.03 90 1.18 738 No 1.17 1196 1.02 2109 1.07 3305 Level of significance of X2 Not significant Not significant Not significant Sex with a non-regular partner in last 1 year
No 0.92 1803 1.08 2192 1.01 3995 Yes 9.11 41 0.00 10 7.96 51 Level of significance of X2 Pr<.05 Not significant Not significant
Ever had sex with more than one partner
No 0.81 1610 1.07 2178 0.96 3788 Yes 2.87 234 1.78 24 2.80 258 Level of significance of X2 Not significant Not significant Not significant
Ever paid/received money for sex
No 1.14 1804 1.08 2196 1.10 4000 Yes 0.00 40 0.00 6 0.00 46 Level of significance of X2 Not significant Not significant Not significant Ever had any risk behaviour1 No 0.81 1609 1.07 2178 0.96 3787 Yes 2.87 235 1.78 24 2.79 259 Level of significance of X2 Not significant Not significant Not significant
Ever had symptoms of STI No 1.08 1818 1.02 1906 1.05 3724 Yes 5.13 26 1.39 296 1.61 322 Level of significance of X2 Not significant Not significant Not significant Whether circumcised Yes 0.57 183 No 1.17 1661 Level of significance of X2 Not significant Total 1.12 1844 1.07 2202 1.09 4046 1 Either had sex with a non-regular partner in the last 1 year, or ever had sex with more than one partner, or ever paid/received money for sex Total includes cases with missing information on occupation, religion, caste/tribe and travel due to work. Pr<.01: Pearson Chi-square is significant below .01 level Pr<.05: Person Chi-square is significant below .05 level

185
Table 5.4: Among the random sub-sample of respondents who have given blood (serum) sample, percentage tested positive for HSV2, according to sex and selected background characteristics
Male Female Total
Characteristic Percent Number Percent Number Percent Number Place of residence Rural 9.64 117 13.83 121 11.80 238
Urban 7.98 96 11.01 102 9.56 198 Level of significance of X2 Not significant Not significant Not significant Age 15-24 2.52 81 1.38 64 1.99 145 25-34 6.68 65 16.69 83 12.07 148 35-49 17.38 67 17.44 76 17.41 143 Level of significance of X2 Pr<.01 Pr<.01 Pr. <0.01 Marital status Currently married 13.49 115 12.97 164 13.19 279 Marriage dissolved Nil Nil 26.63 19 26.63 19 Never married 2.35 98 5.51 40 3.36 138 Level of significance of X2 Pr<.01 Not significant Pr. <0.01 Literacy and education Illiterate 10.78 74 16.64 90 14.03 164 Primary 5.43 7 1.88 12 2.86 19 Middle 16.13 24 18.97 30 17.67 54 Secondary 8.74 24 18.11 25 13.04 49 Secondary+ 5.03 84 4.17 66 4.65 150 Level of significance of X2 Not significant Not significant Pr. <0.05 Occupation Cultivator 5.82 52 0.00 8 5.20 60 Agricultural labourer 0.00 8 0.00 9 0.00 17 Non-agricultural labourer 7.15 38 24.78 30 15.10 68 Business 16.54 55 9.77 11 15.33 66 Salaried employment 14.37 34 0.00 6 12.87 40 Housework Nil Nil 15.26 144 15.26 144 Student 8.30 23.00 0.00 15 3.95 38 Level of significance of X2 Not significant Not significant Not significant
Religion Hindu 10.05 186 12.90 204 11.56 390 Muslim 0.00 26 10.28 18 4.23 44 Other 0.00 1 0.00 1 0.00 2 Level of significance of X2 Not significant Not significant Not significant Caste/Tribe Scheduled Caste 8.31 36 12.53 39 10.58 75 Scheduled Tribe 5.04 42 3.10 38 4.11 80 Other 10.57 135 15.51 145 13.17 280 Level of significance of X2 Not significant Not significant Not significant Total 8.97 213 12.67 223 10.89 436

186
Table 5.4 (Contd.): Among the random sub-sample of respondents who have given blood (serum) sample, percentage tested positive for HSV2, according to sex and selected background characteristics
Male Female Total
Characteristic Percent Number Percent Number Percent Number Travel due to work Yes 13.74 74 0.00 9 12.21 83 No 6.64 139 13.16 214 10.60 353 Level of significance of X2 Not significant Not significant Not significant Sex with a non-regular partner in last 1 year
No 9.56 208 12.54 222 11.15 430 Yes 0.00 5 100.00 1 2.39 6 Level of significance of X2 Not significant Pr<.05 Not significant Ever had sex with more than one partner
No 6.26 184 12.27 219 9.74 403 Yes 18.39 29 42.20 4 19.81 33 Level of significance of X2 Pr<.01 Pr<.05 Pr<0.01 Ever paid/received money for sex
No 8.58 210 12.67 223 10.71 433 Yes 61.37 3 Nil Nil 61.37 3 Level of significance of X2 Pr<.01 N.E. Pr<0.01 Ever had any risk behaviour1 No 6.26 184 12.27 219 9.74 403 Yes 18.39 29 42.20 4 19.81 33 Level of significance of X2 Pr<.01 Pr<.05 Pr<0.01
Ever had symptoms of STI No 9.01 212 11.82 195 10.38 407 Yes 0.00 1 18.65 28 18.04 29 Level of significance of X2 Not significant Not significant Not significant Whether circumcised Yes 0.00 27 No 10.08 186 Level of significance of X2 Not significant
Total 8.97 213 12.67 223 10.89 436 1 Either had sex with a non-regular partner in the last 1 year, or ever had sex with more than one partner, or ever paid/received money for sex Total includes cases with missing information on occupation and caste/tribe. Pr<.01: Pearson Chi-square is significant below .01 level Pr<.05: Person Chi-square is significant below .05 level
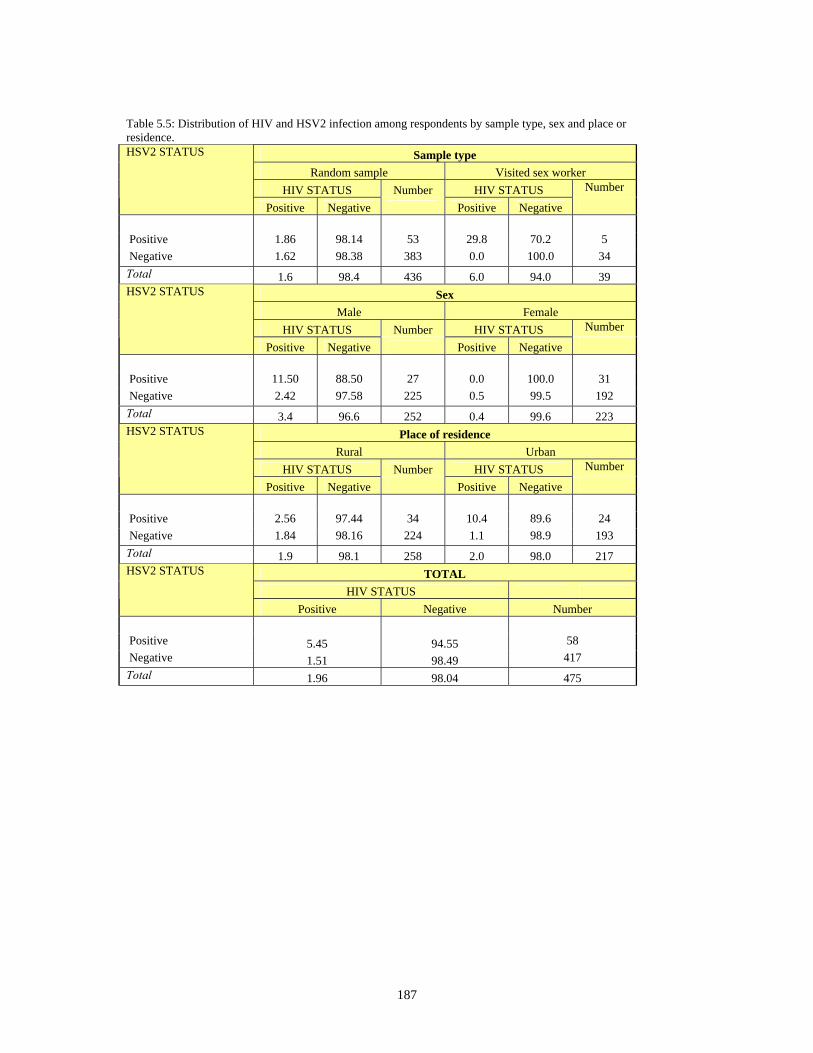
187
Table 5.5: Distribution of HIV and HSV2 infection among respondents by sample type, sex and place or residence.
Sample type Random sample Visited sex worker
HIV STATUS Number HIV STATUS Number
HSV2 STATUS
Positive Negative Positive Negative Positive 1.86 98.14 53 29.8 70.2 5 Negative 1.62 98.38 383 0.0 100.0 34 Total 1.6 98.4 436 6.0 94.0 39
Sex Male Female
HIV STATUS Number HIV STATUS Number
HSV2 STATUS
Positive Negative Positive Negative Positive 11.50 88.50 27 0.0 100.0 31 Negative 2.42 97.58 225 0.5 99.5 192 Total 3.4 96.6 252 0.4 99.6 223
Place of residence Rural Urban
HIV STATUS Number HIV STATUS Number
HSV2 STATUS
Positive Negative Positive Negative Positive 2.56 97.44 34 10.4 89.6 24 Negative 1.84 98.16 224 1.1 98.9 193 Total 1.9 98.1 258 2.0 98.0 217
TOTAL HIV STATUS
HSV2 STATUS
Positive Negative Number Positive 5.45 94.55 58 Negative 1.51 98.49 417 Total 1.96 98.04 475
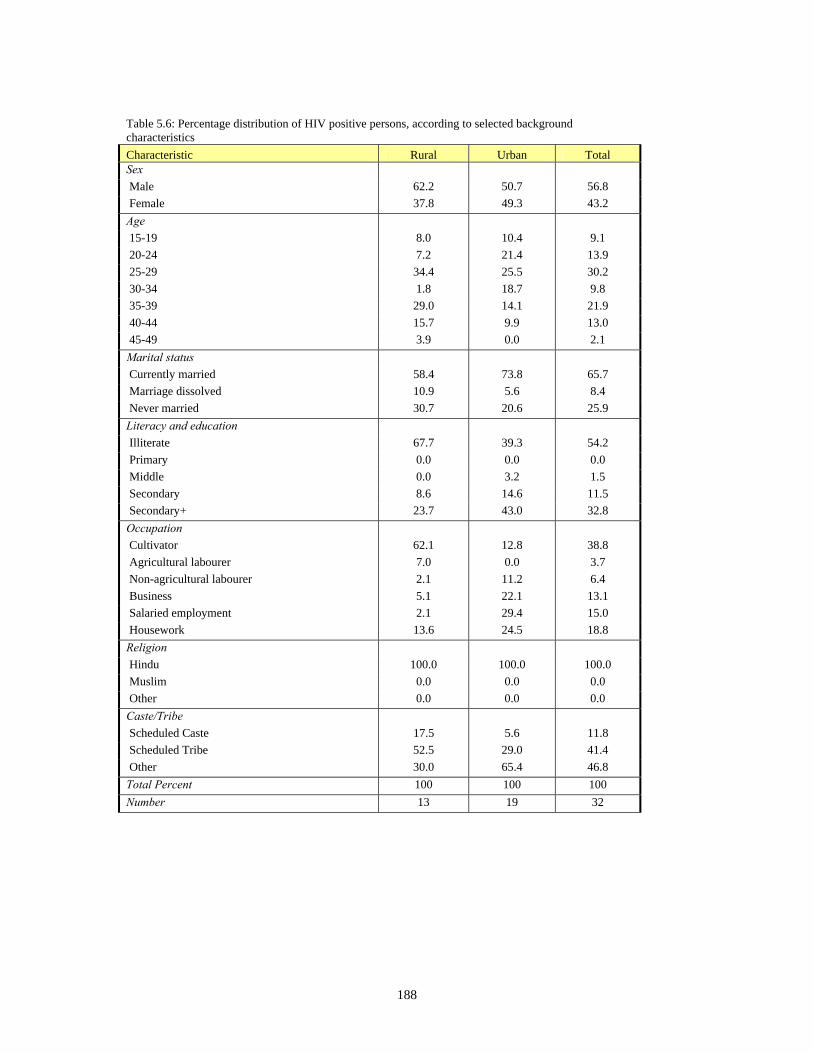
188
Table 5.6: Percentage distribution of HIV positive persons, according to selected background characteristics Characteristic Rural Urban Total Sex Male 62.2 50.7 56.8 Female 37.8 49.3 43.2 Age 15-19 8.0 10.4 9.1 20-24 7.2 21.4 13.9 25-29 34.4 25.5 30.2 30-34 1.8 18.7 9.8 35-39 29.0 14.1 21.9 40-44 15.7 9.9 13.0 45-49 3.9 0.0 2.1 Marital status Currently married 58.4 73.8 65.7 Marriage dissolved 10.9 5.6 8.4 Never married 30.7 20.6 25.9 Literacy and education Illiterate 67.7 39.3 54.2 Primary 0.0 0.0 0.0 Middle 0.0 3.2 1.5 Secondary 8.6 14.6 11.5 Secondary+ 23.7 43.0 32.8 Occupation Cultivator 62.1 12.8 38.8 Agricultural labourer 7.0 0.0 3.7 Non-agricultural labourer 2.1 11.2 6.4 Business 5.1 22.1 13.1 Salaried employment 2.1 29.4 15.0 Housework 13.6 24.5 18.8 Religion Hindu 100.0 100.0 100.0 Muslim 0.0 0.0 0.0 Other 0.0 0.0 0.0 Caste/Tribe Scheduled Caste 17.5 5.6 11.8 Scheduled Tribe 52.5 29.0 41.4 Other 30.0 65.4 46.8 Total Percent 100 100 100 Number 13 19 32

189
Table 5.6 (contd.): Percentage distribution of HIV positive persons, according to selected background characteristics Characteristic Rural Urban Total Travel due to work Yes 44.4 10.0 28.1 No 55.6 90.0 71.9 Sex with a non-regular partner in last 1 year No 100.0 100.0 100.0 Yes 0.0 0.0 0.0 Ever had sex with more than one partner No 68.8 75.3 71.9 Yes 31.2 24.7 28.1 Ever paid/received money for sex No 100.0 87.7 94.2 Yes 0.0 12.3 5.8 Ever had any risk behaviour1
No 68.8 75.3 71.9 Yes 31.2 24.7 28.1 Ever had symptoms of STI No 100.0 90.1 95.3 Yes 0.0 9.9 4.7 Total Percent 100 100 100 Number 13 19 32 1 Either had sex with a non-regular partner in the last 1 year, or ever had sex with more than one partner, or ever paid/received money for sex

190
Table 6.1 Comparison of responses to specific questions as per PBS and FTFI among married males according to place of residence Rural Urban Total
PBS FTFI Z-
Value PBS FTFI Z-
Value PBS FTFI Z-
value Percent Cases Percent Cases Percent Cases Percent Cases Percent Cases Percent Cases Heard of HIV/AIDS 54.4 270 76.9 676 -6.54* 87.8 139 89.9 525 -0.69 65.8 409 82.6 1201 -6.50* Ever taken HIV test 4.1 147 2.1 520 1.12 8.2 122 5.5 471 0.99 5.9 269 3.7 991 1.42 Urethral discharge in last 12 months 10.4 270 0.0 668 5.59* 10.8 139 0.2 520 4.02* 10.5 409 0.1 1188 6.87* Genital ulcer in last 12 months 6.3 270 0.1 668 4.14* 5.8 139 0.0 520 2.91* 6.1 409 0.1 1188 5.08* Ever seen a condom 51.9 270 60.2 676 -2.34** 85.6 139 79.4 525 1.79 63.3 409 68.6 1201 -1.93 Ever had sex other than wife/ partner 32.6 270 23.1 676 2.90* 42.4 139 13.0 525 6.64* 35.9 409 18.7 1201 6.59* Ever had sex other than wife/ partner since marriage 17.8 270 7.7 676 3.97* 18.0 139 5.1 525 3.78* 17.8 409 6.6 1201 5.57* Ever had sex other than wife/partner in last 12 months 9.6 270 1.5 676 4.40* 4.3 139 2.1 525 1.21 7.8 409 1.7 1201 4.40* Ever had sex with CSW 8.5 270 1.9 676 3.71* 5.8 139 2.9 525 1.38 7.6 409 2.3 1201 3.81* Had sex with CSW in last 12 months 3.7 270 0.3 676 2.92* 2.9 139 0.6 525 1.58 3.4 409 0.4 1201 3.28* Anal sex with woman 4.8 270 3.3 676 1.06 7.2 139 2.7 525 1.97** 5.6 409 3.0 1201 2.12** Ever used condom with wife/ partner 18.9 270 9.5 676 3.58* 29.5 139 21.5 525 1.87 22.5 409 14.7 1201 3.37* Condom use in last sex with wife/ partner 7.4 270 2.4 676 2.97* 10.8 139 5.0 525 2.07** 8.6 409 3.5 1201 3.42* Ever used condom with CSW 52.2 23 15.4 13 2.55** 50.0 8 53.3 15 -0.15 51.6 31 35.7 28 1.25 Condom use in last sex with CSW 47.8 23 15.4 13 2.25** 50.0 8 53.3 15 -0.15 48.4 31 35.7 28 0.99 Extra-marital sex by wife/ partner 3.0 270 0.4 670 2.36** 2.2 139 0.6 522 1.24 2.7 409 0.5 1192 2.65* Anal sex with man 6.7 270 0.7 676 3.82* 2.9 139 0.2 525 1.88 5.4 409 0.5 1201 4.30* Condom use in last anal sex with man 22.2 18 0.0 5 2.27** 50.0 4 0.0 1 2.00** 27.3 22 0.0 6 2.87* Ever injected drugs 0.4 270 0.0 676 1.00 0.0 139 0.0 525 NE 0.2 409 0.0 1201 1.00 Note: * Significant at < 0.01 level & ** Significant at < 0.05 level

191
Table 6.2 Comparison of responses to specific questions as per PBS and FTFI among married females according to place of residence
Rural Urban Total PBS FTFI Z-
Value PBS FTFI Z-
Value PBS FTFI Z-
value Percent Cases Percent Cases Percent Cases Percent Cases Percent Cases Percent Cases Heard of HIV/AIDS 96.6 291 88.0 1090 5.91* 98.2 284 95.3 946 2.78* 97.4 575 91.4 2036 6.58* Ever taken HIV test 10.0 281 4.0 959 3.17* 19.4 279 8.3 902 4.35* 14.6 560 6.1 1861 5.38* White discharge in last 12 months 25.8 291 3.0 1090 8.69* 29.2 284 4.0 946 9.09* 27.5 575 3.5 2036 12.59* Genital ulcer in last 12 months 16.2 291 0.3 1090 7.34* 19.0 284 1.5 946 7.43* 17.6 575 0.8 2036 10.46* Ever seen a condom 40.9 291 28.1 1090 4.02* 57.4 284 51.5 946 1.76 49.0 575 38.9 2036 4.30* Ever had sex with person other than husband/partner 8.6 291 0.7 1090 4.72* 12.0 284 1.0 946 5.65* 10.3 575 0.8 2036 7.36* Had extra-marital sex (since marriage) 6.9 291 0.7 1090 4.08* 9.5 284 1.0 946 4.84* 8.2 575 0.8 2036 6.33* Ever had sex with person other than husband/partner in last 12 month 2.4 291 0.3 1090 2.34** 3.2 284 0.5 946 2.48** 2.8 575 0.4 2036 3.41* Had paid sex 2.4 291 0.1 1088 2.56** 3.9 284 0.5 946 2.86* 3.1 575 0.3 2034 3.85* Paid sex in last 12 months 0.3 291 0.1 1088 0.71 1.4 284 0.4 946 1.35 0.9 575 0.2 2034 1.55 Ever had anal sex 4.8 291 0.2 1090 3.67* 3.9 284 0.8 946 2.56** 4.3 575 0.5 2036 4.46* Condom use by husband/ partner 8.9 291 3.9 1090 2.81* 22.5 284 18.0 946 1.64 15.7 575 10.5 2036 3.13* Condom use by husband/ partner in last sex 0.7 291 0.5 1090 0.43 5.3 284 4.2 946 0.71 3.0 575 2.2 2036 0.96 Condom use in last paid sex 14.3 7 0.0 1 1.08 27.3 11 0.0 5 2.03** 22.2 18 0.0 6 2.27** Ever injected drugs 0.0 291 0.0 1090 0.00 1.4 284 0.0 946 2.01** 0.7 575 0.0 2036 2.01** Extra-marital sex by husband/ partner 30.6 291 11.3 978 6.67* 29.2 284 9.1 861 7.03* 29.9 575 10.3 1839 9.64* Sex with sex worker by husband/ partner 12.0 291 2.2 978 4.98* 12.7 284 1.5 861 5.53* 12.3 575 1.9 1839 7.42* Note: * Significant at < 0.01 level & ** Significant at < 0.05 level

192
Table 6.3 Comparison of responses to specific questions as per PBS and FTFI among unmarried males according to place of residence Rural Urban Total
PBS FTFI Z-Value
PBS FTFI Z-Value
PBS FTFI Z-value
Percent Cases Percent Cases Percent Cases Percent Cases Percent Cases Percent Cases Heard of HIV/AIDS 79.1 287 89.8 453 -3.86* 87.3 197 94.2 429 -2.61* 82.4 484 92.0 882 -4.86* Ever taken HIV test 3.1 227 2.9 407 0.10 6.4 172 2.0 404 2.22** 4.5 399 2.5 811 1.74 Genital ulcer in last 12 months 7.7 287 0.2 447 4.69* 7.6 197 0.5 428 3.73* 7.6 484 0.3 875 5.97* Urethral discharge in last 12 months 6.6 287 0.4 447 4.11* 9.6 197 0.5 428 4.31* 7.9 484 0.5 875 5.95* Ever seen a condom 68.3 287 60.5 453 2.18** 87.3 197 74.8 429 3.94* 76.0 484 67.5 882 3.43* Ever had sex 18.1 287 9.3 453 3.34* 24.9 197 7.2 429 5.31* 20.9 484 8.3 882 6.09* Ever had sex with CSW 5.2 287 2.0 453 2.21** 7.6 197 1.6 429 3.01* 6.2 484 1.8 882 3.70* Had sex with CSW in last 12 months 3.8 287 1.3 453 2.00** 3.6 197 0.9 429 1.87 3.7 484 1.1 882 2.78* Ever used condom with CSW 60.0 15 44.4 9 0.75 86.7 15 85.7 7 0.06 73.3 30 62.5 16 0.74 Condom use with CSW in last sex 46.7 15 44.4 9 0.11 80.0 15 85.7 7 -0.34 63.3 30 62.5 16 0.06 Sex with woman other than CSW 18.8 287 8.8 453 3.75* 23.9 197 6.5 429 5.31* 20.9 484 7.7 882 6.41* Sex with woman other than CSW in last 12 months 8.0 287 5.3 453 1.42 12.2 197 4.2 429 3.17* 9.7 484 4.8 882 3.25* Ever used condom with woman other than CSW 22.2 54 27.5 40 -0.58 42.6 47 53.6 28 -0.93 31.7 101 38.2 68 -0.87 Condom use with woman other than CSW in last sex 20.4 54 22.5 40 -0.25 29.8 47 50.0 28 -1.75 24.8 101 33.8 68 -1.27 Ever had anal sex with a man 5.6 287 1.5 453 2.74* 8.1 197 0.0 429 4.17* 6.6 484 0.8 882 4.98* Ever injected drugs 0.0 287 0.0 453 NE 0.5 197 0.0 429 1.00 0.2 484 0.0 882 1.00 Note: * Significant at < 0.01 level & ** Significant at < 0.05 level

193
Table 6.4 Comparison of responses to specific questions as per PBS and FTFI among unmarried females according to place of residence Rural Urban Total
PBS FTFI Z-Value
PBS FTFI Z-Value
PBS FTFI Z-value
Percent Cases Percent Cases Percent Cases Percent Cases Percent Cases Percent Cases Heard of HIV/AIDS 96.7 270 93.5 248 1.64 97.8 275 98.6 286 -0.70 97.2 545 96.3 534 0.92 Ever taken HIV test 1.1 261 0.4 232 0.91 1.9 269 0.7 282 1.19 1.5 530 0.6 514 1.48 White discharge in last 12 months 23.7 270 3.6 248 7.05* 18.2 275 3.1 286 5.91* 20.9 545 3.4 534 9.19* Genital ulcer in last 12 months 9.6 270 0.4 248 5.01* 5.8 275 0.7 286 3.42* 7.7 545 0.6 534 6.02* Ever seen a condom 35.2 270 26.6 248 2.12** 60.4 275 33.6 286 6.60* 47.9 545 30.3 534 6.01* Ever had sex 3.7 270 0.4 248 2.71* 1.1 275 0.7 286 0.49 2.4 545 0.6 534 2.50** Had sex with a man in last 12 months 2.2 270 0.4 248 1.85 0.7 275 0.0 286 1.42 1.5 545 0.2 534 0.38 Had paid sex 0.4 270 0.0 248 1.00 0.7 275 0.0 286 1.42 0.6 545 0.0 534 1.74 Paid sex in last 12 months 0.4 270 0.0 248 1.00 0.7 275 0.0 286 1.42 0.6 545 0.0 534 1.74 Ever had anal sex 0.7 270 0.0 248 1.42 0.4 275 0.0 286 1.00 0.6 545 0.0 534 1.74 Ever used condom 10.0 10 0.0 1 1.05 33.3 3 0.0 2 1.22 15.4 13 0.0 3 1.54 Condom use in last sex 10.0 10 0.0 1 1.05 33.3 3 0.0 2 1.22 15.4 13 0.0 3 1.54 Ever injected drugs 0.4 270 0.0 248 1.00 0.0 275 0.0 286 NE 0.2 545 0.0 534 1.00 Note: * Significant at < 0.01 level & ** Significant at < 0.05 level

194

195
APPENDIX B Estimates of Sampling Errors

196
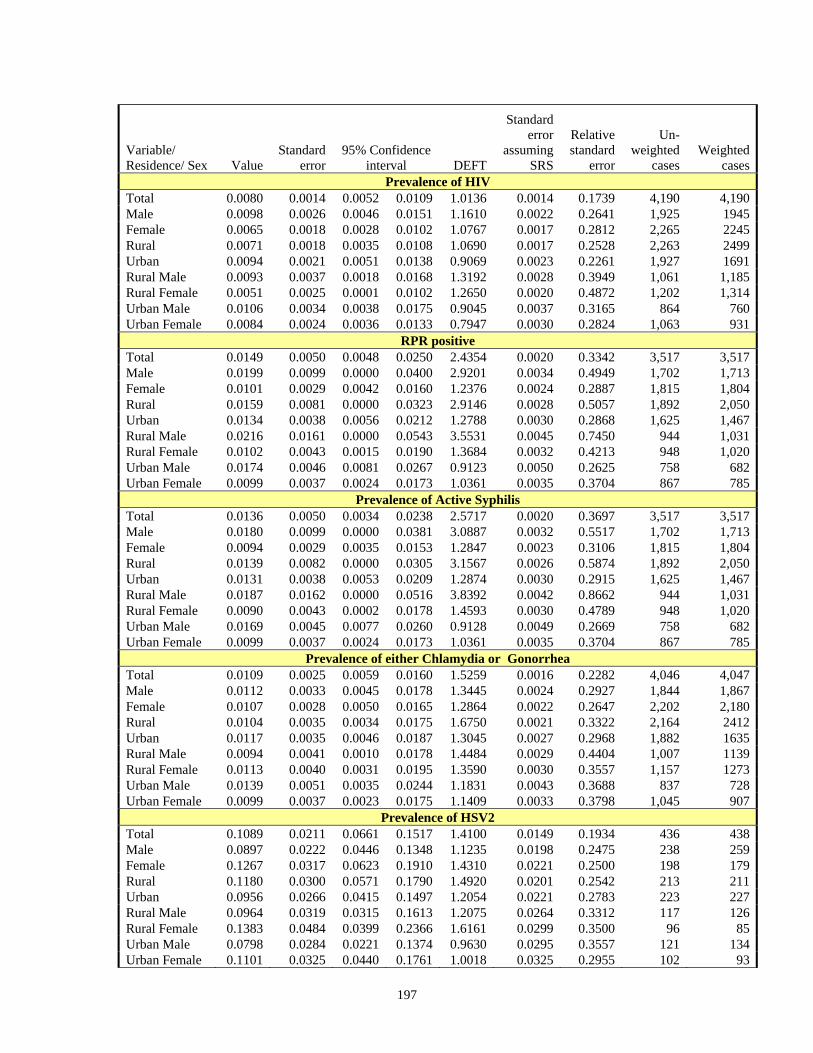
197
Variable/ Residence/ Sex Value
Standard error
95% Confidence interval DEFT
Standard error
assuming SRS
Relative standard
error
Un-weighted
cases Weighted
casesPrevalence of HIV
Total 0.0080 0.0014 0.0052 0.0109 1.0136 0.0014 0.1739 4,190 4,190Male 0.0098 0.0026 0.0046 0.0151 1.1610 0.0022 0.2641 1,925 1945Female 0.0065 0.0018 0.0028 0.0102 1.0767 0.0017 0.2812 2,265 2245Rural 0.0071 0.0018 0.0035 0.0108 1.0690 0.0017 0.2528 2,263 2499Urban 0.0094 0.0021 0.0051 0.0138 0.9069 0.0023 0.2261 1,927 1691Rural Male 0.0093 0.0037 0.0018 0.0168 1.3192 0.0028 0.3949 1,061 1,185Rural Female 0.0051 0.0025 0.0001 0.0102 1.2650 0.0020 0.4872 1,202 1,314Urban Male 0.0106 0.0034 0.0038 0.0175 0.9045 0.0037 0.3165 864 760Urban Female 0.0084 0.0024 0.0036 0.0133 0.7947 0.0030 0.2824 1,063 931
RPR positive Total 0.0149 0.0050 0.0048 0.0250 2.4354 0.0020 0.3342 3,517 3,517Male 0.0199 0.0099 0.0000 0.0400 2.9201 0.0034 0.4949 1,702 1,713Female 0.0101 0.0029 0.0042 0.0160 1.2376 0.0024 0.2887 1,815 1,804Rural 0.0159 0.0081 0.0000 0.0323 2.9146 0.0028 0.5057 1,892 2,050Urban 0.0134 0.0038 0.0056 0.0212 1.2788 0.0030 0.2868 1,625 1,467Rural Male 0.0216 0.0161 0.0000 0.0543 3.5531 0.0045 0.7450 944 1,031Rural Female 0.0102 0.0043 0.0015 0.0190 1.3684 0.0032 0.4213 948 1,020Urban Male 0.0174 0.0046 0.0081 0.0267 0.9123 0.0050 0.2625 758 682Urban Female 0.0099 0.0037 0.0024 0.0173 1.0361 0.0035 0.3704 867 785
Prevalence of Active Syphilis Total 0.0136 0.0050 0.0034 0.0238 2.5717 0.0020 0.3697 3,517 3,517Male 0.0180 0.0099 0.0000 0.0381 3.0887 0.0032 0.5517 1,702 1,713Female 0.0094 0.0029 0.0035 0.0153 1.2847 0.0023 0.3106 1,815 1,804Rural 0.0139 0.0082 0.0000 0.0305 3.1567 0.0026 0.5874 1,892 2,050Urban 0.0131 0.0038 0.0053 0.0209 1.2874 0.0030 0.2915 1,625 1,467Rural Male 0.0187 0.0162 0.0000 0.0516 3.8392 0.0042 0.8662 944 1,031Rural Female 0.0090 0.0043 0.0002 0.0178 1.4593 0.0030 0.4789 948 1,020Urban Male 0.0169 0.0045 0.0077 0.0260 0.9128 0.0049 0.2669 758 682Urban Female 0.0099 0.0037 0.0024 0.0173 1.0361 0.0035 0.3704 867 785
Prevalence of either Chlamydia or Gonorrhea Total 0.0109 0.0025 0.0059 0.0160 1.5259 0.0016 0.2282 4,046 4,047Male 0.0112 0.0033 0.0045 0.0178 1.3445 0.0024 0.2927 1,844 1,867Female 0.0107 0.0028 0.0050 0.0165 1.2864 0.0022 0.2647 2,202 2,180Rural 0.0104 0.0035 0.0034 0.0175 1.6750 0.0021 0.3322 2,164 2412Urban 0.0117 0.0035 0.0046 0.0187 1.3045 0.0027 0.2968 1,882 1635Rural Male 0.0094 0.0041 0.0010 0.0178 1.4484 0.0029 0.4404 1,007 1139Rural Female 0.0113 0.0040 0.0031 0.0195 1.3590 0.0030 0.3557 1,157 1273Urban Male 0.0139 0.0051 0.0035 0.0244 1.1831 0.0043 0.3688 837 728Urban Female 0.0099 0.0037 0.0023 0.0175 1.1409 0.0033 0.3798 1,045 907
Prevalence of HSV2 Total 0.1089 0.0211 0.0661 0.1517 1.4100 0.0149 0.1934 436 438Male 0.0897 0.0222 0.0446 0.1348 1.1235 0.0198 0.2475 238 259Female 0.1267 0.0317 0.0623 0.1910 1.4310 0.0221 0.2500 198 179Rural 0.1180 0.0300 0.0571 0.1790 1.4920 0.0201 0.2542 213 211Urban 0.0956 0.0266 0.0415 0.1497 1.2054 0.0221 0.2783 223 227Rural Male 0.0964 0.0319 0.0315 0.1613 1.2075 0.0264 0.3312 117 126Rural Female 0.1383 0.0484 0.0399 0.2366 1.6161 0.0299 0.3500 96 85Urban Male 0.0798 0.0284 0.0221 0.1374 0.9630 0.0295 0.3557 121 134Urban Female 0.1101 0.0325 0.0440 0.1761 1.0018 0.0325 0.2955 102 93

198
Variable/ Residence/ Sex Value
Standard error
95% Confidence
interval DEFT
Standard error
assuming SRS
Relative standard
error
Un-weighted
cases Weighted
casesNever married persons who had sex
Total 0.0535 0.0097 0.0337 0.0732 1.6274 0.0060 0.1820 1,416 1341Male 0.0806 0.0154 0.0493 0.1120 1.7081 0.0090 0.1916 882 859Female 0.0050 0.0033 0.0000 0.0117 1.0506 0.0031 0.6555 534 482Rural 0.0568 0.0140 0.0283 0.0853 1.7032 0.0082 0.2469 701 748Urban 0.0492 0.0130 0.0227 0.0757 1.5085 0.0087 0.2651 715 593Rural Male 0.0836 0.0211 0.0408 0.1264 1.7558 0.0120 0.2521 453 504Rural Female 0.0016 0.0016 0.0000 0.0049 0.6347 0.0025 0.9796 248 244Urban Male 0.0765 0.0224 0.0310 0.1220 1.6307 0.0137 0.2928 429 355Urban Female 0.0085 0.0062 0.0000 0.0212 1.0707 0.0058 0.7293 286 238
Ever used condom (among who had sex) Total 0.1159 0.0154 0.0846 0.1472 2.7720 0.0056 0.1331 3,311 3380Male 0.1709 0.0210 0.1283 0.2136 2.0103 0.0104 0.1227 1,274 1329Female 0.0802 0.0159 0.0479 0.1126 2.6273 0.0061 0.1985 2,037 2051Rural 0.0641 0.0122 0.0394 0.0889 2.2367 0.0054 0.1900 1807 2065Urban 0.1972 0.0222 0.1522 0.2423 1.9998 0.0111 0.1124 1504 1315Rural Male 0.1218 0.0254 0.0702 0.1733 2.2105 0.0115 0.2083 718 830Rural Female 0.0254 0.0065 0.0122 0.0385 1.4297 0.0045 0.2547 1089 1235Urban Male 0.2526 0.0257 0.2004 0.3048 1.3069 0.0197 0.1017 556 499Urban Female 0.1633 0.0268 0.1088 0.2178 2.0520 0.0131 0.1643 948 816
Used condom during first intercourse (among who had sex) Total 0.0384 0.0060 0.0262 0.0505 1.7868 0.0033 0.1557 3,302 3369Male 0.0718 0.0127 0.0460 0.0977 1.7784 0.0072 0.1772 1274 1329Female 0.0165 0.0040 0.0084 0.0247 1.3976 0.0029 0.2410 2028 2040Rural 0.0269 0.0068 0.0131 0.0408 1.8914 0.0036 0.2533 1801 2056Urban 0.0563 0.0104 0.0351 0.0774 1.6225 0.0064 0.1853 1501 1313Rural Male 0.0561 0.0165 0.0225 0.0896 2.0454 0.0081 0.2943 718 830Rural Female 0.0072 0.0030 0.0010 0.0134 1.2430 0.0024 0.4212 1083 1226Urban Male 0.0980 0.0196 0.0583 0.1378 1.4552 0.0134 0.1996 556 499Urban Female 0.0306 0.0086 0.0131 0.0482 1.4133 0.0061 0.2815 945 814
Used condom during last intercourse (among who had sex) Total 0.0385 0.0099 0.0183 0.0587 0.6103 0.0163 0.2577 3,311 3380Male 0.0497 0.0070 0.0354 0.0641 1.1687 0.0060 0.1416 1,274 1329Female 0.0312 0.0147 0.0014 0.0611 0.5537 0.0265 0.4699 2,037 2051Rural 0.0297 0.0154 0.0000 0.0609 0.5839 0.0263 0.5173 1807 2065Urban 0.0523 0.0075 0.0371 0.0675 1.2032 0.0062 0.1427 1504 1315Rural Male 0.0315 0.0076 0.0160 0.0470 1.2467 0.0061 0.2426 718 830Rural Female 0.0285 0.0238 0.0000 0.0768 0.5428 0.0438 0.8337 1089 1235Urban Male 0.0801 0.0108 0.0582 0.1020 0.8771 0.0123 0.1344 556 499Urban Female 0.0353 0.0081 0.0188 0.0518 1.2434 0.0065 0.2298 948 816
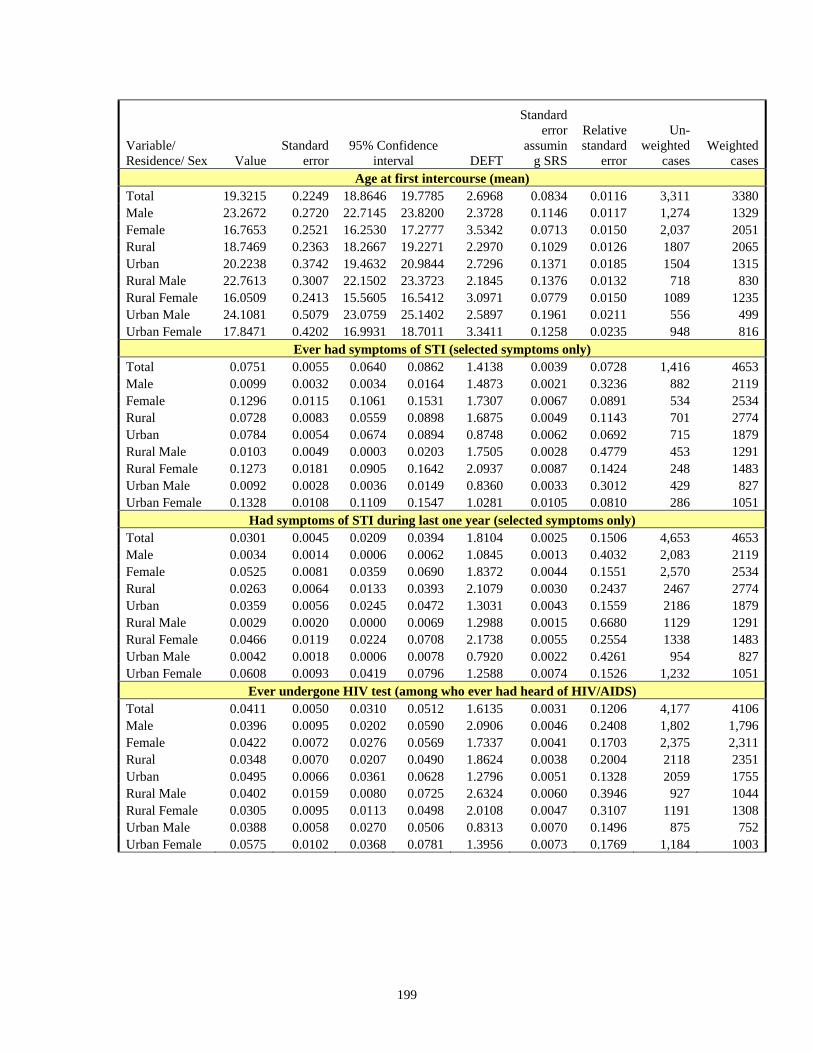
199
Variable/ Residence/ Sex Value
Standard error
95% Confidence interval DEFT
Standard error
assuming SRS
Relative standard
error
Un-weighted
cases Weighted
casesAge at first intercourse (mean)
Total 19.3215 0.2249 18.8646 19.7785 2.6968 0.0834 0.0116 3,311 3380Male 23.2672 0.2720 22.7145 23.8200 2.3728 0.1146 0.0117 1,274 1329Female 16.7653 0.2521 16.2530 17.2777 3.5342 0.0713 0.0150 2,037 2051Rural 18.7469 0.2363 18.2667 19.2271 2.2970 0.1029 0.0126 1807 2065Urban 20.2238 0.3742 19.4632 20.9844 2.7296 0.1371 0.0185 1504 1315Rural Male 22.7613 0.3007 22.1502 23.3723 2.1845 0.1376 0.0132 718 830Rural Female 16.0509 0.2413 15.5605 16.5412 3.0971 0.0779 0.0150 1089 1235Urban Male 24.1081 0.5079 23.0759 25.1402 2.5897 0.1961 0.0211 556 499Urban Female 17.8471 0.4202 16.9931 18.7011 3.3411 0.1258 0.0235 948 816
Ever had symptoms of STI (selected symptoms only) Total 0.0751 0.0055 0.0640 0.0862 1.4138 0.0039 0.0728 1,416 4653Male 0.0099 0.0032 0.0034 0.0164 1.4873 0.0021 0.3236 882 2119Female 0.1296 0.0115 0.1061 0.1531 1.7307 0.0067 0.0891 534 2534Rural 0.0728 0.0083 0.0559 0.0898 1.6875 0.0049 0.1143 701 2774Urban 0.0784 0.0054 0.0674 0.0894 0.8748 0.0062 0.0692 715 1879Rural Male 0.0103 0.0049 0.0003 0.0203 1.7505 0.0028 0.4779 453 1291Rural Female 0.1273 0.0181 0.0905 0.1642 2.0937 0.0087 0.1424 248 1483Urban Male 0.0092 0.0028 0.0036 0.0149 0.8360 0.0033 0.3012 429 827Urban Female 0.1328 0.0108 0.1109 0.1547 1.0281 0.0105 0.0810 286 1051
Had symptoms of STI during last one year (selected symptoms only) Total 0.0301 0.0045 0.0209 0.0394 1.8104 0.0025 0.1506 4,653 4653Male 0.0034 0.0014 0.0006 0.0062 1.0845 0.0013 0.4032 2,083 2119Female 0.0525 0.0081 0.0359 0.0690 1.8372 0.0044 0.1551 2,570 2534Rural 0.0263 0.0064 0.0133 0.0393 2.1079 0.0030 0.2437 2467 2774Urban 0.0359 0.0056 0.0245 0.0472 1.3031 0.0043 0.1559 2186 1879Rural Male 0.0029 0.0020 0.0000 0.0069 1.2988 0.0015 0.6680 1129 1291Rural Female 0.0466 0.0119 0.0224 0.0708 2.1738 0.0055 0.2554 1338 1483Urban Male 0.0042 0.0018 0.0006 0.0078 0.7920 0.0022 0.4261 954 827Urban Female 0.0608 0.0093 0.0419 0.0796 1.2588 0.0074 0.1526 1,232 1051
Ever undergone HIV test (among who ever had heard of HIV/AIDS) Total 0.0411 0.0050 0.0310 0.0512 1.6135 0.0031 0.1206 4,177 4106Male 0.0396 0.0095 0.0202 0.0590 2.0906 0.0046 0.2408 1,802 1,796Female 0.0422 0.0072 0.0276 0.0569 1.7337 0.0041 0.1703 2,375 2,311Rural 0.0348 0.0070 0.0207 0.0490 1.8624 0.0038 0.2004 2118 2351Urban 0.0495 0.0066 0.0361 0.0628 1.2796 0.0051 0.1328 2059 1755Rural Male 0.0402 0.0159 0.0080 0.0725 2.6324 0.0060 0.3946 927 1044Rural Female 0.0305 0.0095 0.0113 0.0498 2.0108 0.0047 0.3107 1191 1308Urban Male 0.0388 0.0058 0.0270 0.0506 0.8313 0.0070 0.1496 875 752Urban Female 0.0575 0.0102 0.0368 0.0781 1.3956 0.0073 0.1769 1,184 1003

200
Variable/ Residence/ Sex Value
Standard error
95% Confidence
interval DEFT
Standard error
assuming SRS
Relative standard
error
Un-weighted
cases Weighted
casesEver had taken injection
Total 0.9479 0.0091 0.9293 0.9664 2.8040 0.0033 0.0096 4,653 4653Male 0.9406 0.0127 0.9148 0.9664 2.4704 0.0051 0.0135 2,083 2119Female 0.9539 0.0121 0.9293 0.9785 2.9094 0.0042 0.0127 2,570 2534Rural 0.9378 0.0134 0.9106 0.9651 2.9223 0.0046 0.0143 2467 2774Urban 0.9627 0.0097 0.9429 0.9824 2.2214 0.0044 0.0101 2186 1879Rural Male 0.9302 0.0200 0.8895 0.9709 2.8218 0.0071 0.0215 1129 1291Rural Female 0.9445 0.0180 0.9079 0.9811 3.0277 0.0059 0.0191 1338 1483Urban Male 0.9569 0.0072 0.9423 0.9714 1.0143 0.0071 0.0075 954 827Urban Female 0.9672 0.0135 0.9398 0.9947 2.4585 0.0055 0.0140 1,232 1051
Had taken injection during last one year (among who ever had injection) Total 0.5857 0.0168 0.5515 0.6199 2.2723 0.0074 0.0287 4,422 4410Male 0.5583 0.0251 0.5073 0.6093 2.2594 0.0111 0.0450 1978 1993Female 0.6083 0.0180 0.5717 0.6450 1.8174 0.0099 0.0296 2444 2418Rural 0.5988 0.0235 0.5510 0.6465 2.4484 0.0096 0.0392 2318 2602Urban 0.5670 0.0226 0.5210 0.6129 1.9433 0.0116 0.0399 2104 1809Rural Male 0.5662 0.0357 0.4937 0.6386 2.4964 0.0143 0.0630 1067 1201Rural Female 0.6267 0.0246 0.5768 0.6766 1.9030 0.0129 0.0392 1251 1401Urban Male 0.5463 0.0319 0.4815 0.6112 1.8052 0.0177 0.0584 911 792Urban Female 0.5830 0.0256 0.5310 0.6351 1.6581 0.0154 0.0439 1193 1017
Number of injections (among who had injection during last one year) Total 4.7838 0.3213 4.1308 5.4368 1.8602 0.1727 0.0672 2,581 2582Male 4.8760 0.5886 3.6797 6.0722 2.0716 0.2842 0.1207 1,125 1111Female 4.7141 0.2543 4.1973 5.2309 1.1875 0.2141 0.0539 1,456 1471Rural 5.2385 0.4727 4.2779 6.1991 1.8693 0.2529 0.0902 1411 1557Urban 4.0925 0.2419 3.6010 4.5840 1.1950 0.2024 0.0591 1170 1024Rural Male 5.5368 0.8894 3.7293 7.3442 2.4964 0.3563 0.1606 633 680Rural Female 5.0075 0.3615 4.2728 5.7421 1.9030 0.1900 0.0722 778 878Urban Male 3.8350 0.3275 3.1695 4.5004 1.3337 0.2455 0.0854 492 431Urban Female 4.2799 0.2750 3.7211 4.8388 0.9156 0.3003 0.0643 678 593
Sex with a non-regular partner during last 12 months Total 0.0119 0.0028 0.0061 0.0176 1.7744 0.0016 0.2374 4,653 4653Male 0.0229 0.0062 0.0103 0.0355 1.9063 0.0033 0.2705 2083 2119Female 0.0026 0.0013 0.0000 0.0053 1.2935 0.0010 0.5002 2570 2534Rural 0.0120 0.0039 0.0042 0.0199 1.8628 0.0021 0.3203 2467 2774Urban 0.0116 0.0040 0.0034 0.0198 1.6334 0.0025 0.3480 2186 1879Rural Male 0.0249 0.0083 0.0081 0.0417 1.9087 0.0043 0.3326 1129 1291Rural Female 0.0009 0.0006 0.0000 0.0021 0.8177 0.0008 0.7194 1338 1483Urban Male 0.0198 0.0093 0.0010 0.0387 1.9121 0.0048 0.4675 954 827Urban Female 0.0051 0.0029 0.0000 0.0109 1.2988 0.0022 0.5586 1232 1051

201
Variable/ Residence/ Sex Value
Standard error
95% Confidence
interval DEFT
Standard error
assuming SRS
Relative standard
error
Un-weighted
cases Weighted
casesSex with more than one partner during last 3 months
Total 0.0065 0.0015 0.0034 0.0096 1.2954 0.0012 0.2353 4,653 4,653Male 0.0128 0.0034 0.0059 0.0197 1.3979 0.0024 0.2669 2083 2119Female 0.0012 0.0008 0.0000 0.0027 1.0995 0.0007 0.6311 2570 2534Rural 0.0049 0.0017 0.0015 0.0084 1.2633 0.0013 0.3402 2467 2774Urban 0.0087 0.0026 0.0034 0.0140 1.2118 0.0021 0.2980 2186 1879Rural Male 0.0104 0.0037 0.0029 0.0179 1.3145 0.0028 0.3569 1129 1291Rural Female 0.0002 0.0002 0.0000 0.0006 0.5335 0.0004 0.9776 1338 1483Urban Male 0.0165 0.0062 0.0039 0.0292 1.4063 0.0044 0.3773 954 827Urban Female 0.0026 0.0017 0.0000 0.0060 1.0771 0.0016 0.6506 1232 1051
Sex with more than one partner during last 12 months Total 0.0118 0.0026 0.0066 0.0170 1.6247 0.0016 0.2181 4,653 4653Male 0.0232 0.0056 0.0118 0.0347 1.7193 0.0033 0.2423 2083 2119Female 0.0022 0.0013 0.0000 0.0049 1.3893 0.0009 0.5837 2570 2534Rural 0.0118 0.0036 0.0044 0.0192 1.7703 0.0021 0.3075 2467 2774Urban 0.0118 0.0034 0.0048 0.0187 1.3812 0.0025 0.2921 2186 1879Rural Male 0.0247 0.0078 0.0089 0.0405 1.8001 0.0043 0.3150 1129 1291Rural Female 0.0006 0.0006 0.0000 0.0018 0.9242 0.0006 0.9774 1338 1483Urban Male 0.0210 0.0078 0.0051 0.0368 1.5653 0.0050 0.3720 954 827Urban Female 0.0045 0.0028 0.0000 0.0103 1.3732 0.0021 0.6281 1232 1051
Ever had sex with more than one partner Total 0.0716 0.0087 0.0539 0.0893 2.3014 0.0038 0.1215 4,653 4653Male 0.1464 0.0201 0.1057 0.1872 2.6113 0.0077 0.1370 2083 2119Female 0.0091 0.0023 0.0045 0.0137 1.1982 0.0019 0.2483 2570 2534Rural 0.0880 0.0120 0.0635 0.1124 2.2383 0.0054 0.1368 2467 2774Urban 0.0475 0.0100 0.0271 0.0679 2.0425 0.0049 0.2110 2186 1879Rural Male 0.1807 0.0278 0.1241 0.2372 2.5997 0.0107 0.1541 1129 1291Rural Female 0.0072 0.0028 0.0016 0.0129 1.2663 0.0022 0.3851 1338 1483Urban Male 0.0929 0.0231 0.0460 0.1399 2.2888 0.0101 0.2486 954 827Urban Female 0.0117 0.0035 0.0047 0.0188 1.0439 0.0033 0.2954 1232 1051
Ever received payment or paid for sex Total 0.0092 0.0019 0.0054 0.0130 1.3375 0.0014 0.2035 4,653 4653Male 0.0179 0.0038 0.0101 0.0256 1.3246 0.0029 0.2133 2083 2119Female 0.0019 0.0012 0.0000 0.0044 1.4043 0.0009 0.6325 2570 2534Rural 0.0064 0.0021 0.0022 0.0106 1.3652 0.0015 0.3221 2467 2774Urban 0.0133 0.0031 0.0071 0.0195 1.1593 0.0026 0.2306 2186 1879Rural Male 0.0136 0.0044 0.0046 0.0226 1.3751 0.0032 0.3260 1129 1291Rural Female 0.0002 0.0002 0.0000 0.0006 0.5335 0.0004 0.9776 1338 1483Urban Male 0.0246 0.0063 0.0118 0.0373 1.1663 0.0054 0.2556 954 827Urban Female 0.0044 0.0028 0.0000 0.0100 1.3518 0.0020 0.6274 1232 1051

202
Variable/ Residence/ Sex Value
Standard error
95% Confidence
interval DEFT
Standard error
assuming SRS
Relative standard
error
Un-weighted
cases Weighted
casesAny of the risky sex behaviour
Total 0.0718 0.0087 0.0541 0.0894 2.2971 0.0038 0.1211 4,653 4653Male 0.1467 0.0200 0.1060 0.1874 2.6072 0.0077 0.1366 2083 2119Female 0.0091 0.0023 0.0045 0.0137 1.1982 0.0019 0.2483 2570 2534Rural 0.0880 0.0120 0.0635 0.1124 2.2383 0.0054 0.1368 2467 2774Urban 0.0478 0.0100 0.0275 0.0681 2.0301 0.0049 0.2090 2186 1879Rural Male 0.1807 0.0278 0.1241 0.2372 2.5997 0.0107 0.1541 1129 1291Rural Female 0.0072 0.0028 0.0016 0.0129 1.2663 0.0022 0.3851 1338 1483Urban Male 0.0937 0.0231 0.0468 0.1405 2.2752 0.0101 0.2461 954 827Urban Female 0.0117 0.0035 0.0047 0.0188 1.0439 0.0033 0.2954 1232 1051
Currently married Total 0.6733 0.0147 0.6435 0.7032 2.1340 0.0069 0.0218 4,653 4653Male 0.5894 0.0125 0.5641 0.6148 1.1669 0.0107 0.0212 2083 2119Female 0.7435 0.0204 0.7020 0.7849 2.3521 0.0087 0.0274 2570 2534Rural 0.6935 0.0214 0.6500 0.7371 2.4474 0.0088 0.0309 2467 2774Urban 0.6435 0.0160 0.6110 0.6760 1.4467 0.0111 0.0248 2186 1879Rural Male 0.6046 0.0157 0.5728 0.6364 1.1509 0.0136 0.0259 1129 1291Rural Female 0.7710 0.0325 0.7050 0.8370 2.9762 0.0109 0.0421 1338 1483Urban Male 0.5657 0.0201 0.5249 0.6066 1.1662 0.0172 0.0355 954 827Urban Female 0.7047 0.0139 0.6763 0.7330 0.9914 0.0141 0.0198 1232 1051
Never married Total 0.2883 0.0111 0.2656 0.3109 1.6785 0.0066 0.0387 4653 4653Male 0.4056 0.0118 0.3815 0.4296 1.1088 0.0107 0.0292 2083 2119Female 0.1902 0.0143 0.1612 0.2192 1.8314 0.0078 0.0751 2570 2534Rural 0.2698 0.0150 0.2394 0.3002 1.7745 0.0084 0.0554 2467 2774Urban 0.3156 0.0153 0.2845 0.3467 1.4253 0.0107 0.0484 2186 1879Rural Male 0.3903 0.0142 0.3614 0.4192 1.0475 0.0136 0.0364 1129 1291Rural Female 0.1648 0.0211 0.1220 0.2076 2.1862 0.0096 0.1278 1338 1483Urban Male 0.4294 0.0203 0.3882 0.4706 1.1788 0.0172 0.0473 954 827Urban Female 0.2261 0.0142 0.1973 0.2549 1.0997 0.0129 0.0628 1232 1051

203
APPENDIX C
Survey Instruments

204

205
GENERAL POPULATION STUDY OF HIV/STI PREVALENCE AND RELATED BEHAVIOUR IN SELECTED INDIAN DISTRICTS
HOUSEHOLD CENSUS FORM
Village/Urban Block___________________________________________
Taluka* ............................................................
District State ..............................................................
Household number .............................................
Interviewer Name__________________________________________________
Date of interview: DAY MONTH YEAR
NAME OF ONI/BEEDI/STREET: __________________________________________
Codes for Taluka: 01- Piriyapatna; 02- Hunsur; 03- Krishnarajanagara; 04- Mysore; 05- Heggadadevenkote; 06- Nanjangud; 07- Tirumakudal Nasripur
CONSENT
Namaskar! My name is ………………… and I am working with St. John’s Medical College, Bangalore. I am requesting you to participate in the first stage of a research study. This first stage consists of a household census. Please take your time to review this consent form. You may ask any questions that you have. You may take your time to make your decision about participating in this study, and you may discuss it with your friends or family before you make your decision. This consent form may contain words that you do not understand. Please ask me to explain any words or information that you do not clearly understand.
Purpose of Study The objective of this community survey is to provide data on the general adult population within a study whose aims are to understand HIV transmission dynamics and assess the impact of HIV preventive interventions, using a combination of mathematical modelling and empirical data, and to assess the cost-effectiveness of these interventions in the four southern states of India, namely, Maharashtra, Tamil Nadu, Andhra Pradesh, and Karnataka, covered by the Avahan project.
A total of approximately 5,000 adults from Mysore district will take part in this study.
Study procedures This study will be carried out in both the rural and urban areas of Mysore. Individuals will be identified at random from households in 15 randomly selected rural villages and 20 randomly selected urban blocks. They will be asked to participate in the study.
If you take part in this household census, information will be collected from the head of the household on the name, age, sex, marital status, education and occupation of every member of the household. Information will also be collected on the general health status of members of the household. This should take about 15 minutes. All of this information will be entered into a computer, and a total of approximately 5,000 individuals in the age group 15-49 will be selected at random to volunteer for the second stage of the

206
study. At that time, the selected individuals will be asked to volunteer to participate in this study on HIV infection in Mysore District. They will be asked to answer certain questions and to provide blood and urine samples for testing HIV and STI. Those who are selected will be free to participate if they wish, or to decline from participating at that time. They will be given additional information about the specifics of this research study. There will be no direct benefit to you from participating in this household census, but we hope that the information learned from this study overall will benefit people at risk for HIV infection in the future. There will be no cost to you for participating in this census and you will receive no payment or reimbursement for any expenses related to taking part in this study. None of the individual information collected from this household census will be linked to information from the second stage of the research study. Information gathered in this research study may be published or presented in public forums. However your name and other identifying information will not be used or revealed.
The University of Manitoba Health Research Ethics Board or St. John’s Medical College Ethical Review Committee or Ethical Review Committee of the Centre hospitalier affilié universitaire (CHA), Quebec, Canada, may review records related to the study for quality assurance purposes.
Your decision to take part in this study is voluntary. You may refuse to participate or you may withdraw from the study at any time. Your decision not to participate or to withdraw from the study will not affect you in any way, including your access to health care.
1. Questions
You are free to ask any questions that you may have about your treatment and your rights as a research participant. If any questions come up during or after the study or if you have a research-related injury, contact the study doctor: Dr. Reynold Washington, IPHCR, Bangalore. 080-22201237, 9341948345 For questions about your rights as a research participant, you may contact the Institutional Ethical Review Board at St. John’s Medical College, between 9.30am and 4.30 pm at the no 080-22065057 or 22065059 (IPHCR). You will be reimbursed for any telephone costs incurred.
Do not agree to be a part of the study unless you have had a chance to ask questions and have received satisfactory answers to all of your questions.
We hope that you will participate in this research study. Do you want to ask me anything about the study at this time?
Signature of interviewer: ___________________________________________ Date:_________________ RESPONDENT AGREES FOR INTERVIEW………………1 RESPONDENT DOES NOT AGREE FOR
INTERVIEW……2 END
PROCEED WITH INTERVIEW

207
Now I would like some information about the people who usually live in your household or who are staying with you now. Please give me the names of the persons who usually live in your household and guests of the household who stayed here last night, starting with the head of the household.
IF AGE 6 YEARS OR MORE
Line.No. Name
What is the relationship of
(NAME) to the head of the household?
Does (NAME) usually live
here?
Did (NAME) stay here last
night? Is (NAME) a male or female?
How old is (NAME)? Marital status Education Occupation
1 2 3 4 5 6 7 8 9 10 01
YES NO 1 2
YES NO 1 2
M F 1 2
CM W D NM 1 2 3 4
IL <P P<M M<S S+ 1 2 3 4 5
02
1 2
1 2
1 2
1 2 3 4
1 2 3 4 5
03
1 2
1 2
1 2
1 2 3 4
1 2 3 4 5
04
1 2
1 2
1 2
1 2 3 4
1 2 3 4 5
05
1 2
1 2
1 2
1 2 3 4
1 2 3 4 5
06
1 2
1 2
1 2
1 2 3 4
1 2 3 4 5
07
1 2
1 2
1 2
1 2 3 4
1 2 3 4 5
08
1 2
1 2
1 2
1 2 3 4
1 2 3 4 5
09
1 2
1 2
1 2
1 2 3 4
1 2 3 4 5
CONTINUATION SHEET USED? YES…………………………1 NO………………………………..2 CODE FOR COLUMN (3): Wife/ husband=02, Son/daughter=03, Son-in-law/Daughter-in-law=04, Grandchild=05, Parent=06, Parent-in-law=07, Brother/sister=08, , Brother-in-law/sister-in-law=09, Niece/nephew=10, Other relative=11, Adopted/foster child=12, Not related=13 CODE FOR COLUMN (7): Age less than 1 year=00, Age 95 years or more=95
CODE FOR COLUMN (8): Currently married=1, Widowed=2, Divorced/Separated/Deserted=3, Never married=4
CODE FOR COLUMN (9): Illiterate=1, Less than primary complete=2, primary complete/middle incomplete=3, middle complete/secondary incomplete=4, High school and above=5 CODE FOR COLUMN (10): Cultivator=1, Agricultural labourer=2, Non-agricultural labourer=3, Business=4, Salaried employment=5, Housework=6, Student=7, Not working/unemployed=8, Other work=

208
No. QUESTIONS AND FILTERS CODING CATEGORIES SKIP 11 What is the religion of the head of the
household? HINDU ...................... 1 MUSLIM ..................... 2 CHRISTIAN .................. 3 BUDDHIST ................... 4 OTHER_______________________5 {SPECIFY)
12 What is the caste or tribe of the head of the household?
CASTE/TRIBE _______________ {SPECIFY) NO CASTE/TRIBE ............ 97
13 Does anyone listed suffer from any illness that has lasted for more than two weeks?
YES ........................ 1 NO ......................... 2
17
14. What is the name of the person who suffers from a chronic illness? RECORD THE LINE NUMBER CORRESPONDING TO THE NAME
15. What is the nature of illness?
16. How long does (NAME) suffer from this illness? RECORD IN WEEKS. RECORD 96 IF MORE THAN 96 WEEKS.
_________________ WEEKS ..................
_________________ WEEKS ..................
_________________ WEEKS ..................
_________________ WEEKS ..................
_________________ WEEKS ..................
17 Did any usual resident of this household die since January, 2003?
YES ........................ 1 NO ......................... 2
END
18 How many persons died? TOTAL DEATHS .............
19. What (was/were) the name(s) of the person(s) who died?
20. How old was he/she when he/she died & sex of the deceased? RECORD ‘00’ IF LESS THAN 1 YEAR
21. In what month and year did (NAME) die?
22. What did (NAME) die of?
1 _________________ (NAME)
M FYEARS………………. 1 2
MONTH.. YEAR..
_______________
____________________ 2 _________________ (NAME)
YEARS………………. 1 2
MONTH.. YEAR..
_______________
____________________ 3 _________________ (NAME)
YEARS………………. 1 2
MONTH.. YEAR..
_______________
____________________ The interview is over now. I thank you for the time and patience you had while answering my questions. We shall return to your household after sometime. I request you to give similar cooperation at that time also.

209
Confidential/ Research Purpose only
COMMUNITY-BASED STI & HIV PREVALENCE STUDY IN MYSORE DISTRICT, KARNATAKA, 2005
MALE QUESTIONNAIRE
SECTION 1: INTERVIEW INFORMATION
Respondent ID ..........................
Interviewer Name ______________________________________________
Date of interview: DAY MONTH YEAR
Hrs Minutes Hrs Minutes TIME STARTED TIME ENDED…….
INTERVIEWER VISITS
1
2
3
FINAL VISIT
DATE RESULT*
_________ _________
___________ ___________
__________ __________
DAY MONTH YEAR RESULT CODE*
NEXT VISIT: DATE TIME
__________
___________
TOTAL NUMBER OF VISITS
* RESULT CODES: 1 COMPLETED 3 POSTPONED 5 PARTLY COMPLETED 2 NOT AT HOME 4 REFUSED 6 OTHER (SPECIFY)___________________________
Biological samples collected
A Blood Yes ……….1 No……. 2 Skip to B
If Yes DBS ……….1 Venipuncture………..2
B Urine Yes………….1 No …….2

210
SECTION 2: SOCIO-DEMOGRAPHIC BACKGROUND OF THE RESPONDENT
No. QUESTIONS AND FILTERS CODING CATEGORIES SKIP 1 How old are you?
AGE IN COMPLETED YEARS….
2 What is your caste or tribe?
CASTE/TRIBE _______________ {SPECIFY) NO CASTE/ TRIBE ............ 97
3 What is your religion?
HINDU ....................... 1 MUSLIM ...................... 2 CHRISTIAN ................... 3 BUDDHIST .................... 4 JAIN ........................ 5 OTHER________________________6 {SPECIFY)
4 Can you read and write?
YES ......................... 1 NO .......................... 2
5 Have you ever been to school?
YES ......................... 1 NO .......................... 2
7
6 What is the highest grade you completed?
GRADE……………………………………..……
7 What kind of work do you mainly do? RECORD VERBATIM
8 Do you have to travel because of your work?
YES ......................... 1 NO .......................... 2
10
9 How often do you have to travel because of your work?
DAILY ....................... 1 WEEKLY ...................... 2 MONTHLY ..................... 3 ONCE IN A WHILE ............. 4
10 What is the longest period of time that you have been away from home during the last one year? RECORD ‘DAYS’ IF PERIOD AWAY WAS LESS THAN A WEEK RECORD ‘WEEKS’ IF PERIOD AWAY WAS MORE THAN A WEEK BUT LESS THAN A MONTH RECORD ‘MONTHS’ IF PERIOD AWAY WAS ONE MONTH OR MORE
DAYS ……………………1 WEEKS ……………………2 MONTHS ……………………3 IF ‘00’ RECORDED IN DAYS SKIP
14

211
No. QUESTIONS AND FILTERS CODING CATEGORIES SKIP 11 Where did you go (during this longest
period that you were away during the last one year)? SPECIFY STATE. IF GONE TO MORE THAN ONE STATE, RECORD STATE WHERE SPENT MOST TIME
WITHIN DISTRICT ............. 1 OUTSIDE DISTRICT BUT WITHIN STATE ............. 2 OUTSIDE STATE________________3 {SPECIFY)
12 What was the main reason for your travel there? INCLUDE FAMILY OBLIGATIONS AS SOCIAL VISIT
WORK ........................ 1 STUDY ....................... 2 SOCIAL VISIT ................ 3 OTHER________________________4 (SPECIFY)
13 Did you go alone or with the family?
ALONE ....................... 1 WITH WIFE/COHABITING PARTNER 2 WITH FAMILY MEMBERS OTHER THAN WIFE/ PARTNER ... 3 WITH FRIENDS ................ 4
14 What is your current marital status?
CURRENTLY MARRIED ........... 1 SEPARATED ................... 2 DESERTED .................... 3 DIVORCED .................... 4 WIDOWED ..................... 5 NEVER MARRIED ............... 6
17
15 Are you currently cohabiting with a partner?
YES ......................... 1 NO .......................... 2
17
16 CHECK Q.14 AND Q.15 IF THE RESPONDENT IS NEVER MARRIED AND CURRENTLY NOT COHABITING AND MARK
NEVER MARRIED AND NOT COHABITING ............. 1 OTHER ....................... 2
26 19
17 IF CURRENTLY MARRIED/ COHABITING: Are you living with your wife/ partner now or is she staying elsewhere?
LIVING WITH WIFE/ PARTNER ... 1 WIFE/ PARTNER LIVING ELSEWHERE .................. 2
19
18 For how long have you and your wife/ partner not been living together? IF LESS THAN 1 YEAR, RECORD MONTHS. OTHERWISE RECORD COMPLETED YEARS. RECORD ‘00’ IN MONTHS, IF < 1 MONTH
MONTHS……….……..….…..1 YEARS…………..………..………2
19 Have you been married/ cohabiting only once or more than once?
ONCE ........................ 1 MORE THAN ONCE .............. 2
21

212
No. QUESTIONS AND FILTERS CODING CATEGORIES SKIP 20 How long were you on your own before
remarrying / finding a new partner? IF LESS THAN 1 YEAR, RECORD MONTHS. OTHERWISE RECORD COMPLETED YEARS. RECORD ‘00’ IN MONTHS, IF < 1 MONTH
MONTHS……….……..….…..1 YEARS…………..………..………2
21 How old were you at the time of your (first) marriage?
AGE IN COMPLETED YEARS….
22 How old were you when you started living with your (first) wife/ partner?
AGE IN COMPLETED YEARS..
23 Do you have any children of your own?
YES ......................... 1 NO .......................... 2
26
24 How many of your own children do you currently have (are currently alive)? How many sons and how many daughters? RECORD ‘00’ IF NONE.
SONS……………………………………….……… DAUGHTERS……………………………….. TOTAL…………………………………………..
25 How old is your youngest child?
AGE IN COMPLETED YEARS.. RECORD ‘00’ IF LESS THAN 1 YEAR
26 Are you circumcised?
YES ......................... 1 NO .......................... 2
28
27 At what age were you circumcised? RECORD ‘00’ IF < 1 YEAR OLD
AGE IN COMPLETED YEARS..
28 CHECK Q.14 & Q.15 AND MARK: CURRENTLY MARRIED/COHABITING.1 OTHER ....................... 2
37
29 Are you or your wife/ cohabiting partner currently using any family planning methods?
NOT USING ................... 1 PILL ........................ 2 CONDOM/NIRODH ............... 3 IUD/LOOP .................... 4 FEMALE STERILIZATION ........ 5 MALE STERILIZATION .......... 6 RHYTHM/SAFE PERIOD .......... 7 WITHDRAWAL .................. 8 OTHER________________________9 (SPECIFY)
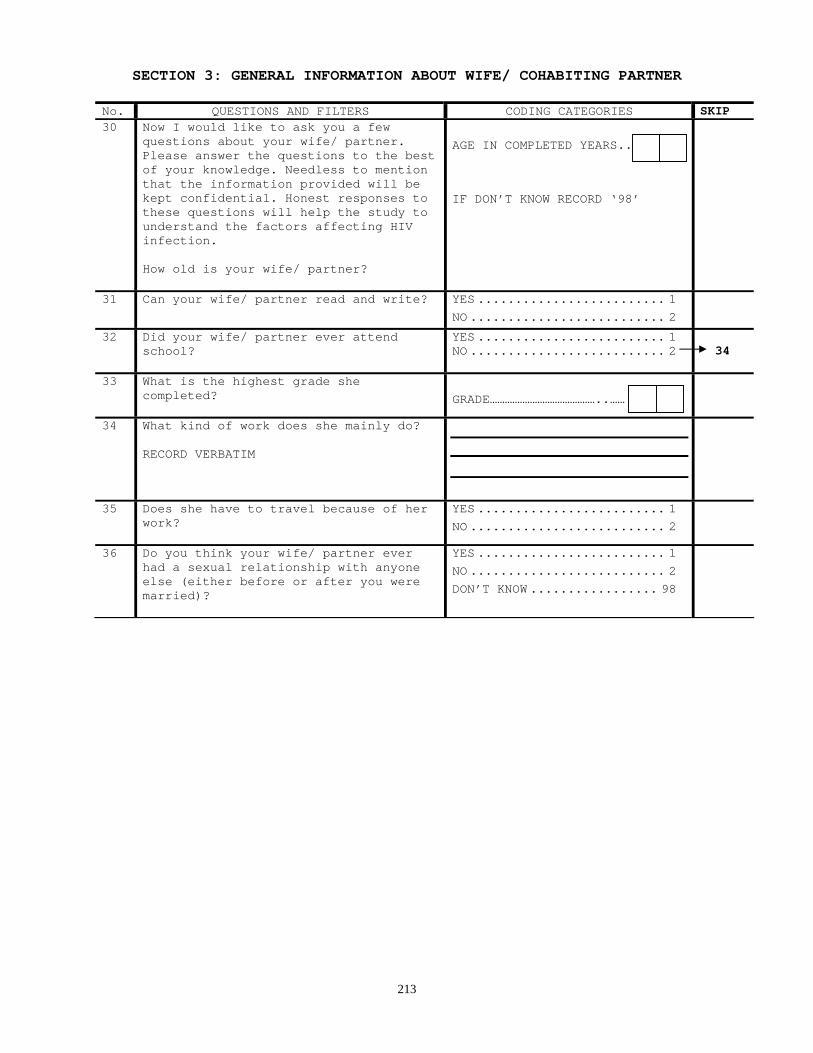
213
SECTION 3: GENERAL INFORMATION ABOUT WIFE/ COHABITING PARTNER
No. QUESTIONS AND FILTERS CODING CATEGORIES SKIP 30 Now I would like to ask you a few
questions about your wife/ partner. Please answer the questions to the best of your knowledge. Needless to mention that the information provided will be kept confidential. Honest responses to these questions will help the study to understand the factors affecting HIV infection. How old is your wife/ partner?
AGE IN COMPLETED YEARS.. IF DON’T KNOW RECORD ‘98’
31 Can your wife/ partner read and write?
YES ......................... 1 NO .......................... 2
32 Did your wife/ partner ever attend school?
YES ......................... 1 NO .......................... 2
34
33 What is the highest grade she completed?
GRADE……………………………………..……
34 What kind of work does she mainly do? RECORD VERBATIM
35 Does she have to travel because of her work?
YES ......................... 1 NO .......................... 2
36 Do you think your wife/ partner ever had a sexual relationship with anyone else (either before or after you were married)?
YES ......................... 1 NO .......................... 2 DON’T KNOW ................. 98
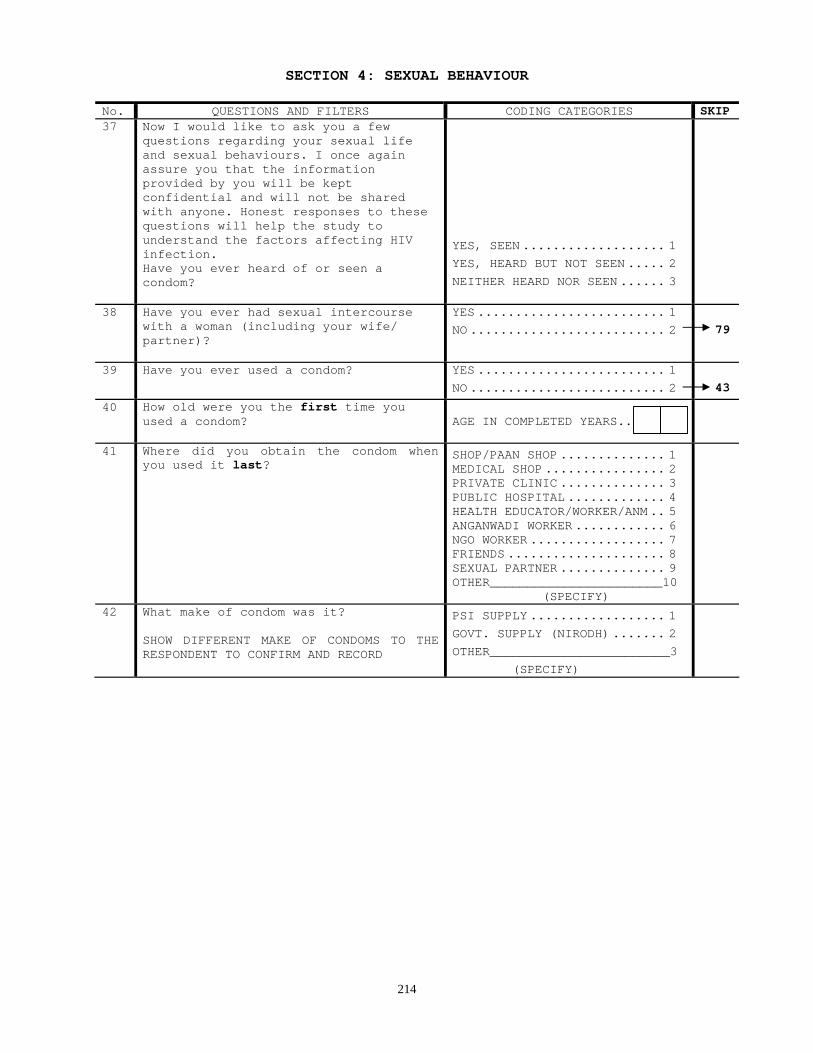
214
SECTION 4: SEXUAL BEHAVIOUR
No. QUESTIONS AND FILTERS CODING CATEGORIES SKIP 37 Now I would like to ask you a few
questions regarding your sexual life and sexual behaviours. I once again assure you that the information provided by you will be kept confidential and will not be shared with anyone. Honest responses to these questions will help the study to understand the factors affecting HIV infection. Have you ever heard of or seen a condom?
YES, SEEN ................... 1 YES, HEARD BUT NOT SEEN ..... 2 NEITHER HEARD NOR SEEN ...... 3
38 Have you ever had sexual intercourse with a woman (including your wife/ partner)?
YES ......................... 1 NO .......................... 2
79
39 Have you ever used a condom?
YES ......................... 1 NO .......................... 2
43
40 How old were you the first time you used a condom?
AGE IN COMPLETED YEARS..
41 Where did you obtain the condom when you used it last?
SHOP/PAAN SHOP .............. 1 MEDICAL SHOP ................ 2 PRIVATE CLINIC .............. 3 PUBLIC HOSPITAL ............. 4 HEALTH EDUCATOR/WORKER/ANM .. 5 ANGANWADI WORKER ............ 6 NGO WORKER .................. 7 FRIENDS ..................... 8 SEXUAL PARTNER .............. 9 OTHER_______________________10 (SPECIFY)
42 What make of condom was it? SHOW DIFFERENT MAKE OF CONDOMS TO THE RESPONDENT TO CONFIRM AND RECORD
PSI SUPPLY .................. 1 GOVT. SUPPLY (NIRODH) ....... 2 OTHER________________________3 (SPECIFY)

215
No. QUESTIONS AND FILTERS CODING CATEGORIES SKIP 43 Now I need to ask you some questions to
gain a better understanding about your sexual life. How old were you when you first had sexual intercourse with a woman (including your wife/ partner)?
AGE IN COMPLETED YEARS..
44 What was your relationship to the woman with whom you had sex for the first time?
WIFE/COHABITING PARTNER ..... 1 GIRLFRIEND/FIANCÉ ........... 2 FRIEND/ KNOWN WOMAN ........ 3 CASUAL ACQUAINTANCE ......... 4 COMMERCIAL SEX WORKER ....... 5 OTHER _______________________6 (SPECIFY)
45 The first time you had sexual intercourse with a woman (including your wife/ partner), did you use a condom?
YES ......................... 1 NO .......................... 2
46 When was the last time you had sexual intercourse? RECORD ‘DAYS AGO’ ONLY IF THE LAST INTERCOURSE WAS LESS THAN A MONTH RECORD ‘MONTHS AGO’ IF THE LAST INTERCOURSE WAS MORE THAN A MONTH BUT LESS THAN AN YEAR RECORD ‘YEARS AGO’ ONLY IF THE LAST INTERCOURSE WAS ONE OR MORE YEARS AGO.
DAYS AGO…………..……………….1 MONTHS AGO………………………..2 YEARS AGO…………………..…….3
47 The last time you had sexual intercourse with a woman (including your wife/ partner), did you use a condom?
YES ......................... 1 NO .......................... 2 DON’T REMEMBER ............ 98
48 In total, with how many different women (including your wife/ partner) have you ever had sex in your life? IF MORE THAN ONE WOMAN RECORD IN BOXES
ONLY ONE WOMAN .............. 1 NUMBER OF WOMEN ………………..
50

216
No. QUESTIONS AND FILTERS CODING CATEGORIES SKIP 49 In total, with how many different women
(including your wife/ partner) have you had sex in the last one year?
NONE ........................ 0 ONLY ONE WOMAN .............. 1 MORE THAN 1: RECORD NUMBER OF WOMEN………………..
57 51 52
50 CHECK Q.44 AND MARK: WIFE/COHABITING PARTNER ..... 1 GIRLFRIEND/ FIANCÉ .......... 2 FRIEND/ KNOWN WOMAN ........ 3 CASUAL ACQUAINTANCE ......... 4 COMMERCIAL SEX WORKER ....... 5 OTHER _______________________6 (SPECIFY)
SEC 4A SEC 4B
51 Was this woman who you had sex with during the last one year a new partner?
YES ......................... 1 NO .......................... 2 DON’T REMEMBER ............. 98
57
52 PLEASE RECORD THE NUMBER OF PARTNERS OF EACH TYPE BY ASKING: Of these (SAY NUMBER FROM Q.49) different women (including your wife/ partner), how many were…..?
A. WIFE/ COHABITING PARTNER B. GIRLFRIEND/ FIANCÉ C. FRIEND/ KNOWN WOMAN D. CASUAL ACQUAINTANCE E. COMMERCIAL SEX WORKER(S) F. OTHER _______________________ (SPECIFY)
A. WIFE/ COHABITING PARTNER…………………… B. GIRLFRIEND/ FIANCÉ….. C. FRIEND/ KNOWN WOMAN.… D. CASUAL ACQUAINTANCE… E. COMMERCIAL SEX WORKER(S)……………………. F. OTHER ______________ (SPECIFY)
53 Among these ______(SAY NUMBER FOR EACH TYPE FROM Q.52) women that you had sex with in the last one year, how many were new sexual partners?
A. WIFE/ COHABITING PARTNER…………………….. B. GIRLFRIEND/ FIANCÉ ………………….. C. FRIEND/ KNOWN WOMAN.… D. CASUAL ACQUAINTANCE… E. COMMERCIAL SEX WORKER(S)…………………. F. OTHER ______________

217
No. QUESTIONS AND FILTERS CODING CATEGORIES SKIP 54 Among these _______ (SAY NUMBER OF EACH
TYPE FROM Q.52) that you had sex with in the last one year, how many of these women live outside the village/ town where you live?
A. WIFE/ COHABITING PARTNER……………………. B. GIRLFRIEND/ FIANCÉ …… C. FRIEND/ KNOWN WOMAN.… D. CASUAL ACQUAINTANCE…. E. COMMERCIAL SEX WORKER(S)…………………. F. OTHER _____________
55 Did you use condoms with all of your sexual partners (new or old) in the last one year?
YES ......................... 1 NO .......................... 2
57
56 If not, with how many out of your (SAY NUMBER FOR EACH TYPE FROM Q.52) partners did you use condoms in the last one year?
A. WIFE/ COHABITING PARTNER………….. B. GIRLFRIEND/ FIANCÉ …… C. FRIEND/ KNOWN WOMAN.… D. CASUAL ACQUAINTANCE…. E. COMMERCIAL SEX WORKER(S)…………………….. F. OTHER ………………………………….

218
57. Now, I’d like to ask you some more details about your most recent FEMALE sexual partners. CHECK Q.48 AND RECORD NO. OF PARTNERS . IF TWO FEMALE PARTNERS IN LIFE THEN ASK FOR THOSE TWO PARTNERS; IF THREE OR MORE FEMALE PARTNERS IN LIFE ASK FOR THE LAST THREE PARTNERS ASK QUESTIONS Q.58 TO Q.67 FOR EACH FEMALE PARTNER SEPARATELY AND ONE AFTER ANOTHER, IF APPLICABLE.
STATUS OF PARTNER 58
What is/ was your relationship with this partner?
59 How old was this partner the first time you had sex with her?
60 How long ago did you have sex with this partner for the first time? RECORD ‘DAYS’ IF LESS THAN 1 MONTH, ‘MONTHS’ IF LESS THAN 1 YEAR, OR IN ‘YEARS’ IF MORE THAN 1 YEAR
61 How long was the last time you had sex with this person? RECORD ‘DAYS’ IF LESS THAN 1 MONTH, ‘MONTHS’ IF LESS THAN 1 YEAR, OR IN ‘YEARS’ IF MORE THAN 1 YEAR
62 Is the relationship with this person still continuing? ADJUST Q.63 TO Q.67 ACCORDING TO THIS ANSWER – PRESENT OR PAST TENSE
63 How often do (did) you have sex with this partner (during your relationship)? RECORD VERBATIM
64 Did you use (a) condom (s) when you had sex with this partner?
65 Have (did) you ever used (use) a condom with this partner?
66 Did you use a condom the last time you had sex with this partner?
67 Out of the last 10 times (or less if they did not have sex 10 times) that you had sex with this partner, how many times did you use a condom? RECORD VERBATIM ‘X OUT OF Y TIMES’
MOST RECENT
WIFE/ COHABITING PARTNER………………….1 GIRLFRIEND/ FIANCE…………….2 FRIEND/ KNOWN WOMAN ……………….3 CASUAL QUAINTANCE……..4 COMMERCIAL SEX WORKER…………5 OTHER_________ 6
AGE IN COMPLETED YEARS
DAYS… 1 MONTHS.2 YEARS…3
DAYS… 1 MONTHS.2 YEARS…3
YES.1 NO..2 NO ANSWER.99
ONCE ONLY ............ 1 A FEW TIMES ONLY ...... 2 LESS THAN ONCE IN A MONTH ............... 3 ONCE IN A MONTH ...... 4 MORE THAN ONCE IN A MONTH & LESS THAN ONCE IN A WEEK ...... 5 ONCE IN A WEEK ........ 6 MORE THAN ONCE IN WEEK ................ 7 IF 2 TO 7 GO TO 65
YES…1 NO.…2 SKIP TO SECOND PARTNER
YES ……1 NO ………2 IF 2 SKIP TO SECOND PARTNER
YES ………1 NO …………2
OUT OF
PREVIOUS
WIFE/ COHABITING PARTNER………………….1 GIRLFRIEND/ FIANCE…………….2 FRIEND/ KNOWN WOMAN ……………….3 CASUAL QUAINTANCE……..4 COMMERCIAL SEX WORKER…………5 OTHER_________ 6
AGE IN COMPLETED YEARS
DAYS… 1 MONTHS.2 YEARS…3
DAYS… 1 MONTHS.2 YEARS…3
YES.1 NO..2 NO ANSWER.99
ONCE ONLY ............ 1 A FEW TIMES ONLY ...... 2 LESS THAN ONCE IN A MONTH ............... 3 ONCE IN A MONTH ...... 4 MORE THAN ONCE IN A MONTH & LESS THAN ONCE IN A WEEK ...... 5 ONCE IN A WEEK ........ 6 MORE THAN ONCE IN WEEK ................ 7 IF 2 TO 7 GO TO 65
YES .1 NO.……2 SKIP TO THIRD PARTNER OR SEC 5
YES ……1 NO ………2 IF 2 SKIP TO THIRD PARTNER OR SEC 5, IF ONLY TWO PARTNERS
YES ………1 NO …………2
OUT OF SKIP TO SEC 5, IF ONLY TWO PARTNERS
SECOND PREVIOUS
WIFE/ COHABITING PARTNER………………….1 GIRLFRIEND/ FIANCE…………….2 FRIEND/ KNOWN WOMAN ……………….3 CASUAL QUAINTANCE……..4 COMMERCIAL SEX WORKER…………5 OTHER_________ 6
AGE IN COMPLETED YEARS
DAYS… 1 MONTHS.2 YEARS…3
DAYS… 1 MONTHS.2 YEARS…3
YES.1 NO..2 NO ANSWER.99
ONCE ONLY ............ 1 A FEW TIMES ONLY ...... 2 LESS THAN ONCE IN A MONTH ............... 3 ONCE IN A MONTH ...... 4 MORE THAN ONCE IN A MONTH & LESS THAN ONCE IN A WEEK ...... 5 ONCE IN A WEEK ........ 6 MORE THAN ONCE IN WEEK ................ 7 IF 2 TO 7 GO TO 65
YES..1 NO…..2 SKIP TO SEC 5
YES ……1 NO ………2 IF 2 SKIP TO SEC 5
YES ………1 NO …………2
OUT OF SKIP TO SEC 5

219
SECTION 4A IF ONLY ONE LIFETIME PARTNER AND IF THIS PARTNER IS WIFE/ COHABITING PARTNER, FOLLOW THIS SECTION No. QUESTIONS AND FILTERS CODING CATEGORIES SKIP A63 How often do (did) you have sex with
your wife/ partner? RECORD VERBATIM
ONCE ONLY ................. 1 A FEW TIMES ONLY ........... 2 LESS THAN ONCE IN A MONTH .................... 3 ONCE IN A MONTH ........... 4 MORE THAN ONCE IN A MONTH & LESS THAN ONCE IN A WEEK ...................... 5 ONCE IN A WEEK ............. 6 MORE THAN ONCE IN WEEK .... 7
68
A64 Have (did) you ever used (use) a condom with your wife/ partner?
YES ......................... 1 NO .......................... 2
68
A65 Out of the last 10 times (or less if they did not have sex 10 times) that you had sex with your wife/ partner, how many times did you use a condom? RECORD VERBATIM
‘X OUT OF Y TIMES’ OUT OF TIMES
68
SECTION 4B
IF ONLY ONE PARTNER AND IF THIS PARTNER IS NOT SPOUSE/ COHABITING PARTNER (I.E., IF RESPONDENT UNMARRIED) FOLLOW THIS SECTION No. QUESTIONS AND FILTERS CODING CATEGORIES SKIP B59 How old was this partner the first time
you had sex with her? AGE IN COMPLETED YEARS …
B60 How long ago did you have sex with this partner for the first time? RECORD IN ‘DAYS’ IF IT IS LESS THAN A MONTH RECORD IN ‘MONTHS’ IF IT IS MORE THAN A MONTH OR LESS THAN ONE YEAR RECORD IN ‘YEARS’ IF IT IS ONE OR MORE YEARS
DAYS AGO…………..……………….1 MONTHS AGO………………………..2 YEARS AGO…………………..…….3
B61 Is the relationship with this person still continuing? ADJUST QUESTIONS B63 & B64 ACCORDING TO THIS ANSWER – PRESENT OR PAST TENSE
YES ........................ 1 NO ......................... 2 NO ANSWER ................. 99
B62 How often do (did) you have sex with this partner (during your relationship)? RECORD VERBATIM
ONCE ONLY ................. 1 A FEW TIMES ONLY ........... 2 LESS THAN ONCE IN A MONTH .. 3 ONCE IN A MONTH ........... 4 MORE THAN ONCE IN A MONTH & LESS THAN ONCE IN A WEEK .. 5 ONCE IN A WEEK ............. 6 MORE THAN ONCE IN WEEK .... 7
68
B63 Have (did) you ever used (use) a condom with this partner?
YES ......................... 1 NO .......................... 2
68
B64 Out of the last 10 times (or less if they did not have sex 10 times) that you had sex with this partner, how many times did you use a condom? RECORD VERBATIM
‘X OUT OF Y TIMES’ OUT OF TIMES

220
SECTION 5: MORE DETAILS ON RISKY SEXUAL BEHAVIOUR
No. QUESTIONS AND FILTERS CODING CATEGORIES SKIP 68 Have you ever paid for sex with a
woman?
YES ......................... 1 NO .......................... 2
76
69 How many times have you ever paid for sex with a woman?
ONLY ONCE ................... 1 2–10 TIMES .................. 2 11-100 TIMES ................ 3 MORE THAN 100 TIMES ......... 4
70 How old were you when you first paid for sex with a woman?
AGE IN COMPLETED YEARS..
71 How long ago was the last time you paid for sex with a woman? RECORD ‘DAYS AGO’ ONLY IF IT WAS LESS THAN A MONTH RECORD ‘MONTHS AGO’ IF IT WAS MORE THAN A MONTH BUT LESS THAN AN YEAR RECORD ‘YEARS AGO’ ONLY IF IT WAS ONE OR MORE YEARS AGO.
DAYS AGO…………..……………….1 MONTHS AGO………………………..2 YEARS AGO…………………..…….3
73
72 How many times did you pay for sex with a woman during the last one year?
NUMBER OF TIMES………………….. IF MORE THAN ‘99’ CODE ‘96’
73 The last time you had paid for sex with a woman, did you use a condom?
YES ......................... 1 NO .......................... 2
74 Out of the last 10 times (or less if they did not have sex 10 times) that you paid for sex with women, how many times did you use a condom? RECORD VERBATIM
‘X OUT OF Y TIMES’ out of times

221
No. QUESTIONS AND FILTERS CODING CATEGORIES SKIP 75 IF ANSWER TO Q.74 IS 10/10, ASK
How long have you been using condoms every time you pay to have sex with a woman?
LESS THAN 6 MONTHS……………….. 1 MORE THAN 6 MONTHS……………….. 2 DON’T KNOW…………………………………..98
76 Some people like to have sex in different ways such as oral, vaginal, anal. Have you ever had anal sex with a woman (including your wife/ partner)?
YES ......................... 1 NO .......................... 2 DON’T KNOW ................. 98 NO ANSWER .................. 99
79
77 How long ago did you last have anal sex with a woman (including your wife/ partner)? RECORD ‘DAYS AGO’ ONLY IF IT WAS LESS THAN A MONTH RECORD ‘MONTHS AGO’ IF IT WAS MORE THAN A MONTH BUT LESS THAN AN YEAR RECORD ‘YEARS AGO’ ONLY IF IT WAS ONE OR MORE YEARS AGO.
DAYS AGO…………..……………….1 MONTHS AGO………………………..2 YEARS AGO…………………..…….3
78 The last time you had anal sex with a woman (including your wife/ partner), did you use a condom?
YES ......................... 1 NO .......................... 2 DON’T KNOW ................. 98
79 Some men like to have sex with other men. Have you ever had anal sex with a man?
YES ......................... 1 NO .......................... 2 DON’T KNOW ................. 98 NO ANSWER .................. 99
101
80 How old were you when you first had anal sex with a man?
AGE IN COMPLETED YEARS.
81 How long ago did you last have anal sex with a man? RECORD ‘DAYS AGO’ ONLY IF IT WAS LESS THAN A MONTH RECORD ‘MONTHS AGO’ IF IT WAS MORE THAN A MONTH BUT LESS THAN A YEAR RECORD ‘YEARS AGO’ ONLY IF IT WAS ONE OR MORE YEARS AGO.
DAYS AGO…………..……………….1 MONTHS AGO………………………..2 YEARS AGO…………………..…….3
86

222
No. QUESTIONS AND FILTERS CODING CATEGORIES SKIP 82 How many times did you have anal sex
with men during the last one year?
NUMBER OF TIMES………………….. IF MORE THAN ‘99’ CODE ‘96’.
83 Which role do (did) you normally take during anal sex with men?
INSERTIVE (KOTHIS) .......... 1 RECEPTIVE (PANKTHIS) ........ 2 BOTH (DOUBLE DECKERS) ....... 3 NO ANSWER .................. 99
84 The last time you had anal sex with a man, was a condom used?
YES ......................... 1 NO .......................... 2 DON’T KNOW ................. 98
85 Out of the last 10 times (or less if they did not have sex 10 times) that you had anal sex with men, how many times was a condom used? RECORD VERBATIM
‘X OUT OF Y TIMES’ out of times
86 Have you ever paid for anal sex with men?
YES ......................... 1 NO .......................... 2 NO ANSWER .................. 99
93 93
87 How many times have you ever paid for anal sex with men?
ONLY ONCE ................... 1 2–10 TIMES .................. 2 11-100 TIMES ................ 3 MORE THAN 100 TIMES ......... 4
88 How old were you when you first paid for anal sex with a man?
AGE IN COMPLETED YEARS..
89 How long ago was the last time you paid for anal sex with a man? RECORD ‘DAYS AGO’ ONLY IF IT WAS LESS THAN A MONTH RECORD ‘MONTHS AGO’ IF IT WAS MORE THAN A MONTH BUT LESS THAN AN YEAR RECORD ‘YEARS AGO’ ONLY IF IT WAS ONE OR MORE YEARS AGO.
DAYS AGO…………..……………….1 MONTHS AGO………………………..2 YEARS AGO…………………..…….3
91
90 How many times did you pay to have anal sex with a man during the last one year?
NUMBER OF TIMES………………….. IF MORE THAN ‘99’ CODE ‘96’.

223
No. QUESTIONS AND FILTERS CODING CATEGORIES SKIP 91 The last time you paid for anal sex
with a man, was a condom used?
YES ......................... 1 NO .......................... 2
92 Out of the last 10 times (or less if they did not have sex 10 times) that you had paid for anal sex with men, how many times was a condom used? RECORD VERBATIM
‘X OUT OF Y TIMES’ out of times
93 Have you ever received payment for anal sex with men?
YES ......................... 1 NO .......................... 2 NO ANSWER .................. 99
101 101
94 How many times have you ever received payment for anal sex with men?
ONLY ONCE ................... 1 2–10 TIMES .................. 2 11-100 TIMES ................ 3 MORE THAN 100 TIMES ......... 4
95 How old were you when you first received payment for anal sex with a man?
AGE IN COMPLETED YEARS..
96 How long ago was the last time you received payment for anal sex with a man? RECORD ‘DAYS AGO’ ONLY IF IT WAS LESS THAN A MONTH. RECORD ‘MONTHS AGO’ IF IT WAS MORE THAN A MONTH BUT LESS THAN AN YEAR. RECORD ‘YEARS AGO’ ONLY IF IT WAS ONE OR MORE YEARS AGO.
DAYS AGO…………..……………….1 MONTHS AGO………………………..2 YEARS AGO…………………..…….3
101
97 How many times did you receive payment for anal sex with men during the last one year?
NUMBER OF TIMES………………….. IF MORE THAN ‘99’CODE ‘96’
98 The last time you received payment for anal sex with a man, was a condom used?
YES ......................... 1 NO .......................... 2
99 Out of the last 10 times (or less if they did not have sex 10 times) that you had received payment when you had anal sex with men, how many times was a condom used? RECORD VERBATIM
‘X OUT OF Y TIMES’ out of times
100 IF ANSWER TO Q.99 IS 10/10, ASK: How long have you been using condoms every time you receive payment for sex with a man?
LESS THAN 6 MONTHS ………………………. 1 MORE THAN 6 MONTHS ………………………..2N/A, NOT CURRENTLY RECEIVING PAYMENT FOR SEX WITH MEN ………..3DON’T KNOW …………………………………………..98

224
SECTION 6: KNOWLEDGE & HISTORY OF STI AND MEDICAL INJECTIONS
No. QUESTIONS AND FILTERS CODING CATEGORIES SKIP 101 Have you ever heard of any disease/
symptom that can be transmitted through sexual intercourse?
YES ......................... 1 NO .......................... 2 DON’T KNOW ................. 98
102 If a man has sexually transmitted disease, what symptoms might he have? MULTIPLE RESPONSES POSSIBLE FIRST RECORD ALL SPONTANEOUS ANSWERS, THEN PROBE FOR EACH THAT HAS NOT BEEN ANSWERED
A. DISCHARGE FROM PENIS ……………………………….. B. SORES, ULCERS OR BLISTERS
ON OR AROUND THE SEX ORGANS ………….. C. SWELLING IN THE GROIN …………………………….. D. PAINFUL SWELLING OF
THE GENITALS/SCROTUM …………………………….. E. BURNING PAIN WHILE PASSING URINE ……………………………………………………. F. OTHER ___________________________
(SPECIFY)
G. NO SYMPTOMS ……………………………………………………….. H. DON’T KNOW …………………………………………………………..
SPONTANEOUS AFTER PROBING YES YES NO D/K A. ..1...........2.....3.....98 B. ..1...........2.....3.....98 C. ..1...........2.....3.....98 D. ..1...........2.....3.....98 E. ..1...........2.....3.....98 F. ..1 G. ..1...........2.....3.....98 H. 98
103 Have you ever suffered from: URETHRAL DISCHARGE GENITAL ULCER/SORE
YES NO
1 2 1 2
IF ONLY ONE SYMPTOM REPORTED IF ‘NO’ FOR BOTH THEN SKIP
105 110

225
No. QUESTIONS AND FILTERS CODING CATEGORIES SKIP 104 What was the most recent of these you
have suffered from?
URETHRAL DISCHARGE............1GENITAL ULCER/SORE............2
105 How long ago was that? IF THE SYMPTOMS ARE CURRENT, REFERRAL CARD TO BE ISSUED TO THE RESPONDENT
DAYS AGO ……………….. 1 MONTHS AGO ……………..2 YEARS AGO ………………..3 DON’T KNOW ................. 98
106 Did you get or take treatment for these symptoms?
YES ......................... 1 NO .......................... 2 DON’T REMEMBER ............. 98
110 110
107 Where did you go for treatment? MULTIPLE RESPONSES POSSIBLE. SHOW LOGO OF ‘KEY’ CLINIC FOR THOSE ANSWERED FOR PRIVATE CLINIC/ DOCTOR TO CODE CORRECTLY IN PSI (KEY) CLINIC.
YES NO A. GOVT.CLINIC/HOSPITAL.1 2B. PRIVATE CLINIC/DOCTOR1 2C. PHARMACY …………………………..1 2D. HOME REMEDY …………………..1 2E. PSI (KEY) CLINIC ……..1 2F. OTHER________________1 (SPECIFY)
108 How long did you have the symptom(s) before you sought treatment?
DAYS……………. ……………….. 1 MONTHS …………..……………..2 YEARS ……..……………………….3 DON’T REMEMBER ............. 98
109 What medicine did you take?
MULTIPLE RESPONSES POSSIBLE
YES NOA. INJECTION .............1 2 B. CAPSULE/ TABLETS ......1 2 C. TROPICAL OINTMENT / CREAM/ LOTION ...........1 2 D. OTHER ________________1 (SPECIFY) E. DON’T REMEMBER ........98
110 Have you ever received, as an adult, an injection from a medical doctor, nurse, RMP or traditional medical practitioner?
YES ......................... 1 NO .......................... 2 DON’T REMEMBER ............. 98
115
111 From which of these types of practitioners have you ever received injections?
MULTIPLE RESPONSES POSSIBLE
YES NO A. MEDICAL DOCTOR …….. 1 2 B. NURSE ………………………………….1 2 C. RMP ……………………………………. 1 2 D. TRADITIONAL MEDICAL PRACTITIONER …………………. 1 2

226
No. QUESTIONS AND FILTERS CODING CATEGORIES SKIP 112 Have you received such an injection in
the last one year?
YES ......................... 1 NO .......................... 2 DON’T REMEMBER ............. 98
114A
113 How many such injections have you received in the last one year?
NUMBER OF TIMES…………………..
114 What did you receive these injections for? MULTIPLE RESPONSES POSSIBLE. DO NOT READ OUT RESPONSES. PROBE FOR HIV/AIDS.
YES NOA. WEAKNESS / ANAEMIA …….. 1 2 B. HEART DISEASE …………… 1 2 C. DIABETES …………………………. 1 2 D. OTHER CHRONIC ILLNESS…..1 2 E. BODY ACHE …………………….. 1 2 F. FEVER/ INFECTION …… 1 2 G. HIV/ AIDS.………………………………..1 2 H. OTHER ______________ 1 (SPECIFY)
SECTION 7: INFORMATION ON PERSONAL HABITS AND DRUG USE
No. QUESTIONS AND FILTERS CODING CATEGORIES SKIP 115 Do you drink alcohol?
NEVER ....................... 1 OCCASIONALLY ................ 2 REGULARLY ................... 3
116 Do you smoke?
NEVER ....................... 1 OCCASIONALLY ................ 2 REGULARLY ................... 3
117 Some people like to inject drugs for fun or to get high. Have you ever injected illicit drugs?
YES ......................... 1 NO .......................... 2 NO ANSWER .................. 99
129
118 How old were you the first time that you injected illicit drugs?
AGE IN COMPLETED YEARS….
119 Have you injected illicit drugs in the last one year?
YES ......................... 1 NO .......................... 2 NO ANSWER .................. 99
121
120 How long ago (in years) was the last time you injected drugs?
YEARS AGO………………………………
129

227
No. QUESTIONS AND FILTERS CODING CATEGORIES SKIP 121 In the last one year, how often did you
inject? RECORD ONE OPTION ONLY:‘NUMBER OF TIMES PER WEEK’ OR‘NUMBER OF TIMES PER MONTH’ OR ‘NUMBER OF TIMES PER YEAR’
TIMES PER WEEK…………….1 TIMES PER MONTH.…………2 TIMES PER YEAR…..…….3
122 In the last one year, with whom did you inject? MULTIPLE RESPONSES POSSIBLE
YES NOA. REGULAR SEX PARTNER. 1 2 B. CLOSE FRIENDS ....... 1 2 C. PEOPLE YOU DON’T KNOW WELL ............ 1 2 D. PEOPLE YOU DON’T KNOW AT ALL .......... 1 2 E. ALONE .............. 1 2 F. NO ANSWER .......... 99
123 Of those people with whom you injected in the last one year, with whom did you inject most often?
REGULAR SEX PARTNER ......... 1 CLOSE FRIENDS ............... 2 PEOPLE YOU DON’T KNOW WELL .. 3 PEOPLE YOU DON’T KNOW AT ALL 4 ALONE ....................... 5 NO ANSWER .................. 99
124 Out of every 10 times that you injected during the last one year (OR LESS IF INJECTED LESS THAN 10 TIMES IN THE LAST ONE YEAR), how many times did you inject with a needle that had already been used by somebody else?
NONE ........................ 1 LESS THAN 1/10 TIMES ........ 2 ____ TIMES / 10 TIMES ..... 3 DON’T REMEMBER ............. 98
129
125 In the last one year, with whom did you share needles/ syringes? MULTIPLE RESPONSES POSSIBLE
YES NOA. REGULAR SEX PARTNER. 1 2 B. CLOSE FRIENDS…………….….1 2 C. PEOPLE YOU DON’T KNOW WELL ……………………………….1 2 D. PEOPLE YOU DON’T KNOW AT ALL ………………………….1 2 E. ALONE ………………………………….…1 2 F. NO ANSWER ………………….. 99
126 Of those people with whom you shared needles/ syringes in the last one year, with whom did you share needles/ syringes most often?
REGULAR SEX PARTNER ......... 1 CLOSE FRIENDS ............... 2 PEOPLE YOU DON’T KNOW WELL .. 3 PEOPLE YOU DON’T KNOW AT ALL 4 ALONE ....................... 5 NO ANSWER .................. 99

228
No. QUESTIONS AND FILTERS CODING CATEGORIES SKIP 127 When you inject with a syringe that has
previously been used by someone else, how often do you clean it before you use it?
NEVER ....................... 1 SOMETIMES ................... 2 OFTEN ....................... 3 ALWAYS ...................... 4
129
128 How do you clean the syringe?
WASH WITH COLD WATER ........ 1 WASH WITH BOILING WATER ..... 2 WASH WITH BLEACH ............ 3 OTHER ______________________ 4
SECTION 8: KNOWLEDGE AND ATTITUDE TOWARDS HIV/AIDS
No. QUESTIONS AND FILTERS CODING CATEGORIES SKIP 129 Have you ever heard of a disease known
as HIV/AIDS? PROBE FOR ANSWERS ‘NO’, DON’T KNOW’ AND ‘NO ANSWER’.
YES ......................... 1 NO .......................... 2 DON’T KNOW ................ 98 NO ANSWER ................. 99
151
130 From which sources of information have you learned about HIV/AIDS? MULTIPLE RESPONSES POSSIBLE
YES NO A. RADIO ............. 1 2 B. TELEVISION ........ 1 2 C. CINEMA ............ 1 2 D. NEWSPAPERS/MAGAZINES1 2 E. POSTERS/HOARDINGS .. 1 2 F. EXHIBITION/MELA .... 1 2 G. ADULT EDUCATION PROGRAM .............. 1 2 H. HEALTH WORKER/ANM ..1 2 I. NGO WORKER ........ 1 2 J. ANGANWADI WORKER .. 1 2 K. AIDS COUNSELLOR ... 1 2 L. FRIEND/NEIGHBOUR/ COLLEAGUE ....... 1 2 M. SEXUAL PARTNER ..... 1 2 N. COMMUNITY MEETINGS .1 2 O. WORKPLACE ......... 1 2 P. SCHOOLS/TEACHERS ... 1 2 Q. RELIGIOUS LEADERS . 1 2 R. POLITICAL LEADERS .. 1 2 S. OTHER_______________1 (SPECIFY) T. DON'T KNOW ........ 98

229
No. QUESTIONS AND FILTERS CODING CATEGORIES SKIP 131 Do you know how HIV/AIDS is
transmitted? MULTIPLE RESPONSES POSSIBLE FIRST RECORD ALL SPONTANEOUS ANSWERS, THEN PROBE FOR EACH THAT HAS NOT BEEN ANSWERED
A. UNPROTECTED INTERCOURSE B. BLOOD TRANSFUSION C. MOTHER TO CHILD D. MOSQUITO BITES E. SHAKING HANDS F. SWIMMING OR BATHING G. SHARING MEALS H. SHARING OF SHAVING SETS I. SHARING NEEDLES/ SYRINGES J. SALIVA K. TEARS L. TOUCHING/ HUGGING M. KISSING N. OTHER ________________ (SPECIFY)
SPONTANEOUS AFTER PROBING YES YES NO D/K A. 1...........2.....3.....98 B. 1...........2.....3.....98 C. 1...........2.....3.....98 D. 1...........2.....3.....98 E. 1...........2.....3.....98 F. 1...........2.....3.....98 G. 1...........2.....3.....98 H. 1...........2.....3.....98 I. 1...........2.....3.....98 J. 1...........2.....3.....98 K. 1...........2.....3.....98 L. 1...........2.....3.....98 M. 1...........2.....3.....98 N. 1
132 Do you yourself feel you are at risk of being infected with HIV?
YES ......................... 1 NO .......................... 2 DON’T KNOW ................ 98 NO ANSWER ................. 99
134
133 Why do you feel you are at risk of being infected with HIV? MULTIPLE RESPONSES POSSIBLE
YES NOA. DOESN’T USE CONDOMS. 1 2 B. HAS MORE THAN ONE SEX PARTNER ………………….. 1 2 C. VISITS SEX WORKERS . 1 2 D. OTHER ______________ 1 (SPECIFY) E. NO ANSWER ……………………. 99
134 Can you know whether a person has HIV (the virus that causes AIDS) by looking at him/her?
YES ......................... 1 NO .......................... 2 DON’T KNOW ................ 98 NO ANSWER ................. 99
135 Are there ways a person can prevent himself or herself getting infected with HIV?
YES ......................... 1 NO .......................... 2 DON’T KNOW ................ 98 NO ANSWER ................. 99
137
230
No. QUESTIONS AND FILTERS CODING CATEGORIES SKIP 136 What are the ways a person can prevent
himself or herself becoming infected with HIV? FIRST RECORD ALL SPONTANEOUS ANSWERS, THEN PROBE FOR EACH THAT HAS NOT BEEN ANSWERED A. TAKE MEDICINE/ HERBAL MIXTURE
BEFORE HAVING SEXUAL INTERCOURSE B. ALWAYS USE CONDOMS WHILE ENGAGING
IN SEX C. AVOID THE USE OF SHARED INJECTION
NEEDLES D. DON’T SHARE CLOTHES OR
EATING UTENSILS E. AVOID MOSQUITO / INSECTS BITES F. EAT NUTRITIOUS FOOD G. ONLY HAVE SEX WITH ONLY ONE
FAITHFUL PARTNER H. OTHER ___________________ (SPECIFY)
SPONTANEOUS AFTER PROBING YES YES NO D/K A. 1 ............2.....3.....98 B. 1 ............2.....3.....98 C. 1 ............2.....3.....98 D. 1 ............2.....3.....98 E. 1 ............2.....3.....98 F. 1 ............2.....3.....98 G. 1 ............2.....3.....98 H. 1
137 Do you personally know a person or persons (who also knows you) infected with HIV or who suffers from AIDS or has died of AIDS?
YES ......................... 1 NO .......................... 2 NO ANSWER ................. 99
140
138 What is / was the relationship with that person to you? MULTIPLE RESPONSES POSSIBLE
YES NOWIFE/ COHABITING PARTNER.1 2 GIRLFRIEND/ FIANCÉ …………..1 2 FAMILY MEMBER ………………………….1 2 PERSON FROM THE SAME AREA………………………………………………..1 2 FRIEND/ KNOWN PERSON.……..1 2 OTHER (SPECIFY)__________1
139 Have you changed your behaviour as a result of knowing this (these) person(s) (who has (have) HIV/AIDS or who died from AIDS?)
YES ......................... 1 NO .......................... 2 NEVER HAD SEX ............... 3 NO ANSWER ................. 99
141 142
140 Have you changed your behaviour as a result of knowing about HIV/AIDS?
YES ......................... 1 NO .......................... 2 NEVER HAD SEX ............... 3 NO ANSWER ................. 99
142

231
No. QUESTIONS AND FILTERS CODING CATEGORIES SKIP 141 In what ways you have changed your
behaviour after knowing about HIV/AIDS? RECORD ALL MENTIONED
YES NOA. TAKE MEDICINE/ HERBAL MIXTURE BEFORE HAVING SEXUAL INTERCOURSE……………………………….. 1 2 B. USE CONDOMS MORE OFTEN WHILE ENGAGING IN SEX …………………….. 1 2 C. SHARE ILLICIT DRUG INJECTION NEEDLES LESS OFTEN ………………. 1 2 D. SHARE CLOTHES OR EATING UTENSILS LESS OFTEN.1 2 E. AVOID MOSQUITO / INSECTS BITES …………………………………….. 1 2 F. EAT MORE NUTRITIOUS FOOD ……………………………………… 1 2 G. HAVE LESS SEXUAL PARTNERS ………………………………………. 1 2 H. ONLY HAVE SEX WITH ONE FAITHFUL PARTNER ……………….. 1 2 I. HAVE SEX LESS OFTEN…….. 1 2 J. OTHER _________________ 1 (SPECIFY)
142 Do you know where people can go to get a confidential test to find out if they have been infected with HIV? By confidential I mean that no one else besides you will know the results of your test unless you want them to know.
YES ......................... 1 NO .......................... 2 NO ANSWER ................. 99
143 Have you ever taken an HIV test?
YES ......................... 1 NO .......................... 2 DON’T KNOW ................ 98 NO ANSWER ................. 99
148
144 When did you last take an HIV test? RECORD APPROPRIATELY
WEEKS AGO…………………………..1 MONTHS AGO………………………..2 YEARS AGO…………………..…….3 NO ANSWER ................. 99
145 Did you take that last test at your own request?
YES ......................... 1 NO .......................... 2 DON’T KNOW ................ 98 NO ANSWER ................. 99
146 Did you have counselling when you took the last HIV test?
YES ......................... 1 NO .......................... 2 DON’T KNOW ................ 98 NO ANSWER ................. 99

232
No. QUESTIONS AND FILTERS CODING CATEGORIES SKIP 147 Do you know the result of the test you
took? IMPORTANT: EXPLAIN THAT THE INTERVIEWER DOESN’T WANT TO KNOW THE TEST RESULT
YES ......................... 1 NO .......................... 2 NO ANSWER ................. 99
148 Do you know whether or not there is treatment available that could prolong the life/ alleviate the suffering of people with AIDS?
YES ......................... 1 NO .......................... 2 DON’T KNOW ................ 98 NO ANSWER ................. 99
149 If there were treatment available that could prolong the life/ alleviate the suffering of people with AIDS, do you think people would change their behaviour?
YES ......................... 1 NO .......................... 2 DON’T KNOW ................ 98 NO ANSWER ................. 99
151
150 If yes, how? RECORD ALL MENTIONED
YES NO A. USE CONDOMS LESS OFTEN WHEN HAVING SEX.1 2 B. SHARE INJECTION NEEDLES MORE OFTEN ..1 2 C. HAVE MORE SEXUAL PARTNERS ………………….. 1 2 D. HAVE SEX MORE OFTEN.1 2 E. OTHER _____________ 1 (SPECIFY)
151 Have you ever heard of “KEY” clinics? SHOW THE LOGO OF ‘KEY’ CLINICS AND PROBE.
YES ........................ 1 NO ......................... 2
153
152 Have you ever visited these clinics for STI treatments?
YES ........................ 1 NO ......................... 2
153 Are you aware of any HIV/AIDS programmes in this area?
YES ........................ 1 NO ......................... 2
SEC9 154 What programmes do you know about?
IF CAN’T SAY; PROBE
Hrs Minutes
TIME ENDED

233
SECTION 9: REPORT ON BIOLOGICAL SAMPLE COLLECTION
The interview is over. I thank you for your patience and cooperation in answering these questions. This information will be very valuable for understanding the spread of HIV/AIDS in this area and to plan suitable programs accordingly. Now a nurse/ health investigator will take samples of your blood and urine to test for HIV and STIs. For Health Investigator to fill up Biological samples collected
A Blood Yes ……….1 No……. 2 Skip to B
If Yes DBS ……….1 Venipuncture………..2
B Urine Yes………….1 No …….2
********************* END **********************

234

235
Confidential/ Research Purpose only
COMMUNITY-BASED STI & HIV PREVALENCE STUDY IN MYSORE DISTRICT, KARNATAKA, 2005
FEMALE QUESTIONNAIRE
SECTION 1: INTERVIEW INFORMATION
Respondent ID
Interviewer Name ______________________________________________
Date of interview: DAY MONTH YEAR
Hrs Minutes Hrs Minutes TIME STARTED TIME ENDED…….
INTERVIEWER VISITS
1
2
3
FINAL VISIT
DATE RESULT*
_________ _________
___________ ___________
__________ __________
DAY MONTH YEAR RESULT CODE*
NEXT VISIT: DATE TIME
__________
___________
TOTAL NUMBER OF VISITS
* RESULT CODES: 1 COMPLETED 3 POSTPONED 5 PARTLY COMPLETED 2 NOT AT HOME 4 REFUSED 6 OTHER (SPECIFY)___________________________
Biological samples collected
A Blood Yes ……….1 No……. 2 Skip to B
If Yes DBS ……….1 Venipuncture………..2
B Urine Yes………….1 No …….2
236
SECTION 2: SOCIO-DEMOGRAPHIC BACKGROUND OF THE RESPONDENT
No. QUESTIONS AND FILTERS CODING CATEGORIES SKIP 1 How old are you?
AGE IN COMPLETED YEARS….
2 What is your caste or tribe?
CASTE/TRIBE _______________ {SPECIFY) NO CASTE/ TRIBE ......... 97
3 What is your religion?
HINDU ....................... 1 MUSLIM ...................... 2 CHRISTIAN ................... 3 BUDDHIST .................... 4 JAIN ........................ 5 OTHER________________________6 {SPECIFY)
4 Can you read and write?
YES ......................... 1 NO .......................... 2
5 Have you ever been to school?
YES ......................... 1 NO .......................... 2
7
6 What is the highest grade you completed?
GRADE……………………………………..……
7 What kind of work do you mainly do? RECORD VERBATIM
8 Do you have to travel because of your work?
YES ......................... 1 NO .......................... 2
10
9 How often do you have to travel because of your work?
DAILY ....................... 1 WEEKLY ...................... 2 MONTHLY ..................... 3 ONCE IN A WHILE ............. 4
10 What is the longest period of time that you have been away from home during the last one year? RECORD ‘DAYS’ IF PERIOD AWAY WAS LESS THAN A WEEK RECORD ‘WEEKS’ IF PERIOD AWAY WAS MORE THAN A WEEK BUT LESS THAN A MONTH RECORD ‘MONTHS’ IF PERIOD AWAY WAS ONE MONTH OR MORE
DAYS ……………………1 WEEKS ……………………2 MONTHS ……………………3 IF ‘00’ RECORDED IN DAYS SKIP
14

237
No. QUESTIONS AND FILTERS CODING CATEGORIES SKIP 11 Where did you go (during this longest
period that you were away during the last one year)? SPECIFY STATE. IF GONE TO MORE THAN ONE STATE, RECORD STATE WHERE SPENT MOST TIME
WITHIN DISTRICT ............. 1 OUTSIDE DISTRICT BUT WITHIN STATE ............. 2 OUTSIDE STATE________________3 {SPECIFY)
12 What was the main reason for your travel there? INCLUDE FAMILY OBLIGATIONS AS SOCIAL VISIT
WORK ........................ 1 STUDY ....................... 2 SOCIAL VISIT ................ 3 OTHER________________________4 (SPECIFY)
13 Did you go alone or with the family?
ALONE ....................... 1 WITH HUSBAND/COHABITING PARTNER. .................... 2 WITH FAMILY MEMBERS OTHER THAN HUSBAND/ PARTNER 3 WITH FRIENDS ................ 4
14 What is your current marital status?
CURRENTLY MARRIED ........... 1 SEPARATED ................... 2 DESERTED .................... 3 DIVORCED .................... 4 WIDOWED ..................... 5 NEVER MARRIED ............... 6
17
15 Are you currently cohabiting with a partner?
YES ......................... 1 NO .......................... 2
17
16 CHECK Q.14 AND Q.15 IF THE RESPONDENT IS NEVER MARRIED AND CURRENTLY NOT COHABITING AND MARK
NEVER MARRIED AND NOT COHABITING ............. 1 OTHER ....................... 2
43 19
17 IF CURRENTLY MARRIED/ COHABITING: Are you living with your husband/ partner now or is he staying elsewhere?
LIVING WITH HUSBAND/ PARTNER.1 HUSBAND/ PARTNER LIVING ELSEWHERE .................. 2
19
18 For how long have you and your husband/ partner not been living together? IF LESS THAN 1 YEAR, RECORD MONTHS. OTHERWISE RECORD COMPLETED YEARS. RECORD ‘00’ IN MONTHS, IF < 1 MONTH
MONTHS……….……..….…..1 YEARS…………..………..………2
19 Have you been married/ cohabiting only once or more than once?
ONCE ........................ 1 MORE THAN ONCE .............. 2
21

238
No. QUESTIONS AND FILTERS CODING CATEGORIES SKIP 20 How long were you on your own before
remarrying/ finding a new partner? IF LESS THAN 1 YEAR, RECORD MONTHS. OTHERWISE RECORD COMPLETED YEARS. RECORD ‘00’ IN MONTHS, IF < 1 MONTH
MONTHS……….……..….…..1 YEARS…………..………..………2
21 How old were you at the time of your (first) marriage?
AGE IN COMPLETED YEARS….
22 How old were you when you started living with your (first) husband/ partner?
AGE IN COMPLETED YEARS..
23 Do you have any children of your own?
YES ......................... 1 NO .......................... 2
26
24 How many of your own children do you currently have (are currently alive)? How many sons and how many daughters? RECORD ‘00’ IF NONE.
SONS……………………………………….……… DAUGHTERS……………………………….. TOTAL…………………………………………..
25 How old is your youngest child?
AGE IN COMPLETED YEARS.. RECORD ‘00’ IF LESS THAN 1 YEAR
26 CHECK Q.14 & Q.15 AND MARK: CURRENTLY MARRIED/COHABITING.1 OTHER ....................... 2
27A
27 Are you or your husband/ cohabiting partner currently using any family planning methods?
NOT USING ................... 1 PILL ........................ 2 CONDOM/NIRODH ............... 3 IUD/LOOP .................... 4 FEMALE STERILIZATION ........ 5 MALE STERILIZATION .......... 6 RHYTHM/SAFE PERIOD .......... 7 WITHDRAWAL .................. 8 OTHER________________________9 (SPECIFY)

239
SECTION 3: GENERAL INFORMATION ABOUT HUSBAND/ COHABITING PARTNER
No. QUESTIONS AND FILTERS CODING CATEGORIES SKIP 28 Now I would like to ask you a few
questions about your husband/ partner. Please answer the questions to the best of your knowledge. Needless to mention that the information provided will be kept confidential. Honest responses to these questions will help the study to understand the factors affecting HIV infection. How old is your husband/ partner?
AGE IN COMPLETED YEARS.. IF DON’T KNOW RECORD ‘98’
29 Can your husband/ partner read and write?
YES ......................... 1 NO .......................... 2
30 Did your husband/ partner ever attend school?
YES ......................... 1 NO .......................... 2
32
31 What is the highest grade he completed?
GRADE……………………………………..…… RECORD ‘98’ IF DON’T KNOW
32 Does he have to travel because of his work?
YES ......................... 1 NO .......................... 2
34
33 How often does he have to travel because of his work?
DAILY ....................... 1 WEEKLY ...................... 2 MONTHLY ..................... 3 ONCE IN A WHILE ............. 4
34 Has your husband/ partner been away for more than a month at a stretch during the last one year?
YES ......................... 1 NO .......................... 2
36

240
No. QUESTIONS AND FILTERS CODING CATEGORIES SKIP 35 The last time your husband/ partner
was away for more than a month, where did he go? SPECIFY STATE. IF GONE TO MORE THAN ONE STATE, RECORD STATE WHERE SPENT MOST TIME
WITHIN DISTRICT…………..……......1 OUTSIDE DISTRICT BUT WITHIN STATE……………………......2 OUTSIDE STATE________________3 {SPECIFY)
36 Does your husband/ partner drink alcohol?
NEVER....................... 1 OCCASIONALLY................ 2 REGULARLY................... 3 DON’T KNOW................. 98
37 Does your husband/ partner smoke?
NEVER....................... 1 OCCASIONALLY................ 2 REGULARLY................... 3 DON’T KNOW................. 98
38 What kind of work does he mainly do? RECORD VERBATIM
39 Do you think your husband/ partner ever had a sexual relationship with anyone else before your marriage?
YES......................... 1 NO.......................... 2 DON’T KNOW................. 98
40 Do you think your husband/ partner ever had a sexual relationship with anyone other than yourself since you were married?
YES......................... 1 NO.......................... 2 DON’T KNOW................. 98
42 42
41 If you took a guess, how many partners other than yourself do you think your current husband/ partner has had in the last one year?
NUMBER OF PARTNERS…….. DON’T KNOW................. 98 NO ANSWER.................. 99
42 To the best of your knowledge, has your husband/ partner ever had sex with commercial sex workers?
YES......................... 1 NO.......................... 2 DON’T KNOW................. 98

241
SECTION 4: SEXUAL BEHAVIOUR No. QUESTIONS AND FILTERS CODING CATEGORIES SKIP 43 Now I would like to ask you a few
questions regarding your sexual life and sexual behaviours. I once again assure you that the information provided by you will be kept confidential and will not be shared with anyone. Honest responses to these questions will help the study to understand the factors affecting HIV infection. Have you ever heard of or seen a condom?
YES, SEEN ................... 1 YES, HEARD BUT NOT SEEN ..... 2 NEITHER HEARD NOR SEEN ...... 3
44 Have you ever had sexual intercourse with a man (including your husband/ partner)?
YES ......................... 1 NO .......................... 2
84
45 Have you ever used a condom?
YES ......................... 1 NO .......................... 2
49
46 How old were you the first time you used a condom?
AGE IN COMPLETED YEARS..
47 Where did you obtain the condom when you used it last?
SHOP/PAAN SHOP .............. 1 MEDICAL SHOP ................ 2 PRIVATE CLINIC .............. 3 PUBLIC HOSPITAL ............. 4 HEALTH EDUCATOR/WORKER/ANM .. 5 ANGANWADI WORKER ............ 6 NGO WORKER .................. 7 FRIENDS ..................... 8 SEXUAL PARTNER .............. 9 OTHER_______________________10 (SPECIFY)
48 What make of condom was it? SHOW DIFFERENT MAKE OF CONDOMS TO THE RESPONDENT TO CONFIRM AND RECORD
PSI SUPPLY .................. 1 GOVT. SUPPLY (NIRODH) ....... 2 OTHER________________________3 (SPECIFY)
49 Now I need to ask you some questions to gain a better understanding about your sexual life. How old were you when you first had sexual intercourse with a man (including your husband/ partner)?
AGE IN COMPLETED YEARS..

242
No. QUESTIONS AND FILTERS CODING CATEGORIES SKIP 50 What was your relationship to the man
with whom you had sex for the first time?
HUSBAND/COHABITING PARTNER .. 1 BOYFRIEND/FIANCE ............ 2 FRIEND/ KNOWN MAN ........... 3 CASUAL ACQUAINTANCE ......... 4 OTHER _______________________5 (SPECIFY)
51 The first time you had sexual intercourse with a man (including your husband/ partner), did you use a condom?
YES ......................... 1 NO .......................... 2
52 When was the last time you had sexual intercourse? RECORD ‘DAYS AGO’ ONLY IF THE LAST INTERCOURSE WAS LESS THAN A MONTH RECORD ‘MONTHS AGO’ IF THE LAST INTERCOURSE WAS MORE THAN A MONTH BUT LESS THAN AN YEAR RECORD ‘YEARS AGO’ ONLY IF THE LAST INTERCOURSE WAS ONE OR MORE YEARS AGO.
DAYS AGO…………..……………….1 MONTHS AGO………………………..2 YEARS AGO…………………..…….3
53 The last time you had sexual intercourse with a man (including your husband/ partner), did you use a condom?
YES ......................... 1 NO .......................... 2 DON’T REMEMBER ............ 98
54 In total, with how many different men (including your husband/ partner) have you ever had sex in your life? IF MORE THAN ONE MAN RECORD IN BOXES
ONLY ONE MAN ................ 1 NUMBER OF MEN………………………..
56
55 In total, with how many different men (including your husband/ partner) have you had sex in the last one year?
NONE ........................ 0 ONLY ONE MAN ................ 1 MORE THAN 1: RECORD NUMBER OF MEN………………..
63 57 58

243
No. QUESTIONS AND FILTERS CODING CATEGORIES SKIP 56 CHECK Q.50 AND MARK: HUSBAND/ PARTNER ............ 1
BOYFRIEND/ FIANCÉ .......... 2 FRIEND/ KNOWN MAN ........... 3 CASUAL ACQUAINTANCE ........ 4 OTHER ______________________ 5
SEC 4A SEC 4B
57 Was this man who you had sex with during the last one year a new partner?
YES ......................... 1 NO .......................... 2 DON’T REMEMBER ............. 98
63
58 PLEASE RECORD THE NUMBER OF PARTNERS OF EACH TYPE BY ASKING: Of these (SAY NUMBER from Q55) different men, how many were…..?
A. HUSBAND/ COHABITING PARTNER B. BOYFRIEND/ FIANCÉ C. FRIEND/ KNOWN MAN D. CASUAL ACQUAINTANCE E. OTHER _______________________
(SPECIFY)
A. HUSBAND/ COHABITING PARTNER………………………
B. BOYFRIEND/ FIANCE ……… C. FRIEND/ KNOWN MAN…….. D. CASUAL ACQUAINTANCE…. E. OTHER _______________ (SPECIFY)
59 Among these ______(SAY NUMBER FOR EACH TYPE FROM Q.58) that you had sex with in the last one year, how many were new sexual partners?
A. HUSBAND/ COHABITING PARTNER…………..
B. BOYFRIEND/ FIANCE ……. C. FRIEND/ KNOWN MAN…….. D. CASUAL ACQUAINTANCE…. E. OTHER _______________
60 Among these _______ (SAY NUMBER OF EACH TYPE FROM Q.58) that you had sex with in the last one year, how many of these men live outside the village/ town where you live?
A. HUSBAND/ COHABITING PARTNER………………………
B. BOYFRIEND/ FIANCE ……… C. FRIEND/ KNOWN MAN…….. D. CASUAL ACQUAINTANCE…. E. OTHER _______________
61 Did you use condoms with all of your sexual partners (new or old) in the last one year?
YES ......................... 1 NO .......................... 2
63
62 If not, with how many out of your (SAY NUMBER FOR EACH TYPE FROM Q.58) partners did you use condoms in the last one year?
A. HUSBAND/ COHABITING PARTNER………………………
B. BOYFRIEND/ FIANCE ……… C. FRIEND/ KNOWN MAN…….. D. CASUAL ACQUAINTANCE…. E. OTHER _______________

244
63 Now, I’d like to ask you some more details about your most recent MALE sexual partners. CHECK Q.54 AND RECORD NO. OF PARTNERS . IF TWO MALE PARTNERS IN LIFE THEN ASK FOR THOSE TWO PARTNERS; IF THREE OR MORE MALE PARTNERS IN LIFE ASK FOR THE LAST THREE PARTNERS. ASK QUESTIONS Q.64 TO Q.73 FOR EACH MALE PARTNER SEPARATELY AND ONE AFTER ANOTHER, IF APPLICABLE.
STATUS OF PARTNER
64 What is/ was your relationship with this partner?
65 How old was this partner the first time you had sex with him?
66 How long ago did you have sex with this partner for the first time? RECORD ‘DAYS’ IF LESS THAN 1 MONTH, ‘MONTHS’ IF LESS THAN 1 YEAR, OR IN ‘YEARS’ IF MORE THAN 1 YEAR
67 How long was the last time you had sex with this partner? RECORD ‘DAYS’ IF LESS THAN 1 MONTH, ‘MONTHS’ IF LESS THAN 1 YEAR, OR IN ‘YEARS’ IF MORE THAN 1 YEAR
68 Is the relationship with this partner still continuing? ADJUST Q.69 TO Q.73 ACCORDING TO THIS ANSWER – PRESENT OR PAST TENSE
69 How often do (did) you have sex with this partner (during your relationship)? RECORD VERBATIM
70 Did you use (a) condom (s) when you had sex with this partner?
71 Have (did) you ever used (use) a condom with this partner?
72 Did you use a condom the last time you had sex with this partner?
73 Out of the last 10 times (or less if they did not have sex 10 times) that you had sex with this partner, how many times did you use a condom? RECORD VERBATIM ‘X OUT OF Y TIMES’
MOST RECENT
HUSBAND/ COHABITING PARTNER…...…1 BOYFRIEND/ FIANCE…….…….2 FRIEND/ KNOWN MAN………………..…3 CASUAL AQUAINTANCE.4 OTHER_______5 (SPECIFY)
AGE IN COMPLETED YEARS …….
DAYS …1 MONTHS…2 YEARS…3
DAYS …1 MONTHS…2 YEARS…3
YES ………1 NO …………2 NO ANSWER…99
ONCE ONLY ........... 1 A FEW TIMES ONLY ..... 2 LESS THAN ONCE IN A MONTH .............. 3 ONCE IN A MONTH ..... 4 MORE THAN ONCE IN A MONTH & LESS THAN ONCE IN A WEEK ..... 5 ONCE IN A WEEK ....... 6 MORE THAN ONCE IN WEEK ............... 7 IF 2 TO 7 GO TO 71
YES ……1 NO …….2 SKIP TO SECOND PARTNER
YES ……1 NO ………2 IF 2 SKIP TO SECOND PARTNER
YES ……1 NO ………2
OUT OF
PREVIOUS
HUSBAND/ COHABITING PARTNER…….…1 BOYFRIEND/ FIANCE………..2 FRIEND/ KNOWN MAN…...3 CASUAL AQUAINTANCE.4 OTHER_______5 (SPECIFY)
AGE IN COMPLETED YEARS ………
DAYS …1 MONTHS…2 YEARS…3
DAYS …1 MONTHS…2 YEARS…3
YES ………1 NO ………..2 NO ANSWER…99
ONCE ONLY ........... 1 A FEW TIMES ONLY ..... 2 LESS THAN ONCE IN A MONTH .............. 3 ONCE IN A MONTH ..... 4 MORE THAN ONCE IN A MONTH & LESS THAN ONCE IN A WEEK ..... 5 ONCE IN A WEEK ....... 6 MORE THAN ONCE IN WEEK ............... 7 IF 2 TO 7 GO TO 71
YES………1 NO……….2 SKIP TO THIRD PARTNER OR TO SEC 5
YES ……1 NO ………2 IF 2 SKIP TO THIRD PARTNER OR SEC 5, IF ONLY TWO PARTNERS
YES ……1 NO ………2
OUT OF SKIP TO SEC 5, IF ONLY TWO PARTNERS
SECOND PREVIOUS
HUSBAND/ COHABITING PARTNER…….…1 BOYFRIEND/ FIANCE…….….2 FRIEND/ KNOWN MAN…3 CASUAL AQUAINTANCE.4 OTHER ______5 (SPECIFY)
AGE IN COMPLETED YEARS ……….
DAYS …1 MONTHS…2 YEARS…3
DAYS …1 MONTHS…2 YEARS…3
YES ………..1 NO ………...2 NO ANSWER.99
ONCE ONLY ........... 1 A FEW TIMES ONLY ..... 2 LESS THAN ONCE IN A MONTH .............. 3 ONCE IN A MONTH ..... 4 MORE THAN ONCE IN A MONTH & LESS THAN ONCE IN A WEEK ..... 5 ONCE IN A WEEK ....... 6 MORE THAN ONCE IN WEEK ............... 7 IF 2 TO 7 GO TO 71
YES …1 NO………2
SKIP TO SEC 5
YES ……1 NO ………2 IF 2 SKIP TO SEC 5
YES ……1 NO ………2
OUT OF SKIP TO SEC 5

245
SECTION 4A IF ONLY ONE LIFETIME PARTNER AND IF THIS PARTNER IS HUSBAND/ COHABITING PARTNER,
FOLLOW THIS SECTION No. QUESTIONS AND FILTERS CODING CATEGORIES SKIP A69 How often do (did) you have sex with
your husband/ partner? RECORD VERBATIM
ONCE ONLY ......................1 A FEW TIMES ONLY................2 LESS THAN ONCE IN A MONTH .........................3 ONCE IN A MONTH ................4 MORE THAN ONCE IN A MONTH & LESS THAN ONCE IN A WEEK.......5 ONCE IN A WEEK..................6 MORE THAN ONCE IN WEEK .........7
74
A70 Have (did) you ever used (use) a condom with your husband/ partner?
YES ......................... 1 NO .......................... 2
74
A71 Out of the last 10 times (or less if they did not have sex 10 times) that you had sex with your husband/ partner, how many times did you use a condom? RECORD VERBATIM
‘X OUT OF Y TIMES’ OUT OF TIMES
74
SECTION 4B
IF ONLY ONE PARTNER AND IF THIS PARTNER IS NOT HUSBAND/ COHABITING PARTNER (I.E., IF RESPONDENT UNMARRIED) FOLLOW THIS SECTION No. QUESTIONS AND FILTERS CODING CATEGORIES SKIP B65 How old was this partner the first time
when you had sex? AGE IN COMPLETED YEARS..
B66 How long ago did you have sex with this partner for the first time? RECORD IN ‘DAYS’ IF IT IS LESS THAN A MONTH RECORD IN ‘MONTHS’ IF IT IS MORE THAN A MONTH OR LESS THAN ONE YEAR RECORD IN ‘YEARS’ IF IT IS ONE OR MORE YEARS
DAYS AGO …………………………..…1 MONTHS AGO…………………………….2 YEARS AGO…………………………………3
B67 Is the relationship with this person still continuing? ADJUST QUESTIONS B68 & B69 ACCORDING TO THIS ANSWER – PRESENT OR PAST TENSE
YES ......................... 1 NO .......................... 2 NO ANSWER ................. 99
B68 How often do (did) you have sex with this partner (during your relationship)? RECORD VERBATIM
ONCE ONLY ..................…..1 A FEW TIMES ONLY...............2 LESS THAN ONCE IN A MONTH ........................3 ONCE IN A MONTH ...............4 MORE THAN ONCE IN A MONTH & LESS THAN ONCE IN A WEEK ...............................5 ONCE IN A WEEK.................6 MORE THAN ONCE IN WEEK ........7
74
B69 Have (did) you ever used (use) a condom with this partner?
YES ......................... 1 NO .......................... 2
74
B70 Out of the last 10 times (or less if they did not have sex 10 times) that you had sex with this partner, how many times did you use a condom? RECORD VERBATIM
‘X OUT OF Y TIMES’ OUT OF TIMES

246
SECTION 5: MORE DETAILS ON RISKY SEXUAL BEHAVIOUR No. QUESTIONS AND FILTERS CODING CATEGORIES SKIP 74 Have you ever received payment for sex
with men?
YES ......................... 1 NO .......................... 2
81
75 How old were you when you first received payment for sex?
AGE IN YEARS…………………………
76 How many times did you receive payment for sex with men during the last year?
NUMBER OF TIMES…………….. IF MORE THAN ‘99’ CODE ‘96’.
77 How long ago was the last time you received payment for sex with a man? RECORD ‘DAYS AGO’ ONLY IF IT WAS LESS THAN A MONTH RECORD ‘MONTHS AGO’ IF IT WAS MORE THAN A MONTH BUT LESS THAN AN YEAR RECORD ‘YEARS AGO’ ONLY IF IT WAS ONE OR MORE YEARS AGO.
DAYS AGO…………..……………….1 MONTHS AGO………………………..2 YEARS AGO…………………..…….3
78 The last time you received payment for sex with a man, was a condom used?
YES ......................... 1 NO .......................... 2
79 Out of the last 10 times (or less if they did not have sex 10 times) that you received payment for sex with a man, how many times was a condom used? RECORD VERBATIM
‘X OUT OF Y TIMES’ OUT OF TIMES
80 IF ANSWER TO Q.79 IS 10/10, ASK: How long have you been using condoms every time you receive payment for sex with a man?
LESS THAN 6 MONTHS ...........1 MORE THAN 6 MONTHS ...........2 N/A, NOT CURRENTLY RECEIVING PAYMENT FOR SEX WITH MEN ....3 DON’T KNOW ..................98 NO ANSWER ...................99
81 Some people like to have sex in different ways such as oral, vaginal, anal. Have you ever had anal sex with a man (including your husband/ partner)?
YES ......................... 1 NO .......................... 2 DON’T KNOW ................. 98 NO ANSWER .................. 99
84
82 How long ago did you last have anal sex with a man (including your husband/ partner)? RECORD ‘DAYS AGO’ ONLY IF IT WAS LESS THAN A MONTH RECORD ‘MONTHS AGO’ IF IT WAS MORE THAN A MONTH BUT LESS THAN AN YEAR RECORD ‘YEARS AGO’ ONLY IF IT WAS ONE OR MORE YEARS AGO.
DAYS AGO…………..……………….1 MONTHS AGO………………………..2 YEARS AGO…………………..…….3
83 The last time you had anal intercourse with a man (including your husband/ partner), did you use a condom?
YES ......................... 1 NO .......................... 2 DON’T KNOW ................. 98

247
SECTION 6: KNOWLEDGE & HISTORY OF STI AND MEDICAL INJECTIONS
No. QUESTIONS AND FILTERS CODING CATEGORIES SKIP 84 Have you ever heard of any disease/
symptoms that can be transmitted through sexual intercourse?
YES ......................... 1 NO .......................... 2 DON’T KNOW ................. 98
85 If a woman has sexually transmitted infections, what symptoms might she have? MULTIPLE RESPONSES POSSIBLE FIRST RECORD ALL SPONTANEOUS ANSWERS, THEN PROBE FOR EACH THAT HAS NOT BEEN ANSWERED
A. SORES, ULCERS OR BLISTERS ON OR AROUND THE SEX ORGANS ………………………….
B. VAGINAL DISCHARGE ………………………………….. C. PAINFUL SWELLING OF THE
GROIN OR THE VAGINA …………………………… D. BURNING PAIN ON URINATION …………….. E. PAIN WHEN HAVING SEX …………………………. F. CHRONIC PAIN IN THE LOWER ABDOMEN G. OTHER ________________
(SPECIFY) H. NO SYMPTOMS ………………………………………………. I. DON’T KNOW
SPONTANEOUS AFTER PROBING YES YES NO D/K A. 1...........2.....3.....98 B. 1...........2.....3.....98 C. 1...........2.....3.....98 D. 1...........2.....3.....98 E. 1...........2.....3.....98 F. 1...........2.....3.....98 G. 1 H. 1...........2.....3.....98 I. 98
86 Have you ever suffered from:
A. VAGINAL DISCHARGE B. LOWER ABDOMINAL PAIN, WITHOUT
DIARRHOEA AND NOT DURING A PERIOD
C. GENITAL ULCER/ SORE
YES NOA. VAGINAL DISCHARGE …….. 1 2 B. LOWER ABDOMINAL PAIN, WITHOUT DIARRHOEA AND NOT DURING A PERIOD ………………………1 2 C. GENITAL ULCER/ SORE…………1 2 IF ONLY ONE SYMPTOM REPORTED IF ‘NO’ FOR ALL THEN SKIP
88 93
87 What was the most recent of these you have suffered from?
VAGINAL DISCHARGE ........... 1 LOWER ABDOMINAL PAIN, WITHOUT DIARRHOEA AND NOT DURING A PERIOD ............ 2 GENITAL ULCER/SORE .......... 3
88 How long ago was that? IF THE SYMPTOMS ARE CURRENT (I.E., IF IT IS ONLY DAYS AGO), REFERRAL CARD TO BE ISSUED TO THE RESPONDENT
DAYS AGO ……………….. 1 MONTHS AGO ……………..2 YEARS AGO ………………..3 DON’T KNOW ................. 98

248
No. QUESTIONS AND FILTERS CODING CATEGORIES SKIP 89 Did you get or take treatment for these
symptoms?
YES ......................... 1 NO .......................... 2 DON’T REMEMBER ............. 98
93 93
90 Where did you go for treatment? MULTIPLE RESPONSES POSSIBLE. SHOW LOGO OF ‘KEY’ CLINIC FOR THOSE ANSWERED FOR PRIVATE CLINIC/ DOCTOR TO CODE CORRECTLY IN PSI (KEY) CLINIC.
YES NO A. GOVT.CLINIC/HOSPITAL.1 2B. PRIVATE CLINIC/DOCTOR1 2C. PHARMACY …………………….. 1 2D. HOME REMEDY …………………. 1 2E. PSI (KEY) CLINIC ……..1 2F. OTHER________________1 (SPECIFY)
91 How long did you have the symptom(s) before you sought treatment?
DAYS……………. ……………….. 1 MONTHS …………..……………..2 YEARS ……..……………………….3 DON’T REMEMBER ............. 98
92 What medicine did you take? MULTIPLE RESPONSES POSSIBLE
YES NOA. INJECTION .............1 2 B. CAPSULE/ TABLETS ......1 2 C. TOPICAL OINTMENT / CREAM/ LOTION/PESSARY ...1 2 D. OTHER (SPECIFY)_______1 E. DON’T REMEMBER ........98
93 Has your husband/ partner ever suffered from sexually transmitted disease(s)? URETHRAL DISCHARGE GENITAL ULCER/SORE
YES NO N/A 1 2 3 1 2 3 IF ONLY ONE SYMPTOM REPORTED IF ‘NO’ OR ‘N/A’ FOR BOTH THEN SKIP
95 96
94 What was the most recent of these he has suffered from?
URETHRAL DISCHARGE............1GENITAL ULCER/SORE............2
95 How long ago was that? IF THE SYMPTOMS ARE CURRENT (I.E., IF IT IS ONLY DAYS AGO), REFERRAL CARD TO BE ISSUED TO THE RESPONDENT
DAYS AGO ……………….. 1 MONTHS AGO ……………..2 YEARS AGO ………………..3 DON’T KNOW ................. 98
96 Have you ever received, as an adult, an injection from a medical doctor, RMP or traditional medical practitioner?
YES ......................... 1 NO .......................... 2 DON’T REMEMBER ............. 98
100A

249
No. QUESTIONS AND FILTERS CODING CATEGORIES SKIP 97 From which of these types of
practitioners have you ever received injections? MULTIPLE RESPONSES POSSIBLE
YES NO A. MEDICAL DOCTOR .... 1 2 B. NURSE ............. 1 2 C. RMP ............... 1 2 D. TRADITIONAL MEDICAL PRACTITIONER ..... 1 2
98 Have you received such an injection in the last one year?
YES ......................... 1 NO .......................... 2 DON’T REMEMBER ............. 98
100A
99 How many such injections have you received in the last one year?
NUMBER OF TIMES…………………..
100 What did you receive these injections for? MULTIPLE RESPONSES POSSIBLE. DO NOT READ OUT RESPONSES. PROBE FOR HIV/AIDS.
YES NOA. WEAKNESS / ANAEMIA ………. 1 2 B. HEART DISEASE ………………….. 1 2 C. DIABETES …………………………………. 1 2 D. OTHER CHRONIC ILLNESS…..1 2 E. BODY ACHE …………………….. 1 2 F. FEVER/ INFECTION …… 1 2 G. HIV/ AIDS.………………………………..1 2 H. OTHER __________ 1 (SPECIFY)
SECTION 7: INFORMATION ON PERSONAL HABITS AND DRUG USE No. QUESTIONS AND FILTERS CODING CATEGORIES SKIP 101 Do you drink alcohol?
NEVER ....................... 1 OCCASIONALLY ................ 2 REGULARLY ................... 3
102 Do you smoke?
NEVER ....................... 1 OCCASIONALLY ................ 2 REGULARLY ................... 3
103 Some people like to inject drugs for fun or to get high. Have you ever injected illicit drugs?
YES ......................... 1 NO .......................... 2 NO ANSWER .................. 99
115
104 How old were you the first time that you injected illicit drugs?
AGE IN COMPLETED YEARS….

250
No. QUESTIONS AND FILTERS CODING CATEGORIES SKIP 105 Have you injected illicit drugs in the
last one year?
YES ......................... 1 NO .......................... 2 NO ANSWER .................. 99
107
106 How long ago (in years) was the last time you injected drugs?
YEARS AGO………………………………
115
107 In the last one year, how often did you inject? RECORD ONE OPTION ONLY:‘NUMBER OF TIMES PER WEEK’ OR‘NUMBER OF TIMES PER MONTH’ OR ‘NUMBER OF TIMES PER YEAR’
TIMES PER WEEK…………….1 TIMES PER MONTH.…………2 TIMES PER YEAR…..…….3
108 In the last one year, with whom did you inject? MULTIPLE RESPONSES POSSIBLE
YES NOA. REGULAR SEX PARTNER. 1 2 B. CLOSE FRIENDS………….…….1 2 C. PEOPLE YOU DON’T KNOW WELL ……………………………….1 2 D. PEOPLE YOU DON’T KNOW AT ALL ………………………….1 2 E. ALONE …………………………………….1 2 F. NO ANSWER ………………….. 99
109 Of those people with whom you injected in the last one year, with whom did you inject most often?
REGULAR SEX PARTNER ......... 1 CLOSE FRIENDS ............... 2 PEOPLE YOU DON’T KNOW WELL .. 3 PEOPLE YOU DON’T KNOW AT ALL 4 ALONE ....................... 5 NO ANSWER .................. 99
110 Out of every 10 times that you injected during the last one year (OR LESS IF INJECTED LESS THAN 10 TIMES IN THE LAST ONE YEAR), how many times did you inject with a needle that had already been used by somebody else?
NONE ........................ 1 LESS THAN 1/10 TIMES ........ 2 ____ TIMES / 10 TIMES ..... 3 DON’T REMEMBER ............. 98
115
111 In the last one year, with whom did you share needles/ syringes? MULTIPLE RESPONSES POSSIBLE
YES NOA. REGULAR SEX PARTNER. 1 2 B. CLOSE FRIENDS…………….….1 2 C. PEOPLE YOU DON’T KNOW WELL ……………………………….1 2 D. PEOPLE YOU DON’T KNOW AT ALL ………………………….1 2 E. ALONE ………………………………….…1 2 F. NO ANSWER ………………….. 99

251
No. QUESTIONS AND FILTERS CODING CATEGORIES SKIP 112 Of those people with whom you shared
needles/ syringes in the last one year, with whom did you share needles/ syringes most often?
REGULAR SEX PARTNER ......... 1 CLOSE FRIENDS ............... 2 PEOPLE YOU DON’T KNOW WELL .. 3 PEOPLE YOU DON’T KNOW AT ALL 4 ALONE ....................... 5 NO ANSWER .................. 99
113 When you inject with a syringe that has previously been used by someone else, how often do you clean it before you use it?
NEVER ....................... 1 SOMETIMES ................... 2 OFTEN ....................... 3 ALWAYS ...................... 4
115
114 How do you clean the syringe?
WASH WITH COLD WATER ........ 1 WASH WITH BOILING WATER ..... 2 WASH WITH BLEACH ............ 3 OTHER ______________________ 4
SECTION 8: KNOWLEDGE AND ATTITUDE TOWARDS HIV/AIDS
QUESTIONS AND FILTERS CODING CATEGORIES SKIP 115 Have you ever heard of a disease known
as HIV/AIDS? PROBE FOR ANSWERS ‘NO’, DON’T KNOW’ AND ‘NO ANSWER’.
YES ......................... 1 NO .......................... 2 DON’T KNOW ................ 98 NO ANSWER ................. 99
137
116 From which sources of information have you learned about HIV/AIDS? MULTIPLE RESPONSES POSSIBLE
YES NO A. RADIO ………………………………. 1 2 B. TELEVISION ………………….. 1 2 C. CINEMA …………………………….. 1 2 D. NEWSPAPERS/MAGAZINES 1 2 E. POSTERS/HOARDINGS .. 1 2 F. EXHIBITION/MELA …….. 1 2 G. ADULT EDUCATION PROGRAM ………………………………. 1 2 H. HEALTH WORKER/ANM .. 1 2 I. NGO WORKER ………………….. 1 2 J. ANGANWADI WORKER ….. 1 2 K. AIDS COUNSELOR ……….. 1 2 L. FRIEND/NEIGHBOR/ COLLEAGUE ……………….. 1 2 M. SEXUAL PARTNER …………. 1 2 N. COMMUNITY MEETINGS . 1 2 O. WORKPLACE …………………….. 1 2 P. SCHOOLS/TEACHERS ….. 1 2 Q. RELIGIOUS LEADERS .. 1 2 R. POLITICAL LEADERS …. 1 2 S. OTHER_______________1 (SPECIFY) T. DON'T KNOW 98

252
No. QUESTIONS AND FILTERS CODING CATEGORIES SKIP 117 Do you know how HIV/AIDS is
transmitted? MULTIPLE RESPONSES POSSIBLE FIRST RECORD ALL SPONTANEOUS ANSWERS, THEN PROBE FOR EACH THAT HAS NOT BEEN ANSWERED
A. UNPROTECTED INTERCOURSE B. BLOOD TRANSFUSION C. MOTHER TO CHILD D. MOSQUITO BITES E. SHAKING HANDS F. SWIMMING OR BATHING G. SHARING MEALS H. SHARING OF SHAVING SETS I. SHARING NEEDLES/ SYRINGES J. SALIVA K. TEARS L. TOUCHING/ HUGGING M. KISSING N. OTHER (SPECIFY)________________
SPONTANEOUS AFTER PROBING YES YES NO D/K A. 1 ............2.....3.....98 B. 1 ............2.....3.....98 C. 1 ............2.....3.....98 D. 1 ............2.....3.....98 E. 1 ............2.....3.....98 F. 1 ............2.....3.....98 G. 1 ............2.....3.....98 H. 1 ............2.....3.....98 I. 1 ............2.....3.....98 J. 1 ............2.....3.....98 K. 1 ............2.....3.....98 L. 1 ............2.....3.....98 M. 1 ............2.....3.....98 N. 1
118 Do you yourself feel you are at risk of being infected with HIV?
YES ......................... 1 NO .......................... 2 DON’T KNOW ................ 98 NO ANSWER ................. 99
120
119 Why do you feel you are at risk of being infected with HIV? MULTIPLE RESPONSES POSSIBLE
YES NOA. DOESN’T USE CONDOMS. 1 2 B. HAS MORE THAN ONE SEX PARTNER ………………….. 1 2 C. OTHER ______________ 1 (SPECIFY) D. NO ANSWER ……………………. 99
120 Can you know whether a person has HIV (the virus that causes AIDS) by looking at him/her?
YES ......................... 1 NO .......................... 2 DON’T KNOW ................ 98 NO ANSWER ................. 99
121 Are there ways a person can prevent himself or herself getting infected with HIV?
YES ......................... 1 NO .......................... 2 DON’T KNOW ................ 98 NO ANSWER ................. 99
123

253
No. QUESTIONS AND FILTERS CODING CATEGORIES SKIP 122 What are the ways a person can prevent
himself or herself becoming infected with HIV? FIRST RECORD ALL SPONTANEOUS ANSWERS, THEN PROBE FOR EACH THAT HAS NOT BEEN ANSWERED
A. TAKE MEDICINE/ HERBAL MIXTURE BEFORE HAVING SEXUAL INTERCOURSE
B. ALWAYS USE CONDOMS WHILE ENGAGING IN SEX
C. AVOID THE USE OF SHARED INJECTION NEEDLES
D. DON’T SHARE CLOTHES OR EATING UTENSILS
E. AVOID MOSQUITO / INSECTS BITES
F. EAT NUTRITIOUS FOOD G. ONLY HAVE SEX WITH ONLY ONE
FAITHFUL PARTNER H. OTHER ___________________
(SPECIFY)
SPONTANEOUS AFTER PROBING YES YES NO D/K A. 1 ............2.....3.....98 B. 1 ............2.....3.....98 C. 1 ............2.....3.....98 D. 1 ............2.....3.....98 E. 1 ............2.....3.....98 F. 1 ............2.....3.....98 G. 1 ............2.....3.....98 H. 1
123 Do you personally know a person or persons (who also knows you) infected with HIV or who suffers from AIDS or has died of AIDS?
YES ......................... 1 NO .......................... 2 NO ANSWER ................. 99
126 126
124 What (is / was) this person’s/ these people’s relationship with you? MULTIPLE RESPONSES POSSIBLE
YES NOHUSBAND/ COHABITING PARTNER ............. 1 2 BOYFRIEND/ FIANCÉ ..... 1 2 FAMILY MEMBER ........ 1 2 PERSON FROM THE SAME AREA ................ 1 2 FRIEND/ KNOWN PERSON .. 1 2 OTHER (SPECIFY)_________1
125 Have you changed your behaviour as a result of knowing this (these) person(s) (who has (have) HIV/AIDS or who died from AIDS?)
YES ......................... 1 NO .......................... 2 NEVER HAD SEX ............... 3 NO ANSWER ................. 99
127 128
126 Have you changed your behaviour as a result of knowing about HIV/AIDS?
YES ......................... 1 NO .......................... 2 NEVER HAD SEX .............. 3 NO ANSWER ................. 99
128

254
No. QUESTIONS AND FILTERS CODING CATEGORIES SKIP 127 In what ways you have changed your
behaviour after knowing about HIV/AIDS? RECORD ALL MENTIONED
YES NO A. TAKE MEDICINE/ HERBAL MIXTURE BEFORE HAVING SEXUAL INTERCOURSE……………………………….. 1 2 B. USE CONDOMS MORE OFTEN WHILE ENGAGING IN SEX …………………….. 1 2 C. SHARE ILLICIT DRUG INJECTION NEEDLES LESS OFTEN…………………….1 2 D. SHARE CLOTHES OR EATING UTENSILS LESS OFTEN.1 2 E. AVOID MOSQUITO/ INSECTS BITES …………………………………….. 1 2 F. EAT MORE NUTRITIOUS FOOD ……………………………………… 1 2 G. HAVE LESS SEXUAL PARTNERS ………………………………………. 1 2 H. ONLY HAVE SEX WITH ONE FAITHFUL PARTNER ……………….. 1 2 I. HAVE SEX LESS OFTEN…….. 1 2 J. OTHER ________________ 1 (SPECIFY)
128 Do you know where people can go to get a confidential test to find out if they have been infected with HIV? By confidential I mean that no one else besides you will know the results of your test unless you want them to know.
YES ......................... 1 NO .......................... 2 NO ANSWER ................. 99
129 Have you ever taken an HIV test?
YES ......................... 1 NO .......................... 2 DON’T KNOW ................ 98 NO ANSWER ................. 99
134
130 When did you last take an HIV test? RECORD APPROPRIATELY
WEEKS AGO…………………………..1 MONTHS AGO………………………..2 YEARS AGO…………………..…….3 NO ANSWER ................. 99
131 Did you take that last test at your own request?
YES ......................... 1 NO .......................... 2 DON’T KNOW ................ 98 NO ANSWER ................. 99
132 Did you have counselling when you took the last HIV test?
YES ......................... 1 NO .......................... 2 DON’T KNOW ................ 98 NO ANSWER ................. 99

255
No. QUESTIONS AND FILTERS CODING CATEGORIES SKIP 133 Do you know the result of the test you
took? IMPORTANT: EXPLAIN THAT THE INTERVIEWER DOESN’T WANT TO KNOW THE TEST RESULT
YES ......................... 1 NO .......................... 2 NO ANSWER ................. 99
134 Do you know whether or not there is treatment available that could prolong the life / alleviate the suffering of people with AIDS?
YES ......................... 1 NO .......................... 2 DON’T KNOW ................ 98 NO ANSWER ................. 99
135 If there were treatment available that could prolong the life / alleviate the suffering of people with AIDS, do you think people would change their behaviour?
YES ......................... 1 NO .......................... 2 DON’T KNOW ................ 98 NO ANSWER ................. 99
137
136 If yes, how? RECORD ALL MENTIONED
YES NO A. USE CONDOMS LESS OFTEN WHEN HAVING SEX...1 2 B. SHARE INJECTION NEEDLES MORE OFTEN …...1 2 C. HAVE MORE SEXUAL PARTNERS …………………………..1 2 D. HAVE SEX MORE OFTEN..1 2 E. OTHER _____________ 1 (SPECIFY)
137 Have you ever heard of “KEY” clinics? SHOW THE LOGO OF ‘KEY’ CLINICS AND PROBE.
YES ........................ 1 NO ......................... 2
139
138 Have you ever visited these clinics for STI treatments?
YES ........................ 1 NO ......................... 2
139 Have you heard of ‘Namma’ clinic run by KHPT in Mysore?
YES ........................ 1 NO ......................... 2
141
140 Have you ever gone to this clinic?
YES ........................ 1 NO ......................... 2
141 Are you aware of any HIV/AIDS programmes in this area?
YES ........................ 1 NO ......................... 2
SEC 9
142 What programmes do you know about? IF CAN’T SAY; PROBE
Hrs Minutes TIME ENDED…….

256
SECTION 9: REPORT ON BIOLOGICAL SAMPLE COLLECTION
The interview is over. I thank you for your patience and cooperation in answering these questions. This information will be very valuable for understanding the spread of HIV/AIDS in this area and to plan suitable programs accordingly. Now a nurse/ health investigator will take samples of your blood and urine to test for HIV and STIs. For Health Investigator to fill up Biological samples collected
A Blood Yes ……….1 No……. 2 Skip to B
If Yes DBS ……….1 Venipuncture………..2
B Urine Yes………….1 No …….2
********************* END **********************

257
PBS Questionnaire Session: _________________ Team members’ Codes: 1. Date: ___________________ 2.
Unmarried females
1. Have you ever heard of HIV/AIDS?
2. Have you had a problem with a white vaginal discharge in the past one year?
3. Have you had ulcers or sores in the genital area in the past one year?
4. Have you ever seen a condom?
5. Have you ever had sex with a man?
6. Have you had sex with a man in the past one year?
7. Have you ever received payment for sex with a man?
8. Have you received payment for sex with a man in the past one year?
9. Some people like to have sex in different ways - have you ever had anal sex?
10. Has any man ever used a condom with you during sex?
11. Last time you had sex, did the man use a condom with you?
12. Last time you received payment for sex with a man, was a condom used?
13. Some people have tried injecting drugs for fun or to get high – have you ever injected illicit drug yourself for fun or to get high?
14. Have you ever taken an HIV test?

258
Unmarried Males 1. Have you ever heard of HIV/AIDS?
2. Have you had a problem of a genital ulcer / sore during the past one year?
3. Have you had a problem of burning urination or urethral discharge during the past one year?
4. Have you ever seen a condom?
5. Have you ever had sex with a woman?
6. Have you ever had sex with a commercial sex worker (CSW)?
7. Have you had sex with a CSW in the past one year?
8. Have you ever used a condom during sex with a CSW?
9. Did you use a condom the last time you had sex with a CSW?
10. Have you ever taken an HIV test?
11. Have you ever had sex with a woman who is not a CSW?
12. Have you had sex with a woman who is not a CSW in the past one year?
13. Have you ever used a condom during sex with a woman who is not a sex worker?
14. Did you use a condom the last time you had sex with a woman who is not a sex worker?
15. Some people like to have sex in different ways – have you ever had anal sex with a man?
16. Some people have tried injecting drugs for fun or to get high – have you ever injected illicit drug
yourself for fun or to get high?

259
Married/ cohabiting females 1. Have you ever heard of HIV/AIDS?
2. Have you had a problem with a white vaginal discharge in the past one year?
3. Have you had a problem with ulcers / sores in the genital area in the past one year?
4. Have you ever seen a condom?
5. Have you ever had sex with a man other than your husband/ partner?
6. Have you had sex with a man other than your husband/ partner since your marriage?
7. Have you had sex with a man other than your husband/ partner in the past one year?
8. Have you ever received payment for sex with a man?
9. Have you received payment for sex with a man in the past one year?
10. Some people like to have sex in different ways - have you ever had anal sex with a man
(including your husband or partner)?
11. Has your husband/ partner ever used a condom with you during sex?
12. Last time you had sex with your husband/ partner, was a condom used?
13. Last time you received payment for sex with a man, was a condom used?
14. Some people have tried injecting drugs for fun or to get high – have you ever injected illicit drug yourself for fun or to get high?
15. Have you ever taken an HIV test?
16. Do you think your husband/ partner ever had sex with any person other than yourself since you were married?
17. Do you think your husband/ partner ever had sex with commercial sex workers?

260
Married/ cohabiting males
1. Have you ever heard of HIV/AIDS? 2. Have you had a problem of burning urination or urethral discharge during the past one year?
3. Have you had a problem with ulcers / sores in the genital area in the past one year?
4. Have you ever seen a condom?
5. Have you ever had sex with a woman other than your wife/ partner?
6. Have you had sex with a woman other than your wife/ partner since your marriage?
7. Have you had sex with a woman other than your wife/ partner in the past year?
8. Have you ever had sex with a commercial sex worker (CSW)?
9. Have you had sex with a commercial sex worker in the past one year?
10. Some people like to have sex in different ways - have you ever had anal sex with a woman
(including your wife or partner)?
11. Have you ever used a condom during sex with your wife/ partner?
12. Last time you had sex with your wife/ partner, did you use a condom?
13. Have you ever used a condom during sex with CSWs?
14. Did you use a condom the last time you had sex with a CSW?
15. Do you think your wife/ partner ever had a sex with any person other than yourself since you were married?
16. Some men like to have sex with other men. Have you ever had anal sex with a man?
17. The last time you had anal sex with a man, was a condom used?
18. Some people have tried injecting drugs for fun or to get high – have you ever injected illicit drug yourself for fun or to get high?
19. Have you ever taken an HIV test?

APPENDIX D Project Team

262

263
CHARME Team Members
Sr. No. Name Title 1 Dr Michel Alary Principal Investigator 2 Ms. Jan Bradley Resident Executive Director 3 Dr Catherine Lowndes Scientific Coordinator 4 Dr Lilani Kumaranayake Co-investigator 5 Dr Marie Claude Boily Co-investigator 6 Dr Peter Vickerman Co-investigator 7 Dr Stephen Moses Co-investigator 8 Dr James Blanchard Co-investigator 9 Dr Sushena Reza Paul Co-investigator 10 Dr Reynold Washington Co-investigator 11 Dr B M Ramesh Co-investigator 12 Dr. Charlote Watts Co-investigator 13 Dr A A Jayachandran Resident Deputy Director 14 Dr Sudhashree Chandrasekhar Consultant - Economist 15 Dr S Rajaram Senior Monitoring & Evaluation Officer 16 Mr Bhaskar Reddy Research Associate 17 Mr Govindraj Program Associate 18 Ms. Anu Raga Mahalingashetty Research Associate 19 Dr. Kaveri Gurav Consultant 20 Mr.Bidhubhusan Mahapatra Data Manager- Statistician 21 Ms Padmini K R Finance/ Accounts 22 Ms. Sapna . A Admin Assistant 23 Mr Gurumurthy U H Admin Assistant
IPHCR, St. Johns' Medical College Staff
24 Dr Reynold Washington Professor of Infectious Disease and Co-principal Investigator
25 Dr Pradeep B S Assistant Professor of Infectious Diseases and Project Coordinator
25 Mr Kevin Mendonca Microbiologist & Lab Coordinator 26 Mr Rajesh Kumar Anand Lab Technician 27 Ms Padma Lab Technician 28 Ms Rekha R Lab Technician 29 Mr Fazil Lab Technician 30 Mr Ramachandra Admin Assistant and Data Entry Operator 31 Ms Vijetha Data Entry Operator 32 Ms Gnaneshwari B R Data Entry Operator 33 Mr Suresh G Data Entry Operator 34 Mr Alisab Data Entry Operator

264
IPHCR, St. Johns' Medical College Staff
Sr. No. Name Title 35 Ms Mubeen Taj Data Entry Operator 36 Ms Ramya K N Data Entry Operator 37 Ms Ambika C Data Entry Operator 38 Mr Dinesh Courier Boy
Rotary - TTK Blood Bank, Bangalore Medical Services Trust & Research Institute Staff
39 Dr Latha Jagannathan Medical Director & Managing Trustee 40 Dr Sanjana Mudaliar Medical Microbiologist and Lab Coordinator 41 Mrs Elsy Mathew Microbiologist and Lab technician
Field staff
42 Mr H.S.Sridhar Rangareddy Field supervisor 43 Mr T.G.Sreenivas Field supervisor 44 Mr Chidanandaswamy Field supervisor 45 Mr Ramakrishna.C. Field supervisor 46 Mr Harish.K. Field supervisor 47 Ms Manjula.M.L. Female Investigator 48 Ms Shantha.A.S. Female Investigator 49 Ms Jyothi Female Investigator 50 Ms H.S.Sheela Female Investigator 51 Ms Bhanumathi.C. Female Investigator 52 Ms Deivani Female Investigator 53 Ms Kavitha.M.E. Female Investigator 54 Ms Kamalakshi.C.H. Female Investigator 55 Ms Prathibha.H.P Female Investigator 56 Ms Savithramma.H.S. Female Investigator 57 Ms Jayashree Female Investigator 58 Ms Chandrakalabai Female Investigator 59 Ms Parvathi Female Investigator 60 Ms V.Jyothi Female Investigator 61 Ms Savithramma.T.K. Female Investigator 62 Ms Nagaveni.Y. Female Investigator 63 Mr Prasad.H.D. Male Investigator 64 Mr Devaraju.H. Male Investigator 65 Mr Gangaraju.K.S. Male Investigator 66 Mr Nandishkumar.M.B. Male Investigator 67 Mr Ramu.B.M. Male Investigator 68 Mr Rajashekar.H.T. Male Investigator 69 Mr Sandeep Aradhya.H.C. Male Investigator

265
Field staff
Sr. No. Name Title 70 Mr Yashawantha.B. Male Investigator 71 Mr Vinayakumar.A.S. Male Investigator 72 Mr Shivashankar.L.D. Male Investigator 73 Mr M.N.Kumar Male Investigator 74 Mr G.P.Krishna Male Investigator 75 Mr M.Nagesh Male Investigator 76 Mr D.G.Srinivas Male Investigator 77 Mr B.S.Rajendra Male Investigator 78 Mr Rajkumar Male Investigator 79 Mr Mahadevaswamy Male Investigator 80 Mr Channa Mallikarjuna Male Investigator 81 Mr Chandrashekar.C. Male Investigator 82 Mr S.Pradeepkumar Laboratory Technician 83 Mr Prakash.M.S. Laboratory Technician 84 Mr Thippeswamy.T. Laboratory Technician 85 Mr T.Mallaiah Laboratory Technician 86 Mr Ningesh Laboratory Technician 87 Mr Srikanth Laboratory Technician 88 Mr Shekarappa Laboratory Technician 89 Mr Manohar Laboratory Technician 90 Mr Thippeshappa B Laboratory Technician