Hindustan Unilever - result update-Jan-13-EDELbreport.myiris.com/ES1/HINLEVER_20130122.pdfHUL has...
18
Edelweiss Research is also available on www.edelresearch.com, Bloomberg EDEL <GO>, Thomson First Call, Reuters and Factset. Edelweiss Securities Limited Hindustan Unilever’s (HUL) Q3FY13 sales and PAT were in line with our estimates. Key positives include: (1) revival in beverages portfolio led by tea, which gained share due to innovations and inflationary scenario; (2) second quarter of recovery in oral care; and (3) recovery in personal products (PP) margins and CSD sales. Key negatives were: (1) dip in soaps & detergents (S&D) EBIT margin due to step up in A&P (due to new launch of Lifebuoy and GCPL’s Cinthol relaunch); (2) moderation in volume growth to 5% YoY (on base of 9.1% YoY) due to slowdown in discretionary segment of personal care and foods; and (3) increase in royalty from current 1.4% to 3.15% by March 2018 (lower than Indonesia’s increase from 3.5% to 8.0%). The increase in royalty and tax implies that HUL will post earnings CAGR of ~9.8% in FY13-15E versus ~24.9% in FY11-13E. With the stock trading at 29.4x FY14E P/E, we downgrade to ‘REDUCE’ from ‘HOLD’. Royalty hike takes the sheen away HUL has hiked royalty payments to its parent Unilever from February 2013 from 1.4% of turnover to 3.15% in a phased manner till 2018. This increase comes at a time when: (a) HUL reported its slowest volume growth in 12 quarters; and (b) increase in tax by 200bps in FY14E and 250bps in FY15E. However, new products from Unilever have 60bps higher gross margin and sales are growing at 6x HUL and will see a step up. Volume growth moderates; slowdown in discretionary segment HUL’s like-to-like revenue (excluding exports business) grew 15.7% YoY in Q3FY13. S&D sales rose 19.8% YoY. PP sales (up 13% YoY) continued to be impacted by price hike in Fair & Lovely sachets (from INR7 to INR8). Beverages posted a strong 18.2% YoY growth. Outlook and valuations: Royalty overhang; downgrade to ‘REDUCE’ We continue to like HUL’s revenue growth from a medium to long term perspective. Also, palm oil correction will benefit S&D gross margin over the medium term. However, with the stock trading at 29.4x FY14E P/E and slowdown in earnings due to royalty and taxes, we downgrade our recommendation to ‘REDUCE’ from ‘HOLD’ and rate it ‘Sector Underperformer’. RESULT UPDATE HINDUSTAN UNILEVER Royalty spoils the show EDELWEISS 4D RATINGS Absolute Rating REDUCE Rating Relative to Sector Underperformer Risk Rating Relative to Sector Low Sector Relative to Market Underweight MARKET DATA (R: HLL.BO, B: HUVR IN) CMP : INR 481 Target Price : INR 458 52-week range (INR) : 572 / 369 Share in issue (mn) : 2,162.0 M cap (INR bn/USD mn) : 1,040 / 19,323 Avg. Daily Vol.BSE/NSE(‘000) : 2,388.7 SHARE HOLDING PATTERN (%) Current Q2FY13 Q1FY13 Promoters * 52.5 52.5 52.5 MF's, FI's & BK’s 9.0 9.0 9.9 FII's 21.1 21.1 20.1 Others 17.4 17.4 17.6 * Promoters pledged shares (% of share in issue) : NIL PRICE PERFORMANCE (%) Stock Nifty EW Consumer Goods Index 1 month (8.8) 3.4 4.9 3 months (14.3) 5.8 13.5 12 months 24.8 19.8 45.0 Abneesh Roy +91 22 6620 3141 [email protected] Hemang Gandhi +91 22 6620 3148 [email protected] Pooja Lath +91 22 6620 3075 [email protected] India Equity Research| Consumer Goods January 22, 2013 Financials (INR mn) Year to March Q3FY13 Q3FY12 % change Q2FY13 % change FY12 FY13E FY14E Total op. inc 66,548 59,555 11.7 63,108 5.5 234,363 267,567 301,771 EBITDA 10,888 9,705 12.2 9,767 11.5 34,836 40,522 44,882 Core profit 8,786 7,662 14.7 8,053 9.1 26,865 32,242 35,557 Dil. EPS (INR) 4.1 3.5 14.6 3.7 9.1 12.4 14.8 16.4 Diluted P/E (x) 38.8 32.4 29.4 EV/EBITDA (x) 28.6 24.3 21.7 ROAE (%) 83.4 75.0 64.9 * Quarterly nos. standalone; annual nos. consolidated
Transcript of Hindustan Unilever - result update-Jan-13-EDELbreport.myiris.com/ES1/HINLEVER_20130122.pdfHUL has...

Edelweiss Research is also available on www.edelresearch.com,
Bloomberg EDEL <GO>, Thomson First Call, Reuters and Factset.
Edelweiss Securities Limited
Hindustan Unilever’s (HUL) Q3FY13 sales and PAT were in line with our
estimates. Key positives include: (1) revival in beverages portfolio led by
tea, which gained share due to innovations and inflationary scenario; (2)
second quarter of recovery in oral care; and (3) recovery in personal
products (PP) margins and CSD sales. Key negatives were: (1) dip in
soaps & detergents (S&D) EBIT margin due to step up in A&P (due to new
launch of Lifebuoy and GCPL’s Cinthol relaunch); (2) moderation in
volume growth to 5% YoY (on base of 9.1% YoY) due to slowdown in
discretionary segment of personal care and foods; and (3) increase in
royalty from current 1.4% to 3.15% by March 2018 (lower than
Indonesia’s increase from 3.5% to 8.0%). The increase in royalty and tax
implies that HUL will post earnings CAGR of ~9.8% in FY13-15E versus
~24.9% in FY11-13E. With the stock trading at 29.4x FY14E P/E, we
downgrade to ‘REDUCE’ from ‘HOLD’.
Royalty hike takes the sheen away
HUL has hiked royalty payments to its parent Unilever from February 2013 from 1.4% of
turnover to 3.15% in a phased manner till 2018. This increase comes at a time when: (a)
HUL reported its slowest volume growth in 12 quarters; and (b) increase in tax by 200bps
in FY14E and 250bps in FY15E. However, new products from Unilever have 60bps higher
gross margin and sales are growing at 6x HUL and will see a step up.
Volume growth moderates; slowdown in discretionary segment
HUL’s like-to-like revenue (excluding exports business) grew 15.7% YoY in Q3FY13. S&D
sales rose 19.8% YoY. PP sales (up 13% YoY) continued to be impacted by price hike in
Fair & Lovely sachets (from INR7 to INR8). Beverages posted a strong 18.2% YoY growth.
Outlook and valuations: Royalty overhang; downgrade to ‘REDUCE’
We continue to like HUL’s revenue growth from a medium to long term perspective. Also,
palm oil correction will benefit S&D gross margin over the medium term. However, with
the stock trading at 29.4x FY14E P/E and slowdown in earnings due to royalty and taxes,
we downgrade our recommendation to ‘REDUCE’ from ‘HOLD’ and rate it ‘Sector
Underperformer’.
RESULT UPDATE
HINDUSTAN UNILEVER Royalty spoils the show
EDELWEISS 4D RATINGS
Absolute Rating REDUCE
Rating Relative to Sector Underperformer
Risk Rating Relative to Sector Low
Sector Relative to Market Underweight
MARKET DATA (R: HLL.BO, B: HUVR IN)
CMP : INR 481
Target Price : INR 458
52-week range (INR) : 572 / 369
Share in issue (mn) : 2,162.0
M cap (INR bn/USD mn) : 1,040 / 19,323
Avg. Daily Vol.BSE/NSE(‘000) : 2,388.7
SHARE HOLDING PATTERN (%)
Current Q2FY13 Q1FY13
Promoters *
52.5 52.5 52.5
MF's, FI's & BK’s 9.0 9.0 9.9
FII's 21.1 21.1 20.1
Others 17.4 17.4 17.6
* Promoters pledged shares
(% of share in issue)
: NIL
PRICE PERFORMANCE (%)
Stock Nifty
EW Consumer
Goods Index
1 month (8.8) 3.4 4.9
3 months (14.3) 5.8 13.5
12 months 24.8 19.8 45.0
Abneesh Roy
+91 22 6620 3141
Hemang Gandhi
+91 22 6620 3148
Pooja Lath
+91 22 6620 3075
India Equity Research| Consumer Goods
January 22, 2013
Financials (INR mn)
Year to March Q3FY13 Q3FY12 % change Q2FY13 % change FY12 FY13E FY14E
Total op. inc 66,548 59,555 11.7 63,108 5.5 234,363 267,567 301,771
EBITDA 10,888 9,705 12.2 9,767 11.5 34,836 40,522 44,882
Core profit 8,786 7,662 14.7 8,053 9.1 26,865 32,242 35,557
Dil. EPS (INR) 4.1 3.5 14.6 3.7 9.1 12.4 14.8 16.4
Diluted P/E (x) 38.8 32.4 29.4
EV/EBITDA (x) 28.6 24.3 21.7
ROAE (%) 83.4 75.0 64.9
* Quarterly nos. standalone; annual nos. consolidated

Consumer Goods
2 Edelweiss Securities Limited
HUL Q3FY13 concall: Key highlights
Volume growth: HUL’s domestic consumer business grew 15% YoY with a volume growth of
5% YoY (lowest growth in 12 quarters) on a base of 9.1% YoY growth in Q3FY12. Volume
growth was lower due to: (1) price hike in Fair & Lovely sachet from INR7 to INR8 (will take a
few more months to pan out); (2) price hikes in Dove sachets from INR1.0 to INR1.5; (3) soft
quarter for Wheel; and (4) slowdown in modern trade due to store closures.
Soaps & detergents: S&D grew 19.8% YoY. EBIT margin contracted 102bps YoY to 12.4%
because of a significant step up in investments through A&P. However, the category’s gross
margin expanded YoY. With lower commodity prices, the tendency of local players re-
entering the segment increases. The laundry portfolio posted a strong performance across
most formats, with both Surf and Rin registering double digit volume growth. Surf growth
was aided by the Easy Wash launch, and Rin growth can be attributed to bars. However,
Wheel faced issues, leading to slowdown. But, HUL has taken actions to correct this.
Household care portfolio registered robust growth led by Vim. Skin cleansing continued
good growth momentum. Lifebuoy, Dove and Lux registered strong growth. The liquids
portfolio was extended with the introduction of the Lifebuoy Colour Changing Handwash.
Personal products: Personal products grew at 13% YoY. Margin improved 142bps YoY to
28.3%. Skin care growth was broad based; robust growth was seen particularly in creams
with Ponds Age Miracle and in lotions with Vaseline and Dove. Hair care portfolio delivered
strong growth led by premium formats. The initial results on TRESemmé have been positive
with gains in the first three months of launch across all channels. The portfolio was
extended with the launch of the Dove Elixir range of premium hair oils and a new styling
range for men under Brylcreem. Oral care grew in double digits YoY (largely volume led) led
by robust growth in Close Up and Pepsodent brand.
Beverages: Beverages grew 18.2% YoY with tea business delivering one of its strongest
quarters with double digit growth across all brands at the premium and popular ends.
Margin catapulted 203bps YoY to 17.7%. In tea business, extend distribution, impactful
activation and continued market development of tea bags helped deliver high growth. Tea
bags is a small category, growing strong and a future growth driver. In coffee, Bru sustained
growth momentum with premium offerings continuing to perform well.
Packaged foods: Packaged foods business grew 7.7% YoY, and margin improved 115bps YoY
as losses were curbed by INR34mn to INR26mn. Kissan Ketchup maintained double digit
growth while growth accelerated in the Knorr soups portfolio. Actions were taken to
manage the pipeline to prepare for the relaunch of Soupy Noodles with a superior mix at the
end of the quarter. Kwality Walls registered moderate growth, impacted by slowdown in
discretionary spending.
Water business: Pureit posted good growth despite slowdown in consumer durables market
in India. The newly launched ‘Marvella UV’ & ‘Advanced’ were received well by consumers.
Royalty: HUL hiked royalty payments to parent Unilever for the provision of technology,
trade mark licence and other services. The company board approved the royalty of 3.15% of
turnover effective from February 2013 from the current 1.4%. HUL will increase the
payment in a phased manner till March 2018. Taking this into account, the royalty for FY14
will stand at 1.9%, up 50bps from the current level.

Hindustan Unilever
3 Edelweiss Securities Limited
Discretionary slowdown: HUL has witnessed some slowdown in growth in discretionary
categories. However, management is positive on the outlook, banking on premiumisation
over the long term.
Modern trade: Growth has slowed down in modern trade due to a slowdown in pace of
store expansion and net store closure.
CSD: CSD business recovered in Q3FY13; but difficult to say if it is trend reversal. However,
the recovery was offset by slow growth in modern trade channels.
New products do well, focus remains on innovation: Q3FY13 has been an innovation
intensive quarter. The company launched Lifebuoy Color Changing Handwash, Dove Elixir
precious hair oils, Sunsilk perfect straight shampoo, Vaseline GermSafe healthy skin jelly,
Brylcreem hair styling range for men and relaunched Knorr Soupy Noodles. We believe HUL’s
focus on keeping the consumer enthused with new and improved offerings will keep it a
step ahead of competition.
Raw material scenario: Raw material scenario has been volatile over the past quarter—
Brent has remained stable, forex has been volatile, PFAD is softening and tea prices have
been soaring.
Tax rate: Management has guided tax rate for operations in FY13 at 24.5%; FY14 to be at
26.5%. FY15 tax is likely to inch up further to full tax rate at 29-33%. However, more clarity
is awaited and will also depend on the direct tax code.
Chart 1: Volume growth tapering
Source: Company, Edelweiss research
0.0
3.4
6.8
10.2
13.6
17.0
Q1
FY1
0
Q2
FY1
0
Q3
FY1
0
Q4
FY1
0
Q1
FY1
1
Q2
FY1
1
Q3
FY1
1
Q4
FY1
1
Q1
FY1
2
Q2
FY1
2
Q3
FY1
2
Q4
FY1
2
Q1
FY1
3
Q2
FY1
3
Q3
FY1
3
(HU
L v
olu
me
gro
wth
%)

Consumer Goods
4 Edelweiss Securities Limited
Chart 2: A&P as % of sales increased YoY
Chart 3: Gross margin decline YoY
Source: Company, Edelweiss research
0.0
3.5
7.0
10.5
14.0
17.5
Q1FY10
Q2FY10
Q3FY10
Q4FY10
Q1FY11
Q2FY11
Q3FY11
Q4FY11
Q1FY12
Q2FY12
Q3FY12
Q4FY12
Q1FY13
Q2FY13
Q3FY13
(% of sales)
40.8
43.2
45.6
48.0
50.4
52.8
Q1
FY
10
Q2
FY
10
Q3
FY
10
Q4
FY
10
Q1
FY
11
Q2
FY
11
Q3
FY
11
Q4
FY
11
Q1
FY
12
Q2
FY
12
Q3
FY
12
Q4
FY
12
Q1
FY
13
Q2
FY
13
Q3
FY
13
(%)

Hindustan Unilever
5 Edelweiss Securities Limited
Chart 4: Category-wise contribution - Sales
Chart 5: Category-wise contribution - EBIT
Chart 6: S&D YoY revenue growth Chart 7: S&D margin dip YoY
Source: Company, Edelweiss research
Soaps and
Detergents
50%
Personal
Products
28%
Beverages
11%
Packaged
Food
6%
Others
(includes
Chemicals,
Water etc)
5%
Q3FY12 revenues
Soaps and
Detergents
35%
Personal
Products
51%
Beverages
12%
Packaged
Food
0%
Others
(includes
Chemicals,
Water etc)
-2%
Q3FY13 - EBIT contribution
(5.0)
2.0
9.0
16.0
23.0
30.0
De
c-0
9
Ma
r-1
0
Jun
-10
Se
p-1
0
De
c-1
0
Ma
r-1
1
Jun
-11
Se
p-1
1
De
c-1
1
Ma
r-1
2
Jun
-12
Se
p-1
2
De
c-1
2
(S&
D s
ale
s g
row
th %
)
Soaps and
Detergents
48%
Personal
Products
31%
Beverages
12%
Packaged
Food
5%
Others
(includes
Chemicals,
Water etc)
4%
Q3FY13 revenues
Soaps and
Detergents
46%
Personal
Products
43%
Beverages
11%
Packaged
Food
0%
Others
(includes
Chemicals,
Water etc)
0%
Q3FY12 - EBIT contribution
0.0
3.0
6.0
9.0
12.0
15.0
De
c-0
9
Ma
r-1
0
Jun
-10
Se
p-1
0
De
c-1
0
Ma
r-1
1
Jun
-11
Se
p-1
1
De
c-1
1
Ma
r-1
2
Jun
-12
Se
p-1
2
De
c-1
2
(S&
D m
arg
ins
%)

Consumer Goods
6 Edelweiss Securities Limited
Chart 8: PP revenue growth YoY Chart 9: PP margin expand YoY
Chart 10: Beverages sales growth head north Chart 11: Beverages margin surges YoY
Chart 12: Packaged food sales growth slows down Chart 13: Packaged food margins expand YoY
Source: Company, Edelweiss research
0.0
4.4
8.8
13.2
17.6
22.0
De
c-0
9
Ma
r-1
0
Jun
-10
Se
p-1
0
De
c-1
0
Ma
r-1
1
Jun
-11
Se
p-1
1
De
c-1
1
Ma
r-1
2
Jun
-12
Se
p-1
2
De
c-1
2
(PP
sa
les
gro
wth
%)
0.0
4.0
8.0
12.0
16.0
20.0
De
c-0
9
Ma
r-1
0
Jun
-10
Se
p-1
0
De
c-1
0
Ma
r-1
1
Jun
-11
Se
p-1
1
De
c-1
1
Ma
r-1
2
Jun
-12
Se
p-1
2
De
c-1
2
(Be
ve
rag
es
sale
s g
row
th %
)
0.0
6.0
12.0
18.0
24.0
30.0
De
c-0
9
Ma
r-1
0
Jun
-10
Se
p-1
0
De
c-1
0
Ma
r-1
1
Jun
-11
Se
p-1
1
De
c-1
1
Ma
r-1
2
Jun
-12
Se
p-1
2
De
c-1
2
(Pa
ck
ag
ed
Fo
od
sa
les
gro
wth
%)
0.0
8.0
16.0
24.0
32.0
40.0
De
c-0
9
Ma
r-1
0
Jun
-10
Se
p-1
0
De
c-1
0
Ma
r-1
1
Jun
-11
Se
p-1
1
De
c-1
1
Ma
r-1
2
Jun
-12
Se
p-1
2
De
c-1
2
(PP
ma
rgin
s %
)
0.0
4.0
8.0
12.0
16.0
20.0
De
c-0
9
Ma
r-1
0
Jun
-10
Se
p-1
0
De
c-1
0
Ma
r-1
1
Jun
-11
Se
p-1
1
De
c-1
1
Ma
r-1
2
Jun
-12
Se
p-1
2
De
c-1
2
(Be
ve
rag
es
ma
rgin
s %
)
(10.0)
(6.0)
(2.0)
2.0
6.0
10.0
De
c-0
9
Ma
r-1
0
Jun
-10
Se
p-1
0
De
c-1
0
Ma
r-1
1
Jun
-11
Se
p-1
1
De
c-1
1
Ma
r-1
2
Jun
-12
Se
p-1
2
De
c-1
2
(PP
ac
ka
ge
d F
oo
d m
arg
ins
%)
Hindustan Unilever
7 Edelweiss Securities Limited
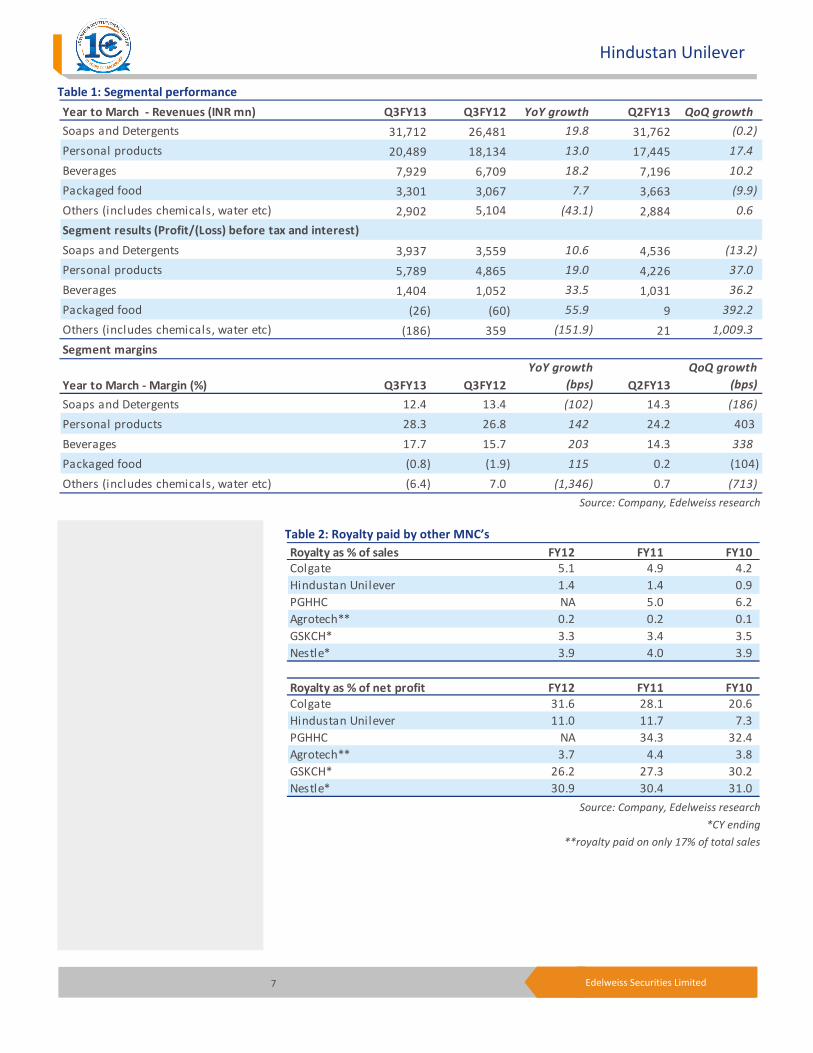
Table 1: Segmental performance
Source: Company, Edelweiss research
Table 2: Royalty paid by other MNC’s
Source: Company, Edelweiss research
*CY ending
**royalty paid on only 17% of total sales
Year to March - Revenues (INR mn) Q3FY13 Q3FY12 YoY growth Q2FY13 QoQ growth
Soaps and Detergents 31,712 26,481 19.8 31,762 (0.2)
Personal products 20,489 18,134 13.0 17,445 17.4
Beverages 7,929 6,709 18.2 7,196 10.2
Packaged food 3,301 3,067 7.7 3,663 (9.9)
Others (includes chemicals, water etc) 2,902 5,104 (43.1) 2,884 0.6
Segment results (Profit/(Loss) before tax and interest)
Soaps and Detergents 3,937 3,559 10.6 4,536 (13.2)
Personal products 5,789 4,865 19.0 4,226 37.0
Beverages 1,404 1,052 33.5 1,031 36.2
Packaged food (26) (60) 55.9 9 392.2
Others (includes chemicals, water etc) (186) 359 (151.9) 21 1,009.3
Segment margins
Year to March - Margin (%) Q3FY13 Q3FY12
YoY growth
(bps) Q2FY13
QoQ growth
(bps)
Soaps and Detergents 12.4 13.4 (102) 14.3 (186)
Personal products 28.3 26.8 142 24.2 403
Beverages 17.7 15.7 203 14.3 338
Packaged food (0.8) (1.9) 115 0.2 (104)
Others (includes chemicals, water etc) (6.4) 7.0 (1,346) 0.7 (713)
Royalty as % of sales FY12 FY11 FY10
Colgate 5.1 4.9 4.2
Hindustan Unilever 1.4 1.4 0.9
PGHHC NA 5.0 6.2
Agrotech** 0.2 0.2 0.1
GSKCH* 3.3 3.4 3.5
Nestle* 3.9 4.0 3.9
Royalty as % of net profit FY12 FY11 FY10
Colgate 31.6 28.1 20.6
Hindustan Unilever 11.0 11.7 7.3
PGHHC NA 34.3 32.4
Agrotech** 3.7 4.4 3.8
GSKCH* 26.2 27.3 30.2
Nestle* 30.9 30.4 31.0

Consumer Goods
8 Edelweiss Securities Limited
Table 3: HUL LTL numbers (ex FMCG exports)
Source: Company, Edelweiss research
Chart 14: Palm oil prices correct
Source: Company, Edelweiss research
(INR mn) Q3FY13 Q3FY12 YoY growth
Net Sales 6,434 5,559 15.7
EBITDA 1,089 928 17.3
EBIT 1,030 876 17.5
PAT 871 725 20.1
800
1,440
2,080
2,720
3,360
4,000
Jan
-07
Jul-
07
Jan
-08
Jul-
08
Jan
-09
Jul-
09
Jan
-10
Jul-
10
Jan
-11
Jul-
11
Jan
-12
Jul-
12
Jan
-13
(MY
R/M
T)

Hindustan Unilever
9 Edelweiss Securities Limited
Other key developments
• HUL launched Lux Body Sprays recently to tap the potential of the INR10bn plus deo
market growing at 25% CAGR.
• Dove Elixir: With the launch of Dove Elixir, HUL has extended Dove to premium hair
oils. This shows HUL’s rising interest in the premium hair oils category (INR67bn). It has
small presence in hair oil via Clinic Plus in select markets. Dove Elixir is a super-premium
offering in the light hair oil segment (growing at 25% CAGR) priced at INR185 for 90ml.
The 4x price to that of competitors needs to be seen in context of innovative packaging
(pumping action) and the strong brand equity of Dove (presence in deodorants, body
wash, shampoos, conditioners, face wash and lotions). HUL had sold Nihar hair oil to
Marico in 2006. Some of the competitors in the space include Dabur Almond hair oil
(INR50 for 100ml), Emami’s Navratna thanda oil (INR55 for 100ml), Marico’s Parachute
Scalp Therapie (INR125 for 100ml) and Bajaj Corp’s Bajaj Almond Drops (INR50 for
100ml). HUL’s Dove brand now has presence across hair care space with shampoo,
conditioner, serum and hair oils. Hair oil consumption in India remains strong as many
hair dye consumers have started using hair oils (likely hair damage in some cases with
excessive use of chemicals). We expect the new offering to have a niche customer base.
In order to become big it will have to be backed by heavy advertising and
commensurate value proposition (as it is priced ~4x competition). Shahrukh Khan and
Katrina Kaif were roped in to endorse two new Lux soap variants.
• Unilever opened a R&D centre in Bengaluru; formally inaugurated by CEO Paul Polman.
• HUL recently launched an ad campaign on All India Radio which asked listeners across
UP and Bihar to give a missed call on a number. Those who made the call were
entertained with humorous jokes that contain messages about HUL’s detergent brand
Wheel. Till now, around 5mn missed calls have been received from 0.77mn unique
numbers.
• HUL has elevated Human Resource Head and Executive Director Leena Nair as its global
Senior Vice-president for leadership and organisation development.
• HUL has become the only company to win the IR Global Ranking awards this year in
India in 3 out of 4 categories. It is a winner in IR website, Online annual report and
Financial disclosures categories.
• Importance of India is increasing for Unilever as innovations are happening in India and
are getting bigger; aims to get 75% of revenue from emerging markets by 2020, up
from the current 55%.
• Pureit, entirely developed in India, is now sold in at least 15 other countries.
• Learnings from India, such as lower price points for products in smaller packages or
sachets (available at GBP1), is gaining acceptance in Europe.
Consumer Goods
10 Edelweiss Securities Limited
Outlook and valuations: Expensive; downgrade to ‘REDUCE’ We like HUL’s strategy of investing in categories that will pay rich dividends from a 3-5 year
perspective and focus on new product launches and market share gains in existing
categories. We like its revenue growth from a medium to long term perspective, however
increase in royalty, steep hike in tax rate (up 200bps and 250bps YoY for FY14E and FY15E
respectively) and slowdown in discretionary segments remains an overhang. On these
concerns we have cut our PAT for FY13E and FY14E by 3.2% & 7.1% respectively. HUL’s
earnings have slowed from FY11-13E CAGR of 24.9% to FY13E-15E CAGR of 9.8%. Hence, we
reduce target P/E to 28x (32x earlier) for FY14E arriving at a target price of INR458. Hence,
we downgrade our recommendation to ‘REDUCE’ from ‘HOLD’ and rate the stock ‘Sector
Underperformer’ on relative return basis.

Hindustan Unilever
11 Edelweiss Securities Limited
Financial snapshot (INR mn)
Year to March Q3FY13 Q3FY12 % change Q2FY13 % change YTD13 FY13E FY14E
Net sales 64,337 58,443 10.1 61,554 4.5 188,393 261,959 295,602
Other operating income 2,211 1,112 98.8 1,554 42.3 5,052 5,608 6,168
Total operating income 66,548 59,555 11.7 63,108 5.5 193,444 267,567 301,771
Cost of goods sold 34,191 30,799 11.0 32,695 4.6 100,563 139,658 156,369
Gross profit 32,357 28,756 12.5 30,414 6.4 92,881 127,909 145,402
Staff costs 3,427 2,741 25.0 3,305 3.7 10,061 13,806 15,722
Advt. sales & promotions 8,222 6,902 19.1 7,690 6.9 24,108 32,376 36,816
Other expenses 9,821 9,408 4.4 9,652 1.8 28,393 41,205 47,982
Total expenditure 21,470 19,051 12.7 20,646 4.0 62,562 87,387 100,520
EBITDA 10,888 9,705 12.2 9,767 11.5 30,320 40,522 44,882
Depreciation & amortization 593 568 4.3 577 2.8 1,746 2,657 2,913
EBIT 10,295 9,137 12.7 9,191 12.0 28,574 37,865 41,969
Interest 75 5 1,573.3 63 19.0 191 320 220
Profit before tax 11,557 9,933 16.3 10,615 8.9 33,393 42,727 48,377
Provision for taxes 2,771 2,271 22.0 2,561 8.2 9,288 10,485 12,820
Core profit 8,786 7,662 14.7 8,053 9.1 24,105 32,242 35,557
Exceptionals (73) (124) NA 16 NA 5,990 4,697 -
Net profit 8,714 7,538 15.6 8,069 8.0 30,095 36,789 35,388
EPS (INR) 4.1 3.5 3.7 13.9 14.8 16.4
As % of net revenues
Other operational income 3.4 1.9 2.5 2.7 2.1 2.1
COGS 53.1 52.7 53.1 53.4 53.3 52.9
Employee cost 5.3 4.7 5.4 5.3 5.3 5.3
Adv. & sales promotions 12.8 11.8 12.5 12.8 12.4 12.5
Other expenditure 15.3 16.1 15.7 15.1 15.7 16.2
EBITDA 16.9 16.6 15.9 16.1 15.5 15.2
PBT 18.0 17.0 17.2 17.7 16.3 16.4
Reported net profit 13.7 13.1 13.1 12.8 12.3 12.0
Tax rate 24.0 22.9 24.1 27.8 24.5 26.5
* Quarterly nos. standalone; annual nos. consolidated
Note: Other operating income includes income from outsourcing which are largely EBITDA neutral; all ratios are computed as % of net sales
Change in Estimates FY13E FY14E
New Old % change New Old % change Comments
Net Revenue 261,959 264,653 (1.0) 295,602 302,210 (2.2) Slight volume slowdown in
discretionary PP and foods
EBITDA 40,522 41,461 (2.3) 44,882 48,118 (6.7) Reduction in palm oil prices to
benefit gross margins but high A&P
and 0.5bps YoY increase in royalty
expenses to take margin hit
EBITDA Margin 15.5 15.7 15.2 15.9
Core profit 32,242 33,295 (3.2) 35,557 38,288 (7.1) Margin pressure coupled with sharp
increase in tax rate (up 200bps YoY)
PAT Margin 12.3 12.5 12.0 12.6
Capex 4,724 4,724 0.0 4,750 4,750 0.0

Consumer Goods
12 Edelweiss Securities Limited
Company Description
HUL, the largest FMCG Company in India, was formed by merging three subsidiaries of
Unilever in 1956. At present, Unilever Plc holds a 52.5% stake in the company. HUL’s
portfolio of products covers a wide spectrum including soaps, detergents, skin creams,
shampoos, toothpastes, tea, coffee, packaged foods and branded atta.
Powerful brands and an envious distribution network are HUL’s primary strengths. The
company operates through segments—soaps & detergents, personal products, beverages,
foods, exports, and other operations.
Investment Theme
HUL is a play on consumption growth in India. The company has displayed its ability to effect
price hikes and avoid impact of inflation in vegetable oils, which, combined with improved
outlook for fabric wash and strong growth in processed foods and beverages, boosts our
positive outlook on the stock. The recent moves by the company to dispose of its non-core
assets including few properties give it a near term upside. We believe the price war in
shampoos with rival P&G has weakened (just like in S&D). We like its revenue growth from a
medium to long term perspective, however increase in royalty, steep hike in tax rate (up
200bps and 250bps YoY for FY14E and FY15E respectively) and slowdown in discretionary
segments remains an overhang.
Key Risks
Further correction in palm oil prices may lead to gross margin expansion.
Also, upside risk arise from the company’s continuous efforts through innovations to deal
with the discretionary slowdown.

13 Edelweiss Securities Limited
Hindustan Unilever
Financial Statements
Income statement (INR mn)
Year to March FY12 FY13E FY14E FY15E
Net revenue 229,877 261,959 295,602 338,342
Other Operating Income 4,486 5,608 6,168 6,847
Total operating income 234,363 267,567 301,771 345,189
Materials costs 125,017 139,658 156,369 178,538
Gross profit 109,347 127,909 145,402 166,651
Employee costs 12,009 13,806 15,722 17,950
Other Expenses 35,532 41,205 47,982 55,921
Advertisement & sales costs 26,970 32,376 36,816 42,458
EBITDA 34,836 40,522 44,882 50,323
Depreciation & Amortization 2,335 2,657 2,913 3,189
EBIT 32,500 37,865 41,969 47,133
Other income 2,596 5,182 6,628 7,818
Interest expenses 17 320 220 200
Profit before tax 35,080 42,727 48,377 54,751
Provision for tax 8,215 10,485 12,820 15,878
Net profit 26,865 32,242 35,557 38,873
Exceptional 1,137 4,697 - -
Minority interest (95) (149) (169) (193)
Profit after minority interest 27,907 36,789 35,388 38,680
Diluted EPS (INR) 12.4 14.8 16.4 17.9
Dividend per share (INR) 7.5 9.9 9.5 10.4
Dividend payout (%) 58.1 58.1 58.1 58.1
Common size metrics
Year to March FY12 FY13E FY14E FY15E
Materials costs 54.4 53.3 52.9 52.8
Employee expenses 5.2 5.3 5.3 5.3
Advertising & sales costs 11.7 12.4 12.5 12.5
Interest expenditure 0.0 0.1 0.1 0.1
EBITDA margins 15.2 15.5 15.2 14.9
Net profit margins 11.6 12.3 12.0 11.4
Growth ratios (%)
Year to March FY12 FY13E FY14E FY15E
Revenues 17.0 14.0 12.8 14.5
EBITDA 28.5 16.3 10.8 12.1
Net profit 28.8 20.0 10.3 9.3
EPS 30.3 19.9 10.3 9.3
Key Assumptions
Year to March FY12 FY13E FY14E FY15E
Macro
GDP(Y-o-Y %) 6.5 5.5 6.5 7.0
Inflation (Avg) 8.8 7.8 6.0 6.0
Repo rate (exit rate) 8.5 7.5 6.8 6.0
USD/INR (Avg) 47.9 54.5 54.0 52.0
Company
Revenue growth (Y-o-Y %)
Volume gr. (overall) 9.0 7.0 6.0 6.5
Pricing gr. (overall) 8.0 7.0 6.8 8.0
Growth in Soaps 9.2 14.5 14.0 14.0
Growth in Detergents 29.2 19.5 17.0 18.0
Growth in PP 19.7 15.0 15.5 16.5
Growth in beverages 11.5 10.0 7.0 8.0
Growth in packaged foods 15.4 14.0 14.5 15.5
EBITDA margin assumptions
Oils, fats and resins as % of COGS 11.2 11.8 12.0 11.9
Chemicals and perfumes as % of COGS 29.1 29.7 29.7 30.1
Tea and Green leaf as % of COGS 7.4 7.3 6.8 6.5
Selling and distribution costs 15.2 15.4 15.9 16.2
Employee cost as % of sales 5.2 5.3 5.3 5.3
A&P as % of sales 11.7 12.4 12.5 12.5
EBITDA margin (%) 15.2 15.5 15.2 14.9
Financial assumptions
Tax rate (%) 23.4 24.5 26.5 29.0
Capex (INR mn) 2,070 4,724 4,750 4,500
Debtor days 14 14 14 14
Inventory days 81 81 81 81
Payable days 145 145 145 145
Cash conversion cycle (days) (50) (50) (50) (50)
Depreciation as % of gross block 5.9 6.2 6.2 6.2
Yield on cash 6.0 12.0 12.3 11.9

14 Edelweiss Securities Limited
Consumer Goods
Peer comparison valuation
Market cap Diluted PE (X) EV/EBITDA (X) ROAE (%)
Name (USD mn) FY13E FY14E FY13E FY14E FY13E FY14E
Hindustan Unilever 19,323 32.4 29.4 24.3 21.7 75.0 64.9
Asian Paints 7,897 36.2 29.5 23.2 19.1 38.8 39.9
Colgate 3,764 36.7 31.9 27.5 23.2 117.1 116.7
Dabur 4,219 29.9 25.1 21.1 17.7 40.7 38.4
Emami 1,638 28.0 23.2 24.2 19.5 41.8 44.2
GlaxoSmithKline Consumer Healthcare 2,967 36.8 30.9 24.9 21.2 35.5 35.0
Godrej Consumer 4,470 33.7 27.8 23.4 19.4 21.5 22.5
ITC 42,496 30.0 25.7 19.5 16.6 36.8 38.6
Marico 2,695 34.9 29.1 22.6 18.6 30.2 28.5
Nestle Ltd 8,455 42.3 34.2 26.0 20.8 71.5 66.4
AVERAGE 33.2 28.0 22.9 19.2 53.9 52.6
Source: Edelweiss research
Cash flow metrics
Year to March FY12 FY13E FY14E FY15E
Operating cash flow 28,844 36,100 40,455 44,485
Investing cash flow (5,134) (4,724) (4,750) (4,500)
Financing cash flow (8,442) (20,459) (24,110) (26,312)
Net cash flow 15,267 10,918 11,595 13,673
Capex (2,070) (4,724) (4,750) (4,500)
Dividends paid (18,839) (24,835) (23,890) (26,112)
Share issuance/(buyback) 2 - - -
Profitability & efficiency ratios
Year to March FY12 FY13E FY14E FY15E
ROAE (%) 83.4 75.0 64.9 58.1
ROACE (%) 257.8 213.6 141.7 112.7
Inventory day 81 81 81 81
Debtors days 14 14 14 14
Payable days 145 145 145 145
Cash conversion cycle (days) (50) (50) (50) (50)
Current ratio 0.8 1.0 1.1 1.2
Operating ratios
Year to March FY12 FY13E FY14E FY15E
Total asset turnover 7.6 6.4 5.6 5.2
Fixed asset turnover 9.2 10.1 10.6 11.5
Equity turnover 7.2 6.1 5.4 5.1
Valuation parameters
Year to March FY12 FY13E FY14E FY15E
Diluted EPS (INR) 12.4 14.8 16.4 17.9
Y-o-Y growth (%) 30.3 19.9 10.3 9.3
CEPS (INR) 13.5 16.1 17.8 19.5
Diluted PE (x) 38.8 32.4 29.4 26.9
Price/BV (x) 29.8 22.1 17.7 14.6
EV/Sales (x) 4.3 3.8 3.3 2.8
EV/EBITDA (x) 28.6 24.3 21.7 19.1
Dividend yield (%) 1.6 2.1 2.0 2.2
Balance sheet (INR mn)
As on 31st March FY12 FY13E FY14E FY15E
Equity capital 2,162 2,162 2,162 2,162
Reserves & surplus 34,649 46,603 58,102 70,670
Shareholders funds 36,811 48,765 60,263 72,831
Minority interest (BS) 183 332 501 694
Deferred tax liability (2,099) (2,099) (2,099) (2,099)
Sources of funds 34,895 46,998 58,665 71,426
Tangible assets 22,329 24,172 25,759 27,069
Intangible assets 300 300 300 300
CWIP (incl. intangible) 2,276 2,500 2,750 2,750
Total net fixed assets 24,905 26,971 28,808 30,119
Non current investments 703 703 703 703
Current Investments 22,519 22,519 22,519 22,519
Cash and equivalents 19,964 30,882 42,477 56,149
Inventories 26,674 30,993 34,701 39,621
Sundry debtors 8,567 10,409 11,575 13,240
Loans and advances 8,269 8,269 8,269 8,269
Other current assets 372 372 372 372
Total current assets (ex cash) 43,883 50,043 54,917 61,502
Current liabilities & provisions 77,079 84,120 90,759 99,566
Net current assets (ex cash) (33,196) (34,077) (35,842) (38,064)
Uses of funds 34,895 46,998 58,665 71,426
Book value per share (INR) 16.1 21.7 27.1 33.0
Free cash flow (INR mn)
Year to March FY12 FY13E FY14E FY15E
Net profit 27,907 36,789 35,388 38,680
Add : Non cash charge 140 (1,570) 3,301 3,583
Depreciation 2,335 2,657 2,913 3,189
Others (2,195) (4,227) 389 393
Gross cash flow 28,047 35,219 38,690 42,263
Less: Changes in WC (797) (881) (1,765) (2,222)
Operating cash flow 28,844 36,100 40,455 44,485
Less: Capex 2,070 4,724 4,750 4,500
Free cash flow 26,774 31,376 35,705 39,985

15 Edelweiss Securities Limited
Hindustan Unilever
Insider Trades Reporting Data Acquired / Seller B/S Qty Traded
24 May 2012 Life Insurance Corporation of India Sell 44984788.00
30 Aug 2012 Mr. Pradeep Banerjee Sell 15000.00
*in last one year
Bulk Deals Data Acquired / Seller B/S Qty Traded Price
No Data Available
*in last one year
Holding – Top10 Perc. Holding Perc. Holding
Unilever plc 36.76 Brooke bond group lt 4.94
Unilever overseas ho 4.05 Life insurance corp 3.88
Aberdeen 3.12 Unilever uk & cn hol 2.78
Brooke bond south in 2.44 Vanguard group inc 1.73
Brooke bond assam es 1.52 Oppenheimerfunds inc 1.29
*as per last available data
Additional Data
Directors Data
Mr. Harish Manwani Chairman Mr. Nitin Paranjpe Managing Director and Chief Executive Officer
Mr. Sridhar Ramamurthy Executive Director, Finance & IT and Chief Financial Officer Mr. Pradeep Banerjee Executive Director, Supply Chain
Mr. A. Narayan Independent Director Mr. S. Ramadorai Independent Director
Mr. R. A. Mashelkar Independent Director Mr. O. P. Bhatt Independent Director
Auditors - M/s. Lovelock & Lewes
*as per last annual report

16 Edelweiss Securities Limited
Company Absolute
reco
Relative
reco
Relative
risk
Company Absolute
reco
Relative
reco
Relative
Risk
Asian Paints BUY SP M Colgate HOLD SP M
Dabur BUY SO M Emami BUY SP H
GlaxoSmithKline Consumer Healthcare BUY SP M Godrej Consumer BUY SO H
Hindustan Unilever REDUCE SU L ITC BUY SO L
Marico BUY SO M Nestle Ltd HOLD SP L
United Spirits BUY SO H
RATING & INTERPRETATION
ABSOLUTE RATING
Ratings Expected absolute returns over 12 months
Buy More than 15%
Hold Between 15% and - 5%
Reduce Less than -5%
RELATIVE RETURNS RATING
Ratings Criteria
Sector Outperformer (SO) Stock return > 1.25 x Sector return
Sector Performer (SP) Stock return > 0.75 x Sector return
Stock return < 1.25 x Sector return
Sector Underperformer (SU) Stock return < 0.75 x Sector return
Sector return is market cap weighted average return for the coverage universe
within the sector
RELATIVE RISK RATING
Ratings Criteria
Low (L) Bottom 1/3rd percentile in the sector
Medium (M) Middle 1/3rd percentile in the sector
High (H) Top 1/3rd percentile in the sector
Risk ratings are based on Edelweiss risk model
SECTOR RATING
Ratings Criteria
Overweight (OW) Sector return > 1.25 x Nifty return
Equalweight (EW) Sector return > 0.75 x Nifty return
Sector return < 1.25 x Nifty return
Underweight (UW) Sector return < 0.75 x Nifty return

17 Edelweiss Securities Limited
Hindustan Unilever
Edelweiss Securities Limited, Edelweiss House, off C.S.T. Road, Kalina, Mumbai – 400 098.
Board: (91-22) 4009 4400, Email: [email protected]
Vikas Khemani Head Institutional Equities [email protected] +91 22 2286 4206
Nischal Maheshwari Co-Head Institutional Equities & Head Research [email protected] +91 22 4063 5476
Nirav Sheth Head Sales [email protected] +91 22 4040 7499
Coverage group(s) of stocks by primary analyst(s): Consumer Goods
Asian Paints, Colgate, Dabur, Godrej Consumer , Emami, Hindustan Unilever, ITC, Marico, Nestle Ltd, GlaxoSmithKline Consumer Healthcare, United Spirits
Distribution of Ratings / Market Cap
Edelweiss Research Coverage Universe
Rating Distribution* 118 46 17 181
* - stocks under review
Market Cap (INR) 117 57 7
Date Company Title Price (INR) Recos
Recent Research
21-Jan-13 Asian Paints Festivals add glitter, margins
improve;
Result Update
4,288 Buy
18-Jan-13 ITC Cigarettes, FMCG on the roll;
Result Update
285 Buy
12-Dec-12 Godrej
Consumer
Products
Ringing in the new;
Visit Note
716 Buy
> 50bn Between 10bn and 50 bn < 10bn
Buy Hold Reduce Total
Rating Interpretation
Buy appreciate more than 15% over a 12-month period
Hold appreciate up to 15% over a 12-month period
Reduce depreciate more than 5% over a 12-month period
Rating Expected to

18 Edelweiss Securities Limited
Consumer Goods
Access the entire repository of Edelweiss Research on www.edelresearch.com
DISCLAIMER
General Disclaimer:
This document has been prepared by Edelweiss Securities Limited (Edelweiss). Edelweiss, its holding company and associate companies are a full service, integrated
investment banking, portfolio management and brokerage group. Our research analysts and sales persons provide important input into our investment banking
activities. This document does not constitute an offer or solicitation for the purchase or sale of any financial instrument or as an official confirmation of any
transaction. The information contained herein is from publicly available data or other sources believed to be reliable, but we do not represent that it is accurate or
complete and it should not be relied on as such. Edelweiss or any of its affiliates/ group companies shall not be in any way responsible for any loss or damage that
may arise to any person from any inadvertent error in the information contained in this report. This document is provided for assistance only and is not intended to
be and must not alone be taken as the basis for an investment decision. The user assumes the entire risk of any use made of this information. Each recipient of this
document should make such investigation as it deems necessary to arrive at an independent evaluation of an investment in the securities of companies referred to
in this document (including the merits and risks involved), and should consult his own advisors to determine the merits and risks of such investment. The investment
discussed or views expressed may not be suitable for all investors. We and our affiliates, group companies, officers, directors, and employees may: (a) from time to
time, have long or short positions in, and buy or sell the securities thereof, of company (ies) mentioned herein or (b) be engaged in any other transaction involving
such securities and earn brokerage or other compensation or act as advisor or lender/borrower to such company (ies) or have other potential conflict of interest
with respect to any recommendation and related information and opinions. This information is strictly confidential and is being furnished to you solely for your
information. This information should not be reproduced or redistributed or passed on directly or indirectly in any form to any other person or published, copied, in
whole or in part, for any purpose. This report is not directed or intended for distribution to, or use by, any person or entity who is a citizen or resident of or located
in any locality, state, country or other jurisdiction, where such distribution, publication, availability or use would be contrary to law, regulation or which would
subject Edelweiss and affiliates/ group companies to any registration or licensing requirements within such jurisdiction. The distribution of this document in certain
jurisdictions may be restricted by law, and persons in whose possession this document comes, should inform themselves about and observe, any such restrictions.
The information given in this document is as of the date of this report and there can be no assurance that future results or events will be consistent with this
information. This information is subject to change without any prior notice. Edelweiss reserves the right to make modifications and alterations to this statement as
may be required from time to time. However, Edelweiss is under no obligation to update or keep the information current. Nevertheless, Edelweiss is committed to
providing independent and transparent recommendation to its client and would be happy to provide any information in response to specific client queries. Neither
Edelweiss nor any of its affiliates, group companies, directors, employees, agents or representatives shall be liable for any damages whether direct, indirect, special
or consequential including lost revenue or lost profits that may arise from or in connection with the use of the information. Past performance is not necessarily a
guide to future performance. The disclosures of interest statements incorporated in this document are provided solely to enhance the transparency and should not
be treated as endorsement of the views expressed in the report. Edelweiss Securities Limited generally prohibits its analysts, persons reporting to analysts and their
dependents from maintaining a financial interest in the securities or derivatives of any companies that the analysts cover. The information provided in these reports
remains, unless otherwise stated, the copyright of Edelweiss. All layout, design, original artwork, concepts and other Intellectual Properties, remains the property
and copyright Edelweiss and may not be used in any form or for any purpose whatsoever by any party without the express written permission of the copyright
holders.
Edelweiss shall not be liable for any delay or any other interruption which may occur in presenting the data due to any reason including network (Internet) reasons
or snags in the system, break down of the system or any other equipment, server breakdown, maintenance shutdown, breakdown of communication services or
inability of the Edelweiss to present the data. In no event shall the Edelweiss be liable for any damages, including without limitation direct or indirect, special,
incidental, or consequential damages, losses or expenses arising in connection with the data presented by the Edelweiss through this presentation.
Analyst Certification:
The analyst for this report certifies that all of the views expressed in this report accurately reflect his or her personal views about the subject company or companies
and its or their securities, and no part of his or her compensation was, is or will be, directly or indirectly related to specific recommendations or views expressed in
this report.
Analyst holding in the stock: No.
Additional Disclaimer for U.S. Persons
This research report is a product of Edelweiss Securities Limited, which is the employer of the research analyst(s) who has prepared the research report. The
research analyst(s) preparing the research report is/are resident outside the United States (U.S.) and are not associated persons of any U.S. regulated broker-dealer
and therefore the analyst(s) is/are not subject to supervision by a U.S. broker-dealer, and is/are not required to satisfy the regulatory licensing requirements of
FINRA or required to otherwise comply with U.S. rules or regulations regarding, among other things, communications with a subject company, public appearances
and trading securities held by a research analyst account.
This report is intended for distribution by Edelweiss Securities Limited only to "Major Institutional Investors" as defined by Rule 15a-6(b)(4) of the U.S. Securities and
Exchange Act, 1934 (the Exchange Act) and interpretations thereof by U.S. Securities and Exchange Commission (SEC) in reliance on Rule 15a 6(a)(2). If the recipient
of this report is not a Major Institutional Investor as specified above, then it should not act upon this report and return the same to the sender. Further, this report
may not be copied, duplicated and/or transmitted onward to any U.S. person, which is not the Major Institutional Investor.
In reliance on the exemption from registration provided by Rule 15a-6 of the Exchange Act and interpretations thereof by the SEC in order to conduct certain
business with Major Institutional Investors, Edelweiss Securities Limited has entered into an agreement with a U.S. registered broker-dealer, Enclave Capital, LLC.
("Enclave").
Transactions in securities discussed in this research report should be effected through Enclave.
Copyright 2009 Edelweiss Research (Edelweiss Securities Ltd). All rights reserved