Hilton Worldwide - brm.ucsf.edu€¦ · Web view- View this material on a computer - Store this...
64
UPlan Smart View Training for Ad hoc Analysis & Reporting Spring 2016
Transcript of Hilton Worldwide - brm.ucsf.edu€¦ · Web view- View this material on a computer - Store this...

UPlan Smart View Training for Ad hoc Analysis & Reporting
Spring 2016

UPlan Smart View Training
© [2015-2016] “University of California San Francisco (UCSF)”
Ownership of CopyrightThe copyright in this material (including without limitation the text, artwork, photographs, and images) are owned by UCSF.
Copyright License
UCSF grants to you a non-exclusive royalty-free revocable license to:- View this material on a computer- Store this course in your cache or memory- Print pages or material from this course for your own personal and non-commercial use.
All rights reserved.
Enforcement of Copyright
UCSF takes the protection of its copyright very seriously. If UCSF discovers that copyrighted materials have been used in contravention of the license above, UCSF may bring legal proceedings against you seeking monetary damages and an injunction to stop you from using the materials.
2 02/19/2016

UPlan Smart View Training
Contents
INTRODUCTION AND BACKGROUND....................................................................................................6
WHAT IS ESSBASE?.......................................................................................................................................6
WHAT IS SMART VIEW?................................................................................................................................6
WHY USE SMART VIEW?...............................................................................................................................6
SMART VIEW ADD-IN...........................................................................................................................6
ORACLE ESSBASE..........................................................................................................................................6
ORACLE HYPERION PLANNING, FUSION EDITION.................................................................................................7
REPORTING AND ANALYSIS FRAMEWORK...........................................................................................................7
GETTING STARTED................................................................................................................................7
DOWNLOAD SMART VIEW (FIREFOX ONLY).......................................................................................................7
LAUNCH SMART VIEW...................................................................................................................................9
CHOOSE THE SOURCE DATABASE....................................................................................................................13
SETTINGS FOR FASTEST AD HOC QUERIES.......................................................................................................13
SETTINGS FOR RETAINING FORMATTING AND FORMULAS...................................................................................18
UPLAN DIMENSIONS IN SMART VIEW.............................................................................................................22
Period.................................................................................................................................................22
Years..................................................................................................................................................22
Scenario.............................................................................................................................................22
Version...............................................................................................................................................22
Fund...................................................................................................................................................22
DeptID................................................................................................................................................22
Title Code...........................................................................................................................................22
Employee...........................................................................................................................................23
Project................................................................................................................................................23
02/19/2016 3
UPlan Smart View Training
View...................................................................................................................................................23
Account..............................................................................................................................................23
AD HOC ANALYSIS WITH SMART VIEW AND ESSBASE.........................................................................23
ACCESSING ESSBASE VIA SMART VIEW............................................................................................................23
NAVIGATING THE SMART VIEW RIBBON..........................................................................................................24
Undo..................................................................................................................................................24
Refresh...............................................................................................................................................25
Options...............................................................................................................................................25
Panel..................................................................................................................................................25
Submit Data.......................................................................................................................................25
NAVIGATING THE ESSBASE RIBBON................................................................................................................25
Zoom In..............................................................................................................................................25
Zoom Out...........................................................................................................................................26
Pivot...................................................................................................................................................26
Keep Only...........................................................................................................................................26
Remove Only......................................................................................................................................26
Member Selection..............................................................................................................................26
Refresh...............................................................................................................................................29
Change Alias......................................................................................................................................30
POINT OF VIEW (POV)................................................................................................................................30
POV Option 1 (Default): POV Dimensions in the top row...................................................................30
POV Option 2: POV Dimensions floating in the worksheet.................................................................30
POV Option 3: POV Dimensions fixed above the top row...................................................................31
MOVING DIMENSIONS WITH PIVOT................................................................................................................31
Pivot Option 1: Using the Pivot Button...............................................................................................31
Pivot Option 2: Left-click to drag and drop.........................................................................................32
4 02/19/2016

UPlan Smart View Training
Pivot Option 3: Right click to drag and drop.......................................................................................32
POPULATING DIMENSIONS............................................................................................................................32
Typing Members directly into the cell................................................................................................32
USING MEMBER SELECTION..........................................................................................................................33
ZOOM IN & ZOOM OUT..............................................................................................................................34
ADVANCED TIPS AND TRICKS..............................................................................................................36
TYPE DIMENSION NAMES NOT ALIASES...........................................................................................................36
Account..............................................................................................................................................36
DeptID................................................................................................................................................36
Fund...................................................................................................................................................36
Project................................................................................................................................................37
TitleCode............................................................................................................................................37
Year....................................................................................................................................................37
Scenario.............................................................................................................................................37
Version...............................................................................................................................................37
Period.................................................................................................................................................37
DIMENSION PLACEMENT..............................................................................................................................37
PIVOT FROM SMALLEST TO LARGEST DIMENSION..............................................................................................40
MAX ROW ERROR......................................................................................................................................43
CASCADE...................................................................................................................................................46
TROUBLESHOOTING...........................................................................................................................51
WHAT DO I DO IF SMART VIEW BECOMES DISABLED IN MY EXCEL APP?................................................................51
UPLAN USER SUPPORT INFO........................................................................................................................52
02/19/2016 5
UPlan Smart View Training
Introduction and Background
UPlan is the UCSF customized software of Oracle Enterprise Performance Management (EPM), a budgeting and forecasting application suite that includes Oracle Hyperion Planning. Hyperion Planning sits on top of Oracle Essbase, a multidimensional database management system (MDBMS) that provides a multidimensional database platform upon which to build analytic applications.
What is Essbase?
Essbase, whose name derives from “Extended Spread Sheet dataBASE”, began as a product of Arbor Software, which merged with Hyperion Software in 1998. Hyperion Planning uses Essbase as a database and calculation engine, a relational repository for business logic, and a web-based user interface.
What is Smart View?
Oracle Smart View for Office (Smart View) is a product in the Oracle EPM suite mentioned above that connects with Hyperion Planning and Essbase to allow users to view, import, manipulate, distribute and share data in Microsoft Excel, Word and PowerPoint.
Why use Smart View?
UCSF uses Smart View for three main purposes:
1. An Excel interface for ad hoc analysis and reporting2. An Excel interface for data input instead of the web-based forms3. An Excel interface for viewing FR reports
Smart View Add-in
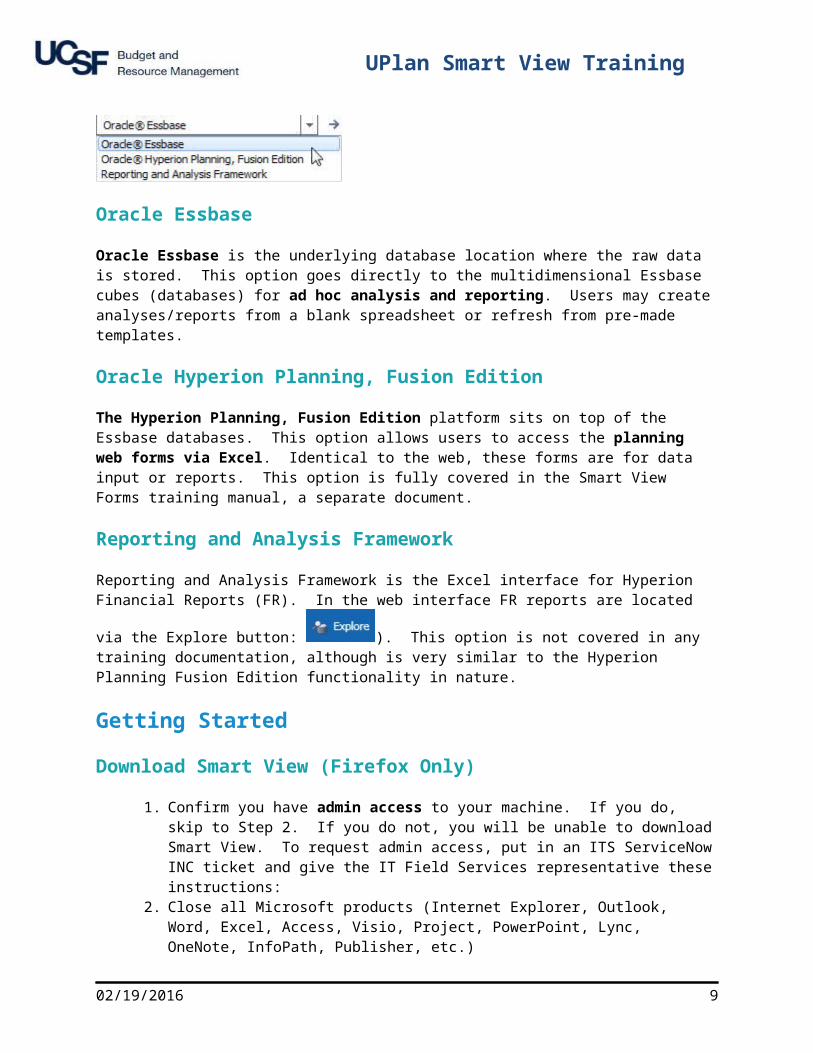
This document instructs how to download Smart View as an Excel add-in. It then describes the Smart View Ad Hoc Reporting functionality which is accessed using the Oracle Essbase option below. Oracle Essbase is used for ad hoc queries and reporting in Excel. Any reference to Smart View in this document should be taken in this context. The three purposes of Smart View above are explained in relation to the three access options below.
6 02/19/2016

UPlan Smart View Training
Oracle Essbase
Oracle Essbase is the underlying database location where the raw data is stored. This option goes directly to the multidimensional Essbase cubes (databases) for ad hoc analysis and reporting. Users may create analyses/reports from a blank spreadsheet or refresh from pre-made templates.
Oracle Hyperion Planning, Fusion Edition
The Hyperion Planning, Fusion Edition platform sits on top of the Essbase databases. This option allows users to access the planning web forms via Excel. Identical to the web, these forms are for data input or reports. This option is fully covered in the Smart View Forms training manual, a separate document.
Reporting and Analysis Framework
Reporting and Analysis Framework is the Excel interface for Hyperion Financial Reports (FR). In the web
interface FR reports are located via the Explore button: ). This option is not covered in any training documentation, although is very similar to the Hyperion Planning Fusion Edition functionality in nature.
Getting Started
Download Smart View (Firefox Only)
1. Confirm you have admin access to your machine. If you do, skip to Step 2. If you do not, you will be unable to download Smart View. To request admin access, put in an ITS ServiceNow INC ticket and give the IT Field Services representative these instructions:
2. Close all Microsoft products (Internet Explorer, Outlook, Word, Excel, Access, Visio, Project, PowerPoint, Lync, OneNote, InfoPath, Publisher, etc.)
3. Download Smart View from the UPlan website at https://brm.ucsf.edu/uplan > click on Training and Job Aids > Download Smart View.
4. Click “Run” in the dialog box that appears.5. The download process may take several minutes depending upon the speed of your
computer. During the download you may see flashing and several black boxes appear on the screen. Do not touch the boxes or attempt to control the download process. When the download process is finished you will see a small dialog box confirming the download is complete.
6. Open Excel.7. Go to the File tab > Options > Add-Ins.8. You should see the Oracle Hyperion Smart View add-ins (there should be two) in the Active
Application Add-ins section. If you don’t see the add-ins here, then go to the drop down menu at the bottom of the dialog box and select “Disabled Items.” You should see the Oracle add-ins in the dialog box that appears now.
02/19/2016 7
UPlan Smart View Training
Wherever you find the Oracle Hyperion add-ins, click on the line item to highlight it and click OK. (Twice for both Hyperion add-ins).
1. You should now see a new tab at the top of your Excel workbook titled “Smart View”.
8 02/19/2016
UPlan Smart View Training
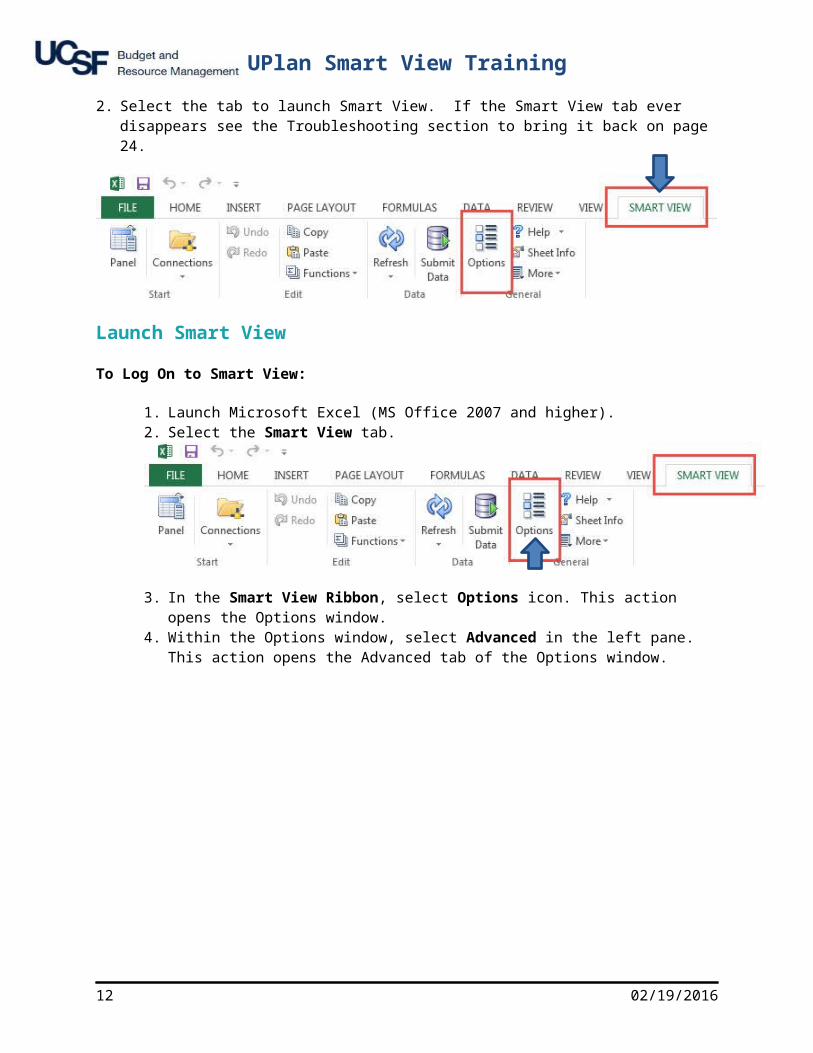
2. Select the tab to launch Smart View. If the Smart View tab ever disappears see the Troubleshooting section to bring it back on page 24.
Launch Smart View
To Log On to Smart View:
1. Launch Microsoft Excel (MS Office 2007 and higher).2. Select the Smart View tab.
3. In the Smart View Ribbon, select Options icon. This action opens the Options window.4. Within the Options window, select Advanced in the left pane. This action opens the
Advanced tab of the Options window.
02/19/2016 9

UPlan Smart View Training
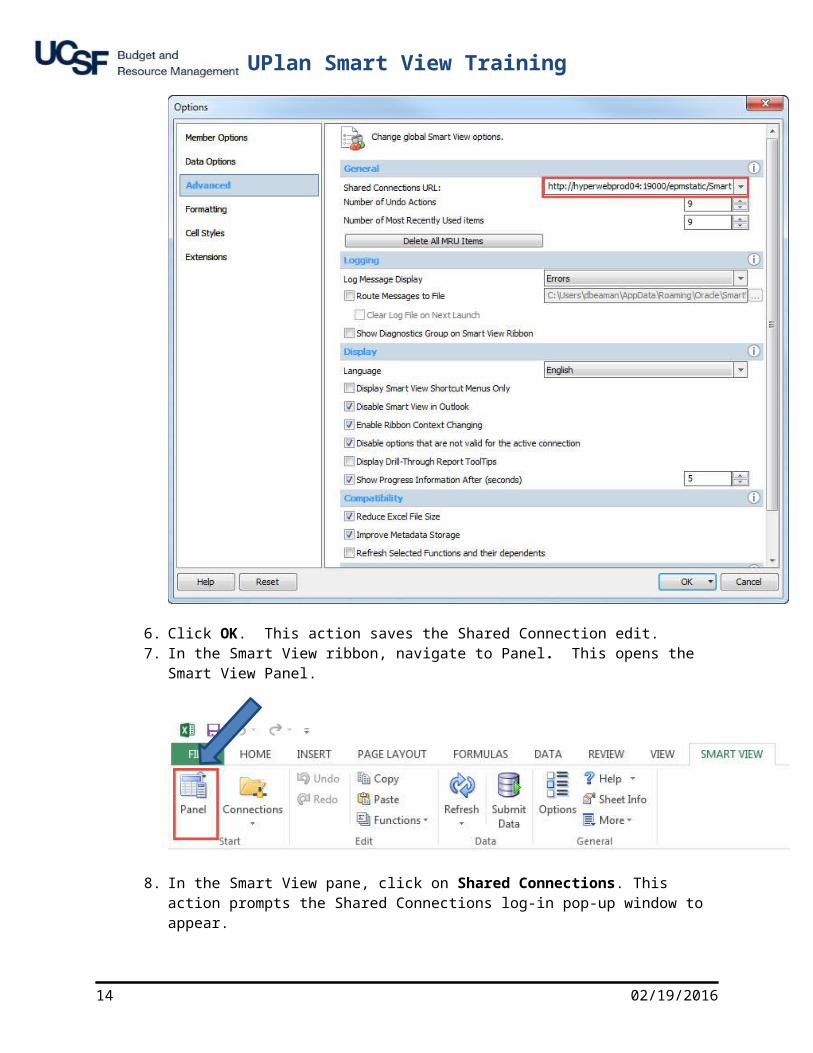
5. In the General section, under Shared Connections URL, input the following URL: http://hyperwebprod04.ucsf.edu:19000/epmstatic/SmartView_Connections.xml
6. Click OK. This action saves the Shared Connection edit.7. In the Smart View ribbon, navigate to Panel. This opens the Smart View Panel.
10 02/19/2016

UPlan Smart View Training
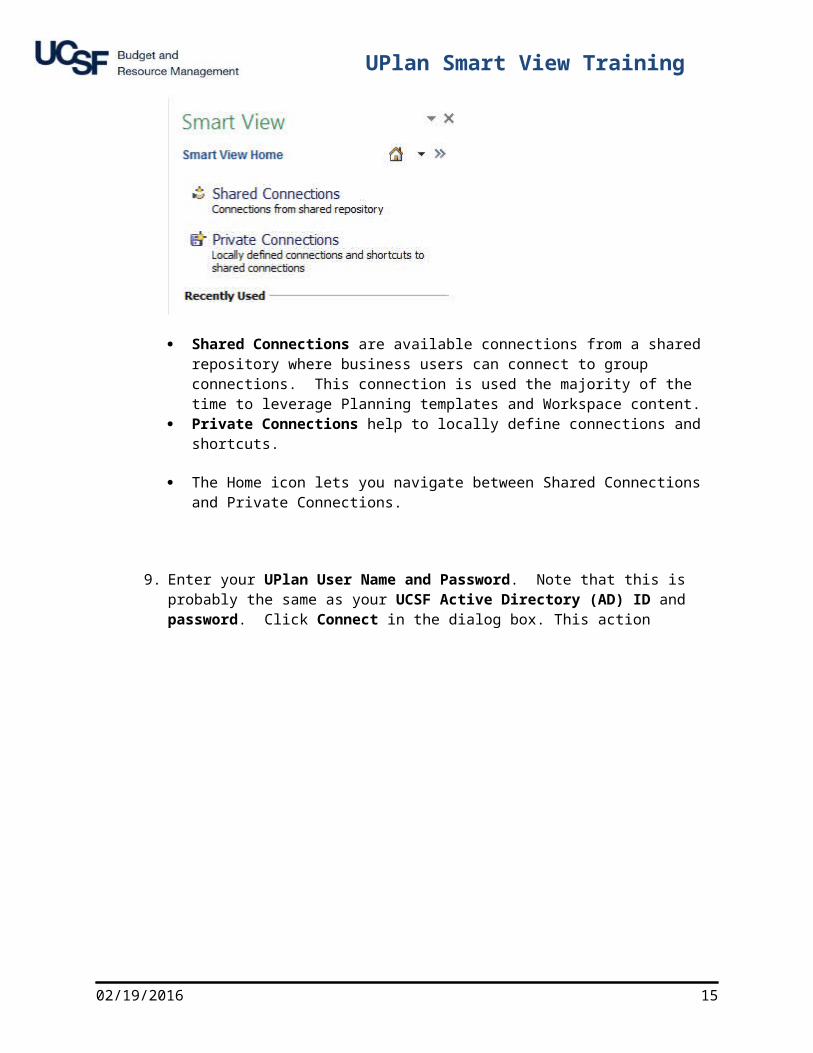
8. In the Smart View pane, click on Shared Connections. This action prompts the Shared Connections log-in pop-up window to appear.
Shared Connections are available connections from a shared repository where business users can connect to group connections. This connection is used the majority of the time to leverage Planning templates and Workspace content.
Private Connections help to locally define connections and shortcuts.
The Home icon lets you navigate between Shared Connections and Private Connections.
9. Enter your UPlan User Name and Password. Note that this is probably the same as your UCSF Active Directory (AD) ID and password. Click Connect in the dialog box. This action
02/19/2016 11
UPlan Smart View Training
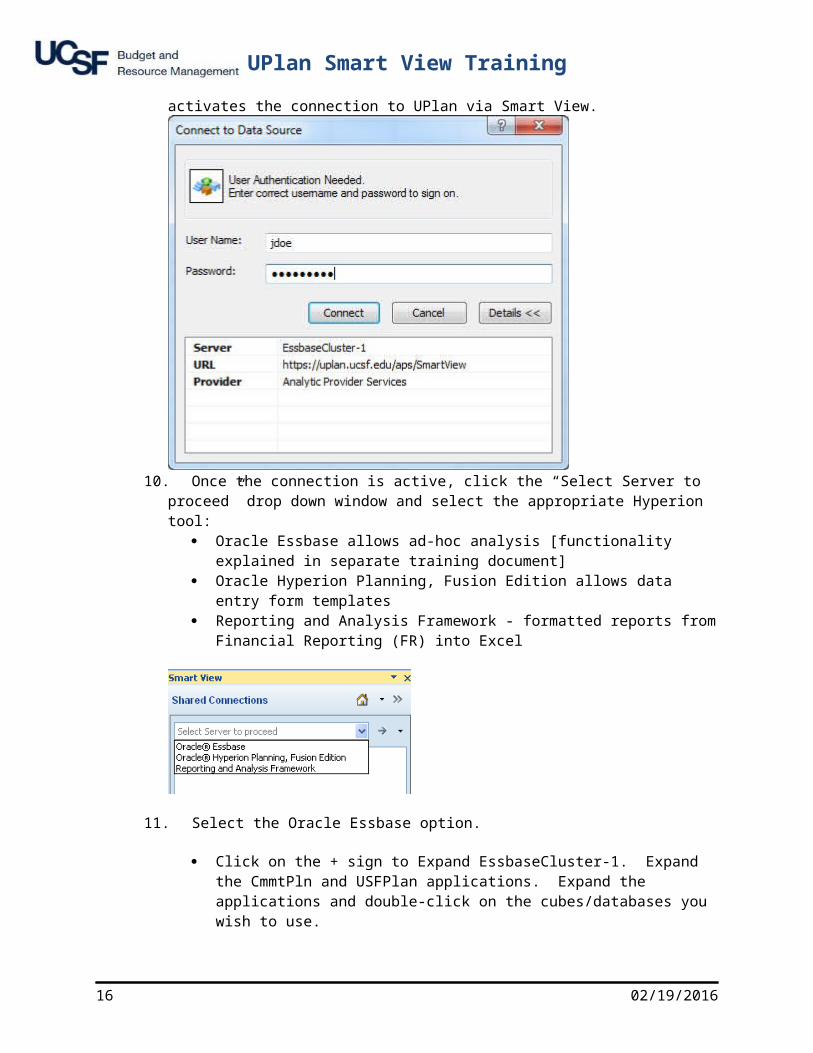
activates the connection to UPlan via Smart View.
10. Once the connection is active, click the “Select Server to proceed” drop down window and select the appropriate Hyperion tool:
Oracle Essbase allows ad-hoc analysis [functionality explained in separate training document]
Oracle Hyperion Planning, Fusion Edition allows data entry form templates Reporting and Analysis Framework - formatted reports from Financial Reporting (FR)
into Excel
11. Select the Oracle Essbase option.
Click on the + sign to Expand EssbaseCluster-1. Expand the CmmtPln and USFPlan applications. Expand the applications and double-click on the cubes/databases you wish to use.
12 02/19/2016

UPlan Smart View Training
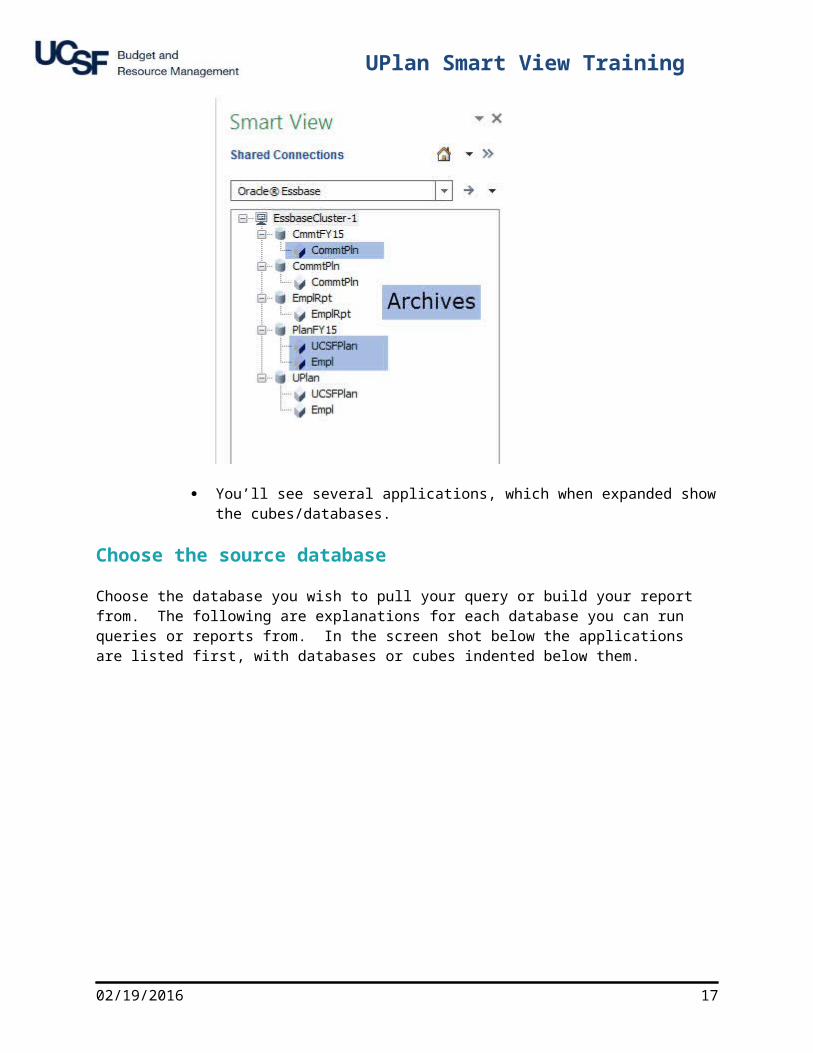
You’ll see several applications, which when expanded show the cubes/databases.
Choose the source database
Choose the database you wish to pull your query or build your report from. The following are explanations for each database you can run queries or reports from. In the screen shot below the applications are listed first, with databases or cubes indented below them.
02/19/2016 13
UPlan Smart View Training
1. The applications/databases with current data are:
CommtPln/CommtPln – current Commitments data. UCSFPlan/Empl – current Employee actuals and planning data at level C/E. UPlan/UCSFPlan –current UCSFPlan actuals and planning data at level C/E. EmplRpt/EmplRpt – current aggregated Empl actuals and planning data at level C/E.
2. The applications/databases in blue shading are archives with data reflecting the UCSF Chart of Accounts prior to 7/1/15:
CmmtFY15/CmmtPlan – archived CmmtPlan data. PlanFY15/Empl – archived Empl data. PlanFY15/UCSFPlan – archived UCSFPlan data.
Settings for Fastest Ad Hoc Queries
Setting Smart View options is a user preference. The following settings are recommended for the best query return times. Formatting and formulas will not be retained using the following settings.
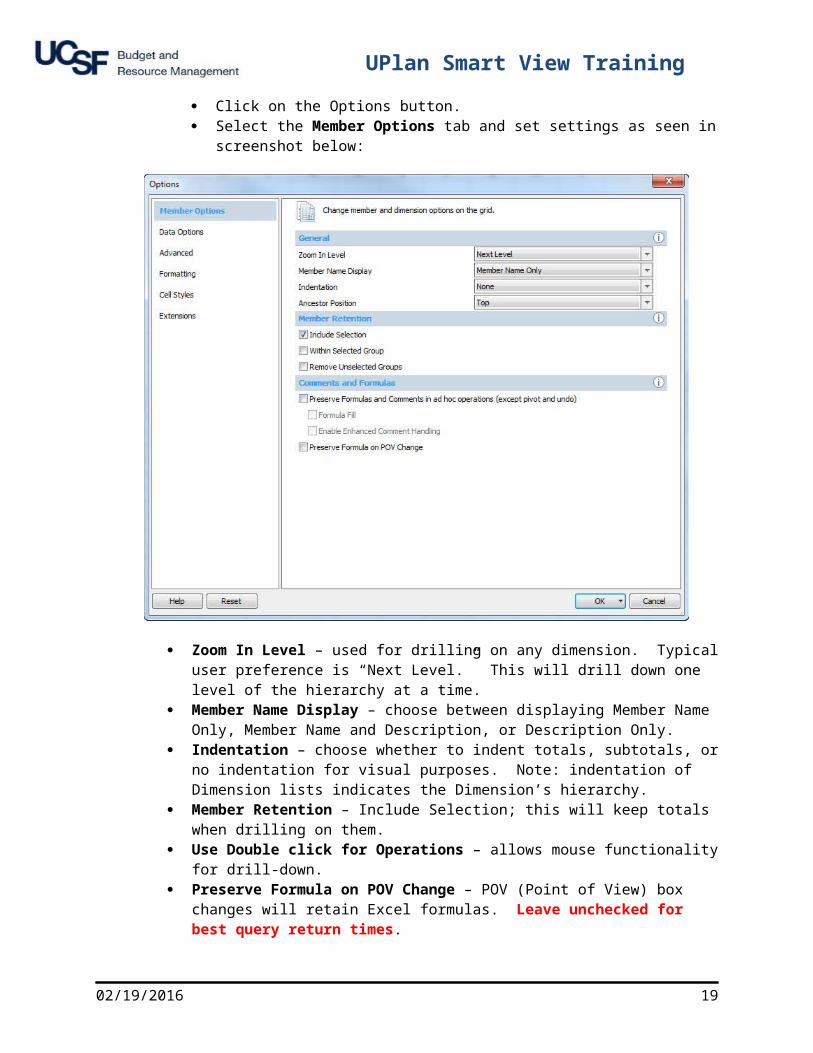
Click on the Options button. Select the Member Options tab and set settings as seen in screenshot below:
14 02/19/2016
UPlan Smart View Training
Zoom In Level – used for drilling on any dimension. Typical user preference is “Next Level.” This will drill down one level of the hierarchy at a time.
Member Name Display – choose between displaying Member Name Only, Member Name and Description, or Description Only.
Indentation – choose whether to indent totals, subtotals, or no indentation for visual purposes. Note: indentation of Dimension lists indicates the Dimension’s hierarchy.
Member Retention – Include Selection; this will keep totals when drilling on them. Use Double click for Operations – allows mouse functionality for drill-down. Preserve Formula on POV Change – POV (Point of View) box changes will retain Excel
formulas. Leave unchecked for best query return times.
Select the Data Options tab and set settings as seen in screenshot below:
02/19/2016 15
UPlan Smart View Training
Suppression Options (Rows/Columns) – Choose whether to display blank rows that have no data. You cannot have these boxes checked if starting from a fresh worksheet. Note: Suppress Missing is available for Rows but not Columns. In addition, the maximum row return is about 1 million rows. The maximum column return is 256 columns. See the Tips and Tricks section for a best practice recommendation for pivoting dimensions from Rows/Columns and Suppressing unnecessary dimensions.
Replacement - This is the text result that appears when query result is zero/no data.o #NoData/Missing – for blank cells to appear blank, delete “#Missing”.
Mode – screenshot options above are the default.o “Navigate Without Data” option should only be checked in situations when
validating metadata and data analysis is not necessary.
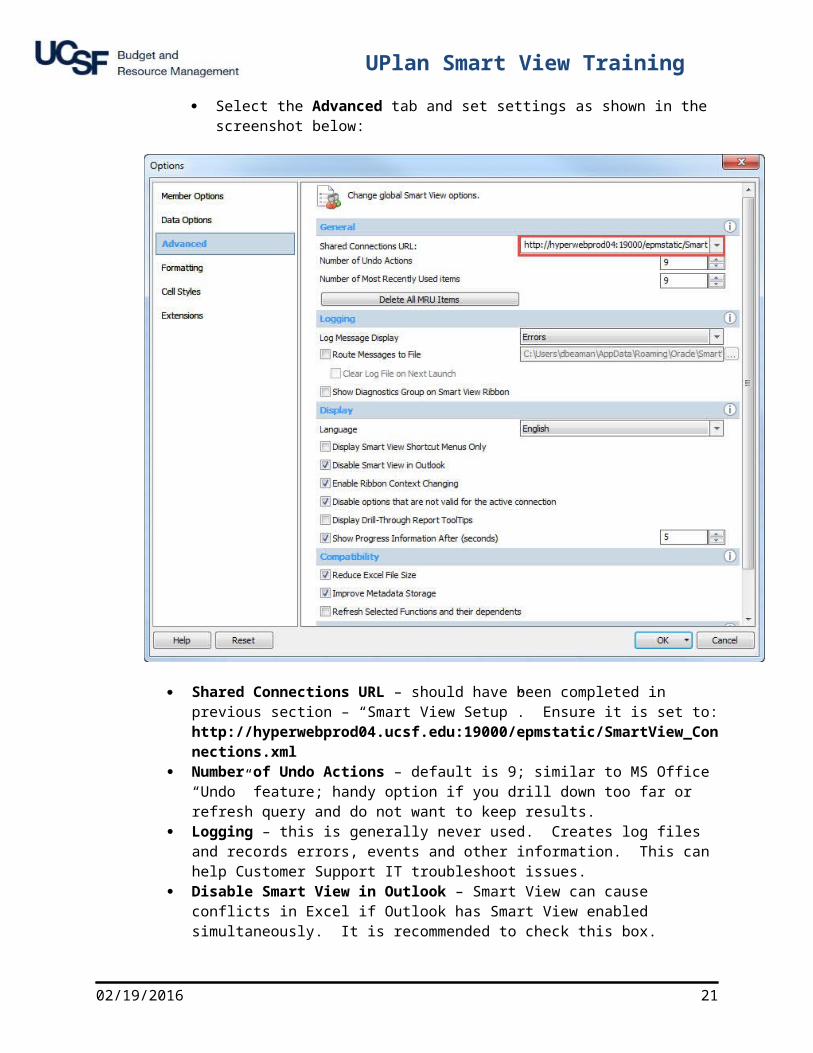
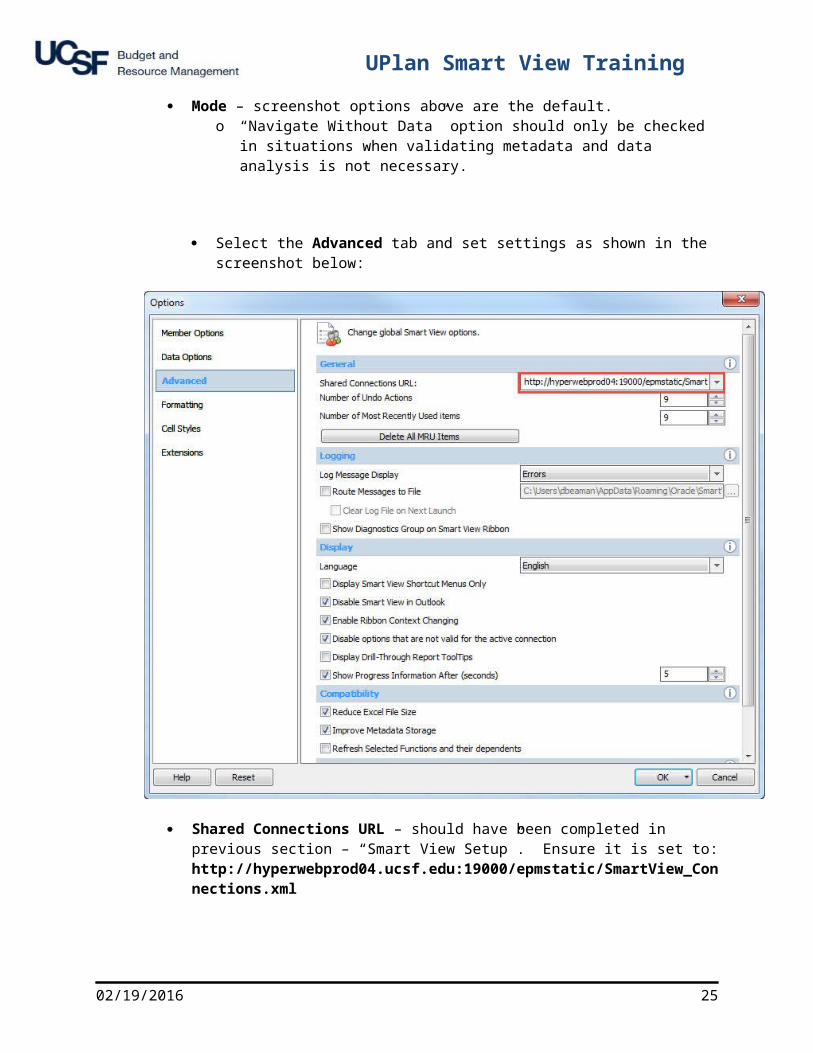
Select the Advanced tab and set settings as shown in the screenshot below:
16 02/19/2016
UPlan Smart View Training
Shared Connections URL – should have been completed in previous section – “Smart View Setup”. Ensure it is set to: http://hyperwebprod04.ucsf.edu:19000/epmstatic/SmartView_Connections.xml
Number of Undo Actions – default is 9; similar to MS Office “Undo” feature; handy option if you drill down too far or refresh query and do not want to keep results.
Logging – this is generally never used. Creates log files and records errors, events and other information. This can help Customer Support IT troubleshoot issues.
Disable Smart View in Outlook – Smart View can cause conflicts in Excel if Outlook has Smart View enabled simultaneously. It is recommended to check this box.
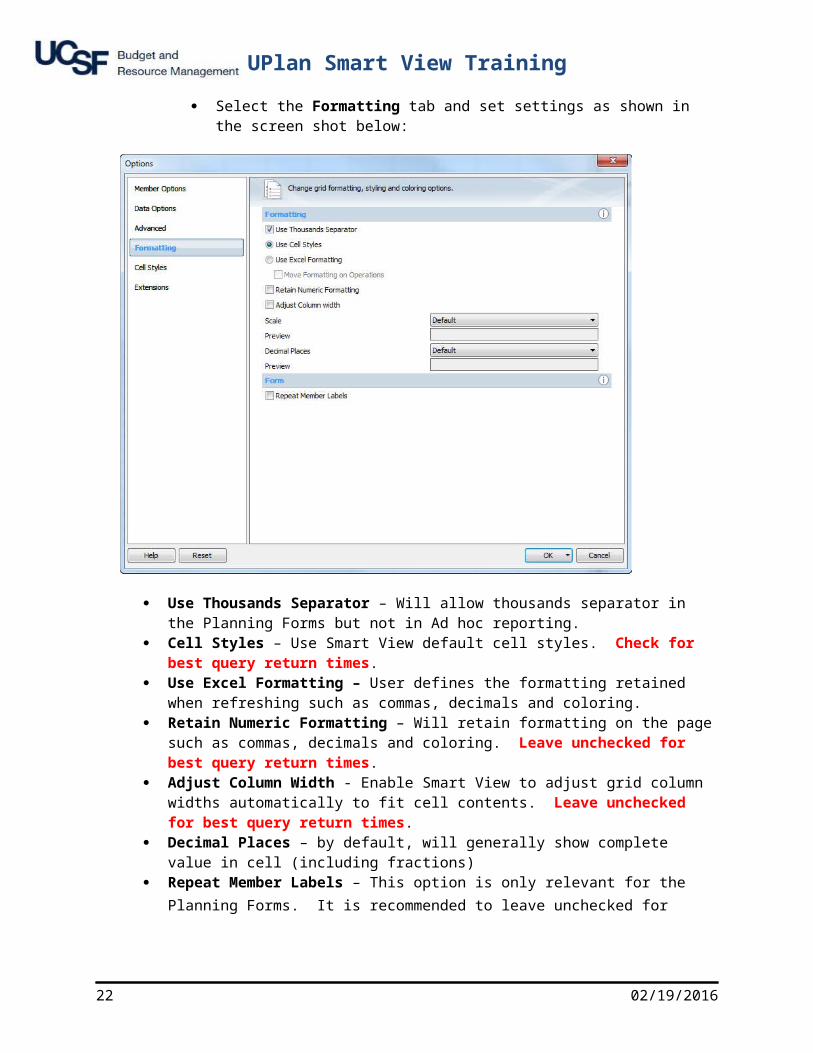
Select the Formatting tab and set settings as shown in the screen shot below:
02/19/2016 17

UPlan Smart View Training
Use Thousands Separator – Will allow thousands separator in the Planning Forms but not in Ad hoc reporting.
Cell Styles – Use Smart View default cell styles. Check for best query return times. Use Excel Formatting – User defines the formatting retained when refreshing such as
commas, decimals and coloring. Retain Numeric Formatting – Will retain formatting on the page such as commas, decimals
and coloring. Leave unchecked for best query return times. Adjust Column Width - Enable Smart View to adjust grid column widths automatically to fit
cell contents. Leave unchecked for best query return times. Decimal Places – by default, will generally show complete value in cell (including fractions) Repeat Member Labels – This option is only relevant for the Planning Forms. It is
recommended to leave unchecked for navigating the forms and checked if you want to copy/paste results into a pivot table for ad hoc analysis.
Cell Styles and Extension tabs – default options do not need to be change.
Settings for Retaining Formatting and Formulas
Setting Smart View options is a user preference. The following settings are recommended for retaining numeric formatting, formulas, or refreshing report templates. Formatting and formulas will be retained using the following settings.
18 02/19/2016
UPlan Smart View Training
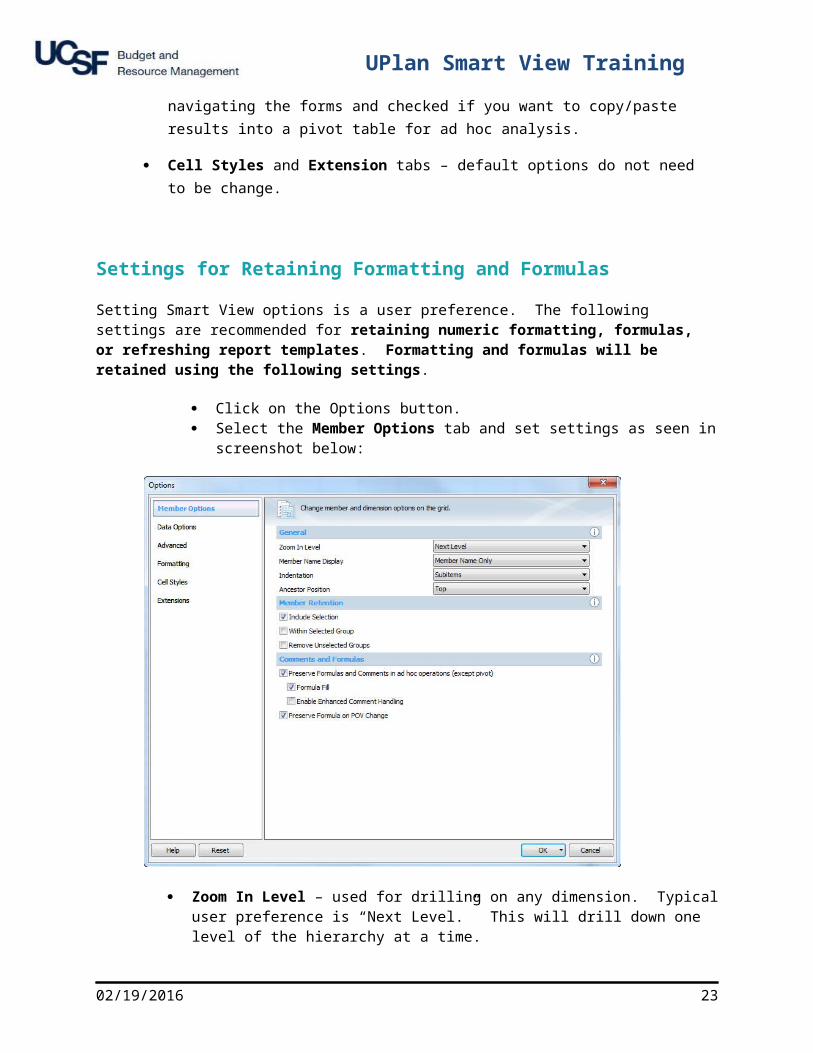
Click on the Options button. Select the Member Options tab and set settings as seen in screenshot below:
Zoom In Level – used for drilling on any dimension. Typical user preference is “Next Level.” This will drill down one level of the hierarchy at a time.
Member Name Display – choose between displaying Member Name Only, Member Name and Description, or Description Only.
Indentation – choose whether to indent totals, subtotals, or no indentation for visual purposes. Note: indentation of Dimension lists indicates the Dimension’s hierarchy.
Member Retention – Include Selection; this will keep totals when drilling on them. Use Double click for Operations – allows mouse functionality for drill-down. Preserve Formula on POV Change – POV (Point of View) box changes will retain Excel
formulas. Check to preserve formulas when refreshing queries or report templates.
Select the Data Options tab and set settings as seen in screenshot below:
02/19/2016 19

UPlan Smart View Training
Suppression Options (Rows/Columns) – Choose whether to display blank rows that have no data. You cannot have these boxes checked if starting from a fresh worksheet. Note: column suppression is currently not allowed.
Replacement - This is the text result that appears when query result is zero/no data.o #NoData/Missing – for blank cells to appear blank, delete “#Missing”
Mode – screenshot options above are the default.o “Navigate Without Data” option should only be checked in situations when
validating metadata and data analysis is not necessary.
Select the Advanced tab and set settings as shown in the screenshot below:
20 02/19/2016
UPlan Smart View Training
Shared Connections URL – should have been completed in previous section – “Smart View Setup”. Ensure it is set to: http://hyperwebprod04.ucsf.edu:19000/epmstatic/SmartView_Connections.xml
Number of Undo Actions – default is 9; similar to MS Office “Undo” feature; handy option if you drill down too far or refresh query and do not want to keep results.
Logging – this is generally never used. Creates log files and records errors, events and other information. This can help Customer Support IT troubleshoot issues.
Disable Smart View in Outlook – Smart View can cause conflicts in Excel if Outlook has Smart View enabled simultaneously. It is recommended to check this box.
02/19/2016 21
UPlan Smart View Training
Select the Formatting tab and set settings as shown in the screen shot below:
Use Thousands Separator – Will allow thousands separator in the Planning Forms but not in Ad hoc reporting.
Cell Styles – Use Smart View default cell styles. Check for best query return times. Use Excel Formatting – User defines the formatting retained when refreshing such as
commas, decimals and coloring. Check to retain Excel formatting when refreshing in queries or report templates.
Retain Numeric Formatting – Will retain formatting on the page such as commas, decimals and coloring. Grayed out if Excel Formatting is checked.
Adjust Column Width - Enable Smart View to adjust grid column widths automatically to fit cell contents. Leave unchecked for best query return times.
Decimal Places – by default, will generally show complete value in cell (including fractions. Repeat Member Labels – This option is only relevant for the Planning Forms. It is
recommended to leave unchecked for navigating the forms and checked if you want to copy/paste results into a pivot table for ad hoc analysis.
Cell Styles and Extension tabs – default options do not need to be change.
22 02/19/2016
UPlan Smart View Training
UPlan Dimensions in Smart View
Dimensions are data elements or variables within a dimensional database and are the primary way that metadata is categorized within the UPlan system. You will notice differences between the Dimensions that you can view in the UPlan web interface versus UPlan in Smart View. Some of these key differences are described below.
Period
This dimension is essentially the same in Smart View as what you see in the web except for the member Admin_Period. This member should not be used for retrievals as it has no data associated with it.
Years
This dimension is essentially the same in Smart View as what you will see in the web except users will see additional years listed as members (i.e. 2012-13, 2017-18). There isn’t any data associated with the outlying years so they shouldn’t be used in retrievals
Scenario
This dimension is set up exactly as Planners will see it the online tool.
Version
This dimension is essentially the same in Smart View as what you will see in the online tool except for the “What If” member. UPlan does not utilize this member so there is no data associated with it. It should not be used for data retrievals.
Fund
This dimension is essentially the same in Smart View as what you will see in the online tool except for “Global Assumptions Funds.” These members are used within UPlan to assist the Global Assumption process and have no data associated with them. They should not be used for data retrievals.
DeptID
This dimension is essentially the same in Smart View as what you will see in the online tool except that Smart View users should use only the Total DeptID hierarchy for data retrievals.
Title Code
The definition of this dimension is the same in Smart View as in UPlan web. The TitleCode dimension is used to identify all of the title codes assigned to an individual employee. An employee can have
02/19/2016 23

UPlan Smart View Training
multiple title codes. Title Codes will be organized in a hierarchy by Title Unit Code (TUC). To look up a TitleCode and its TUC, refer to the Title Code lookup in MyReports or the HR website.
Smart View users should use the “All Title Codes” or “Employee Type” hierarchies for data retrievals. The Input hierarchy is only used to facilitate the Global Assumption processes and has no data associated with them.
Employee
The definition of this dimension is the same in Smart View as in UPlan web and employee names are listed alphabetically based on last name and are grouped by alphabet (e.g., A-C, D-H, I-L, M-Q, R-T, and U-Z).
Project
The definition of this dimension is the same in Smart View as in UPlan web and the hierarchy includes the Project Uses as well as individual Project IDs.
View
UPlan is not currently utilizing this dimension therefore it does not need to be modified in data retrievals. However, it does need to remain somewhere in the worksheet. It is recommended to leave it in the top row which is the location for the Point of View (POV) in Smart View.
Account
This dimension is essentially the same in Smart View as what you will see in UPlan web except accounts are included within this dimension in three separate hierarchies: one for Employee accounts, one for General accounts, and the other for Old Employee accounts for reference only.
Ad Hoc Analysis with Smart View and Essbase
Accessing Essbase via Smart View
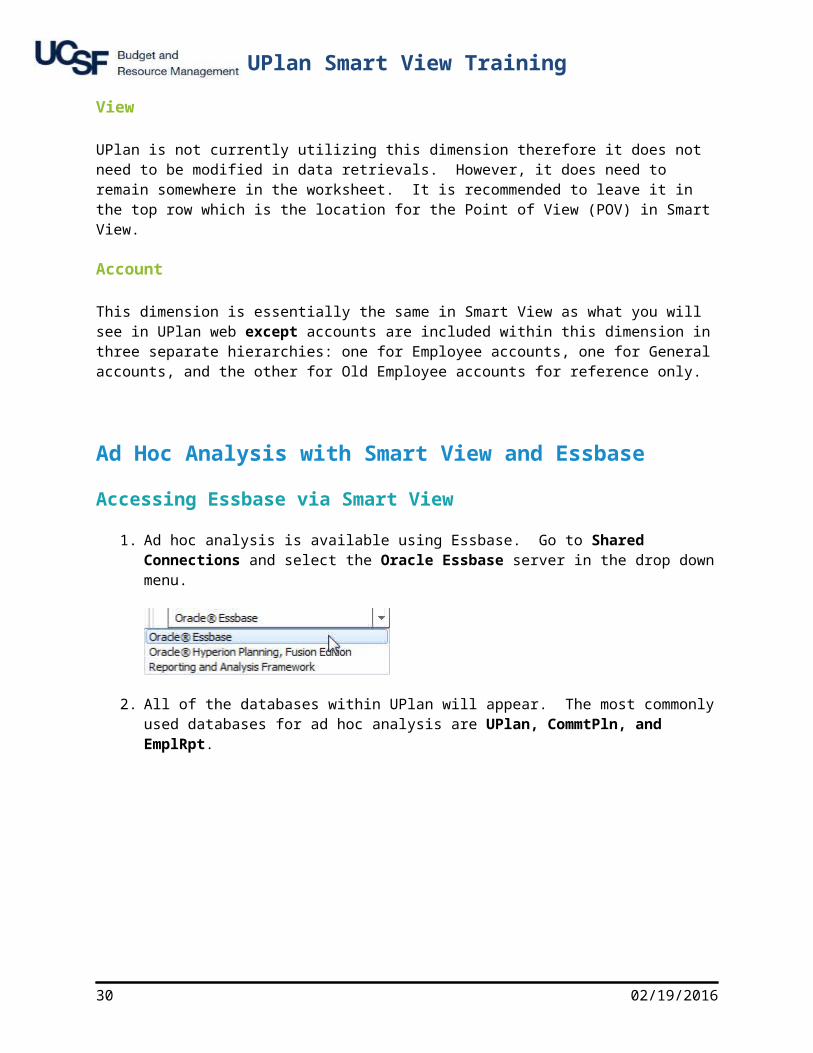
1. Ad hoc analysis is available using Essbase. Go to Shared Connections and select the Oracle Essbase server in the drop down menu.
2. All of the databases within UPlan will appear. The most commonly used databases for ad hoc analysis are UPlan, CommtPln, and EmplRpt.
24 02/19/2016
UPlan Smart View Training
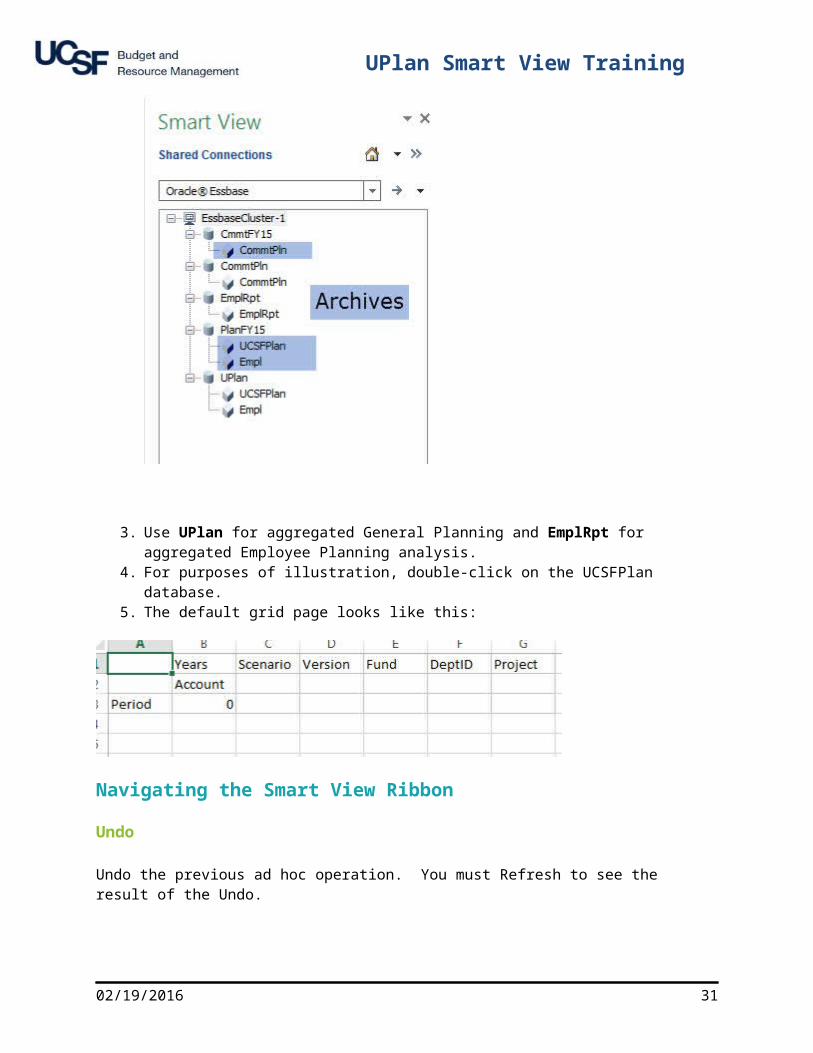
3. Use UPlan for aggregated General Planning and EmplRpt for aggregated Employee Planning analysis.
4. For purposes of illustration, double-click on the UCSFPlan database.5. The default grid page looks like this:
Navigating the Smart View Ribbon
Undo
Undo the previous ad hoc operation. You must Refresh to see the result of the Undo.
02/19/2016 25
UPlan Smart View Training
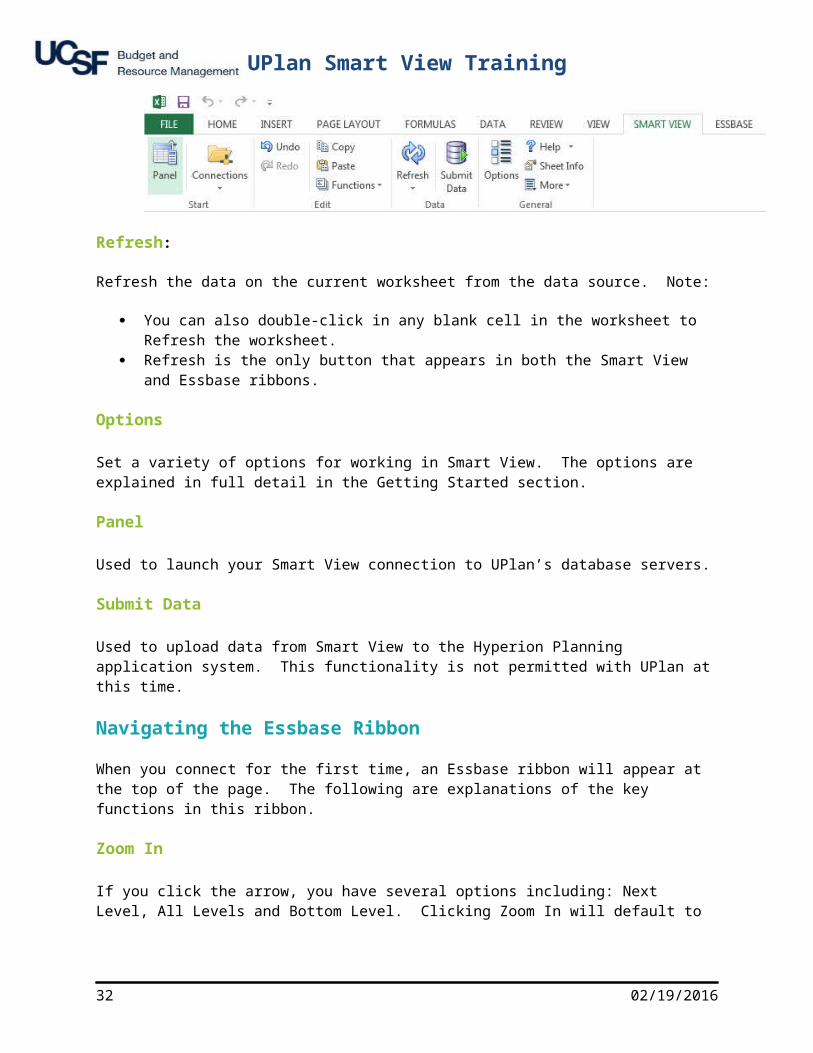
Refresh:
Refresh the data on the current worksheet from the data source. Note:
You can also double-click in any blank cell in the worksheet to Refresh the worksheet. Refresh is the only button that appears in both the Smart View and Essbase ribbons.
Options
Set a variety of options for working in Smart View. The options are explained in full detail in the Getting Started section.
Panel
Used to launch your Smart View connection to UPlan’s database servers.
Submit Data
Used to upload data from Smart View to the Hyperion Planning application system. This functionality is not permitted with UPlan at this time.
Navigating the Essbase Ribbon
When you connect for the first time, an Essbase ribbon will appear at the top of the page. The following are explanations of the key functions in this ribbon.
Zoom In
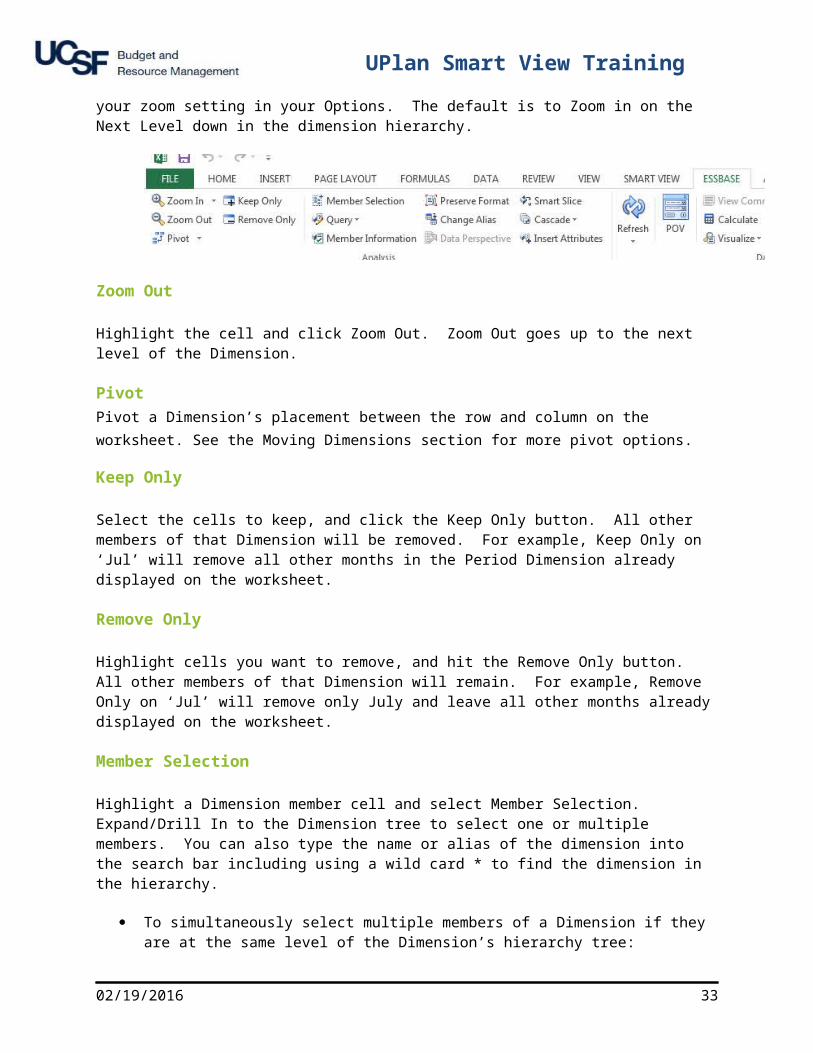
If you click the arrow, you have several options including: Next Level, All Levels and Bottom Level. Clicking Zoom In will default to your zoom setting in your Options. The default is to Zoom in on the Next Level down in the dimension hierarchy.
26 02/19/2016

UPlan Smart View Training
Zoom Out
Highlight the cell and click Zoom Out. Zoom Out goes up to the next level of the Dimension.
PivotPivot a Dimension’s placement between the row and column on the worksheet. See the Moving Dimensions section for more pivot options.
Keep Only
Select the cells to keep, and click the Keep Only button. All other members of that Dimension will be removed. For example, Keep Only on ‘Jul’ will remove all other months in the Period Dimension already displayed on the worksheet.
Remove Only
Highlight cells you want to remove, and hit the Remove Only button. All other members of that Dimension will remain. For example, Remove Only on ‘Jul’ will remove only July and leave all other months already displayed on the worksheet.
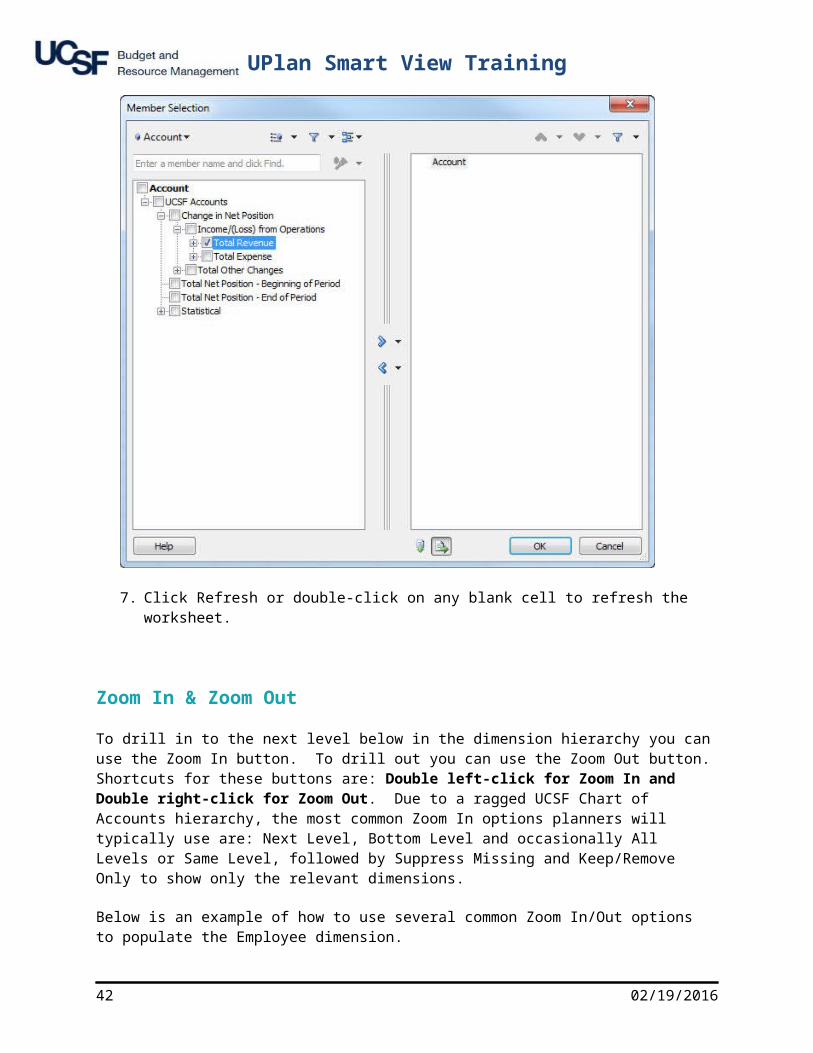
Member Selection
Highlight a Dimension member cell and select Member Selection. Expand/Drill In to the Dimension tree to select one or multiple members. You can also type the name or alias of the dimension into the search bar including using a wild card * to find the dimension in the hierarchy.
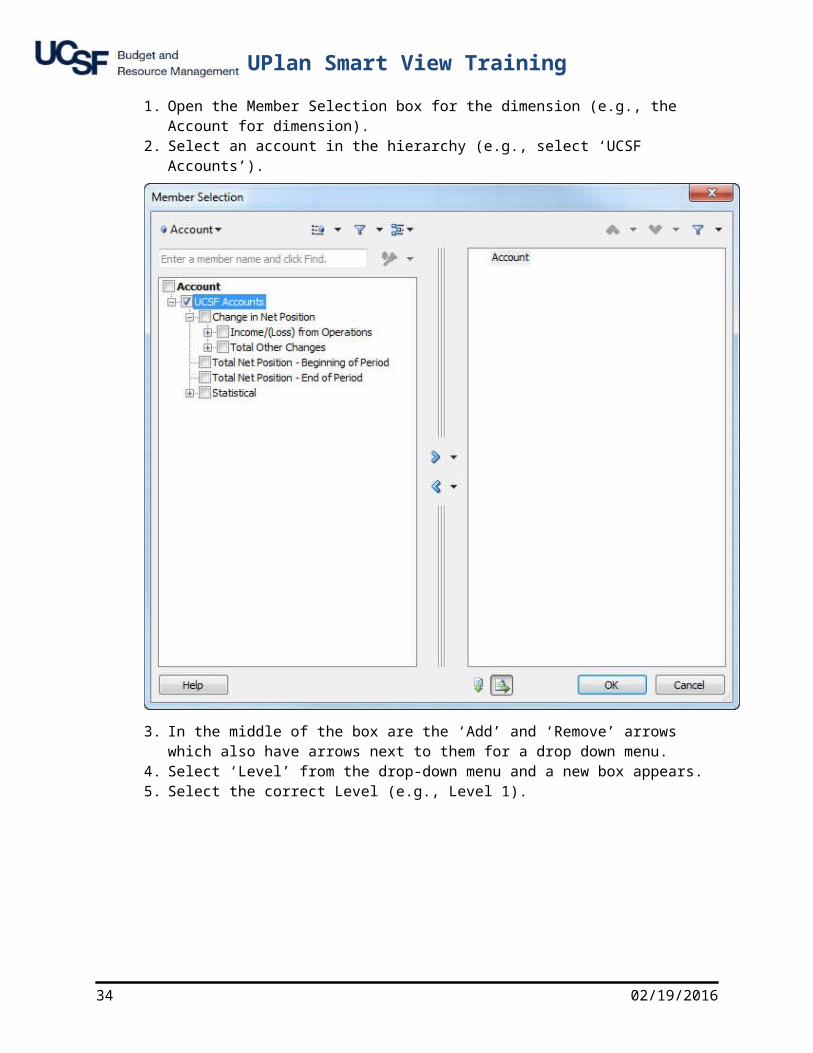
To simultaneously select multiple members of a Dimension if they are at the same level of the Dimension’s hierarchy tree:
1. Open the Member Selection box for the dimension (e.g., the Account for dimension).2. Select an account in the hierarchy (e.g., select ‘UCSF Accounts’).
02/19/2016 27

UPlan Smart View Training
3. In the middle of the box are the ‘Add’ and ‘Remove’ arrows which also have arrows next to them for a drop down menu.
4. Select ‘Level’ from the drop-down menu and a new box appears.5. Select the correct Level (e.g., Level 1).
28 02/19/2016

UPlan Smart View Training
02/19/2016 29
UPlan Smart View Training
6. Everything that falls under Level 1 in the selected Dimension’s hierarchy will appear in the right-hand side box.
7. NOTE: This doesn’t guarantee that you’ve selected every member you desire, so you’ll probably want to pull in a parent member from the hierarchy to check your totals (e.g., pull in Total Revenue or Total Expense and compare that value to the sum of the accounts you pulled from step 8).
Refresh
Refresh the data on the current worksheet from the data source. Note:
1. You can also double-click in any blank cell in the worksheet to Refresh the worksheet.2. Refresh is the only button that appears in both the Smart View and Essbase ribbons.3. The best practice when manually moving dimensions by dragging/dropping or cut/pasting on
the worksheet is to Refresh the worksheet after each dimension is moved.
30 02/19/2016
UPlan Smart View Training
Change Alias
By default Smart View populates dimension Aliases when starting from a blank worksheet. Aliases while helpful because they are longer and more descriptive, also take up more space on your screen. If you wish you change the aliases to show the dimension names instead, click Change Alias > Select None. The dimensions all change from their aliases to their names. Navigating and knowing the Essbase Names instead of Aliases takes practice. Click Change Alias > Select Default to change the names back to aliases.
Point of View (POV)
The POV is the location of the static dimensions that you wish to persist throughout the entire worksheet. The Columns and Rows are the location for the non-static dimensions that can change.
To illustrate, in the UCSFPlan cube Revenue & Expense form the dimensions in the POV are the DeptID, Fund, and Project. When you select these three dimensions, they are the 3 static members that you see reflected on that form. All other dimensions are non-static and are located in the Columns and Rows. In the Revenue & Expense Form example, Scenario could be either Plan or Actual; Account could be Staff Salaries or ICR Revenue; Period could be either Jul or YearTotal, etc.
In Smart View the POV location is by default, in the top row. However, the POV can be viewed three different ways in Smart View. The examples and screen shots below refer to dimensions in the UCSFRptg cube.
POV Option 1 (Default): POV Dimensions in the top row
When dimensions come in on a blank/new worksheet in Excel they appear with most dimensions in the top row, the View Dimension in the Column, and the Account Dimension in the Row (see below). Though nothing in Excel explicitly states that POV = top row, in Smart View the POV is the first row where Dimensions appear. This means it is possible to insert blank rows above Row 1. If you do this the POV Dimensions must all be on the same line. If they are not on the same line Essbase will read the highest row with any Dimension as the POV, and all dimensions below that row as either a Row or Column.
POV Option 2: POV Dimensions floating in the worksheet
When you click the POV button in the Essbase ribbon, it removes the Dimensions from Row 1 and puts them into a floating POV window. Notice you can now toggle/change your POV Dimensions as drop down menu items.
02/19/2016 31
UPlan Smart View Training
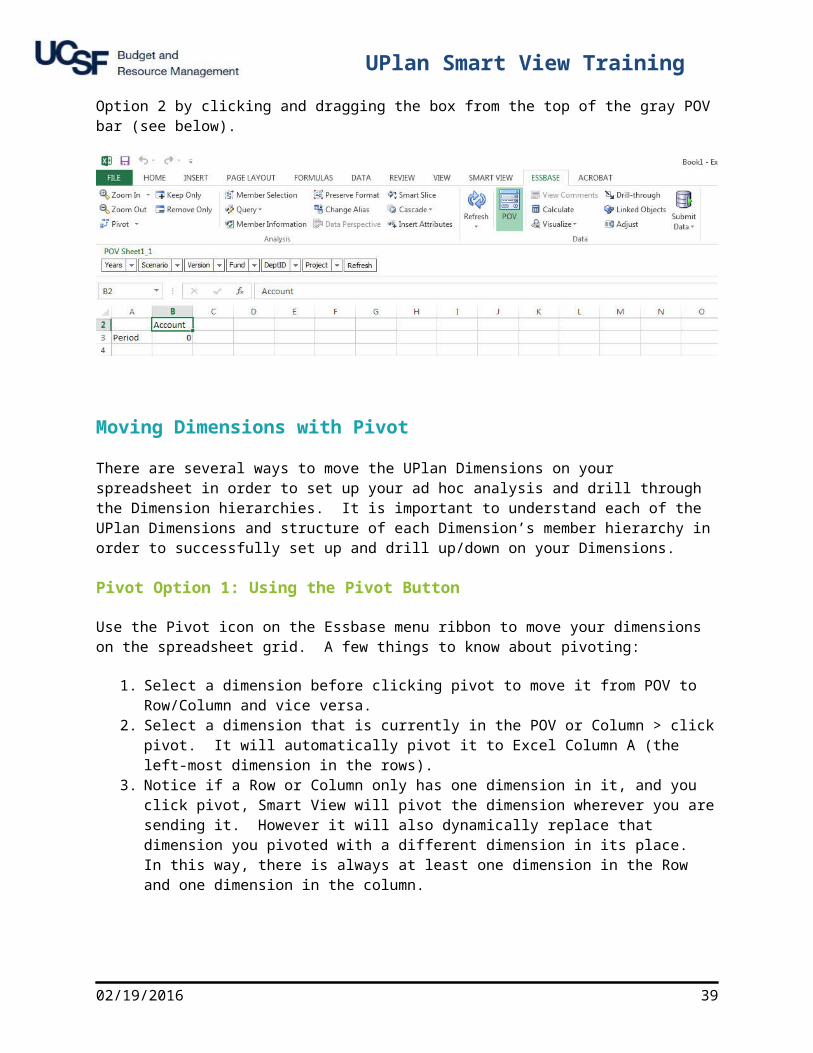
POV Option 3: POV Dimensions fixed above the top row
From Option 2, when you click and drag the floating POV box above the top row, Excel dynamically creates space for you to drop the box into its own window (see below). The drop down menu item functionality is the same as Option 2. You can drag/drop the POV from Option 3 back to Option 2 by clicking and dragging the box from the top of the gray POV bar (see below).
Moving Dimensions with Pivot
There are several ways to move the UPlan Dimensions on your spreadsheet in order to set up your ad hoc analysis and drill through the Dimension hierarchies. It is important to understand each of the UPlan Dimensions and structure of each Dimension’s member hierarchy in order to successfully set up and drill up/down on your Dimensions.
Pivot Option 1: Using the Pivot Button
32 02/19/2016
UPlan Smart View Training
Use the Pivot icon on the Essbase menu ribbon to move your dimensions on the spreadsheet grid. A few things to know about pivoting:
1. Select a dimension before clicking pivot to move it from POV to Row/Column and vice versa.2. Select a dimension that is currently in the POV or Column > click pivot. It will automatically pivot
it to Excel Column A (the left-most dimension in the rows).3. Notice if a Row or Column only has one dimension in it, and you click pivot, Smart View will pivot
the dimension wherever you are sending it. However it will also dynamically replace that dimension you pivoted with a different dimension in its place. In this way, there is always at least one dimension in the Row and one dimension in the column.
Pivot Option 2: Left-click to drag and drop
When a dimension is selected, Smart View will put a black bold border around it (see screen shot below). Moving your cursor to the border changes the cursor into a crosshairs, allowing you to “grab” the dimension. Click and drag that dimension from a row to a column, etc.
Best Practice Recommendation: Refresh the worksheet every time you move a dimension anywhere on the screen.
Pivot Option 3: Right click to drag and dropHolding down the right click on your mouse and dragging a dimension to its desired location will also move it. There are several benefits to this method:
1. Smart View will dynamically move the other dimensions on the page to accommodate the new dimension locations.
2. During the drag/drop the Dimension name appears in a tan box next to your cursor so you know what you are moving/pivoting.
3. Since the dimensions are dynamically moved you will not need to refresh the worksheet after dropping it.
Populating Dimensions
Typing Members directly into the cell
The fastest way to populate a dimension is to type it directly into the cell. You can type the member name or alias (see the UPlan Dimensions section in Smart View section for dimension explanations). Several things to know about this functionality:
1. It does not matter if you type the Essbase Dimension Name or Alias (ie the Essbase Name is ‘5000 and Essbase Alias is “5000: Campus core fund”.
2. Occasionally Essbase will recognize typos but in general either the Name or Alias must be entered without typos to be recognized.
02/19/2016 33
UPlan Smart View Training
3. It does not matter if you type a dimension in lower/upper case or some combination thereof (ie. “total funds” will render the same result as “Total Funds”.
4. When you type in your dimensions, you must refresh the worksheet to render the new/modified dimensions.
5. You can type over existing members with a different member of the same dimension and refresh without issue.
6. You can type over existing members with a different member of a different dimension, but you may have an issue if the member is now in both the row and column (not allowed).
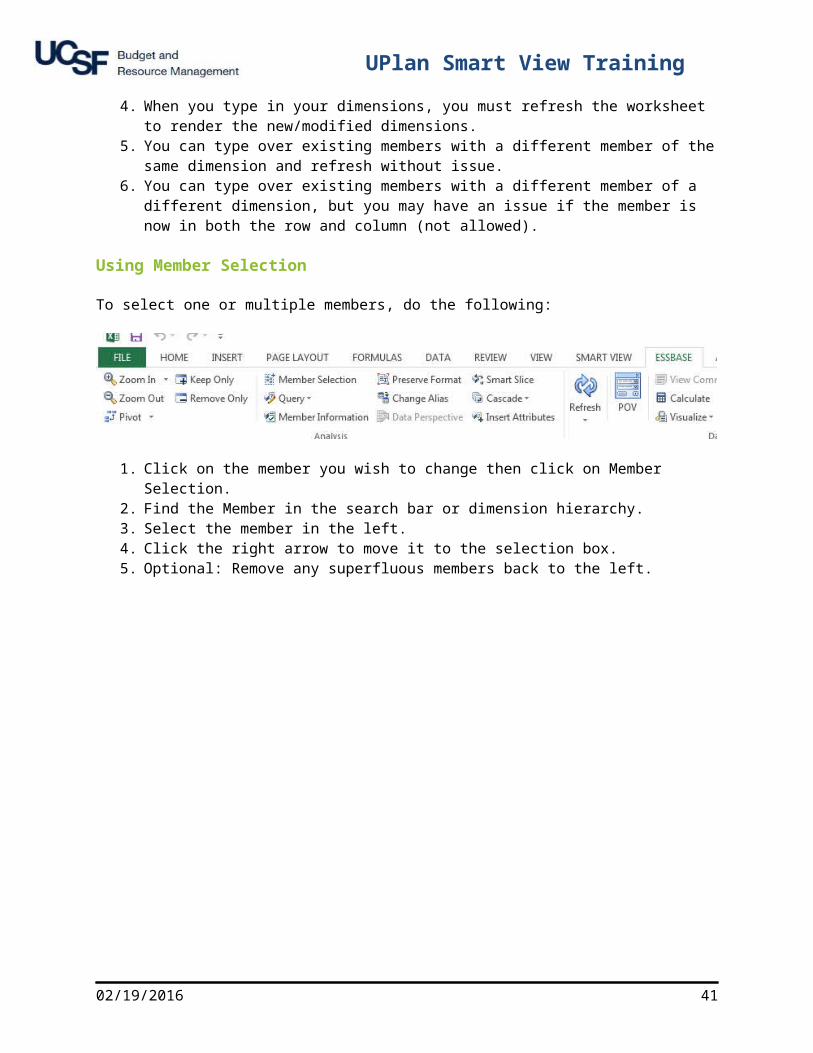
Using Member Selection
To select one or multiple members, do the following:
1. Click on the member you wish to change then click on Member Selection.2. Find the Member in the search bar or dimension hierarchy.3. Select the member in the left.4. Click the right arrow to move it to the selection box.5. Optional: Remove any superfluous members back to the left.
34 02/19/2016

UPlan Smart View Training
7. Click Refresh or double-click on any blank cell to refresh the worksheet.
Zoom In & Zoom Out
To drill in to the next level below in the dimension hierarchy you can use the Zoom In button. To drill out you can use the Zoom Out button. Shortcuts for these buttons are: Double left-click for Zoom In and Double right-click for Zoom Out. Due to a ragged UCSF Chart of Accounts hierarchy, the most common Zoom In options planners will typically use are: Next Level, Bottom Level and occasionally All Levels or Same Level, followed by Suppress Missing and Keep/Remove Only to show only the relevant dimensions.
Below is an example of how to use several common Zoom In/Out options to populate the Employee dimension.
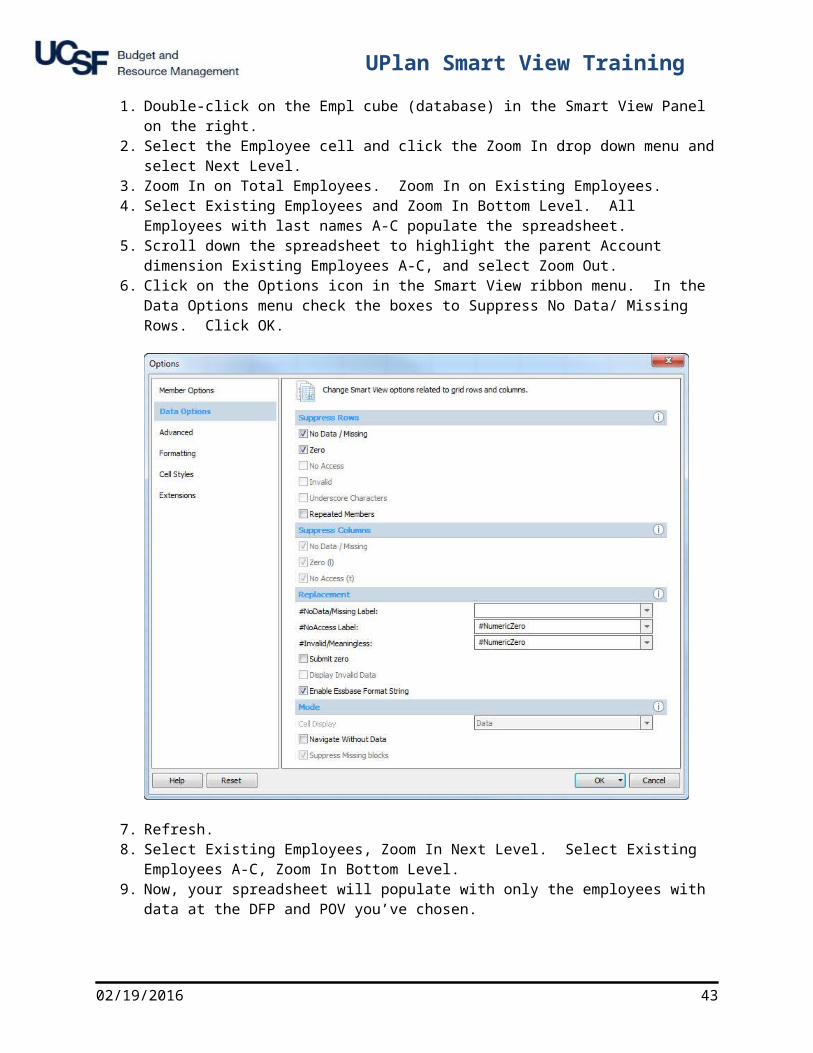
1. Double-click on the Empl cube (database) in the Smart View Panel on the right.2. Select the Employee cell and click the Zoom In drop down menu and select Next Level. 3. Zoom In on Total Employees. Zoom In on Existing Employees.
02/19/2016 35

UPlan Smart View Training
4. Select Existing Employees and Zoom In Bottom Level. All Employees with last names A-C populate the spreadsheet.
5. Scroll down the spreadsheet to highlight the parent Account dimension Existing Employees A-C, and select Zoom Out.
6. Click on the Options icon in the Smart View ribbon menu. In the Data Options menu check the boxes to Suppress No Data/ Missing Rows. Click OK.
7. Refresh.8. Select Existing Employees, Zoom In Next Level. Select Existing Employees A-C, Zoom In Bottom
Level. 9. Now, your spreadsheet will populate with only the employees with data at the DFP and POV
you’ve chosen.10. Use Excel formatting functions to format your number data as desired.
36 02/19/2016

UPlan Smart View Training
Advanced Tips and Tricks
Type Dimension Names not Aliases
In Navigating the Essbase Ribbon you read the description of the Change Alias button. You also read the fastest way to populate a dimension into a cell is to type it directly into a cell. Therefore, the fastest way to enter a dimension into a cell is to type its Name instead of its Alias. This trick usually takes practice and probably requires you to Click the Change Alias button and select ‘None’ so that you can familiarize yourself with Dimension Names instead of Aliases. Below are the Dimension Names with common examples that will definitely speed up ad hoc analysis queries.
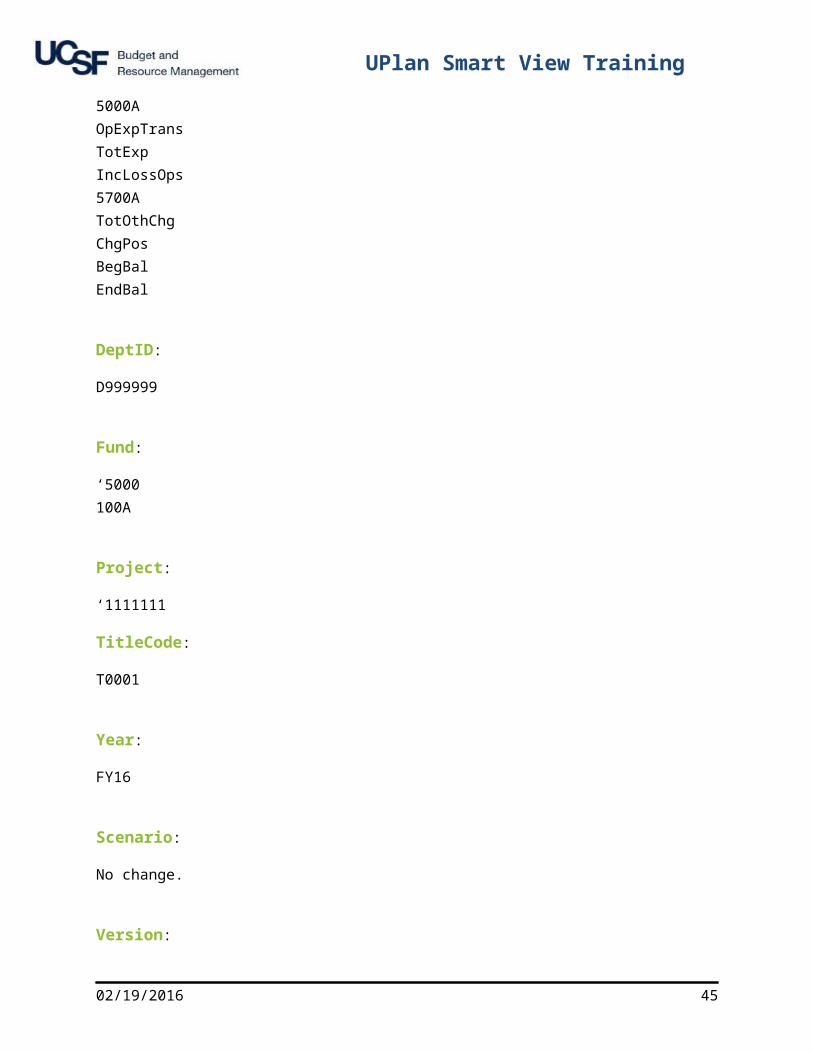
Note: due to Excel functionality, a cell with all numbers will be read as a number instead of text. Therefore Essbase will read it as data in the wrong location instead of metadata in the correct location, and you will receive an error. In the examples below, Account 43150, Fund 5000 and ProjectID 1111111 require an ‘ apostrophe so that they will be read as text (metadata), whereas Fund 100A, Title Code T0001 and DeptID D999999 include a letter therefore do not need to be preceded by an ‘ apostrophe.
Account:
4000A/B/C/E‘43501OpRevTransTotRev 5000AOpExpTransTotExp IncLossOps5700ATotOthChgChgPosBegBalEndBal
DeptID:
D999999
Fund:
02/19/2016 37

UPlan Smart View Training
‘5000100A
Project:
‘1111111
TitleCode:
T0001
Year:
FY16
Scenario:
No change.
Version:
No change.
Period:
No change.
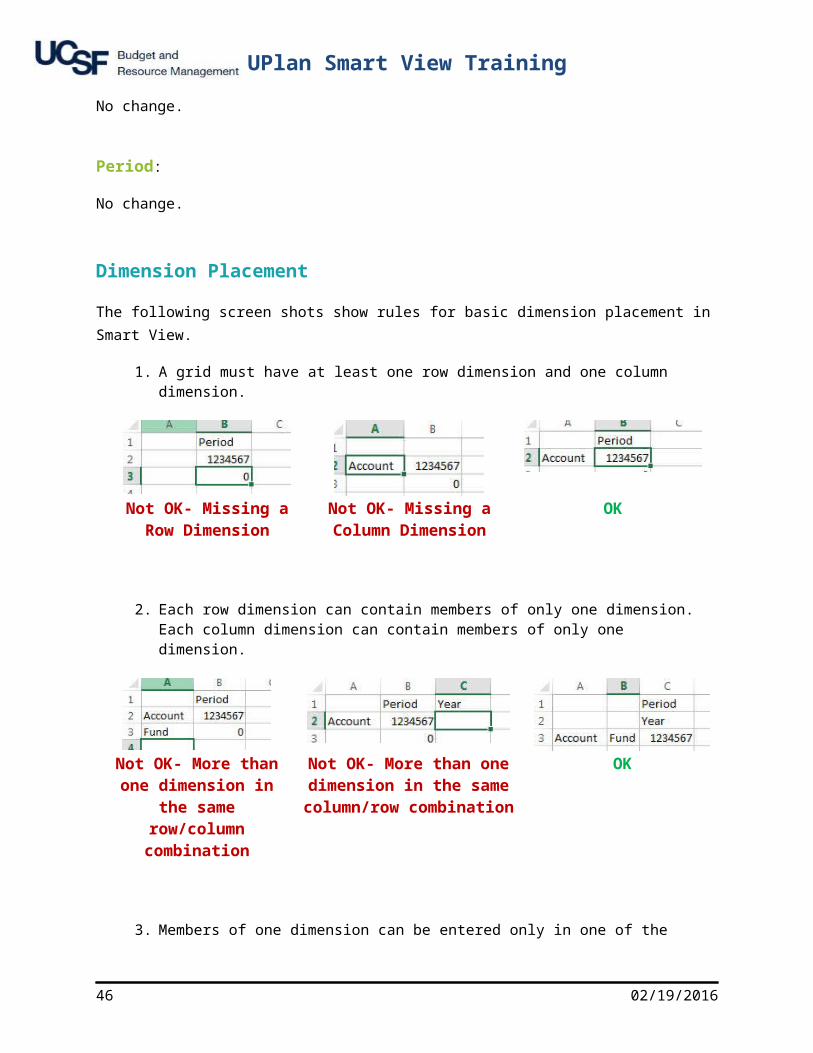
Dimension Placement
The following screen shots show rules for basic dimension placement in Smart View.
1. A grid must have at least one row dimension and one column dimension.
Not OK- Missing a Row Dimension
Not OK- Missing a Column Dimension
OK
38 02/19/2016
UPlan Smart View Training
2. Each row dimension can contain members of only one dimension. Each column dimension can contain members of only one dimension.
Not OK- More than one dimension in the same
row/column combination
Not OK- More than one dimension in the same
column/row combination
OK
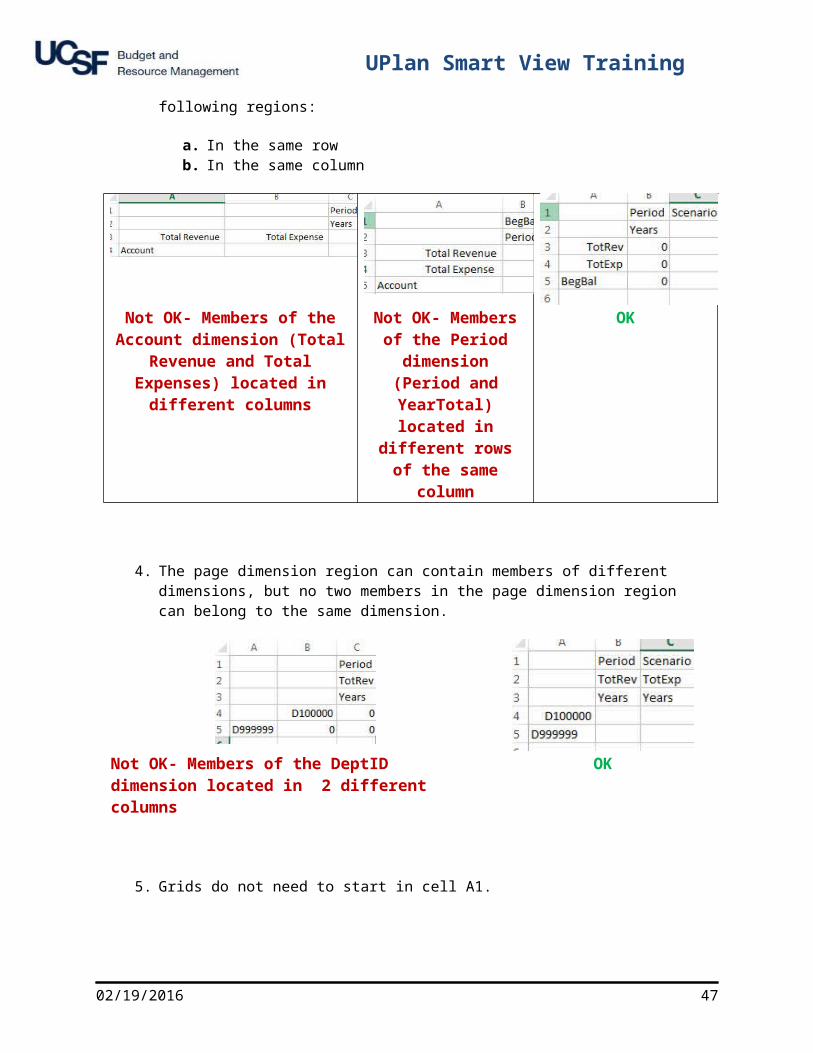
3. Members of one dimension can be entered only in one of the following regions:
a. In the same rowb. In the same column
Not OK- Members of the Account dimension (Total Revenue and Total
Expenses) located in different columns
Not OK- Members of the Period dimension (Period and YearTotal)
located in different rows of the same
column
OK
4. The page dimension region can contain members of different dimensions, but no two members in the page dimension region can belong to the same dimension.
Not OK- Members of the DeptID dimension located in OK
02/19/2016 39
UPlan Smart View Training
2 different columns
5. Grids do not need to start in cell A1.
OK
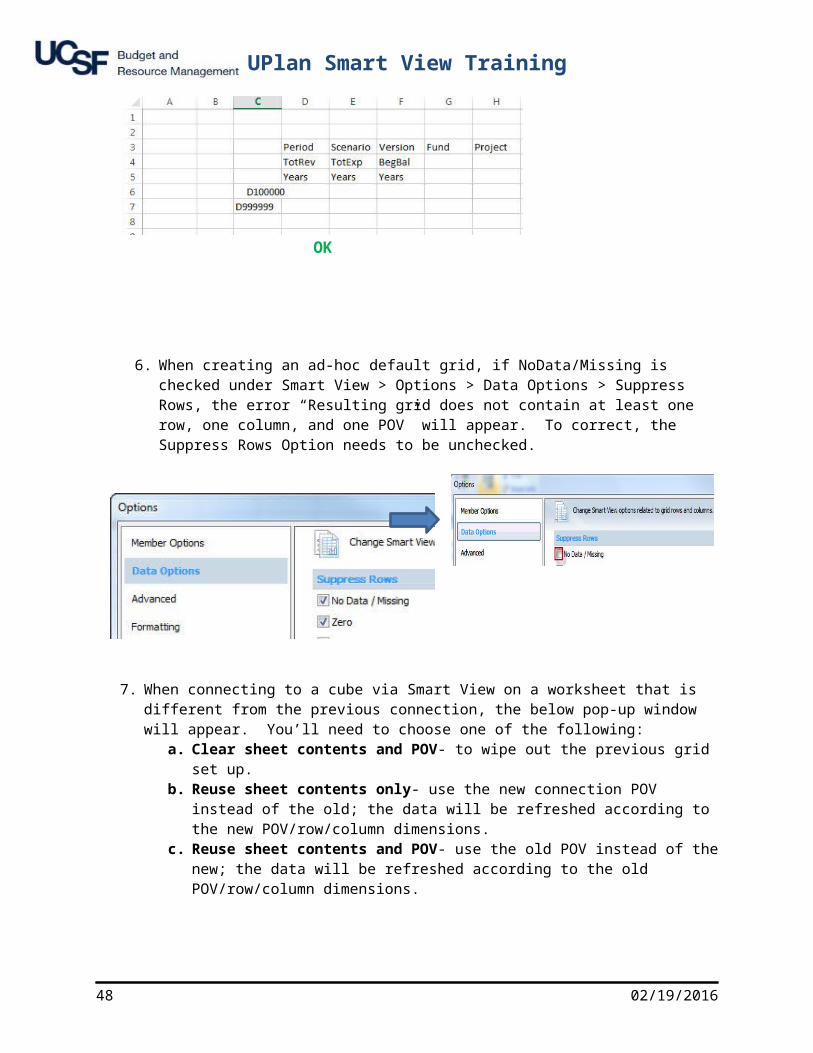
6. When creating an ad-hoc default grid, if NoData/Missing is checked under Smart View > Options > Data Options > Suppress Rows, the error “Resulting grid does not contain at least one row, one column, and one POV” will appear. To correct, the Suppress Rows Option needs to be unchecked.
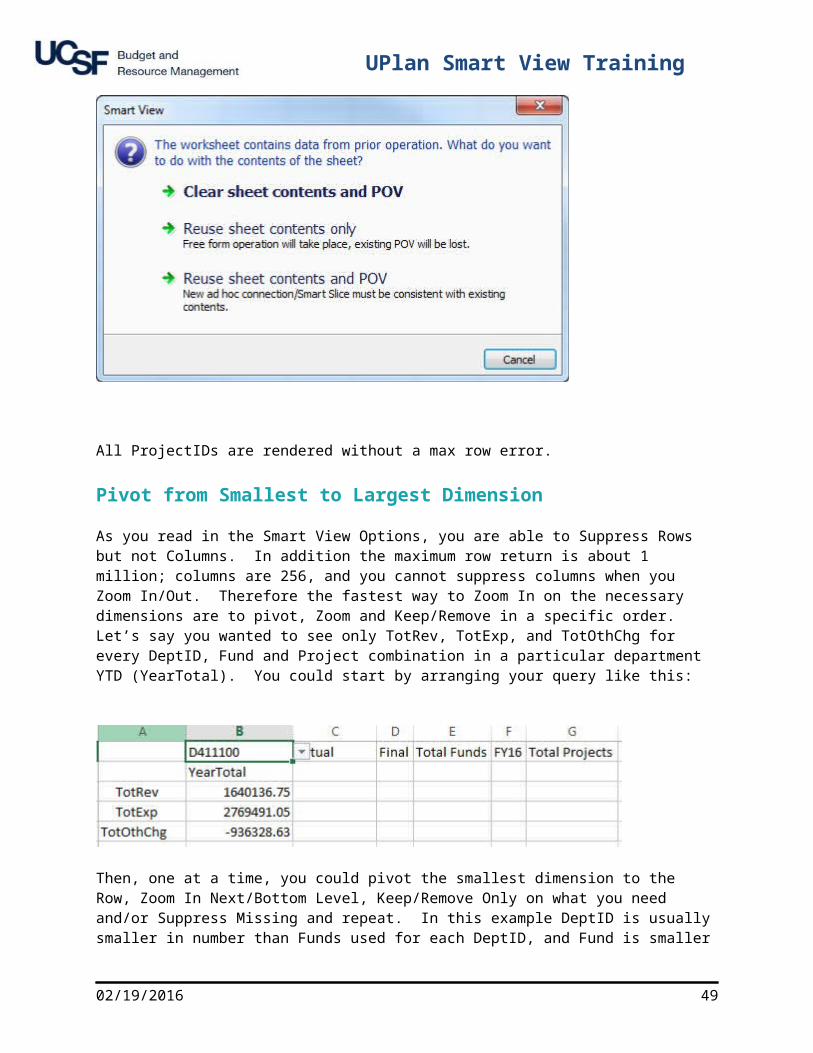
7. When connecting to a cube via Smart View on a worksheet that is different from the previous connection, the below pop-up window will appear. You’ll need to choose one of the following:
a. Clear sheet contents and POV- to wipe out the previous grid set up.b. Reuse sheet contents only- use the new connection POV instead of the old; the data will
be refreshed according to the new POV/row/column dimensions.c. Reuse sheet contents and POV- use the old POV instead of the new; the data will be
refreshed according to the old POV/row/column dimensions.
40 02/19/2016
UPlan Smart View Training
All ProjectIDs are rendered without a max row error.
Pivot from Smallest to Largest Dimension
As you read in the Smart View Options, you are able to Suppress Rows but not Columns. In addition the maximum row return is about 1 million; columns are 256, and you cannot suppress columns when you Zoom In/Out. Therefore the fastest way to Zoom In on the necessary dimensions are to pivot, Zoom and Keep/Remove in a specific order. Let’s say you wanted to see only TotRev, TotExp, and TotOthChg for every DeptID, Fund and Project combination in a particular department YTD (YearTotal). You could start by arranging your query like this:
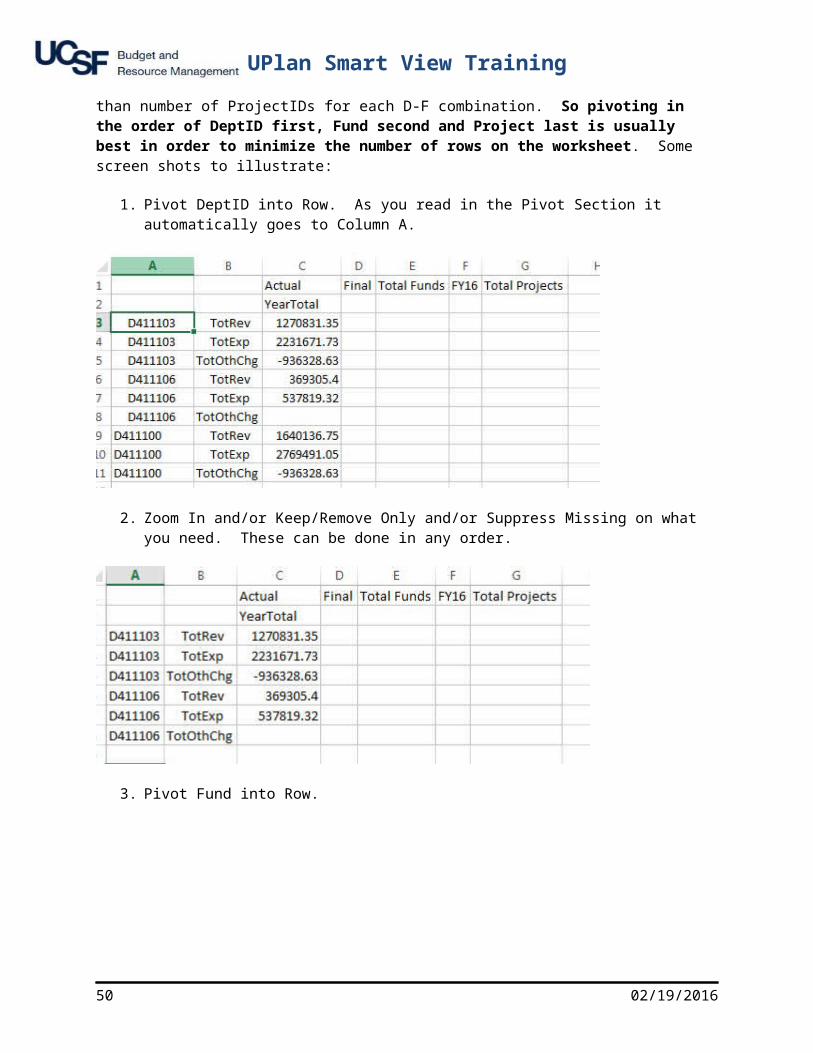
Then, one at a time, you could pivot the smallest dimension to the Row, Zoom In Next/Bottom Level, Keep/Remove Only on what you need and/or Suppress Missing and repeat. In this example DeptID is usually smaller in number than Funds used for each DeptID, and Fund is smaller than number of ProjectIDs for each D-F combination. So pivoting in the order of DeptID first, Fund second and Project last is usually best in order to minimize the number of rows on the worksheet. Some screen shots to illustrate:
1. Pivot DeptID into Row. As you read in the Pivot Section it automatically goes to Column A.
02/19/2016 41
UPlan Smart View Training
2. Zoom In and/or Keep/Remove Only and/or Suppress Missing on what you need. These can be done in any order.
3. Pivot Fund into Row.
4. Right-click drag and drop to move DeptID to the left of Fund.
42 02/19/2016
UPlan Smart View Training
5. Zoom In and/or Keep/Remove Only and/or Suppress Missing on the Funds you need. These can be done in any order. Pro Tip: Go to Smart View Ribbon > Member Options > Uncheck Include Selection Box in Member Retention section to drill to Bottom level without seeing any parent dimensions like “Total Funds”, etc.
6. Pivot Project into Row. Pro Tip: right-click drag and drop Project in between Fund and Account.
02/19/2016 43

UPlan Smart View Training
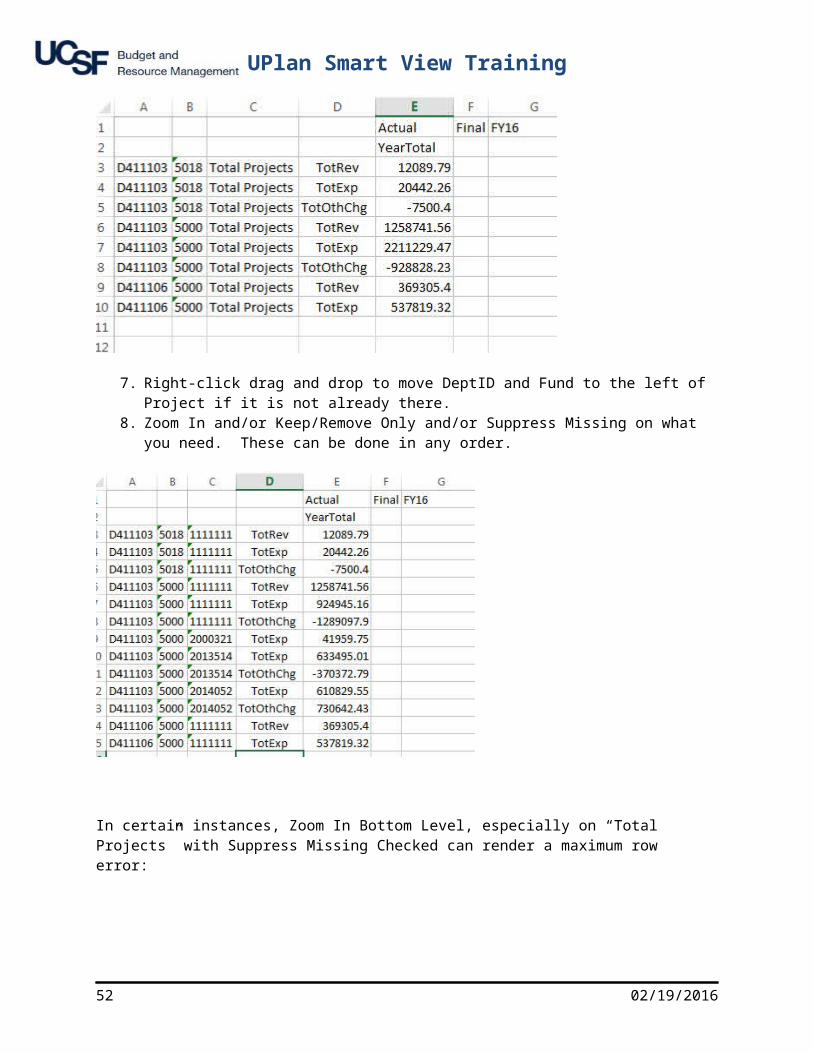
7. Right-click drag and drop to move DeptID and Fund to the left of Project if it is not already there.8. Zoom In and/or Keep/Remove Only and/or Suppress Missing on what you need. These can be
done in any order.
In certain instances, Zoom In Bottom Level, especially on “Total Projects” with Suppress Missing Checked can render a maximum row error:
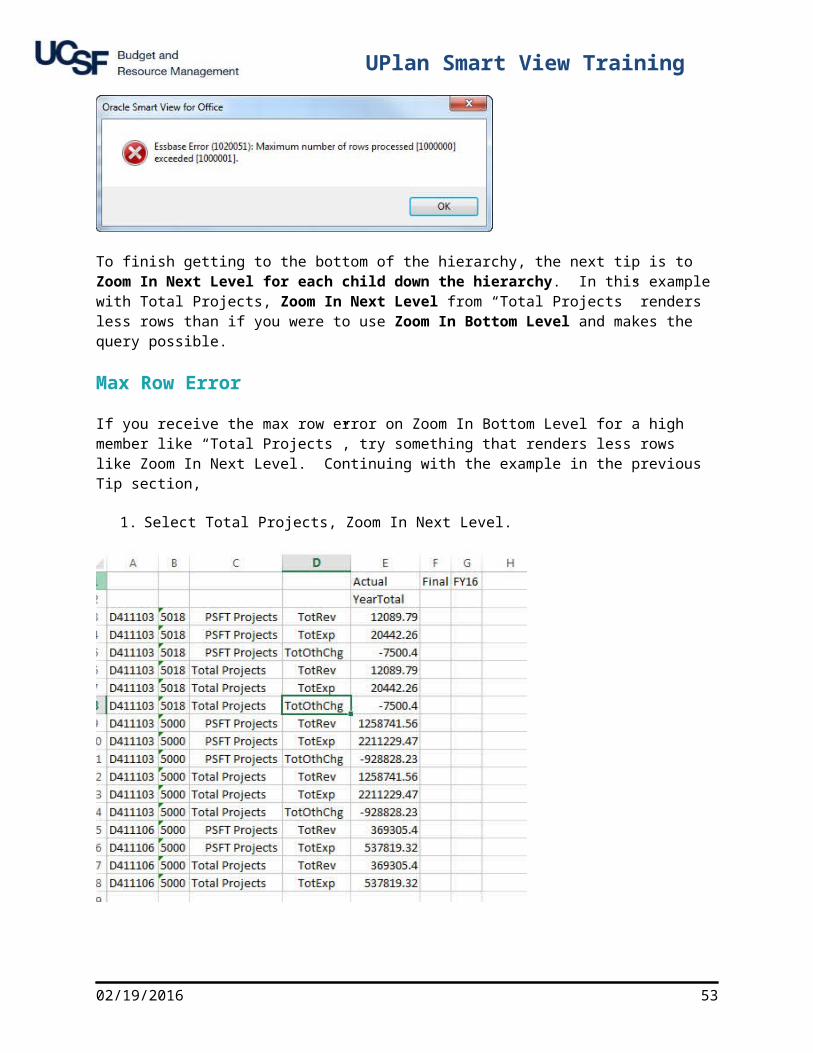
To finish getting to the bottom of the hierarchy, the next tip is to Zoom In Next Level for each child down the hierarchy. In this example with Total Projects, Zoom In Next Level from “Total Projects” renders less rows than if you were to use Zoom In Bottom Level and makes the query possible.
Max Row Error
If you receive the max row error on Zoom In Bottom Level for a high member like “Total Projects”, try something that renders less rows like Zoom In Next Level. Continuing with the example in the previous Tip section,
1. Select Total Projects, Zoom In Next Level.
44 02/19/2016
UPlan Smart View Training
2. Notice Total Project is now the next child down in the project hierarchy, PSFT Projects. Zoom In Next Level again.
02/19/2016 45
UPlan Smart View Training
3. Notice PSFT Projects is now the next level down, Project Uses like General and Prog_Investmt. Zoom In on General first.
4. Then Zoom In on Prog_Investmt > Keep Only on the Project IDs or Remove Only on the Project Uses.
46 02/19/2016
UPlan Smart View Training
Cascade
Occasionally you will want to Zoom In and populate the results of each dimension on different worksheets either within the same workbook, in another workbook, or multiple workbooks. The Cascade feature allows you to pull the data and quickly arrange it in this manner. For example, if you wanted to show the YTD actuals for all FAS departments with each Level E accounts in the Rows and each Department in a separate workbook, you would do the following:
1. Enter the relevant dimensions from scratch with repeated dimensions in the POV.
02/19/2016 47
UPlan Smart View Training
2. High-level Accounts are in the Rows.3. Drill In Bottom Level on the high level accounts.
4. Suppress Missing on Rows. Highlight all of the level F accounts under Total Revenue and select the Zoom Out button. Repeat for level F accounts under Total Expense and Total Other Changes.
48 02/19/2016
UPlan Smart View Training
5. The Dimension you are cascading must be in the POV. If it is in the Row or Column, you will not be able to cascade it. In this example, since you are cascading DeptID, verify that it is in the POV. Click on Cascade. You will see 3 options for Cascade:
02/19/2016 49
UPlan Smart View Training
a. Same Workbook. This option will open a separate worksheet for each dimension chosen to cascade in the current workbook.
b. New Workbook. This option will open a new workbook with each dimension chosen to cascade on each worksheet in the new workbook.
c. Different Workbooks. This option will open a new workbook for each dimension chosen to cascade on one worksheet in each new workbook.
6. Choose the first one for each DeptID tab to appear in the current worksheet.
7. The Member Selection dialog appears with the default dimension in the upper left corner the first dimension in the POV.
8. Click on it to change it to the dimension you want to cascade. In this case, change Period to DeptID.
50 02/19/2016

UPlan Smart View Training
9. Select the DeptIDs you wish to cascade. Pro Tip: enter D400000 in the search bar and click Enter. Select D400000 and in the drop down menu in the middle select Children. Move any dimensions already in the right side of the box back to the left. Click ok.
02/19/2016 51
UPlan Smart View Training
10. The DeptIDs chosen appear as separate worksheets in the same workbook with each worksheet named according to the DeptID in that POV.
Troubleshooting
What do I do if Smart View becomes disabled in my Excel app?
1. Open Excel and go to File > Options > Add-Ins.
52 02/19/2016
UPlan Smart View Training
2. On the Manage drop down list at the bottom of the Options window, select “Disabled Items” and click Go.
3. After you click on Go the following window will appear.
4. In the case where Smart View was disabled, you will see Smart View in the disabled items box.
5. Select Smart View and click on Enable.6. Close Excel and reopen it, and Smart View should show up again.
UPlan User Support Info
For user support, send an email to: [email protected] .
02/19/2016 53


![Material View[1]](https://static.fdocuments.us/doc/165x107/577d34741a28ab3a6b8e11df/material-view1.jpg)