Highway 99 Corridor Urban Activity Profile and Market Assessment
56
City of Lynnwood Highway 99 Corridor Urban Activity Profile and Market Assessment April 2008 Principal: Chris Mefford Project Analysts: Marlo Isaac Dawn Couch Meredith Hermann Mike Babb with ClearPath RE Rob Larsen, SIOR 1402 Third Avenue, Suite 930 Seattle, Washington 98101 tel: 206.523.6683 fax: 866.726.5717 [email protected]
Transcript of Highway 99 Corridor Urban Activity Profile and Market Assessment
City of Lynnwood Highway 99 Corridor Urban Activity Profi le and Market Assessment
April 2008
Principal: Chris Mefford Project Analysts: Marlo Isaac
Dawn Couch Meredith Hermann
Mike Babb
with ClearPath RE Rob Larsen, SIOR
1402 Third Avenue, Suite 930 Seattle, Washington 98101
tel: 206.523.6683 fax: 866.726.5717 [email protected]
Lynnwood Highway 99 Corridor April 2008 Page ii Urban Activity Profile and Market Report
CONTENTS Executive Summary ................................................................................................................... 1
Introduction ................................................................................................................................ 3
Background and Purpose ...................................................................................................... 3
Methods .................................................................................................................................. 3
Organization of the Report................................................................................................... 3
Highway 99 Corridor Existing Conditions .............................................................................. 4
Land Uses ............................................................................................................................... 4
Segments and Nodes ....................................................................................................... 10
Vacant and Underutilized Lands .................................................................................... 12
Highway 99 Traffic .............................................................................................................. 17
Community Transit ......................................................................................................... 20
Demographics ...................................................................................................................... 20
Population and Households ........................................................................................... 20
Income, Age and Race .................................................................................................... 24
Economic Conditions .......................................................................................................... 24
Employment ..................................................................................................................... 24
Market Assessment .................................................................................................................. 27
Retail ...................................................................................................................................... 27
Regional Overview .......................................................................................................... 27
Highway 99 Retail Conditions ........................................................................................ 28
Other Lynnwood Retail .................................................................................................. 32
Other Lynnwood Projects .............................................................................................. 32
Office .................................................................................................................................... 33
Regional Overview .......................................................................................................... 33
Highway 99 Office Conditions ...................................................................................... 34
Housing ............................................................................................................................ 35
Highway 99 Conditions ................................................................................................... 37
Lodging ................................................................................................................................. 38
Land Values .......................................................................................................................... 38
Next Steps ................................................................................................................................. 40
Lynnwood Highway 99 Corridor April 2008 Page 1 Existing Conditions and Market Assessment
EXECUTIVE SUMMARY This interim findings report frames economic and market conditions along the Highway 99 corridor in Lynnwood and areas north of Lynnwood. The report establishes a platform of key findings and trends from which to begin identification of site-specific opportunities and strategies for development and redevelopment. A final report at the completion of this study will include findings gleaned from stakeholder meetings, site-specific feasibility analysis and recommended strategies to support the City’s long-term planning for the Highway 99 corridor.
Lynnwood’s Highway 99 Corridor appears to include ample opportunity for redevelopment. Continued growth expected for the Puget Sound region coupled with Lynnwood’s desirable location positions the City well in terms of future demand for all land uses. The City’s location brings many advantages including proximity to Boeing employment to the north in Everett, the growing employment base in Bothell, Eastside King County commerce centers in Bellevue and Redmond and access to Seattle to the south.
Transit improvements planned for the corridor are anticipated to make the corridor in Lynnwood more desirable for transit-oriented uses, including multifamily housing developments and a mix of retail and commercial services. Other areas in proximity to the corridor that will drive future demand include growing medical centers to the south in Edmonds, office demand stemming from Premera Blue Cross in Mountlake Center, and the City of Lynnwood’s own growth plans for its City Center and Alderwood Mall.
The report brings together a large volume of data and market findings from interviews of corridor stakeholders. Key findings explored within, include:
• The corridor in the study area includes a broad range of uses, spanning retail, office, housing, government uses, industrial, warehousing, hotels and more. Nearly all types of land uses are represented along Lynnwood’s Highway 99 Corridor.
• The corridor study area is so long that markets and planning strategies will likely require breaking the corridor into four or five segments, as has been done in this report.
• Many, many parcels qualify under typical criteria for being redevelopable, as shown in detail in maps herein. Relatively few parcels are actually vacant at present, though their combined land area totals more than 20 acres.
• The non-residential development along the corridor is evenly split amongst retail, office and all other uses, in terms of both numbers of parcels devoted to each group and total square footage of building space.
Lynnwood Highway 99 Corridor April 2008 Page 2 Existing Conditions and Market Assessment
The “all other” group includes warehousing and industrial space primarily, followed by a mix that includes motels and recreational uses.
• Soft office rents and high vacancies in the Northend of the Seattle office market, compared to tight markets in Seattle and Bellevue, suggest in the near-term at least, that larger office developers continue to favor employment centers more centrally located in the region. Lynnwood’s own City Center ambitions would further challenge office development considerations along Highway 99.
• Retail along the corridor has always been highly visible and successful. Retail and real estate professionals in the area report strong and strengthening markets at present for retail space in the study area. Upgrading the existing mix of retail should be the primary focus of retail strategies, along with integrating retail into a desirable corridor-wide plan that incorporates planning considerations (transportation, accessibility and more).
• A fairly broad range of housing and mixed-use residential developments appear to merit close attention. Apartment rents have increased in Lynnwood in recent months, as is the case elsewhere in the region. New residential construction sells well in Lynnwood, with higher prices for both condominiums and single-family products than found on average in Snohomish County.
• Planned transit improvements spur creative energy for new development products. Developments benefit from increased pedestrian activity and potentially a greater concentration of commuters using the corridor. Mixed-use and transit-oriented development project can serve as a catalyst and anchor for broader activity nodes, which will likely be the focus of subsequent work for the corridor strategy.
Lynnwood Highway 99 Corridor April 2008 Page 3 Existing Conditions and Market Assessment
INTRODUCTION
Background and Purpose The City of Lynnwood is exploring the potential for new development along the Highway 99 corridor, with particular consideration to redevelopment and bus rapid transit (BRT) opportunities in conjunction with Community Transit’s planning efforts. The City is in the process of determining the market potential and economic feasibility of new development and implementation strategies to encourage desired development along the Highway 99 corridor.
This interim findings report frames economic and market conditions along the Highway 99 corridor in Lynnwood and areas north of Lynnwood. The report establishes a platform of key findings and trends from which to engage community stakeholders in the planning process, and to begin identification of site-specific opportunities and strategies for development and redevelopment. A final report at the completion of this study will include findings gleaned from stakeholder meetings, site-specific feasibility analysis and recommended strategies to support the City’s long-term planning for the Highway 99 corridor.
Methods Research methods to inform this report include analysis of economic and demographic secondary data relevant for Highway 99 corridor planning and development, including US Census data, private vendor data, published real estate reports and media research. In addition, the report reflects interviews with real estate professionals familiar with Lynnwood markets, and property and business owners and managers. Finally, analysis reflects a synthesis of information gathered from project team meetings, City-provided data, and field work (notes from touring the study area).
Organization of the Report This report is organized into the following sections:
• Highway 99 Corridor Existing Conditions. This section includes an assessment of physical characteristics and current land uses, demographics, and traffic conditions and patterns along the corridor.
• Market Assessment. This section includes an overview of real estate market conditions, including an assessment of demand for retail, office, residential and lodging land uses, land values and competitive supply.
• Next Steps. This section outlines next steps in the study process, including site-specific analysis, stakeholder meetings and strategy identification.
Lynnwood Highway 99 Corridor April 2008 Page 4 Existing Conditions and Market Assessment
HIGHWAY 99 CORRIDOR EXISTING CONDITIONS
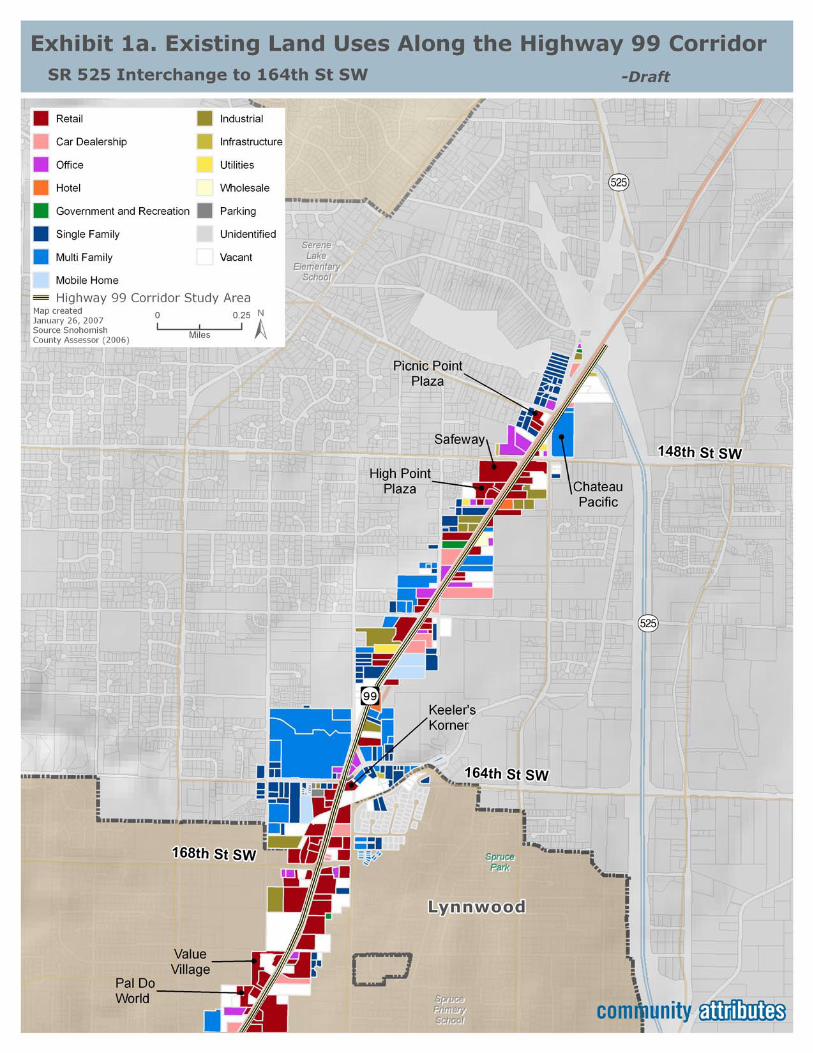
Land Uses The Highway 99 corridor study area is bounded by State Route 525 (unincorporated Snohomish County) to the north and the Lynnwood/Edmonds city boundary to the south. While the study is primarily focused on those parcels of land adjacent to the corridor, analysis also includes commercial and residential development within 0.5 miles to the east and west of Highway 99 along several more intensely developed and active intersections. The development patterns along these intersections are important to consider as the land use activities that radiate out from the corridor relate to and in many instances support the Highway 99 corridor economy. A map of the Highway 99 corridor study area and existing land uses are presented below as Exhibits 1a-1d.
The Highway 99 corridor comprises a broad mix of land uses, serving varied users and customers.
• Auto dealers maintain a strong presence on the corridor, along with numerous auto-related retailers and service providers.
• Several community/neighborhood shopping centers are prominent along the Highway 99 corridor, anchored by grocery stores and offering convenience shopping, personal services and fast food and casual dining restaurants.
• Asian (primarily Korean) businesses and markets are also concentrated in commercial centers dispersed along the corridor.
• Edmonds Community College generates many trips along the corridor. While the college itself is set back from Highway 99 itself, the college is a significant influence on the travel patters of highway users.
Other land uses along the highway include offices, professional and health-related services, banks and check cashing outlets, mobile homes, multifamily housing, recreation, motels, and vacant parcels.
Lynnwood Highway 99 Corridor April 2008 Page 9 Existing Conditions and Market Assessment
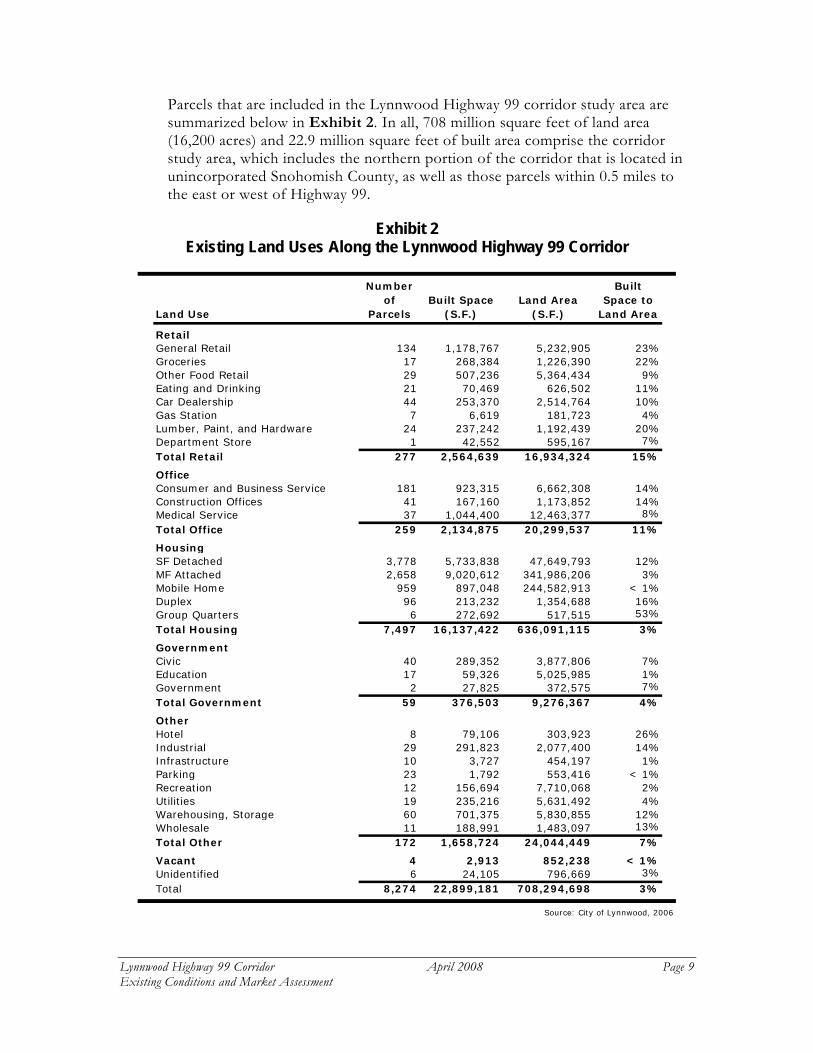
Parcels that are included in the Lynnwood Highway 99 corridor study area are summarized below in Exhibit 2. In all, 708 million square feet of land area (16,200 acres) and 22.9 million square feet of built area comprise the corridor study area, which includes the northern portion of the corridor that is located in unincorporated Snohomish County, as well as those parcels within 0.5 miles to the east or west of Highway 99.
Exhibit 2 Existing Land Uses Along the Lynnwood Highway 99 Corridor
Land Use
Numberof
ParcelsBuilt Space
(S.F.)Land Area
(S.F.)
Built Space to
Land Area
RetailGeneral Retail 134 1,178,767 5,232,905 23%Groceries 17 268,384 1,226,390 22%Other Food Retail 29 507,236 5,364,434 9%Eating and Drinking 21 70,469 626,502 11%Car Dealership 44 253,370 2,514,764 10%Gas Station 7 6,619 181,723 4%Lumber, Paint, and Hardware 24 237,242 1,192,439 20%Department Store 1 42,552 595,167 7%Total Retail 277 2,564,639 16,934,324 15%
OfficeConsumer and Business Service 181 923,315 6,662,308 14%Construction Offices 41 167,160 1,173,852 14%Medical Service 37 1,044,400 12,463,377 8%Total Office 259 2,134,875 20,299,537 11%
HousingSF Detached 3,778 5,733,838 47,649,793 12%MF Attached 2,658 9,020,612 341,986,206 3%Mobile Home 959 897,048 244,582,913 < 1%Duplex 96 213,232 1,354,688 16%Group Quarters 6 272,692 517,515 53%Total Housing 7,497 16,137,422 636,091,115 3%
GovernmentCivic 40 289,352 3,877,806 7%Education 17 59,326 5,025,985 1%Government 2 27,825 372,575 7%Total Government 59 376,503 9,276,367 4%
OtherHotel 8 79,106 303,923 26%Industrial 29 291,823 2,077,400 14%Infrastructure 10 3,727 454,197 1%Parking 23 1,792 553,416 < 1%Recreation 12 156,694 7,710,068 2%Utilities 19 235,216 5,631,492 4%Warehousing, Storage 60 701,375 5,830,855 12%Wholesale 11 188,991 1,483,097 13%Total Other 172 1,658,724 24,044,449 7%
Vacant 4 2,913 852,238 < 1%Unidentified 6 24,105 796,669 3%Total 8,274 22,899,181 708,294,698 3%
Source: City of Lynnwood, 2006
Lynnwood Highway 99 Corridor April 2008 Page 10 Existing Conditions and Market Assessment
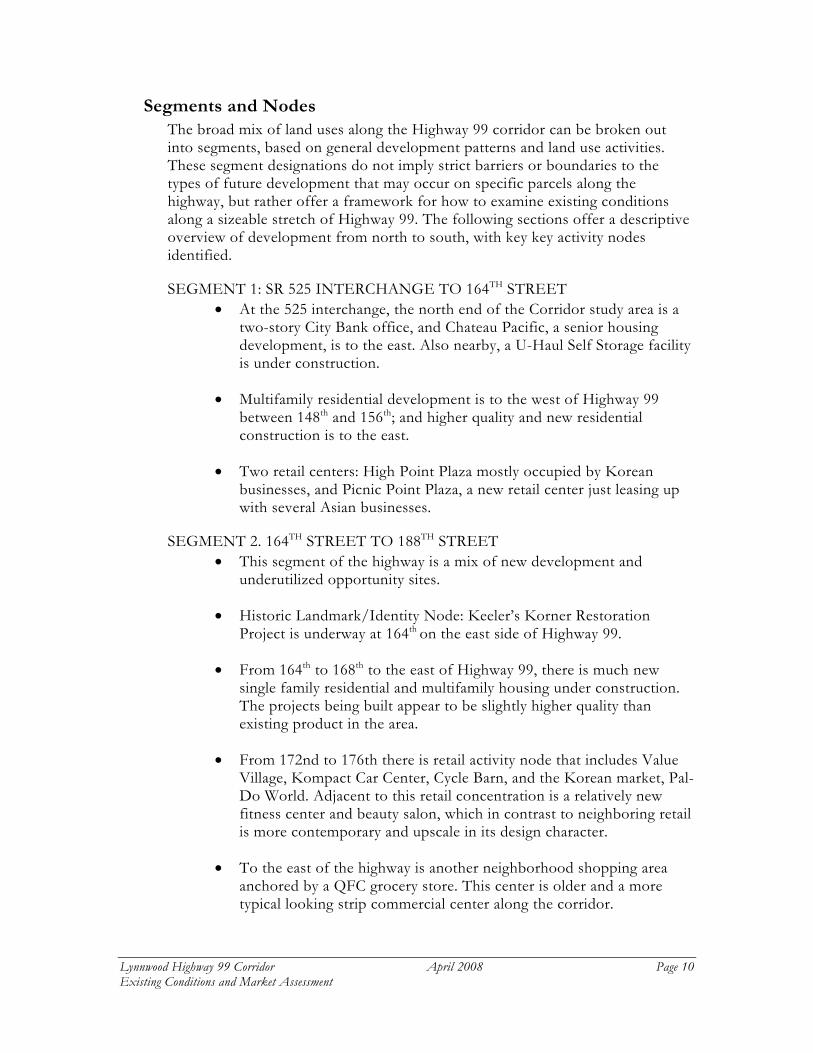
Segments and Nodes The broad mix of land uses along the Highway 99 corridor can be broken out into segments, based on general development patterns and land use activities. These segment designations do not imply strict barriers or boundaries to the types of future development that may occur on specific parcels along the highway, but rather offer a framework for how to examine existing conditions along a sizeable stretch of Highway 99. The following sections offer a descriptive overview of development from north to south, with key key activity nodes identified.
SEGMENT 1: SR 525 INTERCHANGE TO 164TH STREET • At the 525 interchange, the north end of the Corridor study area is a
two-story City Bank office, and Chateau Pacific, a senior housing development, is to the east. Also nearby, a U-Haul Self Storage facility is under construction.
• Multifamily residential development is to the west of Highway 99 between 148th and 156th; and higher quality and new residential construction is to the east.
• Two retail centers: High Point Plaza mostly occupied by Korean businesses, and Picnic Point Plaza, a new retail center just leasing up with several Asian businesses.
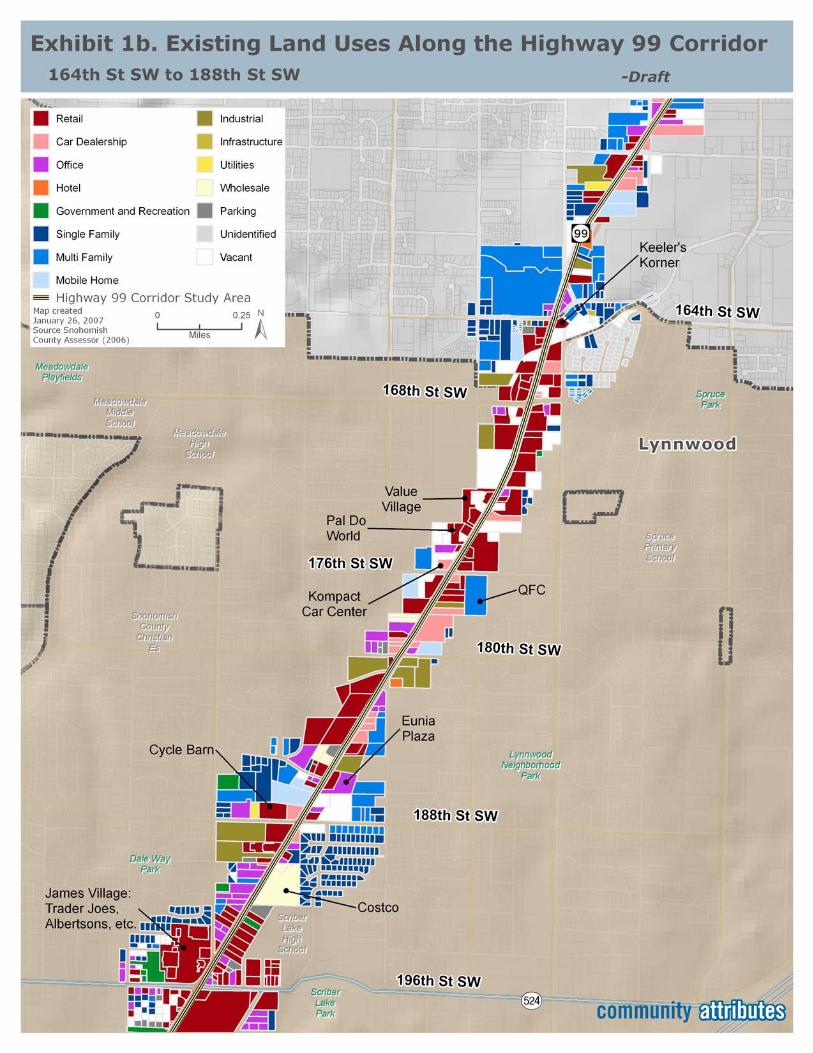
SEGMENT 2. 164TH STREET TO 188TH STREET • This segment of the highway is a mix of new development and
underutilized opportunity sites.
• Historic Landmark/Identity Node: Keeler’s Korner Restoration Project is underway at 164th on the east side of Highway 99.
• From 164th to 168th to the east of Highway 99, there is much new single family residential and multifamily housing under construction. The projects being built appear to be slightly higher quality than existing product in the area.
• From 172nd to 176th there is retail activity node that includes Value Village, Kompact Car Center, Cycle Barn, and the Korean market, Pal-Do World. Adjacent to this retail concentration is a relatively new fitness center and beauty salon, which in contrast to neighboring retail is more contemporary and upscale in its design character.
• To the east of the highway is another neighborhood shopping area anchored by a QFC grocery store. This center is older and a more typical looking strip commercial center along the corridor.
Lynnwood Highway 99 Corridor April 2008 Page 11 Existing Conditions and Market Assessment
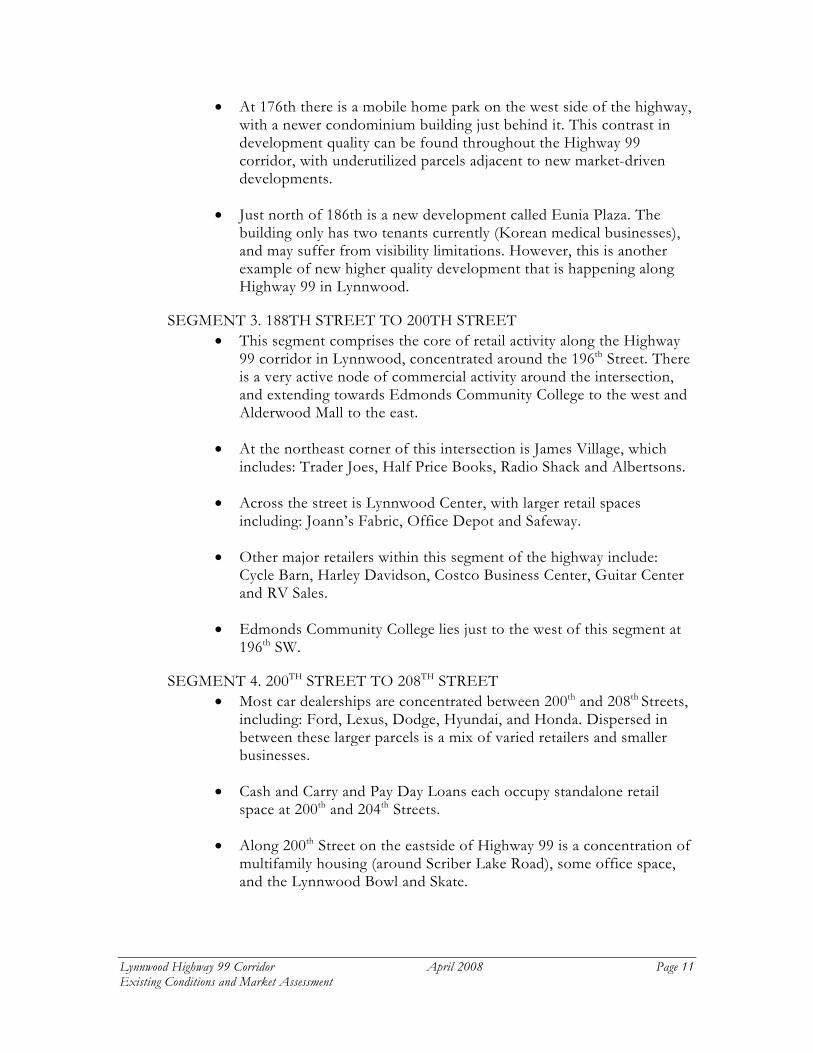
• At 176th there is a mobile home park on the west side of the highway, with a newer condominium building just behind it. This contrast in development quality can be found throughout the Highway 99 corridor, with underutilized parcels adjacent to new market-driven developments.
• Just north of 186th is a new development called Eunia Plaza. The building only has two tenants currently (Korean medical businesses), and may suffer from visibility limitations. However, this is another example of new higher quality development that is happening along Highway 99 in Lynnwood.
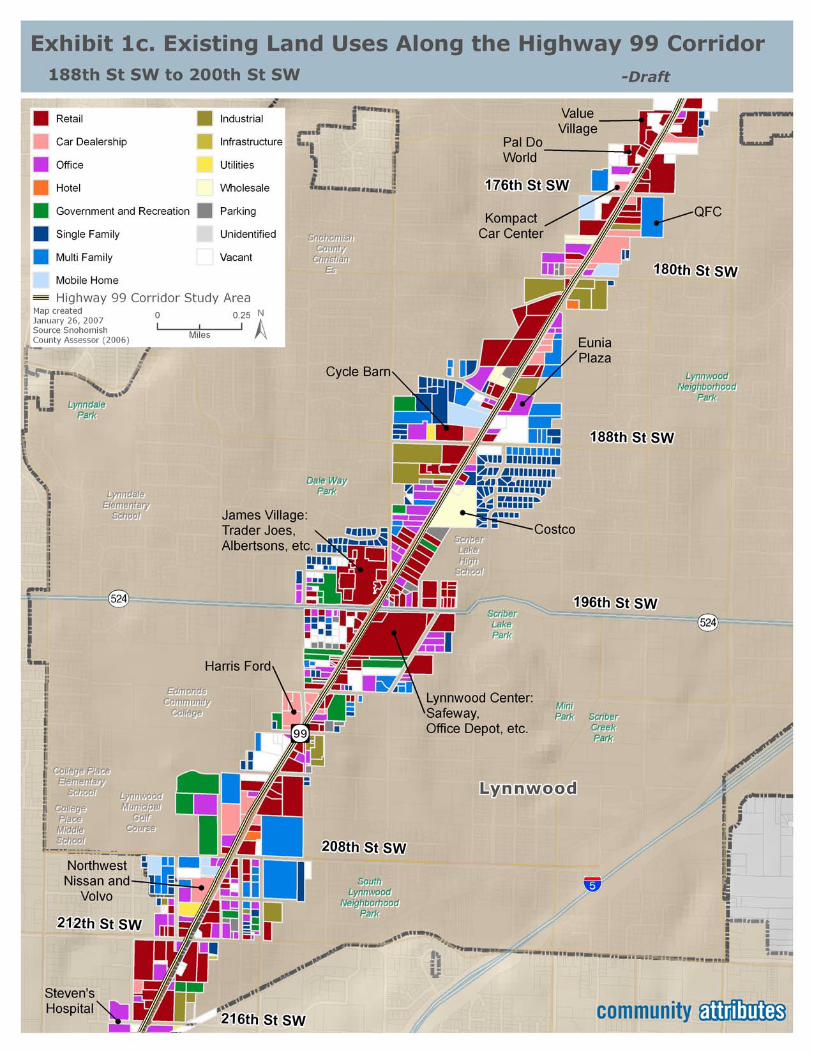
SEGMENT 3. 188TH STREET TO 200TH STREET • This segment comprises the core of retail activity along the Highway
99 corridor in Lynnwood, concentrated around the 196th Street. There is a very active node of commercial activity around the intersection, and extending towards Edmonds Community College to the west and Alderwood Mall to the east.
• At the northeast corner of this intersection is James Village, which includes: Trader Joes, Half Price Books, Radio Shack and Albertsons.
• Across the street is Lynnwood Center, with larger retail spaces including: Joann’s Fabric, Office Depot and Safeway.
• Other major retailers within this segment of the highway include: Cycle Barn, Harley Davidson, Costco Business Center, Guitar Center and RV Sales.
• Edmonds Community College lies just to the west of this segment at 196th SW.
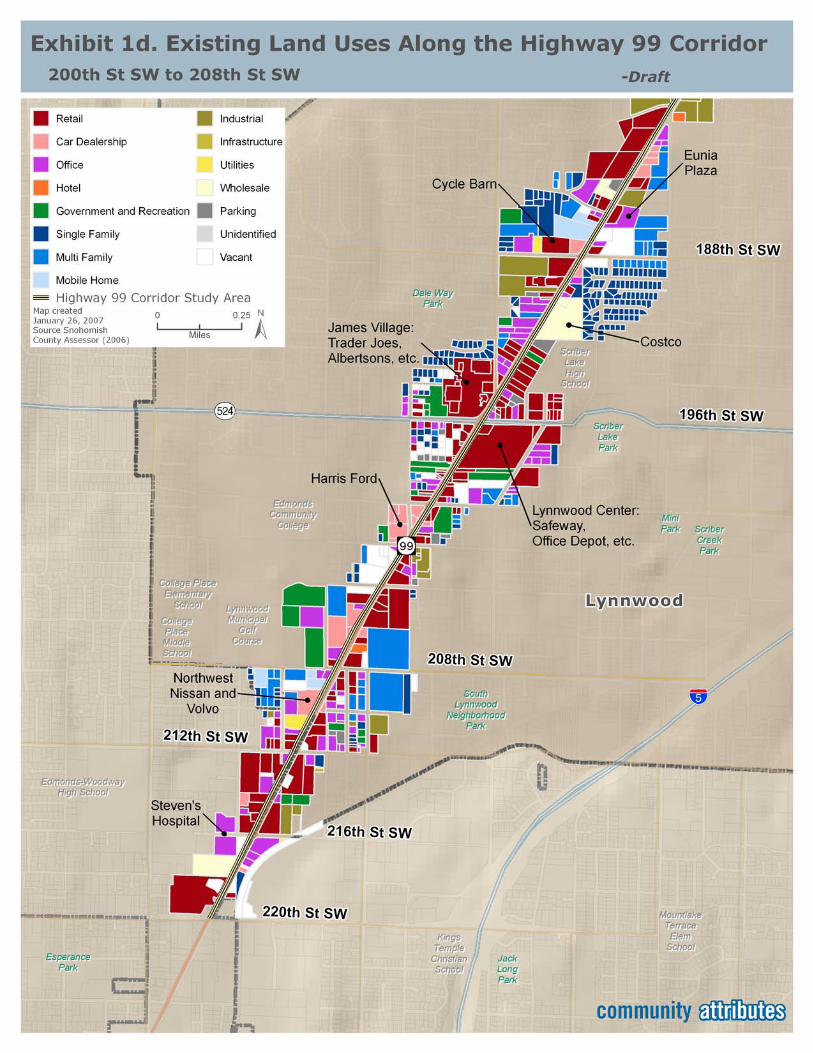
SEGMENT 4. 200TH STREET TO 208TH STREET • Most car dealerships are concentrated between 200th and 208th Streets,
including: Ford, Lexus, Dodge, Hyundai, and Honda. Dispersed in between these larger parcels is a mix of varied retailers and smaller businesses.
• Cash and Carry and Pay Day Loans each occupy standalone retail space at 200th and 204th Streets.
• Along 200th Street on the eastside of Highway 99 is a concentration of multifamily housing (around Scriber Lake Road), some office space, and the Lynnwood Bowl and Skate.
Lynnwood Highway 99 Corridor April 2008 Page 12 Existing Conditions and Market Assessment
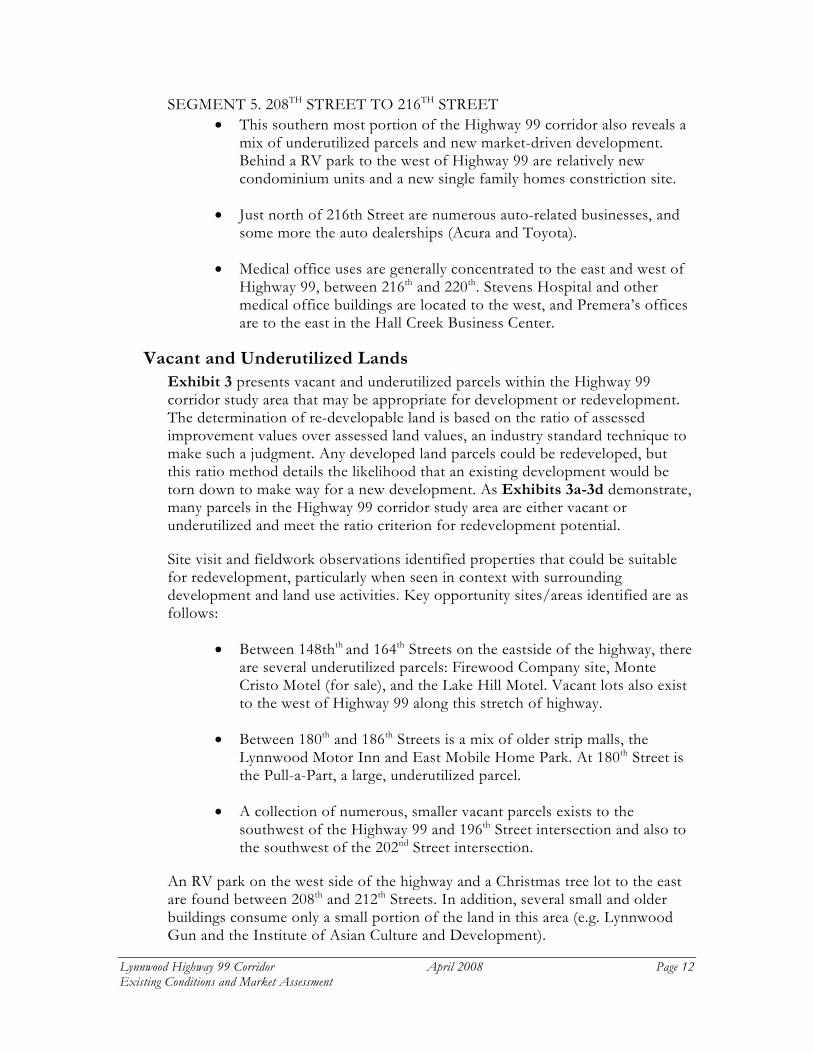
SEGMENT 5. 208TH STREET TO 216TH STREET • This southern most portion of the Highway 99 corridor also reveals a
mix of underutilized parcels and new market-driven development. Behind a RV park to the west of Highway 99 are relatively new condominium units and a new single family homes constriction site.
• Just north of 216th Street are numerous auto-related businesses, and some more the auto dealerships (Acura and Toyota).
• Medical office uses are generally concentrated to the east and west of Highway 99, between 216th and 220th. Stevens Hospital and other medical office buildings are located to the west, and Premera’s offices are to the east in the Hall Creek Business Center.
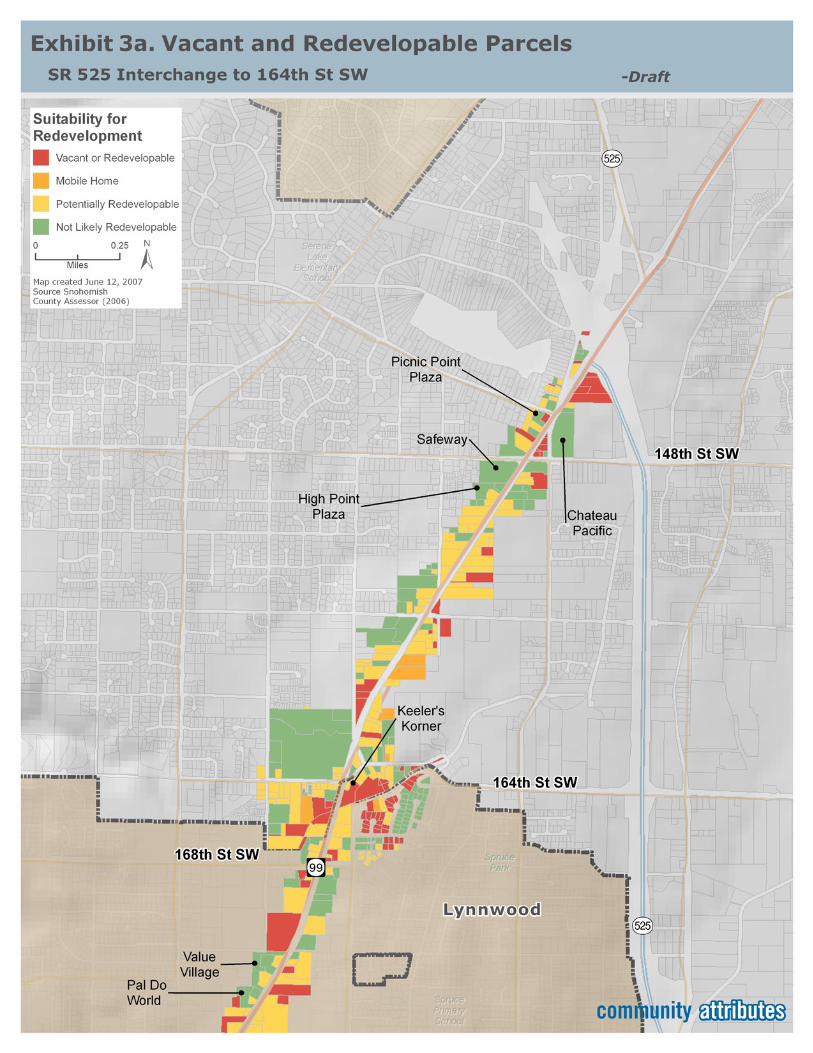
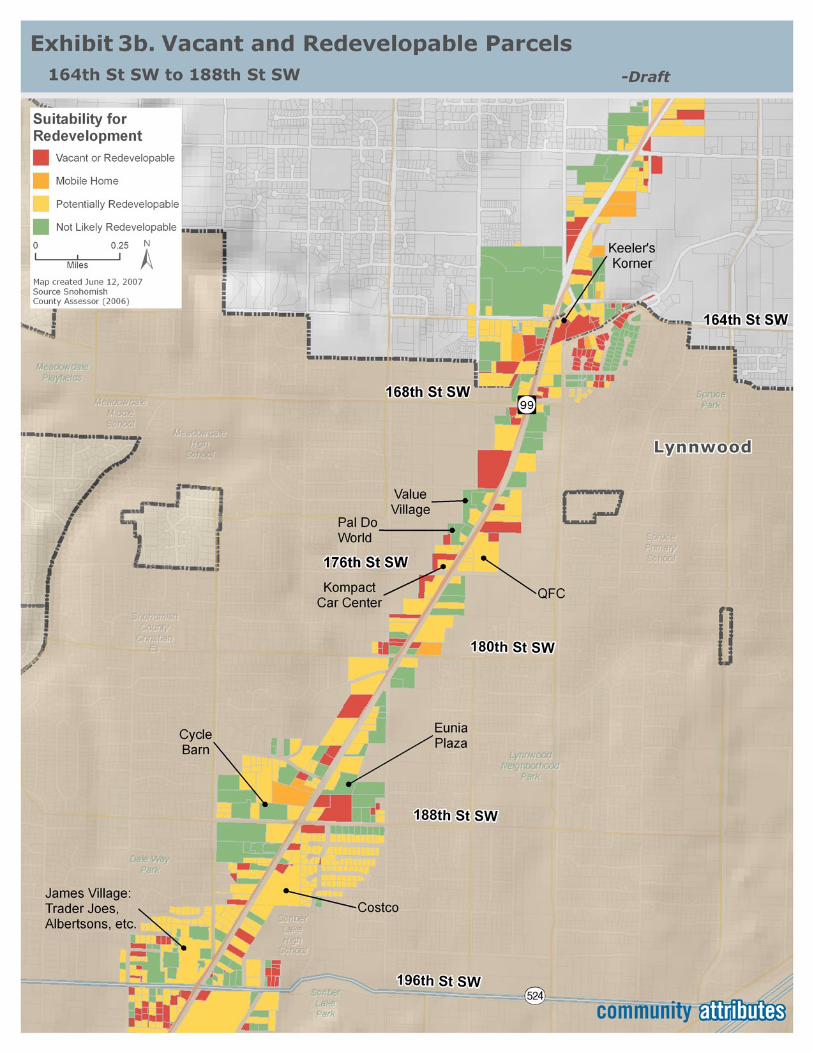
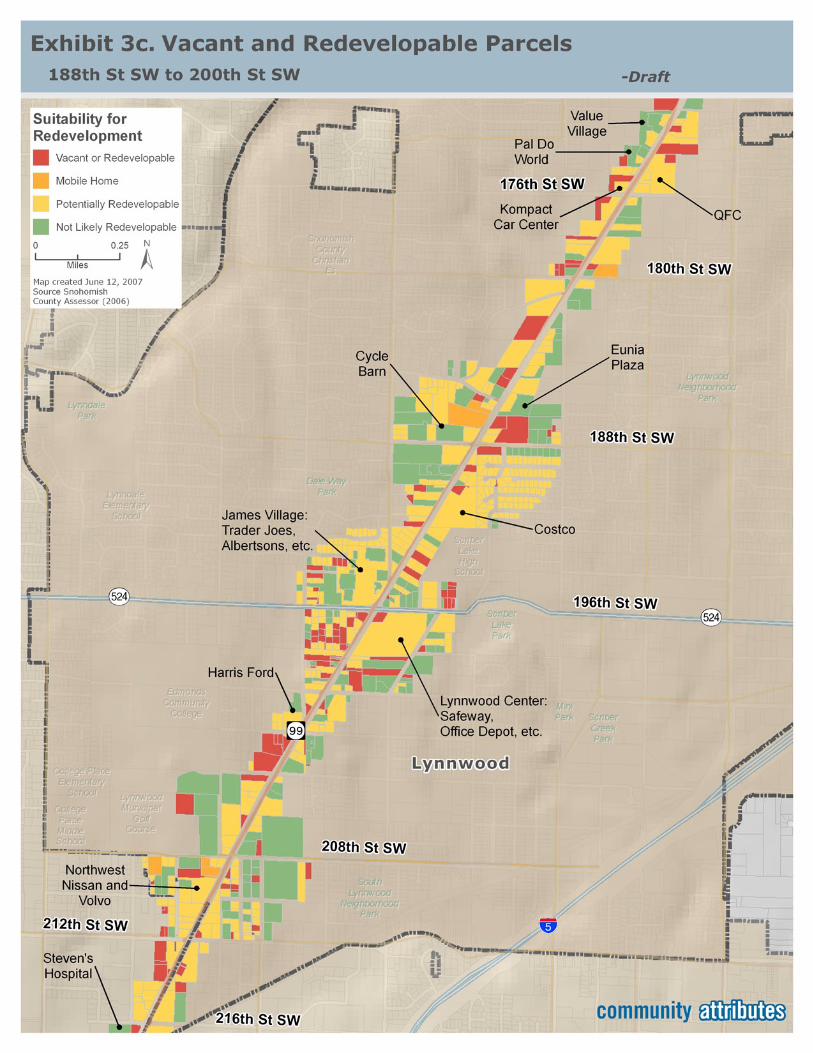
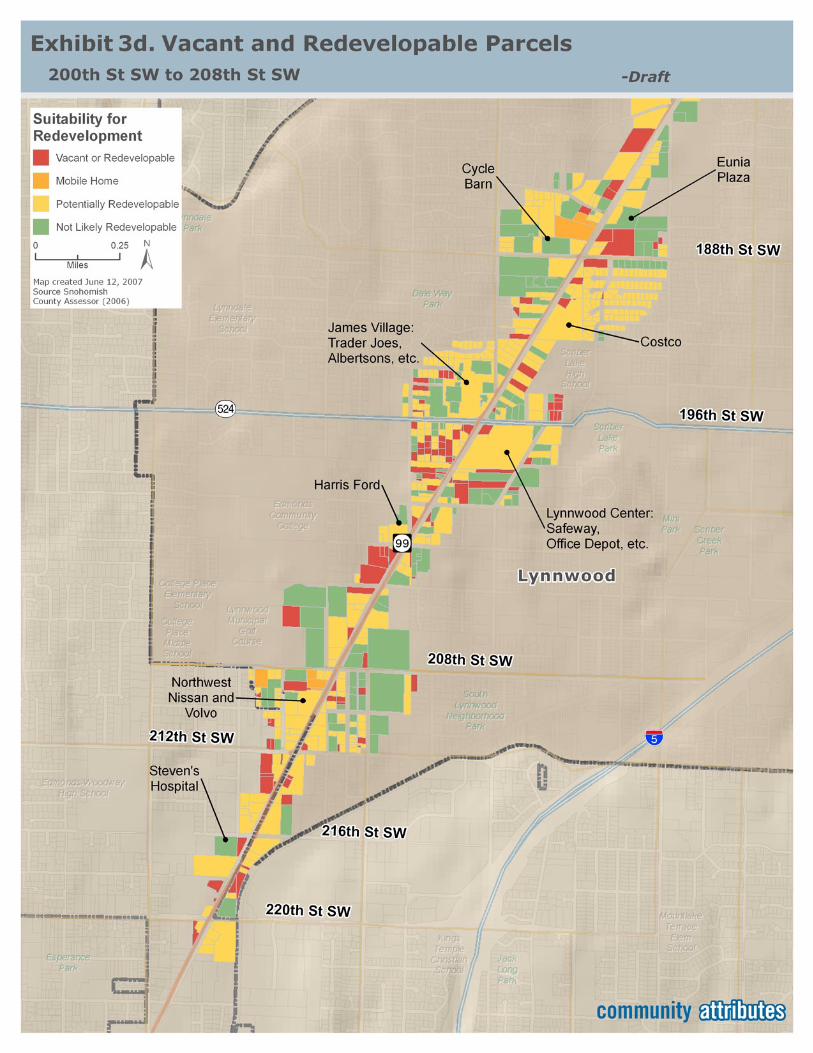
Vacant and Underutilized Lands Exhibit 3 presents vacant and underutilized parcels within the Highway 99 corridor study area that may be appropriate for development or redevelopment. The determination of re-developable land is based on the ratio of assessed improvement values over assessed land values, an industry standard technique to make such a judgment. Any developed land parcels could be redeveloped, but this ratio method details the likelihood that an existing development would be torn down to make way for a new development. As Exhibits 3a-3d demonstrate, many parcels in the Highway 99 corridor study area are either vacant or underutilized and meet the ratio criterion for redevelopment potential.
Site visit and fieldwork observations identified properties that could be suitable for redevelopment, particularly when seen in context with surrounding development and land use activities. Key opportunity sites/areas identified are as follows:
• Between 148thth and 164th Streets on the eastside of the highway, there are several underutilized parcels: Firewood Company site, Monte Cristo Motel (for sale), and the Lake Hill Motel. Vacant lots also exist to the west of Highway 99 along this stretch of highway.
• Between 180th and 186th Streets is a mix of older strip malls, the Lynnwood Motor Inn and East Mobile Home Park. At 180th Street is the Pull-a-Part, a large, underutilized parcel.
• A collection of numerous, smaller vacant parcels exists to the southwest of the Highway 99 and 196th Street intersection and also to the southwest of the 202nd Street intersection.
An RV park on the west side of the highway and a Christmas tree lot to the east are found between 208th and 212th Streets. In addition, several small and older buildings consume only a small portion of the land in this area (e.g. Lynnwood Gun and the Institute of Asian Culture and Development).
Lynnwood Highway 99 Corridor April 2008 Page 17 Existing Conditions and Market Assessment
Highway 99 Traffic Highway 99 is a major regional north-south vehicular corridor, and in Lynnwood, as in most cities through which Highway 99 passes, the area is dominated by land uses and activities which support automobile and public transit uses. With an average of 34,000 vehicles per day traveling along the Lynnwood segment of Highway 99, this segment of Highway 99 is generally as heavily traveled as any portion of the highway north of Seattle.
The most recent traffic collection data come from 2006, when the City of Lynnwood measured Highway 99 traffic counts for one p.m. peak hour (between 4:30 and 5:30 PM), and found 2,935 vehicles passed through, including both northbound and southbound in all lanes.
The traffic consists of a somewhat heavier concentration of southbound vehicles during the morning peak and a heavier concentration of northbound vehicles during p.m. peak hours. Approximately 60% of the evening peak hour traffic is driving northbound; 40% traveling southbound.
A perhaps lesser known traffic concern for market understanding in this area, is that traffic volumes crossing Highway 99 from the east or from the west are also heavy, averaging an estimated 16,000 vehicles per day in some areas along the highway in Lynnwood. This traffic is even more evenly split, with 55% westbound approaching the highway and 45% eastbound.
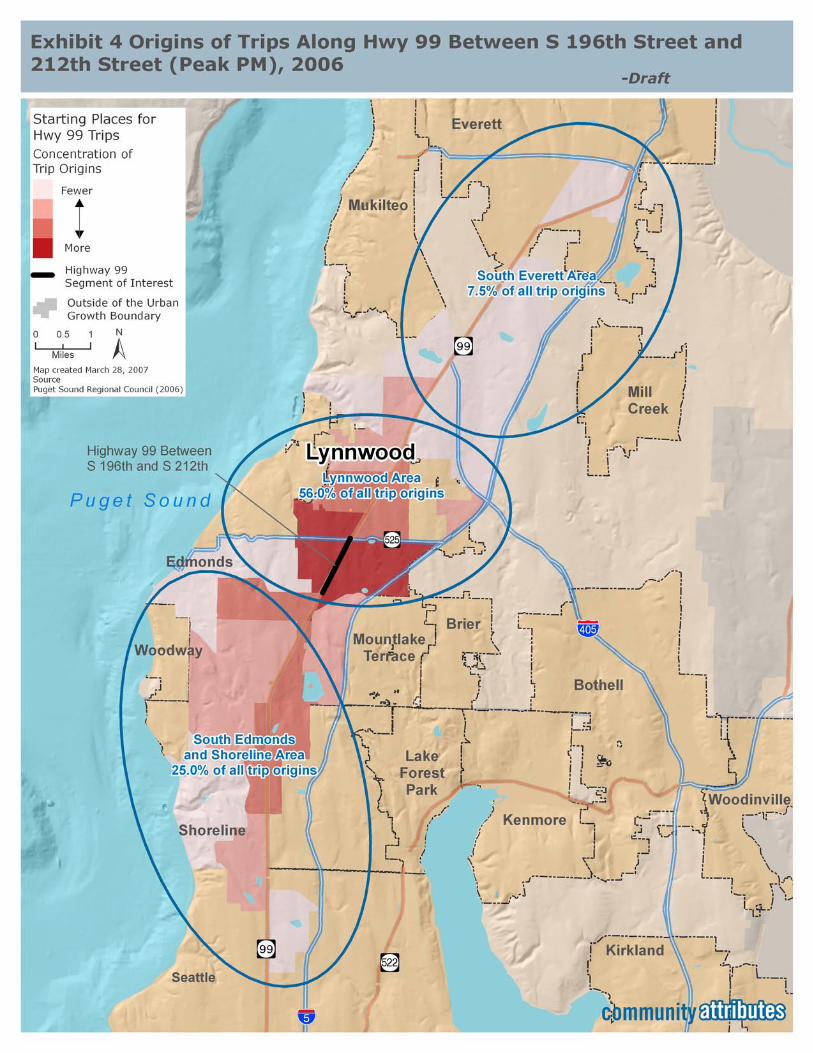
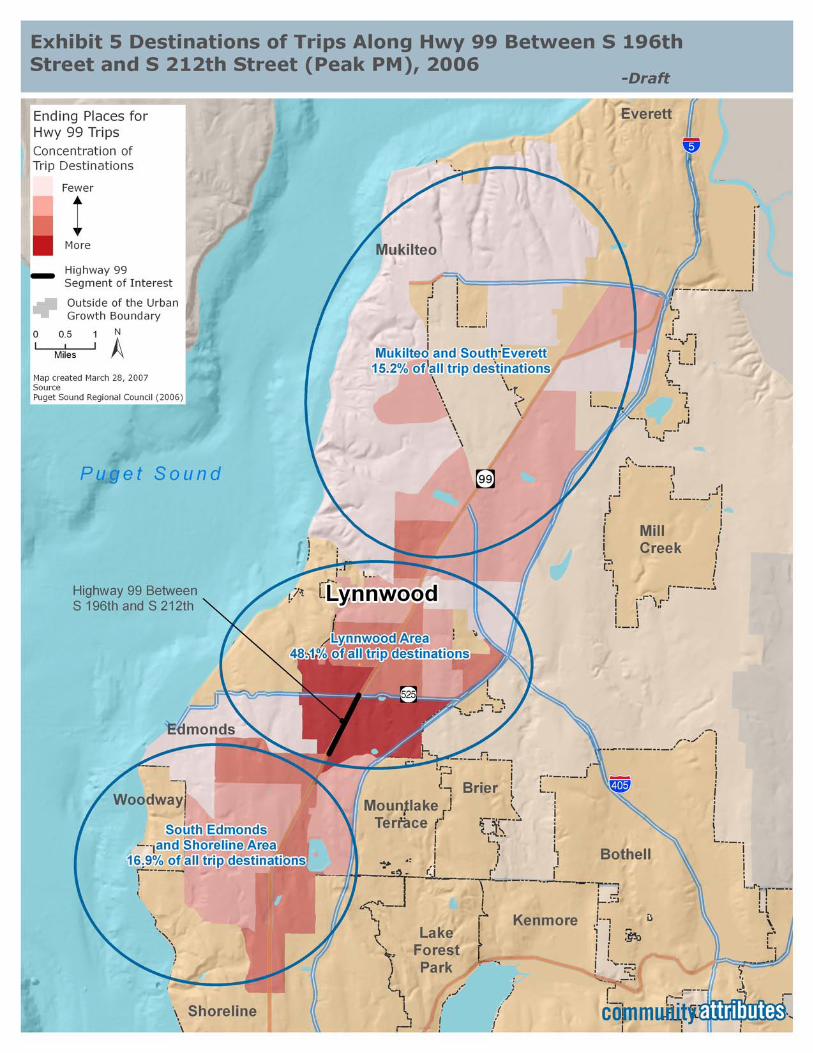
Exhibit 4 and Exhibit 5 below present commute patterns through the Lynnwood Highway 99 corridor (between S 196th and 212th Streets) which depict travelers’ origins and destinations during the p.m. peak travel times (from 4:30 p.m. to 6:30 p.m.). The maps are based on traffic modeling data provided by the Puget Sound Regional Council, and are meaningful in that they reveal travel patterns and specific geographic areas that can be considered primary trade areas that support the corridor’s economic vitality.
About half of the vehicles using Highway 99 in Lynnwood are coming and going to places within city limits, as shown. About one-quarter are coming from and going to places in Shoreline. Other trip origins and destinations are concentrated in places north, around South Everett and Mukilteo.
As illustrated in Exhibit 4, 56% of all trips passing through the Lynnwood Highway 99 corridor originate within the Lynnwood area during the peak p.m. period; 25% originate in the South Edmonds and Shoreline areas, and 7.5% originate in the South Everett area.
Destinations for peak PM travelers passing through the Highway 99 corridor are also largely concentrated within the Lynnwood area (48%), as presented in Exhibit 5. The South Edmonds/Shoreline and Mukilteo/South Everett areas capture 16.9% and 15.2% respectively of the destinations to which peak PM drivers are traveling.
Lynnwood Highway 99 Corridor April 2008 Page 20 Existing Conditions and Market Assessment
Community Transit Community Transit is currently in the planning stages of a major new bus rapid transit (BRT) initiative for the Highway 99 corridor. Community Transit describes this effort as “bundling high quality, higher capacity transit service and facilities together along a corridor to provide a faster, more reliable and more comfortable riding experience for customers that mimics what riders experience on rail systems.” (Community Transit TDP 2004-2009, p.82) The BRT will service an 18.6 mile corridor with approximately 14 to 18 stops.
In January 2007, a Community Transit Technical Advisory Committee presented BRT conceptual station designs for review and comment. Conceptual station designs are linear in design in order to minimize the built footprint, and will accommodate riders sitting on both sides of the structure, providing protection from the weather in all directions. Lighting and way-finding features are also being incorporated into design schemes, although signage, lighting, ticket vending machines and other details are still in flux.
The City anticipates that Community Transit will locate two or three stations along the Highway 99 corridor in Lynnwood. Community Transit will work in concert with the City of Lynnwood to determine the most appropriate and effective station locations.
As this Highway 99 corridor study evaluates the market potential and feasibility for new development and redevelopment in Lynnwood, the potential for future station locations will be incorporated into strategic planning and future implementation strategies, as the location of a BRT station area will be an attractive development amenities and likely play a catalytic role in attracting particular development and land use activities.
Demographics Population and Households
Population growth in Snohomish County has outpaced that of the three other central Puget Sound counties in recent decades (King, Kitsap and Pierce Counties). The County experienced its single largest decade population gain between 1990 and 2000, with a 30% growth in population, or an average annual growth rate of 2.7%. According to the Snohomish County 2005 Growth Monitoring Report, Snohomish County continues to exhibit the fastest rate of population growth among the four central Puget Sound counties since 2000.
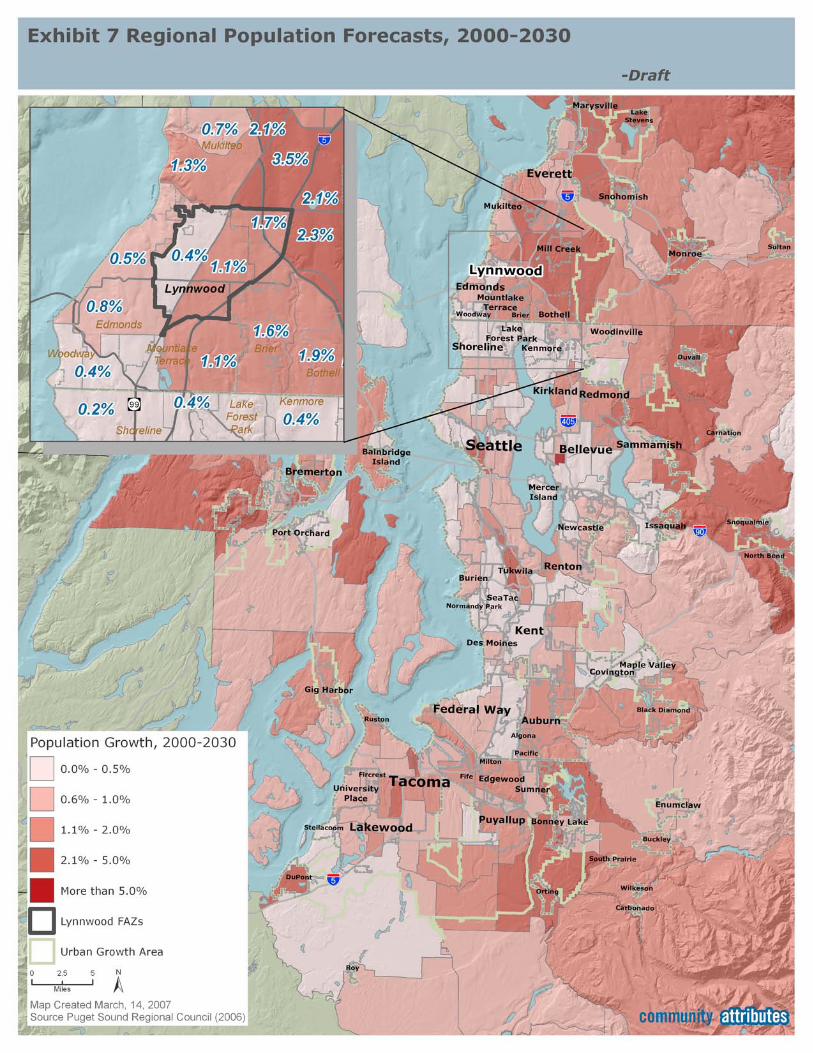
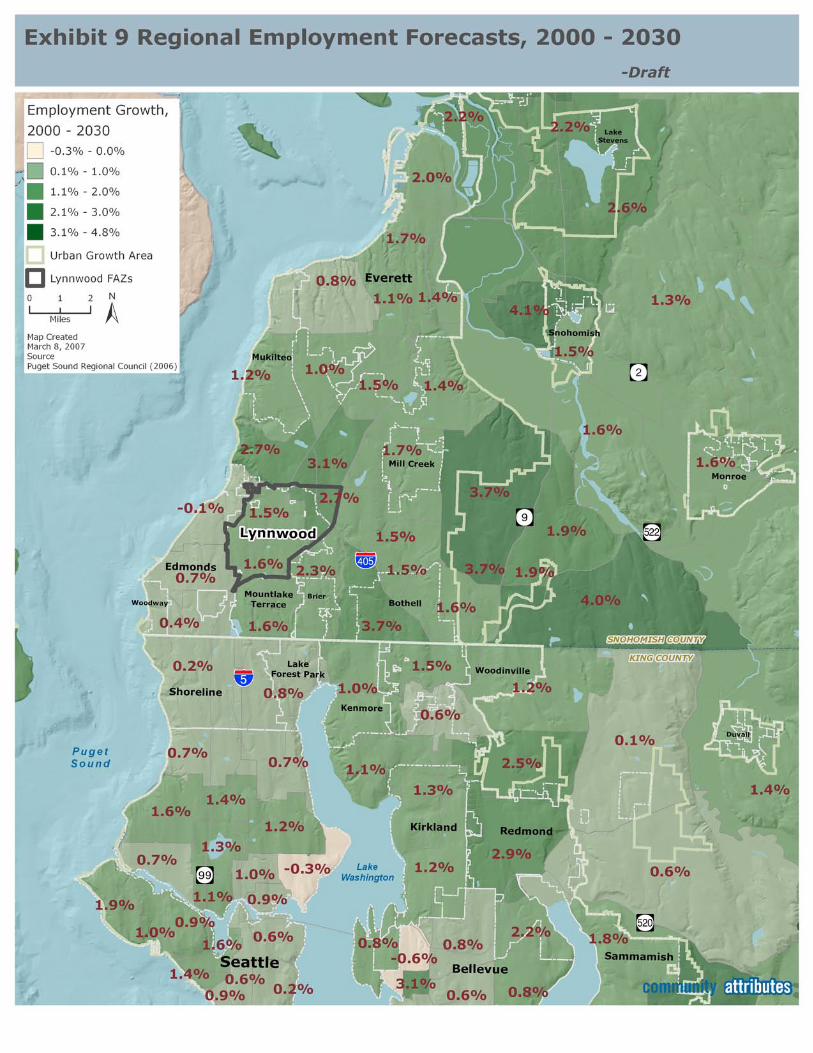
Population and household growth in communities in the southern portions of the county are projected to grow more rapidly through 2030, according to County and Puget Sound Regional Council (PSRC) projections released in Fall 2006. Forecast analysis zones, or FAZs, are defined by the Puget Sound Regional Council’s small area forecast model, and incorporate County planning staff input to produce household and job forecasts for the County and the region.
Lynnwood Highway 99 Corridor April 2008 Page 21 Existing Conditions and Market Assessment
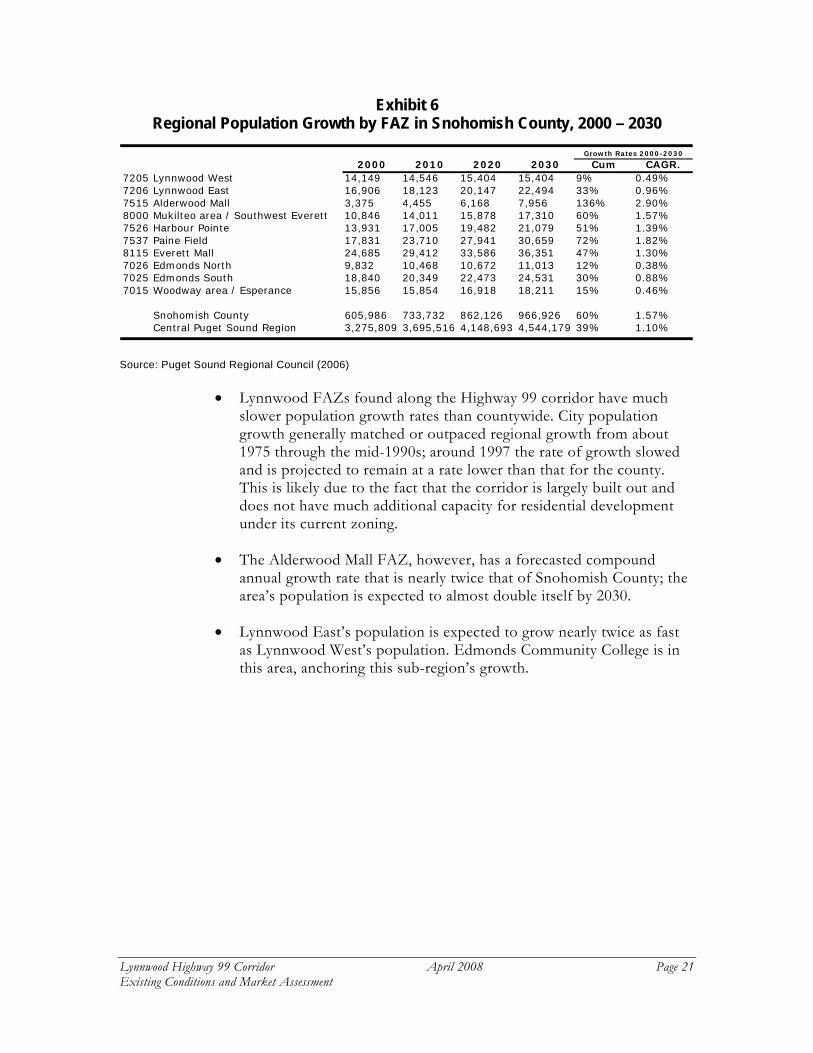
Exhibit 6 Regional Population Growth by FAZ in Snohomish County, 2000 – 2030
2000 2010 2020 2030 Cum CAGR.
7205 Lynnwood West 14,149 14,546 15,404 15,404 9% 0.49%7206 Lynnwood East 16,906 18,123 20,147 22,494 33% 0.96%7515 Alderwood Mall 3,375 4,455 6,168 7,956 136% 2.90%8000 Mukilteo area / Southwest Everett 10,846 14,011 15,878 17,310 60% 1.57%7526 Harbour Pointe 13,931 17,005 19,482 21,079 51% 1.39%7537 Paine Field 17,831 23,710 27,941 30,659 72% 1.82%8115 Everett Mall 24,685 29,412 33,586 36,351 47% 1.30%7026 Edmonds North 9,832 10,468 10,672 11,013 12% 0.38%7025 Edmonds South 18,840 20,349 22,473 24,531 30% 0.88%7015 Woodway area / Esperance 15,856 15,854 16,918 18,211 15% 0.46%
Snohomish County 605,986 733,732 862,126 966,926 60% 1.57%Central Puget Sound Region 3,275,809 3,695,516 4,148,693 4,544,179 39% 1.10%
Growth Rates 2000-2030
Source: Puget Sound Regional Council (2006)
• Lynnwood FAZs found along the Highway 99 corridor have much slower population growth rates than countywide. City population growth generally matched or outpaced regional growth from about 1975 through the mid-1990s; around 1997 the rate of growth slowed and is projected to remain at a rate lower than that for the county. This is likely due to the fact that the corridor is largely built out and does not have much additional capacity for residential development under its current zoning.
• The Alderwood Mall FAZ, however, has a forecasted compound annual growth rate that is nearly twice that of Snohomish County; the area’s population is expected to almost double itself by 2030.
• Lynnwood East’s population is expected to grow nearly twice as fast as Lynnwood West’s population. Edmonds Community College is in this area, anchoring this sub-region’s growth.

Lynnwood Highway 99 Corridor April 2008 Page 24 Existing Conditions and Market Assessment
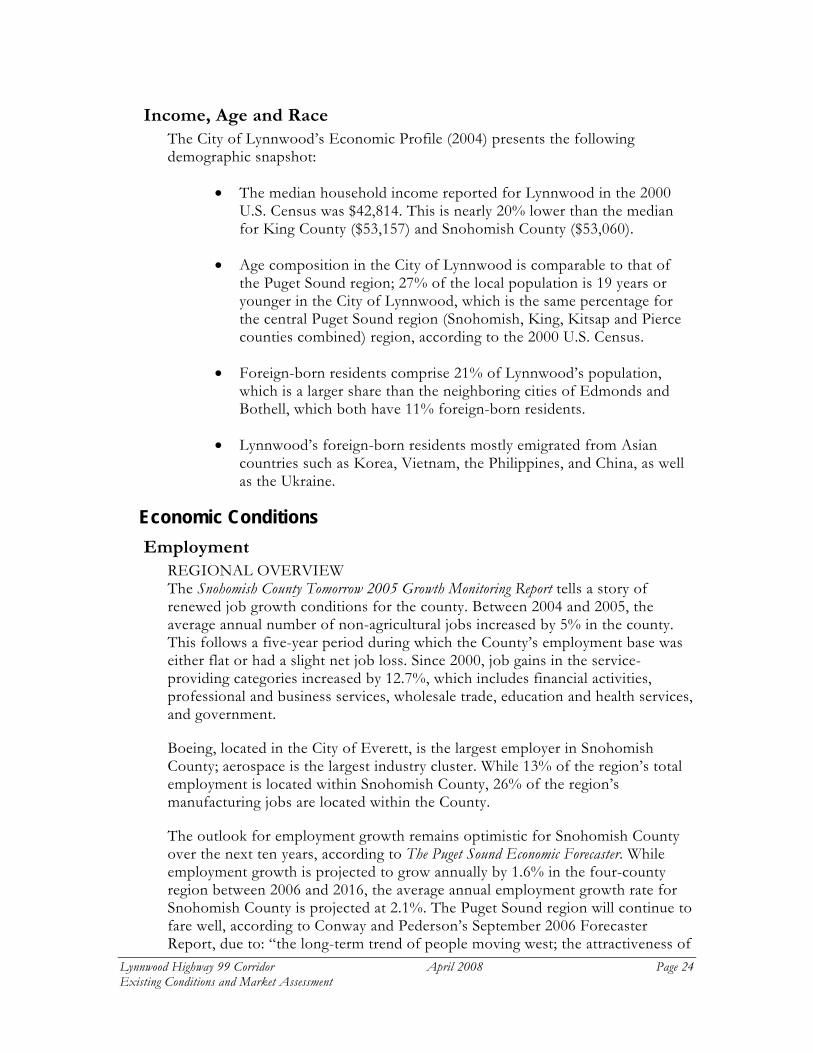
Income, Age and Race The City of Lynnwood’s Economic Profile (2004) presents the following demographic snapshot:
• The median household income reported for Lynnwood in the 2000 U.S. Census was $42,814. This is nearly 20% lower than the median for King County ($53,157) and Snohomish County ($53,060).
• Age composition in the City of Lynnwood is comparable to that of the Puget Sound region; 27% of the local population is 19 years or younger in the City of Lynnwood, which is the same percentage for the central Puget Sound region (Snohomish, King, Kitsap and Pierce counties combined) region, according to the 2000 U.S. Census.
• Foreign-born residents comprise 21% of Lynnwood’s population, which is a larger share than the neighboring cities of Edmonds and Bothell, which both have 11% foreign-born residents.
• Lynnwood’s foreign-born residents mostly emigrated from Asian countries such as Korea, Vietnam, the Philippines, and China, as well as the Ukraine.
Economic Conditions Employment
REGIONAL OVERVIEW The Snohomish County Tomorrow 2005 Growth Monitoring Report tells a story of renewed job growth conditions for the county. Between 2004 and 2005, the average annual number of non-agricultural jobs increased by 5% in the county. This follows a five-year period during which the County’s employment base was either flat or had a slight net job loss. Since 2000, job gains in the service-providing categories increased by 12.7%, which includes financial activities, professional and business services, wholesale trade, education and health services, and government.
Boeing, located in the City of Everett, is the largest employer in Snohomish County; aerospace is the largest industry cluster. While 13% of the region’s total employment is located within Snohomish County, 26% of the region’s manufacturing jobs are located within the County.
The outlook for employment growth remains optimistic for Snohomish County over the next ten years, according to The Puget Sound Economic Forecaster. While employment growth is projected to grow annually by 1.6% in the four-county region between 2006 and 2016, the average annual employment growth rate for Snohomish County is projected at 2.1%. The Puget Sound region will continue to fare well, according to Conway and Pederson’s September 2006 Forecaster Report, due to: “the long-term trend of people moving west; the attractiveness of
Lynnwood Highway 99 Corridor April 2008 Page 25 Existing Conditions and Market Assessment
the region as a place to live and locate jobs; and the lingering momentum of the current economic recovery.” Snohomish County in particular will benefit from the continued movement of people and businesses out from the center of the region, in search of available and more reasonably priced space.
LOCAL TRENDS The City’s Economic Profile describes local employment trends as follows:
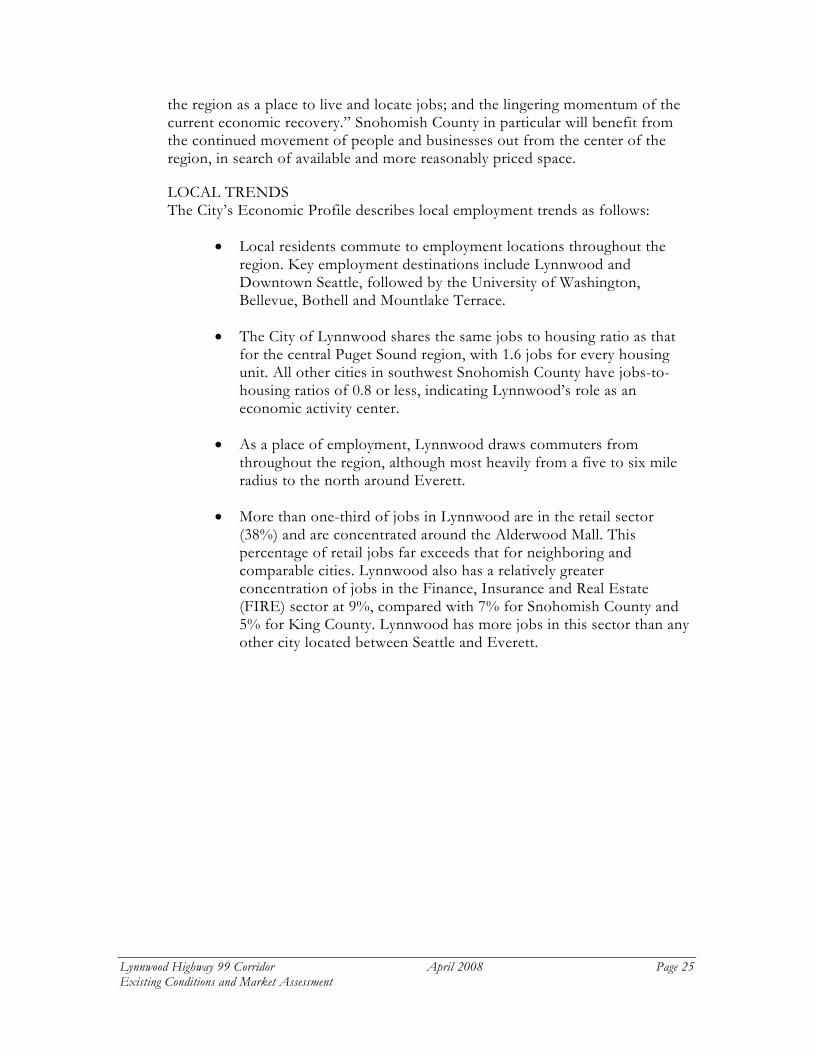
• Local residents commute to employment locations throughout the region. Key employment destinations include Lynnwood and Downtown Seattle, followed by the University of Washington, Bellevue, Bothell and Mountlake Terrace.
• The City of Lynnwood shares the same jobs to housing ratio as that for the central Puget Sound region, with 1.6 jobs for every housing unit. All other cities in southwest Snohomish County have jobs-to-housing ratios of 0.8 or less, indicating Lynnwood’s role as an economic activity center.
• As a place of employment, Lynnwood draws commuters from throughout the region, although most heavily from a five to six mile radius to the north around Everett.
• More than one-third of jobs in Lynnwood are in the retail sector (38%) and are concentrated around the Alderwood Mall. This percentage of retail jobs far exceeds that for neighboring and comparable cities. Lynnwood also has a relatively greater concentration of jobs in the Finance, Insurance and Real Estate (FIRE) sector at 9%, compared with 7% for Snohomish County and 5% for King County. Lynnwood has more jobs in this sector than any other city located between Seattle and Everett.
Lynnwood Highway 99 Corridor April 2008 Page 27 Existing Conditions and Market Assessment
MARKET ASSESSMENT
Retail Regional Overview
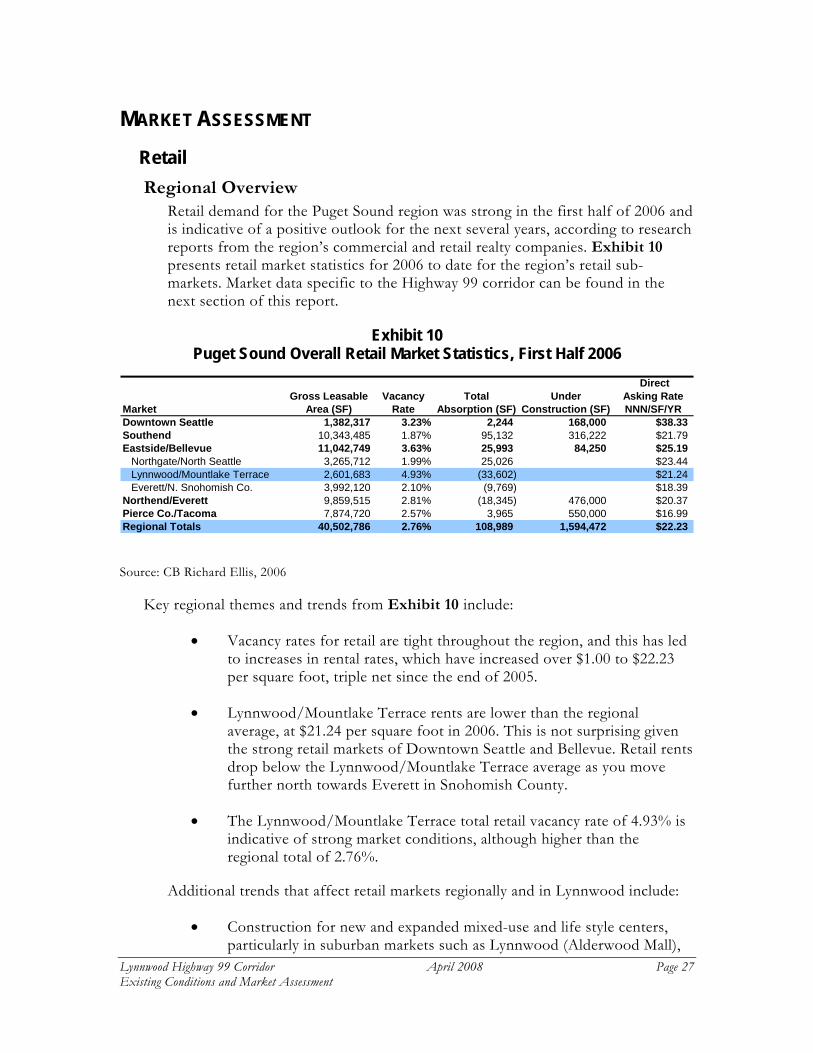
Retail demand for the Puget Sound region was strong in the first half of 2006 and is indicative of a positive outlook for the next several years, according to research reports from the region’s commercial and retail realty companies. Exhibit 10 presents retail market statistics for 2006 to date for the region’s retail sub-markets. Market data specific to the Highway 99 corridor can be found in the next section of this report.
Exhibit 10 Puget Sound Overall Retail Market Statistics, First Half 2006
DirectGross Leasable Vacancy Total Under Asking Rate
Market Area (SF) Rate Absorption (SF) Construction (SF) NNN/SF/YRDowntown Seattle 1,382,317 3.23% 2,244 168,000 $38.33Southend 10,343,485 1.87% 95,132 316,222 $21.79Eastside/Bellevue 11,042,749 3.63% 25,993 84,250 $25.19
Northgate/North Seattle 3,265,712 1.99% 25,026 $23.44Lynnwood/Mountlake Terrace 2,601,683 4.93% (33,602) $21.24Everett/N. Snohomish Co. 3,992,120 2.10% (9,769) $18.39
Northend/Everett 9,859,515 2.81% (18,345) 476,000 $20.37Pierce Co./Tacoma 7,874,720 2.57% 3,965 550,000 $16.99Regional Totals 40,502,786 2.76% 108,989 1,594,472 $22.23
Source: CB Richard Ellis, 2006
Key regional themes and trends from Exhibit 10 include:
• Vacancy rates for retail are tight throughout the region, and this has led to increases in rental rates, which have increased over $1.00 to $22.23 per square foot, triple net since the end of 2005.
• Lynnwood/Mountlake Terrace rents are lower than the regional average, at $21.24 per square foot in 2006. This is not surprising given the strong retail markets of Downtown Seattle and Bellevue. Retail rents drop below the Lynnwood/Mountlake Terrace average as you move further north towards Everett in Snohomish County.
• The Lynnwood/Mountlake Terrace total retail vacancy rate of 4.93% is indicative of strong market conditions, although higher than the regional total of 2.76%.
Additional trends that affect retail markets regionally and in Lynnwood include:
• Construction for new and expanded mixed-use and life style centers, particularly in suburban markets such as Lynnwood (Alderwood Mall),
Lynnwood Highway 99 Corridor April 2008 Page 28 Existing Conditions and Market Assessment
Renton, Kent, and Federal Way continues to gain momentum in the Puget Sound region. Expansions continue at Alderwood Mall, Bellevue Square, Northgate Mall in Seattle and Westfield Shopping Center (formerly Southcenter Mall) in Tukwila. The largest of the new projects under construction is The Landing, a 46-acre project on the south end of Lake Washington in Renton. The former Boeing property is currently being redeveloped as a new urban center to include parks, multifamily housing, restaurants, shops and a cinema.
• Other smaller suburban communities seek the creation or revitalization of town centers, which calls for denser, pedestrian-oriented development, typically with residential units stacked over street-level retail space.
• Retail tenants who are new to the Puget Sound seek to establish a regional presence through location specific development. For example, Kohl’s department store’s strategic placement in Lynnwood, Redmond, Covington, Marysville and Southcenter.
Highway 99 Retail Conditions The retail and service-oriented businesses located along the Highway 99 corridor in Lynnwood range from high-end auto dealerships, big box centers, ethnic markets and individually owned mom-and-pop establishments. In total, built area for retail use occupies 2.4 million s.f. of the total built inventory of 22.9 million s.f. found along the corridor. The average retail establishment along the corridor takes up only 15% of its parcel land area with built space.
Retail development patterns in the corridor can be broken into two groups. General Retail, Grocery Stores, and Lumber, Paint and Hardware Stores tend to build out more of their parcels at 20-23% of land area. Car Dealerships, Gas Stations, Other Food Retail (not large grocery stores), Eating and Drinking establishments, and the single Department store in the vicinity all build out much less of their parcel land area at 4%-11% of total land. The bulk of the retail land area (77%) is comprised of, in descending order, General Retail, Other Food Retail and Car Dealerships.
TRADE AREA Defining the retail trade area(s) for the Highway 99 corridor is dependent upon the retail niche or category located on the corridor: auto dealers and auto-related businesses; Asian markets and ethnic specialty retail; sub-regional and community shopping centers; and smaller convenience-oriented retail. For eating and drinking franchises, the trade area can be a very tight radius (3 or 5 miles) and depends heavily on daytime population. Auto dealerships typically draw from a broader regional market that would include a trade area encompassing a wider swath of Western Washington. Customers come to dealerships on the corridor for reasons such as price points and customer service more than the convenience or location. Ethnic markets, community shopping centers and convenience-

Lynnwood Highway 99 Corridor April 2008 Page 29 Existing Conditions and Market Assessment
oriented retail primarily serve local Lynnwood residents and employees as well as South Edmonds, Shoreline, Mukilteo and South Everett, which are identified in Exhibit 4 and Exhibit 5 as high concentration points of origin and destination for travelers along the Highway 99 corridor.
MARKET CONDITIONS Interviews with retail professionals working with property owners and businesses along Highway 99 in Lynnwood, as well as real estate investors offer the following insights into current retail market conditions:
• Highway 99 Corridor is a naturally thriving and appealing business and retail market area. Its north-south orientation makes the corridor a naturally strong thoroughfare for businesses and residents; Highway 99 serves “an instant advertising function” for the businesses located alongside it. Other key strengths of the Highway 99 corridor include: an established core of national and regional retailers, population density surrounding all sides of the highway, good freeway access with multiple access points from the corridor highway. Proximity to Alderwood Mall is also a stated advantage for the corridor because its regional draw brings people through Lynnwood; some retailers with a store in the mall also choose to locate a second store on the corridor itself (Sprint/Nextel store is an example).
• Escalating rents and low vacancy rates. Most agree that land prices have gone up substantially, and that rents are escalating throughout the corridor. Vacancies on all product types are low and retail is generally strong, however, mixed-use retail has not been particularly successful yet (north of Lynnwood is mentioned as a success). Lynnwood land values are said to range from $25-35 per square foot, triple net for Class A space. Lynnwood Center and James Village are particularly strong locations at the 196th St. intersection. Centers anchored by grocery stores are best positioned to attract higher rents and more demand, as evidenced by the aging center on 196th west of the highway which retains an Albertsons, and is commanding rents of $25 per square foot. Interviewees expect that the rents that have been increasing steadily in recent years will continue the trend.
• Market conditions are on the upswing. Brokers are noticing greater investor interest in buying up vacant and underutilized parcels on the corridor for new development, including mixed use projects with multifamily housing.
• Limited quantity of ideal corridor properties. The corridor presents some challenges for brokers as some regional and national
Lynnwood Highway 99 Corridor April 2008 Page 30 Existing Conditions and Market Assessment
retailers are only interested in locating in specific ‘pockets’ along the corridor. For example, the Lynnwood Center is perceived as a desirable retail location, at a key access and focal point on the corridor, with high traffic counts. Retailers that value high traffic counts and easy in/out automobile access do not want to be located amongst the larger car dealerships. Other retailers do want to locate adjacent to aging developments or underutilized parcels.
• Development opportunities. Interviewees mention a broad range of development opportunities for the corridor which include:
— Additional ethnic centers to cater to the population demographic in area.
— Replication of the kinds of developments that are occurring on the west side of 170th, as well at the intersections of 164th and 188th .
— Paine Field towards the International Airport and at its South end by 128th is viewed as a future development opportunity site.
— A next wave of growth is speculated to occur north of 164th to Mukilteo Speedway which is currently underdeveloped and boasts low land prices of $18-$20/SF.
— Another corridor speculation is that as Everett becomes more affluent in the future, then there will be more property ownership than leasing along the corridor.
— One broker anticipates a mixed- use environment occurring within the next 10 years, while another mentions that limited access for automobiles along the corridor will lead to substantial growth along the east and west arterials of Highway 99’s major intersections.
• Property redevelopment trends. Some property owners on the corridor are recognizing the value of their locations and are seeking to make improvements.
• Development support. The most frequently cited ways that corridor development could be supported are through creating a fast track approach to permitting for developers, as well as opening up commercial zoning to extend further back from the Highway 99 (1,000 ft.), which would help it compete with I-5. One respondent mentioned that a study comparing the overall revenue generated on Highway 99 to the retail areas associated with I-5 would be useful.
Another respondent believed that the City needs to update its regulations from its current zoning code which supports 1950’s style
Lynnwood Highway 99 Corridor April 2008 Page 31 Existing Conditions and Market Assessment
auto-oriented development with big set backs, low density, and heavy parking requirements. He also mentions that the City needs regulation that supports the combination of housing and commercial in development (Shoreline serves as an example). In addition, the City of Lynnwood’s divided City Council and Fire Marshal must resolve their issues to give owners and developers the comfort needed to move forward with redevelopment.
• Highway 99 corridor competition. Areas mentioned include: Shoreline (its big box center in particular), Edmonds, Bothell, Mill Creek and I-5 retail intersections. Tukwila may also be a competitive market, due to Alderwood’s competition with South Center. The corridor is believed to compete with major retail intersections of I-5, but is viewed as superior to it for auto-oriented retail due to its ease of access.
• Transit improvements. Respondents had mixed responses to the idea of transit improvements with several seeing its development as a critical component to the area’s value, while others believing that auto dependencies make the improvements unlikely to work. Some are unsure if light rail would be a good or bad addition, while others do not see it ever expanding to the Lynnwood area. One respondent mentions that transit operations will promote travel by people who do not support the bulk of the commerce that is happening with auto owners. On the other hand, one respondent believes that transit will help drive mixed-use development over time, and another mentions that density or more massing is a positive trend for the area.
• Demographic changes. Brokers comments that there is quite a bit of fluctuation in demographics along the corridor, and these variations in household incomes, race, and housing tenure influence the locations for different retail uses.
KEY CORRIDOR RETAILERS Auto dealerships. Dealerships along the corridor take up 44 separate parcels of land and 2.5 million s.f. of land area. From a development perspective, they build on only 10% of the land in use and the bulk are found within Segment 4 (200th to 208th). (From a broader City economic perspective, of course, vehicle sales provide coveted sales tax revenues to the City.)
Asian retail. There are many service-oriented retail shops throughout the corridor ranging in size from the large international Pal Do market (that likely draws customers from a wide geographic radius) to the smaller individual retail stores and services that cater primarily to an Asian demographic.
Local Serving/Convenience Retail. These include both national and regional tenants as well as local mom and pop stores.
Lynnwood Highway 99 Corridor April 2008 Page 32 Existing Conditions and Market Assessment
Other Lynnwood Retail ALDERWOOD MALL The 1.5 million square foot regional shopping mall includes four anchor department store tenants, more than 200 shops and boutiques within its perimeters, a village-like setup, and entertainment and restaurants throughout (including a 16-screen Cineplex). This shopping area is a major regional draw for the City of Lynnwood.
CITY CENTER City Center retailers include a broad mix of auto-oriented strip centers and pad development. City plans for City Center, described in the following section, include improved urban design that retailers will embrace along with increased daytime population that office absorption would bring, as well as more households in the City Center’s planned multifamily housing.
Other Lynnwood Projects LYNNWOOD HIGH SCHOOL PROJECT A new two-story Lynnwood High School building is being built on a 40-acre site with many features beyond the building itself that will serve the Lynnwood community and its students. These include: two lighted, artificial-turf, multi-use soccer and softball fields; a lighted, artificial turf football field with running track; a lighted baseball field and tennis courts; a field-house with concessions; forested creek and wetland areas; a greenhouse and an accessible path around the site to provide educational opportunities about environmental stewardship.
CITY CENTER SUBAREA PLAN The City of Lynnwood plans to create a vibrant City Center within the next 20 years with a diverse range of projects underway to accomplish these goals. Plans include master plans for city parks, city streets, and the convention center; I-5/196th pedestrian improvements.
Several ordinances have already been adopted, including the City Center Sub Area Plan and the City Center Design Guidelines for development. The Plan and Guidelines lay out the overall intentions of upgrading the city’s transportation network and creating a more pedestrian-friendly environment with designed streetscapes, improved pedestrian connectors, and additional public open spaces for active use. The plan attempts to create an environment with a commercial core of retail and business activity mixed with housing, strong cultural attractions and great public spaces and parks. Additional components include enhanced connectivity for pedestrians and vehicular traffic through improved street patterns and other design elements, such as enhanced street level uses and prominent “community gateways” marking key intersections.
Lynnwood Highway 99 Corridor April 2008 Page 33 Existing Conditions and Market Assessment
Office Regional Overview
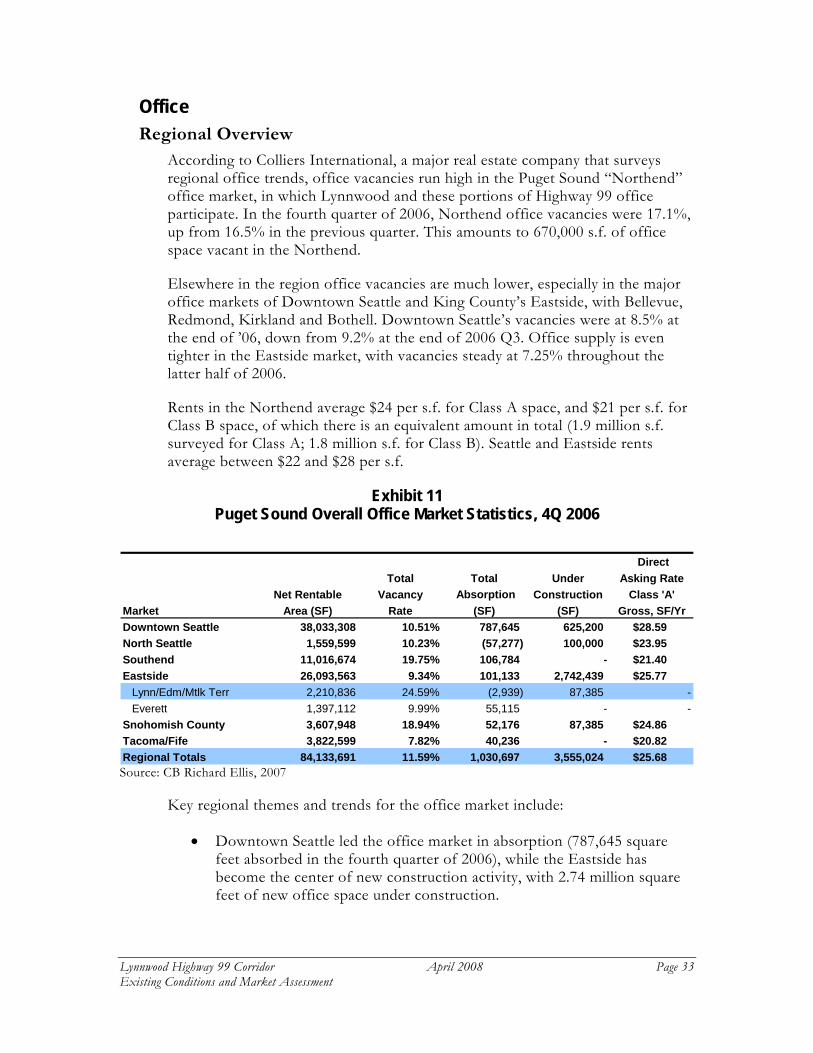
According to Colliers International, a major real estate company that surveys regional office trends, office vacancies run high in the Puget Sound “Northend” office market, in which Lynnwood and these portions of Highway 99 office participate. In the fourth quarter of 2006, Northend office vacancies were 17.1%, up from 16.5% in the previous quarter. This amounts to 670,000 s.f. of office space vacant in the Northend.
Elsewhere in the region office vacancies are much lower, especially in the major office markets of Downtown Seattle and King County’s Eastside, with Bellevue, Redmond, Kirkland and Bothell. Downtown Seattle’s vacancies were at 8.5% at the end of ’06, down from 9.2% at the end of 2006 Q3. Office supply is even tighter in the Eastside market, with vacancies steady at 7.25% throughout the latter half of 2006.
Rents in the Northend average $24 per s.f. for Class A space, and $21 per s.f. for Class B space, of which there is an equivalent amount in total (1.9 million s.f. surveyed for Class A; 1.8 million s.f. for Class B). Seattle and Eastside rents average between $22 and $28 per s.f.
Exhibit 11 Puget Sound Overall Office Market Statistics, 4Q 2006
DirectTotal Total Under Asking Rate
Net Rentable Vacancy Absorption Construction Class 'A'Market Area (SF) Rate (SF) (SF) Gross, SF/YrDowntown Seattle 38,033,308 10.51% 787,645 625,200 $28.59North Seattle 1,559,599 10.23% (57,277) 100,000 $23.95Southend 11,016,674 19.75% 106,784 - $21.40Eastside 26,093,563 9.34% 101,133 2,742,439 $25.77
Lynn/Edm/Mtlk Terr 2,210,836 24.59% (2,939) 87,385 -Everett 1,397,112 9.99% 55,115 - -
Snohomish County 3,607,948 18.94% 52,176 87,385 $24.86Tacoma/Fife 3,822,599 7.82% 40,236 - $20.82Regional Totals 84,133,691 11.59% 1,030,697 3,555,024 $25.68 Source: CB Richard Ellis, 2007
Key regional themes and trends for the office market include:
• Downtown Seattle led the office market in absorption (787,645 square feet absorbed in the fourth quarter of 2006), while the Eastside has become the center of new construction activity, with 2.74 million square feet of new office space under construction.
Lynnwood Highway 99 Corridor April 2008 Page 34 Existing Conditions and Market Assessment
• Average lease rates in the region are at a four year high, increasing $0.95 from the previous quarter to $25.68 per square foot, full service, per year. The Downtown Seattle market experienced the greatest quarterly and yearly gains in lease rates, with Southend market close behind with a $1.30 per square foot increase over the past quarter.
• Vacancy rates on the Eastside are among some of the lowest in the region at 9.34%, as compared to 11.59% for the region as a whole. The Lynnwood/Edmonds/Mountlake Terrace market posted the highest office vacancy rates at 24.59%.
Additional trends that affect office markets regionally and within Lynnwood are as follows:
• Employment growth in the region continues to outpace the national trends, which will drive increased demand for office space. Boeing has been a bright spot in the region, increasing employment along with recent gains in market share for commercial airplanes.
• Office construction activity is expected to increase in the near future, as rising rents and declining vacancy rates signal developers to move ahead with construction plans.
• Most office market growth has been concentrated in the major employment centers of Seattle and Bellevue. For smaller cities such as Lynnwood, office development typically includes a mix of owner-occupied, smaller office buildings, or low-rise developments, frequently home to medical-dental practices and a mix of professional services.
Highway 99 Office Conditions The nearest significant concentration of office space along Highway 99 is found immediately south of Lynnwood, between SW 220th Street and SW 216th Street. Land along this segment is within Edmonds City Limits to the west, Lynnwood to the East, as well as a small portion in Mountlake Terrace to the east. Most of the office supply on the west of this segment is devoted to medical office, clustered around Stevens Hospital.
Most of the office space to the east is set back a quarter-mile or so from the highway, and located in the City of Mountlake Terrace. Office in this area is dominated and anchored by Premera Blue Cross. The remainder of the office space in this area houses a mix of office and light-industrial tenants.
Prices are generally lower in the Northend, though vacancies remain high. This appears to limit the potential for major concentrations of office space along Highway 99 in Lynnwood, but the data alone should not rule out consideration of relatively smaller office buildings that might take advantage of local niche
Lynnwood Highway 99 Corridor April 2008 Page 35 Existing Conditions and Market Assessment
markets and key sites. This potential will be explored further in subsequent phases of the study.
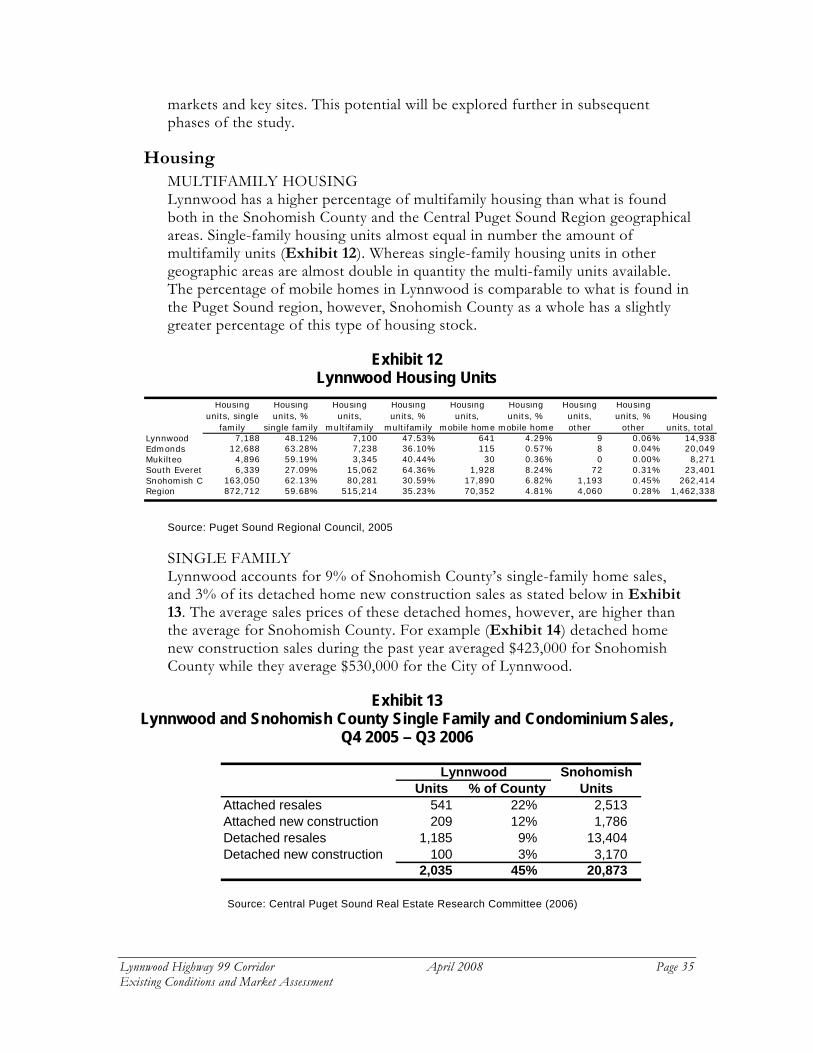
Housing MULTIFAMILY HOUSING Lynnwood has a higher percentage of multifamily housing than what is found both in the Snohomish County and the Central Puget Sound Region geographical areas. Single-family housing units almost equal in number the amount of multifamily units (Exhibit 12). Whereas single-family housing units in other geographic areas are almost double in quantity the multi-family units available. The percentage of mobile homes in Lynnwood is comparable to what is found in the Puget Sound region, however, Snohomish County as a whole has a slightly greater percentage of this type of housing stock.
Exhibit 12 Lynnwood Housing Units
Housing
units, single family
Housing units, %
single family
Housing units,
multifamily
Housing units, %
multifamily
Housing units,
mobile home
Housing units, %
mobile home
Housing units, other
Housing units, %
otherHousing
units, totalLynnwood 7,188 48.12% 7,100 47.53% 641 4.29% 9 0.06% 14,938Edmonds 12,688 63.28% 7,238 36.10% 115 0.57% 8 0.04% 20,049Mukilteo 4,896 59.19% 3,345 40.44% 30 0.36% 0 0.00% 8,271South Everet 6,339 27.09% 15,062 64.36% 1,928 8.24% 72 0.31% 23,401Snohomish C 163,050 62.13% 80,281 30.59% 17,890 6.82% 1,193 0.45% 262,414Region 872,712 59.68% 515,214 35.23% 70,352 4.81% 4,060 0.28% 1,462,338
Source: Puget Sound Regional Council, 2005
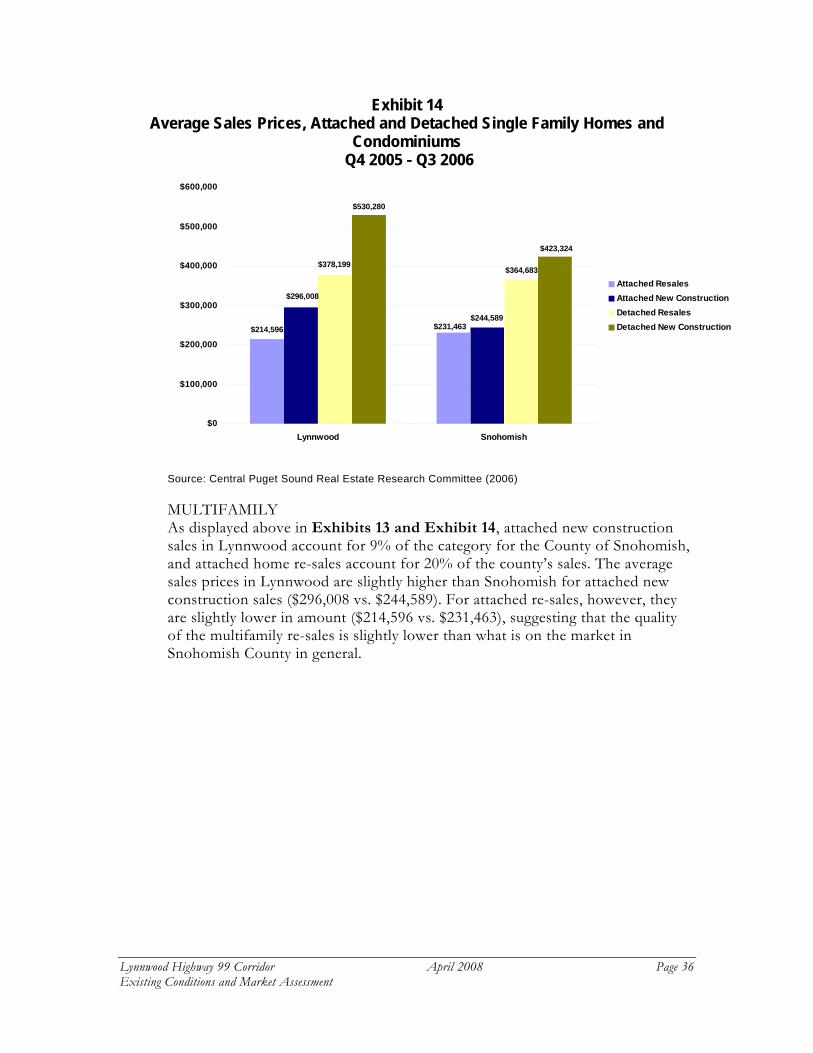
SINGLE FAMILY Lynnwood accounts for 9% of Snohomish County’s single-family home sales, and 3% of its detached home new construction sales as stated below in Exhibit 13. The average sales prices of these detached homes, however, are higher than the average for Snohomish County. For example (Exhibit 14) detached home new construction sales during the past year averaged $423,000 for Snohomish County while they average $530,000 for the City of Lynnwood.
Exhibit 13 Lynnwood and Snohomish County Single Family and Condominium Sales,
Q4 2005 – Q3 2006
SnohomishUnits % of County Units
541 22% 2,513209 12% 1,786
1,185 9% 13,404100 3% 3,170
2,035 45% 20,873Detached new construction
Lynnwood
Attached resalesAttached new constructionDetached resales
Source: Central Puget Sound Real Estate Research Committee (2006)
Lynnwood Highway 99 Corridor April 2008 Page 36 Existing Conditions and Market Assessment
Exhibit 14 Average Sales Prices, Attached and Detached Single Family Homes and
Condominiums Q4 2005 - Q3 2006
$231,463$214,596$244,589
$296,008
$364,683$378,199
$423,324
$530,280
$0
$100,000
$200,000
$300,000
$400,000
$500,000
$600,000
Lynnwood Snohomish
Attached ResalesAttached New ConstructionDetached ResalesDetached New Construction
Source: Central Puget Sound Real Estate Research Committee (2006)
MULTIFAMILY As displayed above in Exhibits 13 and Exhibit 14, attached new construction sales in Lynnwood account for 9% of the category for the County of Snohomish, and attached home re-sales account for 20% of the county’s sales. The average sales prices in Lynnwood are slightly higher than Snohomish for attached new construction sales ($296,008 vs. $244,589). For attached re-sales, however, they are slightly lower in amount ($214,596 vs. $231,463), suggesting that the quality of the multifamily re-sales is slightly lower than what is on the market in Snohomish County in general.
Lynnwood Highway 99 Corridor April 2008 Page 37 Existing Conditions and Market Assessment
Exhibit 15 Lynnwood Multifamily Rental Market Data.
2000-2006
$793$786
$783$780
$771
$758
$770
$786 $784
$813
$800
4.8%4.4%
5.0%
8.2%
3.4%
8.4%8.0%
$730
$740
$750
$760
$770
$780
$790
$800
$810
$820
Sep-01 Mar-02 Sep-02 Mar-03 Sep-03 Mar-04 Sep-04 Mar-05 Sep-05 Mar-06 Sep-060.0%
1.0%
2.0%
3.0%
4.0%
5.0%
6.0%
7.0%
8.0%
9.0%
Average Rent Vacancy Rate
Vacancy RateAverage Rent
Source: Dupre & Scott Apartment Advisors (2006)
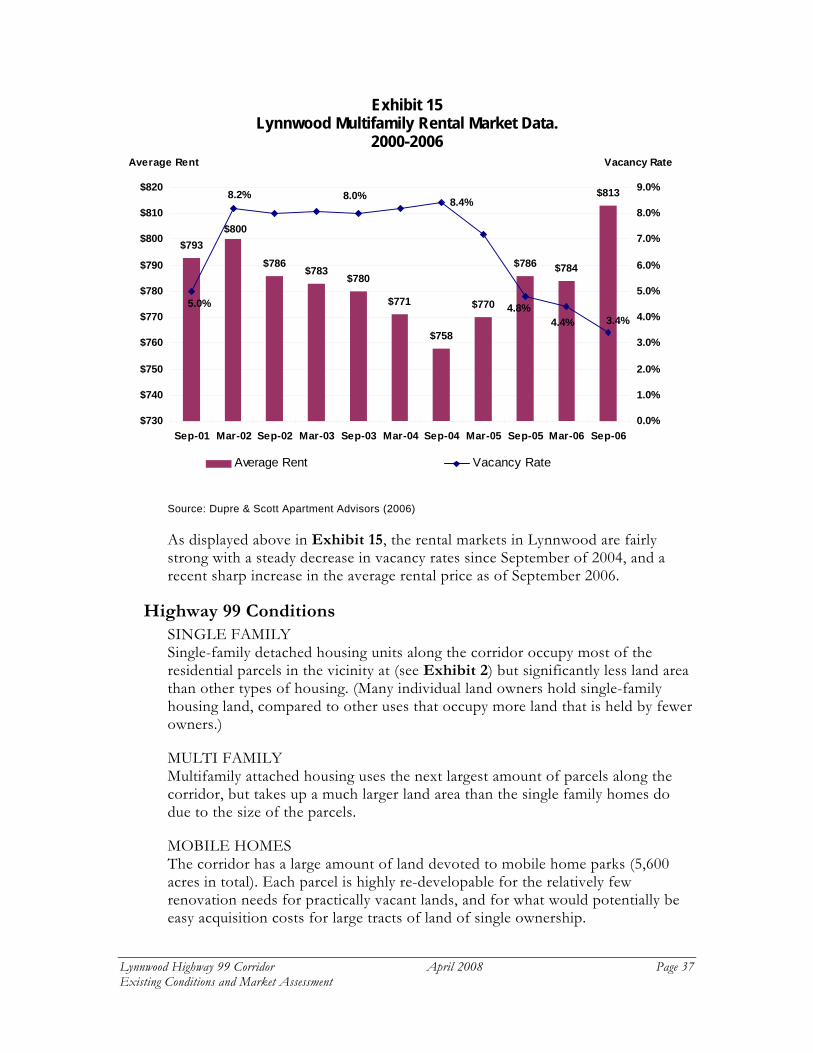
As displayed above in Exhibit 15, the rental markets in Lynnwood are fairly strong with a steady decrease in vacancy rates since September of 2004, and a recent sharp increase in the average rental price as of September 2006.
Highway 99 Conditions SINGLE FAMILY Single-family detached housing units along the corridor occupy most of the residential parcels in the vicinity at (see Exhibit 2) but significantly less land area than other types of housing. (Many individual land owners hold single-family housing land, compared to other uses that occupy more land that is held by fewer owners.)
MULTI FAMILY Multifamily attached housing uses the next largest amount of parcels along the corridor, but takes up a much larger land area than the single family homes do due to the size of the parcels.
MOBILE HOMES The corridor has a large amount of land devoted to mobile home parks (5,600 acres in total). Each parcel is highly re-developable for the relatively few renovation needs for practically vacant lands, and for what would potentially be easy acquisition costs for large tracts of land of single ownership.
Lynnwood Highway 99 Corridor April 2008 Page 38 Existing Conditions and Market Assessment
Lodging Four motels and one hotel are found along Highway 99 in Lynnwood, including: Lynnwood Motor Inn, Rodeo Inn, Lake Hill Motel, Court of Monte Cristo Motel and the Hotel International. Most listed along the corridor have the capacity of between 50-100 rooms. The status of Court of Monte Cristo Motel is unknown, but it did have a for sale sign during the site survey visit. Ten other hotels and motels with the total capacity of over 1,000 rooms are found off of Highway 99 in the direct vicinity of the Alderwood Mall area. These hotels are primarily representative of hotel chains such as Comfort Inn, La Quinta and Embassy Suites.
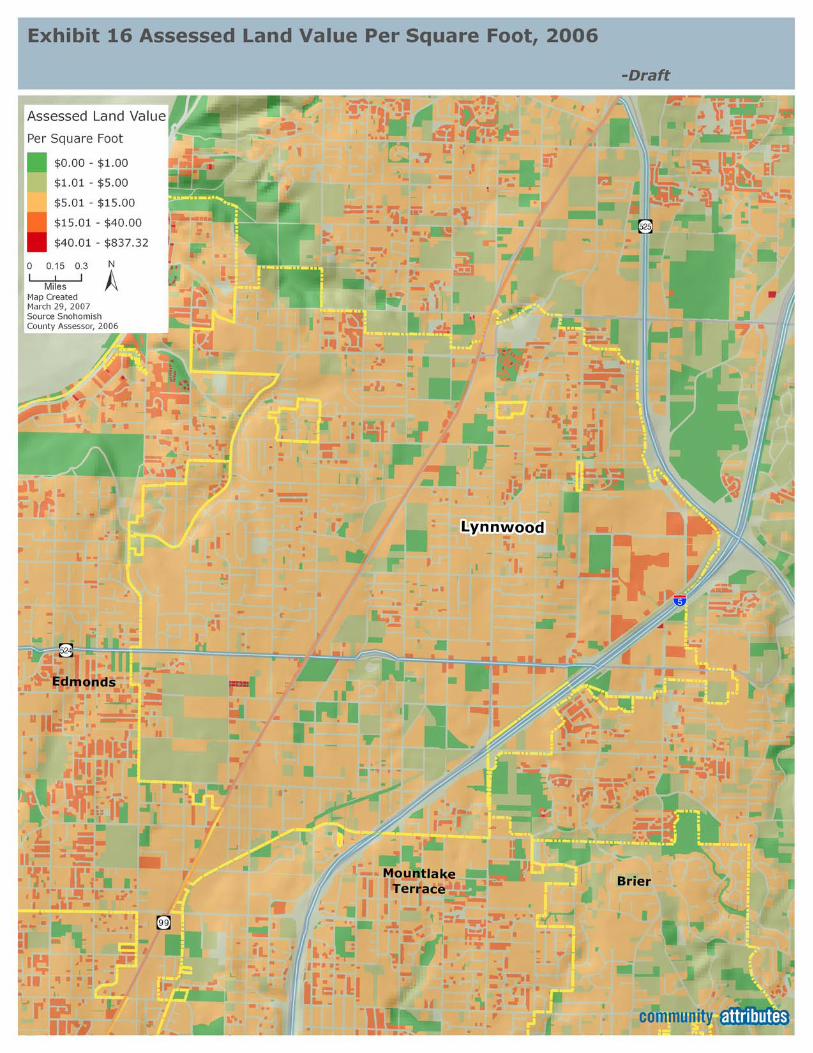
Land Values Land along Highway 99 in Lynnwood has historically been valued lower than residential areas in the vicinity, as shown by County assessed values for land in Exhibit 14.
Lynnwood Highway 99 Corridor April 2008 Page 40 Existing Conditions and Market Assessment
DEVELOPMENT FEASIBILITY ANALYSES This section presents three case studies of developments representative of concepts discussed at the initial stakeholder meeting. Analysis is based on pro forma income statements (see Attachment A) developed for each development, programmed as follows:
#1 Mixed-Use Residential and Retail Development
• A transit-oriented development that clearly establishes the “third place” qualities for community interaction, including open space, transit and non-motorized access and mix of retail and services.
• Size: 4-over-1 construction, 200 housing units, plus 33,000 s.f. of retail and services space in the ground floor.
• Parking: Structured with some ground-level parking.
#2 Community Retail Center
• A retail center anchored by upper-scale grocery that delivers an enjoyable shopping experience. Examples of anchors within the Puget Sound region might include Whole Foods, PCC, MetropolitanMarket or Town & Country Markets (includes Central Market in Mill Creek).
• The retail center is single-level with surface parking, allowing for transit-connectivity and a strong sense of place achieved through public plazas and a broad mix of retailers and services.
• This center would provide for local grocery needs, anchoring a development designed to provide greater place-making than currently found along Highway 99 in Lynnwood. The concept is not intended to compete with Alderwood Mall for regional destination retail.
• Size: 150,000 s.f. of leasable space
• Parking: Surface
#3 Small-Business Center
• A business park that focuses on the needs of small businesses. Provides small spaces that can accommodate the needs of a mix of uses, such as tech companies, small assembly (“urban industrial”), some storage and flexible office configurations.
• “Urban industrial” is a term we have used elsewhere to describe light manufacturing or assembly operations that value an urban location for
Lynnwood Highway 99 Corridor April 2008 Page 41 Existing Conditions and Market Assessment
access to customers and distribution networks. In some cases, these spaces would include a small showroom or storefront, allowing businesses to “make it in back and sell it out front”.
• Size: 60,000 s.f. (at 300 s.f. per job, this would accommodate 200 jobs, plus or minus a few, depending on the mix of tenants’ space needs and vacancies).
• Parking: Surface
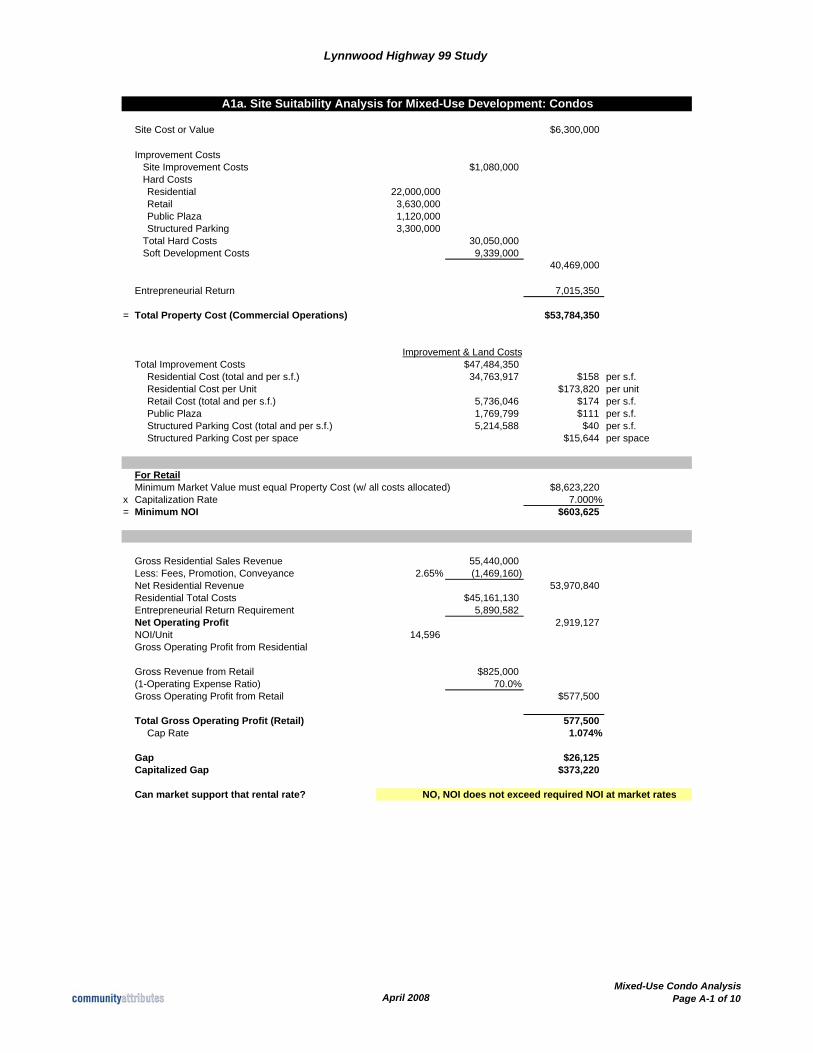
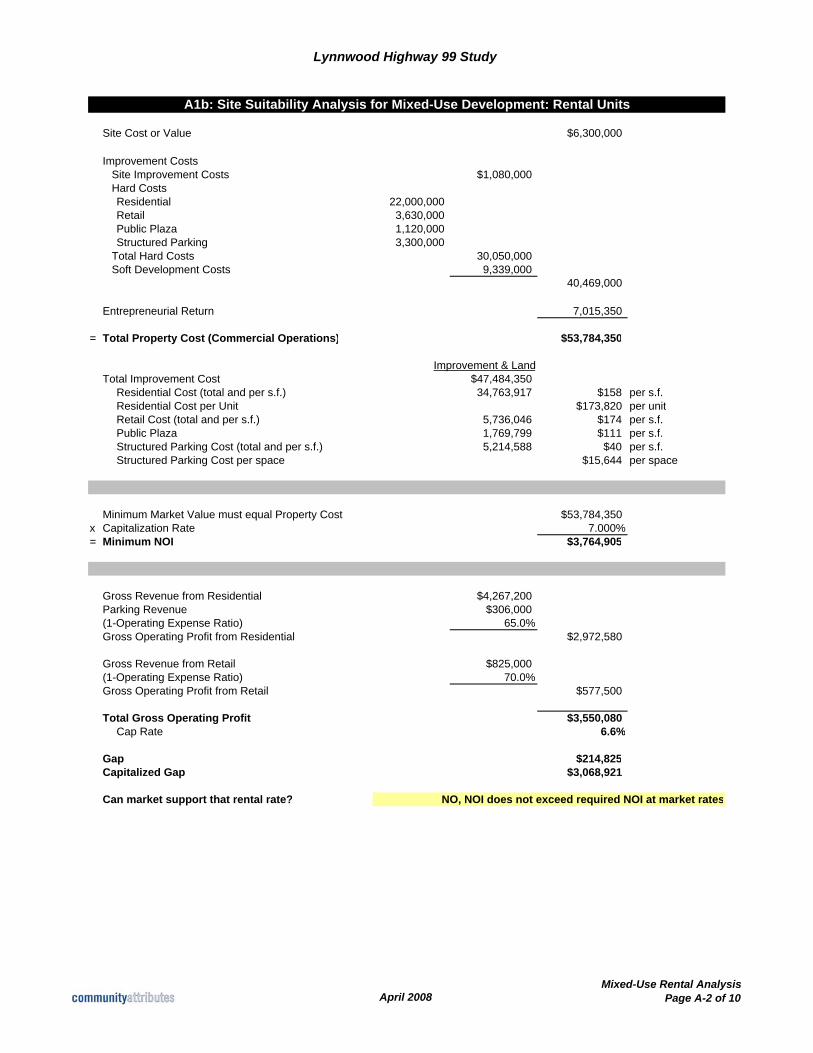
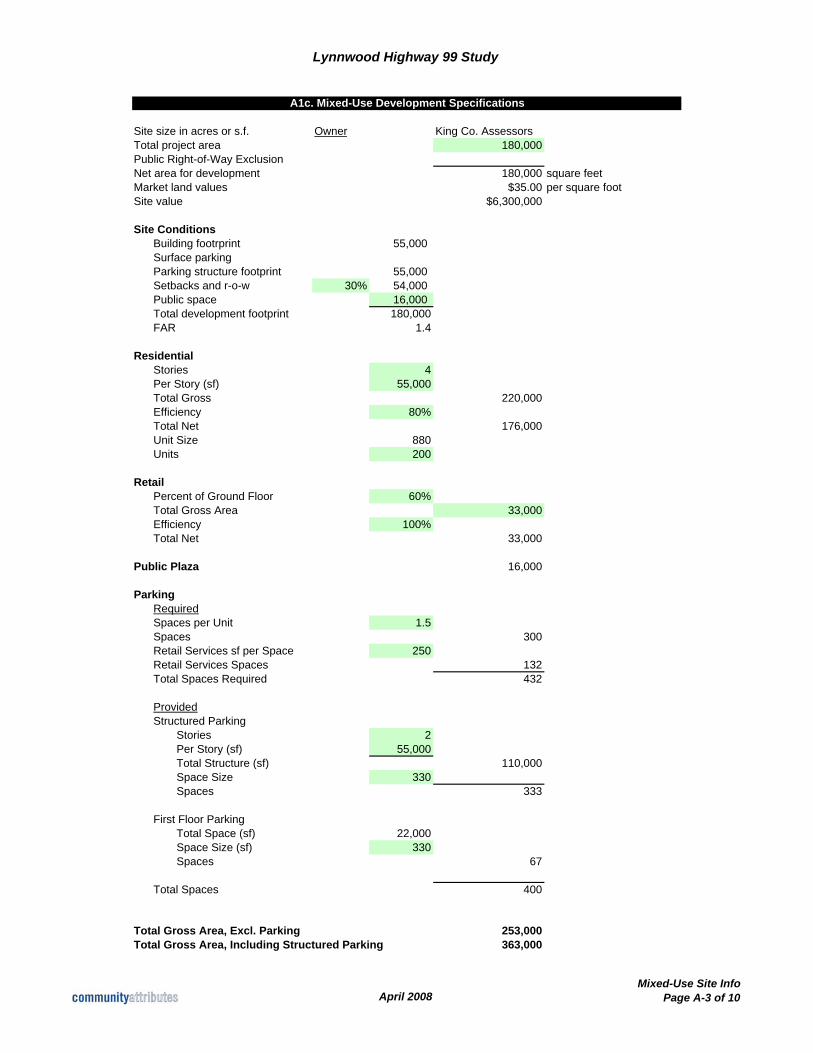
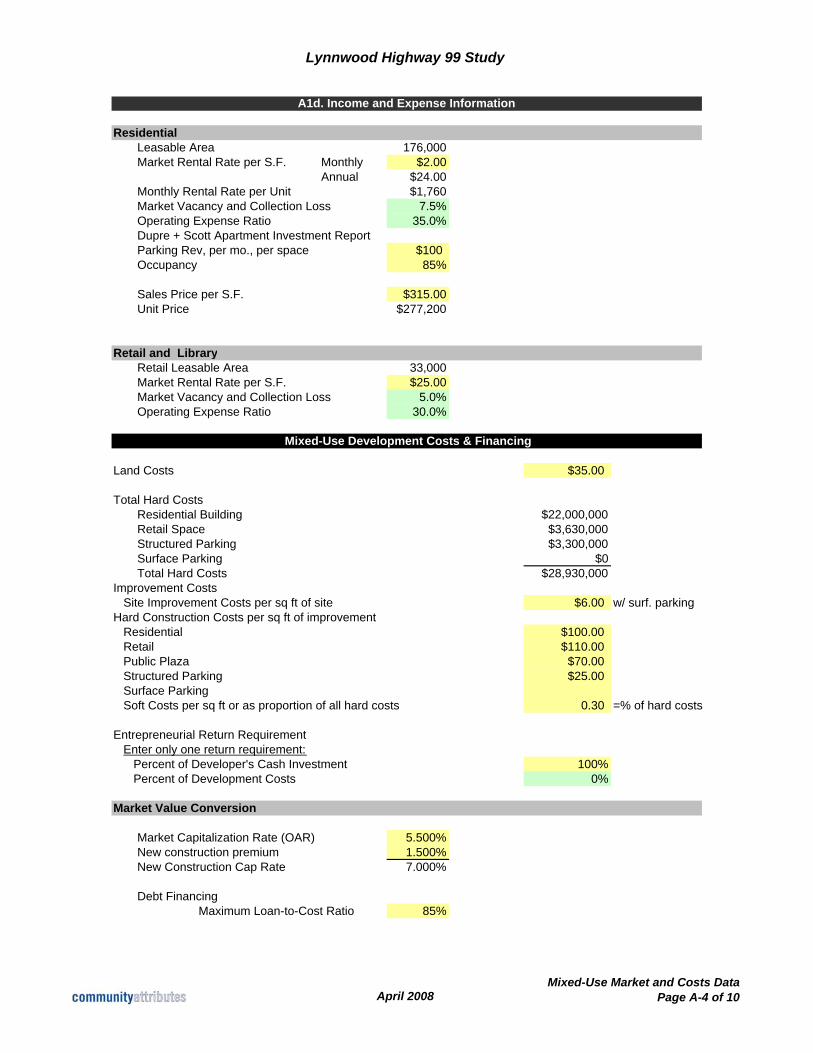
Mixed-Use Residential and Retail Development Mixed-use development modeled for the Lynnwood Highway 99 corridor includes housing above one floor of commercial space (a configuration of mixed-use development common throughout the region), including structured parking in the form of above-ground parking adjacent to the housing and retail space (less commonly found in this region). Exhibit A-1a shows how development costs (Exhibit A-1c) and market data (Exhibit A-1d) come together for feasibility analysis for owner-occupied condominiums in the housing units. The analysis suggests that such a development would be attractive for owner-occupied housing units but rental rates would challenge the development’s ability to cover the structured parking costs.
Exhibit 15 below presents a summary of market conditions and City actions related to successful development of this product.
Exhibit 15 Market Conditions Targeted for Development Success
of Mixed-Use Housing over Retail
Current Market Target Values Actions Considered
Residential condominium sales
$ 341 per s.f. or $300,000 for an 880 s.f. unit
$315 per s.f. or $275,000 for an 880 s.f. unit
Keep construction costs low and regulations minimal to avoid driving up prices.
Residential rental rates
$1.00 per s.f. or $8,00 per mo. for an 880 s.f. unit
$2.00 or more per s.f. per unit, or $1,760 or more for an 880 s.f. unit
Strong transit connections (reducing transportation costs), excellent place-making and reduction of parking costs (eliminate parking costs for developer).
Retail rents $25 per s.f. $25. per s.f. Retail success in mixed-use depends on drawing customers from beyond adjacent retail; requires access and visibility to all customers.
Lynnwood Highway 99 Corridor April 2008 Page 42 Existing Conditions and Market Assessment
Parking Surface parking more viable, especially for rental and more affordably priced housing units.
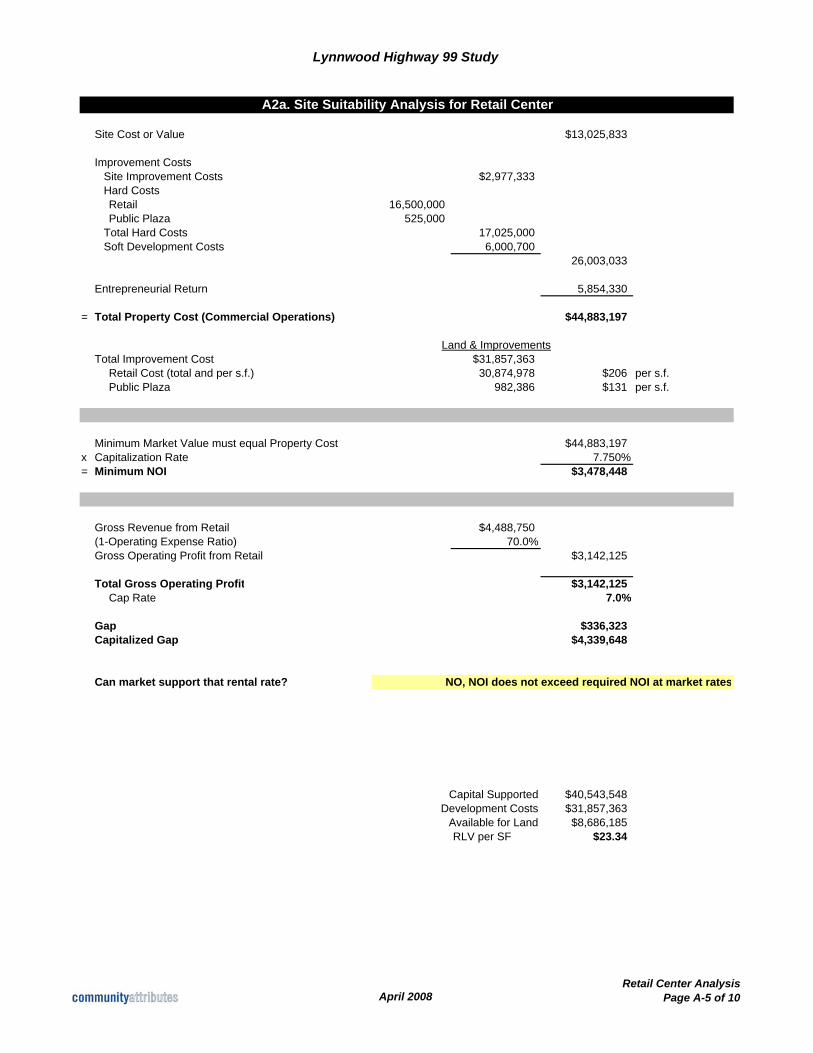
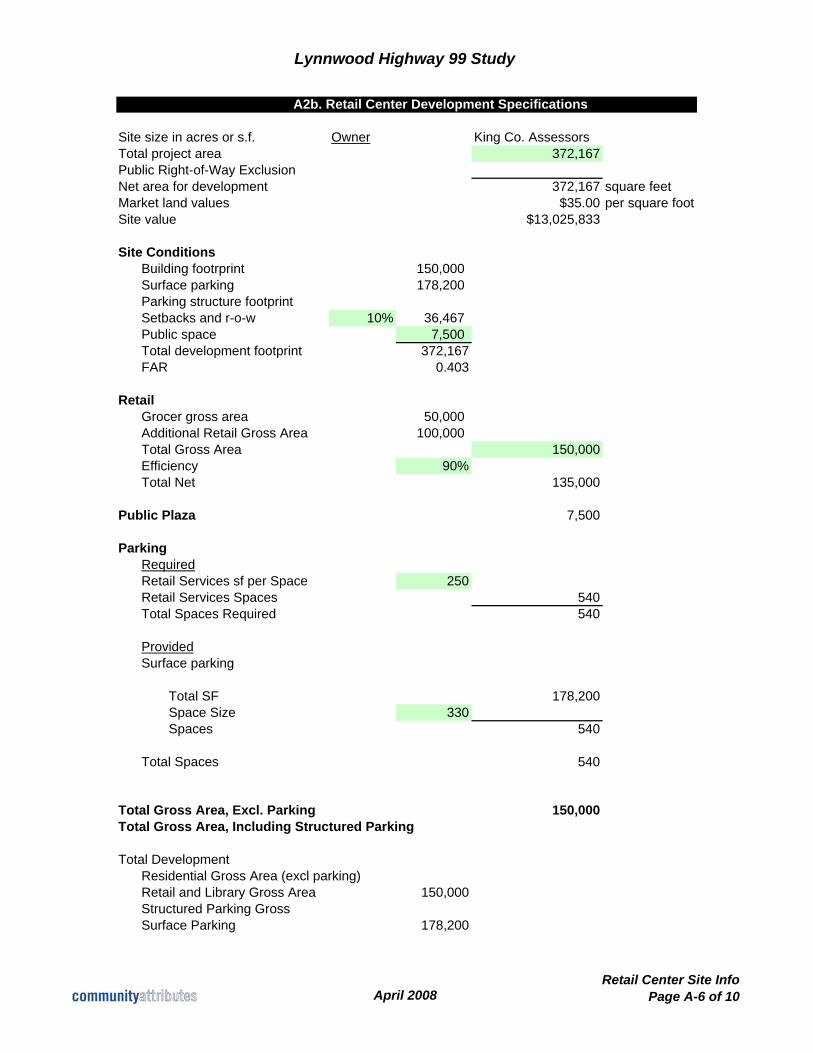
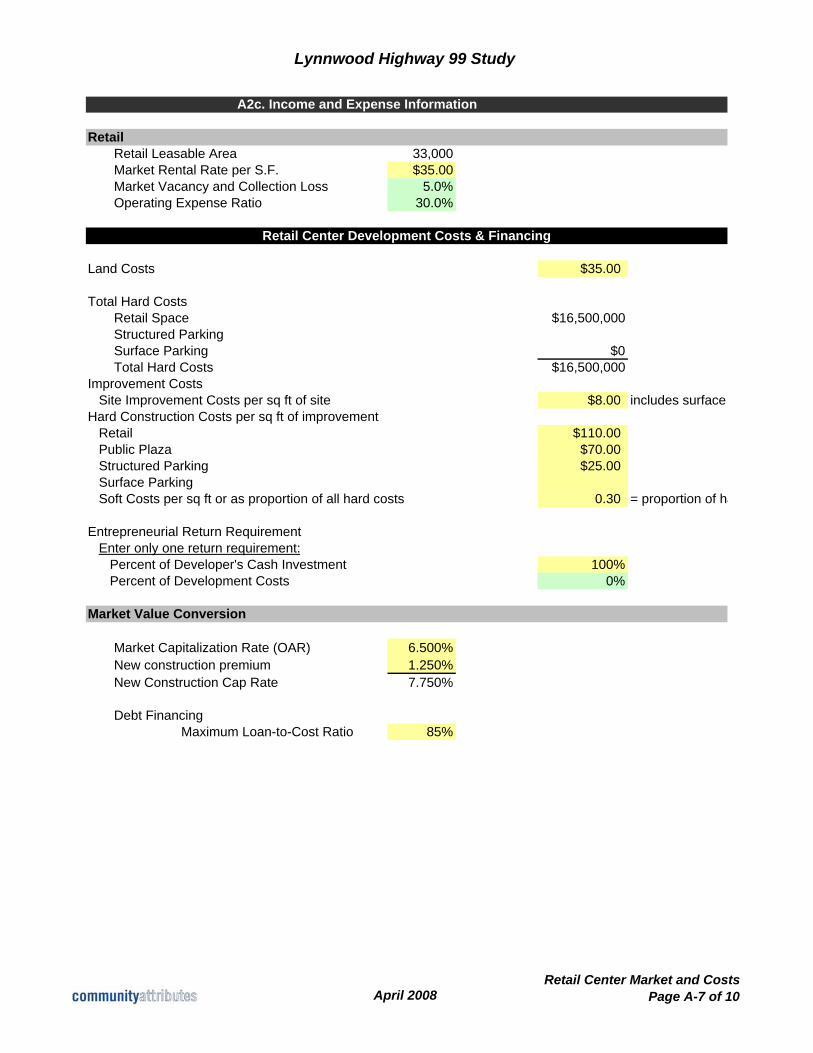
Community Retail Center The Community Retail Center along modeled for the Lynnwood Highway 99 corridor includes single-story retail, an upscale grocer (generously sized for some at 50,000 s.f., such as Trader Joe’s or PCC; modestly sized for others, such as Metropolitan Market or Central Market) and surface parking designed for access and retail visibility. Exhibit A-2a shows how development costs (Exhibit A-2b) and market data (Exhibit A-2c) come together for feasibility analysis. The analysis suggests that such a development would require rents above those found today along Highway 99 for retail, which could be supported with a strong design, connectivity and gathering place.
Exhibit 16 below presents a summary of market conditions and City actions related to successful development of this product.
Exhibit 16 Market Conditions Targeted for Development Success
of Commercial Retail Center
Current Market Target Values Actions Considered
Retail rents $25 per s.f. $35. per s.f. Retail success in mixed-use depends on drawing customers from beyond adjacent retail; requires access and visibility to all customers.
Public Plaza n/a City could provide public plaza and transit connections through interior of commercial center
Parking Surface parking required.
Lynnwood Highway 99 Corridor April 2008 Page 43 Existing Conditions and Market Assessment
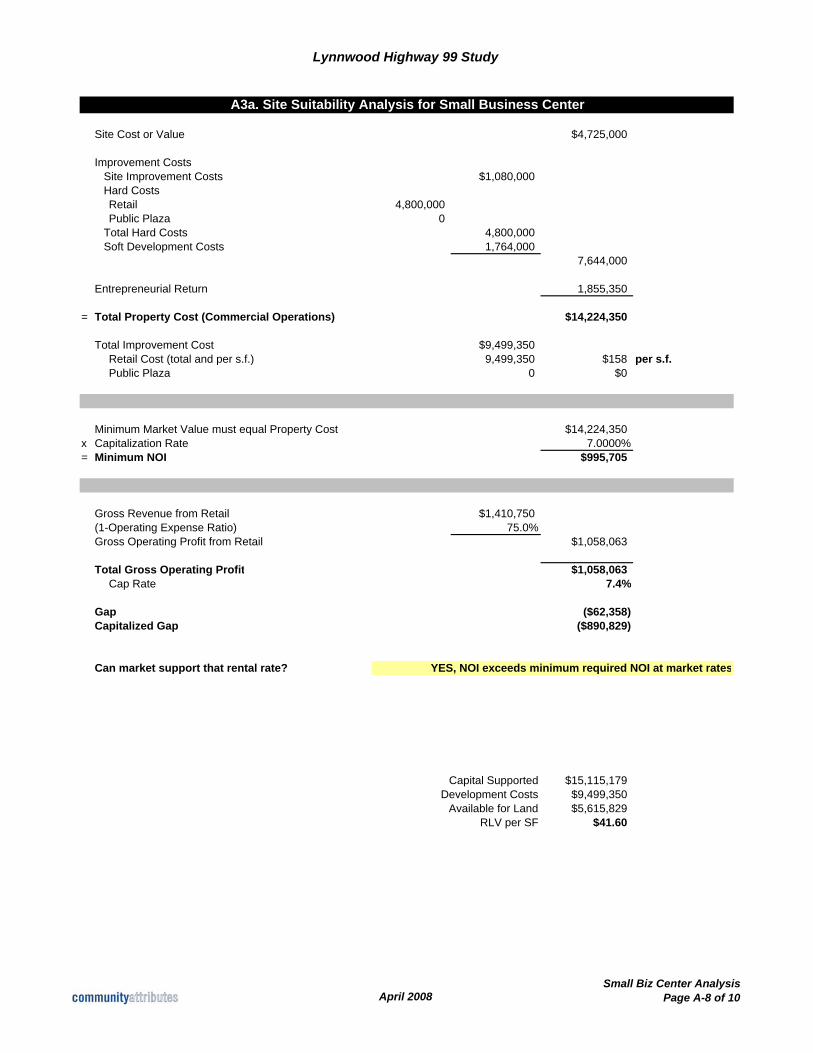
Small-Business Center The Small-Business Center modeled for the Lynnwood Highway 99 corridor includes inexpensively built, flex-tech space, suitable for a broad range of small and start-up businesses. Exhibit A-3a shows how development costs (Exhibit A-3b) and market data (Exhibit A-3c) come together for feasibility analysis. The analysis suggests that such a development is close to being currently feasible, based on commercial rents found throughout Lynnwood at present.
Exhibit 17 below presents a summary of market conditions and City actions related to successful development of this product.
Exhibit 17 Market Conditions Targeted for Development Success
of Small Business Center
Current Market Target Values Actions Considered
Commercial rents
$25 per s.f. $27 to $28 per s.f.
Success depends on low-maintenance, flexible space to accommodate the changing needs associated with serving small businesses.
Parking Surface parking required.
Lynnwood Highway 99 Corridor April 2008 Page 44 Existing Conditions and Market Assessment
ATTACHMENT A
Lynnwood Highway 99 Study
Site Cost or Value $6,300,000
Improvement CostsSite Improvement Costs $1,080,000Hard CostsResidential 22,000,000Retail 3,630,000Public Plaza 1,120,000Structured Parking 3,300,000
Total Hard Costs 30,050,000Soft Development Costs 9,339,000
40,469,000
Entrepreneurial Return 7,015,350
= Total Property Cost (Commercial Operations) $53,784,350
Improvement & Land CostsTotal Improvement Costs $47,484,350
Residential Cost (total and per s.f.) 34,763,917 $158 per s.f.Residential Cost per Unit $173,820 per unitRetail Cost (total and per s.f.) 5,736,046 $174 per s.f.Public Plaza 1,769,799 $111 per s.f.Structured Parking Cost (total and per s.f.) 5,214,588 $40 per s.f.Structured Parking Cost per space $15,644 per space
For RetailMinimum Market Value must equal Property Cost (w/ all costs allocated) $8,623,220
x Capitalization Rate 7.000%= Minimum NOI $603,625
Gross Residential Sales Revenue 55,440,000 Less: Fees, Promotion, Conveyance 2.65% (1,469,160) Net Residential Revenue 53,970,840 Residential Total Costs $45,161,130Entrepreneurial Return Requirement 5,890,582Net Operating Profit 2,919,127 NOI/Unit 14,596 Gross Operating Profit from Residential
Gross Revenue from Retail $825,000(1-Operating Expense Ratio) 70.0%Gross Operating Profit from Retail $577,500
Total Gross Operating Profit (Retail) 577,500 Cap Rate 1.074%
Gap $26,125Capitalized Gap $373,220
Can market support that rental rate? NO, NOI does not exceed required NOI at market rates
A1a. Site Suitability Analysis for Mixed-Use Development: Condos
April 2008Mixed-Use Condo Analysis
Page A-1 of 10
Lynnwood Highway 99 Study
Site Cost or Value $6,300,000
Improvement CostsSite Improvement Costs $1,080,000Hard CostsResidential 22,000,000Retail 3,630,000Public Plaza 1,120,000Structured Parking 3,300,000
Total Hard Costs 30,050,000Soft Development Costs 9,339,000
40,469,000
Entrepreneurial Return 7,015,350
= Total Property Cost (Commercial Operations) $53,784,350
Improvement & LandTotal Improvement Cost $47,484,350
Residential Cost (total and per s.f.) 34,763,917 $158 per s.f.Residential Cost per Unit $173,820 per unitRetail Cost (total and per s.f.) 5,736,046 $174 per s.f.Public Plaza 1,769,799 $111 per s.f.Structured Parking Cost (total and per s.f.) 5,214,588 $40 per s.f.Structured Parking Cost per space $15,644 per space
Minimum Market Value must equal Property Cost $53,784,350x Capitalization Rate 7.000%= Minimum NOI $3,764,905
Gross Revenue from Residential $4,267,200Parking Revenue $306,000(1-Operating Expense Ratio) 65.0%Gross Operating Profit from Residential $2,972,580
Gross Revenue from Retail $825,000(1-Operating Expense Ratio) 70.0%Gross Operating Profit from Retail $577,500
Total Gross Operating Profit $3,550,080Cap Rate 6.6%
Gap $214,825Capitalized Gap $3,068,921
Can market support that rental rate? NO, NOI does not exceed required NOI at market rates
A1b: Site Suitability Analysis for Mixed-Use Development: Rental Units
April 2008Mixed-Use Rental Analysis
Page A-2 of 10
Lynnwood Highway 99 Study
Site size in acres or s.f. Owner King Co. AssessorsTotal project area 180,000Public Right-of-Way ExclusionNet area for development 180,000 square feetMarket land values $35.00 per square footSite value $6,300,000
Site ConditionsBuilding footrprint 55,000 Surface parkingParking structure footprint 55,000 Setbacks and r-o-w 30% 54,000 Public space 16,000 Total development footprint 180,000FAR 1.4
ResidentialStories 4Per Story (sf) 55,000Total Gross 220,000Efficiency 80%Total Net 176,000Unit Size 880Units 200
RetailPercent of Ground Floor 60%Total Gross Area 33,000Efficiency 100%Total Net 33,000
Public Plaza 16,000
ParkingRequiredSpaces per Unit 1.5Spaces 300Retail Services sf per Space 250Retail Services Spaces 132Total Spaces Required 432
ProvidedStructured Parking
Stories 2Per Story (sf) 55,000Total Structure (sf) 110,000Space Size 330Spaces 333
First Floor ParkingTotal Space (sf) 22,000Space Size (sf) 330Spaces 67
Total Spaces 400
Total Gross Area, Excl. Parking 253,000Total Gross Area, Including Structured Parking 363,000
A1c. Mixed-Use Development Specifications
April 2008Mixed-Use Site Info
Page A-3 of 10
Lynnwood Highway 99 Study
ResidentialLeasable Area 176,000Market Rental Rate per S.F. Monthly $2.00
Annual $24.00Monthly Rental Rate per Unit $1,760Market Vacancy and Collection Loss 7.5%Operating Expense Ratio 35.0%Dupre + Scott Apartment Investment ReportParking Rev, per mo., per space $100Occupancy 85%
Sales Price per S.F. $315.00Unit Price $277,200
Retail and LibraryRetail Leasable Area 33,000Market Rental Rate per S.F. $25.00Market Vacancy and Collection Loss 5.0%Operating Expense Ratio 30.0%
Land Costs $35.00
Total Hard CostsResidential Building $22,000,000Retail Space $3,630,000Structured Parking $3,300,000Surface Parking $0Total Hard Costs $28,930,000
Improvement CostsSite Improvement Costs per sq ft of site $6.00 w/ surf. parking
Hard Construction Costs per sq ft of improvement Residential $100.00Retail $110.00Public Plaza $70.00Structured Parking $25.00Surface Parking Soft Costs per sq ft or as proportion of all hard costs 0.30 =% of hard costs
Entrepreneurial Return RequirementEnter only one return requirement:
Percent of Developer's Cash Investment 100%Percent of Development Costs 0%
Market Capitalization Rate (OAR) 5.500%New construction premium 1.500%New Construction Cap Rate 7.000%
Debt FinancingMaximum Loan-to-Cost Ratio 85%
Mixed-Use Development Costs & Financing
Market Value Conversion
A1d. Income and Expense Information
April 2008Mixed-Use Market and Costs Data
Page A-4 of 10
Lynnwood Highway 99 Study
Site Cost or Value $13,025,833
Improvement CostsSite Improvement Costs $2,977,333Hard CostsRetail 16,500,000Public Plaza 525,000
Total Hard Costs 17,025,000Soft Development Costs 6,000,700
26,003,033
Entrepreneurial Return 5,854,330
= Total Property Cost (Commercial Operations) $44,883,197
Land & ImprovementsTotal Improvement Cost $31,857,363
Retail Cost (total and per s.f.) 30,874,978 $206 per s.f.Public Plaza 982,386 $131 per s.f.
Minimum Market Value must equal Property Cost $44,883,197x Capitalization Rate 7.750%= Minimum NOI $3,478,448
Gross Revenue from Retail $4,488,750(1-Operating Expense Ratio) 70.0%Gross Operating Profit from Retail $3,142,125
Total Gross Operating Profit $3,142,125Cap Rate 7.0%
Gap $336,323Capitalized Gap $4,339,648
Can market support that rental rate? NO, NOI does not exceed required NOI at market rates
Capital Supported $40,543,548Development Costs $31,857,363
Available for Land $8,686,185RLV per SF $23.34
A2a. Site Suitability Analysis for Retail Center
April 2008Retail Center Analysis
Page A-5 of 10
Lynnwood Highway 99 Study
Site size in acres or s.f. Owner King Co. AssessorsTotal project area 372,167Public Right-of-Way ExclusionNet area for development 372,167 square feetMarket land values $35.00 per square footSite value $13,025,833
Site ConditionsBuilding footrprint 150,000 Surface parking 178,200 Parking structure footprintSetbacks and r-o-w 10% 36,467 Public space 7,500 Total development footprint 372,167FAR 0.403
RetailGrocer gross area 50,000 Additional Retail Gross Area 100,000 Total Gross Area 150,000Efficiency 90%Total Net 135,000
Public Plaza 7,500
ParkingRequiredRetail Services sf per Space 250Retail Services Spaces 540Total Spaces Required 540
ProvidedSurface parking
Total SF 178,200Space Size 330Spaces 540
Total Spaces 540
Total Gross Area, Excl. Parking 150,000Total Gross Area, Including Structured Parking
Total DevelopmentResidential Gross Area (excl parking)Retail and Library Gross Area 150,000Structured Parking GrossSurface Parking 178,200
A2b. Retail Center Development Specifications
April 2008Retail Center Site Info
Page A-6 of 10
Lynnwood Highway 99 Study
RetailRetail Leasable Area 33,000Market Rental Rate per S.F. $35.00Market Vacancy and Collection Loss 5.0%Operating Expense Ratio 30.0%
Land Costs $35.00
Total Hard CostsRetail Space $16,500,000Structured ParkingSurface Parking $0Total Hard Costs $16,500,000
Improvement CostsSite Improvement Costs per sq ft of site $8.00 includes surface
Hard Construction Costs per sq ft of improvement Retail $110.00Public Plaza $70.00Structured Parking $25.00Surface Parking Soft Costs per sq ft or as proportion of all hard costs 0.30 = proportion of ha
Entrepreneurial Return RequirementEnter only one return requirement:
Percent of Developer's Cash Investment 100%Percent of Development Costs 0%
Market Capitalization Rate (OAR) 6.500%New construction premium 1.250%New Construction Cap Rate 7.750%
Debt FinancingMaximum Loan-to-Cost Ratio 85%
Retail Center Development Costs & Financing
Market Value Conversion
A2c. Income and Expense Information
April 2008Retail Center Market and Costs
Page A-7 of 10
Lynnwood Highway 99 Study
Site Cost or Value $4,725,000
Improvement CostsSite Improvement Costs $1,080,000Hard CostsRetail 4,800,000Public Plaza 0
Total Hard Costs 4,800,000Soft Development Costs 1,764,000
7,644,000
Entrepreneurial Return 1,855,350
= Total Property Cost (Commercial Operations) $14,224,350
Total Improvement Cost $9,499,350Retail Cost (total and per s.f.) 9,499,350 $158 per s.f.Public Plaza 0 $0
Minimum Market Value must equal Property Cost $14,224,350x Capitalization Rate 7.0000%= Minimum NOI $995,705
Gross Revenue from Retail $1,410,750(1-Operating Expense Ratio) 75.0%Gross Operating Profit from Retail $1,058,063
Total Gross Operating Profit $1,058,063Cap Rate 7.4%
Gap ($62,358)Capitalized Gap ($890,829)
Can market support that rental rate? YES, NOI exceeds minimum required NOI at market rates
Capital Supported $15,115,179Development Costs $9,499,350
Available for Land $5,615,829RLV per SF $41.60
A3a. Site Suitability Analysis for Small Business Center
April 2008Small Biz Center Analysis
Page A-8 of 10
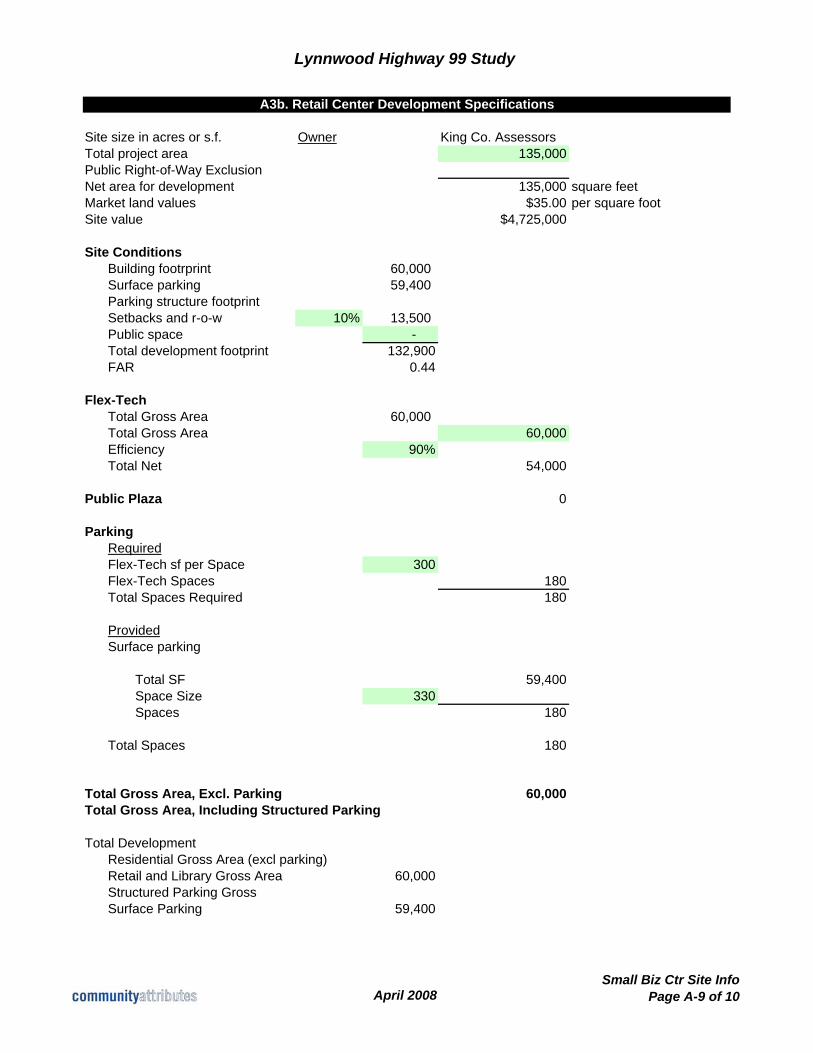
Lynnwood Highway 99 Study
Site size in acres or s.f. Owner King Co. AssessorsTotal project area 135,000Public Right-of-Way ExclusionNet area for development 135,000 square feetMarket land values $35.00 per square footSite value $4,725,000
Site ConditionsBuilding footrprint 60,000 Surface parking 59,400 Parking structure footprintSetbacks and r-o-w 10% 13,500 Public space - Total development footprint 132,900FAR 0.44
Flex-TechTotal Gross Area 60,000 Total Gross Area 60,000Efficiency 90%Total Net 54,000
Public Plaza 0
ParkingRequiredFlex-Tech sf per Space 300Flex-Tech Spaces 180Total Spaces Required 180
ProvidedSurface parking
Total SF 59,400Space Size 330Spaces 180
Total Spaces 180
Total Gross Area, Excl. Parking 60,000Total Gross Area, Including Structured Parking
Total DevelopmentResidential Gross Area (excl parking)Retail and Library Gross Area 60,000Structured Parking GrossSurface Parking 59,400
A3b. Retail Center Development Specifications
April 2008Small Biz Ctr Site Info
Page A-9 of 10

Lynnwood Highway 99 Study
Small Business CenterRetail Leasable Area 54,000Market Rental Rate per S.F. $27.50Market Vacancy and Collection Loss 5.0%Operating Expense Ratio 25.0%
Land Costs $35.00
Total Hard CostsFlex Space $12,000,000Structured ParkingSurface Parking $0Total Hard Costs $12,000,000
Improvement CostsSite Improvement Costs per sq ft of site $8.00 includes surface
Hard Construction Costs per sq ft of improvement Flex Space $80.00Public Plaza $70.00Structured Parking $25.00Surface Parking Soft Costs per sq ft or as proportion of all hard costs 0.30 = proportion of ha
Entrepreneurial Return RequirementEnter only one return requirement:
Percent of Developer's Cash Investment 100%Percent of Development Costs 0%
Market Capitalization Rate (OAR) 5.500%New construction premium 1.500%New Construction Cap Rate 7.000%
Debt FinancingMaximum Loan-to-Cost Ratio 85%
Small Business Center Development Costs & Financing
Market Value Conversion
A3c. Income and Expense Information
April 2008Small Biz Ctr Market Devt Costs
Page A-10 of 10