HIGHER EDUCATION RESEARCH IN FACTS AND FIGURES · Research at UK universities underpins innovation,...
36
HIGHER EDUCATION RESEARCH IN FACTS AND FIGURES
Transcript of HIGHER EDUCATION RESEARCH IN FACTS AND FIGURES · Research at UK universities underpins innovation,...

HIGHER EDUCATION RESEARCH IN
FACTS AND FIGURES

INTRODUCTION
Research at UK universities underpins innovation, which in turn contributes to economic growth. Higher education research in facts and figures provides an overview of the quality of research, impact, collaboration, students, staff and finance at UK universities.
All data relates to UK higher education institutions unless stated otherwise. All percentages have been calculated using raw figures and rounded, and therefore may not sum precisely. Further information on the sources used in this publication can be found on our website:
www.universitiesuk.ac.uk/research-facts-and-figures

3
High
lights
HIGHLIGHTS
76% of research at higher education institutions was considered as
‘world-leading’ or ‘internationally excellent’ for its overall quality in 2014.
UK government spending on research and development is below the OECD average
as a proportion of GDP.
Research performed by UK universities in 2014−15 equates to an increase of £28.9 billion in gross value added.
UK higher education institutions received £4.2 billion from
knowledge exchange activities in 2015−16.
43% of postgraduate research students and 29% of academic staff
were from overseas.
More than half of UK research is produced through international collaborations.
‘The UK continues to punch above its weight as a research nation.’ BEIS, 2017
4
Con
ten
ts
CONTENTS
QUALITY AND IMPACTUK research quality is world-leading 7
UK research quality is improving 8
UK research impact is diverse 9
UK research is frequently cited 10
UK research is punching above its weight
11
UK research has high integrity 12
COLLABORATIONUK research is increasingly collaborative
14
UK research is involved in major global partnerships
15
UK research is international in scope 16
UK research interacts with many parts of the UK economy
17
UK research is accessible 18
STUDENTS AND STAFFUK university research student numbers have increased
20
UK university research students are diverse
21
UK universities are highly popular destinations
22
UK universities are increasingly reliant on international academic staff
23
UK researcher numbers are comparatively low globally
24

5
Con
tents
FINANCESMore than £1 billion of research income is from overseas
26
Knowledge exchange activities generate significant income
27
Gross domestic expenditure on research and development
28
Government-financed gross domestic expenditure on research and development
29
Full economic costing of research 30
UK research contributes to economic growth
31
ANNEXE Glossary 32
Sources 34

QUALITY AND IMPACT
The Research Excellence Framework (REF) is a peer assessment of research across all disciplines at UK universities. The last assessment took place in 2014. University submissions are converted to quality profiles, which rate the research activity out of four stars. Research rated 4* is world-leading in terms of originality, significance and rigour.
The overall quality profile awarded to each submission is based on the quality of research outputs, the impact of research beyond academia, and the research environment.
More details about the REF, its assessment process and criteria can be found on the REF website:
www.ref.ac.uk/2014
Qu
ality
an
d im
pa
ct
7
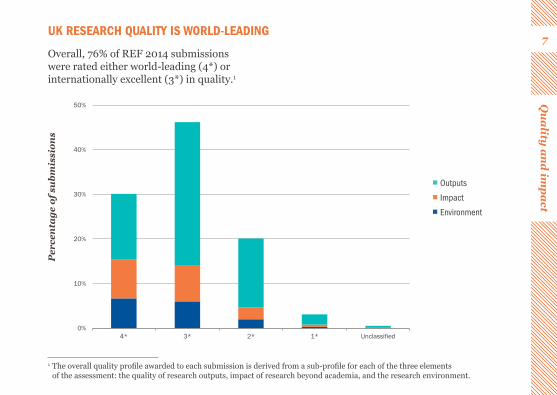
1 The overall quality profile awarded to each submission is derived from a sub-profile for each of the three elements of the assessment: the quality of research outputs, impact of research beyond academia, and the research environment.
UK RESEARCH QUALITY IS WORLD-LEADING
Overall, 76% of REF 2014 submissions were rated either world-leading (4*) or internationally excellent (3*) in quality.1
0%
10%
20%
30%
40%
50%
4* 3* 2* 1* Unclassified
Per
cen
tage
of s
ubm
issi
ons
■ Outputs
■ Impact
■ Environment

Qu
ali
ty a
nd
imp
act
8UK RESEARCH QUALITY IS IMPROVING
Compared to the 2008 Research Assessment Exercise (RAE), 4* research outputs increased by 42%, and 3* outputs increased by 24%. There was also an increase in the number of highly cited UK outputs.
0
20,000
40,000
60,000
80,000
100,000
120,000
140,000
160,000
180,000
RAE 2008 REF 2014
Ou
tpu
ts p
rod
uce
d b
y t
he
UK
▬ 4* outputs
▬ 3* outputs
▬ Top 1% of cited papers
▬ Top 5% of cited papers
▬ Top 10% of cited papers
0
20,000
40,000
60,000
80,000
100,000
120,000
140,000
160,000
180,000
RAE 2008 REF 2014

Qu
ality
an
d im
pa
ct
9UK RESEARCH IMPACT IS DIVERSE
Case studies from the REF revealed that UK university research impacts a broad range of areas.2
■ Technological, 21%
■ Cultural, 17%
■ Health, 13%
■ Societal, 26%
Summary impact type
■ Political, 8%
■ Economic, 6%■ Legal, 3%
■ Environmental, 7%
2 Case studies are assigned to a single ‘summary impact type’ by text analysis of the ‘summary of the impact’ (section 1 of the impact case study template). This is an indicative guide to aid text searching and is not a definitive assignment of the impact described.

Qu
ali
ty a
nd
imp
act
10
3 A commonly used measure of research impact, FWCI compares the number of citations received by a researcher’s publications, with the average number of citations received by similar publications indexed in the Scopus database. A FWCI of 1.00 indicates that publications have been cited at a world average, whereas a FWCI greater than 1.00 indicates that the publications have been cited more than would be expected based on the world average for similar publications.
UK RESEARCH IS FREQUENTLY CITED
In 2014, the UK’s field-weighted citation impact (FWCI)3 was 1.57. This ranked first out of all G8 countries, eighth in the EU, and thirteenth in the world.
1.57
1.26 1.25
1.091.00
0.00
0.20
0.40
0.60
0.80
1.00
1.20
1.40
1.60
UK G8 EU OECD World
Fie
ld-w
eigh
ted
cit
ati
on im
pa
ct

Qu
ality
an
d im
pa
ct
11UK RESEARCH IS PUNCHING ABOVE ITS WEIGHT
Despite representing a small global share of research investment and only 4.1% of researchers, UK research accounted for 9.9% of global downloads, 10.7% of citations and 15.2% of the world’s most highly cited articles.
Relative share per million USD expenditure
0
1
2
3
4GERD
Articles
Citations
Highly-cited articles
Downloads
Digital reads
Patents
Patent citations
0
1
2
3
4
5
6Researchers
Articles
Citations
Highly-cited articles
Downloads
Digital reads
Patents
Patent citations
Relative share per researcher
UK China Germany Japan USA
Note: a value of 1.0 implies that, per researcher or per million USD expenditure, the indicator is equal to the world average.
Qu
ali
ty a
nd
imp
act
12
4 Universities UK (2012), The concordat to support research integrity5 Universities UK (2016), Concordat to support research integrity making progress
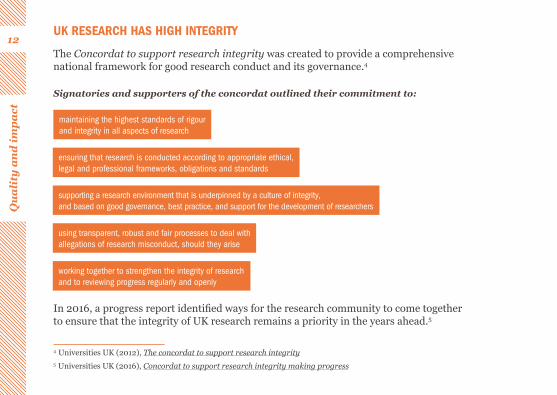
UK RESEARCH HAS HIGH INTEGRITY
The Concordat to support research integrity was created to provide a comprehensive national framework for good research conduct and its governance.4
Signatories and supporters of the concordat outlined their commitment to:
In 2016, a progress report identified ways for the research community to come together to ensure that the integrity of UK research remains a priority in the years ahead.5
maintaining the highest standards of rigour and integrity in all aspects of research
using transparent, robust and fair processes to deal with allegations of research misconduct, should they arise
ensuring that research is conducted according to appropriate ethical, legal and professional frameworks, obligations and standards
working together to strengthen the integrity of research and to reviewing progress regularly and openly
supporting a research environment that is underpinned by a culture of integrity, and based on good governance, best practice, and support for the development of researchers

6 Universities UK (2017), Downturn in UK participation in latest EU research programme statistics7 BEIS (2017), International comparative performance of the UK research base 2016
COLLABORATION
In 1981, about 90% of UK research output was conducted domestically. Now, over half is conducted in collaboration with institutions from overseas, meaning that almost all the growth in output has been produced through international partnerships.
UK research groups and universities lead more European Horizon 2020 collaborations than any other nation. It is concerning however that the overall number of UK participations in Horizon 2020 is declining.6
A recent Elsevier report, commissioned by the Department for Business, Energy and Industrial Strategy (BEIS) suggested that the UK’s ‘sustained upward trend’ in research productivity is likely due to its increasing international collaboration.7

Col
labo
rati
on
14UK RESEARCH IS INCREASINGLY COLLABORATIVE
UK research collaborations, both domestic and international, are far more frequent than they were 15 years ago.
0
10,000
20,000
30,000
40,000
50,000
60,000
70,000
2002 2003 2004 2005 2006 2007 2008 2009 2010 2011 2012
Col
labo
rati
ons
Collaborations – cross UK border
Collaborations – UK-internationalCollaborations – inside UK
Collaborations – single institution
Publications – single author
Note: these data sets are not mutually exclusive, and collaborations may occur across more than one category.
Colla
boration
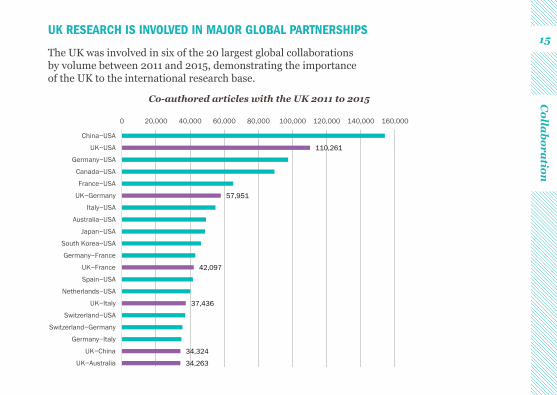
15UK RESEARCH IS INVOLVED IN MAJOR GLOBAL PARTNERSHIPS
The UK was involved in six of the 20 largest global collaborations by volume between 2011 and 2015, demonstrating the importance of the UK to the international research base.
110,261
57,951
42,097
37,436
34,324
34,263
0 20,000 40,000 60,000 80,000 100,000 120,000 140,000 160,000
China−USA
UK−USA
Germany−USA
Canada−USA
France−USA
UK−Germany
Italy−USA
Australia−USA
Japan−USA
South Korea−USA
Germany−France
UK−France
Spain−USA
Netherlands−USA
UK−Italy
Switzerland−USA
Switzerland−Germany
Germany−Italy
UK−China
UK−Australia
Co-authored articles with the UK 2011 to 2015

Col
labo
rati
on
16UK RESEARCH IS INTERNATIONAL IN SCOPE
Six of the UK’s top 20 international collaboration partners are from Europe.
0 20,000 40,000 60,000 80,000 100,000 120,000 140,000 160,000
USA
Germany
France
Italy
Australia
China
Netherlands
Spain
Canada
Switzerland
Co-authored articles 2011 to 2016

Colla
boration
17
8 For more information, visit the HEFCE website.
UK RESEARCH INTERACTS WITH MANY PARTS OF THE UK ECONOMY
Research-based interactions cover a range of activities, from fundamental collaborative research, to interactions closer to the market with a range of partners. 2015−16 saw the creation of 150 new spin-off companies with some university ownership, up from 133 in 2014−15, and the creation of 60 staff start-ups.8
£-
£200,000
£400,000
£600,000
£800,000
£1,000,000
£1,200,000
£1,400,000
Collaborative research involvingpublic funding
Contract research Consultancy
Inco
me
■ 2014−15
■ 2015−16
The total reported income for collaborative research rose from £1.257 billion
to £1.292 billion in 2015−16,
an increase of 3%.
Income from consultancy increased by 3% to £455 million in 2015−16.
Total income from contract research rose by 3%
to £1.245 billion in 2015−16.

Col
labo
rati
on
18UK RESEARCH IS ACCESSIBLE
In 2016, 37% of UK research outputs were freely available to the world immediately at publication, up from 20% in 2014.9
% o
pen
acc
ess
■ Open access immediately (2016) ■ Open access after one year (2016)
0%
10%
20%
30%
40%
50%
60%
UK USA China Global
9 Universities UK (2017), Monitoring the transition to open access

10 British Council (2015), UK universities top destination for Nobel winners11 Universities UK (2017), International technicians vital for UK science and innovation
STUDENTS AND STAFF
In 2015, analysis by the British Council revealed that 38% of past Nobel Laureate winners who studied abroad, did so in the UK – more than any other country.10 Clearly, UK universities attract top-class researchers from around the world.
There have been concerns about the future of the higher education research workforce, particularly in relation to the number of EU staff, and the lack of effective succession planning for research technicians.11

Stu
den
ts a
nd
sta
ff
20UK UNIVERSITY RESEARCH STUDENT NUMBERS HAVE INCREASED
Since 2007−08, all home nations have seen increases in the number of postgraduate research students.
40,000
50,000
60,000
70,000
80,000
90,000
100,000
1,000
3,000
5,000
7,000
9,000
11,000
13,000
15,000
17,000
19,000
2007−08 2008−09 2009−10 2010−11 2011−12 2012−13 2013−14 2014−15 2015−16
En
glan
dN
orth
ern
Ire
lan
d, S
cotl
an
d a
nd
Wa
les
Academic Year
England ScotlandNorthern Ireland Wales

Stu
den
ts an
d sta
ff
21UK UNIVERSITY RESEARCH STUDENTS ARE DIVERSE
In 2015−16, the number of international students on postgraduate research courses were highest for engineering and technology, business and administrative studies, and computer science.
0 3,000 6,000 9,000 12,000 15,000
Biological sciences
Engineering and technology
Physical sciences
Social studies
Medicine and dentistry
Subjects allied to medicine
Historical and philosophical studies
Business and administrative studies
Education
Languages
Computer science
Creative arts and design
Mathematical sciences
Law
Architecture, building and planning
Mass communications and documentation
Agriculture and related subjects
Veterinary science
Combined
Number of postgraduate research students
■ United Kingdom
■ Other European Union
■ Non-European Union

Stu
den
ts a
nd
sta
ff
22
■ Austria, 3%
* Year of reference: 2013 † Data refers to foreign instead of international students.
UK UNIVERSITIES ARE HIGHLY POPULAR DESTINATIONS
In 2014, the UK was the second most popular OECD country for international students studying for masters or doctoral degrees (15%), behind the United States (26%).
Distribution of masters and doctoral students in OECD countries, 2014
■ Others, 12%
■ United Kingdom, 15%
■ Belgium, 2%
■ Australia, 8%
■ Canada, 3%†
■ France, 11%
■ Netherlands, 2%
■ Switzerland, 2%
■ United States, 26%■ South Korea, 2%*
■ Germany, 10%
■ Japan, 3%
■ Italy, 3%*

Stu
den
ts an
d sta
ff
23UK UNIVERSITIES ARE INCREASINGLY RELIANT ON INTERNATIONAL ACADEMIC STAFF
The proportion of non-UK academic staff in research-only roles at UK higher education institutions has increased considerably, from 34% in 2004−05 to 47% in 2015−16.
Employment function2004−05 2015−16
UK EU Non-EU UK EU Non-EU
Research only 22,610 5,485 6,415 25,445 12,575 9,575
Teaching only 27,395 2,450 2,080 40,205 6,550 4,490
Teaching and research 68,145 5,815 6,150 72,915 14,520 10,400
Neither teaching nor research 1,590 150 280 1,345 95 70
Total 119,740 13,895 14,930 139,910 33,735 24,535

Stu
den
ts a
nd
sta
ff
24UK RESEARCHER NUMBERS ARE COMPARATIVELY LOW GLOBALLY
In 2015, despite the high level of research outputs, the UK was outside the top 10 countries in terms of researchers in research and development per million people.
4,471
0 1,000 2,000 3,000 4,000 5,000 6,000 7,000 8,000
Denmark
South Korea
Sweden
Finland
Norway
Iceland
Japan
Luxembourg
Austria
Belgium
Ireland
Netherlands
United Kingdom
Germany
Portugal
Slovenia
Czech Republic
Hong Kong
Greece
Estonia
Researchers in research and development per million people, 2015

12 ONS (2017), UK gross domestic expenditure on research and development: 2015
FINANCES
In 2015−16, UK universities received £7.8 billion in research income, of which 36% was from non-UK government sources and 16% from other overseas sources. EU sources accounted for a fifth of the total increase in research income between 2006−07 and 2015−16.
In 2015, total research and development expenditure in the UK was 1.68% of GDP, below the EU estimate of 2.03% of GDP and the 11th highest of member countries.12

Fin
an
ces
26MORE THAN £1 BILLION OF RESEARCH INCOME IS FROM OVERSEAS
In 2015−16, UK universities received £7.8 billion in research income. £840 million came from EU sources and £440 million from non-EU sources. The UK’s exit from the EU presents particular challenges in relation to continued access to research funding from EU sources.
■ Other sources, 1%
■ EU sources, 11%
■ UK business, 4%
■ UK charities, 15%
■ Non-EU sources, 6%
■ UK government, 64%
Total research income
£7.8 billion2015–16

Fin
an
ces
27KNOWLEDGE EXCHANGE ACTIVITIES GENERATE SIGNIFICANT INCOME
An increasingly important income stream for universities is the funding that they generate from knowledge-exchange activities through the provision of continuing professional development, consultancy services, facilities and equipment-related services, and income from intellectual property. University income from these activities amounted to £4.2 billion in 2015−16.
Total income from knowledge
exchange activities £4.2 billion
2015–16
■ Other, 35%
■ SMEs, 6%
■ Public and third-sector organisations, 33%
■ Large businesses, 20%
■ Individuals, 6%

Fin
an
ces
28GROSS DOMESTIC EXPENDITURE ON RESEARCH AND DEVELOPMENT
The UK invests significantly less in research and development than many other countries. In 2015, UK research and development expenditure was 1.7% of GDP, below the OECD figure of 2.4%. In November 2017, the UK government announced it will work with industry to increase spending to 2.4% of GDP by 2027.13
13 UK government (2017), Record boost to R&D and new transport fund to help build economy fit for the future
2.4%
0.0%
0.5%
1.0%
1.5%
2.0%
2.5%
3.0%
3.5%
Japan Germany USA France Canada UK Italy Russia
▬ OECD total
Gross domestic spending on research and development as % of GDP

Fin
an
ces
29GOVERNMENT-FINANCED GROSS DOMESTIC EXPENDITURE ON RESEARCH AND DEVELOPMENT
UK government spending on research and development is consistently below the OECD figure as a proportion of GDP.
0.0%
0.1%
0.2%
0.3%
0.4%
0.5%
0.6%
0.7%
0.8%
0.9%
1.0%
2010 2011 2012 2012 2014 2015
▬ Canada
▬ France
▬ Germany
▬ Italy
▬ Japan
▬ UK
▬ USA
▬ EU (28 countries)
▬ OECD – total
▬ China
Gov
ern
men
t-fi
na
nce
d G
ER
D a
s %
of G
DP

Fin
an
ces
30FULL ECONOMIC COSTING OF RESEARCH
Evidence at a national level* suggests that the income universities receive to carry out research does not fully cover the costs of research. In 2015-16 UK universities received just 74.6% of the funding needed to cover the full economic costs of research.14
0% 20% 40% 60% 80% 100%
Institution-own funded
Postgraduate research
Research Councils
Other government departments excluding RDEC
EU
UK charities
Industry
Total research excluding RDEC
*4 Based on TRAC returns. Note: research and development expenditure credit (RDEC) gives Corporation Tax relief to companies that do research and development.
14 HEFCE (2017), TRAC data 2015–16: sector analysis
Income as a percentage of full economic cost

Fin
an
ces
31
15 Universities UK (2017), The economic impact of universities in 2014−15
UK RESEARCH CONTRIBUTES TO ECONOMIC GROWTH
Recent research estimates that research and development performed by UK universities in 2014−15 will deliver a stream of benefits into the future.14 If these are discounted into a net present value in 2014−15, they equate to a £28.9 billion increase in gross value added. This is equivalent to £1,071 per household in the UK.15
Research performed by UK universities in 2014−15
equates to a
£28.9 billion increase
in gross value added.

32
Glo
ssa
ry
GLOSSARY
Citation (Elsevier definition) Formal references to earlier work made in an article or patent.
Collaborative research Academic research with public sponsorship and at least one other external partner.
Consultancy Advice and work crucially dependent on a high degree of intellectual input from the university to the client, but without the creation of new knowledge.
Contract research May be fundamental or applied, but meets the specific research needs of external partners.
Doctoral/doctorate The highest level of study/degree offered by a university.
Domicile A student’s permanent country of residence.
Downloads (Elsevier definition) Where a user views the full-text HTML or downloads the full-text PDF of an article from ScienceDirect – Elsevier’s full-text journal article platform.
Digital readership (Elsevier definition) The number of Mendeley users who have added a particular article to their personal library.
Elsevier An information and analytics company, and provider of scientific and medical information.
Full economic costing (fEC) The UK government requires universities to estimate the full cost of their research projects. This includes costs related to academic staff; training of postgraduate research students; fieldwork; laboratory and studio work; maintaining and replacing infrastructure; and investing in innovation.

33
Glossa
ry
Gross domestic product (GDP) The market value of all officially recognised final goods and services produced within a country in a given period of time.
Gross expenditure on research and development (GERD) Total intramural expenditure on research and development performed on the national territory during a given period.
Higher education institutions In 2015–16, there were 162 higher education institutions in the UK in receipt of public funding via one of the UK funding councils.
Higher Education Statistics Agency (HESA) HESA collects, processes, and publishes data about higher education in the UK.
High-skill employment (ONS definition) Occupations at this level are generally termed as ‘professional’ or ‘managerial’ positions, such as accountants; engineers; medical doctors; scientists; and teachers.
OECD The Organisation for Economic Co-operation and Development.
Research Assessment Exercise (RAE) 2008 The primary purpose of the RAE 2008 was to produce quality profiles for each submission of research activity made by institutions. The UK’s four funding bodies used the submissions to determine their grant for research to the institutions.
Research Excellence Framework (REF) The system for assessing the quality of research in UK higher education institutions. The last assessment took place in 2014, and the next assessment is scheduled for 2021.
Transparent approach to costing (TRAC) A government initiative to enable universities to manage on a more financially sustainable basis. The TRAC methodology is used to calculate full economic costs.

34
Sou
rces
SOURCES
BEIS (2017), International Comparative Performance of the UK Research Base 2016
British Council (2015), UK universities top destination for Nobel winners
HEFCE (2017), TRAC data 2015-16: sector analysis
HEFCE (2016), TRAC income and costs by activity 2014–15
HEPI (2017), How much is too much? Cross-subsidies from teaching to research inBritish universities
HESA (2017), Higher education – business and community interaction survey 2015−16
HESA Finance Plus [2015−16]*
HESA Staff Record [multiple years]*
HESA Student Record [2015−16]*
OECD (2016), Education at a glance 2016
ONS (2017), UK gross domestic expenditure on research and development: 2015
Research Excellence Framework (2014), REF 2014 results and submissions
UK Government (2017), Record boost to R&D and new transport fund to help build economy fit for the future
Universities UK (2017), Downturn in UK participation in latest EU research programme statistics
Universities UK (2017), International research collaboration after the UK leaves the European Union
Universities UK (2017), International technicians vital for UK science and innovation
* Copyright Higher Education Statistics Agency Limited. Neither the Higher Education Statistics Agency Limited nor HESA Services Limited can accept responsibility for any inferences or conclusions derived by third parties from data or other information obtained from Heidi Plus.

35
Sou
rces
Universities UK (2017), Monitoring the transition to open access
Universities UK (2017), The economic impact of universities in 2014−15
Universities UK (2016), Concordat to support research integrity making progress
Universities UK (2016), The implications of international research collaboration for UK universities
Universities UK International (2017), International higher education in facts and figures 2017

UNIVERSITIES UK
Universities UK is the representative organisation for the UK’s universities. Founded in 1918, our mission is to be the voice of universities in the UK, providing high-quality leadership and support to our members to promote a successful and diverse higher education sector. With 136 members and offices in London, Cardiff (Universities Wales) and Edinburgh (Universities Scotland), we promote the strength and success of UK universities nationally and internationally.
Woburn House, 20 Tavistock Square, London, WC1H 9HQ
Tel: +44 (0)20 7419 4111 Email: [email protected] Web: www.universitiesuk.ac.uk Twitter: @UniversitiesUK
ISBN 978-1-84036-391-3 February 2018