HIGHER EDUCATION MANAGEMENT - OECD
113
Volume 12, No. 1 EDUCATION AND SKILLS « Journal of the Programme on Institutional Management in Higher Education Higher Education Management Volume 12, No. 1 Higher Education Management
Transcript of HIGHER EDUCATION MANAGEMENT - OECD

ISBN 92-64-17542-389 2000 01 1 PFF 205
Volume 12, No. 1
EDUCATION AND SKILLS
«Journal of the Programme on Institutional Management in Higher Education
Higher EducationManagement
-:HSTCQE=V\ZYW[:
www.oecd.org
EDUCATION AND SKILLS
www.oecd.org
Volume 12, No. 1
Vo
lum
e 1
2, N
o. 1
Hig
he
r Ed
uc
atio
n M
an
ag
em
en
t
Journal of the Programme on InstitutionalManagement in Higher Education
Higher Education ManagementVolume 12, No. 1
CONTENTS
Beyond “Delayering”: Process, Structure and BoundariesChris Duke 7
Managing Regional Collaboration in Higher Education: the Case of the NorthAmerican Free Trade Agreement (NAFTA)
Manuel Crespo 23
Institutional Funding and Managerial Differences in Racially Dual Systems of Higher Education
G. Thomas Sav 41
UK Higher Education: Competitive Forces in the 21st CenturyG.C. Webber 55
Academic Responses to the UK Foresight ProgrammeMary Henkel 67
Economics Research in France: Tentative Conclusions Based on EconLit Database
Jean Mirucki 85
The Use of Indicators in the Strategic Management of UniversitiesRichard L. Morrill 105
Index to Volume 11 113
hi em ISSN 1013-851X2000 SUBSCRIPTION
(3 ISSUES)FF 510 £55 US$85
DM 160 ¥ 10 750

File: $1$DIA3:[PAGER.SAVE.PUB]COPYR–1623E.;8 REGNIER Seq: 1 Page: Free: 4140D Next: 0D VJ: J1:1 6-JAN-00 10:22
OECD, 2000.
Software: 1987-1996, Acrobat is a trademark of ADOBE.
All rights reserved. OECD grants you the right to use one copy of this Program for your personal use only.Unauthorised reproduction, lending, hiring, transmission or distribution of any data or software is prohibited.You must treat the Program and associated materials and any elements thereof like any other copyrightedmaterial.
All requests should be made to:
Head of Publications Service,OECD Publications Service,2, rue Andre-Pascal, 75775 ParisCedex 16, France.

JOURNAL OF THE PROGRAMME ON INSTITUTIONAL MANAGEMENT IN HIGHER EDUCATION
HigherEducation
ManagementVol. 12 - No. 1
ORGANISATION FOR ECONOMIC CO-OPERATION AND DEVELOPMENT

ORGANISATION FOR ECONOMIC CO-OPERATIONAND DEVELOPMENT
Pursuant to Article 1 of the Convention signed in Paris on 14th December 1960,and which came into force on 30th September 1961, the Organisation for EconomicCo-operation and Development (OECD) shall promote policies designed:
– to achieve the highest sustainable economic growth and employment and a risingstandard of living in Member countries, while maintaining financial stability, and thusto contribute to the development of the world economy;
– to contribute to sound economic expansion in Member as well as non-membercountries in the process of economic development; and
– to contribute to the expansion of world trade on a multilateral, non-discriminatorybasis in accordance with international obligations.
The original Member countries of the OECD are Austria, Belgium, Canada, Denmark,France, Germany, Greece, Iceland, Ireland, Italy, Luxembourg, the Netherlands, Norway,Portugal, Spain, Sweden, Switzerland, Turkey, the United Kingdom and the United States.The following countries became Members subsequently through accession at the datesindicated hereafter: Japan (28th April 1964), Finland (28th January 1969), Australia(7th June 1971), New Zealand (29th May 1973), Mexico (18th May 1994), the Czech Republic(21st December 1995), Hungary (7th May 1996), Poland (22nd November 1996) and Korea(12th December 1996). The Commission of the European Communities takes part in the workof the OECD (Article 13 of the OECD Convention).
The Programme on Institutional Management in Higher Education (IMHE) startedin 1969 as an activity of the OECD’s newly established Centre for Educational Research andInnovation (CERI). In November 1972, the OECD Council decided that the Programme wouldoperate as an independent decentralised project and authorised the Secretary-General toadminister it. Responsibility for its supervision was assigned to a Directing Group ofrepresentatives of governments and institutions participating in the Programme. Since 1972,the Council has periodically extended this arrangement; the latest renewal now expires on31st December 2001.
The main objectives of the Programme are as follows:– to promote, through research, training and information exchange, greater profession-
alism in the management of institutions of higher education; and– to facilitate a wider dissemination of practical management methods and approaches.
THE OPINIONS EXPRESSED AND ARGUMENTS EMPLOYED IN THIS PUBLICATION ARE THERESPONSIBILITY OF THE AUTHORS AND DO NOT NECESSARILY REPRESENT THOSE OF THE OECD OROF THE NATIONAL OR LOCAL AUTHORITIES CONCERNED.
** *
Publié en français sous le titre :GESTION DE L’ENSEIGNEMENT SUPÉRIEUR
© OECD 2000Permission to reproduce a portion of this work for non-commercial purposes or classroom use should beobtained through the Centre français d’exploitation du droit de copie (CFC), 20, rue des Grands-Augustins,75006 Paris, France, Tel. (33-1) 44 07 47 70, Fax (33-1) 46 34 67 19, for every country except the United States. Inthe United States permission should be obtained through the Copyright Clearance Center, Customer Service,(508)750-8400, 222 Rosewood Drive, Danvers, MA 01923 USA, or CCC Online: http://www.copyright.com/. Allother applications for permission to reproduce or translate all or part of this book should be made to OECDPublications, 2, rue André-Pascal, 75775 Paris Cedex 16, France.

3
Higher Education Management
• A journal addressed to administrators and managers of institutions of highereducation and researchers in the field of institutional management.
• Covering the field of institutional management through articles and reportson research projects.
• A source of information on activities and events organised by OECD’sProgramme on Institutional Management in Higher Education.
• Published under the title International Journal of Institutional Management in HigherEducation between 1977 and 1988, it appears three times a year.
• Issued in English and French editions.
Information for authors wishing to submit articles for publication appears at theend of this issue. Articles and related correspondence should be sent directly tothe Editor:
Prof. Maurice Kogan48 Duncan Terrace
London N1 8ALUnited Kingdom
To enter a subscription, send your order to:
OECD Publications Service2, rue André-Pascal, 75775 Paris Cedex 16, France
2000 subscription (3 issues):FF 510 $85.00 DM 160 £45 Yen 10 750
Single issue price (2000):FF 205 $35.00 DM 65 £23 Yen 4 350
For information on how to order past issues please write to:OECD Publications Service2, rue André-Pascal, 75775 Paris Cedex 16, France.
OECD 2000
Higher Education Management Vol. 11, No. 3
5
OECD 2000
CONTENTS
Beyond “Delayering”: Process, Structure and BoundariesChris Duke ........................................................................................................................... 7
Managing Regional Collaboration in Higher EducationThe Case of the North American Free Trade Agreement (NAFTA)Manuel Crespo ................................................................................................................... 23
Institutional Funding and Managerial Differences in Racially Dual Systemsof Higher EducationG. Thomas Sav .................................................................................................................... 41
UK Higher Education:Competitive Forces in the 21st CenturyG.C. Webber ........................................................................................................................ 55
Academic Responses to the UK Foresight ProgrammeMary Henkel ........................................................................................................................ 67
Economics Research in France: Tentative Conclusions Based on EconLit DatabaseJean Mirucki ........................................................................................................................ 85
The Use of Indicators in the Strategic Management of UniversitiesRichard L. Morrill ................................................................................................................ 105
Index to Volume 11 ................................................................................................................. 113

Higher Education Management Vol. 12, No. 1
7
Beyond “Delayering”: Process, Structure and Boundaries
Chris DukeUniversity of Western Sydney, Australia
ABSTRACT
The Australian Unified National System of higher education, created in 1989,brought to an end the binary structure of Australian higher education dividedbetween universities and colleges of advanced education. Government fundedrapid growth through the early nineties via load-based grant and HECS. Federalpolicy changed sharply in 1996. In a difficult new environment, new policies andmanagement practices emerged. These are of interest on a comparative basis,especially compared with the UK in the same period.
The federated University of Western Sydney (UWS) is a “1989 university”. Itgrew rapidly through the nineties to serve the fast-growing Western Sydneyregion. The largest element, UWS Nepean, sought to leave the federation in1995. This precipitated a crisis leading to constitutional change. Significantorganisation change was also required, both by this and by changed federal pol-icy. Nepean restructured radically, removing the faculties and their deans andseeking to create a culture of client service and continuous innovation. The ongo-ing process illustrates the intricate and unavoidably interactive relationshipbetween structure, process and boundaries, since UWS Nepean is highly inter-dependent with its rapidly changing region, and the centrality of culture.
THE CHANGING AUSTRALIAN HIGHER EDUCATION ENVIRONMENT
In 1989 Australian federal Minister for Education John Dawkins brought to anend the binary divide between universities and colleges of advanced education(CAEs) – a proximate analogy to Britain’s polytechnics – and inaugurated the Uni-fied National System (UNS). CAEs became universities, or parts of universities,often through merger with existing universities or one with another. Various modelsemerged of multi-campus institutions, adding greatly to the existing diversity as
OECD 2000

Higher Education Management
8
well as to the number of Australian universities, of which there are now 36 state andtwo private.
The institution which provides a case study in this paper is UWS Nepean, for-merly the Nepean CAE, now part of Australia’s only federated (as distinct frommulti-campus) university, the University of Western Sydney (UWS). The other part-ners in the UWS federation are Macarthur (formerly Milperra CAE), like Nepean apost-World War Two creation, and Hawkesbury, formerly Hawkesbury AgriculturalCollege, with a history of more than a century. We turn in the following section to asketch of UWS and its distinctive region.
In Britain the days of easy and often unquestioned growth in higher educationfrom a small and elite base continued after the Robbins report only until the eco-nomic rationalism of the Thatcher administration was felt by universities, in theshock of 1981. Thereafter growth has been predicated on a declining unit ofresource and growth of non-governmental income, along with greater transparencyand public accountability, such that the proportion of income “earned” outside gov-ernment (Funding Council) grant has become a key comparative indicator. InAustralia, a much younger system, participation rates climbed earlier and haveremained higher than the British through recent times. Whereas Britain is recogn-ised as having entered the era of mass higher education, informed discourse inAustralia is of the transition from mass to universal.
Fully funded growth, albeit at a less generous level than had held for the elitepre-Thatcher British system(s), continued through the early nineties, until the Coa-lition (conservative) administration of Howard displaced Labour in 1996. (Highereducation has been a federal not a State matter in Australia since the Whitlamadministration of the early seventies.) The change which occurred with the 1996budget echoed the Thatcher cuts of 1981. Not that the level of grant dropped dra-matically. Instead, students were required to pay more with the modified and vari-able-level new Higher Education Contribution Scheme (HECS). Funded numbersflattened and have now reduced a little; still a severe shock after years of fullyfunded growth, which it was assumed would continue. More serious, the govern-ment declined to meet the cost of salary increases. With academic and general staffsalary increases of 12-13% over two years (1997-99) at most universities, the effectwas a dramatic fall in the effective purchasing power of the grant. Australian univer-sities were thrown more onto their own resources, very much as happened in Britainfifteen years earlier.
The result has been a sharp change in the temperature of the environment foruniversity management. It has become chilly in terms of political support and pub-lic funding; heated in terms of political relations, inter-institutional competition,and now in 1999 in relations with the campus unions – mainly the academic union(the NTEU), and the CPSU for most general staff. The oldest and most prestigious
OECD 2000

Beyond “Delayering”: Process, Structure and Boundaries
9
universities (known as the “sandstones” or the “great eight”) argue for greater con-centration of government research funds in their favour, on the ground that only afew truly international “research universities” can be afforded. A leader amongthese, Melbourne, led the formation of the international club Universitas 21. All thesandstones withdraw in 1999 from the employers’ federation (AHEIA) in an attemptto win greater negotiating freedom with NTEU, and favour with a federal adminis-tration hostile to unions and committed to reducing public expenditure.
In the background lurks the West review of higher education completed in 1998(West, 1998). The report was immediately set aside by the federal Minister forEducation. However its recommendations, and especially those of the libertarianeconomistic consultant Global Alliance Inc., remained to haunt university adminis-trations. One controversial change introduced for 1998 allowed universities to offerfull fee places to home undergraduates, something hitherto proscribed. Several,mostly sandstone, universities took up the opportunity against vigorous studentopposition. Others refused on principle, or through a calculation that they wouldnot gain in a prestige-driven market-place. The numbers recruited in the first year,1998, were very small, but full-fee places, like top-up or deregulated fees, exist asthe leading edge for one aspect of partial privatisation.
The impact of declining public funds, cost of salary increases and the thirdround of Enterprise Bargaining which dominates the university political landscapein 1999, has forced institutions into hungry, highly competitive and at times ethi-cally dubious forms of activity. Competition, for full-fee overseas students (knownas international), research income, and high quality domestic undergraduate andresearch students, is fierce, and dominated by the cheque book. Despite a politicalrhetoric for diversity, there is a tendency for all institutions to compete for the samemarkets and the same prestige and reward systems. The language of the marketplace (customers and products, throughput and output) mingles with the languageof modern management (total quality and MBO, world class, down- or right-sizing,delayering and outsourcing), and with an anxious discourse: of standards and excel-lence, quality or its absence, and increasingly of client service, student satisfaction,and graduate outcomes.
Other manifestations of the new environment include the creation of privatesubsidiaries, the most prominent being Melbourne University Private, and ofspin-off companies and more commercial arms. The new discourse includes strate-gic alliances as well as competition. Every university has some form of partnershipwith the Technical and Further Education (TAFE) system and often also with privateVET (vocational education and training) partners. An impression from one familiarwith both the Australian and British systems is that a competitive market andunconventional not to say unethical behaviour is much more evident and ruthless,as well as more sudden in its arrival, in Australia. It sits uneasily with a tradition ofopportunity, access, equity, and behind that of easy-going mateship. These tensions
OECD 2000

Higher Education Management
10
make the changing behaviours of Australian universities and the new learning oftheir managers topics of significance and fascination.
GREATER WESTERN SYDNEY (GWS)AND THE NEW UNIVERSITY OF WESTERN SYDNEY (UWS)
Sydney, with a population which reached 4 million in 1999, has four universitiesin its Harbour-based eastern half including two of the “great eight”, Sydney andNew South Wales, as well as Macquarie and the University of Technology Sydney(UTS). There is also a branch of the nation-wide multi-campus Australian CatholicUniversity. The western half of Sydney, usually known as GWS, had no universityuntil 1989. There had been plans for a university to be founded at Penrith in theWest, named after a leading Australian former statesman, Ben Chifley. Land setaside for this purpose became part of the estate of Nepean and so from 1989of UWS. One university, created by federating three CAEs, thus now serves thenewer half of Australia’s largest city and urban conglomeration, containing 10% ofAustralia’s population.
GWS is characterised by energy, variety and relative disadvantage. It dis-plays huge ethnic, cultural and religious diversity. It is a main reception area fornew settlers to Australia: economic migrants and political refugees from all partsof the world. It has the largest concentration of the most severely disadvantagedof Australian “communities”, Aboriginal (and other indigenous) peoples, inNew South Wales, and now a strong influx of also disadvantaged Pacific Islanders,as well as refugee groups such as Bosnians and Kurds, who appear within thestudent mix.
Unemployment is high. Very small to small-medium enterprises dominatethroughout the eleven local authority areas (mostly also known as cities and proudof local identity and tradition) which, like private sector industry and business, aregrouped in a multitude of development and lobbying bodies jostling to advancethe interests of the West.
Participation in higher education is low compared with the affluent half ofSydney, and also with the State of Victoria. It is, for all that, much improved with thegrowth of UWS during the nineties. Like most other social indicators across areas ofhealth and welfare, this reflects the relative disadvantage of the West, captured insuch terms as “westies” and “battlers”, now, like “black”, adopted as badges ofpride. Offsetting its current easily quantified disadvantages GWS also has hugepotential. It is a key to the economic future of the State and ultimately of the nation,with a larger population than the whole of such States as South Australia andWestern Australia each with several universities, and something like a quarter of thenation’s under-fives.
OECD 2000

Beyond “Delayering”: Process, Structure and Boundaries
11
UWS celebrates its 10th anniversary in 1999 with over 30 000 students. Thismakes it one of the country’s largest as well as fastest-growing universities, now offi-cially fifth in size. (The picture is complicated by mergers between some Victorianuniversities and TAFE institutes which have produced big conglomerates in thatState.) UWS has written access and opportunity as well as partnership with GWS asits “learning region” into its mission statement and strategy (UWS, 1997). Its vice-chancellor describes it as a social justice university.
The three parts of UWS vary significantly in character and size. The smallest,with a quarter of total student load but above average research output for UWSbecause of its long tradition and science-based strength, is Hawkesbury. It stilloccupies its old agricultural college campus in the North-West (Richmond) and hasrecently opened a second campus at Nirimba, a disused military site near morecentral Blacktown City, which is distinctive in being a multi-institutional partnershipbetween State and Catholic high schools, a TAFE college and UWS. It shares variousfacilities and has agreements for easy progression between the institutions –referred to in Australia as “seamlessness”.
In the South-West of Sydney Macarthur, with approximately a third of UWS stu-dent load, occupies a purpose-designed green-field campus at Campbelltown, anarea of rapid growth and serious socio-economic disadvantage. It also has an olderinner city campus at Bankstown, with a diverse ethnic community mix, especiallyLatin American refugees. Macarthur has been highly innovative, with courses inaeronautics and more recently traditional Chinese medicine, and sponsored chairsin gambling. It has made special efforts to attract “high-fliers” with high UAI (univer-sities’ admission index, formerly TER) scores achieved at the year twelve higherschools certificate examination. The common practice for high achievers in uppersecondary education in the West has been to take the train to one of the older CBDuniversities. Sydney’s spokes-of-a-wheel travel pattern, both road and rail, facili-tates this while inhibiting travel between the different campuses of the Universityacross the western part of the wheel.
In the central West, on the line of earliest European settlement, first atParramatta and then at Penrith and Emu Plains for the crossing of the Nepean Riverand the Blue Mountains, Nepean is geographically central, with some 46% of studentload. The three campuses of Nepean at Werrington-Kingswood (the main site of theNepean CAE) are now treated as a single Penrith campus, and run together with theNepean College of TAFE which sits almost as an enclave within the Penrith campus.
The other main Nepean site is at the upper limit of Sydney Harbour’s salt wateron the eastern side of Parramatta, site of earliest European settlement and nowSydney’s second CBD. On the other side of Parramatta, Nepean has retained one ofits earlier Parramatta Westmead campuses, which sits beside Australia’s largest
OECD 2000

Higher Education Management
12
health industry complex. This has been redefined (like Werrington North on thePenrith campus) as an “innovation precinct”.
Not surprisingly, given these facts about GWS and UWS, the University strug-gles among the less privileged Australian universities. Following rapid and sus-tained growth it is poor in infrastructure; strained in human resources (manifest forexample in the poor staff: student ratio); below the Australian average in researchstudent numbers and research income (though rising fast on both indicators); andwithout significant assets and reserves other than its own land and buildings.
Throughout UWS the majority of students are drawn from the immediateregion, making this clearly a regional university. Some two thirds of graduating stu-dents are the first in their family to attend university. More than a third come froma home where English is not the first language. Nonetheless, graduate employmentis strong for a region of high unemployment. An impression, supported by recenttrends in UAI cut-off scores and in terms of the numbers of first and other prefer-ences for UWS, is that the University, and within it Nepean, is becoming a universityof first choice for more people in GWS. Thus Nepean in 1999 attracted twice thenumber of first preferences of successful and highly regarded Wollongong Univer-sity. UWS is achieving a strong reputation, both for being friendly and accessiblebut also for a number of its programs of study, which are distinctive and alreadyhighly regarded.
UWS NEPEAN – 1995-1997
A few months after a new vice-chancellor took up post at UWS the Nepean CEOattempted to remove Nepean from the UWS federation. In the event the GoverningBody narrowly held the federation together and the CEO resigned. During the fol-lowing interregnum until September 1996 Nepean was administered by an actingCEO, the most recently arrived of its eight deans and the person seen as least impli-cated among senior staff in what had appeared a virtually unanimous will to secede.The acting CEO was joined in a condominium by a very senior external adminis-trator employed part-time as a watchdog for the UWS interest. Nepean remained inthe fold as the distrusted, defeated and still incipiently rebellious yet largest andgeographically central part of the University.
An externally chaired review led to new UWS arrangements through legislationin 1997. This created a dual system, with checks and balances designed to preventa repetition of the 1995 crisis. The three member CEOs (“member” being the infe-licitous statutory term used to describe the constituent parts of the federated sys-tem) became Presidents, as well as remaining Deputy Vice-Chancellors of UWS.Each member appointed a new Council analogous to that for a unitary university,the chair of which became Deputy Chancellor of the UWS governing body nowcalled the Board of Trustees. The CEOs (Members presidents) now report both to
OECD 2000

Beyond “Delayering”: Process, Structure and Boundaries
13
their respective Councils and their Deputy Chancellor Chairs and to the Vice-Chancellor, with whom they constitute a senior management team. Within eachmember the full structure of a conventional university was replicated with an Aca-demic Board, the term Academic Senate being reserved for the analogous body atthe federation level. The Nepean Council and Board have familiar linkages andreporting lines, each with its own set of sub-committees and where necessary workingparties, etc.
The workings and continuing evolution of the federation, including recurrentangst about the nature of the University (rationalisation and synergy, diversity andcentralisation, the division of responsibilities at system and member level and theassociated protocols) are not the focus of this paper. They provide a context forexamining management strategy within the erstwhile rebellious largest member. Itis however relevant that the crisis, and the ambiguity of the federated system,weakened the market position of UWS in its community and region, as well as inmarketing overseas. Immediately it was important to generate a sense of directionand purpose, and to win back confidence in the local region, which remains vital tothe University’s success. Debate about federation continues, and the new legisla-tion remains to be fully interpreted into practice.
The debate was rekindled in a new form with the departure the Vice-Chancellorto the University of Western Australia. His successor was required to come to termswith a unique institution at a time of acute financial stringency caused by thechange from almost automatic funded growth to reduced Government blockgrant and greatly accelerated “marketisation”. “Head office”, the Office of the Vice-Chancellor, might remain an issue for any who identified first with Nepean. Tradi-tional academic suspicions of management and of its strategic planning and controlcontinued to be exacerbated by the existence of two levels of planning andmanagement. In principle direction is set at UWS level, management and imple-mentation are a local matter at the Hawkesbury, Macarthur and Nepean level. Thedistinction can be less clear in reality.
Within Nepean centrifugal tendencies leading to the failed bid for autonomyhad reproduced themselves within the institution. Separatism probably grew dur-ing the interregnum following the failure of “UDI”. When a substantive CEO arrivedit was to find eight faculties in varying degrees of open or covert dissociation fromthe interim CEO. The stress was added to by a sense of financial crisis following the1996 federal budget. Attempts to control finances and make economies wereblocked by some faculties. Academic promotions were on the point of becoming afaculty rather than central responsibility. The management consultants KPMG werejust completing a report favouring yet greater devolution to faculties, as separatesubsidiaries of a “holding company”, while recognising the need to strengthen cen-tral financial capability to generate and share accurate financial data. Morale waspoor, cynicism and suspicion high. The 1995 crisis left a mood of sullen defiance.
OECD 2000

Higher Education Management
14
Nepean was in poor shape to survive in the Howard administration’s new climate ofeconomic rationalism. An immediate and chilling sign was the prospect in the(southern) spring of 1996 that enrolments for 1997 (the academic year coincideswith the calendar year in Australia) were running 20% below target. The1999 predicament of Thames Valley University in England has some resonances.
The first response was to institute a Nepean-wide process of reflection, refo-cusing purpose to confront new external circumstances. The overt agenda was toconsider different arrangements which might better equip Nepean to manage itsresources economically and win business in a competitive environment. The lessopen agenda was to gain a capacity for central steerage of an institution which nowlacked strong shared identity, other than in a negative sense, and promised to driftin disarray. This required purposeful management and empowering staff, adminis-trative, general and academic, some of whom complied with institutional purposein only a token way. Yet it was clear that Nepean had a wealth of talent, havingattracted innovators from more traditional universities to whom the challenge andopportunities of the West appealed.
A wide and protracted process of participatory consultation led by mid-1997 toa new structure for Nepean which in no way resembled earlier prospectivesketches. It differed from the dominant pattern of less radical restructures sweep-ing Australian universities at the time in response to the difficult new circumstancesadumbrated by the new federal government’s resolve to cap and reduce publicexpenditure on higher education, and to shift the funding base towards other stake-holders, notably students or their families.
In place of eight faculties and over 30 departments the “new Nepean” com-prises twenty academic schools along with two small academic centres. Existingresearch centres continued via affiliation to an appropriate school. The position offaculty dean ceased along with the faculties, at the end of 1997 when the schoolstook full effect, led by chairs who were formally elected, but in all but two casesidentified by agreement without competitive election. The often conflictual anddysfunctional “Senior Managers’ Meeting” (SMM) gave way to a monthly meeting ofschool chairs which, like SMM, was joined by Nepean’s senior officers. These meetfortnightly as the President’s informal advisory group. The school chairs quicklydeveloped an invigorating and mutually supportive culture, providing a venue forcritical thinking, contributing to policy and administrative developments, exchangingideas and good practice, and assuming a sense of shared ownership of institutionaldirection and purpose.
Once the basic process of academic restructuring was resolved, and as itmoved through Academic Board to Council via Green and White Paper stages, anequally far-reaching remaking of administration occurred. The large, rather bureau-cratic and not user-friendly, central divisions, Registrar’s, Human Resources and
OECD 2000

Beyond “Delayering”: Process, Structure and Boundaries
15
Finance in particular, were reduced to smaller more strategically focused units. Themajority of the staff were deployed into campus service centres – CSC – at Penrithand Parramatta. The CSCs were required to develop a client service oriented teamapproach, providing support to the schools locating at the respective campuses.
Because the main focus of “restructuring” was on the academic areas as the uni-versity’s “core business”, changes affecting administration lagged behind. This rein-forced the sense of two-class citizenship which had been identified as one ofNepean’s cultural problems and addressed in modest ways, although the changesperpetuated and indeed exacerbated it. The change process required academic staffto identify where they thought they best belonged in the new academic structure.The new schools formed themselves around these groupings of common purpose.Every individual was required to make a choice and a commitment. In some cases thename of the new school was almost the last thing to be decided. Several of thesenames have been under subsequent review, three being changed a year later.
For general staff, especially the administrative and clerical (technical and man-ual staff were less directly affected by the changes), the process was less of choos-ing than of being chosen. Support posts were advertised internally throughout theschools. Those chosen moved from the faculties and divisions, leaving the remain-der to stay in the greatly reduced divisions or to become the staff of the CSCs. It isnot surprising that the CSCs have suffered problems of morale and low self-esteem.It is less evident that the residual divisional support staff have suffered in thissense, perhaps because they have enjoyed more stability and obvious continuity.
AFTER RESTRUCTURING – INSTITUTING INNOVATION
Four general principles were set down when the central academic restructuringwas formulated. One was that there should grow up a process of continuous, non-revolutionary and non-disruptive adaptation. The changing environment, “mar-kets” and “clienteles” of the university as a business as well as an institution weretreated as a main reason for change. Every effort was made to look forward to a moreentrepreneurial culture. Staff generally and the new schools in particular wereexhorted to develop a sense of values, purpose and direction which would manifestitself in school academic plans, aggregated into a Nepean Academic Plan at Aca-demic Board, and increasingly underpinned by business planning. The new con-straints from reduced government funding (greatly exacerbated by non-indexationof salary awards which has reduced spending power) had to become an opportunityto teach and undertake research in new ways and with new partners. The harsh com-petition from stronger and older universities had to be redefined as a contest inwhich Nepean and UWS could win rather than guarantee to lose. Post-restructure,the approach was continuously to stress the need for continuous change, but within
OECD 2000

Higher Education Management
16
this to create a measure of stability so that staff could work with more confidenceand purpose.
The “new Nepean” was launched at the beginning of 1998. It coincided with thelargest move in the history of Australian universities, to the reconstituted and“adaptively reused” Parramatta campus east of Parramatta city centre. One of thevacated Westmead campuses was sold to help pay for the refurbishment and move(AUD 4 million in a total exceeding 40 million); the other is becoming an income-generating “innovation precinct”. The difficulties associated with the move to whatwas still a building site (in a country rigorous in its Occupational Health and Safetyregulations) were formidable. Marquees were erected in case teaching space wasunavailable when semester started (“tent city” in the popular media).
All this shifted attention from the radical restructuring to the drama of themove – but also from the past to a different future. Energy now came fromschools and administrative teams wrestling with new challenges. Through noprocess of clever planning, this proved ultimately team-building, morale-building,and empowering. Public celebrations followed with the Premier on campus tolaunch a new UWS-wide Western Sydney Research Institute, then the first gradua-tions to be held on campus in the fine new Auditorium, and an official opening bythe Governor-General later in the year. The “new Nepean” presented its face verypublicly to its regional partners and communities in the context of a more confidentUWS which under new leadership was gaining a keener sense of itself as a leadingpartner in building Greater Western Sydney as a “learning region”.
This constellation of events was fortuitous and beneficial. It did not take awaythe problem of persisting old culture and ways. A client service culture (beingobsessive about this as a senior consultant to UWS put it) remained elusive. Olderbureaucratic CAE ways reappeared as fast as they were addressed. A variety ofdevices was employed to foster the change, such as instigating recognition for out-standing service, and actively supporting grassroots initiatives. Some individualsmoved laterally to new developmental positions, for example to create andstrengthen partnership and articulation with local and overseas colleges, todevelop a Nepean conference capability, and to get a firmer handle on occupancyand use of rooms. Particular internal interventions were chosen to signal howNepean was to develop. Modelling responsiveness and client service from the topsought to point direction and set the tone. In a few cases of poor performance espe-cially from a client service perspective, staff were terminated, and a few functionsoutsourced.
The idea was to foster a process of continuing innovation following restructur-ing – flattening the hierarchy or in the jargon “delayering”. This was intended to pro-duce a culture of innovation and self-renewal which enabled Nepean to develop areputation for high quality and responsiveness, become less dependent on State
OECD 2000

Beyond “Delayering”: Process, Structure and Boundaries
17
block grant, and diversify its income base. This meant people initiating and reinter-preting rather than merely accepting change. One prerequisite especially for aca-demic staff was belief in the revised mission. Positive valuing of regionalpartnership could be experienced as threatening by those with conventional aca-demic aspirations, for whom “region” might denote “second class”. Positive valuingof entrepreneurialism had to be separated from any notion of “selling out” to thecorporate sector. On both of these vital identity issues redefining and revaluingGreater Western Sydney as a rewarding and wholesome “partner” was central –both to sense of integrity and purpose and to community standing, leading to win-ning new and repeat business.
For all the talk of restructuring in the first twelve months of the new regime, thecentral concern was with cultural change and renewal. Given the lean times from1996 a question asked with rising persistency has been “what can we cease doingaltogether?”, as well as “what can we do leaner and better?”. This extends fromteaching methods including flexible learning, collaboration across UWS and courserationalisation to the structure of the academic year and the optimal length of thesurviving conventional semester. It involves reducing where possible the number,size and frequency of meetings of committees, and the number of stages for allapproval and control procedures – financial, staff, student, etc.
On the other hand it has involved the creation of larger numbers of task-focused time-bound working parties to achieve particular results and shifts in direc-tion, as well as more informal networks, alliances and liaisons across units withinNepean and beyond. A limited number of new standing committees and groupswas chosen with cultural change and community building in mind. They includedthe regular meeting of schools chairs as a developmental middle managementforum; an Internationalisation Group; a Savings Task Force to break the old spend-ing culture while making specific changes; an Earned Income Group; and a deep-slice Organisation Development (or organising change) Committee to strengthenNepean’s capability to operate as a reflective learning organisation.
PROCESS AND STRUCTURE, BOUNDARIES AND CULTURE
What does this study of crisis and change management suggest for manage-ment in higher education more generally?
One response is that there is nothing new under the southern sun: we haveseen all this before. Rediscovering abiding truths may be the name of the game,especially in times of rapid change and short memory. Ironically, a perceptive crit-icism of the radical Mrs. Thatcher has been her ignorance or denial of history. Dis-covery through rediscovery in the management of higher education involveslooking – critically – beyond the particular literature of the sector to wider studiesof organisation and social change. The sector tends to adopt the worn cast-offs of
OECD 2000

Higher Education Management
18
management practice elsewhere, but to miss the deeper implications of changinginsights and practices in seeking models and lessons for its own admittedly uniquechange management requirements.
There are also unique conditions to do with national culture and tradition,within which management practice can become avoidably entrapped as well asbeing unavoidably embedded. In Australia barely recognised authoritarian andbureaucratic assumptions have roots deep in convict and colonial history and nur-tured by low self-confidence characterised as cultural cringe and a “tall poppy” syn-drome. In such an unconscious shared culture it is hard to be truly different,although the rewards may by the same token be the greater. Specifically, there is atendency to take refuge in structures rather than processes, to value tangible mea-sures and quantified targets almost exclusively without attending to the moreimportant longer term cultural change. Vision and a sense of the possible are thenimpoverished.
As to rediscovering earlier wisdom and putting it to work, the insights of opensystems thinking best exemplified through the action research, reflection andconceptualisation of the late Australian-born but internationally experiencedFred Emery well illustrate the point. The large agenda, but also the tactical path formanaging immediate crisis and long-term redirection at UWS Nepean, were in asense scripted by Emery’s reading of turbulent environments and socio-technicalsystem behaviours in the sixties (Emery, 1969). Similarly for much of the organisa-tional behaviour literature of that period which took direction from studying thepsycho-social life of organisations and the behaviour of groups within them. Theinsights of the best of this earlier organisation development literature are taken fur-ther in the best of the more recent learning organisation literature, leaving asidethat which tritely equates learning organisation with training company.
This earlier tradition was largely submerged as economic rationalism invadedmanagement theory and behaviour in the form of business re-engineering, down-sizing and out-sourcing. For universities in unstable, hostile and resource-leanenvironments rationalism rewritten as managerialism proves tempting and fashion-able. Hard times demand tough management: in place of soft collegiality theso-called proletarianisation of the ill-disciplined and individualistic academic pro-fession through hard-edged performance management. This temptation leads awaynot only from the cultural conditions which make universities important andunique, but also from the directions in which the more imaginative and insightfulmanagement theorists of the nineties now point. There is a dangerous “hubris ofleadership”, whereby top-owned vision and control lead to an impossible expecta-tion for what simply cannot be delivered in times of turbulence (Emery, 1969) ormess (Stacey, 1998). Whereas postmodernism has added existential doubt andreduced self-confidence, unrealistic claims to the certainty of a scientific and con-trolling management give no real refuge.
OECD 2000

Beyond “Delayering”: Process, Structure and Boundaries
19
How does this relate to the crisis through which UWS Nepean recently passed,and the uncertainty in which, with all of Australian higher education, it continues toreside?
The vehicle for change in 1996-97 was “restructuring”. This was tangible andunderstandable. If unwelcome, it is less threatening to the embattled and insecurethan the ambiguity of “cultural change”. Allied to a public dialogue about identity,values, directions and a changing outside world it allowed many in the institutionto re-engage with their situation and to reconsider what their university was andwhere it was going. Gradually this has moved since early 1997, for many member ofUWS Nepean, from “where is it taking me?” to “where are we taking it?”.
In other words, process proved vital, more vital indeed than structure – evenin the choice of structural change as the vehicle for a change process. Almost anystructure can be made to work if there is the will. Any structure can be grid-lockedand subverted if there is the purposeful intent so to do. A large number of structuralchanges, with much attention to process and fine detail, have occurred and con-tinue at Nepean. Without these, in a tight and transparent inter-relationship, itwould not be possible to move with confidence and widening of delegation andpower to continue the process of evolution towards greater responsiveness,enhanced client service, and more vigorous and productive entrepreneurialism. Acentral purpose and vision is to create a congruent “learning organisation”. Such aninstitution can serve as a leading partner within a learning region and learning econ-omy (Goddard, 1997, 1998) and thereby become a successful entrepreneurial uni-versity as sketched by Burton Clark (1998), adept at new modes of knowledgeproduction (Gibbons et al., 1994).
The key issues addressed in this article are neatly captured by Andrew Pettigrew,in a summary of his recent analysis of 450 European companies. Pettigrew groupsthe key features as Structures (decentralising, delayering and project forms of orga-nising), Processes (to do with IT, internal communication and new human resourcespractices), and Boundaries (downscoping, outsourcing and strategic alliances).High performance appears to correlate strongly with implementing change in manyof the nine detailed elements. Only a small minority of companies, those whichenjoyed significant performance benefits, carry out “the full multidimensional raftof innovative practices” (Pettigrew, 1999).
The key then, is cultural transformation and the integration of inter-relatedmulti-dimensional change, that is to say, ongoing, in-built, non-traumatic “culturalrevolution”. A resulting reflective organisation is able to learn and adapt from itsown experience, making the necessary internal arrangements (committees, taskforces, working groups, decision paths) to enable this, and growing an ever-wideningcircle of “managers” engaging at all levels across the flattened formal structures ina living matrix mode. For this to succeed however, the nature, separateness and
OECD 2000

Higher Education Management
20
“boundedness” of the institution also require address. In Emery’s open systemsterms, the university has to engage in a set of what we now call strategic relationswith its environment, to network in ever more rich and complex webs with dual andmultiple partnerships. The insights of studies such as those by Alter and Hage(1993) inform such practice.
Boundary riders or spanners are now recognised as important to institutionalsurvival. Like Nepean’s new articulation officers, its earned income group and itsinformal “offshore” good practice exchange network, they enhance dialogue andpartnership both within the university and across its boundaries. Beyond these,other stakeholders, in this case mainly within the GWS region, become internalinfluences, co-planners, and ultimately joint owners and leaders of the university’sdestiny. Reciprocally, increasing numbers of university staff become involved in theactivity and leadership of regional partners. They thereby join in new forms ofresearch which partly finance and enable the university’s fulfilment of teaching andresearch missions. Community service becomes not a third leg but an informingprinciple, a vital sinew within the two main kinds of “core business”.
This article describes and analyses a chapter in the history of an Australianex-college of advanced education turned university and traumatised by an earlyconstitutional crisis: first from the familiar perspective of “process and structure” asBecher and Kogan (1992) put it, but also from a wider set of perspectives. Theserecognise the centrality of culture, and of the political and in themselves culturaldifficulties of using this “soft” term in times when tough rationalist managerialismenjoys fashion and political support.
What may be new in this analysis is recognition of the way in which boundarymanagement, and in older discourse the environment, are essential to facilitatingand steering change. In fact it was the re-creation of identity and purpose (“mission”)through transcending and even dissolving boundaries via new forms of partnershipwhich promised a more confident future for UWS Nepean, assisting it to movebeyond a deeply scarring past. It appears in 1999 that the levels of productivity andintelligent innovation across and between almost all of Nepean’s new academicgroups, in realistic engagement with the local and global environment, demonstratethat it has achieved a cultural transformation from unpromising circumstances. Ithas in the process created for itself the courage to be different.
OECD 2000

Beyond “Delayering”: Process, Structure and Boundaries
21
References
ALTER, C. and HAGE, J. (1993),Organisations Working Together, Sage, Newbury Park.
BECHER, T. and KOGAN, M. (1992),Process and Structure in Higher Education, 2nd ed., Heinemann, London.
CLARK, B.R. (1998),Creating Entrepreneurial Universities, Pergamon, Oxford.
EMERY, F. (1969),Systems Thinking, Penguin, Harmondsworth.
GIBBONS, M., LIMOGES, C., NOWOTNY, H., SCHWARTZMAN, S., SCOTT, P. andTROW, M.(1994),The new production of knowledge, Sage, London.
GODDARD, J. (1998),“Managing the University/Regional Interface”, Higher Education Management, Vol. 9, No. 3,pp. 7-27; 1997, “The Role of Universities in Regional Development", Newcastle uponTyne, and other studies.
PETTIGREW, A. (1999),Organising to Improve Company Performance Hot Topics, 1(5), University of Warwick.
STACEY, R. (1998),“Creativity in organisations: the importance of mess”, work in progress paper, Universityof Hertfordshire.
UNIVERSITY OF WESTERN SYDNEY VISION (1997),2020 Sydney, UWS.
WEST, R. (Chairman) (1998),Learning for Life. Final Report of the Review of Higher Education Financing and Policy, DEETYA,Canberra.
OECD 2000
Higher Education Management Vol. 12, No.1
23
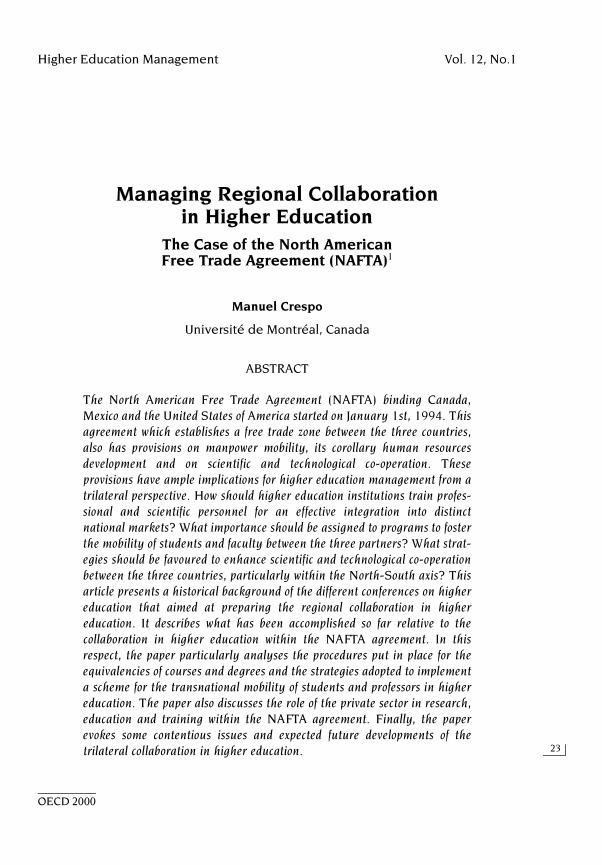
Managing Regional Collaborationin Higher Education
The Case of the North American Free Trade Agreement (NAFTA)1
Manuel Crespo
Université de Montréal, Canada
ABSTRACT
The North American Free Trade Agreement (NAFTA) binding Canada,Mexico and the United States of America started on January 1st, 1994. Thisagreement which establishes a free trade zone between the three countries,also has provisions on manpower mobility, its corollary human resourcesdevelopment and on scientific and technological co-operation. Theseprovisions have ample implications for higher education management from atrilateral perspective. How should higher education institutions train profes-sional and scientific personnel for an effective integration into distinctnational markets? What importance should be assigned to programs to fosterthe mobility of students and faculty between the three partners? What strat-egies should be favoured to enhance scientific and technological co-operationbetween the three countries, particularly within the North-South axis? Thisarticle presents a historical background of the different conferences on highereducation that aimed at preparing the regional collaboration in highereducation. It describes what has been accomplished so far relative to thecollaboration in higher education within the NAFTA agreement. In thisrespect, the paper particularly analyses the procedures put in place for theequivalencies of courses and degrees and the strategies adopted to implementa scheme for the transnational mobility of students and professors in highereducation. The paper also discusses the role of the private sector in research,education and training within the NAFTA agreement. Finally, the paperevokes some contentious issues and expected future developments of thetrilateral collaboration in higher education.
OECD 2000

Higher Education Management
24
INTRODUCTION
The North American Free Trade Agreement (NAFTA) binding Canada, Mexico,and the United States started on January 1st 1994. The agreement, which estab-lishes a free trade zone between the three countries, also has provisions for man-power mobility and its corollary, human resources development and scientific andtechnological co-operation. These provisions have definite implications for thehigher education sector even if there are no explicit references to it. TheAnnex 1210.5 of the Agreement is often cited as the most significant element in theagreement that opens the way to trilateral collaboration in higher education. TheAnnex asks the contracting countries to develop mutually agreeable criteria for pro-fessional certification which would allow individuals to work in any of the threecountries. The constraints of nationality and permanent residence as preconditionsto work are thus eliminated.
Even before the start of the agreement, the three governments promotedtwo major trilateral conferences on higher education collaboration. The firstConference took place September 12-15, 1992 at the Wingspread ConferenceCentre in Wisconsin, USA. The second one took place September 10-13, 1993 inVancouver, British Columbia, Canada.
The participants to the Wingspread Conference agreed to pursue the followingobjectives (Proceedings of the Wingspread Conference, 1992):
– Develop a North American dimension in higher education.
– Encourage an exchange of information on themes of mutual interest.
– Promote collaboration among institutions of higher education.
– Facilitate student and faculty mobility.
– Promote the strengthening of relations between higher education institu-tions and the public and private sectors in areas linked to the quality ofhigher education.
– Use the potential of the new technologies of communication and informationto help implement the above objectives.
The Vancouver Communiqué comprised nine propositions for action (Reportof the International Symposium, 1993):
– The creation of a North American Network of Distance Education andResearch (NADERN).
– The introduction of a trilateral mechanism education/business on mobility,transfers and professional certification.
– The enhancement of relations between teachers and administrators.
– The establishment of an electronic data bank.
OECD 2000

Managing Regional Collaboration in Higher Education
25
– The development of a trilateral program of exchange, research and trainingfor students;
– The founding of a North American Corporate Higher Education Association.
– The elaboration of a plan for distance graduate training.
– The increase of financial support by agencies and foundations.
The last trilateral meeting took place after the start of NAFTA in Guadalajara,Mexico April 28-30 1996 (Partners for Prosperity, 1996). The report identifies severalmajor challenges raised in presentations which should be translated into trilateralpolicies. Among the most relevant, one finds:
– Promoting collaboration in spite of diminishing public resources.
– Widening participation to involve more sectors.
– Supporting specific partnership projects rather than “general frames ofreference”.
– Including academic collaboration in North American foreign policy.
– Establishing academic networks of excellence.
– Maintaining government support as facilitator and provider of funds withoutbureaucratic structures.
STRUCTURING THE COLLABORATION IN HIGHER EDUCATION
NAFTA collaboration in higher education is structured through a SteeringCommittee composed of three members, one for each country, chosen by therespective governments, supported by a Task Force composed, albeit not exclu-sively, of prominent members of the higher education community. The dearth ofbusiness representatives is significant. As of April 7 1998, the three members of theSteering Committee were: Patrick Borbey, Director General, International CulturalRelations Bureau, Department of Foreign Affairs and International Trade (Canada);Robert Earle, Deputy Associate Director, US Information Agency; Eugenio CetinaVadillo, Director General for Higher Education, Mexican Ministry of Public Education.Canada has appointed seven participants to the Task Force, United States six, andMexico five representing the different sectors of higher education, business, gov-ernment and international associations. Again, the presence of business represen-tatives is minimal.2 The Steering Committee schedules meetings, recommends themajor policy initiatives and monitors the collaboration in higher education. TheTask Force has a more specific orientation as it tackles different topics (or themes)of interest for higher education collaboration. After the Vancouver Conference, theTask Force set up nine different working groups that were responsible for theelaboration of the agenda of the Guadalajara meeting.
OECD 2000

Higher Education Management
26
SOME INITIATIVES OF NORTH AMERICAN COLLABORATION IN HIGHER EDUCATION
This review of initiatives of North American collaboration in higher Educationwithin NAFTA deals with three main aspects: a) the equivalence of courses anddiplomas; b) the implementation of a mobility scheme for students and faculty; andc) the role of the private sector in research, education and training.3
Equivalencies of foreign course and diplomas
In Canada, there is no formal mechanism of accreditation for either higher edu-cation institutions or accrediting agencies themselves. However, with respect tocertain professional accreditations, for instance engineering and architecture, thereare national co-ordinating agencies that evaluate foreign diplomas. These nationalagencies are nevertheless under the authority of the respective professional asso-ciation in each province.
With regard to postsecondary education, the equivalency of past training lead-ing to a diploma in a Canadian postsecondary institution is evaluated by academicofficials of each institution.4
The occupations regulated by the provinces pose a real problem in matters ofaccreditation. There are some initiatives to counter this problem. The province ofQuébec for the last 25 years has evaluated numerous foreign occupations and for-mal training for equivalency purposes. To date, there are around 60 000 decisionson referred cases. Ontario, Alberta, and British Columbia are considering, or alreadyhave, an office for foreign equivalencies (Whyte, 1996).
In 1989 the Canadian Information Centre for International Credentials (CICIC) wasfounded to act as a clearing house and information centre on professions and formaltraining. This agency is, according to Whyte (1996), more known outside Canadathan in Canada. It consists of a central office which receives the informationdemands and channels them to the appropriate organisations.
Of interest here is the Association of Accrediting Agencies of Canada (AAAC). TheAssociation is a grouping of national professional associations which accreditsuniversity level professional programs. The AAAC seeks to develop new modelsfor accreditation and financing with the intent to establish norms and proceduresof accreditation. The Association represents also the interests of accrediting agenciesto the government, the professional associations, the training institutions and theprivate sector.
Canada and the United States are members of TRACE (Trans-Regional AcademicMobility and Credential Evaluation Information Network). More than 30 countries aremembers of this network which is co-ordinated by the International Association ofUniversities. Finally, the three NAFTA countries are members of APEC (Asia Pacific
OECD 2000

Managing Regional Collaboration in Higher Education
27
Economic Co-operation). This last organisation has certain work groups on matters ofaccreditation.
There have been conferences to promote awareness of the impact of globali-sation on the professions, for instance the one held in Cancún in May 1994 in whichsome 500 delegates of 25 professions from Canada, the United States, and Mexicoparticipated. For some of these professions (architecture, medicine, administration,veterinary medicine) there has been notable progress in defining common stan-dards (Prieto, 1996). The development of comparable evaluation instruments forscreening at the onset of the training program is a basic input to establish qualitycontrol in professional training across the three NAFTA countries. A Spanish versionof the SAT (Scholastic Achievement Test), the PAA (Prueba de Aptitud Académica) is moreand more employed in Mexican universities. In 1995, around 100 000 students tookthis test. Both in the United States and Canada, candidates to graduate programsusually take the GRE (Graduate Record Exam). Another test for admission to graduatestudies was developed by the Instituto Technológico y de Estudios Superiores de Monterrey(Mexico). It is now being used for admission to fellowships in the Fullbright pro-gram. Note that the American College Board, founded at the beginning of this century,whose main goals are the pursuit of excellence in education and the procurementof a smooth transition from secondary to tertiary education, is very active in promotingthe elaboration of common standards for the professions (Deupree, 1996).
In the case of the United States, the federal government has no jurisdiction toaccredit programs or institutions. It has, however, an indirect power in that severalof its funding programs to institutions are tied to a previous accreditation byaccrediting agencies. There are six regional accrediting associations. There are alsoseveral institutional accrediting agencies that accredit institutions on a nationalbasis, notably in the domain of business programs. In 1995, only one regionalaccrediting agency, the Southern Association of Colleges and Schools, granted accreditationto foreign institutions. At that time, a committee of the National Policy Board on HigherEducation Accreditation was working on the elaboration of a common policy for theaccreditation of foreign institutions (Prieto, 1996).
In this vein, Diana Natalicio, President of the University of Texas at El Paso, hasrecently brought forward a proposal to the Steering Committee to bring togetherAmerican, Mexican, and Canadian University Presidents to look “at the feasibility ofdevising a North-American membership-driven accrediting body to look into insti-tutional and program accreditation in North America” (Report, 1998, p. 2). Sometravel costs for representatives from their respective countries may be covered bythe Steering Committee. Mexico is at an initial stage in the process of accreditinginstitutions and programs.5
Some other problems are associated with the general theme of course anddiploma equivalencies. Among them, one finds the structure of the programs, the
OECD 2000

Higher Education Management
28
counting of “credits”, and the system of grading. In Mexico, professional programsfollow a strict curriculum with no options, whereas in Canada, there is some flexibil-ity allowing choice among optional courses. The number of credits required for aprofessional program varies from 90 to 120 in Canada, from 120 to 136 in the UnitedStates and from 300 to 450 in Mexico. Finally, the grading system that gauges stu-dent performance goes from literal grading to discrete (0-4; 0-9; 1-12) or continuousgrading (0-100). The correspondence between grades under different grading sys-tems is not always easy to determine (Mungaray-Lagarda and Sánchez-Soler, 1996).
The implementation of a mobility scheme for students and faculty
In this respect, there are a number of initiatives among institutions of theNAFTA countries as well as a trilateral program for assuring mobility of students andfaculty. In 1994, ANUIES (Asociación de Universidades e Instituciones Instituticones deEducación Superior de Mexico) and the CREPUQ (Conférence de Recteurs et Principaux des uni-versités du Québec – Canada) signed a Memorandum of Understanding to ensure amodest scheme of bilateral mobility. Under the Memorandum, students from bothQuébec and Mexico may take one year outside their institution of origin in a partic-ipating university with full recognition for the work done. At its initial stage, it com-prised 28 Mexican universities and the majority of Québec universities. CREPUQhas also signed another memorandum with the California State University System toassure student mobility (Mungaray-Lagarda and Sánchez-Soler, 1996).
Through funding by the federal Department of Education, the San Diego StateUniversity has developed a program of double diplomas. The students from SanDiego State University or the Southwestern Community College can obtain a degree ordiploma from Centro de Enseñanza Superior de Tijuana (Mexico) or the UniversidadAutónoma de Baja California. This arrangement is reciprocated (Mungaray-Lagarda etSánchez-Soler, 1996).
The American Accrediting Board of Engineering and Technology received a grant fromthe federal government to elaborate a comparative guide of engineering programsin Canada, Mexico, and the United States. The project was aimed at improving stu-dent mobility by providing accurate information on different program alternativesin the three countries.
As a result of the work of the Task Force on Mobility, the three NAFTA countrieslaunched, on June 1st 1995, an important although underfunded three-year mobilityprogram (1995-1998), the North-American Mobility Programme in Higher Education.Each of the three governments allocated the equivalent of USD 1.2 million to executethe program.
The essential objectives of the program are:
– Encourage co-operation and exchange among Canadian, Mexican, and UShigher education institutions.
OECD 2000

Managing Regional Collaboration in Higher Education
29
– Increase the knowledge of the languages, cultures, and institutions ofCanada, Mexico, and the United States.
– Improve the quality of human resource development in the three countriesand explore ways to prepare students for work throughout North America.
– Augment North American student mobility, including promoting mutual rec-ognition and portability of credits and developing joint curricula and whereappropriate, joint degrees.
– Introduce an added value dimension to North American co-operation inhigher education and training which complements existing forms of bilateraland trilateral co-operation among the three countries as well as other pro-grams and initiatives.
The proposals will be considered to be enhanced if, in addition, they:
– Form partnerships in higher education and training to include others suchas business, professional associations, and public authorities in the threecountries.
– Encourage an exchange of expertise in new developments in higher educa-tion and training, for example training in new technologies for the mutualenrichment of educational practice in the three countries.
Proposals should originate from at least six institutions, two for each country. ACanadian forecast predicted that at least 60 Canadian institutions would be involvedby the end of the project and approximately 400 students would benefit from themobility scheme. The program solicited projects which “include means to facilitatestudent mobility including work placements, adequate language preparation and fullacademic recognition. As well, the development of innovative joint curricula andteaching materials, including those using new education technologies and distanceeducation, will be encouraged. Projects involving student work periods related totheir studies are also invited.” (Gouvernement du Canada, Communiqué 95-37: 3.)The academic stays should be of a minimum of four months in one or more of theforeign institutions; the work placements should be of a minimum of four weeks.
The projects should normally last three years. Special attention was to begiven to a joint planning phase to develop a framework for student visits, develop-ment of programs, language training, and credit transfer. Student mobility per seshould begin towards the second year of the project. Projects are supposed to con-tinue once the three-year financing period is finished.
Since an evaluation of this program has not already been published, it is notpossible to assess its effectiveness with regard to the intended objectives. Thefuture of this program is uncertain. At the moment of writing the paper [early 1999]there is no decision concerning the renewal of new three-year mobility program.
OECD 2000
Higher Education Management
30
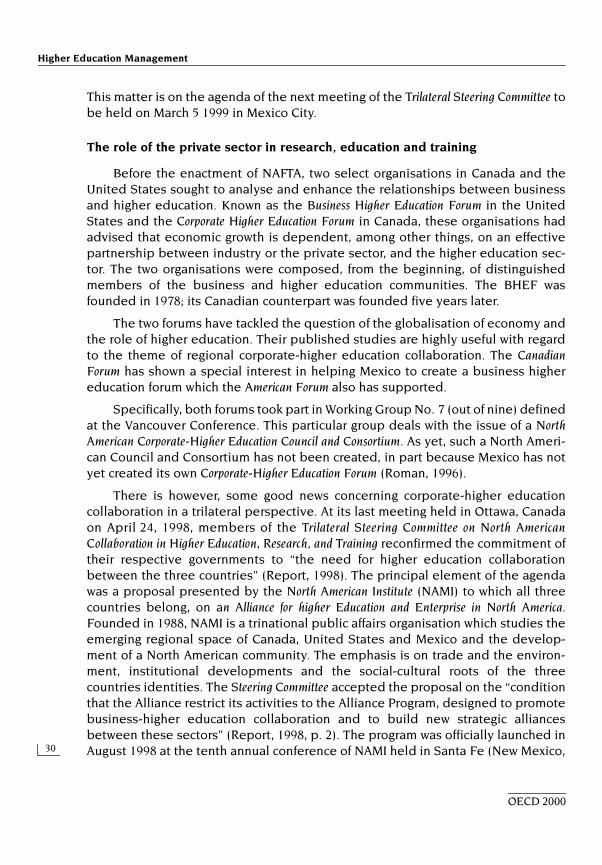
This matter is on the agenda of the next meeting of the Trilateral Steering Committee tobe held on March 5 1999 in Mexico City.
The role of the private sector in research, education and training
Before the enactment of NAFTA, two select organisations in Canada and theUnited States sought to analyse and enhance the relationships between businessand higher education. Known as the Business Higher Education Forum in the UnitedStates and the Corporate Higher Education Forum in Canada, these organisations hadadvised that economic growth is dependent, among other things, on an effectivepartnership between industry or the private sector, and the higher education sec-tor. The two organisations were composed, from the beginning, of distinguishedmembers of the business and higher education communities. The BHEF wasfounded in 1978; its Canadian counterpart was founded five years later.
The two forums have tackled the question of the globalisation of economy andthe role of higher education. Their published studies are highly useful with regardto the theme of regional corporate-higher education collaboration. The CanadianForum has shown a special interest in helping Mexico to create a business highereducation forum which the American Forum also has supported.
Specifically, both forums took part in Working Group No. 7 (out of nine) definedat the Vancouver Conference. This particular group deals with the issue of a NorthAmerican Corporate-Higher Education Council and Consortium. As yet, such a North Ameri-can Council and Consortium has not been created, in part because Mexico has notyet created its own Corporate-Higher Education Forum (Roman, 1996).
There is however, some good news concerning corporate-higher educationcollaboration in a trilateral perspective. At its last meeting held in Ottawa, Canadaon April 24, 1998, members of the Trilateral Steering Committee on North AmericanCollaboration in Higher Education, Research, and Training reconfirmed the commitment oftheir respective governments to “the need for higher education collaborationbetween the three countries” (Report, 1998). The principal element of the agendawas a proposal presented by the North American Institute (NAMI) to which all threecountries belong, on an Alliance for higher Education and Enterprise in North America.Founded in 1988, NAMI is a trinational public affairs organisation which studies theemerging regional space of Canada, United States and Mexico and the develop-ment of a North American community. The emphasis is on trade and the environ-ment, institutional developments and the social-cultural roots of the threecountries identities. The Steering Committee accepted the proposal on the “conditionthat the Alliance restrict its activities to the Alliance Program, designed to promotebusiness-higher education collaboration and to build new strategic alliancesbetween these sectors” (Report, 1998, p. 2). The program was officially launched inAugust 1998 at the tenth annual conference of NAMI held in Santa Fe (New Mexico,
OECD 2000

Managing Regional Collaboration in Higher Education
31
USA). A few pilot projects have been introduced in the form of training courses inpublic administration and banking.
The proposed funding by the respective governments is very modest. How-ever, NAMI will seek to improve the budgets through corporate donations. Canadawill contribute CAD 200 000 per year for the fiscal years 1998-1999 (News Release,21/08/98) for infrastructure and/or projects; Mexico indicated its intention of contrib-uting USD 100 000 each year for fiscal years 1999 and 2000, with funding dividedbetween infrastructure and project support; the United States would consider fundingof up to USD 60 000 on a case by case basis (Report, 1998, p. 2).
SOME BASIC DATA ON ACADEMIC RELATIONS AMONG CANADA, MEXICO, AND THE UNITED STATES
This section presents data on academic relations among Canada, Mexico, andthe United States. It is based on two reports on this matter prepared by the Associ-ation of Universities and Colleges of Canada (AUCC, 1996) and the Institute of InternationalEducation (IIE, 1997). The first report consists of a compilation of the informationregularly collected from the member universities and entered in two databases:Canadian Universities International Exchanges (CUE) and Canadian University Projects inInternational Development (CUPID).
According to the AUCC report:
“Two key findings are of particular note: First, since 1993 (compared to 1996), thenumber of academic agreements and projects between Canada and Mexicohave increased 152%, from 33 to 83. Agreements with the United States havealso increased 41%, from 68 to 97. Second, the data shows that the amount ofCanadian university agreements and projects with Mexican institutions is on parwith co-operation between Canada and the United States.” (AUCC, 1996, p. i)
With regard to the type of agreement, they do not differ significantly from coun-try to country. Most agreements are found in a broad category called “exchangeagreements” (44.3% with the United States and 47.5% with Mexico). The researchagreements are 5.7% with the United States and 2.5% with Mexico. The big imbal-ance between research agreements and other agreements should be noted.
If one considers the preferred disciplines, there are similarities betweenCanada and the United States. The preferred disciplines are found in the socialsciences, business administration and law. A second group of preferred disciplinesis formed by health and engineering.
The report by the Institute of International Education is more comprehensive thanthe one by AUCC. It consists of a survey of representatives of higher education insti-tutions and consortia in Canada, Mexico, and the United States. The questionnairewas developed by IIE in consultation with the United States Information Agency (USIA),
OECD 2000

Higher Education Management
32
the Department of Foreign Affairs and International Trade of Canada and the Secretaría deEducación Pública de Mexico.
There were 46 responses from the Canadian sub-sample, 201 from US sources,and 96 from Mexican institutions (Table 1).
Sixty-seven per cent of Canadian respondents indicated that they have hadtrilateral exchanges, compared with 23% for US respondents. Only 9% of Mexicaninstitutions reported having had trilateral exchange projects (IIE, 1997, 6).
The survey showed an increase in institutional linkages between 1990 and1997. With regard to the United States, the linkages have tripled (from 57 to 190).Canadian institutions have increased their linkage programs ten-fold (from 7 to 73).Mexican institutions reported an increase in their linkages by 30% (IIE, 1997, 1).
The report analysed responses vis-à-vis the motivating forces for linkage activities.Excluding the category “other”, “faculty contacts” was the most frequently citedcategory for all three countries. The second most frequently cited category was“request from a counterpart institution” (IIE, 1997, 9).
The IIE report contained also a chapter on evaluation of the linkages activities.According to the report:
“among those who have assessed their linkages, the comments made mostfrequently rated linkage activities as generally satisfactory, reported difficultyin motivating US students to study in Canada, and cited problems related tofunding”. (IIE, 1997, 9)
Both Canadian and US respondents ranked trilateral agreements as a lower pri-ority than bilateral arrangements because of problems related to administration(IIE, 1997, 3).
Table 1. Distribution of IIE sample by country and type of institutionPercentage
Type of institution Canada Mexico United States
Academic institutions 93.5 86.0 93.5Non profit agencies and academic consortia and membership organisations 4.3 6.0 5.0Government agencies 2.2 4.0 1.0Research institutions – 3.0 –Business organisations – 1.0 0.5Percentage – Total 100 100 100
Total (number) 46 96 201
Source: IIE, 1997.
OECD 2000

Managing Regional Collaboration in Higher Education
33
Finally, the respondents indicated that it was too early to assess their linkageprograms. Most Canadian and US responses indicated “that results of Cupertino todate were inconclusive” (IIE, 1997, 3).
THE FUTURE OF TRILATERAL LINKAGES WITHIN THE NAFTA COUNTRIES
A report was commissioned in 1997 by the Department of Foreign Affairs andInternational Trade of Canada, with the agreement of the United States and Mexico, torecommend what steps should be taken to advance the work of the Trilateral TaskForce over the next five to ten years (Roman, 1997). A survey was done in earlyspring 1997 as part of the project which yielded a respectable over-all responserate of 58%. The response rate of the three different sub-samples were: 79% forCanada, 43% for Mexico, and 47% for the United States. In total, 75 respondents (outof 130) returned a usable questionnaire: 38 from Canada, 20 from Mexico and 17from the United States. It should be noted that the initial list was very selective andwas elaborated in consultation with the relevant authorities and associations ineach country. Special efforts were made to include leaders of business, businessassociations and foundations in the survey. In fact, 44% of respondents came fromthese sectors (N=33). It was the first time that such broad business participation inan assessment of trilateral linkages was attained.
To the question: “how relevant is North American collaboration to your work?”, 75%of respondents believe that North American collaboration is either vitally or veryimportant to their work, whether in higher education, business, foundations or govern-ment. Canadians are less positive in their evaluation. Sixty-eight per cent of Canadianrespondents rated North American collaboration vitally or very important to their work,compared to 79% of Mexican respondents and a high 87% of American respondents.
Respondents were asked to rate the importance of different linkage activities.The list of linkage activities submitted was composed of the following: studentexchange, faculty development, work mobility, international curricula, distancelearning, joint R&D, standards, accreditation and community development.
The single activity to appear in the top four choices for all three countries isinternational curricula. Joint R&D appears in the top three for Canadian andMexican respondents, but not American respondents. Student exchange is the sec-ond most popular choice for Canadian and American respondents.
The survey asked respondents to answer some questions qualitatively. Amongthem, one dealt with the steps to be taken to engage businesses and foundationsmore actively in trilateral initiatives. Roman (1997) summarises the answers in fivepropositions:
– Meet business and foundation needs, and meet them on their own turf.
– Identify champions and they’ll bring in their peers.
OECD 2000

Higher Education Management
34
– Create a new trilateral structure which includes business and foundations.
– Show the value of specific projects.
– Improve the information flow.
The Steering Committee on North American Collaboration in Higher Education tested fourpotential ways to organise the trilateral initiative for the future:
A. Establish a North American Clearinghouse based on Internet activity.
B. Continue on a project by project basis working through a funding body.
C. Create a new organisation representing all stakeholders to define futuregoals and procedures, with a secretariat.
D. Explore the possibility of continuing under a NAFTA commission.
Twice as many respondents chose multiple options as chose a single option.When a single option was selected, the order of preference was B first, A and Cequal, D last. Where combinations were proposed, the preferred order was B, A, C,and D. Five respondents approved all four options. Three approved none, suggestinginstead small, clearly focused occasional meetings organised by regions or issues,or large meetings held every few years to assess and report progress toward spec-ified trilateral goals (with no indication as to how those goals would be set).
Two other options would not be endorsed by respondents nor by the author ofthe above mentioned report: declare a Task Force victory and cease the initiative anddo not restructure, expecting the three governments (Steering Committee) to continuestimulating and assessing trilateral collaboration. According to Roman (1997):
“First it is not realistic to expect governments alone to drive this initiative, espe-cially since they would require active and sustained ministerial support andsubstantial funds and staff, both of which are difficult if not impossible to comeby [...] Second, deciding not to structure further trilateral collaboration wouldremove the opportunity to capitalise on synergies as they arise.” (pp. 6-7)
Roman advocates option C which she calls “an umbrella organisation”.
“In my opinion, choosing this option would signal a firm intention to expandthe trilateral initiative beyond higher education and government, where itmainly resides at present [...] Perhaps option C is the true testing ground,then, for trilateral intentions. But it needs funding. And it needs the commit-ment of ‘champions’ from each sector who are respected by their peers andprepared to make this a priority for several years.” (Roman, 1997, p. 9)
CONCLUSION
Although the overall assessment of the North American collaboration in highereducation within NAFTA is positive, there is much need for a thorough revision ofits structure, funding and programming. The question can be bluntly formulated: Is
OECD 2000

Managing Regional Collaboration in Higher Education
35
it always necessary to have in all North American projects partners from the threecountries? Administrative problems have inclined respondents of the IIE survey torank lower in priority trilateral versus bilateral initiatives. North American collabora-tion in higher education from a trilateral perspective can also gain by improvingbilateral agreements. When one institution of a NAFTA country has exchange pro-grams with institutions of the other two countries on a bilateral basis, it may happenthat the institutions that know each other’s “way of doing business” wish to create atrilateral consortium.
The question of funding is paramount. When one compares the available fundingfor trilateral projects with other type of funding, one easily concludes that theseprojects are not ranked high in the three governments’ priority list. The funding of thenew College of the Americas, an initiative of the Inter-American Organisation for Higher Educationwhose headquarters are for five years at Université de Montréal, is a case in point.Although it exists only in principle since November 1997 and operationally sinceMay 12, 1998, the Canadian government has promised a CAD 3 million, 1 million eachyear starting fiscal year 1998-1999. Comparing this sum with the meagreCAD 1.5 million for the trilateral projects program launched in June 1995, it is evidentthat the Canadian political horizon is already continental (North, Centre, South) andnot simply “trilateral”. Besides, Canada and Chile have signed a free trade agreementand Canada is the host in two years of a Continental Conference of Heads of State andGovernments of the Americas on Free Trade. The Santiago de Chile Conference last springattended by the leadership of the Americas (with the exception of Cuba) agreed inprinciple to start negotiations towards a continental free trade zone.
A clear indication of government intentions may come from the future for theProgram for North American Mobility in Higher Education. The last year of the program was1997-1998. At the moment of writing, the intentions of the NAFTA governmentsthrough the Steering Committee are not known. It is a matter to follow.
It seems clear that there has been, in the words of the Steering Committee (meet-ing of April 24, 1998), a lull since the Guadalajara Conference in April 1996. However,the trilateral perspective is far from being une chose du passé. In effect, WICHE (theWestern Interstate Commission for Higher Education) is very active in this domain.6 It regu-larly publishes working papers on issues relevant to the NAFTA countries and spon-sors conferences and electronic information services. CONAHEC (the Consortiumfor North American Higher Education Collaboration), of which one of foundingpartners is WICHE, organised a conference in Vancouver in September 1998.7 Also,the ELNET (Educational Leadership Network) administered by CONAHEC is a website which specialises in the promotion of North American education exchange.According to a brochure of ELNET, it “allows its user to share important informationwith the goal of fostering dialogue and collaboration among Mexico, Canada, andthe United States”.
OECD 2000
Higher Education Management
36
North American collaboration in higher education is at a crossroads. It certainlyneeds a new structure that will pull together the different partner: institutions them-selves through their administrators and professors, higher education associations, gov-ernments, the business community (business and business associations), andfoundations. It certainly needs more funding from diversified sources. And, it has, mostimportantly, to redefine its mission to ride the tidal wave of continental openness.
OECD 2000

Managing Regional Collaboration in Higher Education
37
Notes
1. Revised version of a paper presented at the 10th World Congress of the World Council ofComparative Education Societies, Cape-Town, South Africa, July 12-17 1998. The authorwishes to thank Sylvie Dubé from the Ministry of Human Resources Development Canada,Jean-François Bergeron from the Ministry of Foreign Affairs and International Trade Canadaand Margo Schultz from the Western Interstate Commission for Higher Education (WICHE)for the valuable information provided. The author wishes also to thank in a very specialmanner Patricia Roman, former vice-president of Corporate Higher Education Forum(Canada) for the rich information provided and her most helpful comments and suggestionsand Shirley Humphries for her assistance with the English. Any error or inaccuracy is thesole responsibility of the author. The opinions expressed in the paper do not necessarilyreflect those of the above mentioned persons or agencies.
2. There were only two representatives from the business community as part of theCanadian delegation.
3. For a general assessment of accomplishments since the Vancouver Conference, see Mallea,Malo and Pendergrast (1998).
4. Eighty per cent of immigrants have occupations that fall in the category of occupationsregulated by the provinces.
5. Natalicio’s proposition raises some questions both in Canada and in Mexico. These twocountries would not welcome an accreditation system based in the US experience andNatalicio’s proposition may be interpreted in that sense. Nevertheless, there will be atwo day seminar at the University of Texas in June 1999 to discuss matters of mobility andaccreditation in line with Natalicio’s proposition.
6. As of February 1999, WICHE has published 8 working papers in the series: “Understandingthe Differences”. Among them, note J.I. Gill and L. Alvarez de Testa (1995) “Understand-ing the Differences: An Essay on Higher Education in Mexico and the United States” andG. de la Garde, B. Landrum and B. Fernández Samuels (1997) “Teeming up: HigherEducation – Business Partnerships and Alliances in North America” (1997).
7. The theme of the Seminar was “Vancouver Revisited: Moving to the Next Step”. Theseminar assessed the progress accomplished since the Vancouver Conference and triedto establish guidelines for future developments. There have been some significantaccomplishments since 1993 such as the North-American Mobility Programme of HigherEducation and the establishment of an electronic information base with data relevant totrilateral co-operation (ELNET). There is still much to be done, particularly with regardto the involvement of the business sector and the level of commitment of the respectivegovernments (see Mallea, Malo and Pendergrast, 1998).
OECD 2000

Higher Education Management
38
References
ASSOCIATION OF UNIVERSITIES AND COLLEGES OF CANADA (AUCC) (1996),Academic Relations among Canada, Mexico, and the United States, Ottawa, AUCC, April.
DEPARTMENT OF FOREIGN AFFAIRS AND INTERNATIONAL TRADE (1998),News Release, 21 août.
DEUPREE, J.L. (1996),“La convergencia de los mecanismos para garantizar la calidad y los instrumentos deevaluación para el desarrollo de normas académicas”, in M. Crespo and L. Yarzábal(eds.), La integración de América del Norte y la educación superior, Caracas, UNESCO/CRESALC,pp. 45-54.
GOUVERNEMENT DU CANADA (1995),Communiqué 95-37, “Programme nord-américain de mobilité dans l’enseignementsupérieur mis en œuvre en collaboration avec le Mexique et les États-Unis”, 1st June.
“Identifying the Agenda” (1992),Proceedings of the Wingspread Conference on North American Higher EducationCo-operation: Racine, Wisconsin, September 12-15.
INSTITUTE OF INTERNATIONAL EDUCATION (1997),Survey and Evaluation of North American Higher Education Co-operation, Institute of InternationalEducation, April.
MALLEA, J., MALO, S. and D. PENDERGRAST (1998),“The Vancouver Communiqué Revisited: An Assessment”, Working Paper No. 8 in theseries Understanding the Differences, Boulder, Co., WICHE.
MUNGARAY-LAGARDA, A. and SÁNCHEZ-SOLER, D. (1996),“La transferencia de cursos y títulos desde una perspectiva trilateral de la educaciónsuperior”, in M. Crespo and L. Yarzábal (eds.), La integración de América del Norte y la educaciónsuperior, Caracas, UNESCO/CRESALC, pp. 55-68.
“North American Higher Education Co-operation: Implementing the Agenda” (1993)Report of the International Symposium on Higher Education and Strategic Partnerships,Vancouver, September 10-13.
“Partners for Prosperity” – Third General Meeting on Higher Education, Research and TrainingCollaboration in North America (1996),Guadalajara, Jalisco, Mexico, April 28-30.
PRIETO, C.R. (1996),“La infraestructura educativa del TLC: una evaluación de las necessidades”, inM. Crespo and L. Yarzábal (eds.), La integración de América del Norte y la educación superior,Caracas, UNESCO/CRESALC, pp. 91-100.
OECD 2000

Managing Regional Collaboration in Higher Education
39
Report of the Meeting of the Trilateral Steering Committee on North American Collaborationin Higher Education, Research and Training (1998),Ottawa, April 24.
ROMAN, P. (1996),“Las universidades y las empresas: el respeto a las diferencias y el fortalecimiento delrendimiento”, in M. Crespo and L. Yarzábal (eds.), La integración de América del Norte y laeducación superior, Caracas, UNESCO/CRESALC, pp. 103-121.
ROMAN, P. (1997),“How to structure North American collaboration in higher education, research and trainingfor the future”, A Report Commissioned by Foreign Affairs and International Trade, Canada,April 30.
WHYTE, F.R. (1996),“La equivalencia de cursos y diplomas en el contexto de América del Norte”, inM. Crespo and L. Yarzábal (eds.), La integración de América del Norte y la educación superior,Caracas, UNESCO/CRESALC, pp. 35-44.
OECD 2000

Higher Education Management Vol. 12, No. 1
41
Institutional Funding and Managerial Differences
in Racially Dual Systems of Higher Education
G. Thomas SavWright State University, United States
ABSTRACT
Since their founding in the United States under a racially dual system, publiccolleges and universities serving predominantly blacks’ higher education needshave experienced funding and financial circumstances that differ from highereducation institutions serving predominantly white populations. Past fundingdisparities have thrust different managerial pressures on college and universitydecision-makers with regard to the internal allocation of institutional resources.These historically black colleges and universities continue to provide uniquehigher educational opportunities for blacks, but their survival has continuedamidst ongoing questions of whether or not they have been placed on equal financialfooting with their publicly supported and still predominantly white sister institutions.The present article presents analyses addressing the extent to which differencesin external funding sources and internal allocations of resources arising frommanagerial decision-makers persist between these historically black and whiteinstitutions of higher education and considers potential future implications aschanges in funding patterns sit on the near term horizon.
In the United States, a racially segregated system of higher education emergedin the 1860s soon after the Civil War. Southern states and some of their borderingneighbor states utilized land grant endowments for funding the formation of publiccolleges and universities to serve blacks’ higher education needs separately fromwhites. In 1890, the racially dual system that was well underway was given legal sanc-tion under the auspices of “separate-but-equal”, where the courts stipulated the lat-ter as equality in funding. However, the dual system of higher education that aroseunder de jure segregation was found to be anything but financially equal in funding,hence educational opportunities. Even following the many legal challenges toinequality that produced the Brown vs. Brown (1954) Supreme Court ruling that
OECD 2000

Higher Education Management
42
“Separate education facilities are inherently unequal”, the Civil Rights Act of 1964,and the corresponding mandates to desegregate education, de facto segregationpersisted in the provision of public higher education throughout the southern states.1
Throughout the 1970s and well into 1980s legal challenges continued to pres-sure violating states to comply with desegregation mandates and to put their pre-dominantly black and predominantly white colleges and universities on equal fiscalfooting. Even as recently as 1996, the US Department of Education threatened toreopen a discrimination lawsuit when it was rumored that the state of Ohio pro-posed closing its only public historically black university amidst financial difficulty.
These now historically black colleges and universities continue to survive andprovide unique higher educational opportunities for blacks. Their survival, however,has continued in an environment of disparate funding circumstances that has addi-tionally placed managerial pressures on college and university decision-makers thatsignificantly differ from their counterpart institutions serving predominantly whitepopulations. Indeed, questions still arise as to whether or not and to what extentthese historically black colleges and universities stand on equal financial footing withtheir public supported and still predominantly white sister institutions.
It is the purpose of this article to explore those questions from a number offinancial perspectives, including differences between publicly supported histori-cally black and predominantly white colleges and universities with regard toalternative financial resources and the resulting impacts such finances carry for dif-ferences in managerial decision-making with respect to the internal allocation ofuniversity resources.
INSTITUTIONAL DATA AND METHODOLOGY
In attempting to study the institutional funding and managerial differences ofhigher education institutions, the availability of data, as with all empirical work, isthe constraining factor. For this study, data were obtained from the United StatesDepartment of Education, National Center for Education Statistics, Integrated Post-secondary Education Data System (IPEDS). Raw IPEDS data for individual institu-tions of higher education as related to institutional characteristics, funding,expenditures, and faculty status and salaries were used from the 1995 FinanceSurvey,2 1994-95 Salary Survey,3 and the Institutional Characteristics Surveys for1994-95, 1995-96, and 1996-97.4 In this case, the period of study was constrained byNCES’s most recent final release of the 1995 Finance Survey which pertains tothe1994-95 academic year.
For the 1994-95 academic year, a complete profile for individual institutionalfinances, faculty status and salaries, and characteristics was constructed by mergingthe 1994-95 finance, salary, and institutional characteristics raw data. The mergeddata set resulted in more than three thousand postsecondary institutions accredited
OECD 2000

Institutional Funding and Managerial Differences in Racially Dual Systems of Higher Education
43
at the collegiate level, including 103 historically black colleges and universities.This data set was culled so as to focus on publicly controlled, state supported, four-year degree and above, historically black institutions and their predominantlywhite counterparts. Thus, privately controlled and two-year degree granting institu-tions were excluded. In addition, publicly controlled specialized institutions suchas medical colleges, textile centers, and health sciences institutes were excluded.The entire culling process produced a final data set comprised of 31 public four-year historically black colleges and universities and 176 of their predominantlywhite counterparts grouped accordingly over 14 different states.
The data set presents a rich opportunity to measure the extent to which thereexists intrastate differences in the dependency on various revenue sources, gov-ernmental funding, and the internal allocation of resources among historically blackcompared to predominantly white institutions of higher education.
With respect to overall funding, sources of current funds revenue were com-puted for individual institutions and then averaged across each historically blackcollege and university group and predominantly white college and university groupwithin a state.
To capture differences in the internal allocation of resources, the same compu-tations were performed with respect to education and general institutional expen-ditures, including instruction, research, and administration. Here, an attempt wasmade to focus as best as possible on the internal decision-making process in allo-cating resources within the institution based upon discretionary sources of funding,i.e. based upon revenues generated by the institution. Thus, excluded from theexpenditure profile of institutions were restricted expenditures for scholarshipsand fellowships allocated by sources external to the institution, e.g. Federal PellGrants. Unfortunately, the data precluded the same dichotomy when examininginstitutional research expenditures. Thus, research expenditures include bothexternally generated research funding as well as internally sponsored research. Tocompute a measure of the internal allocation of resources to administrative func-tions, the NCES’s definition of administrative expenditures was employed. TheNCES defines “administration” as expenditures on academic support and institu-tional support excluding library expenditures.
In developing measures of institutional labor costs and the allocation of laborcosts to different institutional functions, two separate IPEDS surveys were utilized.First, the finance survey was used for determining the total institutional labor costsand the proportion of total educational and general expenditures allocated tolabor. Second, the faculty survey was used to disaggregate full-time faculty salarycompensation from total labor costs so as to get an overall measure of facultyresource utilization.
OECD 2000

Higher Education Management
44
ANALYSIS
While the primary focus is on intrastate differences in the funding and internalresource allocation decisions between historically black and predominantly whiteinstitutions of higher education, the results also reveal significant interstate differ-ences within each group that are critical to the analysis.
External funding
Table 1 presents the results of the decomposition of revenue sources by insti-tutional type within each state. Institutional revenues from a particular source arecomputed as a percentage of total current funds revenue, excluding revenuesderived from hospitals. While all revenue sources are not accounted for, among his-torically black institutions, tuition, state appropriations, federal grants, and salescapture a minimum of 90% and a maximum of 98% of total revenues. Among pre-dominantly white institutions, the range is 88% to 95%.
Table 1. Revenue sources as a percentage of total revenue
Historically black institutions Predominantly white institutions
State TuitionState
appropri-ations
Federal grants
Sales TuitionState
appropri-ations
Federal grants
Sales
% % % % % % % %
Alabama 20 42 20 13 24 41 12 16
Arkansas 17 38 30 9 22 43 13 16
Delaware 23 43 16 16 38 19 9 22
Florida 19 41 21 9 16 49 12 14
Georgia 15 39 24 15 22 46 9 15
Louisiana 23 33 26 15 30 36 12 16
Maryland 25 39 16 15 30 38 6 21
Mississippi 18 35 28 17 21 39 13 19
N. Carolina 12 51 17 17 13 46 9 27
Pennsylvania 23 43 15 14 45 30 7 13
S. Carolina 19 36 23 20 32 35 9 17
Tennessee 21 39 25 12 20 48 9 15
Texas 18 38 26 13 22 47 10 14
Virginia 25 29 19 21 27 29 8 25
Mean 19 40 21 15 28 39 9 16
Source: Computed by author based on data from the United States Department of Education National Center forEducation Statistics, Integrated Postsecondary Education Data System, Finance Survey, FY 1995.
OECD 2000

Institutional Funding and Managerial Differences in Racially Dual Systems of Higher Education
45
Here, tuition revenue includes tuition and fees assessed against students.State government appropriations include revenue received by the institutionthrough acts of legislation, but excludes state grants and contracts. Grants and con-tracts received from federal agencies for research and training programs areincluded in the revenue source identified as federal grants in Table 1. Sales reve-nue is a more comprehensive source of revenue. In this study, it is computed as thesum of revenues generated from four sources, including: sales of educational ser-vices and goods such as testing services and university presses; auxiliary enterpriserevenues such as residence halls and intercollegiate athletics; revenues from inde-pendent operations such as research and development centers; and revenues frommiscellaneous sources.
As indicated in Table 1, the dependency on various revenue sources varies sig-nificantly from state to state for both historically black institutions and predomi-nantly white institutions. However, as a group, historically black compared topredominantly white institutions are much less dependent on tuition as a source ofrevenue. That is, on average, tuition charges comprise only 19% of total revenuesfor public historically black institutions compared to 28% for public predominantlywhite institutions. But, both the inter- and intrastate variations are significant.
North Carolina institutions are consistently much less subject to tuition marketforces. This holds regardless of whether they are historically black institutions gath-ering 12% of revenues from tuition or predominantly white institutions gathering13% of revenues from tuition. In contrast, the typical historically black institutionoperating in either Maryland or Virginia must acquire 25% of revenues from tuition.And although their predominantly white sister institutions are even worse-off in thissense (30% and 27%, respectively), they do not reside among institutions in thehighest tuition dependency state. For predominantly white institutions, that isreserved for those operating in Pennsylvania where 45% of revenue funds must bederived from tuition.
Overall, on an intrastate basis, historically black colleges and universities relativeto predominantly white institutions demonstrate less dependency on tuition revenue.The only exceptions are Florida and Tennessee, where historically black institu-tions rely slightly more on tuition revenue with a white-black group differential of–3% and –1%, respectively.5 At the other extreme, the largest positive white-blackgroup differentials exist in Tennessee (22%), Delaware (15%) and South Carolina (13%).
Of course, in the public sector, higher education revenues not collected fromtuition charges levied upon the direct beneficiaries of education are generatedfrom the indirect beneficiaries through the tax mechanism. Generally, these subsi-dies in the form of state appropriations have provided the largest source of revenuefor public colleges and universities. In this case, the present groups of institutionsare no different. In fact, the results presented in Table 1 show that in the aggregate,
OECD 2000

Higher Education Management
46
historically black institutions are at par with predominantly white institutions withrespect to their relative dependency on state provided monies, i.e. 40% vs. 39% oftotal revenues. However, again there exists wide inter and intrastate variations.
As expected, with a low institutional dependency on tuition revenues, NorthCarolina is a public subsidy friendly state, providing 51% of the total revenue sourcefor the typical historically black institution. This in comparison to Virginia, wherestate appropriations account for only 29% of historically black institutional reve-nues. Yet, in this respect, Virginia’s historically black institutions are on equal stateappropriations footing with predominantly white institutions so that the white-black group differential vanishes. Such is not the case in other states. For example,historically black institutions in Delaware and Pennsylvania receive proportionallymore state appropriations in the form of revenue sources and produce white-blackgroup differentials of 24% and 13%, respectively. The reverse holds true in Tennes-see and Texas, where the white-black differential is 9%, hence favoring predomi-nantly white institutions in state appropriations.
A different funding pattern emerges on the federal government side. In theaggregate, historically black institutions receive 21% of their revenues from federalgrants. predominantly white institutions receive only 9%. Unlike the variations inthe state appropriations differential, the white-black differentials on federal grantsare negative in each state, but range from –7% in Delaware to –16% in both Tennesseeand Texas. Moreover, historically black institutions residing in states that receiverelatively greater proportions of revenues from federal grants compared to theirpredominantly white counterparts tend to be on the shorter funding end withrespect to state funding appropriations. That is, positive white-black state fundingdifferentials tend to be offset by negative federal funding differentials. To someextent this supports the notion that there is a degree of substitution of state forfederal funding.
The final and smallest revenue source of all higher education institutions isderived from sales of educational, auxiliary, and other enterprises. As a proportionof total revenues, historically black and predominantly white institutions are, in theaggregate, essentially equal (15% vs. 16%) with regard to their relative ability to gen-erate revenues from sales. In fact, the intrastate variations in the dependency onsales revenue are the smallest of all revenue sources. With the exception of NorthCarolina’s predominantly white compared to historically black institutions ability togenerate 10% more revenue from sales, the white-black differential ranges from –3%in South Carolina to 7% in Arkansas. In addition, while not insignificant to the oper-ation of any individual institution within a group, these revenue differentials can beattributed to institutional differences in residence hall capacity, the existence ofresearch centers, and the mix of intercollegiate athletics, among other less measurableoperations.
OECD 2000

Institutional Funding and Managerial Differences in Racially Dual Systems of Higher Education
47
Internal resource allocation
Table 2 presents the results of the institutional decision-making regarding theinternal allocation of resources as captured in the decomposition of expenditure func-tions within each state. Expenditures on institutional functions are computed as a per-centage of total educational and general expenditures. As with revenue sources, not allexpenditures are accounted for. Rather, the focus here is on the internal allocation ofresources to instruction, research, and administration. When combined, these threeexpenditure components capture, on average, 72% of total institutional expendituresamong historically black institutions and 71% of total expenditures among predomi-nantly white institutions. The remaining proportion of expenditures excluded from theanalysis is allocated to functional areas such as public service, maintenance, and stu-dent services. Expenditures within each of the three included, as well as excluded,functional areas, contain both non-labor and labor costs. In order to explore possibledifferences in the labor intensity of institutional expenditures, the salary and wage sub-components of expenditures across all functional areas are aggregated and reportedseparately in Table 2 as the labor cost proportion of total expenditures.
Table 2. Expenditure allocations as a percentage of total institutional expenditures
Historically black institutions Predominantly white institutions
State Instruction Research Admin. Labor Instruction Research Admin. Labor
% % % % % % % %
Alabama 31 9 26 51 41 8 17 57
Arkansas 37 17 22 59 44 6 16 57
Delaware 43 7 21 53 46 12 12 52
Florida 38 15 22 55 41 16 19 53
Georgia 40 4 29 54 49 7 20 57
Louisiana 45 5 27 61 50 7 17 60
Maryland 38 9 25 49 43 7 19 59
Mississippi 39 7 19 52 37 12 18 53
N. Carolina 45 5 24 62 46 8 16 60
Pennsylvania 43 0 22 51 45 2 23 57
S. Carolina 41 7 22 61 42 5 16 58
Tennessee 45 9 15 58 50 8 14 61
Texas 41 9 21 54 46 7 18 53
Virginia 39 6 23 54 47 8 19 61
Mean 41 7 24 55 45 7 19 57
Source: Computed by author based on data from the United States Department of Education, National Center forEducation Statistics, Integrated Postsecondary Education Data System, Finance Survey FY 1995 and Salaries,Tenure, and Fringe Benefits of Full-Time Instructional, Faculty Survey 1994-95.
OECD 2000

Higher Education Management
48
With respect to the internal allocation of resources, historically black comparedto predominantly white institutions on average spend proportionately less oninstruction (41% vs. 45%), the same on research (7%), and more on administration(24% vs. 19%). As a group, their total labor cost as a proportion of expenditures aresomewhat lower than that of predominantly white institutions (55% vs. 57%).
Compared to these group averages, there exists much wider interstate andintrastate expenditure variations among both types of institutions. For example,among historically black institutions, instructional expenditures range from a low of31% of total expenditures in Alabama to a high of 45% in Louisiana, North Carolina,and Tennessee. Similarly, among predominantly white institutions the range is from37% in Mississippi to 50% in Louisiana and Tennessee.
Institutions that allocate the most resources to instruction tend to reside in thesame state regardless of whether they are historically black or predominantly whiteinstitutions. Louisiana and Tennessee are tied at the top on this account. However,the reverse does not hold for institutions allocating the fewest resources to instruc-tion. For example, Alabama holds the lowest instructional expenditure allocationamong historically black institutions but not among predominantly white institutions.
Comparisons across all states show that, with the exception of Mississippi, his-torically black compared to predominantly white institutions allocate proportionatelyless to instruction. The largest white-black differential with respect in instructionalexpenditures is 10% and exists in Alabama. The only negative white-black differentialis fairly small at –2% and exists in Mississippi.
In the areas of institutional research and administration, the same magnitudes ofvariation persist on an interstate basis. In the historically black institution group, theproportion of expenditures flowing to research ranges from none in Pennsylvania to17% in Arkansas. This is nearly matched in the predominantly white institution groupwith a low of 2% in Pennsylvania and a high of 16% in Florida. Thus, on this measure,Pennsylvania is the lowest priority research state among both groups of publicinstitutions. However, the intrastate research expenditure differences are mixed. Thewhite-black differential is negative in six states and positive in eight states –accounting for a mean intrastate difference of zero between all historically black andall predominantly white institutions.
In contrast to research, the relatively larger proportion of resources devoted toadministrative functions exhibits wider interstate variations among historicallyblack institutions (15% in Tennessee to 29% in Georgia) compared to predominantlywhite institutions (16% in Arkansas to 23% in Pennsylvania). Also, on an intrastatebasis, in all states except Pennsylvania, historically black institutions allocate agreater proportion of institutional expenditures to administration. The largest dif-ferential is 10% in Louisiana.
OECD 2000

Institutional Funding and Managerial Differences in Racially Dual Systems of Higher Education
49
Higher education is relatively labor intensive and about equally so among his-torically black and predominantly white institutions in that the total labor cost as aproportion of annual expenditure is 55% and 57%, respectively. One would gener-ally expect that institutions allocating greater resources to instruction and henceincurring higher instructional expenditures to be higher labor cost institutions. Theproposition is generally supported by the results presented in Table 2 for bothgroups of institutions. For example, within the historically black group, the highlabor cost institutions in North Carolina are among the high instructional expendi-ture institutions. Likewise, within the predominantly white group, Tennessee insti-tutions are simultaneously among the most labor cost intensive and highestinstructional expenditure institutions. However, in this case the intrastate differen-tials between the two groups of institutions are equally divided, i.e. the white-blacklabor cost differential is positive in seven states and negative in seven states. Theoutlying labor cost differential occurs in Maryland where predominantly whiteinstitutions outstrip historically black institutions by a full 10%.
Faculty compensation
Although higher education is relatively labor intensive and higher labor coststend to derive from higher instructional costs, it does not follow that faculty are allo-cated or capture the majority of labor costs in the form of salary compensation. Infact, the results presented in Table 3 support the contrary. Whereas the instruc-tional expenditure focus of Table 2 included both non-labor and labor costs associ-ated with all institutional labor, Table 3 presents only the full-time faculty salaryallocation as a percentage of the total institutional labor costs. For additional com-parative purposes, the mean full-time faculty salary is also derived along with fac-ulty salary per annual credit hour production. The latter attempts to control forteaching workload differentials of faculty across institutions.
Indeed, full-time faculty salaries comprise well less than half of higher educa-tion labor costs. On average, among historically black institutions, full-time facultiesreceive 38% of the total labor cost outlays. It is slightly higher at 40% among predom-inantly white institutions. This difference is also reflected in the USD 3 635 white-black mean salary differential and to a lesser extent in the USD 2 white-black fac-ulty salary per credit hour produced. Here again, large variations exist with respectto interstate differences within each institution group and with respect to intrastatedifferences between groups.
Within the historically black institution group, full-time faculty salaries as aproportion of total labor costs vary from a low of 30% in Florida to a high of 43% inGeorgia. That variation is nearly the same among predominantly white institutionswith Delaware at 32% and Arkansas at 46%. However, the mean salary variations aremuch larger, ranging from USD 36 362 to USD 48 222 within the historically black
OECD 2000

Higher Education Management
50
group and USD 37 966 to USD 58 664 within the predominantly white group of insti-tutions. Interestingly enough, high mean faculty salaries do not necessarily producehigh faculty salary allocations as a proportion of total labor costs. Witness, for exam-ple, that among predominantly white institutions, Delaware has the highest meansalary and the lowest percentage of faculty salary relative to total labor costs. This,of course, is consistent with the results presented above and in Table 2 whereDelaware’s predominantly white institutions produce the lowest labor costs as aproportion of total institutional expenditures.
On the other hand, the lowest faculty salaries tend to be accompanied by thehighest faculty teaching workloads and vice versa. Louisiana’s historically blackinstitutions have the lowest mean faculty salary (USD 36 362) and the lowest meanfaculty salary per credit hour (USD 41) produced. At Pennsylvania’s historicallyblack institutions, where there is the highest mean faculty salary (USD 48 222), fac-ulty receive more than two and a half times the faculty salary per credit hour(USD 110) than at Louisiana. Among predominantly white institutions, the highest
Table 3. Full-time faculty salary allocations
Historically black institutions Predominantly white institutions
State Salary as % of total labor
cost
Mean faculty salary
Salary per credit hour produced
Salary as % of total labor
cost
Mean faculty salary
Salary per credit hour produced
% $ $ % $ $
Alabama 35 36 967 54 35 45 304 50
Arkansas 40 37 214 72 46 41 285 67
Delaware 37 41 970 84 32 58 664 93
Florida 30 45 503 65 34 48 777 67
Georgia 43 42 226 45 43 44 632 42
Louisiana 36 36 362 41 44 37 966 51
Maryland 38 43 974 64 39 49 708 85
Mississippi 37 37 799 59 37 44 816 78
N. Carolina 39 45 614 81 37 48 343 85
Pennsylvania 39 48 222 110 41 47 304 76
S. Carolina 38 37 664 72 39 42 574 65
Tennessee 33 44 184 62 35 48 727 78
Texas 32 42 406 51 41 43 260 57
Virginia 41 43 189 63 40 48 494 83
Mean 38 41 975 65 40 45 610 67
Source: Computed by author based on data from the United States Department of Education, National Center forEducation Statistics, Integrated Postsecondary Education Data System, Finance Survey FY 1995, Salaries,Tenure and Fringe Benefits of Full-Time Instructional Faculty Survey 1994-95 and Institutional CharacteristicsSurvey 1994-95 and 1996-97.
OECD 2000

Institutional Funding and Managerial Differences in Racially Dual Systems of Higher Education
51
mean salary at Delaware is also accompanied by the highest salary per credit hourproduced.
In the aggregate and in ten of the fourteen states, predominantly white institu-tions allocate a greater proportion of labor costs to full-time faculty salaries. More-over, in all fourteen states, faculty salaries at predominantly white institutionsexceed that of historically black institutions. That white-black intrastate salary dif-ferential ranges from a low of USD 854 in Texas to a high of USD 16 694 in Delaware.But the intrastate differentials in faculty salary per credit hour produced are moremixed. In five states, predominantly white institutions have higher faculty salariesper credit hour produced. Maryland’s white-black differential of USD 85 vs.USD 64 salary per credit hour is the largest. Yet, in nine states, the salary per credithour differential favors historically black institutions. The most favorable differen-tial exists in Pennsylvania where the historically black institution salary per credithour is USD 110 compared to USD 76 among the predominantly white institutions.
CONCLUSIONS AND FUTURE POLICY IMPLICATIONS
The primary focus of this paper has been to empirically explore the possibleextent of funding differences between publicly supported historically black col-leges and universities and their predominantly white counterparts in those stateswithin the United States where racially dual systems arose a century ago and wherepresently historically black higher education institutions continue to provideunique educational opportunities for blacks. Overall, the analyses support the gen-eral proposition that there exist significant differences in the funding and subse-quently the internal resource allocation decision-making between these twogroups of institutions. Those differences carry potentially important managerial andpublic policy implications at both the institutional level and at the federal and stategovernment levels.
In the public sector of higher education, state and federal government subsi-dies and grants as opposed to direct tuition charges provide the largest source ofoperating revenues for colleges and universities. In the aggregate, this holds forboth historically black and predominantly white institutions. However, when ana-lyzed on a state-by-state basis, in several states the state funding mechanismtended to favor predominantly white institutions over historically black institu-tions. Simultaneously, however, federal funds flowing to historically black institu-tions compensated for the differential. In general, this revealed a tendency for thesubstitution of federal for state funding and somewhat relieved historically blackinstitutions relative to predominantly white institutions from a dependency ontuition charges to students.
Yet, the future may hold in store a different pattern of funding for publiccolleges and universities. While recent years have already witnessed a decrease in
OECD 2000

Higher Education Management
52
federal funds flowing to public institutions, projections suggest that this trend willcontinue at an accelerated rate. At the same time, state policy makers have beenon the heels of public institutions continuously raising questions of accountabilitywith regard to the use of state funding support and have threatened, if not startedto implement, cuts in such support. Given the heavy reliance on both sources offunding, any future declines carry important policy implications for the manage-ment of both historically black and predominantly white public higher educationinstitutions. However, based on the analyses presented in this paper, the burdenof these changes in funding patterns will not fall equally on these two groups ofinstitutions.
In fact, because historically black colleges and universities are, without exception,more heavily dependent upon federal funding, the managerial pressures to deriverevenues from alternative sources will be greater. In the absence of greater statefunding to offset the evaporation of federal funds, historically black relative to pre-dominantly white institutions will likely have to seek disproportionally greaterincreases in tuition charges and revenues. That alone will place historically blackinstitutions in a less competitive position compared to now. In addition, becausethese institutions have historically provided unique educational opportunities andhigher education access to blacks, this suggests that as a group blacks will bear agreater societal burden of these changing funding patterns in the future.
What impact these potential changes may have on institutional decision-making regarding the internal allocation of resources is yet another uncertainty butlikely to be a real managerial task facing all colleges and universities. Again, basedon the results presented herein, the managerial tasks and decisions will differ forhistorically black compared to predominantly white colleges and universities.Although both groups of institutions are labor intensive, with labor costs consumingapproximately 56% of total costs, historically black colleges and universities spendproportionately less on instruction and more on administration. Tighter externalfunding constraints may require across the board budget cuts in both expenditurecomponents, while faculty salaries at historically black institutions are alreadysignificantly lower than at their predominantly white counterparts. Moreover, anyattempt to lower per unit costs is also disproportionately more burdensome forhistorically black institutions where, as measured in this paper, the lower facultysalaries tend to be associated with higher teaching loads.
Additional legal implications are also potentially generated by both the cur-rent funding differentials as well as by the future policy implications of changingfunding patterns. In most instances it was the continuous legal challenges of thepast decades that pressured states to comply with desegregation mandates andmove their historically black institutions toward equality of funding with their pre-dominantly white institutions. Along these lines, the analyses presented in thispaper revealed that the better financial status of historically black institutions in a
OECD 2000

Institutional Funding and Managerial Differences in Racially Dual Systems of Higher Education
53
few states tended to mask the disparate funding footing of historically black insti-tutions in many other states. However, whether or not such funding differentials aresufficient to continue such legal challenges is certainly beyond the scope of thispaper and is better left to the courts. On the other hand, as pointed out above,forced changes in funding patterns that may be on the near term horizon couldpotentially disrupt the current legally perceived or determined equality of fundingand give rise to a resurgence of legal oversight to assure compliance with past man-dates to achieve funding equalities.
In summary, as a cautionary note this paper cannot claim to produce definitiveevidence regarding the existence of either inequality or equality of fundingbetween historically black and predominantly white institutions of higher educa-tion. There are widely mixed results that could, in part, arise from fiscal discrimina-tion in the apportionment of public monies or, in part, from differences ininstitutional missions and particularly the uniqueness of the missions of historicallyblack colleges and universities. Improved data collection methods and subse-quently additional research could build upon and shed additional light on theresults and policy implications presented in this paper.
OECD 2000

Higher Education Management
54
Notes
1. An extensive review of the historical and legal development of historical black collegesand universities and the dual system of higher education is provided in Sol Cohen,Education in the United States: A Documentary History (New York, Random House, 1974);United States Commission on Civil Rights, Black-White Colleges: Dismantling the Dual Systemof Higher Education (Clearing House Publication 66, April 1981); Antoine Garibaldi, BlackColleges and Universities (New York, Prager, 1984) and Carnegie Commission on HigherEducation, From Isolation to Mainstream: Problems of the Colleges Founded for Negroes (New York,McGraw-Hill, February 1971).
2. United States Department of Education, National Center for Education Statistics, IntegratedPostsecondary Education Data System, Finance Survey FY 1995 (Washington, DC).
3. United States Department of Education, National Center for Education Statistics, IntegratedPostsecondary Education Data System, Salaries, Tenure, and Fringe Benefits of Full-Time InstructionalFaculty Survey 1994-95 (Washington, DC).
4. United States Department of Education, National Center for Education Statistics, IntegratedPostsecondary Education Data System, Institutional Characteristics Survey 1994-95, 19968-97(Washington, DC).
5. The white-black group differentials are the intrastate differences in the percentage revenuedependencies between historically black and predominantly white institutions. Insteadof percentage point differences, this convention is used for convenience in reference tothe statistical results and is employed throughout the paper.
OECD 2000

Higher Education Management Vol. 12, No. 1
55
UK Higher Education:Competitive Forces in the 21st Century
G.C. WebberNapier University, United Kingdom
ABSTRACT
This article considers UK higher education as a competitive business in the contextof Michael Porter’s work on the forces governing competition, focusing mainly butnot exclusively on teaching. It identifies some of the critical factors that have influ-enced the balance of competitive forces in recent times, and identifies ways in whichthat balance is likely to change over the next couple of decades. Finally, it considerssome of the implications that these developments may have for existing universities,and identifies grounds for optimism as well as reasons for concern.
PORTER’S FIVE FORCES
Michael Porter argues that the nature and degree of competition in any busi-ness sector can usefully be considered in relation to five major forces whichbetween them determine the underlying attractiveness or profitability of the indus-try concerned (Porter, 1980). These five forces are: i) the jockeying for position andresources among existing competitors; ii) the power of buyers in the marketplace;iii) the power of suppliers; iv) the threats which can arise from the emergence of sub-stitute products and services; and v) the strength of the barriers which keep outpotential new entrants. Porter identifies the principal barriers to entry as: estab-lished cost advantages, including economies of scale; strong product differentia-tion and brand identification; the need for significant up-front capital investment;access to distribution channels; and the influence of government policy.
Porter believes that organisations need to understand the competitive dynam-ics established by the interaction of these forces in order to position themselves insuch a way that they minimise their vulnerability to attack and maximise theirchances of success. This at least involves building sustainable competitive advan-tages which are difficult for competitors to replicate. In addition, Porter and others
OECD 2000

Higher Education Management
56
(e.g. Prahalad and Hamel, 1994) suggest that organisations can improve their posi-tion by actively influencing the structure of the industry itself. Indeed, not only thestructure, but the very definition of the industry to which one might apply Porter’smodel is ultimately a variable, since the coincidence of major change across severalcompetitive forces can create points of flux from which new conceptions of the busi-ness itself may arise.
In the context of Porter’s model, this article contends that competition amonghigher education providers in the United Kingdom has been relatively tame overthe past few decades but that a number of forces are now at work which threaten todestabilise this balance. It seems possible that the UK higher education marketmay even be approaching a point of transformation, and not just another period ofinevitable change.
LOOKING BACK
For most of the past fifty years, UK universities have operated in a surprisinglystable and protected competitive environment, notwithstanding perceptions tothe contrary among many of those working in the sector.
In the first place, the competition for market share and resources has beenrelatively mild. UK universities have benefited from long-term growth in studentnumbers, albeit sporadic, and in total income, albeit from increasingly diversesources (USR/HESA annual statistics; Shattock, 1996; Williams, 1992). The studentmarket in particular has grown strongly since the end of the 2nd World War, andhead-to-head competition between providers has consequently been muted. In1946 there were 16 recognised universities in the United Kingdom educating28 000 full-time students. By 1996 there were 115 universities plus 61 other highereducation institutions (HEIs) educating more than 1.6 million students, includingabout half a million part-time students (Shattock, 1996; Dearing, 1997). During thosefifty years, the full-time student population alone grew by a factor of forty: the totalnumber of universities grew by a factor of less than ten. Room enough for everyone.
Secondly, UK universities have enjoyed the support and protection of thestate, as well as suffering the related burden of state regulation. The state has, ofcourse, guarded the power to award degrees and controlled the use of titles, whichhas created significant barriers to entry (and exit, as it happens). More subtly, butno less importantly, the state and its agencies have also constrained access to pub-lic funding both for institutions themselves and for students. Only defined activitiesand until recent years only designated institutions have been eligible for publicsupport. Governments have also allowed universities a preferential (charitable) taxstatus and provided implicit financial guarantees in that failing institutions have notbeen allowed to go bankrupt, even though some have been forced to endure major
OECD 2000

UK Higher Education: Competitive Forces in the 21st Century
57
surgery. All of these factors have put potential for-profit competitors at a significantfinancial disadvantage.
Thirdly, the sector has at least until recently operated quite effectively as akind of cartel, for example with respect to self-regulating quality control mecha-nisms, self-imposed constraints upon the promotion of and recruitment to under-graduate courses, the mutual recognition of credits and qualifications, and themaintenance of the principle, which most respect but few seem to believe, that theawards granted by all universities have equivalent educational value. Quite apartfrom the financial constraints imposed by the state, these factors have helped toensure a very gentlemanly form of competition for students, and more-or-less erad-icated price competition in the domestic market, with the obvious but not exclusiveexception of the MBA.
Fourth, consumer power has been limited by the dominant position of the stateas a purchaser of services, paying fees on behalf of the majority of undergraduates,and a fair proportion of postgraduates too. The role of the National Union of Students(NUS) as a representational body has further reinforced the trend towards corporat-ism rather than consumerism in higher education. In conjunction with the otherfactors identified above, this has created a market that has been heavily producer-led and fairly homogeneous. Most HEIs have been teaching similar things to similarstudents in similar ways. Leaving aside the Open University, product differentiationhas not featured very strongly in the post-war development of UK higher education,at least with respect to the undergraduate curriculum. And although it might beargued that there has been greater differentiation at the postgraduate level, this ismainly because postgraduate courses have tended to reflect the interests of produc-ers (academics) even more strongly than most undergraduate courses, not becausethey have been designed specifically to address consumer-led demand. For the mostpart, institutions have therefore tended to differentiate themselves mainly by repu-tation and location rather than content, delivery or service.
Finally, the high costs of capital investment and the extraordinary inflexibilityof university cost-structures have tended to create further barriers to entry. Inrecent times, universities and other HEIs have been characterised by a substantialcadre of academic staff on contracts that have made the cost of teaching at best asemi-variable, and by the ownership of land and buildings, usually including anelement of residential accommodation, required to create a traditional campusenvironment. Both of these factors have tended to deter commercial interest inhigher education by creating an unusual labour market, requiring significant invest-ment capital, and demanding relatively high levels of activity just in order torecover costs. Even in the special case of the Open University (OU) which has rela-tively few core academic staff and a limited physical estate, the barriers faced bypotential new entrants have been high because the OU has been provided with
OECD 2000
Higher Education Management
58
preferential access to state-funded broadcast facilities which have made it difficultfor others to offer credible substitutes at comparable cost or quality.
In the context of Porter’s model, the nature of competition among higher edu-cation providers in the United Kingdom since 1945 can thus be explained as a resultof three key factors. First, high barriers to entry have been maintained by the stateas a dominant purchaser, by the sector operating as a cartel, and by the underlyingeconomics of the business as traditionally understood. Secondly, individual stu-dents have until recently exercised little power because most of them have beenand have regarded themselves as being consumers without being customers (indi-vidual purchasers). Hence the power of higher education buyers has been limited,or at least transformed into another form of state power, which has reinforced thestatus quo. Finally, long-term growth in the student market, coupled with limitedprice competition, again reinforced by the influence of the state and the ability ofthe sector to operate as a cartel, have tended to ensure that the jockeying for posi-tion among UK universities has been restrained.
LOOKING FORWARD
The next few decades will be very different. Some of the protective monopo-lies maintained by the state are starting to weaken; the relationships between uni-versities and their students are becoming more overtly commercial; the numberand range of existing providers has already increased to the point where the highereducation cartel is fragmenting; future growth in the student market seems likely tobe strongest in new market segments that existing universities may be poorly posi-tioned to address; and technological change is enabling new entrants to challengethe traditional economics of higher education provision and to offer substituteproducts via new distribution channels.
HEIs are already starting to operate in a more competitive and diverse envi-ronment. The Dearing compact which acknowledges the state only as one of threefunding partners has reinforced the trend that is evident around the world, and notjust in the United Kingdom, to reduce government subsidies for higher education,at least as a proportion of the total cost. Conversely, and just as importantly, it hasaccelerated the transfer of costs and therefore power to the consumers of highereducation, including but not limited to the majority of UK undergraduate students.Students and other purchasers of the services provided by HEIs, including industry,commerce and the medical charities who fund a large part of the sector’s researchactivity, are also more able than ever before to make informed choices about theirpurchasing decisions, supported by the results of teaching and research assess-ments, as well as a range of third-party buyer’s guides. At the same time, educa-tional theory in recent years has come to emphasise the importance of student-
OECD 2000

UK Higher Education: Competitive Forces in the 21st Century
59
centred learning rather than tutor-centred teaching, reinforcing the pressures for acustomer-led approach to higher education.
Since the state will in future find it difficult to control those things for which itis not a monopoly purchaser, the likelihood is that existing control mechanisms willgradually weaken, even if individual HEIs experience this as more accountability forless of the business (Shattock, 1997). Conversely, market-based competition willincrease, and competition on price will become more widespread. UK universitieshave long since lost their position as monopoly providers of higher educationand (especially) research. The UK government may not yet be inclined to followNew Zealand in conferring the power to award degrees on any provider that candemonstrate competence irrespective of status, but it is certainly conceivable thatsome of the existing constraints will be relaxed. It is also possible that the conceptof formal recognition will itself be undermined, at least in markets like computingand business education where global commercial forces might easily challenge oreffectively ignore the presumed authority of the nation state.
Already the number of higher education providers and the range of higher edu-cation provision have increased significantly. The following figures illustrate thegeneral point, despite being limited to the university sector as conventionallydefined. In 1946 there were just 16 designated universities in the United Kingdom;the Robbins Report recorded 31 universities; by 1970 there were 45 including theOU (but excluding the polytechnics created in the 1960s); and by 1996 Dearingreported there to be 115 universities (including the ex-polytechnics) plus 61 otherHEIs (Shattock, 1996; Robbins, 1963; Dearing, 1997). This of course involved a grow-ing diversity of institutional histories and missions as well as an increase in thenumber of institutions.
The percentage of school-leavers participating in higher education has alsoincreased dramatically over this period. Although the Age Participation Rate (APR)is another limited and conventional measure, it has increased from less than 5% inthe early 1960s to roughly 35% in England and more than 45% in Scotland today withalmost one third of the Scottish figure reflecting higher education provision inScottish Further Education (FE) Colleges (Dearing, 1997; SHEFC 1996).
To date, the overall impact of these changes has been to contain rather thanexacerbate competition despite the increase in numbers and diversity because thegrowth in demand has outstripped the growth in supply. But several complicatingfactors are now at work.
In the first place, UK universities are no longer sufficiently small in number orsufficiently alike in their outlook for the post-war cartel to operate as efficiently asonce it did, nor even for the Committee of Vice-Chancellors and Principals (CVCP)and the Committee of Scottish Higher Education Principals (COSHEP) to representthem all effectively, least of all on the most contentious issues. Hence the emer-
OECD 2000

Higher Education Management
60
gence of sub-sectoral alliances such as the Russell Group and the Coalition ofModern Universities, and supra-national groupings such as Universitas 21. The sec-tor is also becoming blurred at the boundaries. A significant minority of higher edu-cation courses are already being taught in Scottish FE Colleges, and it seemsentirely likely that this backward integration of higher education provision into theFE sector and even possibly into the schools, as well as the forward integration ofhigher education into industry and commerce, through company degrees and so on,will become more widespread in the near future.
At the same time, the student market, though probably still growing in total, isbecoming increasingly heterogeneous, with most of the future growth likely to be innon-traditional market segments. Demographic projections suggest that the UnitedKingdom, like most of Western Europe, can expect its population to remain broadlystatic but become markedly older over the next few decades, and participation inhigher education is already expected to grow at least in part through wideningaccess. To use the business jargon, future growth will require market extension, andnot just a better penetration of existing markets.
The global market too is developing in ways that will change the nature of com-petition for international students. The world market for higher education hasincreased by c. 60% over the past 20 years, from 51 million in 1980 to 82 million in1995, and the World Bank expects there to be as many as 150 m million peoplearound the world seeking higher education by 2025 (UNESCO, 1998; West, 1998).The international market has also become increasingly global as students, like therest of the population, have become more mobile. The number of students study-ing abroad has trebled in the past 25 years and doubled in the past decade, andthere are currently about 1.5 million foreign students resident in the top 50 hostcountries. But this masks some important details. The existing market in interna-tional students studying abroad is heavily skewed: three-quarters of the 1.5 millionstudents referred to above are concentrated in the top ten host countries(UNESCO, 1998). Furthermore, the majority of the new demand predicted by theWorld Bank is likely to be concentrated in countries where personal incomes arerelatively low. Since new technology (discussed below) will further loosen the con-straints traditionally imposed by time and space, it seems reasonable to assumethat HEIs in the developed world will start to move away from their current relianceon middle-class foreigners studying on-campus. Internationally as domestically,future growth will be strongest in new market segments that will favour more speci-alised providers, and demand more customised provision.
However, it is the increased mobility of information rather than people whichposes the biggest threat to the status quo. For even if new technologies are onlyenablers of change in higher education, they are nevertheless opening up the marketfor substitute products, driving down traditional barriers to entry, and permitting newentrants to re-engineer the business and exploit new distribution channels.
OECD 2000

UK Higher Education: Competitive Forces in the 21st Century
61
Historically, the cost of investment in fixed assets, the labour-intensive modesof production and delivery, and the overheads associated with the provision of non-educational services have all helped to deter potential new competitors. But newdevelopments in information technology and telecommunications, affordableaccess to digital television and a growing recognition of the need to support thedevelopment of knowledge-based economies have between them made it not onlypossible but desirable, and perhaps necessary, to re-invent higher education bystripping out traditional costs associated with the ownership of land and buildings,the employment of permanent academic staff and/or the provision of bundledsupport services.
Until recently, developments in this area have mostly been limited to a pleth-ora of government-sponsored initiatives intended to promote computer-assistedteaching within the existing sector, and the development of the (government-sponsored) Open University, which other institutions have to date been happy toallow their own academic staff to support. But the possibility of producing anddelivering educational materials in ways which permit entry costs as well as operatingcosts to be scaled down, have set new competitive forces in motion around theworld, and especially in the United States.
A new wave of competitors is now emerging. These competitors are difficult tocategorise in any generally agreed way, but can usefully be sub-divided into threebroad clusters: mega universities, corporate universities, and for-profit organisations.
The mega universities, of which the United Kingdom’s Open University is by nomeans the largest, are in truth no longer very new. They are nevertheless assuminga new importance as the nature of demand for higher education, and the technologyof educational production and consumption change. Put simply, these organisationsoffer a new means of delivering mass higher education, and especially state sponsoredhigher education at significantly reduced unit costs (Daniels, 1996).
A range of rather dis-similar organisations, here labelled corporate universi-ties, are also assuming a new importance. Despite the nervous jokes about “mickeymouse qualifications” awarded by the Disney University, or “qualifications to go”from MacDonalds, existing universities find it harder to dismiss the emergence ofcorporate universities associated with companies such as Microsoft, Motorola, Fordand British Aerospace. Indeed, established HEIs have been keen to work in part-nership with the more prestigious companies, and the companies themselves havebeen keen to make these connections.
Serious for-profit providers have also started to emerge in the USA, with uncer-tain consequences for the rest of the English-speaking world. The Apollo Group isthe biggest player in this market, and is proving that higher education can be a veryprofitable business, given the right conditions. Apollo is the parent company of theUniversity of Phoenix which already has more than 60 000 registered higher educa-
OECD 2000

Higher Education Management
62
tion students, mostly pursuing courses in business and technology, including com-puting, by distance learning. More recently, a new variant has also emerged: theWestern Governors University. This is not a university in the traditional sense at all.It employs no teaching staff and develops no courses of its own. However, like theUniversity for Industry (UFI) project in Britain, it aims to be a major broker of highereducation provision, initially but not exclusively for the western states of the USA,providing on-line access to material provided by partner organisations whichinclude not only traditional universities (including now the US division of the OpenUniversity) but publishers such as International Thomson, and a range of blue-chipcorporations including IBM, Microsoft, Sun, AT&T and KPMG (Marchese, 1998).
In the context of Porter’s model, the combined impact of all the changes out-lined above – weaker monopolies, stronger consumers, changing markets, novelproducts and new competitors – will almost certainly be to transform the competi-tive environment. These developments will enhance the power of individual buy-ers and change the traditional nexus of relations between the students, the stateand the universities; exacerbate the competition among existing providers for mar-ket share and related resources; reduce significantly the barriers to entry into thehigher education market; and significantly increase the threat from new entrantsoffering substitute products. Between them, these forces threaten to change thecompetitive dynamics of the higher education business to such an extent that thoseof us already engaged in it may soon be forced to re-consider the very nature of thebusiness in which we are engaged, to re-define the sector within which we under-stand ourselves to be competing, and to re-examine the ways in which we positionour organisations.
REASONS TO BE FEARFUL
There are many reasons for existing HEIs to worry as they contemplate thefuture. UK universities face more intense competition, taking new forms in new mar-kets, with new entrants that seem likely to focus very effectively on high-growth,high-yield market segments, especially in computing and business education,potentially leaving traditional providers to serve what might be regarded from abusiness perspective as the least attractive market segments.
Consumer-led competition will increasingly temper the producer-ledassumptions that have shaped the development of post-war higher education inthe United Kingdom, and this will pose major challenges for established universitieswhose past success has been rooted in an entirely different tradition.
New wave competitors will be especially well-placed to re-engineer the busi-ness and operate at low unit costs by removing traditional economic constraints,and especially if price competition increases, this will pose difficult questions fortraditional providers. Existing HEIs tend to have their assets tied-up in land and
OECD 2000

UK Higher Education: Competitive Forces in the 21st Century
63
buildings. New wave competitors will not. Apart from the obvious cost advantages,this means that established universities will find it far more difficult than many oftheir potential rivals to finance major investments. In financial terms, UK universi-ties are generally solvent without being very liquid.
New entrants to the market will also look to purchase rather than develop edu-cational content, and be well-placed to cream the work of the academic communitysustained and employed by their rivals. Star academics will be tempted, not leastby the money, to freelance, and the protection of course-related intellectual prop-erty rights (IPR) looks set to become another big issue for existing universities in thevery near future.
Product differentiation will assume a new importance too, and this will add tothe pressures driving existing providers onto the back foot. In future, providers willhave to differentiate their products and services on more than location and content.Indeed, the core components of initial undergraduate study are likely to becomeless proprietary than they are now as universities strive both to demonstrate con-sistency with minimum (threshold) standards and further reduce the unit cost offirst year teaching. New entrants are likely to compete on a mixture of utility, flexi-bility, customer-service and price, and few established universities will feel able totackle this threat head-on.
More worrying still for existing universities, if virtual provision emerges as a keyweapon in the coming battle for high-growth, high-yield markets, as many universi-ties appear by their present actions to assume, then strong global brands and newdistribution channels will inevitably influence future developments. The more vir-tual the products or services become, and the more global the competition for mar-ket share, the more difficult it will be for existing universities successfully todifferentiate their own on-line provision.
REASONS TO BE CHEERFUL
Nevertheless, established universities will survive, and many will thrive in thenew environment.
Technological developments will doubtless bring enormous change, but newforms of educational production, delivery and consumption will not simply displacethe old. The promise or threat, whichever it is, of the virtual university may yetprove to be a revolution akin to the arrival of the paperless office. Quality onlineeducation will neither be cheap nor easy to produce or deliver in many disciplines,though it obviously is in some, and many students, even or perhaps especiallywhen they are regarded as consumers of higher education, will continue to wantaccess to libraries and arguments with other people to help support their educa-tion. Higher education will remain a social as well as an educational experience.
OECD 2000

Higher Education Management
64
Although the nature of demand for higher education will change as it grows, italso seems likely that the overall rate of growth in the global market will be suffi-cient in future to sustain an enormous number of complementary (sic) providers.Demographic trends will certainly shift the balance of demand for higher educationboth globally and domestically, but exactly how and to what extent remains uncer-tain. The global market will not be any more uniformly international than it is now,and the emergence of English as the dominant second-language around the worldseems likely to put UK providers in a relatively strong competitive position.
Indeed, some parts of the university sector will barely notice the winds ofchange because there will still be a thriving market for full-time campus-basedstudy, even though price will emerge explicitly as a moderating factor (the currentlegal framework in the United Kingdom being unsustainable in the longer term),and fewer universities in total will be willing or able to regard this form of provisionas constituting their core business.
The threat from new entrants remains a real one, of course, but diversification(taking new products into new markets) is a high-risk business strategy, eventhough it can bring big rewards. The apparent distinction between established andnew-wave providers will inevitably blur over time, and mixed model organisationsare likely to predominate. Partnerships will play an important part in addressingthe diverse and changing educational needs of the knowledge economies, as thenew wave competitors are starting to demonstrate, and partnership-based compe-tition will inevitably happen through and with, and not just beyond and aroundexisting universities.
The dangers of a big shake out will only be high where large numbers of highereducation providers all try to compete for the same narrow range of students withsimilar courses delivered in similar ways at similar prices. Greater differentiationwill consequently be the key to a sustainable future, and this is already widelyunderstood among existing UK universities, although it seems likely that the needfor institutions to become more distinctive and therefore more selective will infuture manifest itself as another focus of tension between managerial logic andacademic aspirations.
Finally, there are two other important factors to consider, both of them positive,but each of them paradoxically so.
The first paradox is that despite the changing role of the state in the fundingand regulation of higher education, governments around the world increasinglylook at higher education as a form of strategic investment in the knowledge econ-omy. This makes it less likely than ever that the state will consider these invest-ments as sunk costs which might safely be disregarded in making future decisions.UK universities will receive more political attention as well as less financial support
OECD 2000

UK Higher Education: Competitive Forces in the 21st Century
65
from the state: an uncomfortable combination perhaps, but one that universitiesshould learn to regard as an opportunity as well as a threat.
The second paradox is that while new technologies are radically weakening theconstraints of time and place, so too the extent to which traditional universities arerooted in fixed geographical locations is emerging as a renewed source of compet-itive advantage. The world economy is becoming “globally local” as well as “locallyglobal”, and established universities have unique opportunities to establish (orre-establish) themselves as key partners in regional plans for economic, social andcultural rejuvenation and development (HEQE, 1998).
AFTERWORD
It would be inappropriate to pretend that there are any clear conclusions to bedrawn from all of this. The future will no doubt be far more complicated and surpris-ing than any of us can imagine just now. But the spectre of fundamental change inthe higher education business (and it is a business these days, whatever else it maybe) is surely not a fanciful one.
The parallels with our high-street banks may yet prove to be instructive. Forthere only thirty years ago was a traditional, predictable and very British business,which did not appear to think of itself fully as a business since the bank was an “insti-tution” and not merely an organisation, that was at least partly defined by its physicallocation and operated on terms that suited the service providers rather more than thecustomers. Yet the combined impact of telecommunications, consumerism, globalcompetition, substitute products and new entrants to the market have between themtransformed the nature of the business and redefined the sector itself.
Not that our institutions of higher education have anything to learn from thebusiness world, of course.
OECD 2000

Higher Education Management
66
References
DANIELS, J. (1996),The Mega Universities, Open University.
DEARING (1997),The National Committee of Enquiry: Higher Education in the Learning Society, HMSO.
GODDARD, J. et al. (1998),"Higher Education Quality and Employability Report", Universities and Economic Development,June.
MARCHESE, T. (1998),“Not-so-distant competitors: How new providers are re-making the post-secondarymarketplace”, AAHE Bulletin, May.
PORTER, M.E. (1980),Competitive Strategy, Free Press.
PRAHALAD, C.K. and HAMEL, G. (1994),Competing for the Future, HBS Press.
ROBBINS (1963),Report of the Committee on Higher Education, HMSO Cmnd 2154.
SHATTOCK, M. (1997),“The managerial implications of the new priorities”, Higher Education Management, Vol. 9,No. 2, July, pp. 27-34.
SHATTOCK, M. (ed.) (1996),The Creation of a University System, Blackwell, Oxford.
Scottish Higher Education Funding Council (SHEFC)Circular letter 57/96.
UNESCO (1998),World Statistical Outlook on Higher Education: 1980-1995.
USR/HESA,Universities Statistical Record and the Higher Education Statistics Agency annual statisticalreports.
WEST (1998),The West Committee Review of Higher Education and Policy, App.11.
WILLIAMS, G. (1992),Changing Patterns of Finance in Higher Education, OU Press.
OECD 2000

Higher Education Management Vol. 12, No. 1
67
Academic Responses to the UK Foresight Programme*
Mary HenkelBrunel University, United Kingdom
ABSTRACT
This article explores how far government policies influence academic values andways of working. It focuses on the UK Foresight Programme as a catalyst of culturalchange in research communities in England. On the basis of an empirical study, itanalyses the responses to the programme of scientists and social scientists at differ-ent levels of the higher education and research system. It concludes that while thereis some evidence of shifting attitudes towards industry and the exploitation ofresearch, Foresight has not affected fundamental academic values and practices.
THE POLICY THRUST
In 1993 the UK Conservative government produced a white paper, ambitious inboth scope and title, Realising Our Potential. A Strategy for Science, Engineering andTechnology (OST, 1993). The central issue it addressed was familiar: the need toexploit more effectively the potential of science and technology to contribute towealth creation and quality of life, in the context of global challenges to nationalcompetitiveness and human welfare. Central to the government’s strategy to meetthis need was a new (for the UK) policy: Technology Foresight.
Technology Foresight would provide a conceptual framework and a processthrough which emerging key technologies and markets could be identified and prior-ities for the public funding of science determined. It would set in motion a “culturalchange [of] better communication, interaction and mutual understanding betweenthe scientific community, industry and government departments” (para. 1.18.2). The
* This article is based on Academic Responses to the UK Foresight Programme (1999) byMary Henkel, Stephen Hanney, Maurice Kogan, Janet Vaux and Dagmar von Walden Laing.The full report is available from CEPPP, Brunel University, Uxbridge, Middlesex UBH 3PH,England (e-mail: [email protected]).
OECD 2000
Higher Education Management
68
Office of Science and Technology (OST) took the policy forward. By the end of1993 a Technology Foresight Steering Group had been established to oversee theForesight programme and provide a framework in which 15 (later 16) sector panelscomprising members from academia, business, finance and government wouldbegin to implement it.
THE STUDY
There are already many studies of Foresight (e.g. Martin and Irvine, 1989;Martin, 1993, 1996; POST, 1997; Royal Academy of Engineering, 1998; Segal QuinceWicksteed, 1998; OST, 1997c). The study reported here, however, focused on theresponses of academic scientists and social scientists to the Foresight programme,as it had developed by 1997-98. We explored how, and how far, academics at differ-ent levels of the higher education and research system perceived the Foresightpolicy; what patterns of response emerged, and how these might be explained. Themain question was to what extent a process of change was discernible in academicvalues, agendas and modes of working in the UK research communities.
Key assumptions of the study were that academic responses were crucial to thesuccess of the policy; that the programme might challenge existing research aimsand values; and that academic aims, values and conceptions of research were aproduct of the interplay between individuals and key institutions, notably univer-sities, disciplines and funding bodies. Knowledge of academic institutionalresponses would therefore be important for an understanding of the implicationsof Technology Foresight for individual academics. It might also reveal importantdifferences between them.
The study did not set out to answer the question, “how well did the Foresightpolicy work?”, although it is relevant to those concerned with such questions, andis in the tradition of policy impact studies. However, we and others have arguedelsewhere that impact is not an entirely appropriate metaphor for the study of asubstantial set of policies and their outcomes. It implies that those affected bypolicies are best understood as passive recipients and underestimates thepotential of a range of actors in a policy sector to subvert or enhance the purposesof others, to create solutions of their own and to set in motion new interactionswith different players.
Academics are more plausibly to be seen as an active population, with theirown agendas, and with a strong normative commitment to autonomy and inter-nal concepts of motivation. They are able to draw on well institutionalised, aswell as individual, strategies to obtain the means to achieve their ends. Thoseinterested in the effectiveness of policies might learn most by examining howactors such as these interpret the policies, how far they perceive them to be
OECD 2000

Academic Responses to the UK Foresight Programme
69
consistent with their own values and goals and how far they can incorporate theminto their own frames of reference or problem solving approaches.
THE FORESIGHT POLICY AND ACADEMIC VALUES
Foresight, as articulated by Martin and Irvine (1989), one of whom was a con-sultant to the government in the period leading up to the adoption of the policy,comprised a complex set of ideas and carried with it a number of controversialassumptions:
– While it must strike “a balance between top-down and bottom-up approaches”(Martin, 1993), Foresight requires a comprehensive approach, and strongstrategic leadership from the top.
– Foresight must be distinguished from forecasting, the aim of which is toarrive at predictions which can be justified scientifically, on the assumptionthat “only one probable future exists and that this can be linked in a unilinearand deterministic way to the present and the past.” (Martin and Irvine, 1989;Wills, 1972). Foresight, like the French idea, la prospective (Godet, 1986),assumes that there exist many possible futures but that collective analysis oftrends, options and action may make it possible to influence which of thememerges.
– It is possible to shape the direction of research without impairing scientificcreativity or the degree of innovation required to sustain scientific and eco-nomic competitiveness.
– Partnership between academic researchers, industry and government,through which the fit between science push and demand pull can be eval-uated and strengthened, is central – for the selection of priorities for stra-tegic research and generic technologies, for their development, and forthe dissemination and exploitation of results (OST, 1993, paras. 2.26-2.29)(see also OST, 1995a).
– Strategic research is a key component of the programme.
– Largely linear and uni-directional assumptions about the relationshipbetween fundamental, strategic and applied research and between scienceand technology are increasingly untenable. Such assumptions have, in fact,long been challenged in social studies of science (Ziman, 1984; Layton, 1977;Mulkay, 1977) (see also OECD, 1993; Brooks, 1994).
– As thinking about the foundations of the economy and of wealth creationchange and the role of advanced knowledge and innovation become critical,the traditional boundaries between science and industry, the academy andthe market begin to shift.
OECD 2000

Higher Education Management
70
– Multi-disciplinary research is increasingly recognised as essential for bringingwork on emerging technologies to fruition, and to advance knowledge in somescientific fields.
– Priorities must be set for research funding.
Some of these assumptions run counter to traditional beliefs among scientists.
An earlier piece of research carried out between 1994 and 1997 (Henkel, forth-coming) by some members of our team in a three country study of the impacts ofhigher education reforms on academic values and working practices had found littleevidence that attitudes or modes of work had changed or that Foresight wasinfluencing them. Respondents, particularly scientists, were overwhelminglypreoccupied by research funding problems. At the same time, they emphasised theimportance of academic autonomy for sustaining motivation and the quality ofresearch. Few spontaneously mentioned Foresight or saw it as significantly imping-ing upon them. Some were developing partnerships with industry, either underpressure from their institutions or on their own initiative, mainly to increase theirresearch income. But they did so only within the terms of their own agenda. Atti-tudes to science policies to promote collaboration were mixed. There was supportfor the principle but uncertainty about how compatible were the expectations ofthe parties. Some felt that what industry most wanted from universities was asupply of well trained scientists and that their requirements for academic researchwere short term and tightly defined. Others believed that partnerships with indus-try cannot be generated easily and that industry should be expected to take moreof the initiative. It was also felt that the conditions imposed upon recent researchgrant award schemes where success depended upon securing some industrialfunding had led to a shift of evaluative criteria away from scientific merit, at a timeof intense competition for research funding.
STUDY METHODS
The current study provided an opportunity to make a closer analysis of whatappeared to be ambivalent attitudes and to see whether clearer patterns ofresponse could be identified. Broadly, we were concerned with two kinds of pat-tern: those that might derive from or be linked with knowledge (disciplines or fieldswith different interests, methods of inquiry, organisation and networks) and thosethat might be linked with authority or power, for example age and individual andinstitutional status. Issues of authority and power threw up a further and funda-mental question for our project. How far could the responses of those individualsand institutions with the authority of expertise or institutional power be seen to bechanging the research environment or research culture in ways that might criticallyaffect whole communities of academics, for example by changing funding opportu-nities or reward structures?
OECD 2000

Academic Responses to the UK Foresight Programme
71
We took a case study approach to the core of the study since it enables com-plexities to be explored by focusing on a limited field of action. This made it pos-sible to examine in some depth the responses of academics from varied butselected disciplines and fields.
We carried out case studies in research areas covered by two Foresight panels,Health and Life Sciences and Materials. The study was designed to enable us tolook for patterns of difference and similarity between:
– The health and life sciences and materials policy arenas.
– Disciplines or clusters of disciplines: natural scientists, clinical scientists,social scientists, basic researchers and applied researchers.
– Universities.
– Funding bodies.
– Levels of academia.
– Academics with different degrees of association with the Foresight policy.
THE AIMS OF FORESIGHT AND ATTEMPTS TO IMPLEMENT IT
The main ideas contributory to Foresight have been in circulation over a periodof time. Work on Foresight itself had been undertaken by the Science PolicyResearch Unit (SPRU) over a decade before the White Paper of 1993 (OST, 1993).While, therefore, Technology Foresight as a composite policy was a new organisingconcept for science policy in the United Kingdom, key governmental bodies hadalready been working with some of the ideas espoused in it.
We noted some tension between the two main Foresight aims. The idea of pro-moting dialogue and collaboration between the scientific community, industry andgovernment suggested a dynamic conception of agenda development. However,setting priorities for research funding through matching strong areas of strategicscience in the United Kingdom with potential market opportunities implied a moredecisive shaping of research agendas (reinforced by the Steering Group’s mappingof generic priorities). It also created some uncertainty about the implications of thepolicy for the future of basic or “blue skies” research in academic communities.
Not surprisingly, there were differences of interpretation of the aims withinthose communities, and over time the emphasis between them seemed to change,as the process of implementation got underway, and new actors, including a newgovernment, entered the policy arena. In particular, there appeared to be somemovement away from the selectivist function of Foresight. The setting of prioritieswas widely interpreted, notably amongst academics nearer to the centres of policymaking, as a broad shaping exercise, and unlikely to exclude significant areas ofresearch or to undermine the strength of basic research. Government policy makersfocused increasingly strongly on the promotion of collaborative activity between
OECD 2000

Higher Education Management
72
business and academia. With the advent of the new government in 1997, the over-arching political agenda for Foresight moved towards the solution of major socialand environmental problems, in which both the creation of wealth and quality oflife were implicated and the differences between them blurred.
However, the extent to which such shifts were evident to academics varied.Those who had been intensively engaged in prioritisation exercises, particularly onthe panels, were likely to emphasise the importance of priority-setting as a functionof Foresight. Those nearer the academic base interpreted this as likely to lead togreater external direction.
The Steering Group, the Foresight panels and OST made substantial attemptsto engender involvement in the initiative and to promote network building, notablythrough a Delphi exercise, workshops and later some joint working parties betweenpanels. However, the overall impact of these events relative to the input of effortwas low. More important was the response of the academic institutions with thepower to shape the research environment.
THE RESPONSE TO FORESIGHT OF KEY INSTITUTIONS
Research and funding councils
The research and funding councils provide the key policy and funding frame-works for UK academics. The extent to which they saw it as their role to incorporateForesight concepts into their policies was therefore of critical importance to depart-ments, research centres and individual researchers in universities.
The research councils had been more involved through membership of keygroups in the development of the Foresight policy than the funding councils. TheSteering Group made it clear that they saw “scope for a sustained readjustment of[research funding] priorities over a number of years” (OST, 1995), while the two panelswith which this study is concerned recommended that the research councils shouldprovide additional support for priorities identified by them.
All the research councils in their early responses to Foresight tended to taketwo lines: that they were already substantially addressing research areas identifiedas priorities in Foresight; and that they were also now specifically responding to theForesight initiative, although there was a general perception that one of them hadbeen more active and specific than the others.
Unlike the research councils, the Higher Education Funding Councils were notinitially represented on the Steering Group. They differed in their subsequentsupport for Foresight.
In contrast to its Scottish and Welsh counterparts, the Higher Education FundingCouncil for England (HEFCE) chose not to introduce a specific funding initiative
OECD 2000

Academic Responses to the UK Foresight Programme
73
to encourage Foresight in universities. Probably the most important mechanismthrough which the funding councils could have supported Foresight was theresearch assessment exercise (RAE), on the results of which funding council alloca-tions to universities for research were based. It had become probably the singlemost important influence on universities’ research policies by the early 1990s.
In spite of funding council guidance to the research assessment panels, how-ever, fewer than one third mentioned response to Foresight in their guidance todepartments about factors that should be referred to in their submissions. Andwhile there was a clear difference of approach between the panels relevant to Mate-rials and those relevant to Health and Life Sciences, the view from the universitiesin our study was that Foresight had had a negligible influence on the RAE exercisein 1996.
HEFCE then consulted the universities on how far a policy factor should beused in calculating research funding between subject areas, but decided that itwould be wrong to apply the findings of the Foresight panels to the funding meth-odology in a formulaic way. It had made clear to institutions that it expected themto take full account of Foresight in their allocations of funds, but it supported theprinciple of university autonomy in this matter.
The learned societies
By 1998 Foresight had generated a limited response from learned societiesand, with the exception of one society, few members were aware of what theirresponse had been. However, major disciplinary bodies in the physical and the bio-logical sciences, together with the Royal Society, had seen it as a significant devel-opment in science policy, of which they must take account and seek to influence.Social science organisations, on the other hand, for the most part regarded it as notrelevant to them.
There were a few examples of societies which had actively sought to take Fore-sight aims forward and to encourage a new momentum in the relationships betweendisciplines and between industry and academia.
Universities
Universities had been strengthening their capacities to work with industries andother external bodies on research and technology transfer over the two decadesbefore Foresight. The need to generate research income from sources other than thedual support system had become increasingly pressing.
The relationship between academic reputation and research income tightenedand the RAE was the most powerful lever of change in this development. It tookaccount of research income as well as research output but discriminated between
OECD 2000

Higher Education Management
74
the sources of research income in favour of the research councils and a few presti-gious charities. The funding and research councils’ perceived response to Foresightwas thus crucial to the development of universities’ attitudes to Foresight. Univer-sities in England were clear that RAE criteria had been little influenced by Fore-sight. The reactions of the research councils had been more difficult to read, butmost institutions saw them as still equivocal. Foresight had not had a decisiveimpact on them, although the Engineering and Physical Sciences Research Board(EPSRC) and the Economic and Social Science Research Board (ESSRC) were seenas having been more active respondents to the policy.
Since neither the Funding nor the Research Councils could be regarded asstraightforward mediators of the Foresight programme, universities were makingtheir own decisions about its importance. Although, according to HEFCE, many uni-versities referred to it in their strategic planning documents, most had not made aninstitutional response to Foresight, but left it to their faculties or departments to doso. The extent to which they had, nevertheless, sought to create structures andpolicies that influenced the choices made in their basic units varied.
For the most part, Foresight had not been a stimulus to change in universityresearch strategies. Rather it had been part of a complex of external factors affectinginstitutions’ policies and structures.
However, while there is little evidence anywhere that Foresight had been adirect cause of change in policies or in research agendas, three of the civic univer-sities in the study had seen it as significant in the research policy environment.Foresight seemed to have been an important means by which they worked todevelop regional connections and prosperity in the name of mutual interests.
THE RESPONSE OF THE ACADEMICS
What were the responses of academics in the basic units? The study focusedon researchers in three research areas, Materials, Ageing and Health Informatics. Itconsidered how aware they were of Foresight and the impacts it had made on theiraims, values, agendas, networks and modes of working We aimed to identify differ-ences and similarities between the disciplines under study.
FORESIGHT AND ACADEMIC NORMS
Most materials scientists showed themselves to be in sympathy with the Fore-sight aims of promoting the relationships between academics and industry. Severalargued that the intellectual challenge of addressing problems posed by industrywas greater than that of research generated outside the academic-industry relation-ship. Others, however, thought that too much emphasis could be placed on collab-oration with industry which should not become a mandatory criterion for funding.
OECD 2000

Academic Responses to the UK Foresight Programme
75
The picture in health informatics and ageing was more complicated. Computerscientists also saw working with industry as embedded in their practice. Biologicalscientists divided between basic researchers who relied wholly or mainly onresearch council and charitable funding and those with a greater variety of fundingsources. For many life scientists and clinical researchers there was a strong traditionof relationships with the pharmaceutical industry, itself strongly research-based.For clinically oriented researchers in ageing and in health informatics and for socialscience researchers working in ageing or similar fields, the National Health Servicewas also a major sponsor and/ or user of their research.
The majority of researchers considered that wealth creation was more impor-tant to the policy makers than the improvement of quality of life, but respondentswho saw wealth creation as irrelevant to them or even incompatible with their ownvalues were more likely to be health or life scientists. There was support amongsome health and life scientists for a clear division of labour between industry andacademia, rather than closer working partnerships. They believed that the univer-sities’ role was to ensure that the United Kingdom had a highly trained workforce,to sustain the research base and to make the breakthroughs on which industriescould draw; industries should pay for these things through taxes. The idea that aca-demics were part of a culture in which entrepreneurial values and abilities were inlow esteem was expressed by several life scientists, although not all of these asso-ciated themselves with academic culture in this respect.
However, as indicated in other recent studies (Howells et al., 1998), attitudeswere changing towards the commercialisation of research, as universities wereencouraging academics to address intellectual property rights and making it easierfor them to form their own companies for the development and exploitation of theirresearch. A few academics had moved strongly in this direction and others findingit difficult to get their ideas taken up in industry now saw it as an option. That mightin the longer term have some influence on the balance between research anddevelopment in individual agendas.
For researchers in materials and in the biological sciences intellectual propertyrights were a high profile issue, although it appeared that the driving force behindthis was the institution rather than the individual. These studies played a majorpart in the negotiation of work with industries and was the source of conflicts ofvalues and interests for academics, as the importance of collaboration with industrygrew. Most materials scientists saw potential problems in publishing research thatwas commercially sensitive for companies, although it appeared that senior aca-demics found they were usually manageable. The issues were largely those of delayand this could be limited. More serious problems were mentioned by a few people,where commercial confidentiality meant that full account of findings could not bepublished, so restricting the outlets for publication and limiting the free flow ofcommunication between researchers in the field.
OECD 2000
Higher Education Management
76
A related problem was identified by some biological scientists who noted thatcollaboration in departments with several competing firms could mean that com-munication within those departments was also affected, for example in graduateresearch seminars where students might be sponsored by different companies.
Those respondents who saw Foresight as an instrument for stronger externalsteerage of research were mostly opposed to it on those grounds. They stressed theimportance of academic autonomy, internal motivation and drive for creativeresearch. Those who saw Foresight as a threat to these values tended to be lifescientists and clinical researchers but these views were also expressed by scientistsworking in materials-related research.
Although a minority of those who commented on such issues welcomed theidea of a more systematic approach to exploiting basic as well as applied science,others considered that a focus on exploitation or practical outcomes must meangiving less value nationally to basic science. There were fears about Foresight onthis score amongst the materials scientists as well as amongst the health and lifescientists, although they were probably more widespread amongst the latter. Inter-viewees from all fields stressed that it was vital that applied research continued tobe able to draw on new basic science.
FORESIGHT AND ACADEMIC NETWORKS: ACADEMIC-INDUSTRY RELATIONSHIPS
The impact of Foresight on academic practices and the nature of their networksis not easily determined. Foresight was designed to promote more productive rela-tionships between academics and industry. As we have seen, during the 1980s and1990s universities were also trying to encourage academic staff to make strongerconnections with industry and to generate more income from research. At the sametime, the research needs of some key industries, such as the pharmaceutical indus-try, were changing along with their perceptions of how to get those needs met.Some of these changes were attributable to changes in science. In the field of phar-maceuticals, advances in molecular sciences meant that companies were increas-ingly looking to university-based scientists for new compounds that had becomemore and more difficult to find. The task of identifying appropriate targets for theirdrugs had been made massively more complex by the advances in genetic science.However, the potential for exploiting basic science to pinpoint such targets was nowsubstantial.
Existing relationships between academia and industry predominantly reflecteddifferent forms of exchange. At one end of a continuum, they might be largely instru-mental exchanges, in which researchers tested materials or clinicians carried outclinical trials of drugs for companies in exchange for money that could then be spenton various forms of research support. Researchers tried to minimise such forms ofrelationship as being of limited intellectual value. An alternative form of exchange
OECD 2000

Academic Responses to the UK Foresight Programme
77
was one in which researchers might carry out similar forms of work but in doing so getaccess to material or data or extended time that enabled them to address problemsof interest to themselves. Or academic clinicians might seek opportunities to evalu-ate devices, equipment or drugs. Exchanges might be more speculative, in whichuniversity-based researchers took new basic knowledge or theories to firms, with aview to interesting them in technology transfer or product development. Alterna-tively firms might fund individual scientists or groups over a period of time to under-take basic research in a field of interest to them, in exchange for privileged access tothe knowledge that emerged.
Such exchanges might come nearer to forms of partnership if work on productdevelopment were joint.
Researchers might be involved in institutional initiatives to facilitate access byfirms to the university or department or exchange of ideas between academia andbusiness or to develop forms of relationship that were effectively joint programmesof knowledge development. Funding, usually by major companies, of chairs, equip-ment or buildings might facilitate direct access to leading edge scientists in the uni-versity by industry and joint development of research agendas over protractedperiods of time.
Foresight policies were to promote partnerships that might support mediumand long term exploitation of research with a view to securing a lead in key marketareas and improving quality of life. This might create a new culture of academic-industry interaction across a far wider spectrum of researchers and companies.
The study highlighted instances of direct impacts of Foresight initiatives inexpanding relationships. Examples include: the generation of new forms of lever-age for investment and new connections across academic departments and institu-tions as well as new interactions between company- and university-based clinicalresearch; a multi-disciplinary research centre co-operating with a major British com-pany in which the outcomes were planned to be of use to the company, while at thesame time producing advances in the modelling of materials processing; the devel-opment of a bio-sciences incubator in one of our sample universities. There weresome highly successful basic researchers in the biological sciences, who were sub-stantially supported by industry, either as a result of negotiations at the universitylevel or of the development of their own contacts but these were not directly attrib-utable to Foresight. Some of those active in collaborations with industry, however,were critical that Foresight policies had not helped to resolve the more seriousproblems encountered, particularly in the process of technology transfer.
PROMOTING INTER AND MULTI-DISCIPLINARY RESEARCH
Inter-disciplinary research was one of a number of forms of collaborativeresearch advocated in the Foresight initiative. These also included inter-institutional
OECD 2000

Higher Education Management
78
collaboration. Researchers who saw themselves as interdisciplinary were compara-tively strongly represented in this study. Materials was widely characterised as amulti-disciplinary or as an inter-disciplinary field and this was particularly true ofbiomaterials. Health informatics was perceived as requiring collaboration betweentechnologists and social scientists, as well as drawing on basic sciences. Ageing wasa research domain, and while it was dependent on highly specialised basic researchin, for example, a range of biological sciences, most of those most committed to itwere strongly inter-disciplinary in their approach, even if their own work wasgrounded in highly specialised basic science.
How far was Foresight perceived by academic researchers to be strengtheninginter-disciplinarity, enlarging the opportunities for it and facilitating the finding ofsolutions to its notorious difficulties?
We found that for participants in our study, inter-disciplinarity was not stronglyassociated with Foresight, in the way that academic-industry relationships certainlywere. While the funding programmes most closely associated with it could be saidto have supported collaborative approaches of all kinds to research, Foresight wasnot generally seen as having broken down the barriers to inter-disciplinarity in theresearch council structure. The strong leads coming from some universities toencourage inter-disciplinarity and inter-departmental collaborations were not per-ceived as having been triggered by Foresight, even if they were thought to be intune with its aims.
WAS FORESIGHT SHIFTING ACADEMIC AGENDAS?
This issue can be addressed in individual and in collective terms. In the caseof individuals, both the scope for and the imperative towards change in academicagendas depended partly upon individual expertise and the nature of the field.
Possibilities for shifting the substantive focus of research were most obviousfor researchers in computer science, information studies and some social scientists.However, most physical, biological and clinical scientists believed the scope forindividuals to make significant intellectual shifts was limited, given the effortrequired to master an area to the point where research could be undertaken com-petitively. A policy that aimed to provide incentives for researchers to move intonew areas would need to assure them that funding for those areas was relativelysecure and also that the review system would find room for newcomers. The judge-ments of peer evaluators were felt increasingly to rely on the existing track recordsof grant applicants and not necessarily influenced by Foresight criteria. In that casethe effective policies of funding bodies might be quite confusing.
Foresight agendas were, however, having an impact on the language or framesin which academics applied for research funding. Most people, at least in materialsscience, felt they must see that their research proposals fitted with Foresight
OECD 2000

Academic Responses to the UK Foresight Programme
79
priorities and orientation to applicability. Beyond this, while applied researcherswere used to taking into account external expectations of their work, even if that didnot constitute the whole of their research agenda, a few academics who saw them-selves as pure researchers now felt that they were required to construe relevanceor potential exploitation in their work. Doubts were expressed, however, about thevalue of this shift. It might foster an atmosphere, according to a clinician, “where younever get started because you cannot answer the questions in advance”. This shiftwas, moreover, not necessarily ascribed to Foresight. There was a wider set of influ-ences at work.
Biomaterials was cited as a fast moving field, where developments were likelyto come from those working at the edge of various disciplines and across disciplin-ary boundaries. A few individual scientists in the study were looking at the poten-tial for making contributions to the field on the basis of their existing expertise orwere already involved, as individuals or as members of the InterdisciplinaryResearch Centre in this field.
Shifting the academic agenda was more often discussed in terms of future pos-sibilities. Foresight might gradually reshape collective disciplinary research agen-das, by its influence on funding possibilities. However, some research fields suchas dementia and other aspects of ageing were now attracting highly talented peo-ple because of their intellectual excitement. Foresight was seen as one of a numberof initiatives encouraging this trend.
As yet, few academics in areas identified as priorities by the two panels in ourstudy considered that they had significantly benefited from enlarged fundingopportunities. Academics in the field of ageing were well aware that it had a highprofile in the Foresight initiative. The MRC decision to establish a national centrefor the study of ageing was not made until after the end of the study and, at the timeof our fieldwork, there was a sense that at least as yet, the research councils’ devel-opment of programmes in ageing had been somewhat uncoordinated.
The Foresight initiatives in health informatics were also only just getting off theground and were not perceived as shifting agendas.
Within materials, people in materials processing and in biomaterials wereaware of some shift in resources and in industrial interest, although as the majorityof biomaterials specialists in our study were in the Interdisciplinary ResearchCentre, and therefore not able to apply for research grants from public bodies, theyhad not themselves benefited from greater public support in this area.
FORESIGHT AND YOUNG RESEARCHERS
In materials studies there were mixed views about Foresight’s implications foryounger researchers. Involvement could be useful for those who wanted to get intoindustry but that might be secured in other ways. Foresight might also be more
OECD 2000

Higher Education Management
80
prescriptive for them than for well established academics. But it could make themaware that their research was of some clear benefit as well as academically interesting.
In ageing studies whilst it was thought important that young academicsembraced the idea that collaboration with industry was important and rewarding itwas equally important that they develop their research interests within the univer-sity framework beyond their student years. Yet changes in attitudes to industrialcollaboration were noticeable; young scientists were aware of what had to be doneand how: writing business plans, marketing strategies, etc. This had various impli-cations. Industrialists were brought into graduate programmes to talk about intel-lectual property, about publishing agreements and about confidentiality. Oneacademic suggested that this was one of the things that had changed for the better.The financial problems facing young researchers were brought up by a number ofinterviewees. Highly trained people could get disillusioned and leave.
CONFLICTS WITH OTHER POLICIES
As we have seen, the Steering Group was keen that Funding Councils shouldsupport Foresight through their funding formulae and allocations of capital funds.But the reaction from institutions and academics was generally negative. We havealso quoted evidence to the effect that it had comparatively low priority within theHEFCs’ research assessment exercise. Whilst offering guidance to panels to takeuniversity departments’ responses to Foresight into account, they were content toleave them to reach their own conclusions. This meant that the RAE judgementscontinued to be based on the traditional evaluative criteria of research excellence.
The pre-eminence of RAE and its lack of connection with Foresight were amajor factor in making for distance between academics and Foresight. Universitylevel respondents were most likely to feel that the main way in which Foresightcould exercise an influence on them would be through the Research Councils’response or the RAE criteria. Universities saw neither as having decisively shiftedtowards Foresight thinking. Indeed the values underlying the two policies wereoften seen as in conflict.
As we have seen, a second factor was concern that Foresight might seem toimply a degree of direction over individual academics which academics believed tobe a source of tension with Foresight.
REFLECTION ON OUR MAIN THEMES
Our evaluation took place at a time when Foresight had been able to clarifyitself as a national and governmental policy, but over a time scale relatively shortin terms of academic responses and changes in academic culture. The initiative wasevidently gaining momentum but could not compete successfully for attention with
OECD 2000

Academic Responses to the UK Foresight Programme
81
the other policies, particularly the research assessment exercises and resourceallocations. On these both funding and reputations depended.
Thus Foresight must depend on its persuasive power and in this respect it can-not be deemed to have been successful so far. Not only the distraction of other pol-icies but also some apprehension of prescription and channelling inhibited itsacademic endorsement. Nor were its merits advanced consistently by the fundingand research councils who do, indeed, possess the means of influence. Whilstresearchers in some fields were aware that Foresight had shifted the research fundingenvironment, it had not as yet been an agent of cultural change.
Analysts of higher education policies and their impacts would expect there tobe differences in perception of and attitude to national policies at different levelsof the system. Governmental hopes for Foresight were shared by many of the aca-demics recruited to its bodies and by a few champions in a range of academic insti-tutions. But there was something of a consensual scepticism which increased as onetravelled through the levels of the Funding and Research Councils, the universitiesand into the working academic levels.
There were, however, discernible disciplinary differences in approach. Thesedid not, however, seem to derive from differences in epistemologies and aca-demic values so much as from the accidents of organisation – proximity to a singleresearch council that evinced a positive approach for most researchers in materi-als, for example, or historic connections with and a corresponding continuingbelief in connection between academia and industry. Social scientists did dem-onstrate some differences of value and knowledge perspectives from those ofnatural scientists. Some social scientists emphasised the critical role they shouldplay in societies’ management of technological developments, as well as thepotential of social science to elucidate and facilitate those developments. Theywere also less willing than other groups to accept accommodation between thegoals of wealth development and enhancing quality of life. They were more readyto point out the different ideologies underlying conceptions of quality of life thatcannot easily be reconciled.
For the most part academic values – the belief in the importance of intellectualindependence from the here and now – seemed to remain firm, and these also weremade to justify some of the more sceptical attitudes towards Foresight. However, wehave noted that younger researchers were willing to accommodate the possibility ofbeing both academically motivated and responding to economic needs, as weresome of the established researchers whom we encountered. It is not easy, however,to isolate Foresight as a factor among others in causing this shift in attitudes.
Established conceptions and criteria of knowledge remained secure and,indeed, there was no suggestion that Foresight attempted to influence them.
OECD 2000

Higher Education Management
82
A CASE STUDY OF CHANGE
The study has thrown up issues about how changes happen, e.g. whether it isnecessary to “capture individual hearts and minds” if institutional priorities orstructures are to change. It is manifest from our study that individual attitudes to aninitiative such as Foresight will depend on its relationship to other imperatives thatdominate academic life. Whilst disciplinary orientation instils the academic valuesof the Republic of Science, within the competitive environment engendered by cur-rent policies, resources and reputations increasingly affect actions. Thus the actionsand attitudes of funding and research councils and the extent to which Foresightwill bring tangible benefits are dominant concerns. On these counts academicshave not detected fundamental change. The shifts that are taking place are the out-comes of longer term pressures, notably those compelling universities and aca-demics to seek new forms of funding. Foresight is seen largely as reinforcing thosepressures and more rarely as giving them new direction or impetus.
OECD 2000

Academic Responses to the UK Foresight Programme
83
References
BROOKS, H. (1994),“The relationship between science and technology”, Research Policy, 23, pp. 477-486.
GODET, M. (1986),“Introduction to La Prospective”, Futures, Vol. 18, pp. 134-157.
HENKEL, M. (forthcoming),Academic Identities and Policy Change, Jessica Kingsley Publishers, London.
HOWELLS, J., NEDEVA, M. and GEORGHIOU, L. (1998),Industry-Academic Links in the United Kingdom, PREST, Manchester and HEFCE, Bristol.
LAYTON, E. (1977),“Conditions of Technological Development” in I. Spiegel-Rösing and D. de Solla Price,Science, Technology and Society: A Cross-Disciplinary Perspective, Sage Publications, London andBeverly Hills.
MARTIN, B. (1993),Research Foresight and the Exploitation of the Science Base, Report commissioned by the Officeof Science and Technology, HMSO, London.
MARTIN, B. (1996),“Technology Foresight: capturing the benefits from science-related technologies”,Research Evaluation, Vol. 6, No. 2 (August).
MARTIN, B. and IRVINE, J. (1989),Research Foresight: Priority Setting in Science, Pinter Publishers, London.
MULKAY, M. (1977),“Sociology of the Scientific Research Community”, in I. Spiegel Rosing and D. de SollaPrice, Science, Technology and Society: a Cross-Disciplinary Perspective, Sage Publications andBeverly Hills, London.
OECD (1993),Educational Research and Development, Trends, Issues and Challenges, Paris.
OST (1993) (White Paper)Realising our Potential – A Strategy for Science, Engineering and Technology, Command 2250,HMSO, London.
OST (1995a),Report from the Steering Group of the Technology Foresight Programme, Summary Document, DTI,London.
OST (1995b),Report of the Steering Group of the Technology Foresight Programme, London, DTI.
OECD 2000

Higher Education Management
84
OST (1997c),Report on the Whitehall Audit of the Foresight Programme, London, DTI.
POST (1997),Science Shaping the Future: Technology Foresight and its Impacts, London, POST.
ROYAL ACADEMY OF ENGINEERING (1998),Preliminary Assessment of the Impact of Foresight: Report of the Working Group, London, RoyalAcademy of Engineering.
SEGAL, QUINCE and PARTNERS (1985),The Cambridge Phenomenon : The Growth of High Technology Industry in a University Town, Segal,Quince and Partners, Cambridge.
WILLS, G. (1972),Technological Forecasting, Penguin, Harmondsworth.
ZIMAN, J. (1984),An introduction to Science Studies, University Press, Cambridge.
OECD 2000
Higher Education Management Vol. 12, No. 1
85
Economics Research in France:Tentative Conclusions Based on EconLit Database
Jean MiruckiUniversité de Valenciennes, France
ABSTRACT
Despite France’s influential role in and significant impact on the development ofeconomic thought in the past, it seems that no recent publication has assembled anup-to-date inventory of its internationally best known contemporary economists. Thepurpose of this study, therefore, is to produce an exploratory survey for 1998 of thescientific contributions of representative economics research groups in France based onthe EconLit bibliographic database. Three indicators, one relating to overall visibility,one to net production and one to international presence, have been used to evaluateand compare two major categories of representative groups: the “French specificity”category [including Conseil National des Universités (CNU) and agrégationgroups] and another made up of more “traditional” groups (including editorialcommittees of journals and the chairmen and management committee of a nationalassociation of economists). The results indicate a clear dichotomy between the two.Moreover, the poor performance of the first of the above categories measured by allthree indicators raises serious questions about the way the public university systemoperates in France and the future implications thereof in the light of the globalisationof the production and dissemination of scientific knowledge.
INTRODUCTION
For several decades many studies on the evaluation of original scientific con-tributions, including those of Bairam (1994), Colander (1989), Conroy et al. (1995),Laband and Piette (1994), and Nederhof and Wijk (1999), have served to classifyindividuals, institutions and journals. These studies, covering several disciplinesand published mainly in English-language journals, have not been so popular inFrance, which is regrettable for several reasons. For a start, the lack of this kind ofinformation is a drawback for young researchers, both those seeking benchmarksand others more concerned with assuming important administrative tasks not
OECD 2000

Higher Education Management
86
directly connected with their research work. Secondly, all the comparative studiescarried out on either an individual or an institutional basis that are published anddiscussed abroad almost invariably ignore the existence of the French-speakingworld. Hence this exploratory survey, which some may consider inopportune, aimsto fill this gap, while in addition yielding some surprising and encouraging results,which are useful for all French economists.
The purpose of our survey is to draw some tentative conclusions regarding thescientific contributions of representative economic research groups in France usingthe EconLit bibliographic database. The advantage of this approach is that it willenable us to evaluate the position of these representative groups in relation toeach other, using three simple criteria to measure scientific activity and its dissem-ination among the international community.
Our overall visibility indicator, which measures the number of entries in Econ-Lit, shows how frequently a researcher’s name appears in the database. The degreeof contact maintained in this way with other researchers is a precondition of anyclaim to notoriety. This is a purely quantitative dimension, which totals the numberof times a name appears either directly, indirectly or implicitly. Direct appearancesconcern statements signed by the author; indirect appearances are taken to be theanalyses, commentaries or citations concerning his work made by others; whileimplicit overall visibility is the case where the person’s name is used as a referenceto illustrate a model, a concept or other theoretical development. Regardless of thewealth of contributions or achievements which a particular scientist may lay claimto, if he does not tangibly exist in the eyes of other researchers using the database,either through his statements, or by the attention others might give him, then hemay well never appear in any later citations, and therefore never be able to buildup his notoriety, regardless of how justified his claims may be.
Net production is the second indicator we need to measure the truly scien-tific dimension of a researcher. It adopts the rules applied in the specialisedliterature by considering only articles selected by the anonymous arbitrationprocedure and is calculated in proportion to the author’s effective contribution.Excluded from consideration are: books, collective works, book reviews, theses,discussion records, special issues, proceedings of meetings, commentaries,replies, corrections, regular features, chronicles, official speeches, commis-sioned articles, presentations, editorial notes, etc. This rather strict approach,which is debatable rather than disputable, may well not meet with approval inFrance, whereas it is the scientific standard recognised throughout top English-language literature. The underlying theory is that the progress of researchshould be measured by the addition to universal knowledge made by originalcontributions, and that only an appreciation of works chosen by the impartialjudgement of peers (whence the anonymity rule) can best ensure the highestpossible quality in the dissemination of new knowledge. The publication
OECD 2000

Economics Research in France: Tentative Conclusions Based on EconLit Database
87
system that best fulfils these conditions is that of scientific journals, with read-ing committees that apply the anonymous arbitration procedure for unsolicitedarticles. It is in this light that Gans and Shepherd (1994) explain how particulararticles come to be rejected, including some submitted by Nobel Prize winners.Beyond that basic consideration, Laband (1990) reminds us of the clear differ-ence from the point of view of impact, in terms of citations and hence of poten-tial notoriety, between journal articles and books. According to him, the latter,even published by the best English-speaking publishers, make up only a verysmall fraction of the citation potential of a single article and for a distinctly morelimited lifetime.
International presence is the last of our three indicators, particularly suited to acommunity of non-English-speaking researchers. It replaces, in a way, the verydemanding classifications of English-language surveys established on the basis ofvery restricted lists of the best journals in the world, which boil down in fact to exclu-sively English-language journals for any selected list of less than twenty. In rejectingthis criterion in our own survey, and instead extending our interpretation of interna-tional presence to some 600 foreign journals, we have avoided a process of exces-sively drastic elimination, which few individuals, and especially representativeFrench groups, would have survived. The only special condition which we haveapplied, for purely practical reasons, is that we have tried to overcome the languagebarrier by selecting, for net production, only articles published in English in English-language or multilingual journals, with a view to guaranteeing “language visibility”.This is because, to the extent that a researcher wishes to be recognised for his originalwork and to be appreciated by as many colleagues as possible worldwide, he will beable to enhance his citation potential by publishing, say, an article in Kyklos in English,rather than in French or German.
To the extent that notoriety constitutes the ultimate objective for a researcheror a group of scientists, and that it represents a sufficient criterion of successfulresearch, why concentrate only on the three indicators described above and not goon to consider this other aspect? In fact, appreciating the degree of notorietyachieved by an individual’s entire work implies a qualitative dimension, which maybe controversial in a number of ways. Of all the possible methods of measurement,the number of citations reckoned on the basis of the publications given in the SocialScience Citation Index is undoubtedly the method most used in available studies.1
Since the work in hand is essentially exploratory and aimed at drawing only prelim-inary conclusions on a new and sensitive subject, it seemed more constructive tolook at France’s real visibility abroad through some of its most representativegroups, to highlight the contrasts between different traditional research structuresand to give our own statistical interpretation, as our contribution to a debate initi-ated a few years ago by Laffont (1995), in the knowledge that scientific evaluationby citation is already part of our next stage.
OECD 2000

Higher Education Management
88
CHOICE OF REPRESENTATIVE GROUPS
Considering what is nationally and internationally at stake in scientificresearch, with the growing globalisation of knowledge production and the prolifer-ation of new information and communication technologies, both researchers andthe public authorities need to take stock of where they stand and how well they aredoing in relation to the rest of the world.2 An exploratory survey must therefore beundertaken as a means of identifying shortcomings, advantages and possibilities assoon as possible, and if necessary taking appropriate action. We shall start byexamining the functioning of two university systems, which apply different princi-ples in order effectively to achieve the objectives of scientific notoriety in the generalinterest of society as a whole.
In the American system, where the university is considered as the real engineof scientific knowledge production, an academic’s tenure represents a long-terminvestment for the institution, as explained by Goodwin and Sauer (1994) and byMcPherson and Schapiro (1999), and will only be granted against the assurance ofhigh quality, confirmed productivity, backed up by a portfolio of publications builtup over a trial period of several years. The so-called “up or out” rule (i.e. promotionor exclusion) ensures that the system’s inherent principle is preserved, since theinvestment in human capital is decided solely in the light of objectives achievedover a medium-term probationary period, with the certainty that no workingteacher/researcher is exempt.
In France, higher education and research are divided between the private sec-tor and the public sector, the latter being subject to specific rules regarding therecruitment and subsequent careers of its teachers/researchers. Lecturers are takenon for a probationary period, lasting at most two years, after which full appointmentwill normally follow automatically in the light of an appreciation of the teachingactivities and the pedagogic or administrative duties performed by the probationerduring this period at the institution. Thus young academics are recruited on thebasis of their research portfolio, made up of their thesis, any related publicationsand any other works produced. They will not, however, be reassessed formally priorto their final appointment. The Conseil National des Universités (CNU) becomesinvolved in the recruitment and advancement process and, in certain cases, thepromotion of candidates to a professorship, but not in their initial appointment.This means that their whole career could take place without any obligation what-ever to produce new publications, since a steady improvement in their financialsituation, in addition to job security, will be guaranteed by their step-by-stepprogression up the professional scale.
In the case of the agrégation competitive examination, which opens the door tothe higher ranks of professorship, the matter of appointment is even more straight-forward, since the probationary period is done away with altogether. Recruitment in
OECD 2000

Economics Research in France: Tentative Conclusions Based on EconLit Database
89
that case is immediate and definitive, as admission is based on past research workand on lessons in which candidates can display their level of knowledge3 as well astheir teaching abilities. The system was conceived in the 19th century as a way ofselecting the most promising young teachers for secondary school and was laterapplied to higher education,4 the logic behind the system being at present to takeaccount of candidates’ abilities both as teachers and researchers. However, consid-ering that poor teaching performance during examination hearings is not penalisedin any way and that already established teachers do not have to undergo that typeof assessment test, the system no longer fully guarantees a high quality of teaching.On the other hand, the recognition of a candidate’s very high quality of research inthe initial stages of the competitive exam may be lost in the case where a promisingresearcher is unlucky in the subsequent lessons draw.5 This means that the exami-nation inherently no longer ensures the primacy of research6 and may even detractfrom it as a result of the random choice of lesson subjects.
The evaluation of economics research in France must then distinguish between“French specificity” (made up of CNU and agrégation groups7), and other selectivegroups measured by more “traditional” notoriety criteria, in line with common eval-uation practices applied in most other countries, and compare the results.
French specificity: CNU and higher education agrégation examination
Lecturers (maîtres de conférences) and CNU professors
The CNU is made up of lecturers (maîtres de conférences, MCF) and professors (PR)elected by their peers or appointed by the public authorities. Their numbers arenot the same and vary from one period to another. Only the last three bureaux, of1988, 1992 and 1995, have been included, with a distinction being drawn betweenlecturers and professors, though none between appointees and elected staff,although such a distinction would have been possible.
Presidents and members of the Jury and candidates who have passed the agrégation examination in higher education
It may be remembered, as we said earlier, that the specific method of recruit-ment and career development in France are such that selected candidates do nothave to undergo a probation period to confirm their research productivity. The out-come depends in fact solely on the sovereign judgement of the agrégation examina-tion Jury.8 It would therefore be useful initially to measure the three indicators forcandidates who passed the examination, with a view to assessing their overallvisibility, their net production and their international presence at the start of theircareers. In order to follow the fair assessment principle applied in the French civilservice, that is, whereby an assessment should be “based on the judgement of
OECD 2000

Higher Education Management
90
peers holding a rank at least equal to or higher than that of the candidate”, theanalysis will also be applied to the members of each of these Juries and, a fortiori, totheir Presidents.
The 30 candidates who passed the last three examinations of 1994, 1996 and1998 will be considered, together with the seven members of each Jury. A fourthseries of 16 candidates who passed the second examination of 1998 will then beadded with that Jury. For the Jury presidents (first and second examinations), theseries has been extended to the seven examinations covering the period from 1989to 1998.
Other selective groups: the traditional references of scientific notoriety
Typically national references
In a more “traditional” approach, the selected reference groups concern theeditorial committees of two major non-specialised journals and one national asso-ciation of economists. The choice of the two journals, the Revue d’économie politiqueand the Revue économique, is of course arbitrary and therefore open to criticism,especially since other journals would have been just as suitable. Considering theexploratory nature of this survey, however, it is quite conceivable that in the nearfuture the selection may be extended to a broader panel of either non-specialisedor specialised journals, whether French, French-language or bilingual. The compo-sition of the French-speaking membership of the journal editorial committees of1998 has been kept, as for the members of the management committee of the Asso-ciation Française de Science Économique (AFSE). The 11 former AFSE presidents havebeen assessed on their contributions on the date they took office, which meantstarting the series no further back than 1978, considering that the EconLit databasebegan only in 1969. Insofar as membership of the Conseil d’Analyse Économique (CAE)implies considerable influence over the economic affairs of the State, this Councilalso deserved detailed analysis on the basis of its official 1997 composition. Onlythe 30 French members of the CAE were selected for specific assessment.
French-speakers on the international scene
For the general public, supreme notoriety for economists goes with the awardof the Nobel Prize. In fact, as Mirucki (1986) has noted, the progression towards thisoften belated recognition may well be “heralded” by earlier appointments or nom-inations. The two most important promotions are nomination to the Fellows of theEconometrics Society, the first step towards high-level international recognition,which may be followed a few years later in the case of the chosen few by the title ofForeign Honorary Member of the American Economic Association. In this survey,two reference groups have been evaluated: firstly the 27 French-speakers admitted
OECD 2000

Economics Research in France: Tentative Conclusions Based on EconLit Database
91
as Fellows of the Econometrics Society since 1973, and secondly, all the ForeignHonorary Members of the American Economic Association received since 1975 outof the previous group, plus the only French Nobel Prize for Economics.9 The sixHonorary Members will therefore make up the majority of the EconLit 100 + groupdescribed in the following paragraph.
In fact, departing from the approach we have followed so far, which consists inappreciating the position held by certain formal groups among the most represen-tative of economic research in France, it seemed worth making up a new informalgroup, called “EconLit 100 +”, based on the first proposed evaluation criterion. Byidentifying French-speakers with an overall visibility higher than a hundred in theEconLit reference database, we can then estimate the highest levels achieved byFrench-speaking researchers. Among the ten members10 of the EconLit 100+ group, we find eight members of the Fellows of the Econometrics Society, whoinclude all six of the above-mentioned Foreign Honorary Members of the AmericanEconomic Association.
RESULTS AND IMPLICATIONS: TENTATIVE CONCLUSIONS
An unmistakable dichotomy emerges from Table 1. Out of the fourteen groupsconsidered, the averages of the first half related to “French specificity” (CNU andagrégation) lie distinctly below those of the other selective groups of French-speakingresearchers. For the latter, the overall visibility indicator is ten times higher; the netproduction indicator is roughly six times higher, while the international presenceindicator, the most significant of the three, is 14 times greater than for the CNU+ agrégation groups.
The international impact of articles concerns only a fifth of publications in the firstpart (19%) but almost half in the second (47%). The classifications of the three indicatorsconfirm without a single exception the clear dichotomy between the two parts.
A more detailed analysis, using a series of graphs11 shows the profiles of eachgroup, though it should be borne in mind that results obtained only from regressiontests will supply information on the “positioning” of variables and not on the distri-bution of publication frequencies.
CNU + agrégation groups: “French specificity”
CNU lecturers
The data are related to the last three groups made up in 1988, 1992 and 1995.They show that half the lecturers have no entries in EconLit, and therefore no cor-responding net production, while for the 44 members as a whole, only five havepublished in foreign journals. Thanks to the good performance of the leadingbureau member in 1992, who has since been promoted to the position of Director
OECD 2000

Higher Education Management
92
Table 1. Overall visibility, net production and international presence of representative economic research groups in France (averages)*
OV R1 Representative groups of French researchers
Year NP R2 IP R3 IP %
0.9 CNU: MCF 1988 0.9 0.0 02.1 CNU: MCF 1992 1.3 0.3 230.8 CNU: MCF 1995 0.6 0.1 171.6 13 Averages for CNU (MCF) (Lecturers) 88-95 1.1 13 0.2 13 184.1 CNU: PR 1988 3.0 0.4 13
13.3 CNU: PR 1992 5.4 0.8 159.1 CNU: PR 1995 4.5 0.6 139.4 9 Averages for CNU (PR) (Professors) 88-95 4.5 9 0.6 10 13
10.3 Agrégation Jury 1994 5.7 0.7 1210.0 Agrégation Jury 1996 4.0 1.3 338.4 Agrégation Jury 1998 5.7 1.0 189.6 8 Averages for agrégation Jury: First exam 94-98 5.1 8 1.0 9 195.0 10 Agrégation Jury: Second exam 1998 3.6 11 1.2 8 334.9 11 Agrégation Jury Presidents 89-98 3.8 10 0.4 12 113.0 Passed agrégation 1994 1.9 0.4 193.1 Passed agrégation 1996 1.7 0.5 313.2 Passed agrégation 1998 2.0 0.6 303.1 12 Averages for Passed agrégation: First exam 94-98 1.9 12 0.5 11 271.0 14 Passed agrégation: Second exam 1998 1.0 14 0.2 13 20
4.8 Averages for CNU + agrégation groups 2.6 0.5 19
19.4 7 Revue Économique 1998 10.3 6 1.3 7 1244.1 3 Revue d’ Économie Politique 1998 13.4 4 5.3 3 3927.4 6 AFSE Directing Committee 1998 9.4 7 3.6 5 3827.6 5 AFSE Presidents 78-98 14.1 3 3.1 6 22
37.1 4Conseil d’analyse économique (French-speakers) 1997 12.2 5 5.2 4 42
77.1 2Fellows of the Econometrics Society (French-speakers) 73-98 22.8 2 15.9 2 70
168.4 1 EconLit 100 + (French-speakers) 1998 39.3 1 23.9 1 61
47.8 Averages for selective groups of French researchers
15.3 7.2 47
* Abbreviated column headings.OV Overall visibility indicator: number of times the name is found (with rating R1).NP Net production indicator: restricted to number of journal articles subject to anonymous arbitration procedure
(excluding books, collective works, book reviews, theses, discussion records, special issues, minutes ofmeetings, commentaries, replies, corrections, regular features, chronicles, official speeches, commissionedarticles, presentations, editorial notes, etc.) and adjusted for effective contribution share in the case of multiple-author articles (with rating R2).
IP International presence indicator: net production, restricted to articles published in English in English-language or multilingual journals, showing language visibility abroad (with rating R3).
IP% International presence coefficient: international impact of net production (IP/NP ratio).
Source: EconLit 1969-3/1998, database of the American Economic Association.
OECD 2000

Economics Research in France: Tentative Conclusions Based on EconLit Database
93
of Research at the CNRS and appointed member of the Fellows of the EconometricsSociety, overall visibility and net production improved substantially in 1992 butremained generally flat in 1995.
CNU professors
The data on professors show a distinct improvement compared with previousgroups, while maintaining the same characteristics, i.e. definite progress in 1992 andsimilar profiles for 1992 and 1995. This time, only three members in 1988 and two in1995 have no entries in EconLit, while a little less than half the members in each ofthe series has published abroad. Overall visibility is six times greater among pro-fessors than among lecturers, but the ratio is only three times more for the interna-tional presence indicator. In practical terms, only one-third of the professors wouldhave published the equivalent of a whole article in a foreign journal by the datethey were elected or appointed to the CNU.
Members of the agrégation examination jury
The analysis of Jury members covers the three first examinations of 1994, 1996and 1998, to which has been added the second examination of 1998. Apart from thevery first observations, overall visibility is below that of the CNU professors. With avery uneven distribution, the 1996 Jury includes the two best performances as wellas the two poorest, i.e. two members with no entry at all in EconLit. For net produc-tion, the four series come closer at each observation level, although the perfor-mance on the whole remains rather modest. It is quite surprising to note that atleast three Jury members of the First examination, in each series, had no interna-tional presence. Generally speaking, the Second examination Jury behaves in asimilar way to the other three, despite poorer net production to start with.
Agrégation examination jury presidents
The three indicators may be evaluated from the data concerning presidents ofeach first and second agrégation examination over the last ten years. Overall visibilityand net production are generally very close, while international presence is non-existent for most of them. In fact, despite their dominant hierarchical position,12 fiveout of seven have never published an article in a foreign scientific journal coveredby EconLit13 throughout their careers.
Candidates passing the agrégation examination
The 30 successful candidates at each first agrégation examination in 1994, 1996 and1998 are very similar as far as overall visibility is concerned, with between threeand six absent from EconLit. This indicator is much better than that of the second
OECD 2000

Higher Education Management
94
1998 examination, for which nearly half are absent. There is a fall-off in net production,but less so than in the case of Jury members. International presence is fairly similar tothat of CNU professors, bearing in mind that some are starting their careers while theothers have already reached a mature stage. Among the successful candidates, onlyone-third in 1994, half in 1996 and a little more than a quarter in 1998 and one-fifth inthe second 1998 examination have published in scientific journals abroad. Despite theprestige attached to the ranking of successful candidates, only one of the four candi-dates who came first in each of the examinations had succeeded in publishing a singlearticle abroad, and then only on a joint basis, by the date of the examination.
Other selective groups: the traditional references of scientific notoriety
For the purposes of the analysis, a distinction was drawn between two groups:national references, i.e. the two major non-specialised journals plus the AssociationFrançaise de Science Économique (AFSE), and secondly the performance of French-speakers among the international community, i.e. members of the Fellows of theEconometrics Society and Foreign Honorary Members of the American EconomicAssociation, the latter all appearing in EconLit 100 +. For the purpose of comparingwith the second group, the analysis also includes members of the Conseil d’analyseéconomique, reflecting a political choice at top government level, and Jury presidentsof the agrégation examination, who, in the spirit of “French specificity”, officially rep-resent the top crust of university research in economics.
National selective groups
In Figure 1, overall visibility for the four selective typically national referencegroups shows distinctly higher averages than in all the previous cases, judging bythe very first observations, and despite two absences in EconLit for two of theseries. It should be pointed out that some researchers as a result of the notorietygained may have appeared in more series than one, which may have increased theaverages. Thus, contrary to the figures given in Table 1, the difference of profilebetween the editorial committees of the two journals, to a great extent, is relativelyless apparent. Apart from the first three observations, the lesser performance of theAFSE presidents may come as a surprise. Net production brings the two journalseven closer together, both of these being caught up by the members of the AFSEmanagement committee. Where international presence is concerned, we find a sig-nificant number of absences: about a third as many for the AFSE management com-mittee as for the Revue d’Économie Politique, and over half of the Revue Économique.
Selective groups of French-speakers in the International arena
In the second category of selective French-speaking groups, Figure 2, com-pared with Figure 1, shows the highest number of EconLit entries observed so far.
OECD 2000

Economics Research in France: Tentative Conclusions Based on EconLit Database
95
Some double and even triple appearances among the series, especially the upperhalf of the first ten observations, would imply that only about 80% out of the total of74 representations can be taken as the real number of different researchers identi-fied in Figure 2. One quarter of the CAE members and one agrégation Jury presidenthave no entry in EconLit. The distinct contrast between Jury presidents and theother three groups sheds a very revealing light on the position held by the top levelof “French specificity” within the circle of French-speaking researchers when itcomes to their presence in an international showcase such as the EconLit database.Net production roughly follows the same profiles as before, with for the EconLit 100+ group a declining tendency for the second half.
1 3 5 7 9 11 13 15 17 19 21 23 25 27 29
300
250
200
150
100
50
0
300
250
200
150
100
50
0
Figure 1. Global visibility of presidents and directors of the AFSE,and editors of selected journals
Presidents of the AFSE
Board of directors of the AFSE
Board of editors of the Revue Économique
Board of editors of the Revue d’Économie Politique
Ranking by number of entries in EconLit1 3 5 7 9 11 13 15 17 19 21 23 25 27 29
300
250
200
150
100
50
0
300
250
200
150
100
50
0
Figure 1. Global visibility of presidents and directors of the AFSE,and editors of selected journals
Presidents of the AFSE
Board of directors of the AFSE
Board of editors of the Revue Économique
Board of editors of the Revue d’Économie Politique
Ranking by number of entries in EconLit
OECD 2000

Higher Education Management
96
A new ranking appears in Figure 3, reflecting the international presence ofFrench-speakers. Once again, it is worth sounding a word of caution against any pri-mary interpretation of the averages given in Table 1. At the top come the first fiveobservations, related to researchers of the EconLit 100 + group and to the group ofthe Fellows of the Econometric Society (these are duplicates), the first three beingat the same time Foreign Honorary Members of the American Economic Associa-tion. The second rank is held by the rest of the members of the Fellows of theEconometrics Society, followed by the other part of the EconLit 100 + group, aheadof a good top half of CAE members. In terms of international presence, the contrastobserved in Figure 3 between agrégation Jury presidents and the other three groupsis quite striking and not a little surprising.
1 3 5 7 9 11 13 15 17 19 21 23 25 27 29
300
250
200
150
100
50
0
300
250
200
150
100
50
0
Ranking by number of entries in EconLit
Figure 2. Global visibility of selective groups of francophones
EconLit 100+
Council of economic analysis
Fellows of the Econometrics Society
Presidents of the Jury of the agrégation
OECD 2000

Economics Research in France: Tentative Conclusions Based on EconLit Database
97
TENTATIVE CONCLUSION
This exploratory analysis carried out with the help of the EconLit bibliograph-ical database constitutes a mere overview of descriptive statistics. It can be per-formed by any researcher using or having access to a recent version of this databaseavailable in the form of a CD-ROM. This means that potentially several thousandeconomists can lay their hands on the necessary data, a process which is bound tobecome easier still in the future, since EconLit may also be accessed on the Internet.In addition, comparative analyses with other countries or language groups can now
1 3 5 7 9 11 13 15 17 19 21 23 25 27 29
60
50
40
30
20
10
0
60
50
40
30
20
10
0
Ranking by number of scientific articles published in foreign journals (net production)
Figure 3. International presence of selective groups of francophones
EconLit 100+
Council of economic analysis
Fellows of the Econometrics Society
Presidents of the Jury of the agrégation
OECD 2000
Higher Education Management
98
be made concerning the groups of researchers applying the traditional standards ofnotoriety, included in the second part of Table 1.
The purpose of this study was to check whether the criteria for evaluatingresearch in France were the same as those applied in the international scientificcommunity at large or might be even partially related. The results in effect show anundeniable dichotomy between the two categories of groups. First we have thecircle of public higher education, with its “French specificity” embodied in itsrecruitment and career advancement rules, a set of procedures and practices gov-erned by the members of the CNU and those of the agrégation Jury, with the backingof the public authorities. In the light of information published on other countries,the figures obtained are disappointing and somewhat alarming.
This pessimistic view disappears rapidly if we examine the second category ofthe more “traditional” groups, made up mainly, as in most of the industrialised coun-tries, on the basis of performance and the degree of notoriety acquired according tothe rules of competitive publication. This category includes a number of academicsand reflects a fairly decentralised geographical distribution. The best performancescome from groups which have already obtained recognition abroad, i.e. the French-speaking members of the Fellows of the Econometrics Society and the EconLit 100+ group, most of the latter being also Foreign Honorary Members of the AmericanEconomic Association. This means that a great many of these researchers make aquite commendable contribution to France’s presence on the international scene,going against any preconceived ideas regarding the domination of English-speakingeconomists or the impermeability of their journals to European work.
Admission to the very select group of Foreign Honorary Members of the AmericanEconomic Association is considered as a very promising step forward towards thewaiting room for potential Nobel Prize laureates, considering that all non-Americanrecipients of the prize14 first went through the stage of being admitted HonoraryMembers. Hence it is encouraging to note that, in the various classifications drawnup in another study prepared by Mirucki (1999b), which concentrated specifically onthe 52 Foreign Honorary Members of the American Economic Association (English-speakers who are either non-American or nationals of other countries in the world),the one who comes out top is always a Frenchman, a provincial academic,15 thesame person we find at the top of the lists in Figures 2 and 3 of selective French-speaking groups according to criteria of overall visibility or international presence.
Acknowledgement
The author wishes to thank more specifically Drucilla Ekwurzel and Jean-JacquesLaffont for their encouragement and their commentary.
OECD 2000

Economics Research in France: Tentative Conclusions Based on EconLit Database
99
Notes
1. See Davis and Papanek (1984), Downing and Stafford (1981), Laband (1990), Laband andPiette (1994), Liebowitz and Palmer (1984) and Wouters (1999).
2. Another survey prepared by Mirucki (1999a), equally exploratory, gave a preliminarypicture of the state of economics research in Ukraine.
3. In the United States, this basic knowledge check, which takes place before a jury (PhDComprehensive Exam), is a precondition of enrolment to the thesis preparation stage,which has the effect of automatically excluding from teaching, even during the proba-tionary period, all candidates who are unable to meet the standard.
4. André Chervel (1993), Histoire de l’agrégation, Paris, Institut National de RecherchesPédagogiques, Editions Kimé.
5. In France, the agrégation competitive economics examination takes place in three stages:discussion of works produced to determine preliminary approval, presentation of a the-oretical lesson to confirm approval and a final stage (one or two applied lessons) toestablish a classification list of successful candidates.
6. In his report as President of the Jury of the 1995-1996 agrégation examination, Bourguinat(1997) goes even further: “… the Jury, breaking somewhat with tradition, having decidedto reject certain candidates who, albeit of a fair standard, might not have succeeded incompleting the examination process” (p. 132). Candidates eliminated in this way thenhave to accept a negative judgement on their research work and will not be given achance to try to improve their performance in the lessons, in the event that they mightsit the examination again, nor are they left the choice of voluntarily withdrawing theircandidature between two tests to avoid the humiliation of a rejection, which is candidlyadmitted to be unfair but which nevertheless officially amounts to a clear-cut failure.
7. Several authors have tackled the issue of the characteristics of the French universitysystem, such as Frey and Eichenberger (1993), Kolm (1988), Portes (1987), Ratier-Coutrot(1985) and Wolfelsperger, Pommerehne and Frey (1988).
8. It might be feasible to analyse the case of directors of theses or establishments accordingto their classification ranking or the degree of success achieved by their approvedcandidates.
9. Maurice Allais, winner of the Nobel Prize for Economics in 1988, did in fact go through theprevious two appointments, his initial membership of the Fellows in 1949 beingfollowed by his confirmation as Foreign Honorary Member of the American EconomicAssociation in 1976.
10. Out of the ten members of the EconLit 100+ group, four are academics and three teachin the provinces. It is significant to note that all four completed part of their studies and/or career abroad.
OECD 2000

Higher Education Management
100
11. For reasons of editorial convenience, only three of the 19 graphs produced have beenincluded in this article, but readers who are interested may obtain the missing detailsfrom the author.
12. Traditionally, the Jury presidents of agrégation examinations are appointed from amongthe professors on the highest “rungs” of the ladder, in other words, at the highest gradeand step of all teacher-researchers in each discipline, with an alternation between Parisand provincial universities. This hierarchical position is itself determined in the light ofpromotion decisions taken during the individuals’ careers by the CNU. Hence the factthat the functional links between the CNU and the agrégation examination clearlyillustrate the notion of “French specificity”.
13. In recent years, the number of journals covered by EconLit has doubled, by nowexceeding 600, the great majority of which are English-language publications.
14. Out of a total of 15 prize-winners, the only exception was Leonid Kantorovitch (USSR) in 1975.
15. Although the anonymity rule was applied to all groups, it is clear that merely by comparingdifferent memberships, it is quite easy to identify the person in question, who is none otherthan Jean-Jacques Laffont, Professor at Toulouse I University.
OECD 2000

Economics Research in France: Tentative Conclusions Based on EconLit Database
101
References
BAIRAM, E.I. (1994),“Institutional affiliations of contributors to top economic journals, 1985-1990”, Journal of Economic Literature,Vol. 32, pp. 674-679.
BLANK, R.M. (1991),“The effects of double-blind versus single-blind reviewing: experimental evidence",American Economic Review, Vol. 81, pp. 1041-1067.
BOURGUINAT, H. (1997),“Rapport sur le concours d’agrégation de sciences économiques 1995-1996”, Revue d’ÉconomiePolitique, Vol. 107, pp. 131-140.
CHERVEL, A. (1993),Histoire de l’agrégation, Institut national de recherches pédagogiques, Éditions Kimé, Paris.
CHUNG, K.H., COX, R.A.K. and OKUNADE, A.A. (1993),“Publishing behavior of individuals and most prolific authors in the economics litera-ture”, Quarterly Journal of Business and Economics, Vol. 32, pp. 32-42.
COLANDER, D. (1989),“Research on the economics profession”, Journal of Economic Perspectives, Vol. 3, pp. 137-148.
CONROY, M.E. et al. (1995),“The productivity of economics departments in the US: Publications in the core journals”,Journal of Economic Literature, Vol. 33, pp. 1966-1971.
DAVIS, P. and PAPANEK, G. (1984),“Faculty rating of major economics departments by citations”, American Economic Review,Vol. 74, pp. 225-229.
DELORME, C.D. and KAMERSCHEN, D.R. (1987),“What ‘Who’s Who in Economics’ tells us about the economics profession”, Quarterly Review ofEconomics and Business, Vol. 37, pp. 65-79.
DOWNING, P.B. and STAFFORD, E.A. (1981),“Citations as an indicator of classic works and major contributors in social science”, PublicChoice, Vol. 37, pp. 219-230.
EHRENBERG, R.G. (coordinated by) (1997),The American University: National Treasure or Endangered Species? Cornell University Press,Ithaca.
FREY, B.S. and EICHENBERGER, R. (1993),“American and European economics and economists”, Journal of Economic Perspectives,Vol. 7, p. 185-193.
OECD 2000

Higher Education Management
102
GANS, J.S. and SHEPHERD, G.B. (1994),“How are the mighty fallen: rejected classic articles by leading economists”, Journal ofEconomic Perspectives, Vol. 8, pp. 165-179.
GOODWIN, T.H. and SAUER, R.D. (1995),“Life cycle productivity in academic research: evidence from cumulative publicationhistories of academic economists”, Southern Economic Journal, Vol. 61, pp. 728-743.
HAMERMESH, D.S. (1994),“Facts and myths about refereeing”, Journal of Economic Perspectives, Vol. 8, pp. 153-163.
HANSEN, W.L. (1991),“The education and training of economics doctorates”, Journal of Economic Literature,Vol. 29, pp. 1054-1087.
HICKS, D. (1999),“The difficulty of achieving full coverage of international social science literature and thebibliometric consequences”, Scientometrics, Vol. 44, pp. 193-217.
HODGSON, G.M. and ROTHMAN, H. (1999),“The editors and authors of economics journals: a case of institutional oligopoly?”,Economic Journal, Vol. 109, pp. 165-186.
KASPER, H. et al. (1991),“The education of economists”, Journal of Economic Literature, Vol. 29, pp. 1088-1109.
KOLM, S.C. (1988),“Economics in Europe and the US.”, European Economic Review, Vol. 32, pp. 207-212.
LABAND, D.N. (1990),“Measuring the relative impact of economics book publishers and economics journals”,Journal of Economic Literature, Vol. 28, pp. 655-660.
LABAND, D.N. and PIETTE, M.J. (1994),“The relative impacts of economics journals: 1970-1990”, Journal of Economic Literature,Vol. 30, pp. 640-666.
LAFFONT, J.J. (1995),“Réflexions sur l’agrégation d’économie”, Revue d’Économie Politique, Vol. 105, pp. 353-356.
LIEBOWITZ, S.J. and PALMER, J.P. (1984),“Assessing the Relative Impacts of Economics Journals”, Journal of Economic Literature,Vol. 22, pp. 77-88.
LOVELL, M.C. (1973),“The Production of Economic Literature: An Interpretation”, Journal of Economic Literature,Vol. 11, pp. 27-55.
McPHERSON, M.S. and SCHAPIRO, M.O. (1999),“Tenure Issues in Higher Education”, Journal of Economic Perspectives, Vol. 13, pp. 85-98.
MIRUCKI, J. (1986),“Prix Nobel: les lauréats prennent de l’âge”, Collection: Des idées, des événements, LeDevoir, 21 octobre 1986.
MIRUCKI, J. (1999a),“A Visibility Analysis of the Scientific Production of Ukrainian Economists: 1969-94”,Journal of Socio-Economics, Vol. 28, pp. 221-232.
OECD 2000

Economics Research in France: Tentative Conclusions Based on EconLit Database
103
MIRUCKI, J. (1999b),“What does an American Economic Association Foreign Honorary Membership NominationReally Imply?”, working paper.
NEDERHOF, A.J. and WIJK, E. (1999),“Profiling Institutes: Identifying High Research Performance and Social Relevance in theSocial and Behavioral Sciences”, Scientometrics, Vol. 44, pp. 487-506.
PORTES, R. (1987),“Economics in Europe”, European Economic Review, Vol. 31, pp. 1329-1340.
RATIER-COUTROT, L. (1985),“Les économistes français vus d’Amérique”, Futuribles, Vol. 91, pp. 71-76.
WOLFELSPERGER, A., POMMEREHNE, W.W. and FREY, B.S. (1988),“La valeur des économistes français”, Revue française d’économie, Vol. 3, pp. 145-174.
WOUTERS, P. (1999),“Beyond the Holy Grail: from citation theory to indicator theories”, Scientometrics, Vol. 44,pp. 561-580
OECD 2000

Higher Education Management Vol. 12, No. 1
105
The Use of Indicators in the Strategic Management of Universities
Richard L. MorrillUniversity of Richmond, Virginia, United States
ABSTRACT
Universities around the world are under increasing pressure to develop indicatorsof quality and performance. This paper argues that when set in a strategic contextand understood appropriately, indicators can be a powerful tool of leadership anddecision-making. They can contribute substantially to the elaboration of an insti-tution’s self-understanding, the establishment of its priorities, and the evaluationof its work.
INTRODUCTION: THE DEMAND FOR INDICATORS
During the past two decades most of the systems of higher education in OECDcountries have turned their attention to the issue of indicators of performance. Asuniversities have grown rapidly in size and in the scope and importance of theiractivities, they have come to occupy an ever more central place in the expenditureof both public and private funds. As a result of this continuing and enlarging flow ofresources, elected representatives, government officials, and the media have pres-sured universities to provide measures of their quality and achievements. Withcountless claimants for limited funds, governments and others have requireduniversities to justify their needs and to demonstrate their accountability.
In response to this pressure for indicators of performance, universities havebeen diffident and cautious. In academic circles it is widely claimed that the work ofthe university is not easily measured by quantitative indicators of productivity orquality. The discovery and transmission of knowledge and the formation of the mind,are complex human processes whose results cannot be reduced to simple measuresof productivity. Universities emphasize that they evaluate themselves continuouslyand appropriately through peer review performed by academic professionals.
OECD 2000

Higher Education Management
106
Nonetheless, the thirst for measures is unrelenting and widespread, especiallyconcerning transparent indicators of institution-wide quality and capacity. In an effortto be responsive to the society that it serves and on which it depends, most insti-tutions have developed an implicit or explicit set of indicators that they use in var-ious ways to evaluate their strategic position and to assess their work. Rarely, ifever, do these indicators function with the directness and normative character thatone might find in an industrial corporation. Yet they are increasingly used as waysto reflect the strengths, weaknesses and effectiveness of institutions of higherlearning. Often developed through processes for accreditation or state funding,they are used primarily by institutions in self-evaluations to improve their ownprocesses or programs (formative evaluation).
Quite frequently the claim is now heard that normative (or summative) judge-ments of performance should be made through the use of indicators, and fundingawarded in terms of levels of demonstrated quality. Several state systems in theUnited States are experimenting with this kind of normative (or summative) evalu-ation for funding. To put these new funding approaches into perspective, it must besaid that institutions are typically given the freedom to set their own goals accord-ing to their mission, and that many of the “indicators of quality” relate to the estab-lishment of “best practices”, such as mandated evaluation procedures (for teaching,tenured faculty, etc.).
STRATEGIC DECISION-MAKING AND THE CULTURE OF THE UNIVERSITY
The central aim of this article is to define the context in which indicators can beused most constructively and effectively within higher education. It will be arguedthat when set in a strategic context and developed appropriately, indicators can bea powerful tool of leadership and decision making. As institutions define them-selves and set priorities for their future in terms of the opportunities and challengesthat confront them, carefully drawn indicators can be of substantial benefit.
Since the effective use of indicators has been given a strategic orientation, wemust first understand the power and the possibility of strategic decision making foruniversities.
Everyone who exercises leadership and management responsibilities within auniversity knows well that the decision making culture of institutions of higherlearning is peculiar and challenging. As both direct management experience andformal studies of higher education reveal, universities must respond to multipleconstituencies. Studies by European and American scholars, and the reports oforganizations like US accrediting and educational associations, the OECD and theAssociation of European Universities all reach similar conclusions. Universitieshave multiple constituencies – the interests of faculty, staff, boards of directors,local and national governments, students, parents, former students, and others, all
OECD 2000

The Use of Indicators in the Strategic Management of Universities
107
seek to be represented in university decisions. In some countries some groups aremore salient and organized than in others, but the patterns are reasonably compa-rable. In such a context, as is said in a recent report on the role of the universitypresident by the Association of Governing Boards in the United States, a presidentoften becomes simply a juggler of interests. Presidents find it increasingly difficultto set an agenda for action and to move that agenda toward implementation.
The problem of multiple constituencies is related to an even deeper problem,which again seems to be nearly universal in university decision making. The funda-mental challenge in university decision-making is the requirement to institutional-ize the values of academic professionals, values that typically resist the veryprocesses of institutionalization. To be effective and to do their best work, aca-demic professionals require substantial autonomy. Yet, all institutions as such nec-essarily insist upon regulations and controls in order to be accountable to the largersocial system of which they are a part. Every participant in university decision-making knows well the small and large conflicts between autonomy and control thatplay out on a daily basis in virtually every university. Similarly, academic profes-sionals insist on resources to serve the intrinsic value of the knowledge they seek,while institutional leaders must forge instrumental decisions that will strike abalance among the competing claims on the university’s limited funds.
Academic autonomy plays out in especially complex ways as academic disci-plines organize themselves into departments, programs and schools. Now the pro-fessional autonomy of individuals becomes compounded and intensified as theyorganize themselves into groups and units that frequently define their prioritiesseparately from the goals of the larger organization. Most observers of highereducation comment on the fragmentation of university life and decision-making.
One could easily continue to elaborate on the complexity of decision makingwithin higher education by examples of other conflicts in the fundamental values ofthe decision-making culture. Even this brief analysis suggests that universitiesneed to invest considerable time and energy in the discovery and articulation ofthe shared values and common interests that mediate and transcend the conflicts,providing a sense of common purpose. Indeed, the discovery of a common set ofvalues that can serve as the basis for the collective life of the organization is one ofthe primary tasks of leadership. A number of scholars have concluded, in fact, thateffective leadership depends upon the ability of leaders to know and to articulatethe institution’s identity, or as one frequently hears, to know and to tell the university’sstory. In the words of the Harvard psychologist, Howard Gardner,
“I argue that the story is a basic human cognitive form; the artful creation andarticulation of stories constitutes a fundamental part of the leader’s vocation.Stories speak to both parts of the human mind – it’s reason and emotion. AndI suggest further, it is in stories of identity – narratives that help individuals think
OECD 2000

Higher Education Management
108
about and feel who they are, where they come from, and where they are headed– that constitute the single most powerful weapon in the leader’s literary arsenal.”
With this as the vital context, that is, strategic decision-making that manifestsan institution’s distinctive possibilities and priorities, we can begin to see thepotential power of effective indicators. Indicators can contribute substantially tothe elaboration of an institution’s self-understanding, the establishment of itspriorities, and the evaluation of its work.
As a consequence, the suggestion arises that institutional leaders can seek todevelop indicators as a means through which to answer the question of identity,“Who are we?” To do so is to transform dead statistics into indicators that have thecapacity for self-revelation. The task is to read indicators as measures that pointbeyond themselves because they reveal an institution’s special identity, as foundin its distinctive capacities and core competencies.
INDICATORS: STRATEGIC, KEY, PROPORTIONATE, COMPARATIVE, AND TRENDLINE
If both quantitative and qualitative indicators are to have this capacity to con-vey meaning they must obviously be chosen carefully and thoughtfully. So, forexample, it is important to move back and forth between raw statistical informationand the more intuitive sense that a community possesses of its distinctive missionand its particular opportunities. Within this process of reflection and dialog aboutan institution’s best possibilities, indicators will present themselves in variousbasic forms. Typically, this involves translating raw information into ratios or intopercentages that capture an institution’s relative position on a given measure. Fre-quently indicators are most effective when they relate an absolute figure to a depic-tion of relative position. Thus, it is helpful to know how a measure translates into aper-student, or per-faculty, or per-employee measure.
Also vital is the disciplined selection of the most illuminating or “key” indicators,those that carry the central motifs of the institutional story in an “economic” form. Toomany or less important indicators will weaken the strategic impact of the process. Theselection of indicators, both as to number and form is a demanding task, but also onethat can evolve over time. The aim is to find meaning in the indicators, and the taskof institutional leaders as managers is to manage those meanings.
When key measures are presented in relative terms, by ratios, by percentages,or by other proportionate measures, it then becomes possible to develop effectivecomparative analyses. If good data can be obtained (which is often not the case)from similar institutions, then a pattern of relative indicators can be used effectivelyto compare results. Needless to say, the task of self-understanding is usuallyadvanced substantially when a fruitful comparison can be made with others.
OECD 2000

The Use of Indicators in the Strategic Management of Universities
109
The use of comparative data can lead to the development of common bench-marks in which certain measures come to be associated with a “best practice” andthereby take on the character of a norm. Yet, even if benchmark results prove onlyinfrequently to be true norms, much is to be learned from the process of careful ana-lytical comparison. Comparative analysis reveals quickly the fundamental truth thatindicators only have meaning when they are interpreted within a larger framework ofprofessional analysis and judgement. If the indicators are pushed prematurely orinappropriately into a normative or judgmental role, then their true purpose is dis-torted. Indicators can be significant points of departure for reflection and for inquiry.They give rise to thought and help to shape critical questions for exploration morethan providing definitive answers. If, for example, a comparative analysis shows thata university’s costs are much higher than any comparable institution for a given activ-ity, there may or may not be good reasons that explain the divergence. The diver-gence carries no fixed meaning, but it presses for an exploration of the issue with afocal point for the inquiry. Ultimately, indicators have to be drawn into the context ofconscientious professional judgement and decision-making to be effective.
Just as comparative data can help to sharpen an institution’s sense of itself, socan trendlines in indicators reveal substantial changes in an institution’s identityover time that otherwise might be missed. An analysis of changing patterns ofenrollment by program and degree over, say, a ten-year period may tell a very sig-nificant story. In many contemporary institutions these trendlines show a strongpattern of student movement toward ever more practical and applied fields andaway from fundamental disciplines in the arts and sciences. A clear cognizance ofthese trends sets the stage for professional reflection and potential action torespond to the trends as institutional mission, circumstances and resources dictate.
Trend analysis is obviously of critical significance in analyzing an institution’s finan-cial performance. Often at stake in this domain are changing patterns in the structure ofan institution’s income and expense. What is happening over time to the structuralcomponents of revenue, for example? Many European and US public institutions havelearned from their financial trendlines that they are far less state-supported than wasthe case just a decade ago. Revenues from student tuition, adult students, research,contracts, and rental of facilities have increased dramatically as a proportion of income,while state subsidy has dropped dramatically. What is the strategic meaning of thesenumbers? It has given rise in some states in the United States to the exploration of aredefinition of the very terms of institutional identity and governance.
UNIVERSITY OF RICHMOND FACT BOOK: PLANNING AND PERFORMANCE
It may be helpful to connect theory with practice by examining the use of indi-cators in a concrete case, the University of Richmond’s Fact Book. The Fact Book, anannual publication, is organized around the basic areas of institutional life, each of
OECD 2000

Higher Education Management
110
which has a series of measures. Thus there are sections and indicators relating togeneral characteristics, admission and enrollment, finances, fund raising, academicprograms, faculty, and student life. The information is displayed precisely in theforms that have been suggested; that is, there are trendlines, ratios, percentages,and a substantial amount of comparative information, based on comparisons with20 other institutions. The data reveal some of the particularities of the Americanexperience, but that may represent a difference more in form than substance.
It might be interesting to look at one of the places where the differencebetween American and European universities is the largest, and that is in the realmof fund raising. The section on “Development” in the Fact Book provides a goodexample of the analysis of the University’s fund-raising performance through theuse of indicators. The data are presented both in terms of single-year resultsthrough time, as well as by means of three-year averages in the comparative analy-sis. What is the reason for the two types of indicators? A one-year result can be mis-leading when used for comparison because there are erratic variations from oneyear to the next in an institution’s receipt of funds. Much depends upon whether theinstitution had a special fund-raising campaign or whether it perhaps received alarge bequest in a given year. Also critical for comparative analysis is the amount ofresources that were raised on a per-student or other relative basis. Without propor-tionate results, there is little ability to understand the real potency of a fund raisingprogram. The size of the institution is obviously critical in relation to its results; bothin terms of the number of sources to which a university can turn as well as the wayits needs are influenced by size. Accurate knowledge of an institution’s relativecapacity to raise funds provides fundamental and decisive information about theinstitution’s possibilities for the future.
The data that we find in this Fact Book, and in many similar publications at otheruniversities, goes not only to the question of identity but as well to the issue of per-formance. The same indicators tell us not only who we are but also how we havedone. Now, in this context it is critical to understand that the term “performance” istypically used very broadly. For many university activities, especially the core edu-cational processes, there are only proxies for performance. So for example, theassessment of an institution’s effectiveness in providing students with a superioreducation can only be approached by using pointers and proxies for a process thatis itself beyond genuine measurement. What are some of these proxies? At the Uni-versity of Richmond each academic department is expected to develop its own pat-tern of exit interviews with students, to send periodic questionnaires to graduates,and to collect data on the post graduate activities of its alumni. In the Fact Book itselfthere are summary data about the success of students on various postgraduateexaminations, including public licensure exams. The results of an annual survey ofgraduate employment patterns as well as admission rates to various graduate andprofessional schools are included in the Fact Book. Graduating students are also
OECD 2000

The Use of Indicators in the Strategic Management of Universities
111
asked more subjective questions in terms of their opinions regarding the quality ofthe education they have received, the skills and knowledge they have gained, thechanges they note in their academic interests, and their evaluation of variousadministrative offices and services. This survey is done on a comparative basis witha dozen other institutions. All of these efforts are embedded in a continuing andcomprehensive process of evaluation by school, department and university-widethat is linked to cycles of strategic planning and accreditation.
The issue of performance is also to be found in other sections of the Fact Bookalthough often the term takes on shifting meanings as one moves from one contextto another.
So, for example, the Fact Book contains annual faculty salaries by rank, as wellas comparative data from national studies and from designated groups of similarinstitutions. To the extent that the strategic goals that have been set for salaries areachieved, this is taken as a measure of successful performance. Performance is alsomeasured, perhaps more directly, in the ways in which financial position is evalu-ated. At a minimum, effective performance requires a balanced budget, but actualexpectations are set to a higher standard. At the University of Richmond and mostother private institutions, the endowment is expected to grow more rapidly thanspending plus inflation, and funds are set aside annually for the maintenance,renovation and replacement of campus facilities and equipment.
In the realm of performance, it is clear that indicators must be chosen carefullyby the institution itself for them to have meaning. In selecting them, attention hasto be focused on those measures that will display an institution’s own perspectiveson quality to enable what we have called formative evaluation. No one can designabsolute measures that would fit every institution to measure abstract definitionsof performance.
CONCLUSION: SELF-DEFINITION, EVALUATION, AND IMPROVEMENT
The data that is gathered and analyzed for self-definition, and is then turnedtoward the purposes of the evaluation of performance, obviously sets the contextfor the establishment of goals for the future. The process of strategic planningdepends critically on the establishment of objectives, many of which will be numer-ical, to guide the institution’s design for the future. Needless to say, numerical goalsmust be chosen with consummate care if they are to be both realistic and demand-ing in energizing that institution’s best possibilities. Goals need to be aspirationalas well as attainable so that their achievement will take on genuine significance andprovide the basis for institutional pride and confidence.
Finally, the indicators that an institution chooses must provide the basis for itscontinuing efforts at evaluation and at self-improvement. As institutions continuallyassess themselves by the indicators that they have chosen to define themselves
OECD 2000

Higher Education Management
112
and their aspirations, the basis is set for constant institutional improvement. As theresults of evaluation are gathered the question immediately is posed as to howwhat has been learned will be used to improve the institution’s overall effective-ness. Thus, a closed loop is created as indicators are developed to reveal an insti-tution’s identity, to set goals, to assess its effectiveness, and finally translated intopolicies and practices that will result in improvements to overall performance.
One goal of this article has been to demystify much of the current emphasis onthe use of indicators within higher education. When pursued in the improper man-ner, as if they were universal measures of achievement that could be imposed fromthe outside, or when it is believed that educational performance can be entirelyquantified, they are meaningless or even dangerous. If, on the other hand, indica-tors are developed within the context of an institution’s own efforts at strategic self-definition to both reveal and evaluate its own effectiveness, then the contributionto effective leadership and decision making is substantial. Indicators then becomepart of an unbroken process of strategic discovery, evaluation, and action that offertools of leadership of substantial power and promise.
References
GARDNER, H. (1995), Leading Minds, New York, NY, p. 43.
RENEWING THE ACADEMIC PRESIDENCY (1996),Report of the Commission on the Academic Presidency, Association of Governing Boards.
OECD 2000
Higher Education Management Vol. 12, No. 1
113
Index to Volume 11
The following section contains a list of contribution published in Volume 11/1999.The list is organised in alphabetical order of authors. The title of articles is listedonly once in the case of multiple authors.
Appropriate articles are abstracted/indexed in Current Index to Journals inEducation (ERIC).
Contributions Vol. No. Pages
ATKINS, M., DERSLEY, J. and TOMLIN, R. The Engagement of Universities in Regional Economic Regeneration and Development: A Case Study of Perspectives 11.1 97-116
BRANDT, E. Higher Education Institutions and the Market for Lifelong Learning in Norway 11.2 19-30
BYRNE, J. V. Taking Charge of Change: A Leadership Challenge for Public Higher Education 11.1 79-90
COALDRAKE, P. The Changing Climate of Australian Higher Education: An International Perspective 11.1 117-136
DANERMARK, B. Disabled Students in Higher Education: Management for Inclusion 11.3 113-126
DUKE, C. Lifelong Learning: Implications for the University of the 21st century 11.1 19-36
EL-KHAWAS, E. The “New” Competition: Serving the Learning Society in an Electronic Age 11.2 7-18
ENGWALL, L., LEVAY, C. and LIDMAN, R. The Roles of University and College Rectors 11.2 75-94
ERIKSSON, C. B. Role Conflict and Ambiguity at the Departmental Level 11.1 81-96
GLADIEUX, L. E. and SWAIL, W. S. The Virtual University and Educational Opportunity: Panacea or False Hope? 11.2 43-57
GYÖRFFI, M. Co-operation in Hungarian Higher Education in the View of a World Bank Programme 11.2 57-74
HARMAN, G. Setting Public Funding Priorities for “Learning for Life”: Recommendations of the Australian Review of Higher Education Financing and Policy 11.3 7-24
OECD 2000

Higher Education Management
114
HILL, S., MCNICOLL, I. and ROBERTS, A. The Economic Effectiveness of Higher Education in “Nation” Regions of the United Kingdom: a Comparative Study of Scotland and Wales 11.3 127-142
JOUANDEAU, A. Reversing the Flow in Higher Education: Necessary Changes in the Training of French Engineers 11.3 41-50
KANG, M.-S. Opening New Horizons for Lifelong Learning at the Tertiary Level: The Introduction of the Educational Credit Bank System 11.2 31-42
KEHM, B. M. The Challenge of Lifelong Learning: Differences and Reactions of East and West German Higher Education Institutions 11.3 25-40
LANG, D. W. Responsibility Centre Budgeting and Responsibility Centre Management in Theory and Practice 11.3 81-112
MOULY, V. S. and NILAKANT, V. A Case Study of a University in Transition in New Zealand 11.2 95-112
PROEHL, R. A. Cross-Functional Teams: an Innovation or Just Another Committee? 11.3 63-80
SHATTOCK, M. L. The impact of the Dearing Report on UK Higher Education 11.1 7-18
SMITH, D., BARGH, C., BOCOCK, J. and SCOTT, P. New Leaders at the Top? The Educational and Career Paths of UK UniversityVice-Chancellors (1960-1996) 11.2 113-135
STAMELOS, Y. The Changing Role of Greek Universities 11.3 51-62TEICHLER, U. Life-Long learning as Challenge for Higher Education:
The State of Knowledge and Future Research Tasks 11.1 37-54WAGNER, A. Tertiary Education and Lifelong Learning:
Perspectives, Findings and Issues from OECD Work 11.1 55-68
Contributions Vol. No. Pages
OECD 2000

Information for Authors
Contributions to the IMHE Journal should be submitted in either English or French and all articlesare received on the understanding that they have not appeared in print elsewhere.
Selection procedure and criteria
Selection of articles for publication is carried out by the Editor of the Journal. Articles short-listedfor consideration are submitted to independent referees for review.
The Journal is primarily devoted to the needs of those involved with the administration and studyof institutional management in higher education. Articles should be concerned, therefore, with issuesbearing on the practical working and policy direction of higher education. Contributions should, how-ever, go beyond mere description of what is, or prescription of what ought to be, although both descrip-tive and prescriptive accounts are acceptable if they offer generalisations of use in contexts beyondthose being described. Whilst articles devoted to the development of theory for is own sake willnormally find a place in other and more academically based journals, theoretical treatments of direct useto practitioners will be considered.
Other criteria include clarity of expression and thought. Titles of articles should be as brief as possible.
Presentation
**Three copies of each article should be submitted, typewritten (1½ spaced) on one side of a pageonly.
Length: should not exceed 15 pages including figures and references.
The first page: before the text itself should appear centred on the page in this order the title of thearticle and the name(s), affiliation(s) and country/countries of the author(s).
Abstract: the main text should be preceded by an abstract of 100 to 200 words summarising the article.
Quotations: long quotations should be single-spaced and each line should be indented 7 spaces.
Footnotes: authors should avoid using footnotes and incorporate any explanatory material in the textitself. If notes cannot be avoided, they should be endnotes typed at the end of the article.
Tables and illustrations: tabular material should bear a centred heading “Table”. Presentations of non-tabular material should bear a centred heading “Figure”. The source should always be cited.
References in the text: Jones and Little (1986) or Jones et al. (1988) in the case of three or more authors.However, the names of all authors should appear in the list of references at the end of the article.
References at the end of the article: references should be listed in alphabetical order under the heading“References”. Examples of the reference style used in the Journal are:
– For periodicals: TAYLOR, M.G. (1991), “New Financial Models – Summary Report”, Higher EducationManagement, Vol. 3, No. 3, pp. 203-213.
– For books: SCHUSTER, H. (1988), Changing Patterns of Finance of Higher Education, Country Study,Germany, OECD, Paris.
Electronic text: articles should be retained in electronic form, since a diskette or electronic transferwill be requested if the article is accepted.
The Covering letter
This should give full addresses and telephone numbers and, in the case of multi-authored papers,indicate the author to whom all correspondence should be sent.
Complimentary copies
Each author will receive two complimentary copies of the Journal issue in which his article appears,in the original language.

OECD PUBLICATIONS, 2, rue André-Pascal, 75775 PARIS CEDEX 16
PRINTED IN FRANCE
(89 2000 01 1 P) ISBN 92-64-17542-3 – No. 51171 2000
ISSN 1013-851X


![THE QUALITY ASSURANCE OF HIGHER EDUCATION: ACCOUNTABILITY ... · THE QUALITY ASSURANCE OF HIGHER EDUCATION: ACCOUNTABILITY AND ENHANCEMENT ... practice[1].pdf OECD-UNESCO ... Arab](https://static.fdocuments.us/doc/165x107/5b88f5517f8b9a435b8ee086/the-quality-assurance-of-higher-education-accountability-the-quality-assurance.jpg)


