High Voltage Laboratory: simulation, adjustment and test...
152
Faculdade de Engenharia da Universidade do Porto High Voltage Laboratory: simulation, adjustment and test on electrical insulators Manuel Angel Saboy Gabiña Master’s Thesis Report carried out within Master in Electrical and Computers Engineering - Energy Director: Prof. Dr. António Carlos Sepúlveda Machado e Moura June 2009
Transcript of High Voltage Laboratory: simulation, adjustment and test...

Faculdade de Engenharia da Universidade do Porto
High Voltage Laboratory: simulation, adjustment and test on electrical insulators
Manuel Angel Saboy Gabiña
Master’s Thesis Report carried out within Master in Electrical and Computers Engineering - Energy
Director: Prof. Dr. António Carlos Sepúlveda Machado e Moura
June 2009

ii
© Manuel Angel Saboy Gabiña, 2009

iii
Resumo
O principal objectivo desta dissertação é a preparação do Laboratório de Alta Tensão da
Faculdade de Engenharia da Universidade do Porto com a finalidade de permitir a realização
de ensaios de alta tensão, particularmente ensaios ao choque de descargas atmosféricas, de
isoladores eléctricos de material orgânico conforme a normativa internacional aplicável e,
dar solução aos problemas encontrados no equipamento que foram detectados no começo dos
trabalhos no laboratório.
As descargas de origem atmosférica produzem sobretensões nas linhas eléctricas de
transporte de energia que podem atingir centenas de milhares de volts, o que causa esforços
dieléctricos sob os isoladores e pode pôr em perigo uma operação, normal e com segurança,
do equipamento eléctrico das estações e subestações. Os isoladores eléctricos são
amplamente utilizados neste tipo de dispositivos, como por exemplo: seccionadores de
tensão, terminais de transformadores eléctricos, linhas de transporte em alta tensão, ou,
linhas eléctricas em infra-estructuras ferroviárias.
O trabalho é divido em três partes: a primeira parte estabelece os fundamentos teóricos
necessários para a compreensão do mesmo. É imprescindível conhecer como são produzidas
as descargas atmosféricas e a categoria das sobretensões que são objecto de estudo.
A segunda parte apresenta o trabalho de experimentação feito: introdução ao
equipamento do laboratório disponível, simulação do processo, estudo das diferentes
possibilidades e solução dos problemas que surgiram, avaliação de riscos para os utilizadores
na instalação, princípios estabelecidos pelas normas internacionais, calibração do
equipamento de medida e, o ensaio de isoladores eléctricos.
Para concluir, a terceira parte do trabalho mostra os resultados e conclusões obtidas. Os
passos a seguir em futuros projectos no Laboratório são também descritos com a finalidade
de alcançar um conhecimento mais profundo das altas tensões. Não pode ser esquecido que,
neste campo, a experimentação é altamente importante.
iv
Palavras chave: acoplamento electromagnético, avaliação de riscos, calibração, ensaios de
alta tensão ao choque atmosférico, isoladores eléctricos, Laboratório de Alta Tensão,
simulação computacional.
v
Abstract
The main purpose of this final project is to prepare the High Voltage Laboratory of the
Faculty of Engineering of the University of Porto in order to carry out high voltage testing of
electrical insulators, specifically lightning over-voltages tests, attending to international
standards and solving some practical problems which were found.
These over-voltages can run up to hundreds of thousands of volts, which cause dielectric
stresses on insulators and could endanger normal and safe operation in electrical equipment.
Electrical insulators are widely used in power station and substation equipment; for example,
insulators are used for disconnectors, transformer bushings or condenser bushings; in high
voltage transmission lines and distribution lines; or, in traction current lines for railways
among other things.
The work is divided into three parts: the first part sets the theoretical fundamentals. It is
important to know how lightning occurs and the range of over-voltages which is object of
study.
The second part presents the experimental work made: introduction to laboratory
equipment available, simulation of the process and study of the different variants and
problems found, assessment of possible risks of the equipment for the users, principles
established by the International Standards, calibration of the measuring device and test of
electrical insulators.
Finally, the third part will show the results and conclusions obtained. The steps for
further work are given so that new projects can reach deeper points of knowledge and
discover new aspects of high voltage engineering. It should not be forgotten that, in this
field, experimentation is highly important.
Keywords: calibration, computer simulation, electrical insulator, electromagnetic coupling,
High Voltage Laboratory, High Voltage lightning impulse testing, risk assessment.

vi
vii
Acknowledgements
This Master’s Thesis is the last step of my graduation and the first one of my professional
career. For this reason, at this point of my life, I want to thank my family, friends and mates
for all their support, help and encouragement during my life and, especially, during my time
at the university. They all are the most important and it would have been not possible to get
here without them.
First of all, thank you, dad, mum and grandparents, for wishing me always a good luck.
We have shared experiences, decisions, stress and happiness during the last years. Thank you,
because you all have never been missing whenever I needed you.
Special thanks to my friends from university: Pablo, Yago “el Turko”, Dani, Juan, Rubo
and Julio. I cannot imagine better friends; it was the best to spend these years with all of
you. We have had hard moments studying or working, but we have also had very nice
moments enjoying our resting time; moments which I hope we will never forget wherever we
are.
To Lisa, we have shared all our moments together with our friends in Portugal. She has
shown me all her support and patience, and, the most important, always believed in me.
Secondly, but not less important, I am very grateful to Prof. Dr. António Machado e Moura
for his understanding, help and friendship during our work, together with Eng. Vasques de
Carvalho, Eng. Orlando Tato, Eng. Neves Gomes and Prof. Paulo Portugal. All of them have
contributed to my work with their experience and ideas.
Finally, I cannot forget Prof. Dr. Manuel Pérez Donsión and all the people in charge of
Erasmus programme, who gave me the opportunity to come to Oporto, discover the
neighbouring country, its culture and people.

viii

ix
Table of contents
Resumo ............................................................................................ iii
Abstract............................................................................................. v
Acknowledgements ..............................................................................vii
Table of contents ................................................................................ ix
List of figures ..................................................................................... xi
List of tables .................................................................................... xvii
Abbreviations and symbols.................................................................... xix
Chapter 1........................................................................................... 1
Introduction.......................................................................................................1
Chapter 2........................................................................................... 3
Theoretical fundamentals ......................................................................................3 2.1 - Lightning and thunderclouds.........................................................................4 2.2 - Keraunic level ..........................................................................................9 2.3 - Over-voltages ......................................................................................... 10 2.4 - Impulse voltage ...................................................................................... 13
Chapter 3..........................................................................................17
Generation of High Voltage impulses and Laboratory Equipment..................................... 17 3.1 - Erwin Marx: historical note ........................................................................ 17 3.2 - Marx impulse generator............................................................................. 18 3.3 - Laboratory equipment .............................................................................. 21 3.4 - Preparation of the test ............................................................................. 36
Chapter 4..........................................................................................39
Computer simulation .......................................................................................... 39 4.1 - Simulation using PSpice............................................................................. 39 4.2 - Simulation using PSCAD............................................................................. 51 4.3 - Conclusion............................................................................................. 56

x
Chapter 5..........................................................................................57
Standard Techniques for High-Voltage Testing........................................................... 57 5.1 - Introduction .......................................................................................... 57 5.2 - Tests with lightning impulse voltage ............................................................. 59
Chapter 6..........................................................................................65
Practical problems emerging in measurement ........................................................... 65 6.1 - Preliminary............................................................................................ 65 6.2 - Description of the problems ....................................................................... 66 6.3 - Other things which were thought as cause of the problems. Previous steps ............. 77 6.4 - Solution to the problem ............................................................................ 79 6.5 - Conclusions ........................................................................................... 82
Chapter 7..........................................................................................83
Calibration according to IEC 60052 ......................................................................... 83 7.1 - Overview .............................................................................................. 84 7.2 - Standard sphere-gap ................................................................................ 84 7.3 - Connections........................................................................................... 87 7.4 - Use of the sphere-gap .............................................................................. 87 7.5 - Reference values .................................................................................... 89 7.6 - Advantages and disadvantages .................................................................... 91 7.7 - How to perform the calibration process......................................................... 92
Chapter 8..........................................................................................97
Risk assessment ................................................................................................ 97 8.1 - What is risk assessment?............................................................................ 97 8.2 - How to assess the risks in the workplace........................................................ 98 8.3 - Conclusions ..........................................................................................105
Chapter 9........................................................................................ 107
Test on electrical insulators of organic material .......................................................107 9.1 - Insulator parameters ...............................................................................107 9.2 - Characteristics of indoor and outdoor post insulators .......................................108 9.3 - Test on indoor post insulators of organic material ...........................................110 9.4 - Test waveforms .....................................................................................113
Chapter 10 ...................................................................................... 115
Results ..........................................................................................................115
Chapter 11 ...................................................................................... 117
Further work...................................................................................................117
Chapter 12 ...................................................................................... 119
Conclusions ....................................................................................................119
Chapter 13 ...................................................................................... 121
Glossary of terms .............................................................................................121
References ...................................................................................... 129

xi
List of figures
Figure 2.1 - Causes of lightning over-voltages [4].......................................................3
Figure 2.2 - Comparison of various sizes of convective clouds that produce lightning discharges [3]. ...........................................................................................5
Figure 2.3 -Thunderhead. Probable distribution in a thundercloud (cumulonimbus) mostly accepted [©Encyclopaedia Britannica, Inc. (1999)]...............................................5
Figure 2.4 – Lightning [4]. ...................................................................................7
Figure 2.5 -Shapes of stressing continuous voltages (left) and temporary over-voltages (right). .................................................................................................. 11
Figure 2.6 - Shapes of stressing transient over-voltages: slow-front (up), fast-front (middle) and very-fast-front (down)............................................................... 12
Figure 2.7 - High voltage waves caused by direct lightning stroke on a high voltage line [4]. ....................................................................................................... 14
Figure 2.8 - Tower struck by lightning [4]. ............................................................. 15
Figure 2.9 - Flashover from tower to power line due to lightning stroke in a tower [4]. ...... 15
Figure 3.1 - Simplified impulse generator [1].......................................................... 18
Figure 3.2 - Double exponential curve as generated by the impulse generator showed in figure 3.1 [1]. .......................................................................................... 19
Figure 3.3 - Approximate wave shape of lightning impulse used in laboratory testing [1]. ... 20
Figure 3.4 - Multistage impulse generator [11]. ....................................................... 21
Figure 3.5 - Impulse generator ........................................................................... 22
Figure 3.6 – Impulse generator circuit [11]............................................................. 23
Figure 3.7 - Effect of stray inductances [4]. ........................................................... 24
Figure 3.8 – Detail of the generator stack. ............................................................. 25
Figure 3.9 - Triggered gap [4]. ........................................................................... 27

xii
Figure 3.10 - Trigger system.............................................................................. 28
Figure 3.11 - Typical triggering range. ................................................................. 29
Figure 3.12 - Motor drive mechanism ................................................................... 30
Figure 3.13 - Front panel of the control console...................................................... 31
Figure 3.14 - Resistive voltage divider of the generator. ........................................... 32
Figure 3.15 - Sketch of the capacitive voltage divider. ............................................. 33
Figure 3.16 - Detail of the low voltage arm of the voltage divider, the coaxial cable and the measuring device (oscilloscope)............................................................... 33
Figure 3.17 - Tektronix TDS 340 A. ...................................................................... 34
Figure 3.18 - Layout of the Laboratory and earth connections..................................... 34
Figure 3.19 - Detail of the earth connections of the equipment: points (A), (B) and (C). .... 35
Figure 4.1 - Impulse generator circuit used in simulation with PSpice............................ 42
Figure 4.2 - Typical lightning impulse waveform obtained in the simulation with PSpice..... 43
Figure 4.3 - Variation of peak voltage in kV according to front resistance in ohms. It is considered a constant tail resistance of 450Ω. .................................................. 45
Figure 4.4 - Variation of the efficiency in percentage according to tail resistance in ohms. It is considered a constant front resistance of 75Ω. ............................................ 46
Figure 4.5 - Variation of the front time in microseconds according to front resistance in ohms. It is considered a constant tail resistance of 450Ω. .................................... 46
Figure 4.6 - Variation of the tail time in microseconds according to tail resistance in ohms. It is considered a constant front resistance of 75Ω..................................... 47
Figure 4.7 - Impulse generator circuit used in order to simulate the influence of stray capacitances with PSpice ............................................................................ 49
Figure 4.8 - Lightning impulse waveform obtained in the PSpice simulation with stray capacitances. .......................................................................................... 50
Figure 4.9 - Impulse generator circuit used in simulation of full lightning discharge using PSCAD. .................................................................................................. 52
Figure 4.10 - Full lightning waveform for the impulse generator circuit simulated using PSCAD. .................................................................................................. 53
Figure 4.11 - Charge waveform for the fifth stage of the impulse generator simulated using PSCAD. ........................................................................................... 53
Figure 4.12 - Impulse generator circuit used in simulation of chopped-tail impulse using PSCAD. .................................................................................................. 54
Figure 4.13 - Chopped-tail impulse waveform simulated using PSCAD............................ 55
Figure 4.14 - Chopped-front impulse waveform simulated using PSCAD. ........................ 55

xiii
Figure 5.1 – Full lightning impulse without oscillations or overshoots. ........................... 59
Figure 5.2 – Lightning impulse chopped on the tail................................................... 60
Figure 5.3 – Linearly rising front-chopped impulse. .................................................. 62
Figure 5.4 – Examples of lightning impulses with oscillations or overshoots (1)................. 62
Figure 5.5 – Examples of lightning impulses with oscillations or overshoots (2). Mean curves shown as dotted lines........................................................................ 63
Figure 6.1 - Waveform for a standard lightning voltage impulse test. Volts and seconds per division rate selected: 200V/div, 50µs/div. 100X probe attenuation. It was captured using a Tektronix TDS 2012B digital storage oscilloscope.......................... 67
Figure 6.2 - Test wave with three “interferences”: a positive voltage impulse before wave-front and other two negative voltage impulses at wave-tail. Volts and seconds per division rate selected: 2V/div, 2.5µs/div. Captured using a Tektronix TDS 340A digital storage oscilloscope.......................................................................... 68
Figure 6.3 – Test wave-front with a fast positive voltage impulse and superimposed oscillation on the wave-front. Volts and seconds per division rate selected: 2V/div, 500ns/div. Captured using a Tektronix TDS 340A digital storage oscilloscope............. 68
Figure 6.4 - Test waveforms that show the run of negative voltage impulses on the wave-tail. Volts and seconds per division rate selected are for all: 2V/div; 100, 250 and 500µs/div. Captured using a Tektronix TDS 340A digital storage oscilloscope............. 69
Figure 6.5 – Front-oscillation of lightning impulse voltage. IEC 601083-2 test data generator impulse waveform: Case 11. ........................................................... 70
Figure 6.6 – Test waveform which shows the run of negative voltage impulses on the wave-tail. Volts and seconds per division rate selected: 200V/div, 100µs/div. 100X probe attenuation. It was captured using a Tektronix TDS 2012B digital storage oscilloscope. ........................................................................................... 71
Figure 6.7 – Enlarged test waveform which shows the run of negative voltage impulses on the wave-tail. Volts and seconds per division rate selected: 200V/div, 25µs/div. 100X probe attenuation. It was captured using a Tektronix TDS 2012B digital storage oscilloscope. ........................................................................................... 72
Figure 6.8 – Test waveform. Volts and seconds per division rate selected: 100V/div, 25ms/div. 100X probe attenuation. It was captured using a Tektronix TDS 2012B digital storage oscilloscope.......................................................................... 72
Figure 6.9 – Test waveform that shows electromagnetic interferences (EMI). Volts and seconds per division rate selected: 500V/div, 100µs/div. 100X probe attenuation. It was captured using a Tektronix TDS 2012B digital storage oscilloscope. ................... 73
Figure 6.10 – Test waveform that shows electromagnetic interferences (EMI). Volts and seconds per division rate selected: 500V/div, 50µs/div. 100X probe attenuation. It was captured using a Tektronix TDS 2012B digital storage oscilloscope. ................... 73
Figure 6.11 – Test waveform that shows electromagnetic interferences (EMI). Volts and seconds per division rate selected: 200V/div, 100µs/div. 100X probe attenuation. It was captured using a Tektronix TDS 2012B digital storage oscilloscope. ................... 74
Figure 6.12 – Experimentally generated impulse voltage with noise near the start of the impulse signal [28]. ................................................................................... 75

xiv
Figure 6.13 – The signal noise due to electromagnetic coupling from the stack of capacitors to the LV arm of capacitive mixed divider. Volts and seconds per division rate selected in both: 200V/div, 1µs/div, 100X probe attenuation. It was captured using a Tektronix TDS 2012B digital storage oscilloscope...................................... 76
Figure 6.14 – The signal noise due to electromagnetic coupling from the stack of capacitors to the LV arm of capacitive mixed divider. Volts and seconds per division rate selected in both: 200V/div, 250ns/div, 100X probe attenuation. It was captured using a Tektronix TDS 2012B digital storage oscilloscope...................................... 76
Figure 6.15 – Enlargement of the positive voltage impulse before the wave-front. Volts and seconds per division rate selected are for all: 5V/div, 10ns/div. Captured using a Tektronix TDS 340A digital storage oscilloscope. ............................................... 78
Figure 6.16 – Part of the equipment where there was a potential difference with provisional earth connection........................................................................ 78
Figure 6.17 – Representation of the voltage divider ................................................. 80
Figure 6.18 – Representation of the voltage divider with the explanation to the problems. . 80
Figure 6.19 – Probe: Tektronix P6015A ................................................................. 81
Figure 6.20 – Measurement of the test waveform made by the probe. ........................... 81
Figure 6.21 – Measurement of the test waveform made by the probe (1) and the capacitive divider (2)................................................................................. 82
Figure 7.1 - Vertical sphere-gap (left side) and horizontal sphere-gap (right side) [15]....... 85
Figure 7.2 - Clearance limit: minimum value of distance B depending on sphere diameter D, both in cm, for a spacing between spheres of S = 10 cm................................... 86
Figure 7.3 - Clearance limit: minimum and maximum values of height A depending on sphere diameter D, both in cm. .................................................................... 86
Figure 7.4 - Correlation between the breakdown strength and the gap distance [4]. ......... 90
Figure 7.5 - Layout of the Laboratory necessary to calibrate the measuring system according to IEC 60052............................................................................... 93
Figure 7.6 - Clearance limit: minimum value of distance B in cm depending on sphere-gap spacing S in cm, for a sphere diameter D = 75 cm. ............................................. 94
Figure 7.7 - Peak values of disruptive discharge voltages in kV for full lightning impulse voltages of negative polarity depending on sphere-gap spacing S in cm, for a sphere diameter of D = 75 cm. .............................................................................. 94
Figure 8.1 - Current layout of the Laboratory at room J003 of the Faculty of Engineering. .. 99
Figure 8.2 - New suggested layout at room J003 of the Faculty of Engineering................100
Figure 8.3 - Example of a limit switch (OMRON Industrial Automation) on the left, and the safety system of the Faraday cage on the right. ...............................................101
Figure 8.4 - Light alarm signal of the High Voltage Laboratory. ..................................101
Figure 8.5 - Emergency stop switch of the High Voltage Laboratory. ............................101

xv
Figure 8.6 - Metallic gutter which protects electrical cables......................................102
Figure 8.7a and b - Layout of the Laboratory. It shows a possible safety way that aims to avoid human error which may be fatal for the users if an electrical discharge occurs. The design shown in figures (a.) and (b.) was made for the current and the suggested layouts of the Laboratory respectively. ..........................................................103
Figure 8.8 - Optical sensor (Monarch Instrument) which might be used in the design of the safety system. ........................................................................................104
Figure 8.9 - Suggested layout for the Laboratory. It shows the placement of the optical sensor (blue), together with the potentially dangerous points (orange dotted line) and the safety way above purposed. .............................................................104
Figure 9.1 - Post insulator under test. .................................................................109
Figure 9.2 - Test waveform of an insulator of organic material. 25kV per stage were applied (125kV). Volts and second per division rate selected: 100V/div, 10µs/div. Prove attenuation: 100X. ...........................................................................113
Figure 9.3 - Test waveform of an insulator of organic material. 35kV per stage were applied (175kV) and it is possible to see a positive peak, and, interferences and a damped oscillation after flashover arc occurs; they are object of study. Volts and second per division rate selected: 200V/div, 5µs/div. Prove attenuation: 100X. ........114
Figure 9.4 - Test waveform of an insulator of organic material. 65kV per stage were (375kV) applied and it is possible to see a positive peak and it is possible to see a positive peak, and, interferences and a damped oscillation after flashover arc occurs; they are object of study. Volts and second per division rate selected: 200V/div, 5µs/div. Prove attenuation: 100X. ...................................................114

xvi

xvii
List of tables
Table 2.1 — Data concerning cloud-to-ground lightning discharge [3] ...........................8
Table 2.2 — Reference values for keraunic level in a year ....................................... 10
Table 2.3 — Usual values for an impulse voltage .................................................... 15
Table 3.1 — Generator parameters. .................................................................... 24
Table 3.2 — Main specifications of the capacitive voltage divider. ............................. 32
Table 4.1 — Resistors available for the study of the impulse generator by means of simulation. ............................................................................................. 40
Table 4.2 — Highest values for front and tail resistors............................................. 43
Table 4.3 — Lowest values for front and tail resistors. ............................................ 43
Table 4.4 — Medium values for front and tail resistors. ........................................... 44
Table 4.5 — Obtained results: values for front time................................................ 44
Table 4.6 — Data for calculating the value of the stray capacitance. .......................... 48
Table 4.7 — Impulse test system parameters for simulation of stray capacitances ......... 48
Table 4.8 — Results of the simulation with stray capacitances [2] compared to the simulation without stray capacitances [1]. .................................................... 50
Table 4.9 — Real parameters of the impulse generator measured and used in the simulation using PSCAD. ............................................................................ 51
Table 6.1 — Impulse test system parameters......................................................... 66
Table 7.1 —Example of measurement.................................................................. 95
Table 7.2 — Relation between peak value of disruptive discharge voltage in the sphere-gap and peak voltage measured in the oscilloscope................................ 96
Table 9.1 — Indoor post insulators of organic material and with internal metal fittings..110

xviii

xix
Abbreviations and symbols
List of abbreviations
AC Alternating Current
ASINEL Asociación de Investigación Industrial Eléctrica
BRK Breaker
CMD Capacitive Mixed Divider
CAD Computer Aided Design
DSO Digital Storage Oscilloscope
DC Direct Current
EMC Electromagnetic Coupling
EMI Electromagnetic Interferences
EHV Extremely High Voltage
HV High Voltage
HVL High Voltage Laboratory
IEEE Institute of Electrical and Electronics Engineers
IEC International Electrotechnical Commission
LI Lightning Impulse
LV Low Voltage
MV Medium Voltage
NATO North Atlantic Treaty Organisation
r.m.s. Root Mean Square
SI Switching Impulse
UHV Ultra High Voltage
VHV Very High Voltage

xx
List of symbols
h, h0 Ambient absolute humidity
A Amplitude, Area
ω Angular frequency
b Atmospheric pressure
t Atmospheric temperature
C Capacitance
Uch, Uc Charge voltage
Es, U0 Charge voltage per stage
Rch Charging resistance
K Correction factor
B Clearance limit around the sparking point
z Conventional deviation
k1 Correction factor for air density
k2 Correction factor for humidity
i Current
η Efficiency
τD Discharge time constant
p Disruptive discharge probability
U50 50% disruptive discharge voltage
d Distance
f Frequency
Rf Front resistance
Cg Generator’s High Voltage capacitor
A Height of the sparking point
k Humidity correction factor
L Inductance
N, n Number of generator stages
Et Output voltage
ε0 Permittivity of free space
Vp P-percent disruptive discharge voltage
δ Relative air density
εr Relative static permittivity
R Resistance
D Sphere diameter
e Sphere-gap
S Sphere-gap spacing
b0 Standard atmospheric pressure
t0 Standard atmospheric temperature

xxi
Ls Stray inductance
Rt Tail resistance
τ Time Constant
Tc Time to chopping
Tp Time to peak
E0 Total energy stored per stage
j Unit vector
T1, Tf Virtual front time, rise time
O1 Virtual origin
Up Voltage peak
T2, Tt Virtual time to half-value in the tail
U, u Voltage


Chapter 1
Introduction
Electrical systems are strongly limited by an important characteristic of electrical energy;
its storage is not possible on a large scale and it must be produced and transported to the
places where it is required just at the moment.
Production and consumption points are usually far away from each other; therefore it is
necessary to resort to high voltage values in order to reduce losses in electrical lines and
maximizes the efficiency of the electrical transport system.
Thus, there is a wide range of values used in high voltage systems which are divided into
five groups:
• MV (Medium Voltage);
• HV (High Voltage);
• VHV (Very High Voltage);
• EHV (Extremely High Voltage);
• UHV (Ultra High Voltage).
The high voltage values need an appropriate insulation level and the higher the voltage,
the higher the cost. The process called Insulation Coordination determines the proper
insulation levels of the components in a power system as well as their arrangements so that
costs can be substantially reduced.
Insulation structure must withstand voltage and over-voltage stresses to which the system
or equipment will be subjected. This area of knowledge requires simulation studies based on
mathematical models (scientific modelling) and laboratory testing (tests) to precisely
determine and allow for high electric field effects.
Theoretical studies are carried out based on macroscopic or microscopic models.
- Macroscopic modelling is used when voltage, current and electric fields values in
equipment must be tested.

2
2
- Microscopic (or molecular) modelling is used in order to study how insulators
behave under voltage and over-voltage stresses, and, especially, how ageing and
dielectric breakdown mechanisms appear.
Experimental studies involve high voltage laboratory testing to measure certain
parameters, but outdoor tests are also carried out when it is necessary to check electric
equipment in its final place of use.
In short, it is essential to accompany theoretical studies with experimental testing in
order to ensure efficient and safe installations.
But a second important feature cannot be forgotten: frequency. A right choice of
mathematical models or laboratory tests must be taken into account due to the different
kinds of phenomena produced by a wide range of frequencies, from alternating voltages of
power frequencies (50 – 60 Hz) to full lightning impulse voltages (in the order of hundreds of
kHz or even MHz).
Each model is studied and just accepted for a certain range of frequencies, considering
the right hypothesis. Satisfying the requirements on the validity domain insures reliability and
quality of results obtained.

Chapter 2
Theoretical fundamentals
Electrical insulators of organic material can be affected by lightning and must withstand
high voltage values that are present in it. An overview of this phenomenon and their
consequences are explained in this chapter. It aims to set the theoretical fundamentals and
give an introduction in order to carry out other studies in this field. If further information is
needed, books and articles shown in the references can be helpful.
Not a few industrial high voltage installations are placed in outdoor locations. Thus,
electrical equipments are exposed to temperature and humidity changes, wind, rain and even
occasionally lightning which can cause many problems in the equipments.
This work is focused on lightning impulses and they are tested at the High Voltage
Laboratory. They may be caused by the next three circumstances:
1. A lightning stroke in the vicinity of a line or a substation.
2. A lightning stroke in the tower or in the ground wire of an overhead line.
3. A direct lightning stroke in the line.
Figure 2.1 - Causes of lightning over-voltages [4].

4
4
It is necessary to study how electrical equipments behave under this kind of atmospheric
phenomenon in order to establish the necessary safety level so that a certain operational
capacity do not be lost.
2.1 - Lightning and thunderclouds
2.1.1 -Lightning
Lightning over-voltages are the main cause of many breakdowns that occur in electrical
equipment from stations and substations. Thus, the problem must be, therefore studied in
depth to understand how lightning works and the protections that may be designed in order
to minimize its effects and electrical breakdown, which might be still more costly than a
proper high-voltage insulation.
As defined by Uman [3], lightning is a transient, high-current electric discharge whose
path length is generally measured in kilometres. Lightning occurs when some region of the
atmosphere attains an electric charge sufficiently large that the electric fields associated
with the charge cause electrical breakdown of the air. The most common producer of
lightning is the thundercloud, known as cumulonimbus.
However, lightning also occurs in snowstorms, sandstorms, and in the clouds over erupting
volcanoes. It can take place entirely within a cloud (intracloud or cloud discharges), between
two clouds (cloud-to-cloud discharges), between a cloud and the earth (cloud-to-ground or
ground discharges), or between a cloud and the surrounding air (air discharges).
2.1.2 -Thunderclouds: definition and origin
The thundercloud and its electric charges are the sources of lightning. Thunderclouds are
formed in an atmosphere containing cold, dense air aloft, and warm moist air at lower levels.
The warm air at low levels rises in strong updrafts when heated by the Sun, carrying water
steam into the sky to form clouds, and the cold air aloft descends. When the hot air mingles
comes into contact with colder air, the moisture condenses into water droplets. Clouds are
created when these water droplets become visible. The droplets increase in size as the cloud
grows and eventually become so heavy that they fall as rain. Thunderclouds are large, anvil-
shaped masses that can stretch miles across at the base, and reach 12 km or more into the
atmosphere.
Such atmospheric conditions occur, for example, when cold polar air masses overrun
regions of warmer air or when the earth is strongly heated by the Sun and transfers its heat
to the air of the lower atmosphere.
A comparison of various sizes of convective clouds that produce lightning discharges is
shown in figure 2.2. Thunderclouds range in size from small clouds, which occur in the
semitropics and in which the temperature may everywhere be above freezing, to giant
electrical storms, which may have a vertical extent exceeding 20 km.
5
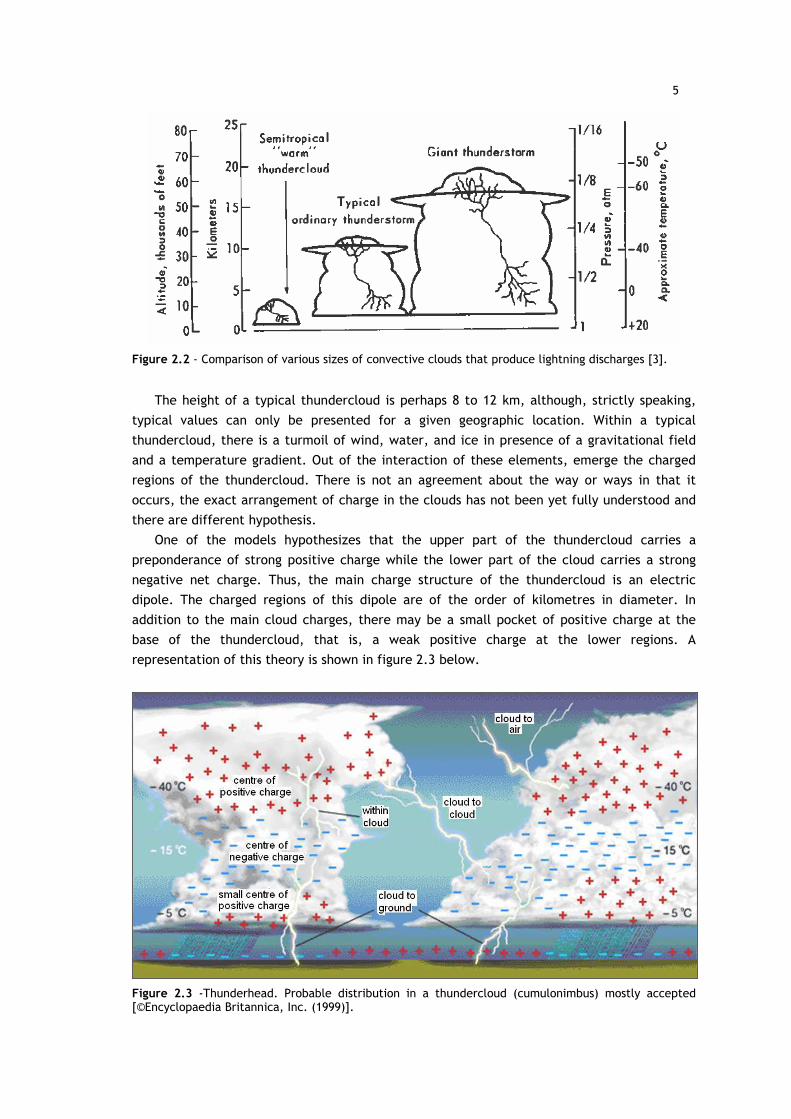
Figure 2.2 - Comparison of various sizes of convective clouds that produce lightning discharges [3].
The height of a typical thundercloud is perhaps 8 to 12 km, although, strictly speaking,
typical values can only be presented for a given geographic location. Within a typical
thundercloud, there is a turmoil of wind, water, and ice in presence of a gravitational field
and a temperature gradient. Out of the interaction of these elements, emerge the charged
regions of the thundercloud. There is not an agreement about the way or ways in that it
occurs, the exact arrangement of charge in the clouds has not been yet fully understood and
there are different hypothesis.
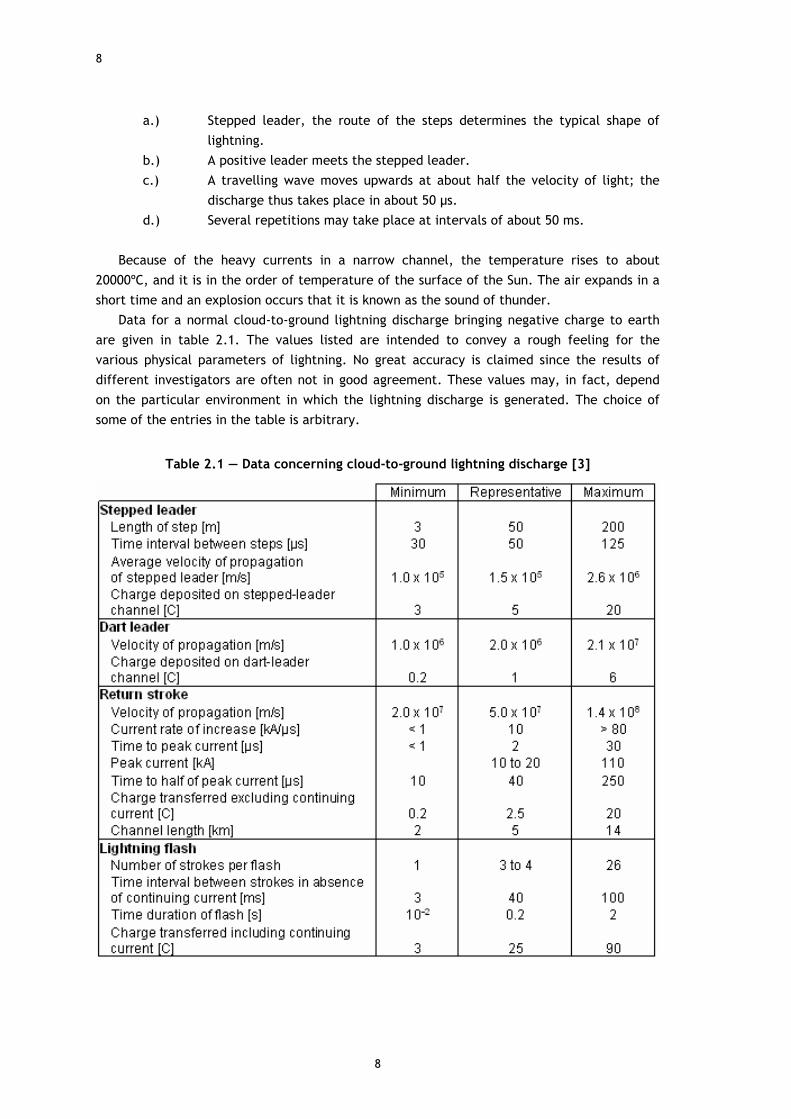
One of the models hypothesizes that the upper part of the thundercloud carries a
preponderance of strong positive charge while the lower part of the cloud carries a strong
negative net charge. Thus, the main charge structure of the thundercloud is an electric
dipole. The charged regions of this dipole are of the order of kilometres in diameter. In
addition to the main cloud charges, there may be a small pocket of positive charge at the
base of the thundercloud, that is, a weak positive charge at the lower regions. A
representation of this theory is shown in figure 2.3 below.
Figure 2.3 -Thunderhead. Probable distribution in a thundercloud (cumulonimbus) mostly accepted [©Encyclopaedia Britannica, Inc. (1999)].

6
6
This theory is based on the idea that heavier and larger particles tend to gain a negative
charge, while lighter particles tend to gain a positive charge in collisions. Then, charged
particles become separated due to differences in size and density, moving to certain levels of
the cloud system.
The amount of total charge and polarity is also affected by the temperature in the layer
of the cloud, the content of the water particles, and several other conditions.
This theory is the most widely accepted, although it is just one of many which attempt to
explain the properties of the charge built-up in electrical storms. As it was mentioned above,
there is not an universal agreement that explains the phenomena.
To make possible a lightning discharge, it is necessary that an electrical path is created
and permits electric current to pass through. Since opposite charges attract, when two
regions of strong and opposite charge are present, they will attract and exchange electrons.
When they are separated and cannot exchange electrons through contact, they must
exchange charge through a medium. In thunderhead systems, the air serves as the medium
between the two regions. Since air is not conductive, electric current cannot easily pass
through it and, in order for the regions to exchange electrons, the air molecules must be
arranged so that electrons can pass through it.
The process of ionization performs this procedure. It is a physical process of converting an
atom or molecule into an ion by adding or removing charged particles such as electrons or
other ions. This happens when a large amount of charged particles attempts to pass through
the neutral medium, causing the electrons and protons of the medium to separate in order to
create a path between the two regions on which charge can flow.
Then, lightning occurs due to the extreme difference of charge between two regions.
When the difference of charge reaches a certain point, air between both regions becomes
ionized, that is, the air surround breaks down and lightning occurs. When that phenomenon
happens, an extreme amount of energy is used up and is converted into light, heat and
sound, which is seen as lightning and heard as thunder.
In conclusion, lightning is a form of electrical breakdown of ambient air over extreme
distances due to the difference of charge between them, and, as shown in figure 2.3, there
are different kinds of lightning discharge that are listed below:
a.) cloud to air;
b.) cloud to cloud;
c.) within cloud;
d.) cloud to ground, with negative and positive charge on earth’s surface.
The most frequently occurring form of lightning is the intracloud discharge; however, this
report only concerns of ground discharges because they are the ones that affect electric
power lines and electrical equipment in stations and substations.

7
2.1.3 -The lightning stroke
Most of thunderclouds are negatively charged, as defined by Kreuger [4]. The potential
relative to earth may amount to several hundreds of megavolts (MV).
Lightning is initiated by discharges within the cloud, from which a leader reaches down to
earth in steps of about 30 meters. This leader is called stepped leader and it reaches the
earth in about 10 ms. Steps of the leader are directed each time in a different direction and,
thus, the zigzag shape of the lightning is built up.
The path followed by the leader is often two to three times as long as the distance from
cloud to earth. From time to time the leader is forked, so that the typical branched shape of
lightning is formed. And, for this reason, cloud-to-ground lightning is sometimes referred to
as streaked or forked lightning.
The light of the leader is faint and can not be observed with the naked eye. Its current is
restricted, in the order of 100 A.
When the leader approaches earth, earth’s electric field increases a lot and a positive
leader travels upwards, preferably from a pointed object. After making contact, a travelling
wave moves upwards. The front of this wave can travel with values as far as half the velocity
of light. This is accompanied by intense light so that the visible stage of lightning does not
strike downwards, as is commonly thought, but upwards. On its way upwards the branches
are brightly illuminated. This takes about 50 µs and the current level is in the order of 20 to
100 kA.
But a cloud-to-ground lightning discharge is made up of one or more intermittent partial
discharges. Uman [3] calls the total discharge, whose time duration is of the order of 0.2
seconds, a flash; and he calls each component discharge, whose luminous phase is measured
in tenths of milliseconds, a stroke.
These discharges, strokes, are repeated at intervals of about 40 to 50 ms, usually 3 to 4
times but 10 to 12 times are possible. The repeated discharges follow the path of the first
discharge. This manifold repetition of lightning is too fast for the naked eye, so that lightning
is seen by us as one heavy flash.
(a) (b) (c) (d)
Figure 2.4 – Lightning [4].
8
8
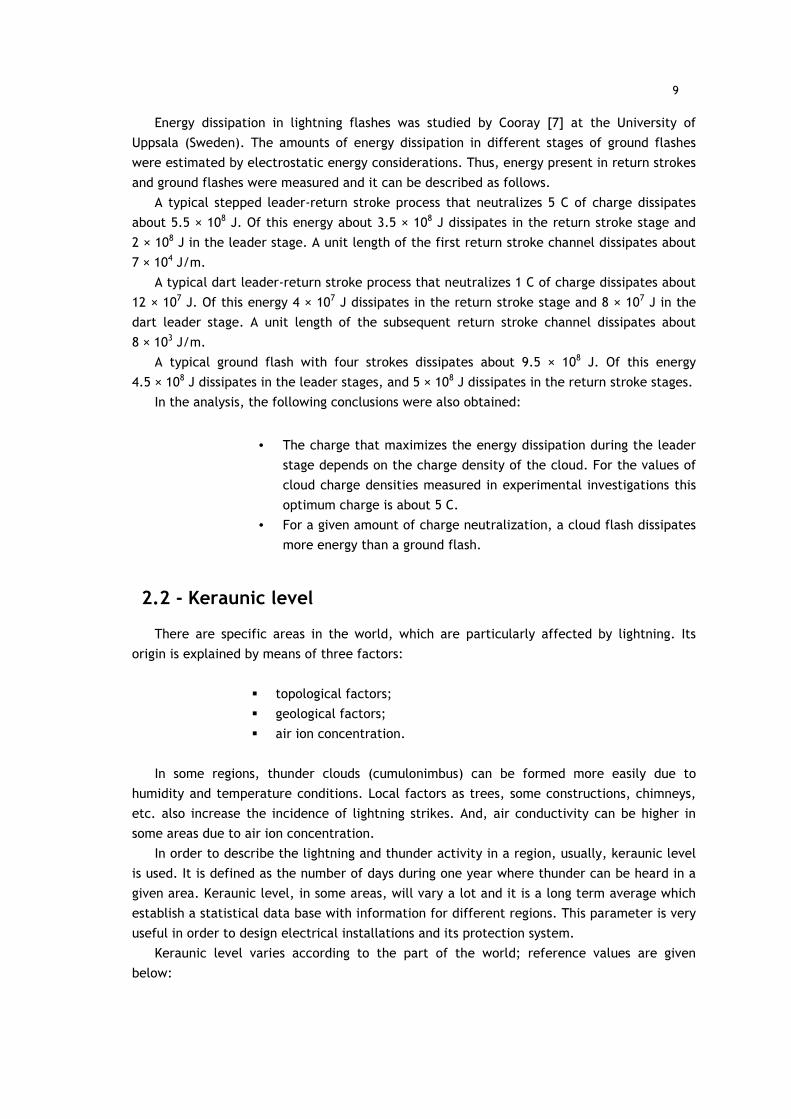
a.) Stepped leader, the route of the steps determines the typical shape of
lightning.
b.) A positive leader meets the stepped leader.
c.) A travelling wave moves upwards at about half the velocity of light; the
discharge thus takes place in about 50 µs.
d.) Several repetitions may take place at intervals of about 50 ms.
Because of the heavy currents in a narrow channel, the temperature rises to about
20000ºC, and it is in the order of temperature of the surface of the Sun. The air expands in a
short time and an explosion occurs that it is known as the sound of thunder.
Data for a normal cloud-to-ground lightning discharge bringing negative charge to earth
are given in table 2.1. The values listed are intended to convey a rough feeling for the
various physical parameters of lightning. No great accuracy is claimed since the results of
different investigators are often not in good agreement. These values may, in fact, depend
on the particular environment in which the lightning discharge is generated. The choice of
some of the entries in the table is arbitrary.
Table 2.1 — Data concerning cloud-to-ground lightning discharge [3]
9
Energy dissipation in lightning flashes was studied by Cooray [7] at the University of
Uppsala (Sweden). The amounts of energy dissipation in different stages of ground flashes
were estimated by electrostatic energy considerations. Thus, energy present in return strokes
and ground flashes were measured and it can be described as follows.
A typical stepped leader-return stroke process that neutralizes 5 C of charge dissipates
about 5.5 × 10⁸ J. Of this energy about 3.5 × 10⁸ J dissipates in the return stroke stage and
2 × 10⁸ J in the leader stage. A unit length of the first return stroke channel dissipates about
7 × 10⁴ J/m.
A typical dart leader-return stroke process that neutralizes 1 C of charge dissipates about
12 × 107 J. Of this energy 4 × 10⁷ J dissipates in the return stroke stage and 8 × 10⁷ J in the
dart leader stage. A unit length of the subsequent return stroke channel dissipates about
8 × 10³ J/m.
A typical ground flash with four strokes dissipates about 9.5 × 10⁸ J. Of this energy
4.5 × 10⁸ J dissipates in the leader stages, and 5 × 10⁸ J dissipates in the return stroke stages.
In the analysis, the following conclusions were also obtained:
• The charge that maximizes the energy dissipation during the leader
stage depends on the charge density of the cloud. For the values of
cloud charge densities measured in experimental investigations this
optimum charge is about 5 C.
• For a given amount of charge neutralization, a cloud flash dissipates
more energy than a ground flash.
2.2 - Keraunic level
There are specific areas in the world, which are particularly affected by lightning. Its
origin is explained by means of three factors:
topological factors;
geological factors;
air ion concentration.
In some regions, thunder clouds (cumulonimbus) can be formed more easily due to
humidity and temperature conditions. Local factors as trees, some constructions, chimneys,
etc. also increase the incidence of lightning strikes. And, air conductivity can be higher in
some areas due to air ion concentration.
In order to describe the lightning and thunder activity in a region, usually, keraunic level
is used. It is defined as the number of days during one year where thunder can be heard in a
given area. Keraunic level, in some areas, will vary a lot and it is a long term average which
establish a statistical data base with information for different regions. This parameter is very
useful in order to design electrical installations and its protection system.
Keraunic level varies according to the part of the world; reference values are given
below:
10
10
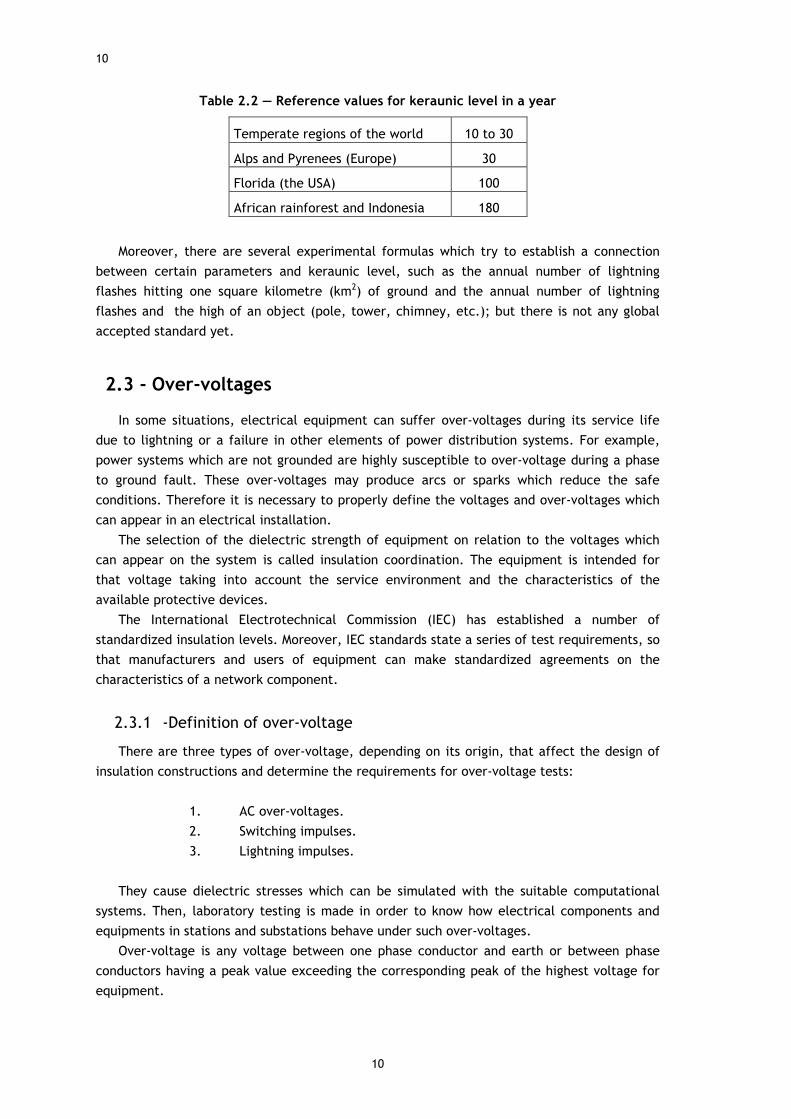
Table 2.2 — Reference values for keraunic level in a year
Temperate regions of the world 10 to 30
Alps and Pyrenees (Europe) 30
Florida (the USA) 100
African rainforest and Indonesia 180
Moreover, there are several experimental formulas which try to establish a connection
between certain parameters and keraunic level, such as the annual number of lightning
flashes hitting one square kilometre (km2) of ground and the annual number of lightning
flashes and the high of an object (pole, tower, chimney, etc.); but there is not any global
accepted standard yet.
2.3 - Over-voltages
In some situations, electrical equipment can suffer over-voltages during its service life
due to lightning or a failure in other elements of power distribution systems. For example,
power systems which are not grounded are highly susceptible to over-voltage during a phase
to ground fault. These over-voltages may produce arcs or sparks which reduce the safe
conditions. Therefore it is necessary to properly define the voltages and over-voltages which
can appear in an electrical installation.
The selection of the dielectric strength of equipment on relation to the voltages which
can appear on the system is called insulation coordination. The equipment is intended for
that voltage taking into account the service environment and the characteristics of the
available protective devices.
The International Electrotechnical Commission (IEC) has established a number of
standardized insulation levels. Moreover, IEC standards state a series of test requirements, so
that manufacturers and users of equipment can make standardized agreements on the
characteristics of a network component.
2.3.1 -Definition of over-voltage
There are three types of over-voltage, depending on its origin, that affect the design of
insulation constructions and determine the requirements for over-voltage tests:
1. AC over-voltages.
2. Switching impulses.
3. Lightning impulses.
They cause dielectric stresses which can be simulated with the suitable computational
systems. Then, laboratory testing is made in order to know how electrical components and
equipments in stations and substations behave under such over-voltages.
Over-voltage is any voltage between one phase conductor and earth or between phase
conductors having a peak value exceeding the corresponding peak of the highest voltage for
equipment.

11
For any insulation configuration, an over-voltage is any voltage across its terminals higher
than the peak of the power-frequency voltage existing between them when all phase
terminals of the equipments are energized with the highest voltage for equipment.
2.3.2 -Classification of voltages and over-voltages
According to their shape and duration, voltages and over-voltages are divided in the
following classes, as defined by the IEC 60071-1 [34]:
a.) continuous voltage.
b.) temporary over-voltage.
c.) transient over-voltage.
d.) Combined over-voltage.
A continuous voltage is a power-frequency voltage. A temporary over-voltage is a power
frequency over-voltage of relatively long duration, and, a transient over-voltage is a short-
duration over-voltage of a few milliseconds or less, oscillatory or non-oscillatory, and usually
highly damped, as defined by the international standard [34].
In figure 2.5 below, shapes of stressing continuous voltages and temporary over-voltages
are shown. Both kinds of stresses are designed as low frequency stresses. For temporary over-
voltage, the over-voltage may be undamped or weakly damped. In some cases its frequency
may be several times smaller or higher than power frequency.
Figure 2.5 -Shapes of stressing continuous voltages (left) and temporary over-voltages (right).
Transient over-voltages may be immediately followed by temporary over-voltages. In such
cases the two over-voltages are considered as separate events. Transient over-voltages are
divided into:
• slow-front over-voltage. Transient over-voltage with time to
peak 20 µs < Tp ≤ 20 µs, and tail duration T2 ≤ 20 ms.
• fast-front over-voltage. Transient over-voltage with time to
peak 0.1 µs < T1 ≤ 20 µs, and tail duration T2 < 300 µs.

12
12
• very-fast-front over-voltage. Transient over-voltage with time
to peak Tf ≤ 0.1 µs, total duration < 3 ms, and with
superimposed oscillations at frequency 30 kHz < f < 100 MHz.
In next figure 2.6 it is possible to see the shapes of these three classes of transient over-
voltages.
Figure 2.6 - Shapes of stressing transient over-voltages: slow-front (up), fast-front (middle) and very-fast-front (down).
A combined over-voltage consists of two voltage components simultaneously applied
between each of the two phase terminals of a phase-to-phase (or longitudinal) insulation and
earth. It is classified by the component of higher peak value (temporary, slow-front, fast-
front or very-fast-front over-voltage).
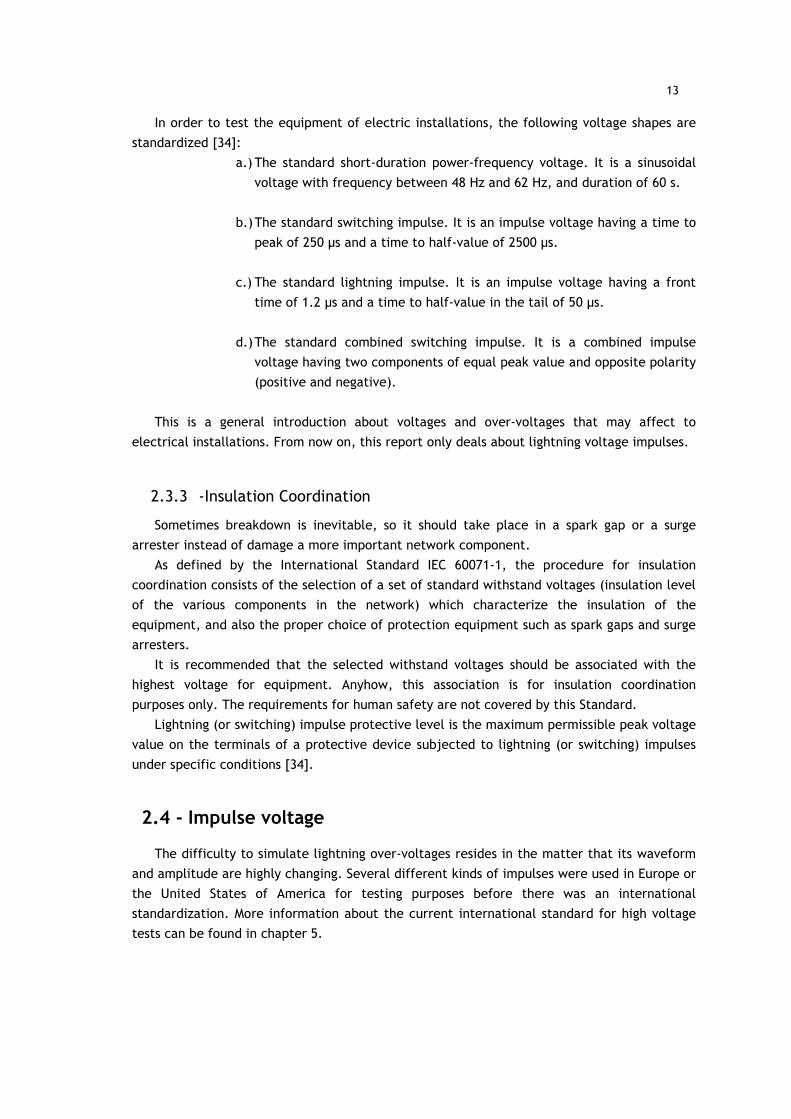
13
In order to test the equipment of electric installations, the following voltage shapes are
standardized [34]:
a.) The standard short-duration power-frequency voltage. It is a sinusoidal
voltage with frequency between 48 Hz and 62 Hz, and duration of 60 s.
b.) The standard switching impulse. It is an impulse voltage having a time to
peak of 250 µs and a time to half-value of 2500 µs.
c.) The standard lightning impulse. It is an impulse voltage having a front
time of 1.2 µs and a time to half-value in the tail of 50 µs.
d.) The standard combined switching impulse. It is a combined impulse
voltage having two components of equal peak value and opposite polarity
(positive and negative).
This is a general introduction about voltages and over-voltages that may affect to
electrical installations. From now on, this report only deals about lightning voltage impulses.
2.3.3 -Insulation Coordination
Sometimes breakdown is inevitable, so it should take place in a spark gap or a surge
arrester instead of damage a more important network component.
As defined by the International Standard IEC 60071-1, the procedure for insulation
coordination consists of the selection of a set of standard withstand voltages (insulation level
of the various components in the network) which characterize the insulation of the
equipment, and also the proper choice of protection equipment such as spark gaps and surge
arresters.
It is recommended that the selected withstand voltages should be associated with the
highest voltage for equipment. Anyhow, this association is for insulation coordination
purposes only. The requirements for human safety are not covered by this Standard.
Lightning (or switching) impulse protective level is the maximum permissible peak voltage
value on the terminals of a protective device subjected to lightning (or switching) impulses
under specific conditions [34].
2.4 - Impulse voltage
The difficulty to simulate lightning over-voltages resides in the matter that its waveform
and amplitude are highly changing. Several different kinds of impulses were used in Europe or
the United States of America for testing purposes before there was an international
standardization. More information about the current international standard for high voltage
tests can be found in chapter 5.

14
14
The origin of an impulse voltage may be due to two possible causes, as defined by
Kreuger [4]:
• direct stroke; or,
• lightning stroke in a tower.
If a high voltage line is struck by lightning, extremely high voltage waves appear in the
line and move along it. This situation is a direct stroke and can endanger the equipment in
the substations. Lightning arresters are applied at the entrance of the substation in order to
protect the equipment, but electrical insulators of the power lines are also subjected to the
high voltage waves, which can easily be as high as 1 MV. Therefore, it is important to know
how these impulse voltages are to design insulators that withstand without deterioration not
just its nominal voltage, but also high over-voltages of short duration. A flashover arc can be
formed between two metal points, such as a power line and the metallic structure of its
tower, which may stress the insulator (see figures 2.1 and 2.7).
Figure 2.7 - High voltage waves caused by direct lightning stroke on a high voltage line [4].
The shape of this voltage wave shown in figure 2.7 is determined by the shape of the
lightning current. This shape varies considerably from stroke to stroke, but, generally, the
current reaches its peak in 1 to 5µs and falls down to a low value in about 50 to 100µs. This
shape can be described as:
2 1
t t
si i e eτ τ
− − = ⋅ −
(2.1)
The resulting voltage wave has the shame shape and produces the travelling waves as
shown in figure 2.7 above.
2 1( )
t t
u t A e eτ τ− −
= ⋅ −
(2.2)
Another mechanism that causes voltage waves is related to a lightning stroke in a tower,
or in the earth conductors which protect the line. The lightning current has now to pass the
impedance ( )R j Lω+ ⋅ ⋅ of the tower, as shown in figure 2.8 below.

15
Figure 2.8 - Tower struck by lightning [4].
The self-induction L is determined by the size of the tower and is in the order of 20µH
and, the resistance R is mainly determined by the earth resistance of the foundations; 10 Ω is
approximately a good value for it.
When it happens, an over-voltage U is caused by the lightning current passing
( )R j Lω+ ⋅ ⋅ . The voltage between the top of the tower and earth can be calculated by
means of the next equation:
2 1
2 1
t t
s s
L LU i R e i R e
τ τ
τ τ− −
= ⋅ − ⋅ − ⋅ − ⋅
(2.3)
Inserting usual values like shown in table 2.3, the equation (2.3) gives a peak voltage of
1 MV.
Table 2.3 — Usual values for an impulse voltage
is 50 kA
τ1 1 µs
τ2 50 µs
The top of the tower reaches a higher potential than the line and flashover occurs from
tower to line. Electrical insulators must again withstand it without deterioration as described
above. This is a peculiar phenomenon because flashover takes place from the “earthed”
electrical tower to the power line as shown in next figure 2.9.
Figure 2.9 - Flashover from tower to power line due to lightning stroke in a tower [4].
Consequently, a travelling wave enters the line in the way shown in figure 2.7 causing the
same consequences.

16
16
17
Chapter 3
Generation of High Voltage impulses and Laboratory Equipment
The purpose of the High Voltage Laboratory of the Faculty of Engineering is to test
electrical components and equipments which may be stressed by lightning impulse voltages
that can reach hundreds of kilovolts or even more.
Specifically, an evaluation of the effects of such over-voltages on insulators will permit to
develop new electrical equipments, insulator materials, and, in general, to study high voltage
phenomena.
The laboratory was only used to carry out tests on electrical indoor and outdoor post
insulators, but other electrical equipment, such as high voltage cables, can also be tested
doing the appropriate changes established by international standards.
Impulse voltages are generated by an impulse generator based on Marx Impulse Generator
that will be described in this chapter.
3.1 - Erwin Marx: historical note
Erwin Otto Marx (1893-1980) was a German electrical engineer who first described a
system to generate impulse voltages. It was in 1923 and, nowadays, the Marx Impulse
Generator is widely used when high impulse voltage values are needed for laboratory testing
purposes.
At the 3rd IEEE Pulsed Power Conference (June 1981), the Erwin Marx Award was created
and dedicated to the memory of Professor Marx and his concept of the Cascade Impulse
Voltage Generator.
Nowadays, the IEEE Erwin Marx Award, established in 1997, recognizes outstanding
technical achievements in pulsed power engineering, science and technology by an individual
over an extended period of time. This prize acknowledges the importance of Professor Erwin
Marx and is given biennially to individuals who have made outstanding technical contributions
to pulsed power technology for at least ten years.

18
18
3.2 - Marx impulse generator
The first Impulse Generator was developed by Marx at the beginning of the 20th century.
This system permits to test elements of power lines under a range of over-voltages which
might occur during a product’s service life due to lightning or transient voltage phenomena
resulting from equipment association with power distribution systems.
Basically, it consists of a stack of capacitors that are charged in parallel through charging
resistors and discharged in series through discharging resistors (front and tail resistors). It is
possible by means of sphere-gaps: at certain instant, when the disruptive discharge voltage is
achieved in the air between the sparking points of the spheres, a flashover arc occurs and
capacitors become connected in series through the short circuit.
This is probably the most common way of generating a high voltage impulse for laboratory
testing because capacitors are charged in parallel and, when they connect in series, the
addition of the voltages permits to reach very high voltage values, that is, the power supply
used to charge all the capacitors is multiplied by means of the use of sphere-gaps.
The operation principle of the Marx Impulse Generator is explained in this section, first as
a simplified generator and then as a multistage generator, because the Impulse Test System
of the High Voltage Laboratory is a Marx Generator with five stages.
3.2.1 -Simplified circuit
In figure 3.1, the simplified circuit is depicted in order to explain the basic operation of
an impulse generator. The design of the Impulse Test System of the High Voltage Laboratory
is based in this circuit.
Figure 3.1 - Simplified impulse generator [1].
Capacitors C1 and C2 are charged in parallel by the DC power supply Uc. These capacitors
are called discharge capacitances and they store the energy of the impulse generator. The
group C1, R1 and R2 is connected in parallel regarding to the capacitor C2 as far as the sphere-
gap is not triggered. The voltages of C1, C2 and the sphere-gap are zero at the beginning.
When the charging process starts, the voltage at these elements start increasing, and, at a
certain moment, the air between both spheres breaks down and two new circuits appear.
Thus, capacitors C1 and C2 are discharged through R1 and R2, respectively.
The capacitance C1 discharges itself through R1 with a time constant τ1:

19
1 1 1R Cτ = ⋅ (3.1)
And, the capacitance C2 discharges itself through R2 with a time constant τ2:
2 2 2R Cτ = ⋅ (3.2)
In this process, a double exponential wave is generated. The output voltage u(t) results
from the subtraction of both exponential curves due to the discharges of C1 and C2 as shown
in figure 3.2.
Figure 3.2 - Double exponential curve as generated by the impulse generator showed in figure 3.1 [1].
These two charge displacements cause a voltage surge of the shape:
2 1( )
t t
u t A e eτ τ
− − = ⋅ −
(3.3)
The output voltage u(t) depends on the charging voltage Uc (showed in the equation (3.3)
as A) and, time constants τ1 and τ2 that affect to rise and tail time respectively and only
depend on values of R1-C1 and R2-C2.
The international standard (see chapter 5) defines the impulse voltage as a biexponential
wave with 1.2µs of front time and 50µs of time to half value.
20
20
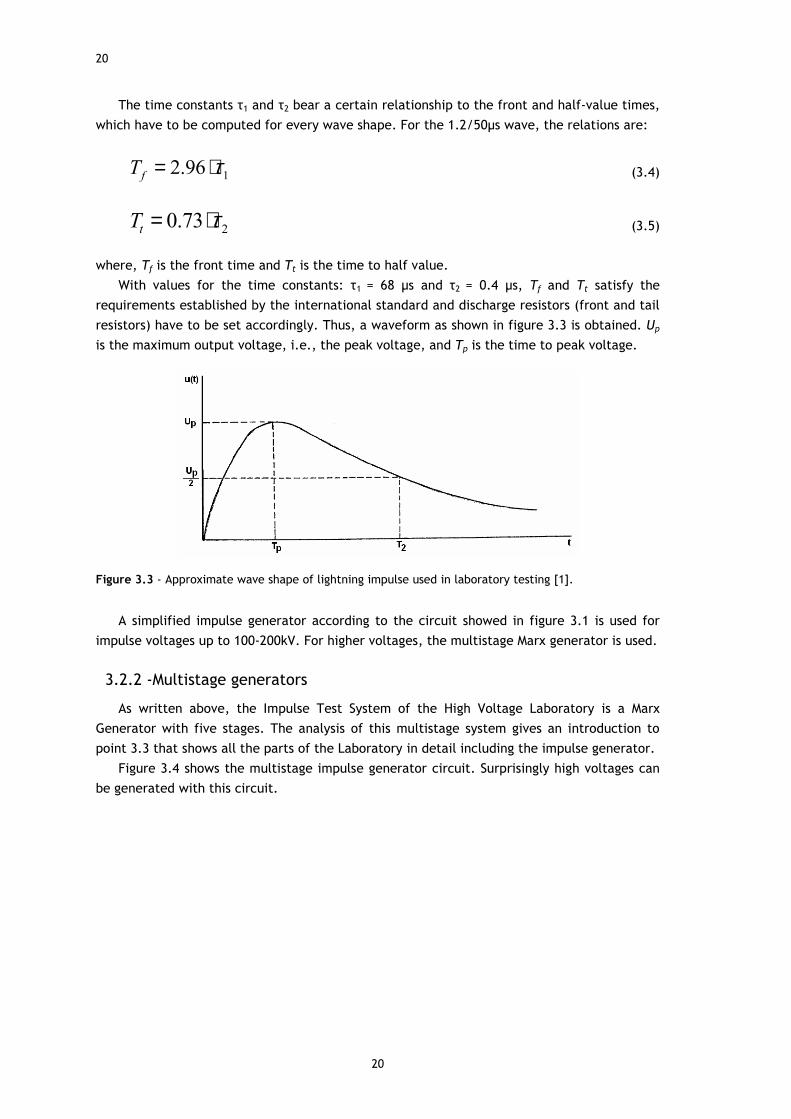
The time constants τ1 and τ2 bear a certain relationship to the front and half-value times,
which have to be computed for every wave shape. For the 1.2/50µs wave, the relations are:
12.96fT τ= ⋅ (3.4)
20.73tT τ= ⋅ (3.5)
where, Tf is the front time and Tt is the time to half value.
With values for the time constants: τ1 = 68 µs and τ2 = 0.4 µs, Tf and Tt satisfy the
requirements established by the international standard and discharge resistors (front and tail
resistors) have to be set accordingly. Thus, a waveform as shown in figure 3.3 is obtained. Up
is the maximum output voltage, i.e., the peak voltage, and Tp is the time to peak voltage.
Figure 3.3 - Approximate wave shape of lightning impulse used in laboratory testing [1].
A simplified impulse generator according to the circuit showed in figure 3.1 is used for
impulse voltages up to 100-200kV. For higher voltages, the multistage Marx generator is used.
3.2.2 -Multistage generators
As written above, the Impulse Test System of the High Voltage Laboratory is a Marx
Generator with five stages. The analysis of this multistage system gives an introduction to
point 3.3 that shows all the parts of the Laboratory in detail including the impulse generator.
Figure 3.4 shows the multistage impulse generator circuit. Surprisingly high voltages can
be generated with this circuit.

21
Figure 3.4 - Multistage impulse generator [11].
As described by Kreuger [4], the charging resistors Rch are needed for charging the
generator. The front and tail discharge resistors are Rf and Rt, respectively, may be changed
in order to adjust the front time and the time to half value in the generator according to the
Standard (see chapter 5).
Sphere-gaps are placed between stages. The discharge capacitors C are charged in
parallel and discharged in series, what occurs when sphere-gaps are fired.
When the first sphere-gap is fired, the others follow and a voltage (nUc) is generated in
the output terminal; where n is the number of stages and Uc is the charging voltage and,
consequently, the voltage between capacitor’s terminals of any stage at the end of the
charging process.
3.3 - Laboratory equipment
In this section, equipment and operating information of the High Voltage Laboratory is
described in order to familiarize personnel with the set-up and operation. The main
characteristics of the equipment are described. Further information is available in manuals of
the equipment when required.
The Impulse Test System of the Laboratory is the Hipotronics Impulse Generator Model
IG 500-12.5 and is designed for simulating lightning or transient voltage phenomena resulting
from equipment association with power distribution systems as required by IEEE and IEC
international standards. This generator is designed to operate with a charging voltage of
100kV per stage and an energy rating of 12.5kJ per stage.

22
22
The need for components which will reliably withstand short duration over-voltage
waveforms demands that simple and safe lightning simulators be available. This test system
includes: a control console, high voltage power supply, capacitor bank with switching
arrangement, capacitive mixed divider and oscillographic monitoring system.
Note:
Equipment user’s guides must be read carefully before starting. This equipment employs
voltages which are dangerous and may be fatal if contacted by operating personnel. Extreme
caution shall be exercised when working with equipment. Never approach or touch a
potentially live high voltage circuit without solidly connecting an appropriate ground
conductor first.
3.3.1 - General description
The multiplier circuit of Marx has a predefined number of stages. Concretely, the
generator of the High Voltage Laboratory has 5 stages and is shown in figure 3.5 below. Each
stage is made up of a capacitance, a charging resistor, front resistor and tail resistor.
Figure 3.5 - Impulse generator
Figure 3.6 shows the electrical circuit of the Impulse Test System based on the circuit
shown in the previous section. It is a generator with 5 stages and with the most important
components, such as the high voltage charging supply, the trigger generator and the motor
drive mechanism used to vary the sphere-gap spacing.

23
Figure 3.6 – Impulse generator circuit [11].
As said in section 3.2, all stages are charged in parallel and discharged through sphere-
gaps when connected in series. This means that, after discharge, the resulting voltage is:
( )t skE n E= − ⋅ (3.1)
where:
Et .- Output Voltage;
n .- Number of generator stages used;
Es .- Charge Voltage per stage;
k .- Losses due to system inductance.

24
24
The rest of components of the circuit, capacitors and resistors, were already defined in
section 3.2.2.
Each stage is charged to voltage (+Es). When the system is triggered, a voltage of (2Es)
appears across gap 2. This is due to the fact that one capacitor high voltage plate is pulled
down to zero and a negative charge redistribution appears on the other plate. The process is
repeated yielding an output voltage of an opposite polarity from the charging supply.
In practice, if a positive wave is desired, the polarity of the power supply must be
negative output. The negative output, equally, requires a positive charging voltage.
When a selected voltage is reached, charging process is halted by electromechanical
means. At this time an isolated electronic trigger (see section 3.3.7) delivers a pulse to
discharge the capacitor bank. A simultaneous oscillographic recording is made of the impulse
waveform [11].
The discharge capacitance C should always be larger than the load Cl, as otherwise the
efficiency of the generator will be too low. A factor 3 may be acceptable, but higher values
are preferred, as described by Kreuger [4].
The impulse test system is set with parameters shown in table 3.1 below:
Table 3.1 — Generator parameters.
Rf 35 Ω Rt 200 Ω Rch 18 kΩ Cg 500 nF N 5 stages
By means of changing front and tail resistors, Rf and Rt, it is possible to vary the
discharging time and, in this way, to avoid the effect of stray inductances, because the faster
the velocity change of current in the circuit, the bigger the effect of stray inductances, as it
can easily be demonstrated by basic principles of electromagnetism.
In addition, the inductance of the circuit should be kept low. If too much inductance is
present, a waveform as shown in figure 3.7a occurs. With front times less than 1 µs these
oscillations cannot be prevented. At about 1 µs front time the oscillations have vanished but
some overshoot still occurs, as shown in figure 3.7b. IEC standards allow, therefore, an
overshoot of up to 5 %.
(a) (b)
Figure 3.7 - Effect of stray inductances [4].
25
To reach this approved wave-shape, the stray inductance Ls of the generator circuit shall
satisfy next condition, as recommended by Kreuger [4]:
2 s sf
l
L LR
C C⋅ + ≤ (3.2)
The efficiency η of the generator is:
c
p
U n
Uη ⋅= (3.3)
where:
Uc – DC charge voltage per stage;
n – number of stages in the generator;
Up – Peak voltage of the output waveform.
Further information about lightning impulse front time, time to half value and efficiency
can be found in the instruction manual of the 100 Series Impulse Generator.
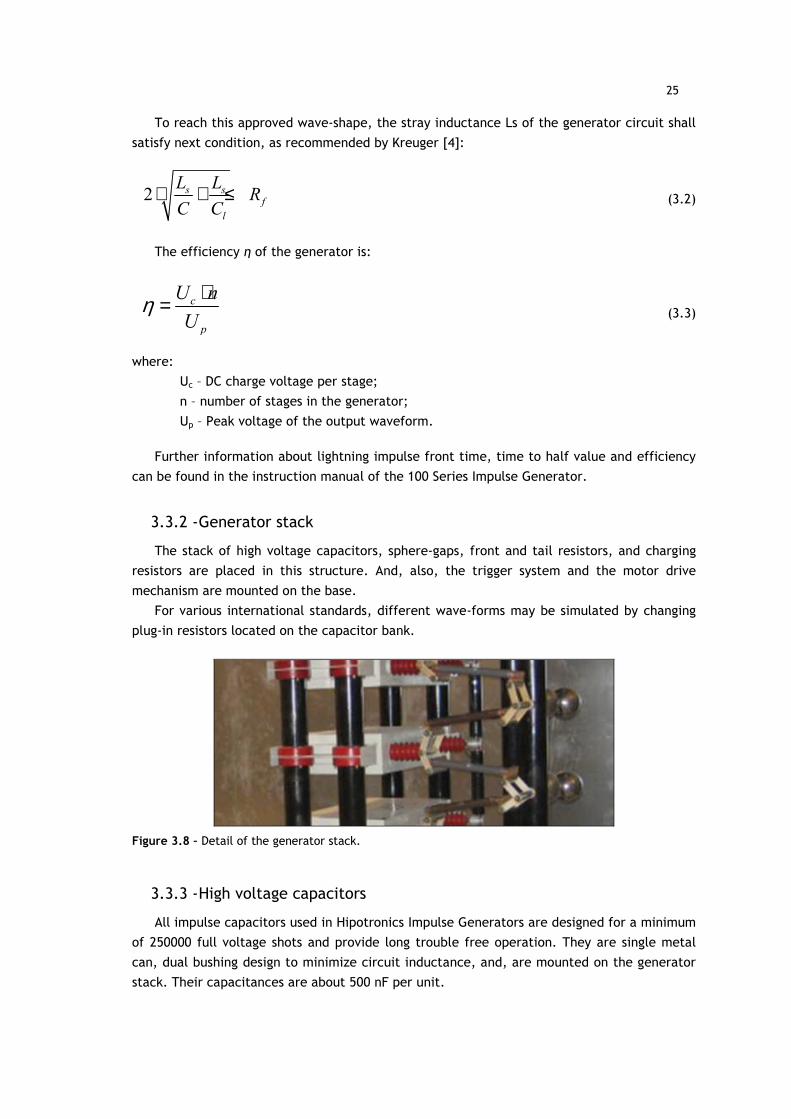
3.3.2 - Generator stack
The stack of high voltage capacitors, sphere-gaps, front and tail resistors, and charging
resistors are placed in this structure. And, also, the trigger system and the motor drive
mechanism are mounted on the base.
For various international standards, different wave-forms may be simulated by changing
plug-in resistors located on the capacitor bank.
Figure 3.8 – Detail of the generator stack.
3.3.3 - High voltage capacitors
All impulse capacitors used in Hipotronics Impulse Generators are designed for a minimum
of 250000 full voltage shots and provide long trouble free operation. They are single metal
can, dual bushing design to minimize circuit inductance, and, are mounted on the generator
stack. Their capacitances are about 500 nF per unit.
26
26
Internal construction consists of Kraft paper, Polyester film, castor oil dielectric, with
swedged low inductance sections. They have an internal discharging resistor; this bleeder
resistor is connected in parallel in order to discharging the energy stored in the capacitor.
The internal discharge time constant is several minutes and these resistors should not be
relied upon to safety ground the capacitors. The capacitor terminals and the capacitor case
should always be grounded with a shorting stick before touching any parts of the generator
structure by hand.
3.3.4 - Waveshaping resistors
Each stage has provision for up to 4 front and 4 tail resistors to be connected in
parallel. Depending on the calculated values of resistance required to test a particular
load, the appropriate combination of resistors may be plugged in accordingly. All
Hipotronics’ resistors are non-inductively wound.
Front and tail resistors available in the High Voltage Laboratory are shown below:
• 2 units of 20 Ω (R-6154)
• 3 units of 25 Ω (R-6196)
• 8 units of 35 Ω (R-6201)
• 3 units of 60 Ω (R-6197)
• 5 units of 75 Ω (R-6199)
• 6 units of 200 Ω (R-4966)
• 6 units of 450 Ω (R-4967)
Resistors selection must be done according to the rules below:
• To know the amount of energy necessary per stage and for the testing which
will be carried out.
• To install necessary front and tail resistors in each stage according to the
amount of energy per stage.
• Do not do any test with standard resistors and repetitions shall be done not
before one minute after the previous voltage application.
• When resistors are placed in parallel, it is necessary to make sure that each
resistor is proportional to the energy which it will absorb.
• Every stage joined in series, independently of the stages which are joined in
parallel, must have the same front and tail resistors.
3.3.5 - Charging resistors
The charging resistors are of similar design to the waveshaping resistors but are
typically of a higher ohmic value. The charging resistors are of sufficiently high value to
allow proper firing of the impulse generator without influencing the wave-shape, but not
so high as to cause unequal charging voltage on the upper stages. There are 5 units of
about 18kΩ mounted on the stack.

27
3.3.6 - Charging supply
Each generator is supplied with a reversible polarity power supply that provides the DC
voltage for charging the stage capacitors. The charging supply provides a high voltage output
up to 50mA and 100kV in DC.
The circuit design for the power supplies consists of a full wave bridge rectifier. Since the
load of the impulse generator is capacitive, no internal capacitors are required within the
power supply, which simplifies the design. All units have a simple polarity reversal
mechanism that is motorized for use with C100-M controller as a standard feature.
Internally the supply contains its own current limiting resistor and system discharge
resistor. Heavy-duty solenoids provide gravity discharge of capacitor bank should system
power be interrupted.
The charging units are assembled in a steel tank and are vacuum filled with mineral based
transformer oil. The output connection is provided via a HV coaxial cable to allow the
charging supply to be located away from the HV components of the impulse circuit.
3.3.7 - Trigger system
In order to determine the exact moment of firing, so that the time sweep of oscilloscopes
and other measuring equipment can be tripped, a triggered sphere-gap according to figure
3.9 is used. A trigger impulse of 15 kV is used to break down the annular gap. This causes a
distortion of the main field, ultra-violet radiation fills the gap and a source of charged
particles occurs at the triggered electrode, so that breakdown of the main gap is initiated.
Figure 3.9 - Triggered gap [4].
The gaps should be in line and they should “see” each other. Thus, the ultra-violet light
of the first gap irradiates the others so that the breakdown is initiated. If the radiation is
blocked, the firing of the generator will be inconsistent and often be incomplete. Internal
oscillations are prevented by dividing the front resistors Rf over the stages. It would have
been more practical to concentrate the front resistance Rf in series with the generator,
however, stray inductance would cause oscillations within the stages, which would spoil the
wave-shape and even cause breakdown of the discharge capacitors.

28
28
The system necessary to create this impulse of 15kV is shown in figure 3.10:
Figure 3.10 - Trigger system
The basic operation is as follows. When the pulse button on front panel of the control
console (see section 3.3.10) is depressed, a short circuit across H-E is caused. And then, next
sequence occurs:
1.) Scr-1 fires and discharges capacitor C2.
2.) Capacitor C2’s energy is discharged into the primary of ignition coil on base.
3.) Ignition coil steps up voltage and causes ignition between stage 1 sphere gaps.
4.) Partial ionization triggers first gap and remaining stages fired.
5.) Capacitor C1 running to terminal A provides a trigger pulse for the Tektronix 507
scope.
After sparking in the first sphere gap, a sequence of sparking in the next sphere gaps
occurs. This is the way how the capacitor’s bank is triggered and impulse voltage for testing
is obtained.
From the impulse out terminal to the trigger electrode in the first gap of the generator,
there is a delay cable which is fixed length. This cable has a fixed delay equal to the transit
time of the delay line, which is approximately 200ns.
Terminal G impulse from scope allows remote firing from the scope main frame.
Power supply of trigger system has the function of supplying a controlled high voltage
signal which will be used to ionize the electrode of the spark gap of the first stage.

29
The typical triggering range for the 100 series generators is shown in figure 3.11. The
impulse must be inside the highlighted area in order to ensure a successful firing of the gap.
Figure 3.11 - Typical triggering range.
3.3.8 - Motor drive mechanism
As shown in figure 3.12, the design of the gap system consists of a fixed set of spheres
that are connected to the waveshaping resistor provisions (on the right side) and a moving set
of spheres that are connected to the stage capacitors (on the left side).
The individual spheres are fixed to the gap support tubes and adjustment is provided to
set the gap spacings. The moving gap tube is connected to a DC motor drive and gear
reducing package that provides remote adjustment of the gap spacing. Since the gaps are all
mounted to a common tube, the spacing can be controlled with a high degree of linearity.
The motor drive system also includes a 10 turn potentiometer which is used to drive the
panel indicator for gap spacing.
This unit does not have any automatic drive control.

30
30
Figure 3.12 - Motor drive mechanism
3.3.9 - High voltage discharging relay
The High voltage discharge relay is an electrically operated switch that opens when the
charging supply is operating and closes when power is interrupted or if the generator is
turned off. The switch is connected in series with a discharge resistor that absorbs the stored
energy in the generator. The design of the high voltage discharge circuit is to rapidly
discharge the high voltage capacitors to zero voltage under emergency conditions.
It is an external air insulated switch that is mounted on the base of the impulse
generator.
3.3.10 - Impulse generator control system
Hipotronics Impulse Generator Control System Model C-100M, is an integrated system
designated to charge and control the firing of the standard IG100-2.5 generator.
The control console is shown in figure 3.13 below. The following items are found on the
control console panel:
• Main power circuit breaker;
• Main power “ON” indicator lamp;
• High voltage “ON” pushbutton;

31
• High voltage “OFF” pushbutton;
• High voltage “ON” indicator lamp
• Pulse initiation pushbutton;
• “Interlock Open” indicator lamp;
• Three position charge rate control;
• Impulse “READY” indicator lamp;
• Dual range kilovoltmeter with high set point;
• Gap breakdown voltage meter;
• Open-Close gap motor control switch;
• Meter calibration access hatches.
Figure 3.13 - Front panel of the control console.
The high voltage charging supply is measured by means of a resistive voltage divider
located on the generator structure.
3.3.11 - Capacitive mixed divider
The capacitive voltage divider shown in figure 3.14 measures the voltage of lightning
impulse tests.

32
32
Figure 3.14 - Resistive voltage divider of the generator.
A voltage divider is a device that is intended to produce accurately a suitable fraction of
the test voltage for measurement. It usually has two impedances connected in series across
which the voltage is applied. One of them, the high-voltage arm, takes the major fraction of
the voltage. The voltage across the other, the low voltage arm, is used for the measurement.
The components of the two arms are usually resistors or capacitors (or combinations of these)
and the device is described by the type and arrangement of the components [26].
The Laboratory of High Voltage has a Hipotronics Capacitive Mixed Divider, Model
CMD-500. The Hipotronics CMD Series dividers are general purpose, series damped, resistive-
capacitive dividers for measuring AC or impulse voltages. They are capable of measuring
voltages from 50 Hz to 599 Hz, Lightning Impulses (L.I.) including Chopped Waves and
Switching Impulses (S.I). The divider is comprised of a single section HV arm, a base
assembly, and HV electrode, an LV arm and a coaxial measuring cable.
The following table 3.2 provides the main system specifications.
Table 3.2 — Main specifications of the capacitive voltage divider.
The HV electrode is a single toroid type. A stress distributor (corona shield) is used at the
end of the beam in order to avoid corona effect.
The HV arm is a series of custom made HV capacitor and series resistor elements. The
capacitor sections and resistors are mounted inside an insulating tube and filled with mineral-
based transformer oil.
The LV arm assembly consists of a custom made capacitor section. This capacitor, along
with an impedance matching resistor, is mounted in a cylindrical metal can. The LV arm
assembly connects to the output connector of the HV arm, located on the front panel at the
base of the Capacitive Mixed Divider.

33
Figure 3.15 shows the capacitive voltage divider sketch provided by the manufacturer
[12].
Figure 3.15 - Sketch of the capacitive voltage divider.
3.3.12 - Oscilloscope used with voltage divider
An oscilloscope is connected to the low-voltage arm of the voltage divider by a coaxial
cable. This is a RG11/U cable for measuring purposes of 15 meters approximately. The signal
is attenuated by means of a high-voltage passive probe of 100X. The digital storage
oscilloscope (DSO) is a Tektronix TDS 340 A (see figure 3.17). A detail of the connection of
these components, except the probe, is shown in figure 3.16.
Figure 3.16 - Detail of the low voltage arm of the voltage divider, the coaxial cable and the measuring device (oscilloscope).
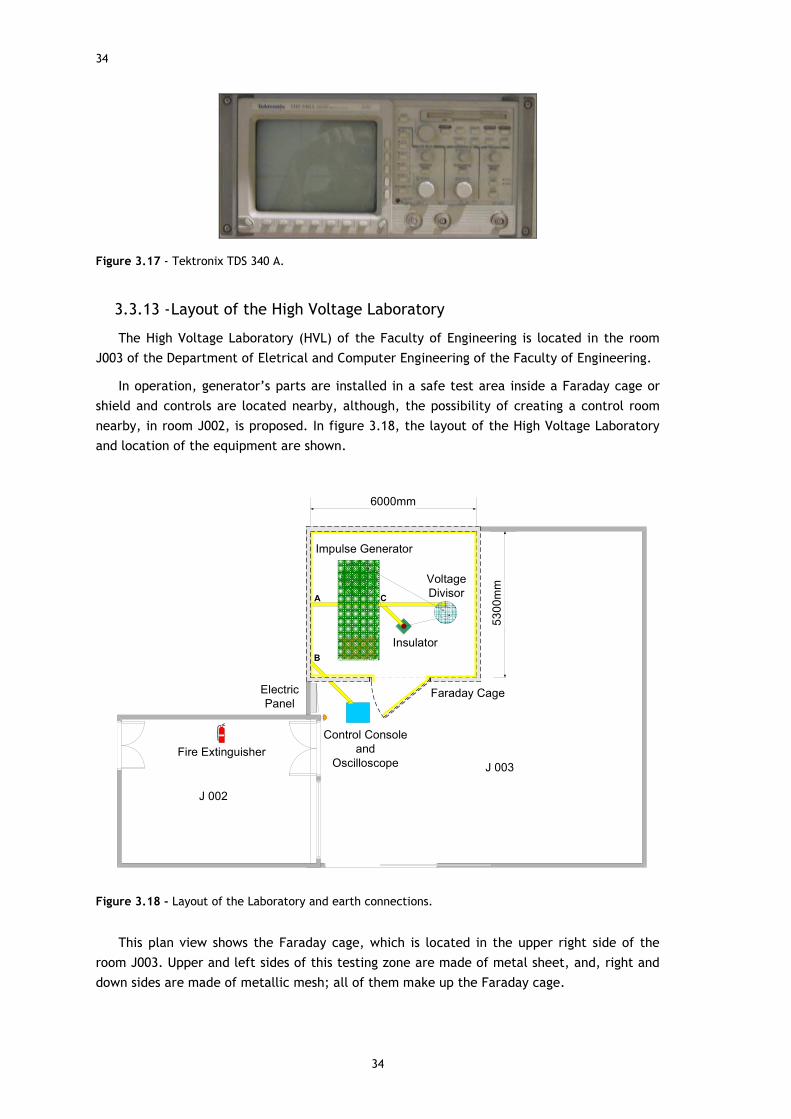
34
34
Figure 3.17 - Tektronix TDS 340 A.
3.3.13 - Layout of the High Voltage Laboratory
The High Voltage Laboratory (HVL) of the Faculty of Engineering is located in the room
J003 of the Department of Eletrical and Computer Engineering of the Faculty of Engineering.
In operation, generator’s parts are installed in a safe test area inside a Faraday cage or
shield and controls are located nearby, although, the possibility of creating a control room
nearby, in room J002, is proposed. In figure 3.18, the layout of the High Voltage Laboratory
and location of the equipment are shown.
J 002
J 003
Faraday Cage
Impulse Generator
Insulator
Voltage
Divisor
Control Console
and
Oscilloscope
5300mm
6000mm
Electric
Panel
Fire Extinguisher
B
A C
Figure 3.18 - Layout of the Laboratory and earth connections.
This plan view shows the Faraday cage, which is located in the upper right side of the
room J003. Upper and left sides of this testing zone are made of metal sheet, and, right and
down sides are made of metallic mesh; all of them make up the Faraday cage.
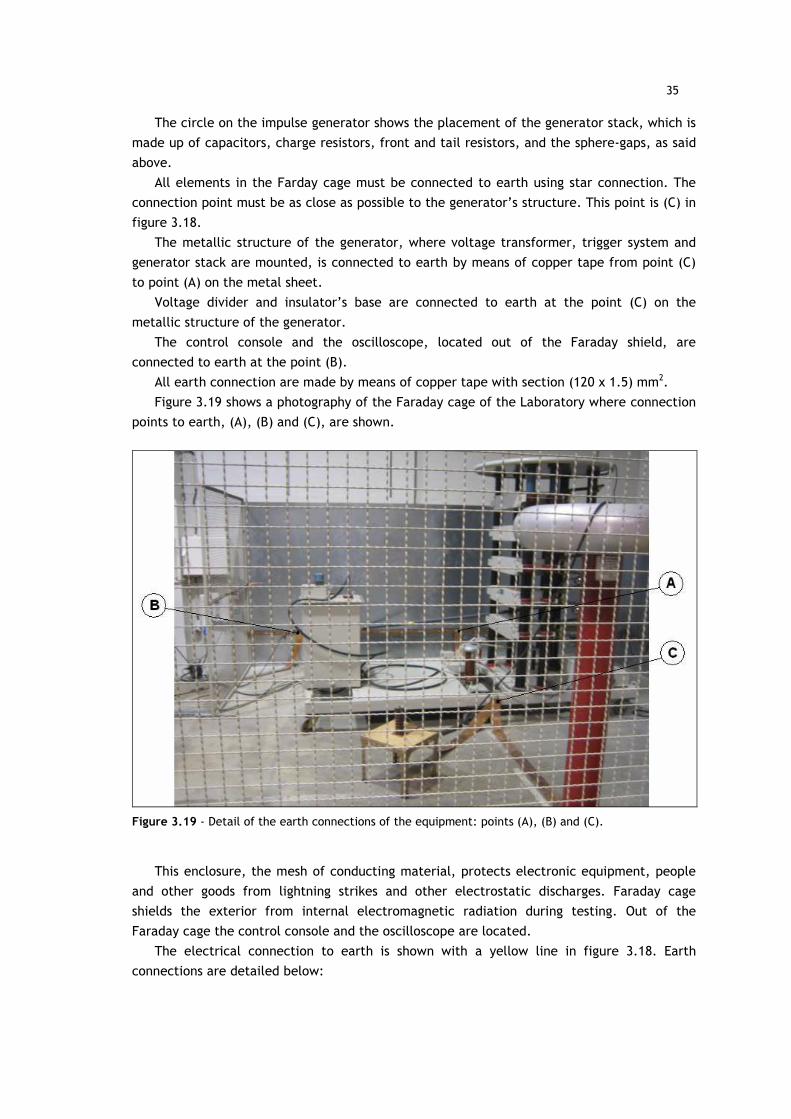
35
The circle on the impulse generator shows the placement of the generator stack, which is
made up of capacitors, charge resistors, front and tail resistors, and the sphere-gaps, as said
above.
All elements in the Farday cage must be connected to earth using star connection. The
connection point must be as close as possible to the generator’s structure. This point is (C) in
figure 3.18.
The metallic structure of the generator, where voltage transformer, trigger system and
generator stack are mounted, is connected to earth by means of copper tape from point (C)
to point (A) on the metal sheet.
Voltage divider and insulator’s base are connected to earth at the point (C) on the
metallic structure of the generator.
The control console and the oscilloscope, located out of the Faraday shield, are
connected to earth at the point (B).
All earth connection are made by means of copper tape with section (120 x 1.5) mm2.
Figure 3.19 shows a photography of the Faraday cage of the Laboratory where connection
points to earth, (A), (B) and (C), are shown.
Figure 3.19 - Detail of the earth connections of the equipment: points (A), (B) and (C).
This enclosure, the mesh of conducting material, protects electronic equipment, people
and other goods from lightning strikes and other electrostatic discharges. Faraday cage
shields the exterior from internal electromagnetic radiation during testing. Out of the
Faraday cage the control console and the oscilloscope are located.
The electrical connection to earth is shown with a yellow line in figure 3.18. Earth
connections are detailed below:

36
36
• Faraday cage’s earth connection;
• Earth connection of the metallic structure. On this structure are placed the
voltage transformer, the stages of the impulse generator and other elements of
the equipment as the trigger system;
• Earth connection common point on the metal sheet. Metal sheets are on the
building’s wall and they are two sides of the Faraday cage square viewed from
the top;
• Insulator tested earth connection;
• Earth connection common point of the impulse generator, the capacitive
voltage divider and the insulator’s base;
• Capacitive voltage divider earth connection.
The control console and the oscilloscope are connected to earth as well at point (B) in
figure 3.19.
3.4 - Preparation of the test
To make a test about certain electrical equipment at the Laboratory of high Voltage, the
steps which are shown below must be followed:
• To place the equipment which will be tested.
• To set the impulse generator by means of the suitable resistors.
• To calibrate the wave which is obtained.
• To execute the test based on international standards.
Lightning impulses are made up of high current values, even higher than 150 kA in some
cases, and they have very short rise time. The standard wave-form rise time is 1.2 µs. It is
different to internal over-voltages, which always happen with Alternating Current (AC) at
power frequency, 50 Hz, so its rise time is much longer, about [ms].
Next information of the Impulse Generator is given below according to Hipotronics [11]:
• Total Number of Stages = 5
• Maximum Voltage per Stage = 100 kV
• Total Energy Stored per Stage = 2.5 kJ
• Maximum Output Voltage = 500 kV
• Net Generator Capacitance = 100 nF
• Maximum Load = 30000 pF (Maximum load without drastically effecting
efficiency)
• Number of Gaps Used = 5
It is possible to calculate easily the capacitance value per stage. The total energy stored
per stage is:

37
( )20 0
1
2E n C U= ⋅ ⋅ ⋅ (3.4)
Therefore, the capacitance per stage is:
( )212.5 100 500
2kJ C kV C nF= ⋅ ⋅ ⇒ = (3.5)

38
38

39
Chapter 4
Computer simulation
Computer simulations have become a very useful part in engineering processes. They
allow to gain insight into the operation of a certain system or to observe its behaviour. They
are, therefore, widely used nowadays and make possible to study, for example, different
configurations of the Impulse Test System of the High Voltage Laboratory.
In this chapter, two computer simulators are used: OrCAD PSpice 9.1 (Student Version)
and PSCAD v4.2.1. The first one helps to carry out a study about how parameters change
according to front and tail resistors and, the second one simulates full lightning and chopped
impulses.
The use of two simulators is justified. For the first part PSpice is used because it provides
quick simulations and accuracy, what permit to create data tables in order to compare the
results obtained. But, when chopped impulses want to be simulated, PSpice is limited;
therefore, it is necessary to count on more powerful computer simulators such as PSCAD for
these purposes.
4.1 - Simulation using PSpice
By means of computer simulation with PSpice, it is possible to determinate peak voltage,
front time and time to half value of a test waveform, and global efficiency of the system. It
allows finding the best solution to comply with international standards and to compare the
results obtained.
Two simulations are made:
• Simulation of the Impulse Generator;
• Simulation of the Impulse Generator under the influence of stray
capacitances between the generator stack and the metal sheet on the wall.

40
40
4.1.1 -Impulse generator: simulation parameters
As depicted in section 3.3, the impulse test system is set with the parameters shown
there. Capacitors of stage are fixed, its capacitance is about 500 nF; charging resistors are
also fixed, its resistance is about 18 kΩ; and, the impulse generator has a fixed number of
stages, 5 stages. Therefore, there are two parameters, Rf and Rt, that may be changed in
order to adjust the test waveform to requirements. These requirements may be: to obtain
certain values of front time T1 and time to half value T2; to reach the maximum output
voltage, that is, maximum peak voltage of the waveform; or to have the highest efficiency η
of the system.
As the main objective of this Master’s Thesis is to establish the principles in order to
adjust the equipment of the High Voltage Laboratory in general, it is not chosen any of the
requirements said above, but it is purposed as a further work to adjust front time and time to
half value of the waveform to comply with the international standard.
As depicted in section 3.1.4, there are available waveshaping resistors with different
resistances. Then, it is interesting to study how parameters of the waveform change
according to resistors chosen. The generator stack has 5 stages, with two places for resistors
per stage: one place for a front resistor and another for a tail resistor; therefore, the study
only takes into account those resistors which there are, at least, 5 units. These resistors are
shown in table 4.1:
Table 4.1 — Resistors available for the study of the impulse generator by means of
simulation.
Output results are, as said above: front time T1, time to half value T2, peak voltage Up
and efficiency η. The peak value Up is the maximum value of the test voltage for a lightning
impulse. The front time T1 of a lightning impulse is 1.67 times the time interval between the
instants when the impulse is 30% and 90% of the peak value, that is:
( )1 90 301.67T T T= ⋅ − (4.1)
The time to half-value or tail time T2 of a lightning impulse is the time interval between
the origin of the wave-shape and the instant on the tail when the voltage has decreased to
half of the peak value (50% of the peak value). And the efficiency of the process is, as
commonly defined:
_ __
_ _
Useful power outputElectrical Efficiency
Total power input= (4.2)
Rf 35 Ω 75 Ω
Rt 200 Ω 450 Ω
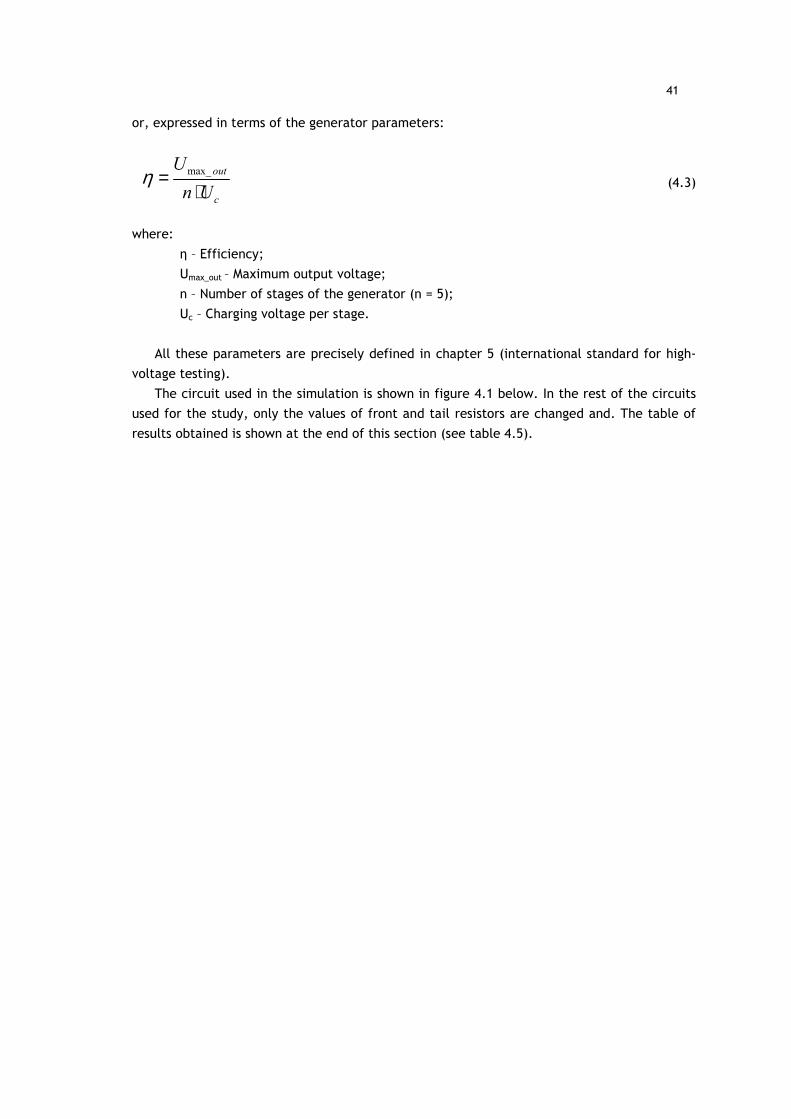
41
or, expressed in terms of the generator parameters:
max_ out
c
U
n Uη =
⋅ (4.3)
where:
η – Efficiency;
Umax_out – Maximum output voltage;
n – Number of stages of the generator (n = 5);
Uc – Charging voltage per stage.
All these parameters are precisely defined in chapter 5 (international standard for high-
voltage testing).
The circuit used in the simulation is shown in figure 4.1 below. In the rest of the circuits
used for the study, only the values of front and tail resistors are changed and. The table of
results obtained is shown at the end of this section (see table 4.5).
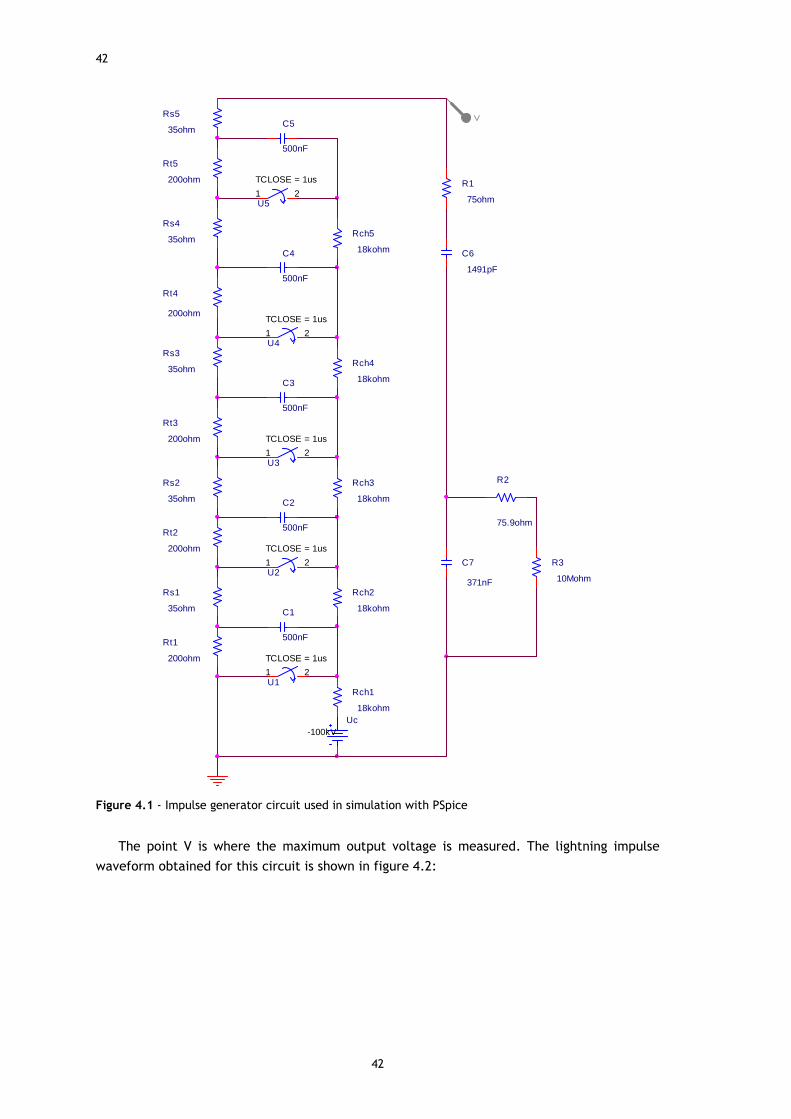
42
42
U3
TCLOSE = 1us
1 2
Rt1
200ohm
U1
TCLOSE = 1us
1 2
C6
1491pF
C7
371nF
Rs3
35ohm
U2
TCLOSE = 1us
1 2
U5
TCLOSE = 1us
1 2
Rch2
18kohmC1
500nF
C5
500nF
R3
10Mohm
V
Rch4
18kohm
Rt3
200ohm
Rs2
35ohm
Rt5
200ohm
Rs1
35ohm
Rs5
35ohm
Rch5
18kohm
C2
500nF
C3
500nF
Rt2
200ohm
Rt4
200ohm
Rs4
35ohm
Rch3
18kohm
Uc-100kV
U4
TCLOSE = 1us
1 2
C4
500nF
Rch1
18kohm
R1
75ohm
R2
75.9ohm
Figure 4.1 - Impulse generator circuit used in simulation with PSpice
The point V is where the maximum output voltage is measured. The lightning impulse
waveform obtained for this circuit is shown in figure 4.2:

43
Figure 4.2 - Typical lightning impulse waveform obtained in the simulation with PSpice
The criterion chosen in order to study how parameters change according to front and tail
resistors is to simulate with the highest, the lowest and medium values for front and tail
resistors.
The highest values for front and tail resistors are shown in table 4.2:
Table 4.2 — Highest values for front and tail resistors.
Rfmax 75 Ω
Rtmax 450 Ω
The lowest values for front and tail resistors are obtained with front resistors connected
in parallel and tail resistors connected in parallel respectively. They are shown in table 4.3:
( )min 35 / /75 23.86fR Ω Ω = Ω (4.4)
( )min 200 / /450 139tR Ω Ω = Ω (4.5)
Table 4.3 — Lowest values for front and tail resistors.
Rfmin 23.86 Ω
Rtmin 139 Ω

44
44
The medium values for front and tail resistors are calculated below and their values are
shown in table 4.4:
23.86 7549.47
2fmedR
Ω + Ω= = Ω (4.6)
139 450294.5
2tmed
RΩ + Ω= = Ω (4.7)
Table 4.4 — Medium values for front and tail resistors.
Rfmed 49.47 Ω
Rtmed 294.5 Ω
4.1.2 -Impulse generator: obtained Results
Obtained values in the simulation process are shown in table 4.5 below. Maximum and
minimum values for maximum peak voltage Up, front T1 and tail T2 times, and efficiency η are
highlighted.
Table 4.5 — Obtained results: values for front time
As a note, it is possible to say that the impulse generator with Rf = 49.47Ω and Rt = 139Ω
complies with the international standard; it will be detailed in chapter 5. The standard
waveform has a front time of 1.2 µs and a time to half value of 50 µs; therefore, the
waveform obtained in the simulation with times 1.34 µs and 52.65 µs respectively is within
tolerance limits defined by the Standard [26].
It is possible to list the main features of the impulse generator simulation extracted from
data in table 4.5:
• The maximum peak voltage and, therefore, the maximum efficiency, are
obtained with the minimum value of front resistor and the maximum value of tail
resistor, and vice versa.
It is because, the lower the front resistance, the lower the voltage drop of the
discharging circuit. And, the higher the tail resistor, the higher the discharging time and,
therefore, the waveform reaches higher peak voltage.

45
• The higher the value of front resistor, the higher the rise time, and vice versa,
the lower the front resistance, the lower the rise time.
• The higher the value of the tail resistor, the higher the tail time, and vice versa,
the lower the tail resistance, the lower the tail time.
Both features can be described with the same reason. Discharge time constant of the
stack of capacitors is directly proportional to resistance, as shown by equation 4.8.
DR Cτ = ⋅ (4.8)
where:
τD – Discharge time constant in seconds;
R – Resistance in ohms;
C – Capacitance in Farads.
The main parameters of the impulse generator test can be depicted. It easily allows
seeing how they change according to values of front and tail resistors.
Figure 4.3 shows the change of the peak voltage when front resistance increases, and for
a constant tail resistance of 450Ω. The higher front resistor, the lower peak voltage.
408,599
406,545
404,243
402,000
403,000
404,000
405,000
406,000
407,000
408,000
409,000
23,86 49,47 75,00
Front resistance [ohm]
Pea
k vo
ltag
e [k
V]
Figure 4.3 - Variation of peak voltage in kV according to front resistance in ohms. It is considered a constant tail resistance of 450Ω.
For a constant value of tail resistance, and varying front resistance, the efficiency of the
system decreases like peak voltage does, that is, the higher the front resistance, the lower
the efficiency. Therefore, figure 4.4 shows the variation of the efficiency according to tail
resistance, for a constant value of front resistance of 75Ω. The higher tail resistor, the higher
efficiency.

46
46
78,94
80,85
80,38
77,50
78,00
78,50
79,00
79,50
80,00
80,50
81,00
139,00 294,50 450,00
Tail resistance [ohm]
Eff
icie
ncy
[%
]
Figure 4.4 - Variation of the efficiency in percentage according to tail resistance in ohms. It is considered a constant front resistance of 75Ω.
Mainly, front and tail time vary more according to front and tail resistors respectively.
Thus, figure 4.5 shows the wave “front time T1-front resistor Rf” for a constant value of tail
resistance of 450Ω, and figure 4.6 shows the wave “tail time T2-tail resistor Rt” for a constant
value of front resistance of 75Ω. It is seen that the higher front resistor, the higher front
time; and, the higher tail resistor, the higher tail time.
2,00
1,42
0,75
0,00
0,50
1,00
1,50
2,00
2,50
23,86 49,47 75,00
Front resistor [ohm]
Fro
nt
tim
e [u
s]
Figure 4.5 - Variation of the front time in microseconds according to front resistance in ohms. It is considered a constant tail resistance of 450Ω.

47
53,928
107,354
160,400
0,000
20,000
40,000
60,000
80,000
100,000
120,000
140,000
160,000
180,000
139,00 294,50 450,00
Tail resistor [ohm]
Tai
l tim
e [u
s]
Figure 4.6 - Variation of the tail time in microseconds according to tail resistance in ohms. It is considered a constant front resistance of 75Ω.
The impulse test system is designed to reach up to 500 kV, but the efficiency of the
system, around 82% according to simulation, decreases this value to about 409kV. In the real
test, front and tail time, peak voltage and efficiency can be measured from the test
waveform obtained by means of the measuring device, that is in the High Voltage Laboratory,
the oscilloscope Tektronix TDS 340 A.
4.1.3 -Impulse generator with stray capacitances: simulation parameters
The metallic sheet on the wall inside the Faraday cage (see figure 3.19) brings about the
idea that stray capacitances between the stages and the metallic sheet may affect the
normal behaviour of the system, and some of the problems that are shown in chapter 6 might
have their origin in this theory.
There are other stray capacitances that have influence on the normal behaviour of the
generator system, but only the ones between the stages of the generator stack and the
metallic sheet are simulated in this section. Thus, the stray capacitance is calculated by
means of equation 4.9 below:
0 r
AC
dε ε= ⋅ ⋅ (4.9)
Where, the total area A of the stack of capacitors and spheres is shown in table 4.6. This
value is divided by 5 because it is simulated with 5 stray capacitors, one per stage. The
distance d from the generator stack to the metallic sheet on the wall, the relative static
permittivity of the air between εr and the permittivity of free space ε0 are also shown in this
table. Values A and d are obtained by means of measuring of the parameters of the
equipment.
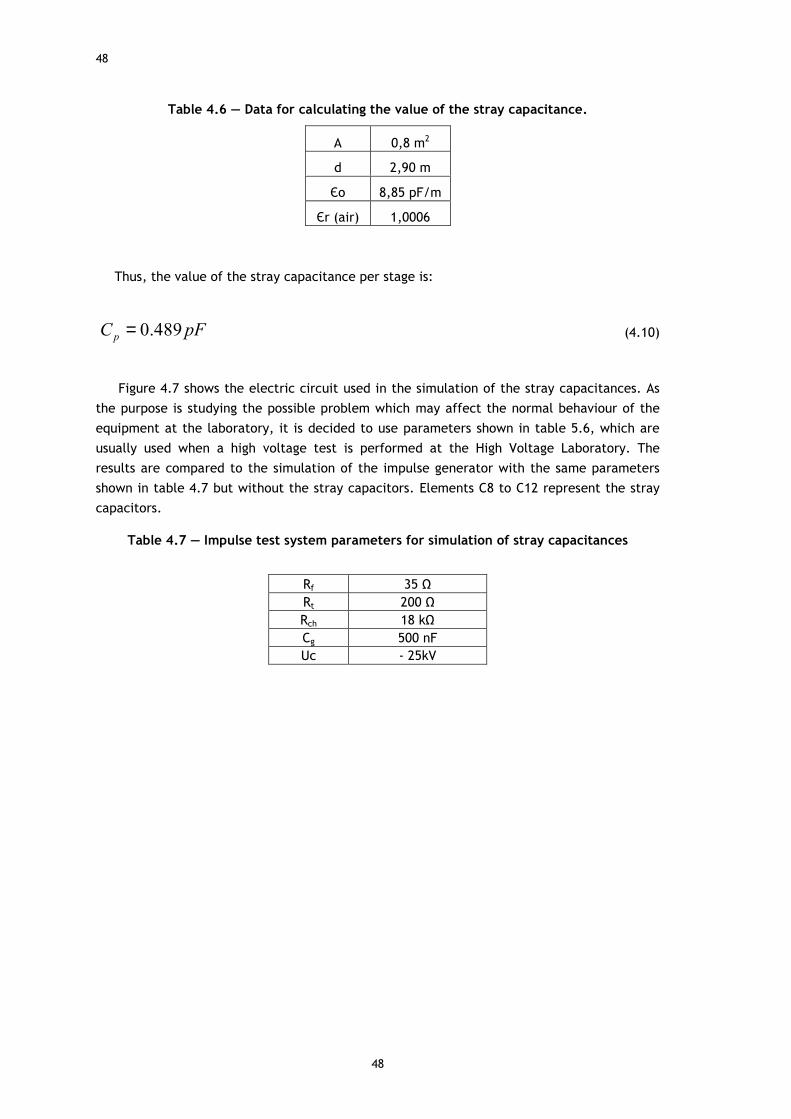
48
48
Table 4.6 — Data for calculating the value of the stray capacitance.
Thus, the value of the stray capacitance per stage is:
0.489pC pF= (4.10)
Figure 4.7 shows the electric circuit used in the simulation of the stray capacitances. As
the purpose is studying the possible problem which may affect the normal behaviour of the
equipment at the laboratory, it is decided to use parameters shown in table 5.6, which are
usually used when a high voltage test is performed at the High Voltage Laboratory. The
results are compared to the simulation of the impulse generator with the same parameters
shown in table 4.7 but without the stray capacitors. Elements C8 to C12 represent the stray
capacitors.
Table 4.7 — Impulse test system parameters for simulation of stray capacitances
A 0,8 m2
d 2,90 m
Єo 8,85 pF/m
Єr (air) 1,0006
Rf 35 Ω Rt 200 Ω Rch 18 kΩ Cg 500 nF Uc - 25kV

49
R1
75
C1
500nF
C2
500nF
C3
500nF
Rch3
18kohm
C9
0.489pF
R2
75.9
U5
TCLOSE = 0.1ms
1 2
R3
1G
Rt4
200ohm
C8
0.489pF
Rch418kohm
C7
371nF
C6
1491pF
Rch5
18kohm
Rs2
35ohm
Rs5
35ohm
Rs3
35ohm
C10
0.489pF
Rs4
35ohm
Rt3
200ohm
Rt2
200ohm
C12
0.489pF
C11
0.489pF
U4
TCLOSE = 0.1ms
1 2
Rch2
18kohm
U2
TCLOSE = 0.1ms
1 2
Uc-25kV
Rt5
200ohm
Rch1
18kohm
C4
500nF
Rt1
200ohm
C5
500nF
U1
TCLOSE = 0.1ms
1 2
V
Rs1
35ohm
U3
TCLOSE = 0.1ms
1 2
Figure 4.7 - Impulse generator circuit used in order to simulate the influence of stray capacitances with PSpice
The point V is where the maximum output voltage is measured. The lightning impulse
waveform obtained for this circuit with stray capacitances is shown in figure 4.8. The firing
instant of the sphere-gaps is a bit delayed until 0.1ms and the maximum step size used is 1 ns
in order to pay attention to what occur before the rising edge of the waveform. It is
explained in chapter 6 because it might be the reason of some “interferences” explained
there.

50
50
Figure 4.8 - Lightning impulse waveform obtained in the PSpice simulation with stray capacitances.
4.1.4 -Impulse generator with stray capacitances: obtained results
Obtained values in the simulation process with stray capacitances are shown in table 4.8
below. Results of the simulation with stray capacitances “2” are compared to the results of
the simulation without stray capacitances “1”.
Table 4.8 — Results of the simulation with stray capacitances [2] compared to the
simulation without stray capacitances [1].
Comparing results obtained, it is possible to say that the effect of stray capacitances
between the generator stack and the metallic sheet on the wall causes a decrease of the
peak voltage and, therefore, of the efficiency of the system as well. Thus, the simulation
does not show any problem caused by stray capacitances as was thought to be the cause of
the “interferences” before wave-front that are explained in chapter 6.
Test Rf [Ω] Rt [Ω] Umax_out [kV] Efficiency [%]
1 35 200 101,170 80,94
2 35 200 100,961 80,77

51
4.2 - Simulation using PSCAD
PSCAD is a computer simulator that permits to simulate more precisely the laboratory
equipment. Unlike PSpice, it is possible to simulate not only full lightning discharges, but also
chopped-tail and chopped-front impulses. A group of simple simulations are shown in this
section in order to support future studies performed in the High Voltage Laboratory.
For full lightning discharges, a five stages generator is simulated, but for chopped-tail and
chopped-front impulses, a simplified generator is used. It does not have any influence on the
results obtained.
The values of the impulse generator are shown in table 3.1, but in order to be more
precise, the real values were measured by means of a digital multimeter and are used in the
simulation. They are shown in table 4.9.
Table 4.9 — Real parameters of the impulse generator measured and used in the
simulation using PSCAD.
Stage Front resistor [ohm] Tail resistor [ohm] HV capacitor [nF] Charging resistor [kohm]
1 36.3 199.9 496 18
2 34.6 238 482 18
3 35.0 203 489 18
4 35.8 203 487 18
5 35.3 202 503 18
4.2.1 -Full Lightning Discharge
The electric circuit of the impulse generator for simulating full lightning discharge by
PSCAD is shown in figure 4.9 below.

52
52
R=
01
8.0
[ko
hm
]
0.496 [uF]
19
9.9
[oh
m]
36
.3 [o
hm
]
BRK
75
.0 [o
hm
]1
49
1.0
[pF
]3
71
.0 [n
F]
10
.0 [M
oh
m]75.9 [ohm]
0.482 [uF]
23
8.0
[oh
m]
34
.6 [o
hm
]
BRK
18
.0 [k
oh
m]
0.489 [uF]
20
3.0
[oh
m]
35
.0 [o
hm
]
BRK
18
.0 [k
oh
m]
0.487 [uF]
20
3.0
[oh
m]
35
.8 [o
hm
]
BRK
18
.0 [k
oh
m]
Vout
0.503 [uF]2
02
.0 [o
hm
]3
5.3
[oh
m]
BRK
18
.0 [k
oh
m]
Ea
Figure 4.9 - Impulse generator circuit used in simulation of full lightning discharge using PSCAD.
Two waveforms are obtained: the lightning impulse test waveform simulated by PSCAD is
shown in figure 4.10, and the charge waveform of one of the stages, in this case the fifth
stage, is shown in figure 4.11. The firing of the sphere-gaps is produced after 0.52 seconds
after starting the charge of the impulse generator.

53
Figure 4.10 - Full lightning waveform for the impulse generator circuit simulated using PSCAD.
The peak voltage is about 100.5kV. This value is similar to the other one obtained by
PSpice simulation and shown in table 4.8 above.
Figure 4.11 - Charge waveform for the fifth stage of the impulse generator simulated using PSCAD.
This waveform shows the typical charge of a capacitor, in this case, the capacitor of the
fifth stage of the impulse generator.

54
54
4.2.2 -Chopped-tail Impulse
The electric circuit of the impulse generator for simulating a chopped-tail impulse using
PSCAD is shown in figure 4.12 below. The parameters used in the simulation are shown in the
figure except the charging voltage, which is -100kV. It is used a load capacitance of 2pF that
simulates the behaviour of an electrical insulator.
R=0
18.
0 [k
ohm
]0.5 [uF]
20
0.0
[oh
m]
BRK75
.0 [o
hm
]1
49
1.0
[pF
]37
1.0
[nF
]
1.0
[Go
hm]
75.9 [ohm]
Vout
35
.0 [o
hm
]
Ea
2.0
[pF
] Fa
ult
Figure 4.12 - Impulse generator circuit used in simulation of chopped-tail impulse using PSCAD.
The firing of the sphere-gap occurs after 50 ms after starting the charge of the generator
and the time to chopping is of 3.5 µs after firing. The chopped-tail waveform obtained in the
simulation is shown in figure 4.13. It is necessary to emphasize that front and tail time
decrease for the configuration of this circuit; therefore, if it wants to be adjusted to the
international standard, values for front and tail resistors must be calculated as defined by
Hipotronics [11].

55
Figure 4.13 - Chopped-tail impulse waveform simulated using PSCAD.
4.2.3 -Chopped-front Impulse
The electric circuit and the parameters of the impulse generator for simulating a
chopped-front impulse using PSCAD is the same as shown in figure 4.12 above.
The firing of the sphere-gap occurs after 50 ms after starting the charge of the generator
and the time to chopping is of 0.1 µs after firing. The chopped-front waveform obtained in
the simulation is shown in figure 4.14.
Figure 4.14 - Chopped-front impulse waveform simulated using PSCAD.
56
56
This is a very fast waveform. It would be more clearly shown if front and tail resistors are
increased, because front and tail times would also increase.
4.3 - Conclusion
It is shown in this chapter how different computer simulators, such as PSpice and
PSCAD, may be used in order to study the equipment of the High Voltage Laboratory.
Computer simulators attempt to simulate an abstract model of the impulse test system
and help in adjustment of a part of the equipment when required.
For this reason, it is a very popular tool used not only for engineering purposes.

57
Chapter 5
Standard Techniques for High-Voltage Testing
Principles of High Voltage Testing are standardized in order to make possible reproduction
and comparison of the results obtained worldwide. Organizations like the International
Electrotechnical Commission (IEC) and the Institute of Electrical and Electronics Engineers
(IEEE) prepare these documents which, for the standard presented here, establish standard
methods of measurement of high voltage and basic testing techniques.
To perform laboratory testing, it is also necessary the information described by the
appropriate standard of the apparatus under test, which states its electrical and mechanical
characteristics, prescribe methods of testing and acceptance criteria. This Standard is, for
post insulators of organic material, the IEC 60660 [27].
In this chapter, a summary of the most important information depicted by the IEEE
Standard 4-1995 is shown in order to explain the main characteristics of the standard
lightning impulse waveform and test techniques used in the High Voltage Laboratory.
Whenever further information than presented here is required, the Standard IEEE
Std 4-1995 [26] must be consulted.
5.1 - Introduction
The IEEE Standard here presented, defines terms of general applicability; presents
general requirements regarding test equipment, objects, and procedures; and, describes
methods for evaluation of test results. It is applicable to several kinds of high voltage tests,
but this report has as subject only dielectric tests with impulse voltages, which are
performed at the High Voltage Laboratory.
Requirements in the arrangement of the test object and definitions of the different
discharges which can occur in high voltage test are shown below.

58
58
5.1.1 -Arrangement of the test object
The arrangement of the test object is absolutely important and should be specified by the
appropriate apparatus standard. The electrical discharge characteristics of the test object
may be affected by its general arrangement.
Its clearance from other energized or grounded structures, its height above ground level,
and the arrangement of the high-voltage lead, among others, may affect the flashover
voltage.
As recommended by the IEEE standard [26], a clearance to nearby structures equal to or
greater than 1.5 times the length of the shortest possible discharge path on the test object
usually makes proximity effects insignificant.
5.1.2 -Interpretation of discharges in high-voltage tests
This section gives the interpretation of electrical discharges in high-voltage test according
to defined by the appropriate international standards.
Three different interpretations may be done and are explained below:
• Disruptive discharges
• Nonsustained disruptive discharges
• Nondisruptive discharges
- Disruptive discharge:
A disruptive discharge is a discharge that completely bridges the insulation under test,
reducing the voltage between the electrodes practically to zero.
These disruptive discharges are subject to random variation and, usually, a number of
observations have to be made in order to obtain a statistically significant value of the
disruptive discharge voltage.
- Nonsustained disruptive discharge:
A nonsustained disruptive discharge is a discharge in which the test object is momentarily
bridged by a spark or arc. During these events, the voltage across the test object is
momentarily reduced to zero or to a very small value. Depending on the characteristics of the
test circuit and the test object, a recovery of dielectric strength may occur and may even
permit the test voltage to reach a higher value.
Such an event shall be interpreted as a disruptive discharge for post insulator tests as
most of apparatus.
- Nondisruptive discharge:
Nondisruptive discharges are those between intermediate electrodes or conductors. They
may also occur without reduction of the test voltage to zero but are not considered in post
insulators tests because it is not possible a discharge between other points than high voltage
and ground leads.
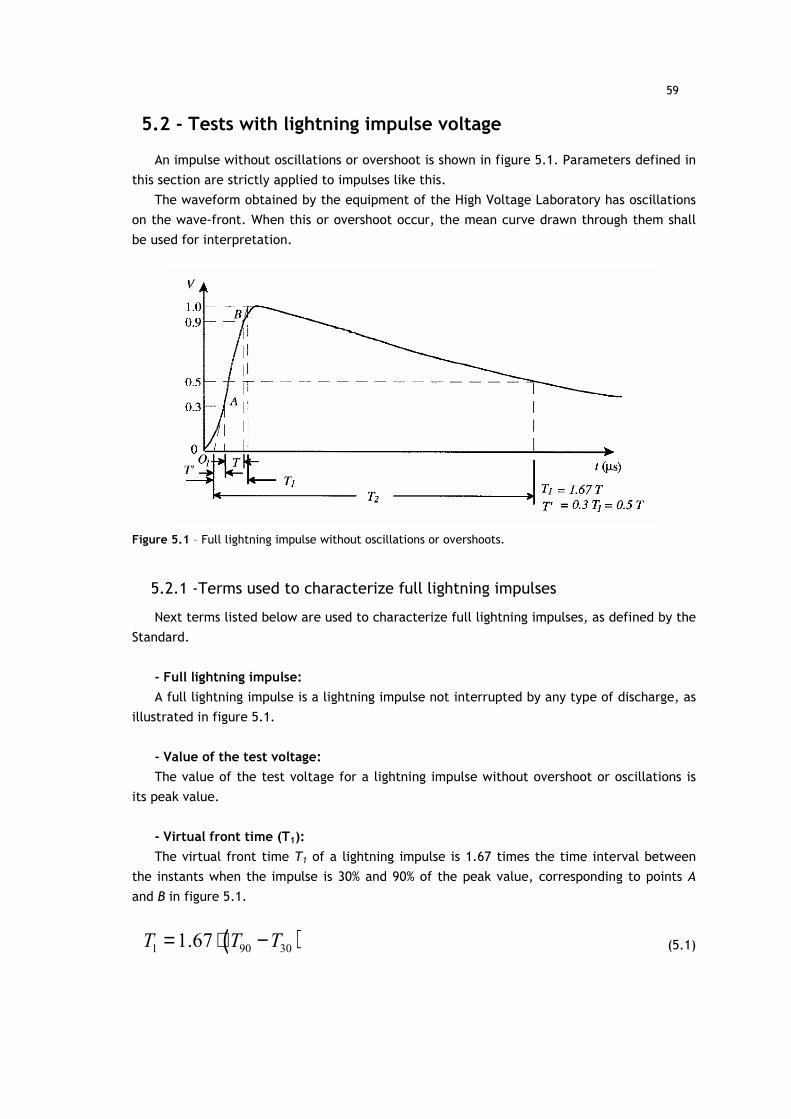
59
5.2 - Tests with lightning impulse voltage
An impulse without oscillations or overshoot is shown in figure 5.1. Parameters defined in
this section are strictly applied to impulses like this.
The waveform obtained by the equipment of the High Voltage Laboratory has oscillations
on the wave-front. When this or overshoot occur, the mean curve drawn through them shall
be used for interpretation.
Figure 5.1 – Full lightning impulse without oscillations or overshoots.
5.2.1 -Terms used to characterize full lightning impulses
Next terms listed below are used to characterize full lightning impulses, as defined by the
Standard.
- Full lightning impulse:
A full lightning impulse is a lightning impulse not interrupted by any type of discharge, as
illustrated in figure 5.1.
- Value of the test voltage:
The value of the test voltage for a lightning impulse without overshoot or oscillations is
its peak value.
- Virtual front time (T1):
The virtual front time T1 of a lightning impulse is 1.67 times the time interval between
the instants when the impulse is 30% and 90% of the peak value, corresponding to points A
and B in figure 5.1.
( )1 90 301.67T T T= ⋅ − (5.1)
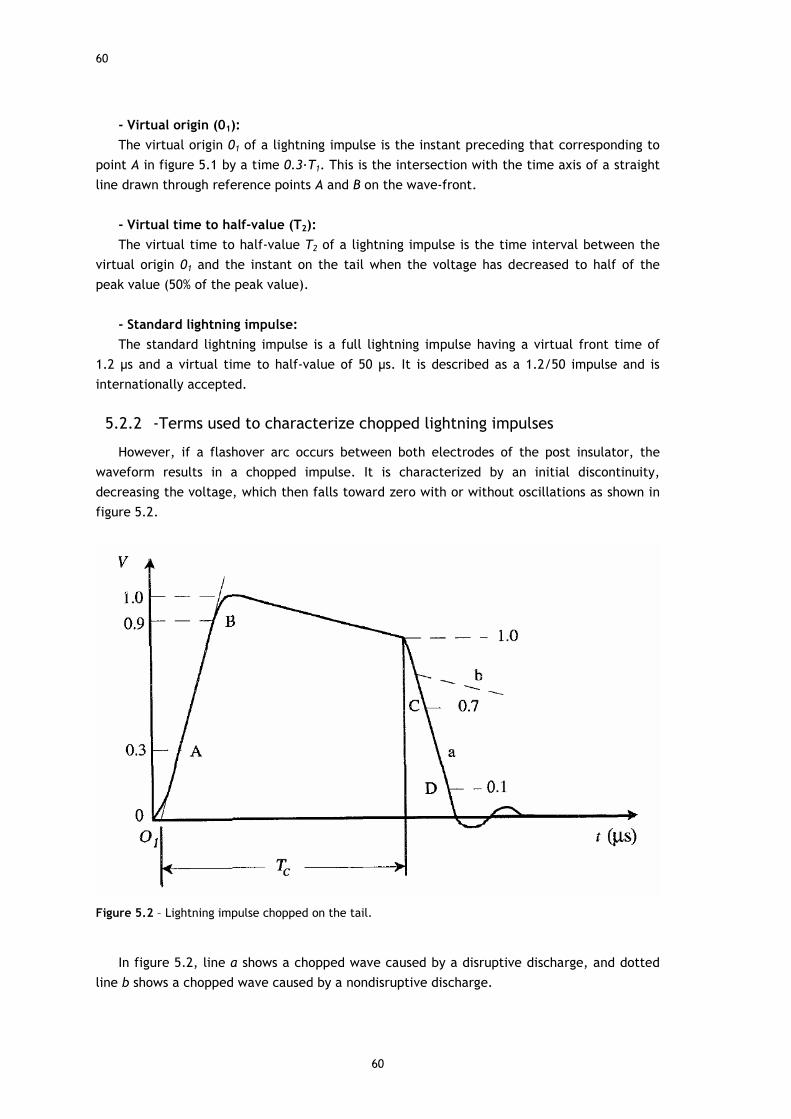
60
60
- Virtual origin (01):
The virtual origin 01 of a lightning impulse is the instant preceding that corresponding to
point A in figure 5.1 by a time 0.3T1. This is the intersection with the time axis of a straight
line drawn through reference points A and B on the wave-front.
- Virtual time to half-value (T2):
The virtual time to half-value T2 of a lightning impulse is the time interval between the
virtual origin 01 and the instant on the tail when the voltage has decreased to half of the
peak value (50% of the peak value).
- Standard lightning impulse:
The standard lightning impulse is a full lightning impulse having a virtual front time of
1.2 µs and a virtual time to half-value of 50 µs. It is described as a 1.2/50 impulse and is
internationally accepted.
5.2.2 -Terms used to characterize chopped lightning impulses
However, if a flashover arc occurs between both electrodes of the post insulator, the
waveform results in a chopped impulse. It is characterized by an initial discontinuity,
decreasing the voltage, which then falls toward zero with or without oscillations as shown in
figure 5.2.
Figure 5.2 – Lightning impulse chopped on the tail.
In figure 5.2, line a shows a chopped wave caused by a disruptive discharge, and dotted
line b shows a chopped wave caused by a nondisruptive discharge.

61
Next terms listed below characterize chopped lightning impulses.
- Chopped lightning impulse:
A chopped lightning impulse is a prospective full lightning impulse during which any type
of discharge causes a rapid collapse of the voltage. The collapse of the voltage can occur on
the front, at the peak, or on the tail (figure 5.2).
A chopped lightning impulse may occur because of a discharge in the internal or external
insulation of a test object.
- Instant of chopping (chop time) for tail-chopped impulses:
The intersection of the 10%-70% line on the chop and the tail of the wave is shown in
figure 5.2.
- Voltage at the instant of chopping:
The voltage at the instant of chopping is the voltage at chop time.
- Time to chopping (Tc):
The time to chopping Tc is the time interval between the virtual origin and the instant of
chopping.
- Characteristics related to the voltage collapse during chopping:
The characteristics of the voltage collapse during chopping are defined in terms of two
points, C and D, at 70% and 10% of the voltage at the instant of chopping, as shown in figure
5.2.
During chopped lightning impulse tests, the gap used for chopping shall be located as
close as possible to the terminals of the test object without disrupting its electric field
distribution. The impedance of the chopping circuit shall be minimized by the use of the
shortest possible leads to the chopping gap.
If the undershoot during chopping exceeds 50% of the voltage at the instant of chopping,
the distances can be increased but should not exceed a lead length greater than the height of
the test object.
- Standard chopped lightning impulse:
A standard chopped lightning impulse is a standard impulse that is chopped by an external
gap after a time between 2 and 5 µs.
- Linearly rising front-chopped impulse:
A voltage rising with approximately constant steepness, until it is chopped by a disruptive
discharge, is described as a linearly rising front-chopped impulse. To define such an impulse,
the best-fitting straight line is drawn through the part of the front of the impulse between
50% and 90% amplitudes (designated E and F respectively in 5.3). The impulse is considered to
be approximately linear if the front, from 50% up to the instant of chopping, is entirely
enclosed between two lines parallel to the line E-F, but displaced from it in time by 0.05Tr.
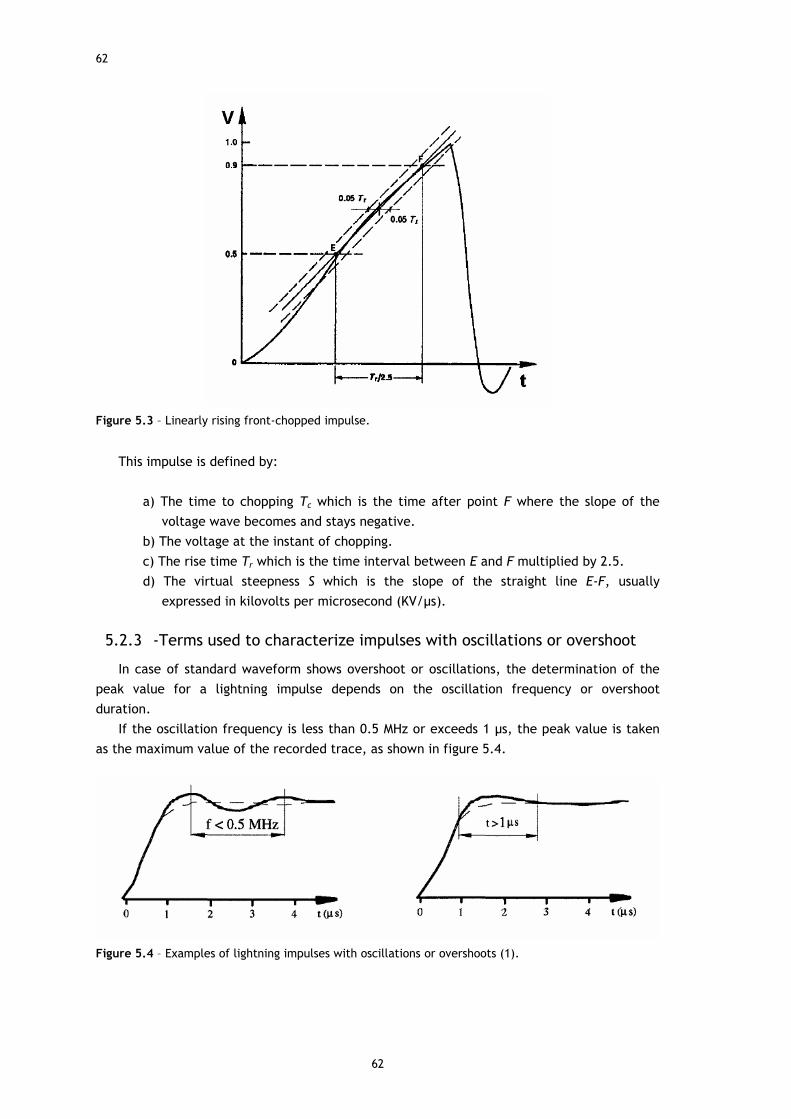
62
62
Figure 5.3 – Linearly rising front-chopped impulse.
This impulse is defined by:
a) The time to chopping Tc which is the time after point F where the slope of the
voltage wave becomes and stays negative.
b) The voltage at the instant of chopping.
c) The rise time Tr which is the time interval between E and F multiplied by 2.5.
d) The virtual steepness S which is the slope of the straight line E-F, usually
expressed in kilovolts per microsecond (KV/µs).
5.2.3 -Terms used to characterize impulses with oscillations or overshoot
In case of standard waveform shows overshoot or oscillations, the determination of the
peak value for a lightning impulse depends on the oscillation frequency or overshoot
duration.
If the oscillation frequency is less than 0.5 MHz or exceeds 1 µs, the peak value is taken
as the maximum value of the recorded trace, as shown in figure 5.4.
Figure 5.4 – Examples of lightning impulses with oscillations or overshoots (1).

63
If the oscillation frequency is greater than 0.5 MHz or less than 1 µs, the peak value is
determined from the maximum value of the mean curve, as shown in figure 5.5, or from the
exponential fitting of the front and tail portions.
Figure 5.5 – Examples of lightning impulses with oscillations or overshoots (2). Mean curves shown as dotted lines.
If oscillations are present on the front, points A and B should be taken on the mean curve
drawn through these oscillations. In the case of the waveform obtained at the High Voltage
Laboratory, there is a superimposed oscillation on the wave-front.
5.2.4 -Tolerances
The following differences are accepted between values for the standard impulse and
those actually recorded:
a) Peak value ±3%
b) Virtual front time ±30%
c) Virtual time to half-value ±20%
It is emphasized that the tolerances on the peak value, front time, and time to half-value
constitute the permitted differences between specific values and those actually recorded by
measurements. These differences should be distinguished from measuring errors, which are
the differences between values actually recorded and true values.
Overshoot or oscillations in the neighbourhood of the peak are tolerated, provided that
their single-peak amplitude is not larger than 5% of the peak value. Its measurements shall be
made by a system with specific properties, but this problem was not found at the Laboratory
and, therefore, not studied. In commonly used impulse generator circuits, oscillations on the
wave-front during which the voltage does not exceed 90% of the peak value have generally
insignificant influence on test results.

64
64

65
Chapter 6
Practical problems emerging in measurement
Engineering is the discipline of applying technical, scientific and mathematical knowledge
in real life. Sometimes, the results of this real part differ from the theoretical and practical
fundamentals studied at faculties of engineering because of the negative effect of certain
element. When it occurs, this is the signal that a problem occurs and a meticulous search
must begin. For the engineer, it is important to find where the problem is in order to
understand it, replace the damage component and recover the normal behaviour of the
system.
This chapter reports on the practical problems emerging in measurement of the lightning
impulse waveform of tests on insulators of organic material at the High Voltage Laboratory.
Such problems do not make possible to carry out lightning impulse tests on insulators of
organic material as it is described in the relevant international standards and the solution
must be founded. They are, therefore, cause of multiple discussions.
To perform the study of the emerging problems in the equipment already mentioned, it
was possible to count on experienced engineers who presented their ideas and enriched the
process: a retired engineer with large experience in High Voltage Laboratories, an engineer
specialized in calibration of this kind of equipment, and a group of professors of the Faculty
of Engineering who, in different moments, helped and contributed with their experience.
6.1 - Preliminary
When the work was planned at the beginning, the main purpose of the Master’s Thesis
was to study how lightning impulse tests are made complying with international standards,
but when the equipment started using, an unknown phenomenon appeared. In that moment,
the main objective of this work changed its direction and was focused on discovering the
origin of the problem and solving it, but, at the same time, without forgetting the first
objective of the master’s thesis.
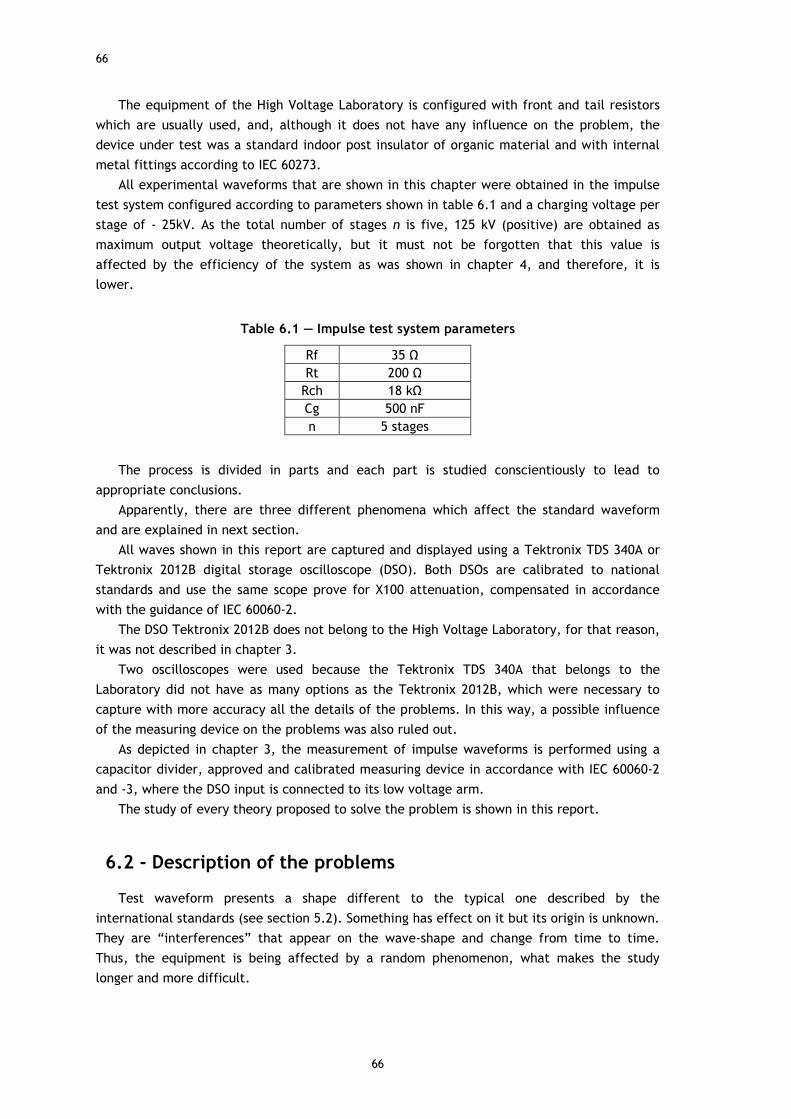
66
66
The equipment of the High Voltage Laboratory is configured with front and tail resistors
which are usually used, and, although it does not have any influence on the problem, the
device under test was a standard indoor post insulator of organic material and with internal
metal fittings according to IEC 60273.
All experimental waveforms that are shown in this chapter were obtained in the impulse
test system configured according to parameters shown in table 6.1 and a charging voltage per
stage of - 25kV. As the total number of stages n is five, 125 kV (positive) are obtained as
maximum output voltage theoretically, but it must not be forgotten that this value is
affected by the efficiency of the system as was shown in chapter 4, and therefore, it is
lower.
Table 6.1 — Impulse test system parameters
Rf 35 Ω Rt 200 Ω
Rch 18 kΩ Cg 500 nF n 5 stages
The process is divided in parts and each part is studied conscientiously to lead to
appropriate conclusions.
Apparently, there are three different phenomena which affect the standard waveform
and are explained in next section.
All waves shown in this report are captured and displayed using a Tektronix TDS 340A or
Tektronix 2012B digital storage oscilloscope (DSO). Both DSOs are calibrated to national
standards and use the same scope prove for X100 attenuation, compensated in accordance
with the guidance of IEC 60060-2.
The DSO Tektronix 2012B does not belong to the High Voltage Laboratory, for that reason,
it was not described in chapter 3.
Two oscilloscopes were used because the Tektronix TDS 340A that belongs to the
Laboratory did not have as many options as the Tektronix 2012B, which were necessary to
capture with more accuracy all the details of the problems. In this way, a possible influence
of the measuring device on the problems was also ruled out.
As depicted in chapter 3, the measurement of impulse waveforms is performed using a
capacitor divider, approved and calibrated measuring device in accordance with IEC 60060-2
and -3, where the DSO input is connected to its low voltage arm.
The study of every theory proposed to solve the problem is shown in this report.
6.2 - Description of the problems
Test waveform presents a shape different to the typical one described by the
international standards (see section 5.2). Something has effect on it but its origin is unknown.
They are “interferences” that appear on the wave-shape and change from time to time.
Thus, the equipment is being affected by a random phenomenon, what makes the study
longer and more difficult.
67
As said, it is a random problem, therefore, it does not appear in every voltage application
and its shape and amplitude vary between them. Thus, in figure 6.1, it is possible to see a
test waveform obtained in the Laboratory which is not affected by this unknown problem. Its
wave-shape is the typical of a standard waveform as depicted in chapter 5, but front and tail
times are not adjusted because it does not have any influence on the problem.
Figure 6.1 - Waveform for a standard lightning voltage impulse test. Volts and seconds per division rate selected: 200V/div, 50µs/div. 100X probe attenuation. It was captured using a Tektronix TDS 2012B digital storage oscilloscope.
But, usually, test waveforms are displayed with positive and negative voltage impulses on
it. Most of the times, voltage amplitudes are even higher than the peak voltage of the
standard wave-shape.
In figure 6.2 below, it is shown a test waveform as is normally displayed in the
oscilloscope. It is possible to see a very fast positive voltage impulse before wave-front and
two single negative voltage impulses after peak voltage of the standard wave-shape.

68
68
Figure 6.2 - Test wave with three “interferences”: a positive voltage impulse before wave-front and other two negative voltage impulses at wave-tail. Volts and seconds per division rate selected: 2V/div, 2.5µs/div. Captured using a Tektronix TDS 340A digital storage oscilloscope.
It is seen that the second negative voltage impulse is triangular shaped and falls as ramp
function and rises very fast, almost vertical, as step function.
When the wave-front is enlarged, as shown in figure 6.3, a new phenomenon became
relevant: a superimposed oscillation on the rising edge. The point (A) shows the origin of the
lightning impulse waveform.
Figure 6.3 – Test wave-front with a fast positive voltage impulse and superimposed oscillation on the
wave-front. Volts and seconds per division rate selected: 2V/div, 500ns/div. Captured using a Tektronix
TDS 340A digital storage oscilloscope.
And, finally, when the parameter seconds per division of the oscilloscope is increased,
the “interferences” on the wave-tail are shown as a run of negative voltage impulses (see
figure 6.4), triangular shaped as well, with a no-constant period. Its period increased with
time, and it goes from a few to tens of µs. This phenomenon is also random and usually starts
when wave-tail voltage value is under 40-30% of the peak value, but, in some voltage

69
applications, single negative voltage impulses with the same shape are captured out of the
series as shown in figure 6.2.
Figure 6.4 - Test waveforms that show the run of negative voltage impulses on the wave-tail. Volts and seconds per division rate selected are for all: 2V/div; 100, 250 and 500µs/div. Captured using a Tektronix TDS 340A digital storage oscilloscope.
Thus, as the origin of the “interferences” is not clearly known, it is decided to divide the
study in three parts for a better understanding:
• The oscillations on the wave-front;
• The run of negative voltage impulses on the wave-tail;
• The fast positive voltage impulse before the wave-front.
These three parts are explained below. The oscillations on the wave-front have an easy
explanation; therefore, this phenomenon is explained firstly and, then, the other two
phenomena are discussed separately.
6.2.1 -The oscillations on the wave-front
As shown in figure 6.3, the lightning impulse waveform generated by the equipment of
the High Voltage Laboratory has significant noise on the rising edge. This superimposed
oscillation is clarified by Kind and Feser [25]: the firing of the impulse generator causes the
shape of the voltage for lightning impulse voltages deviates considerably from the
theoretically calculated on the wave-front.

70
70
Figure 6.5 shows an example of the voltage waveform with superposed oscillations. The
noise on the rising edge may cause a wrong measurement of the value at which the signal is
at 30% of the peak voltage. The front-oscillations result from the rapid firing of the upper
stages of the multi-stage (5 stages) generator of the High Voltage Laboratory. A voltage is
suddenly coupled through longitudinal capacitance of the generator stages to the connecting
lead of the load capacitance, and it gets reflected at that end. This conclusion has not been
obtained when the simulation of stray capacitances between the generator stack and the
metallic sheet of the Faraday cage was made (see chapter 4).
Figure 6.5 – Front-oscillation of lightning impulse voltage. IEC 601083-2 test data generator impulse waveform: Case 11.
It is necessary to obviate the fast positive voltage impulse before the wave-front, so that
similarity between figures 6.3 and 6.5 can be accepted, what reveals that the theory of Kind
and Feser [25] is completely fulfilled. By means of a damping resistance between the impulse
generator and the load capacitance, that is the front resistance, this oscillation can be
appreciably reduced. But, it is a real limitation because the front (damping) resistance has to
have a specific value in order to damp the oscillations as well as to obtain a time to front
according to the standards (1.2 µs). More information this phenomenon can be found in the
reference [25] already mentioned.
6.2.2 -The run of negative voltage impulses on the wave-tail
At this point, the run of negative voltage impulses on the wave-tail is studied.
As shown in figure 6.2 above, the test waveform usually displays negative voltage
impulses after the peak. These impulses are triangular shaped, fall as ramp function and rise
very fast, almost vertical, as step function. Such phenomenon is also random and cases like
shown in figure 6.2 do not appear so usually. Even when in some voltages applications,
negative voltage impulses appear after the peak, it becomes evident when the wave-tail
voltage falls under 40-30% of the peak value. At this time, a run of negative voltage impulses
triangular shaped with a no-constant period, no-constant frequency, is shown on the
waveform captured by the DSO and, just in a few voltage applications, some negative voltage
impulses, triangular shaped too, are captured out of the series.
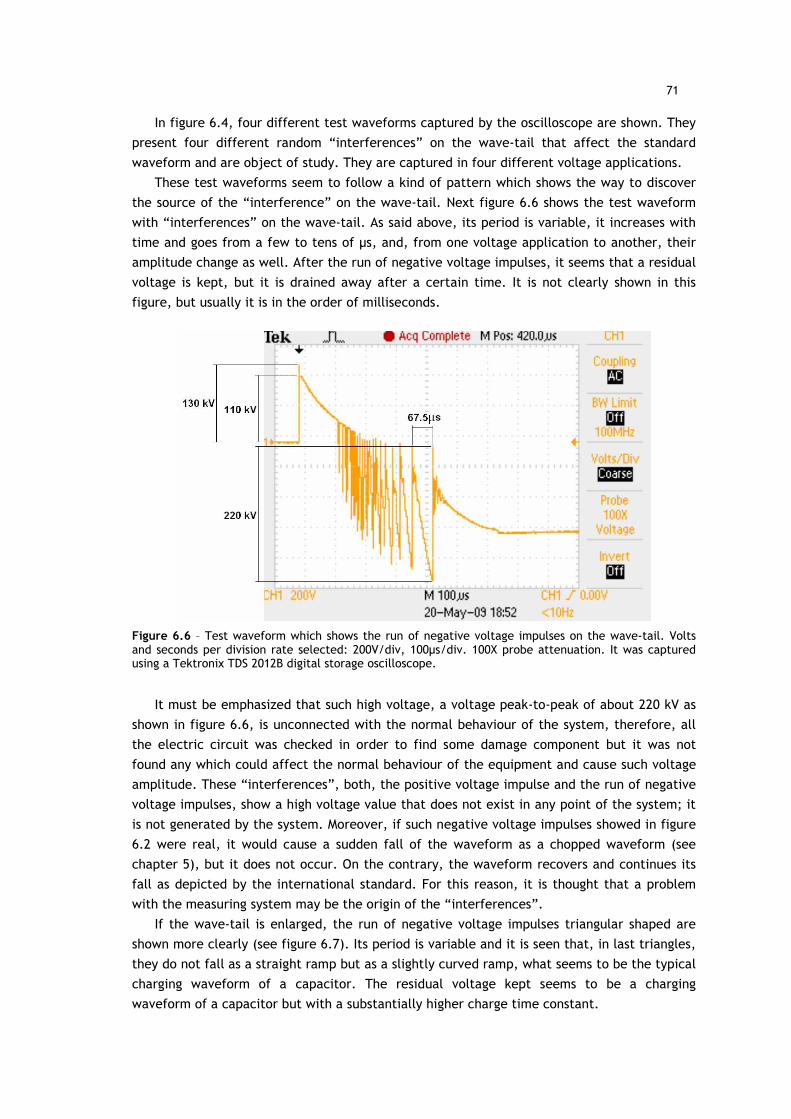
71
In figure 6.4, four different test waveforms captured by the oscilloscope are shown. They
present four different random “interferences” on the wave-tail that affect the standard
waveform and are object of study. They are captured in four different voltage applications.
These test waveforms seem to follow a kind of pattern which shows the way to discover
the source of the “interference” on the wave-tail. Next figure 6.6 shows the test waveform
with “interferences” on the wave-tail. As said above, its period is variable, it increases with
time and goes from a few to tens of µs, and, from one voltage application to another, their
amplitude change as well. After the run of negative voltage impulses, it seems that a residual
voltage is kept, but it is drained away after a certain time. It is not clearly shown in this
figure, but usually it is in the order of milliseconds.
Figure 6.6 – Test waveform which shows the run of negative voltage impulses on the wave-tail. Volts and seconds per division rate selected: 200V/div, 100µs/div. 100X probe attenuation. It was captured using a Tektronix TDS 2012B digital storage oscilloscope.
It must be emphasized that such high voltage, a voltage peak-to-peak of about 220 kV as
shown in figure 6.6, is unconnected with the normal behaviour of the system, therefore, all
the electric circuit was checked in order to find some damage component but it was not
found any which could affect the normal behaviour of the equipment and cause such voltage
amplitude. These “interferences”, both, the positive voltage impulse and the run of negative
voltage impulses, show a high voltage value that does not exist in any point of the system; it
is not generated by the system. Moreover, if such negative voltage impulses showed in figure
6.2 were real, it would cause a sudden fall of the waveform as a chopped waveform (see
chapter 5), but it does not occur. On the contrary, the waveform recovers and continues its
fall as depicted by the international standard. For this reason, it is thought that a problem
with the measuring system may be the origin of the “interferences”.
If the wave-tail is enlarged, the run of negative voltage impulses triangular shaped are
shown more clearly (see figure 6.7). Its period is variable and it is seen that, in last triangles,
they do not fall as a straight ramp but as a slightly curved ramp, what seems to be the typical
charging waveform of a capacitor. The residual voltage kept seems to be a charging
waveform of a capacitor but with a substantially higher charge time constant.
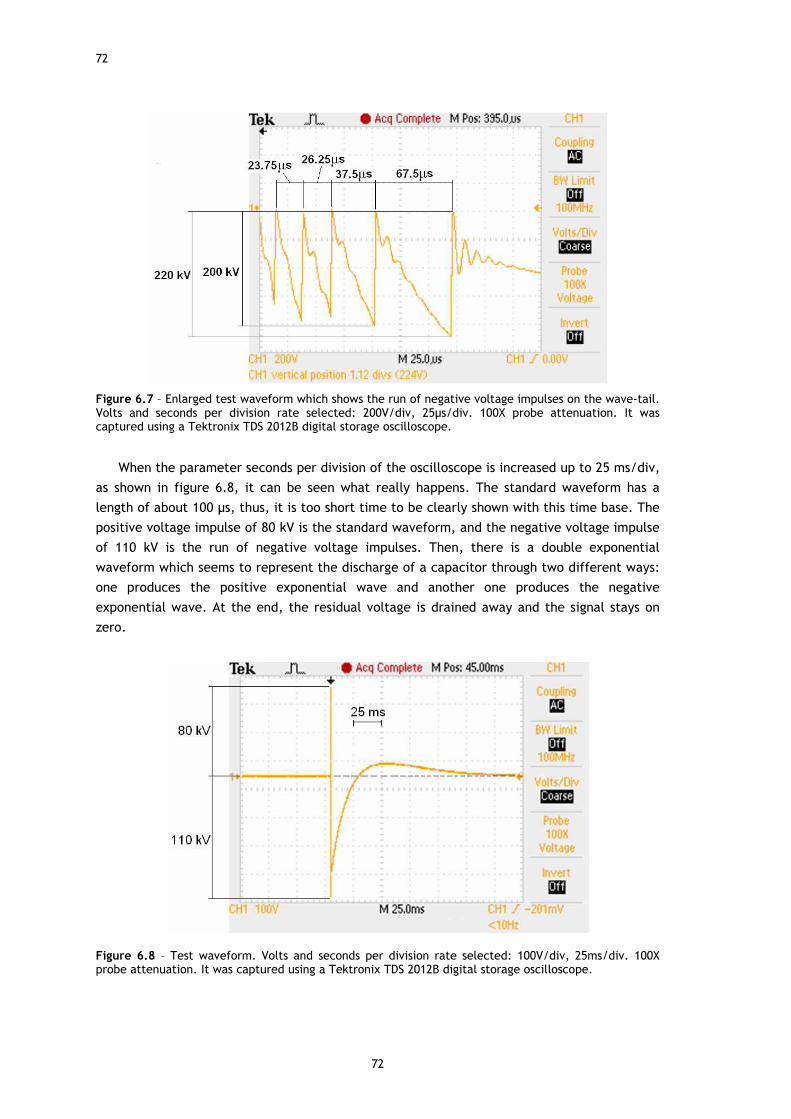
72
72
Figure 6.7 – Enlarged test waveform which shows the run of negative voltage impulses on the wave-tail. Volts and seconds per division rate selected: 200V/div, 25µs/div. 100X probe attenuation. It was captured using a Tektronix TDS 2012B digital storage oscilloscope.
When the parameter seconds per division of the oscilloscope is increased up to 25 ms/div,
as shown in figure 6.8, it can be seen what really happens. The standard waveform has a
length of about 100 µs, thus, it is too short time to be clearly shown with this time base. The
positive voltage impulse of 80 kV is the standard waveform, and the negative voltage impulse
of 110 kV is the run of negative voltage impulses. Then, there is a double exponential
waveform which seems to represent the discharge of a capacitor through two different ways:
one produces the positive exponential wave and another one produces the negative
exponential wave. At the end, the residual voltage is drained away and the signal stays on
zero.
Figure 6.8 – Test waveform. Volts and seconds per division rate selected: 100V/div, 25ms/div. 100X probe attenuation. It was captured using a Tektronix TDS 2012B digital storage oscilloscope.
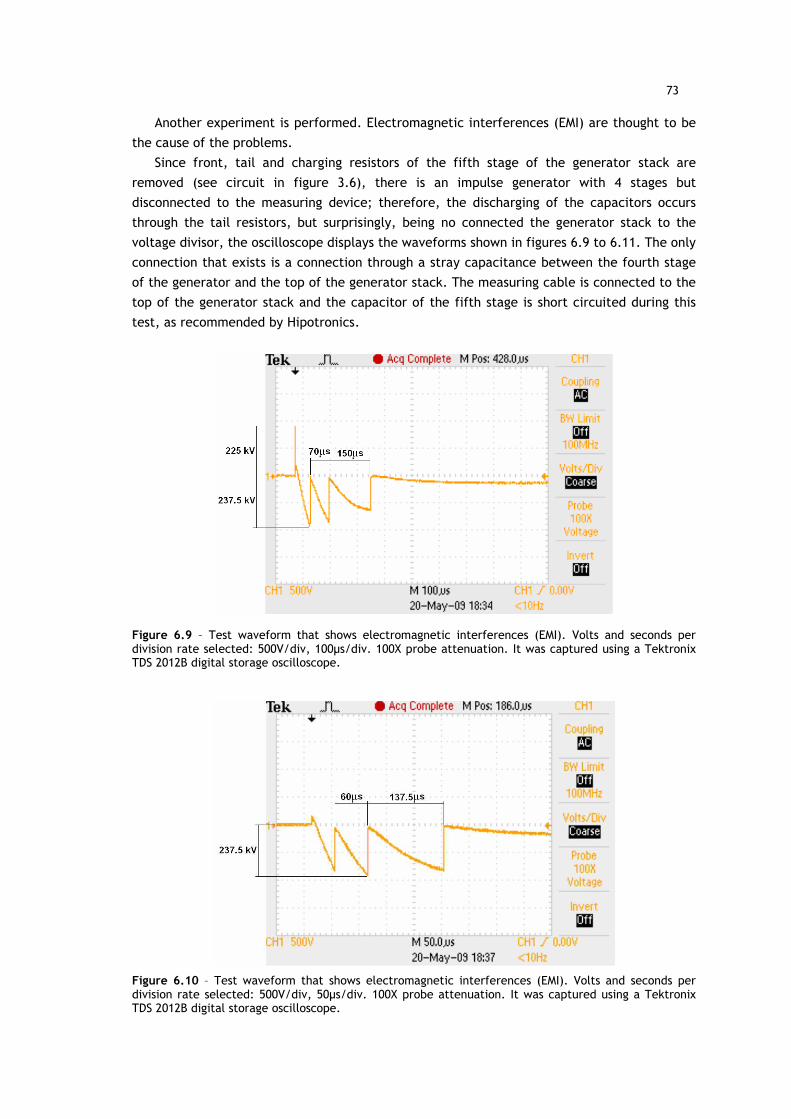
73
Another experiment is performed. Electromagnetic interferences (EMI) are thought to be
the cause of the problems.
Since front, tail and charging resistors of the fifth stage of the generator stack are
removed (see circuit in figure 3.6), there is an impulse generator with 4 stages but
disconnected to the measuring device; therefore, the discharging of the capacitors occurs
through the tail resistors, but surprisingly, being no connected the generator stack to the
voltage divisor, the oscilloscope displays the waveforms shown in figures 6.9 to 6.11. The only
connection that exists is a connection through a stray capacitance between the fourth stage
of the generator and the top of the generator stack. The measuring cable is connected to the
top of the generator stack and the capacitor of the fifth stage is short circuited during this
test, as recommended by Hipotronics.
Figure 6.9 – Test waveform that shows electromagnetic interferences (EMI). Volts and seconds per division rate selected: 500V/div, 100µs/div. 100X probe attenuation. It was captured using a Tektronix TDS 2012B digital storage oscilloscope.
Figure 6.10 – Test waveform that shows electromagnetic interferences (EMI). Volts and seconds per division rate selected: 500V/div, 50µs/div. 100X probe attenuation. It was captured using a Tektronix TDS 2012B digital storage oscilloscope.

74
74
Figure 6.11 – Test waveform that shows electromagnetic interferences (EMI). Volts and seconds per division rate selected: 200V/div, 100µs/div. 100X probe attenuation. It was captured using a Tektronix TDS 2012B digital storage oscilloscope.
The equipment cannot generate higher voltages than 125 kV, and the stack of capacitors
is absolutely discharged after 200 µs; therefore, these “interferences” are just justified by a
problem in the measuring device.
The solution of the problem is explained in section 6.4. Before, the fast positive voltage
impulse before the wave-front is presented, because both problems may be related.
6.2.3 -The fast positive voltage impulse before the wave-front
The fast high-amplitude positive voltage impulse before the wave-front is a random
impulse, that is, its amplitude varies between voltage applications from a few to hundreds of
kilovolts (kV), and, it is even not captured in some few voltage applications.
As written before, the maximum voltage reached in the equipment is 125 kV when the
voltage at the sphere-gaps reaches the disruptive voltage value, a flashover arc occurs and all
the stages become connected in series. Due to this reason, it is not possible that the wave,
captured using an oscilloscope, is up to 295 kV at any moment (see figure 6.3) and the right
explanation to this “interference” must be discovered.
An impulse waveform generated experimentally in order to analyze a zero-phase filter
design for a revision of IEC 60060-1 and -2 (High Voltage Test Techniques) shows the way to
find out the reason for this fast positive voltage impulse before the wave-front.
The description made by Lewin, Tran, Swaffield and Hällström [28] in the revision
mentioned above, presents an unprocessed waveform which was generated from a two-stage
Marx generator with no load in circuit. This waveform displays noise near the origin and may
lead to an incorrect estimation of the true origin (see figure 6.12).

75
Figure 6.12 – Experimentally generated impulse voltage with noise near the start of the impulse signal [28].
The noise is due to electromagnetic coupling from the test generator to the digital
storage oscilloscope (DSO) input and was deliberately permitted in order to experimentally
evaluate the proposed techniques under study. These oscillations greater than the
background noise due, for example, to the firing of spark gaps [29] are permissible as
specified by IEC 60060-1, because it does not occur on the part of the waveform in excess of
90% of the peak voltage, but at the High Voltage Laboratory the problem is worse. In figure
6.12, this signal noise is only up to a 35% of the peak value, but at the High Voltage
Laboratory, it can be up to hundreds of kilovolts (kV), values even two times higher than the
peak value of the impulse voltage waveform.
Thus, this idea is taken into account and the possible electromagnetic coupling from the
firing of the test generator to the DSO input is studied.
The cable which joins the top of the stack of capacitors of the impulse generator to the
capacitive mixed divider is removed; this test permits to study the signal which is captured
by the oscilloscope when the firing of spark gaps occurs and is just transmitted by the air, by
means of stray capacitances, between components. It shows that an electromagnetic
coupling occurs between them, and introduces disturbances to the lightning impulse voltage
wave-shape. An exchange of electromagnetic energy in the form of radiated and absorbed
power exists between them.
It is thought that electromagnetic coupling between circuits affects directly the LV arm of
the capacitive mixed divider, that is the DSO input, because the electromagnetic noise should
not affect the signal inside the measuring coaxial cable RG11/U; it is a shielded cable
surrounded by a conductive layer earth connected, which provides protection of the signal
from external electromagnetic interferences.
Electromagnetic interferences could affect the LV arm of the voltage divider because a
bad contact in this element was found, but it is not possible to explain as far as shown in next
section 6.4. The signal noise due to electromagnetic coupling, deliberately permitted by
means of taking off the cable from the top of the stack of capacitors to the HV arm of the
capacitive mixed divider, is captured by the oscilloscope (DSO) and is shown in figure 6.13.

76
76
Figure 6.13 – The signal noise due to electromagnetic coupling from the stack of capacitors to the LV arm of capacitive mixed divider. Volts and seconds per division rate selected in both: 200V/div, 1µs/div, 100X probe attenuation. It was captured using a Tektronix TDS 2012B digital storage oscilloscope.
The captured signal is a damped oscillatory wave. The impulse test system was configured
to give rise to 125 kV as maximum output voltage, and the signal noise reaches 190 kV peak-
to-peak. This value agrees with the measurement of the fast positive impulse made in figure
6.2 (195 kV), but, as written before, the amplitude of this interference varies between
voltage applications, but not its period and duration. In any case, if the electromagnetic
interference affects directly the LV arm, the divider ratio is not applicable, therefore, these
voltages would really be lower amplitude ones. Figure 6.14 shows the magnified signal noise
from figure 6.13.
Figure 6.14 – The signal noise due to electromagnetic coupling from the stack of capacitors to the LV arm of capacitive mixed divider. Volts and seconds per division rate selected in both: 200V/div, 250ns/div, 100X probe attenuation. It was captured using a Tektronix TDS 2012B digital storage oscilloscope.

77
In figure 6.14, the waveform presents second order harmonics into it during the first
250 ns after the origin (A). The period of the signal noise is 175 ns, and it is equal to the
period of the superimposed oscillation on the front edge as seen in figure 6.3. Its duration is
1.5 µs, and it is also approximately equal to the duration of the front edge of this wave
shown in figure 6.3, which is 1.375 µs. It is necessary to remark on the fact that this
waveform is affected by a negative voltage impulse which does not permit to make a right
measurement; consequently, it is possible to state that both periods are equal.
To remind what is seen in chapter 5 of this report, a full lightning impulse wave-shape is
specified in the international standards as having a front time T1 of 1.2µs ± 30%, which gives
the next validity interval:
0.84µs ≤ T1 ≤ 1.56µs
Finally, it is possible to write as a conclusion that the fast positive voltage impulse before
the wave-front is due to an electromagnetic coupling on the low voltage arm of the voltage
divisor, but the positive impulse appears because of a problem in the measuring device that
is explained in section 6.4.
6.3 - Other things which were thought as cause of the
problems. Previous steps
During the search process, several engineers gave their advices and some changes were
made at the High Voltage Laboratory, but they did not succeed. They are listed in this section
in order to present the information of the whole process and all the steps that were made.
• Shielding of the cables between the control console and the Faraday cage by
means of a metal gutter connected to earth.
• Substitution of front and tail resistors in order to make sure that the problem was
not caused by a deterioration of these elements or possible inductive
components.
• Adjustment of the sphere-gap spacings: it was thought that it might affect the
firing and cause the “interferences” on the wave-front.
• Verification of the trigger system: it was thought that the deterioration in this
system might cause the positive voltage impulse before the wave-front. The
electrical circuit was checked and the maximum output signal of the trigger
system is 15kV.
• The choice of earthing system has implications for the safety and electromagnetic
compatibility of the power supply; therefore, it was studied together with
checking the conduction of all earth connections. New earth connections were
made.
• It was thought that the positive voltage impulse before the wave-front was
caused by the effect of stray capacitances because of the shape of this impulse
which is shown in figure 6.15 below.

78
78
Figure 6.15 – Enlargement of the positive voltage impulse before the wave-front. Volts and seconds per division rate selected are for all: 5V/div, 10ns/div. Captured using a Tektronix TDS 340A digital storage oscilloscope.
• The equipment layout was changed to minimize the influence of the LC circuit
made of stray inductances and stray capacitances of the system. But these stray
capacitances have not influence on this problem, as was shown in chapter 4.
• The compensation of the probe of the oscilloscope was checked.
• All the electric circuit of the impulse generator was checked looking for any
deterioration that might amplify any signal.
• Due to a potential difference between two parts of the generator structure, there
was a flashover arc that caused electromagnetic interferences on the measuring
equipment. This part of the equipment and the new provisional connection to
earth made in order to avoid this flashover arc on the metallic structure are
shown in figure 6.16.
Figure 6.16 – Part of the equipment where there was a potential difference with provisional earth connection.
In short, many different tests and changes were performed in order to understand the
equipment behaviour and check the validity of all the recommendations.

79
6.4 - Solution to the problem
Tests and studies show that the origin of the problem is in the measuring device. A
puncture in any capacitor of the high or low voltage arm of the capacitive voltage divider
shown in figure 3.14 may be the cause of distortion of the standard waveform. As it is a
random phenomenon, this loss of dielectric strength of the capacitor is not permanent, but it
got worse during the period of work at the High Voltage Laboratory.
The capacitive divider is made up of stacks of individual capacitors housed in oil filled
cylinders of insulating material. This puncture permits a disruptive discharge passing the
dielectric of the capacitor. Therefore, the divider ratio change and these high amplitude
impulses occur, but they are never higher than the maximum output voltage of the
generator.
A possible bad contact in the low voltage arm of the capacitive voltage divider was also
found. In normal conditions, the capacitance of this element is 371 nF, but it was measured
by means of a digital multimeter and a variable capacitance about 2 nF was discovered. It is
clearly shown that the problem is caused by a deterioration of components, because after
trying to repair the low voltage arm, it worked for a few time, but after some voltage
applications, the “interferences” appeared again.
This bad contact in the LV arm mentioned also causes that electromagnetic interferences
affect the DSO input and the fast positive voltage impulse before the wave-front occurs.
In short, it is a random phenomenon, thus, it is not possible to demonstrate it using
simulation because there are two causes:
• A puncture in a capacitor that changes the divider ratio.
• A bad contact in the low voltage arm that causes the wave-tail falling as a slightly
curved ramp and recovering quickly to the standard wave-shape.
This bad contact is probably made through a stray capacitance, because it seems to be
the typical waveform of the charge of a capacitor with a sudden return to the standard wave-
shape caused, probably, by a disruptive discharge passing the dielectric of this stray
capacitor. This effect “charge of stray capacitor-disruptive discharge” is repeated up to all
the energy has been drained away.
The model used to explain the problem is shown in figure 6.17.

80
80
Figure 6.17 – Representation of the voltage divider
Thus, figure 6.18 shows both causes of “interferences”: the puncture in a capacitor and
the bad contact in the low voltage arm.
Figure 6.18 – Representation of the voltage divider with the explanation to the problems.
The puncture is shown with the number (3) in the high-voltage arm of the voltage divider.
It causes that the divider ratio changes and, thus, the high amplitude of the “interferences”
occurs.
The bad contact in the low voltage arm through a stray capacitance is shown with the
number (1). It causes the slightly curved ramp of the negative voltage impulse on the wave-
tail as the waveform of the charge of a capacitor. The number (2) shows the disruptive
discharge passing the dielectric of this stray capacitor, what causes the sudden return front

81
point (a) to (b) on the lightning impulse wave-shape. This shape changes because it is a
random phenomenon and cannot be demonstrated clearly, but this theory explains all the
problems that affect the standard waveform and a correct display of the test waveform.
To prove that the problem is in the capacitive voltage divider, a probe is used. This is an
electrical device for making contact with a circuit test point for test purposes and it permits
to measure voltages up to 40 kV.
Thus, the experiment is carried out using only the first stage of the impulse generator in
order not to exceed the voltage limit of the probe. The first stage is charged up to 25 kV and
no trigger is used to avoid this extra 15kV of the trigger system. Therefore, the firing is made
by reducing the sphere-gap spacing to permit the disruptive discharge.
The probe is a Tektronix P6015A with an attenuation of 1000X and is shown in figure 6.19.
Figure 6.19 – Probe: Tektronix P6015A
Firstly, it is checked the voltage measurement made by the probe. The probe is used
instead of the voltage divider and the result is shown in figure 6.20.
Figure 6.20 – Measurement of the test waveform made by the probe.
The figure shows the typical lightning impulse waveform. It is not shown any
“interference”, what confirms the theory explained above.

82
82
Figure 6.21 shows two waveforms: the waveform number 1 is obtained by the probe, and
the number 2 is obtained by the capacitive voltage divider, which is damaged as is shown.
Figure 6.21 – Measurement of the test waveform made by the probe (1) and the capacitive divider (2).
This experiment demonstrates that the problem is in the capacitive voltage divider and
this part of the High Voltage Laboratory equipment must be replaced. The waveform number
1 does not show any problem, but the waveform number 2 has this problem mentioned
before.
6.5 - Conclusions
The problem does not affect the test, because the problem is only in the measurement
device; therefore, the device under test does not have to support higher voltage values.
As the parameters of the test waveform, such front time, tail time and peak voltage, can
still be read, the equipment may be used for testing purposes, but the capacitive voltage
divider must be replaced if a measurement without “interferences” is required.
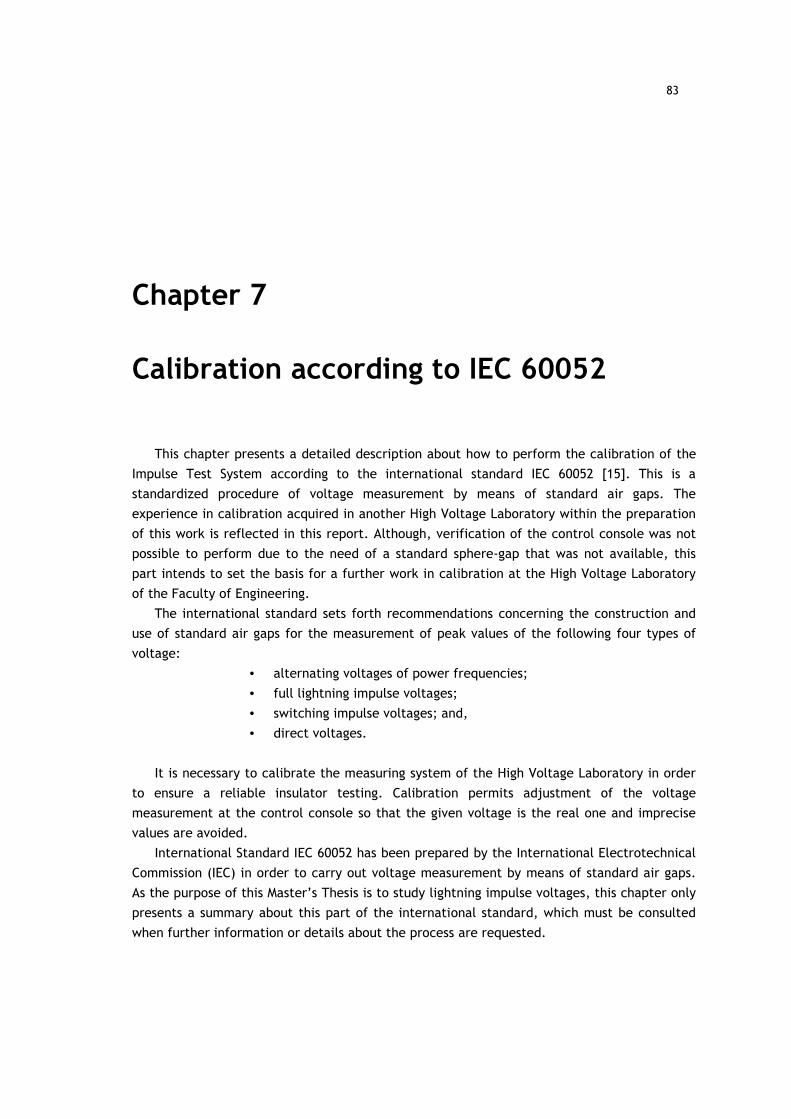
83
Chapter 7
Calibration according to IEC 60052
This chapter presents a detailed description about how to perform the calibration of the
Impulse Test System according to the international standard IEC 60052 [15]. This is a
standardized procedure of voltage measurement by means of standard air gaps. The
experience in calibration acquired in another High Voltage Laboratory within the preparation
of this work is reflected in this report. Although, verification of the control console was not
possible to perform due to the need of a standard sphere-gap that was not available, this
part intends to set the basis for a further work in calibration at the High Voltage Laboratory
of the Faculty of Engineering.
The international standard sets forth recommendations concerning the construction and
use of standard air gaps for the measurement of peak values of the following four types of
voltage:
• alternating voltages of power frequencies;
• full lightning impulse voltages;
• switching impulse voltages; and,
• direct voltages.
It is necessary to calibrate the measuring system of the High Voltage Laboratory in order
to ensure a reliable insulator testing. Calibration permits adjustment of the voltage
measurement at the control console so that the given voltage is the real one and imprecise
values are avoided.
International Standard IEC 60052 has been prepared by the International Electrotechnical
Commission (IEC) in order to carry out voltage measurement by means of standard air gaps.
As the purpose of this Master’s Thesis is to study lightning impulse voltages, this chapter only
presents a summary about this part of the international standard, which must be consulted
when further information or details about the process are requested.

84
84
7.1 - Overview
Calibration is the act of correlating the readings of an instrument with those of a standard
in order to check the instrument's accuracy, which allows comparison with other
experimental data. The most widely known instrument for measuring high voltage is the
sphere-gap, although its way of functioning makes it more a calibrating device than a
measuring instrument.
Measuring high voltage with the aid of a sphere-gap is based on the fact that air of know
pressure and temperature always breaks down at the same field strength: for example, air of
1 atmosphere and 20 ºC needs about 3 kV/mm to break down, as defined by Kreuger [4].
This element is used for calibration processes by determining the gap distance where
breakdown takes place. A high voltage circuit and its voltage divider can be calibrated with
the aid of the international IEC 60052 tables, and an inspector can check a test circuit in any
laboratory anywhere in the world. The method is not very accurate, about 3 %, but it is easy
and reliable.
The sphere-gap is the simplest configuration where a uniform and predictable field occurs
between electrodes and has been used as a simple and reliable method for measurement of
peak voltage in many industrial test facilities for more than 75 years. Moreover, the
mentioned standard provides values for laboratory testing which have been accepted as an
International Consensus Standard of Measurements.
7.2 - Standard sphere-gap
The standard sphere-gap is a peak voltage measuring device, constructed and arranged in
accordance with the standard IEC 60052. It consists of two metal spheres of the same
diameter with their shanks, operating gear, insulating supports, supporting frame and leads
for connection to the point at which the voltage is to be measured. The standard specifies
reference values and tolerances for specific requirements on sphere shape and surface
conditions. The spheres shall be carefully made so that their surfaces are smooth and their
curvature is as uniform as possible, and the diameter of each sphere shall not differ by more
than 2% from the nominal value.
As shown in figure 7.1, the spheres can be arranged in two different ways: one of which is
typical of sphere-gaps with vertical axis and the other of sphere-gaps with horizontal axis.
Both of them show the high voltage conductor with series resistor connected to the high
voltage sphere and the other sphere is connected to ground.

85
Figure 7.1 - Vertical sphere-gap (left side) and horizontal sphere-gap (right side) [15].
The points on the two spheres that are closer to each other are called the sparking
points. In figure 7.1, D is the diameter of the spheres, S is the spacing between them, A is
the height of the sparking point, and B is the distance from the sparking point of the high-
voltage sphere to any extraneous objects.
In order to reduce the influence of the shank of the high voltage sphere on the disruptive
discharge voltage when the spheres are arranged vertically, it shall be free from sharp edges
or corners and the standard sets its dimensions. It also specifies the dimensions of a stress
distributor (corona shield) if it is necessary to be used at the end of the shank.
The earthed shank and the operating gear have a smaller effect and their dimensions are
therefore less important.
As shown in figure 7.1, some clearance limits around the spheres are defined by this
standard. Thus, the distance from the sparking point of the high-voltage sphere to any
extraneous objects (such as ceiling, walls, and any energized or earthed equipment), and also
to the supporting frame work for the spheres, if this is made of conducting material, shall not
be less than a distance B.
The value of this distance B depends on the sphere diameter D and the spacing between
spheres S. A spacing of 10 cm has been considered in figure 7.2 in order to represent how the
minimum value of distance B changes according to their values. It is possible to see that the
smaller the sphere diameter D, the bigger the minimum limit distance B. These values were
taken from table 1 of the Standard IEC 60052.

86
86
Figure 7.2 - Clearance limit: minimum value of distance B depending on sphere diameter D, both in cm, for a spacing between spheres of S = 10 cm.
Supporting frameworks for the spheres made of insulating material are exempted from
this requirement, provided that they are clean and dry and that the spheres are used for the
measurement of alternating or impulse voltages only.
Other clearance limit showed in figure 7.1 and defined by the standard is the height A of
the sparking point of the high-voltage sphere above the earth plane of the laboratory floor. It
only depends on the sphere diameter D and shall be within the limits shown in figure 7.3. It is
seen that the bigger the sphere diameter D, the bigger the minimum and maximum limit
distances A. These values are taken from table 1 of the Standard IEC 60052.
Figure 7.3 - Clearance limit: minimum and maximum values of height A depending on sphere diameter D, both in cm.

87
The peak values of disruptive discharge voltages shown in the IEC 60052 (tables 2 and 3 of
the Standard) are only valid for clearances around the spheres within the limits given in
figures 7.2 and 7.3.
It is important that the circuit is arranged so that at the test voltage there is:
• no disruptive discharge to other objects;
• no visible leader discharge from the high-voltage lead or shank within
the space defined by B;
• no visible discharge from other earthed objects extending into the
space defined by B.
7.3 - Connections
The sphere-gap shall be connected in accordance with the next specified requirements,
which have been standardized by the international standard IEC 60060-2.
7.3.1 -Earthing
Normally, one sphere shall be connected directly to earth.
7.3.2 -High voltage conductor
The high-voltage conductor, including any series resistor not in the shank itself, shall be
connected to a point on the shank away from the sparking point of the high-voltage sphere.
This distance must be at least two times the diameter of the spheres (2D).
Within the region where the distance to the sparking point of the high-voltage sphere is
less than B, the high-voltage conductor (including the series resistor, if any) must not pass
through the plane normal to the axis of the sphere-gap. This plane is situated at the
connection point on the shank and shown in figure 7.1.
7.3.3 -Protective resistor for measurement of impulse voltages
As depicted by the international standard [15], series resistance is needed with large
diameter spheres to eliminate oscillations in the sphere-gap circuit which may cause a higher
voltage to occur between the spheres and, if connected, across the test object. A series
resistance may also be needed in order to reduce the steepness of the voltage collapse which
might introduce undesirable stresses in the test object.
The resistor shall have a non-inductive construction (not more than 30 µH) and its
resistance should not exceed 500 Ω, as specified by the standard. In the circuit, the resistor is
positioned at the high voltage conductor and shown in figure 7.1.
7.4 - Use of the sphere-gap
A sphere-gap is an IEC standard measuring device when the conventional deviation z (see
note below) at the time of use is, for lightning impulse voltages, less than 1%.
88
88
The conventional deviation z is affected by the condition of the sphere surfaces, the
availability of free electrons (sufficient irradiation), the dust contained in the air and the
measurement procedures. This requirement for the conventional deviation z ensures that the
requirements for the surface conditions have been met.
Note: (4.4 of the Standard IEC 60060-1)
Disruptive discharge voltages are subject to random variations and, usually, a number of
observations must be made in order to obtain a statistically significant value of the voltage.
The test procedures are generally based on statistical considerations.
The p% disruptive discharge voltage of a test object is the prospective voltage value
which has p% probability of producing a disruptive discharge on the test object.
The conventional deviation z of the disruptive discharge voltage of a test object is the
difference between its 50% and 16% disruptive discharge voltages. It is often expressed in per
unit or percentage value, referred to the 50% disruptive discharge voltage.
7.4.1 -Conduction of the sphere surfaces
An accurate field distribution is obtained by satisfying the following requirements in this
section.
The curvature of the surface of the spheres shall be constant. The surfaces, in the
neighbourhood of the sparking points, shall be cleaned and dried but they do not need to be
polished. They must be smooth, free of defects and free of dust. In normal use, the surfaces
of the spheres become roughened and pitted. When it occurs, the surface should be treated.
If the spheres become excessively roughened or pitted in use, they shall be repaired or
replaced.
Moisture may condense on the surface of the sparking points in conditions of high relative
humidity causing measurements to become erratic.
No air currents may be present in order to ensure accuracy; however, minor damage to
the surface of the sphere beyond the region of sparking point is not likely to affect the use of
the sphere as a measuring or calibrating device.
7.4.2 -Irradiation
The disruptive discharge voltage of a sphere-gap depends upon the availability of free
electrons in the gap between the spheres at the moment of application of voltage. Actions
should be taken if the requirements for conventional deviation z are not met.
Irradiation is usually required for measurements below 50 kV peak for all sphere
diameters, and for measurement of voltages with spheres of 12.5 cm diameter and less for all
voltage shapes.
For impulse voltage, direct exposure of a sphere-gap to the light from the impulse
generator gaps may be sufficient; otherwise, when sufficient irradiation is not available, the
uncertainly associated with the values for disruptive discharge given in the standard should
be increased.

89
7.5 - Reference values
The disruptive discharge voltages for various spacing between spheres are given in tables
2 and 3 of the Standard IEC 60052 for the standard atmospheric conditions for temperature
and pressure:
Temperature t0 = 20 ºC
Pressure b0 = 101.3 kPa
The values were obtained under conditions of absolute humidity h between 5gm-3 and
12gm-3, with an average of 8.5gm-3.
In tables 2 and 3 of the Standard are given the values in impulse tests of the 50%
disruptive discharge voltages U50 in kV for full lightning impulse voltages of negative and
positive polarity respectively. These tables are not valid for the measurement of impulse
voltages below 10 kV. For impulse voltages, these values given have an estimated uncertainty
of 3% for a level of confidence not less than 95%.
Note:
It is recommended that the sphere-gap spacing should not be less than 0.05D, as it may
be difficult to measure and adjust the gap with sufficient accuracy if the ratio of spacing to
diameter is very small.
No level of confidence is assigned to those values in brackets.
Figure 7.4 is shown in order to give an idea about how the peak voltage Up at which a
sphere-gap breaks down as a function of the sphere-gap spacing and the sphere diameter D.
This relationship is used for calibrating impulse voltages. This figure, showed by Kreuger [4],
is valid only for estimations; therefore the exact values are well documented in tables of the
IEC standard.
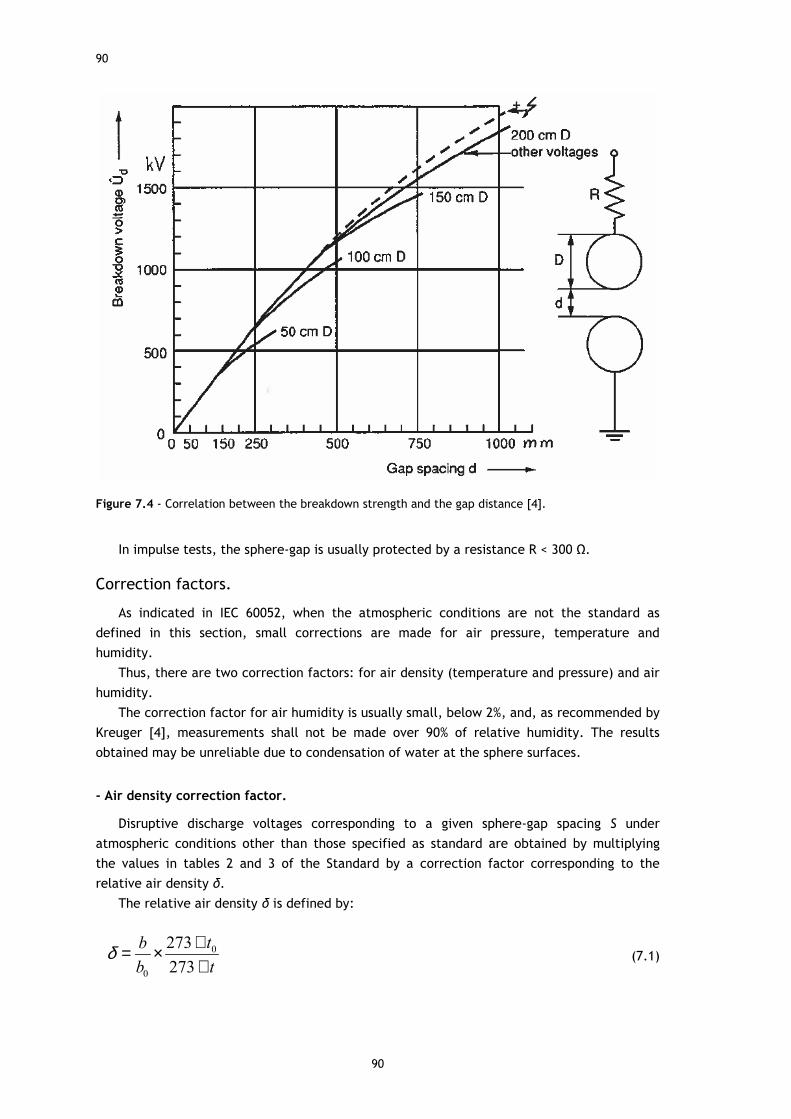
90
90
Figure 7.4 - Correlation between the breakdown strength and the gap distance [4].
In impulse tests, the sphere-gap is usually protected by a resistance R < 300 Ω.
Correction factors.
As indicated in IEC 60052, when the atmospheric conditions are not the standard as
defined in this section, small corrections are made for air pressure, temperature and
humidity.
Thus, there are two correction factors: for air density (temperature and pressure) and air
humidity.
The correction factor for air humidity is usually small, below 2%, and, as recommended by
Kreuger [4], measurements shall not be made over 90% of relative humidity. The results
obtained may be unreliable due to condensation of water at the sphere surfaces.
- Air density correction factor.
Disruptive discharge voltages corresponding to a given sphere-gap spacing S under
atmospheric conditions other than those specified as standard are obtained by multiplying
the values in tables 2 and 3 of the Standard by a correction factor corresponding to the
relative air density δ.
The relative air density δ is defined by:
0
0
273
273
tb
b tδ += ×
+ (7.1)

91
where:
• the atmospheric pressures b and b0 are expressed in the same units (kPa);
• t and t0 are the temperatures in degrees Celsius.
Standard atmospheric conditions for temperature and pressure are:
Temperature t0 = 20 ºC
Pressure p0 = 101.3 kPa
- Humidity correction factor:
The disruptive discharge voltage of a sphere-gap increases with absolute humidity at a
rate of 0.2 % per gm-3.
The average value of absolute humidity h under which values in tables 2 and 3 of the
Standard were obtained is 8.5 gm-3. These values shall be corrected for humidity by
multiplying the values in those tables by the humidity correction factor k given by the
following equation:
1 0.002 8.5h
kδ
= + × −
(7.2)
with the ambient absolute humidity h in gm-3.
7.6 - Advantages and disadvantages
The sphere-gap is widely used because of its advantages; although it also presents some
disadvantages. Both are presented in this section based on the information depicted by
Kreuger [4].
The advantages are:
• It is a simple device and universally applicable;
• It measures the crest voltage which usually is decisive in dielectric
testing;
• It measures all types of voltages: lightning impulses and, also DC, AC
and switching impulses;
• It has a large scope: from a few kVs with small spheres of some
centimetres diameter to MVs with spheres of some metres diameter.
The disadvantages are:
• Its accuracy is modest (about 3 % at impulses);
• It does not give a voltage reading but is used to calibrate the readings
of the voltage divider in the case of the High Voltage Laboratory;

92
92
• Time consuming: in order to obtain full accuracy, long test series are
needed to determine the 50 % disruptive discharge voltage U50 or, also
called, breakdown value.
7.7 - How to perform the calibration process
The use of standard air gaps permits checking the approved measuring systems of the
High Voltage Laboratory.
A measurement of voltage by means of sphere-gap consists of establishing the relation
between a voltage in the test circuit, as measured by the standard air gap, and the peak
value of the voltage obtained from the measuring device of the Laboratory, that is the digital
storage oscilloscope (DSO), connected to the low voltage arm of the measuring system (the
Capacitive Mixed Divider).
If it is possible to access to low voltage unit of the Capacitive Divider, by means of
intentionally changing capacitance of the variable capacitor of this unit, the divider output
ratio can be changed and adjusted according to the voltage measured by the standard air gap
in order to obtain a true voltage value in the oscilloscope.
As this operation cannot be made at the High Voltage Laboratory, because it is not
possible to access to low voltage arm of the Divider, the calibration process must consist of
establishing the relation between voltages by means of a function. The peak value of the
voltage obtained from the oscilloscope can be related to the true voltage in the test circuits
by a mathematical function. This function can be represented as a straight line, a linear
function.
Values of the calibration presented in this report are not real and can be used only as
indicative values. Thus, this section aims to set the principles and give an example in order to
make the correct calibration of the High Voltage Laboratory in the future.
7.7.1 -Layout with clearance limits
The general arrangement of the sphere-gap at the High Voltage Laboratory was
considered vertical as shown in figure 7.1 (left side). The layout shown in figure 7.5 makes
possible to perform the calibration of the system complying with clearance limits established.
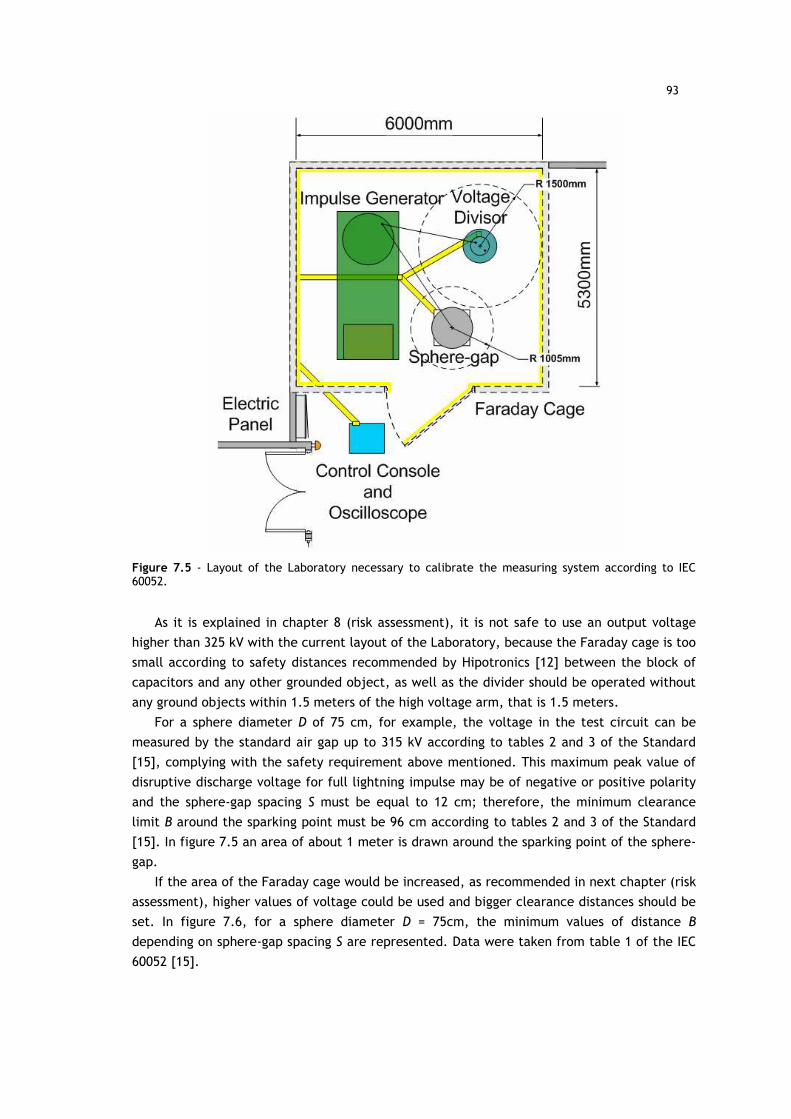
93
Figure 7.5 - Layout of the Laboratory necessary to calibrate the measuring system according to IEC 60052.
As it is explained in chapter 8 (risk assessment), it is not safe to use an output voltage
higher than 325 kV with the current layout of the Laboratory, because the Faraday cage is too
small according to safety distances recommended by Hipotronics [12] between the block of
capacitors and any other grounded object, as well as the divider should be operated without
any ground objects within 1.5 meters of the high voltage arm, that is 1.5 meters.
For a sphere diameter D of 75 cm, for example, the voltage in the test circuit can be
measured by the standard air gap up to 315 kV according to tables 2 and 3 of the Standard
[15], complying with the safety requirement above mentioned. This maximum peak value of
disruptive discharge voltage for full lightning impulse may be of negative or positive polarity
and the sphere-gap spacing S must be equal to 12 cm; therefore, the minimum clearance
limit B around the sparking point must be 96 cm according to tables 2 and 3 of the Standard
[15]. In figure 7.5 an area of about 1 meter is drawn around the sparking point of the sphere-
gap.
If the area of the Faraday cage would be increased, as recommended in next chapter (risk
assessment), higher values of voltage could be used and bigger clearance distances should be
set. In figure 7.6, for a sphere diameter D = 75cm, the minimum values of distance B
depending on sphere-gap spacing S are represented. Data were taken from table 1 of the IEC
60052 [15].

94
94
Figure 7.6 - Clearance limit: minimum value of distance B in cm depending on sphere-gap spacing S in cm, for a sphere diameter D = 75 cm.
Peak values of disruptive voltages for full lightning impulse voltages only depend on the
sphere-gap spacing S and the sphere diameter D. Figure 7.7 shows these voltage values of
negative polarity, for a sphere diameter D = 75cm, as established by the table 2 of the
Standard IEC 60052 [15].
Figure 7.7 - Peak values of disruptive discharge voltages in kV for full lightning impulse voltages of negative polarity depending on sphere-gap spacing S in cm, for a sphere diameter of D = 75 cm.
7.7.2 -Measurement of peak value of full lightning impulse voltages
The 50% disruptive discharge voltage U50 and the conventional deviation z shall be
determined. The value of the conventional deviation z shall be not more than 1% for full
lightning impulse voltages.
This can be done by a multiple level test. A minimum of 10 voltage applications at each
of five voltage levels in approximately 1% steps of the expected disruptive discharge value is

95
needed to obtain U50 and to check the conventional deviation z for a fixed sphere-gap spacing
S.
Table 7.1 shows an example. On the left, the 50% peak value of disruptive discharge
voltage, after being corrected by air density and humidity correction factors, is shown, and,
on the right, the process of determination the 50% disruptive discharge voltage and the
conventional deviation is performed.
Table 7.1 —Example of measurement.
Winter
V peak
oscilloscope [kV]
Temperature [ºC] 9.2 1 220
Atmospheric pressure
[mbar] 1023 2 218
Relative humidity [%] 70 3 218
4 222
Air density correction
factor (δ) 1.05 5 221
Humidity correction
factor (k) 0.995 6 200
7 220
Sphere diameter D [cm] 75 8 223
Sphere-gap spacing S
[cm] 8 9 220
U50 Lightning Impulse
(LI) [kV] 215 10 221
Corrected value
(U50δk) [kV] 224.62 Mean value 220.33
Conventional
deviation 1.7 <
1%
(220.33)
Correction factors are applied according to the Standard.
When there is a peak voltage measured by the oscilloscope, which deviates from the
expected voltage value, it must be removed so that it does not affect the mean value and the
conventional deviation. One of the values has been highlighted for this reason.
The criterion for the conventional deviation z shall be checked by applying 15 impulses at
the voltage level of (U50 - 1%) for lightning impulse voltages. There shall be not more than
two disruptive discharges.
The interval between voltage applications shall be not less than 30 s.

96
96
As it is not possible to adjust the divider ratio of the voltage divider, the calibration must
be done by means of creating a table of equivalences between the peak voltage displayed in
the oscilloscope and the peak value of disruptive discharge voltage in the sphere-gap. This is
only an example, because the necessary equipment was not available, but it shall be
obtained a table as shown in table 7.2. It shows a linear function that links both parameters.
With this relation it is very easy to know the real peak value of the standard waveform for
any laboratory testing.
Table 7.2 — Relation between peak value of disruptive discharge voltage in the sphere-
gap and peak voltage measured in the oscilloscope.
0
50
100
150
200
250
300
350
180,1 220,33 289,5 322,3
V peak oscilloscope [kV]
Co
rrec
ted
pea
k va
lue
of
dis
rup
tive
d
isch
arg
e vo
ltag
e [k
V]
To obtain the table of equivalences of the equipment of the High Voltage Laboratory is
purposed a further work.

97
Chapter 8
Risk assessment
In last 10 or 15 years, human safety and risk management in the workplace have become
more and more important. Nowadays, workers and administrators are aware of the risks
which are present at their workplace. A risk assessment is an important step in protecting all
the people who work or, temporarily, visit the workplace, as well as complying with the law
and protecting the institution image.
This chapter states necessary actions to prevent somebody might be harmed and those
risks with the worst potential consequences at the High Voltage Laboratory of the Faculty of
Engineering. The Impulse Test System is equipment potentially dangerous, thus, safety must
be priority in order to carry out safe lightning impulse tests.
The current importance of this field is shown by all the information which is possible to
find about it. In last time, new journals on risk and safety have appeared, longer established
journals in the risk and safety field have gone from strength to strength, and, the large
amount of recent research literature that has been generated in the risk and safety field is
reflected in several completely new books which have been published.
8.1 - What is risk assessment?
A risk assessment is a careful examination of what, in the workplace, could cause harm to
people. Workers and others as visitors have a right to be protected from harm caused by a
failure to take reasonable control measures. The responsible engineer of the High Voltage
Laboratory is legally required to assess the risks in the workplace so that it is put in place a
plan to control the risks. An accident can affect the institution image and a business.
When an update of the risk assessment of the Laboratory is necessary to do, it should be
made sure that the responsible engineer and all the users are involved in the process. She or
he will have useful information about how the work is done that will make the update of the
assessment more thorough and effective; what guarantees a successful process.

98
98
The process is not complicated, the risks are well-known and the necessary control
measures are, in this case, easy to apply.
As defined by Glendon, Clarke and McKenna [17], the varieties of technical approach to
risk as applied to safety, health, and environment issues have their origins in engineering. An
example of this approach is shown below:
“Risk = Probability x Magnitude”
It assumes rationality, considering risk as being primarily about seeking safety benefits,
such that acceptable risk decisions are deemed to be matters of engineering judgement.
8.2 - How to assess the risks in the workplace
A hazard is anything that may cause harm, such as electricity at the High Voltage
Laboratory. The risk is the chance, high or low, that somebody could be harmed by these and
other hazards, together with an indication of how serious the harm could be.
To assess the risks in the laboratory, there are five steps that must be followed by the
person in charge of the assessment for a correct plan. They are explained below.
• Identify the hazards;
• Decide who might be harmed and how;
• Evaluate the risks and decide on precautions;
• Decide further actions that must be implemented;
• Review the assessment and update if necessary.
8.2.1 -Identify the hazards
Hazards of the High Voltage Laboratory are basically divided in two:
• Charges retained by capacitors;
• Safety distances too short.
In this high voltage installation of the Laboratory, people could be harmed mainly by an
unexpected high voltage discharge if someone enters the zone delimited by the Faraday cage
and touches a part of the equipment inside the Faraday cage that has a dangerous potential
and it was unexpected for the user. These dangerous potentials may exist in the circuit due
to charges retained by capacitors.
Therefore, special care must be taken, especially, when the discharge of the capacitors
does not occur because a wrong adjustment of the sphere-gap spacings.
The safety distance around the impulse generator, as well as other points that reach
dangerous potentials, such as the high voltage arm of the capacitive divisor or the device
under test (insulator), must be properly calculated before carrying out any lightning impulse
tests.
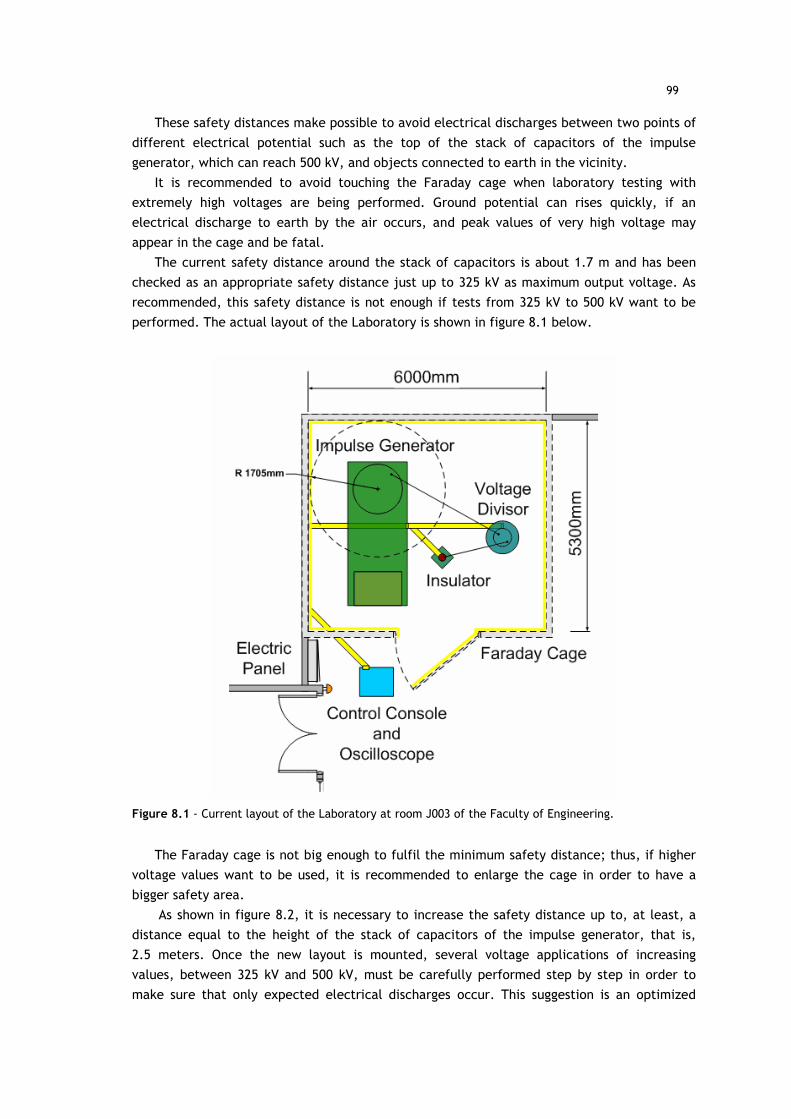
99
These safety distances make possible to avoid electrical discharges between two points of
different electrical potential such as the top of the stack of capacitors of the impulse
generator, which can reach 500 kV, and objects connected to earth in the vicinity.
It is recommended to avoid touching the Faraday cage when laboratory testing with
extremely high voltages are being performed. Ground potential can rises quickly, if an
electrical discharge to earth by the air occurs, and peak values of very high voltage may
appear in the cage and be fatal.
The current safety distance around the stack of capacitors is about 1.7 m and has been
checked as an appropriate safety distance just up to 325 kV as maximum output voltage. As
recommended, this safety distance is not enough if tests from 325 kV to 500 kV want to be
performed. The actual layout of the Laboratory is shown in figure 8.1 below.
Figure 8.1 - Current layout of the Laboratory at room J003 of the Faculty of Engineering.
The Faraday cage is not big enough to fulfil the minimum safety distance; thus, if higher
voltage values want to be used, it is recommended to enlarge the cage in order to have a
bigger safety area.
As shown in figure 8.2, it is necessary to increase the safety distance up to, at least, a
distance equal to the height of the stack of capacitors of the impulse generator, that is,
2.5 meters. Once the new layout is mounted, several voltage applications of increasing
values, between 325 kV and 500 kV, must be carefully performed step by step in order to
make sure that only expected electrical discharges occur. This suggestion is an optimized

100
100
layout, according to recommendations of Hipotronics [11], when tests with voltages up to
500 kV want to be performed.
Figure 8.2 - New suggested layout at room J003 of the Faculty of Engineering.
In figure 8.2, it is also included other two safety areas around the device under test
(insulator) and the capacitive divider, which makes the new layout safer. As recommended by
Hipotronics [12], the divider should be operated without any ground objects within
1.5 meters of the high-voltage arm, that is, 1.5 meters. Metallic objects and protrusions
present within this distance may affect measurements (ratio and response time) and cause
flashovers or incorrect partial discharge readings.
8.2.2 -Decide who might be harmed and how
First of all, it is assumed that the user has a basic understanding of electrical equipment
and the functions to be performed by this laboratory equipment. Only trained and qualified
personnel should operate this equipment.
Special care must be taken whit groups of students or other inexperienced visitors. All the
people must always bear in mind that extreme caution (prudence, care) is required in order
to be present at a lightning impulse test.

101
8.2.3 -Evaluate the risks and decide on precautions
This section presents safety systems currently used at the Laboratory in order to prevent
risks and, shows precautions which must be taken by the users of the Laboratory.
To establish precautions necessary for working with the equipment, the door of the
Faraday cage has a safety system which can be compared with a limit switch (see figure 8.3).
When the door is open, it cuts off the electrical supply of the control console of the impulse
generator and, prevents from charging the impulse test system.
Figure 8.3 - Example of a limit switch (OMRON Industrial Automation) on the left, and the safety system of the Faraday cage on the right.
Whit voltage supply on, a light alarm signal shown in figure 8.4 warns about extremely
high voltages are being generated and, therefore, special care must be taken.
Figure 8.4 - Light alarm signal of the High Voltage Laboratory.
In case of someone enter the safety area, inside the cage, without permission, an
emergency stop switch shown in figure 8.5 makes possible to stop the electrical supply of the
system instantly.
Figure 8.5 - Emergency stop switch of the High Voltage Laboratory.
The control console and measuring system (oscilloscope) must be placed in a clean room,
dust-free, preferably equipped with air conditioned. Temperatures below 0ºC or above 40ºC
may damage the electric and electronic circuits of the equipment. The High Voltage
Laboratory may be a very cold room for the equipment in winter.

102
102
Control console and oscilloscope must be placed out of the Faraday cage and, at least,
2meters away of it. Another suggested option for the future is to place the control console
and measuring system in the room J002 nearby.
All the electrical cables between the Faraday cage and the control console must be
protected by a metallic gutter as shown in figure 8.6. Moreover, if this protection is
connected to earth, the metallic gutter placed around conductors works as a shield;
electromagnetic interferences (EMI) may be avoided in this way. Thus, inside it, the noise
voltage on conductors is reduced to zero, as described by Ott [19].
Figure 8.6 - Metallic gutter which protects electrical cables.
Human error can happen; for this reason, these safety systems were implemented in the
Laboratory. Objects like paper or cardboard must not be left inside the Faraday cage because
they may catch fire if touched by a flashover arc. If a fire occurs, there is available a fire
extinguisher in room J002, as shown in figure 3.18.
8.2.4 -Decide further actions that must be implemented
Two further actions are mainly suggested here: a safety way and improvement of the
safety system; both in order to improve and insure a safe workplace.
The ground rod should always be employed, after shutting off all power, to ensure that
circuits are electrically “dead” before touching any potentially dangerous point of the
system, as recommend by Hipotronics [11].
It might be forgotten due to a human error at any time, for this reason, a safety way was
designed and is ready to be implemented, as shown in figures 8.7a (for the current layout)
and 8.7b (for the suggested layout above mentioned). This design aims to highlight the way
which must always be followed when operating and maintenance personnel enter the Faraday
cage and remind them to discharge circuits by using of the ground rod.
It is an absolutely important safety rule because the points highlighted in orange in figure
8.7a and 8.7b (impulse generator, insulator and capacitive divisor) may have charges retained
by capacitors and it might be produced an electrical discharge, fatal for the users when
touched before discharging.

103
(a.)
(b.)
Figure 8.7a and b - Layout of the Laboratory. It shows a possible safety way that aims to avoid human error which may be fatal for the users if an electrical discharge occurs. The design shown in figures (a.) and (b.) was made for the current and the suggested layouts of the Laboratory respectively.

104
104
This section also introduces a new safety system which may be implemented and is
proposed as a further work (see chapter 11).
The laboratory safety system, depicted in section 8.2.3, becomes a more active system if,
as suggested, it is included a system designed by using optical sensors which can be
implemented to prevent risks.
When charges are retained by the stack of capacitors and someone enter the Faraday
cage, dangerous potentials exist in the circuit and may be fatal. These points, already shown,
highlighted in orange, in figures 8.7a and 8.7b, may have charges retained by capacitors
which might be fatal for the users if an electrical discharge occurs.
Thus, this suggested safety system would raise an alarm when someone tries to cross the
dangerous area before discharging capacitors by means of the ground rod. The optical sensor
used in the design might be one as shown in figure 8.8. The placement of this sensor is shown
in figure 8.9.
Figure 8.8 - Optical sensor (Monarch Instrument) which might be used in the design of the safety system.
Figure 8.9 - Suggested layout for the Laboratory. It shows the placement of the optical sensor (blue), together with the potentially dangerous points (orange dotted line) and the safety way above purposed.

105
As a conclusion, another further action that must be implemented is recommended. In
order to show and mind all the safety rules to potential users of the High Voltage Laboratory,
a poster can be designed, printed and placed on a wall of the Laboratory, in a visible
location.
8.2.5 -Review the assessment and update if necessary
The High Voltage Laboratory is a workplace that stays the same; usually there are no
significant changes, therefore, reviews or updates of this risk assessment are only necessary
if new equipment is brought or layout is changed.
If there is a significant change in the High Voltage Laboratory, the risk assessment here
presented must then be checked and amended where necessary. It is the best to think about
the risk assessment when the change is being planned and it leaves more flexibility to solve
other possible problems.
8.3 - Conclusions
This equipment employs voltages which are substantially dangerous when contacted by
operating personnel. Therefore, extreme caution shall be exercised when working with
equipment. While every practicable safety precaution has been incorporated, the following
rules must be strictly observed, as stated by Hipotronics [11]:
• Operating and maintenance personnel must all times observe all
safety regulations.
• The equipment must be kept away from live circuits.
• Do not change components or make adjustments inside equipment
with voltage supply on. Under certain conditions, dangerous
potentials may exist in circuits with power controls in the off position
due to charges retained by capacitors.
• To avoid accidents, always remove power, then discharge and ground
by use of grounding rod, prior to touching any parts.
• Do not tamper with interlocks.
• Do not depend upon door switches or interlocks for protection, but
always shut down high voltage rectifiers and other power equipment.
• Under no circumstances should any access gate, door or safety
interlock switch be removed, short circuited, or tampered with in any
way, except by authorized maintenance personnel when considered
unavoidable, nor should reliance be placed upon the interlock
switches for removing voltages from the equipment.
• Never switch on the equipment while anybody is inside the Faraday
cage.
As recommended, before anyone begin using the equipment, please read manuals and
user’s guides carefully in order to be aware of the risks.

106
106
Nowadays, a social pressure for greater personal safety in workplaces exists. It is
necessary a safety culture, a leader and a supervisor for a safe performance of every work, in
this case, laboratory testing.
Using safety rules and systems depicted in section 8.2, insures safety without a wrong use
of the available space, which will be, therefore, optimized.

107
Chapter 9
Test on electrical insulators of organic material
The function of electrical overhead transmission lines’ insulators is to keep the conductor
isolated from ground and another conductor, and mechanical cable holding. They must bear
cable’s mechanical load which is transmitted through them to the tower, and keep an
electrical isolation between conductor and tower. They must resist normal and abnormal
voltages, and over-voltages as far as maximum ones planned. Both insulating material, and its
surface, and air surrounding must resist peak voltage values.
Insulators have to be tested in the same conditions as they will support during their
service life. They must comply with minimum standard requirements so that customers
accept the quality of the product.
9.1 - Insulator parameters
Insulator parameters are specified in every catalogue and they are defined below for a
better understanding.
Puncture voltage is the minimum voltage that causes a portion of an insulator to become
electrically conductive. A partial or total break of the insulator can happen due to an
electrical arc which goes through it. It is the voltage across the insulator (when installed in
its normal manner) which causes a breakdown and conduction through the interior of the
insulator. The heat resulting from the puncture arc usually damages the insulator irreparably.
Flashover voltage consists of an electric arc through the air between two points of the
insulator which have, normally, nominal voltage. This voltage causes that air around or along
insulator’s surface break down and be able to conduct through it. A flashover arc along
insulator’s outside occurs, but they are designed to withstand this phenomenon, usually,
without damage.

108
108
Power frequency withstand voltage, dry (kV), is the r. m. s. (root mean square) value of
sinusoidal power frequency voltage that the equipment can withstand during tests made
under dry conditions and for a specified time.
Power frequency withstand voltage, wet (kV), is the r. m. s. (root mean square) value
of sinusoidal power frequency voltage that the equipment can withstand during tests made
under raining conditions and for a specified time.
Lightning impulse is a voltage impulse, applied during dielectric tests complying with
standards, with a front duration in the order of one microsecond (especially for standard
lightning impulses 1.2/50 microseconds) and a time to half value in the order of 50 µs.
Lightning impulse withstand voltage (kV peak value) is the maximum lightning voltage
which can be supported by an insulator without any damage in it.
Creepage distance (mm) is the shortest distance along the surface of the insulating
material between two conductive parts. It is also called leakage distance.
Clearance distance (mm) is the shortest air distance between conductors.
Maximum mechanical strengths such as tensile strength, flexural strength, compressive
strength and impact strength are also insulator parameters, but, as they are not electrical
ones, they are not define in this chapter.
High voltage insulators are designed with a lower flashover voltage than puncture voltage
so that they will flashover before they puncture to avoid any damage.
The insulator designing requirement is that electrical discharge must take place through
the air and not to puncture the insulator. It is important an adequate geometrical design so
that there will not be a big electrical field concentration which might break the insulator
material.
Dirt, pollution, salt, and particularly water on the surface of a high voltage insulator
might create a conductive path across it and cause leakage currents and flashovers. Flashover
voltage can be lower than 50% when insulator’s surface is wet. High voltage outdoor
insulators are shaped to maximize the length of the leakage path along the surface from one
end to the other, called the creepage length, to minimize these leakage currents.
9.2 - Characteristics of indoor and outdoor post insulators
Characteristics of indoor and outdoor post insulators for systems with nominal voltages
greater than 1000 V are standardized by IEC 60273.
This standard applies to post insulators of organic material intended for indoor service in
electrical installations or equipment operating on alternating current systems with a nominal
voltage greater than 1000V and a frequency not greater than 100Hz. They are primarily
intended for use in isolator switches, disconnectors or as bus-bar or fuse support.
The post insulator tested in the High Voltage Laboratory is an indoor post insulator of
organic material and with internal metal fittings, as shown in figure 9.1.

109
Figure 9.1 - Post insulator under test.
This standard is intended to establish standard values of those electrical characteristics,
mechanical characteristics and dimensions which are essential for the interchangeability of
post insulators and post insulator units of the same type.
Each post insulator is designated for a specific lightning impulse withstand voltage based
on the standardized values given in IEC 60071-1. The minimum height to be chosen is
determined by one of the electrical characteristics given in the standard, i.e. dry lightning
impulse withstand voltage, wet power frequency withstand voltage and wet switching
impulse withstand voltage as applicable and according to the relevant insulation coordination
requirements. The operating voltage is not specified because depending on service
conditions, especially contamination, it cannot strictly be correlated with the height of the
post insulator.
The composition of the post insulator, i.e. the number, the size and the positioning of
insulator units is not specified. For a given height of a post insulator, however, the
composition together with insulator profile and size and shape of metal parts can all affect
the electrical performance of the post insulator especially the wet switching impulse
withstand voltage value.
9.2.1 -Mechanical characteristics
Post insulators are standardized in mechanical strength classes based on values of the
specified failing load in the bending test.
9.2.2 -Dimensional characteristics
The following dimensional characteristics are specified:
• overall height;
• maximum nominal diameter of the insulating part;
• fixing arrangements;
• tolerances;
• minimum nominal creepage distance (for outdoor post insulators only).
The composition of the post insulator is not specified.
The amount by which the creepage distance of an insulator may be increased within the
specified dimensions varies according to the design and size of the insulator, and, where
increased creepage distance is required, it should be the subject of agreement between the

110
110
manufacturer and the purchaser in order to avoid designs which are unsuitable for service in
polluted atmospheres.
9.2.3 -Table of characteristics
Table II of the Standard IEC 60273 shows the characteristics of indoor post insulators of
organic material and with internal metal fittings. A part of this table is shown in table 9.1
below.
Table 9.1 — Indoor post insulators of organic material and with internal metal fittings.
The insulator under test in the high voltage laboratory is:
“JO4-125”
where:
JO – indoor post insulator of organic material.
4 – mechanical strength class (4000N).
75 – lightning impulse withstand voltage (in kilovolts) = 125 kV
Thus, “IEC post insulator Type JO4-125” indicates an indoor post insulator of organic
material of strength Class 4 and with lightning impulse withstand voltage 125 kV.
9.3 - Test on indoor post insulators of organic material
The international standard IEC 60660 states the way to perform tests on indoor post
insulators of organic material for systems with nominal voltages greater than 1000 V up to but
not including 300 kV.
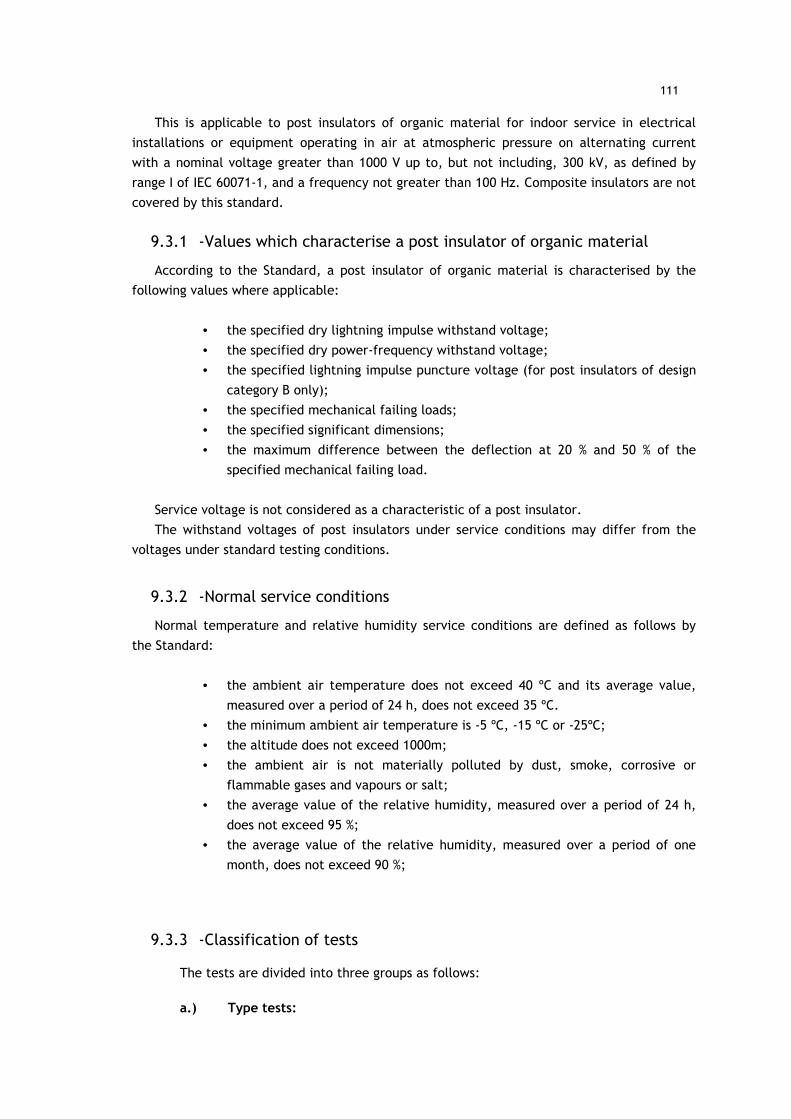
111
This is applicable to post insulators of organic material for indoor service in electrical
installations or equipment operating in air at atmospheric pressure on alternating current
with a nominal voltage greater than 1000 V up to, but not including, 300 kV, as defined by
range I of IEC 60071-1, and a frequency not greater than 100 Hz. Composite insulators are not
covered by this standard.
9.3.1 -Values which characterise a post insulator of organic material
According to the Standard, a post insulator of organic material is characterised by the
following values where applicable:
• the specified dry lightning impulse withstand voltage;
• the specified dry power-frequency withstand voltage;
• the specified lightning impulse puncture voltage (for post insulators of design
category B only);
• the specified mechanical failing loads;
• the specified significant dimensions;
• the maximum difference between the deflection at 20 % and 50 % of the
specified mechanical failing load.
Service voltage is not considered as a characteristic of a post insulator.
The withstand voltages of post insulators under service conditions may differ from the
voltages under standard testing conditions.
9.3.2 -Normal service conditions
Normal temperature and relative humidity service conditions are defined as follows by
the Standard:
• the ambient air temperature does not exceed 40 ºC and its average value,
measured over a period of 24 h, does not exceed 35 ºC.
• the minimum ambient air temperature is -5 ºC, -15 ºC or -25ºC;
• the altitude does not exceed 1000m;
• the ambient air is not materially polluted by dust, smoke, corrosive or
flammable gases and vapours or salt;
• the average value of the relative humidity, measured over a period of 24 h,
does not exceed 95 %;
• the average value of the relative humidity, measured over a period of one
month, does not exceed 90 %;
9.3.3 -Classification of tests
The tests are divided into three groups as follows:
a.) Type tests:

112
112
The type tests are intended to verify the main characteristics of a post insulator of
organic material, which depend mainly on its design, the material used and the
manufacturing process.
They are usually carried out on one insulator, and once only for a new design or
manufacturing process, and then subsequently repeated only when the design, material
or manufacturing process is changed. When the change only affects certain
characteristics, only the test(s) relevant to those characteristics need to be repeated. For
this, the type tests are divided into three sub-groups according to their applicability.
Type tests shall be carried out only on insulators from a lot which meets the
requirements of all the relevant sample and routine tests not included in the type tests
b.) Sample tests:
The sample tests are carried out to verify the characteristics of an insulator, which
can vary with the manufacturing process and the quality of the component materials of
the insulator. Sample tests are used as acceptance tests on a sample of post insulators,
taken at random from a lot which has met the requirements of the relevant routine tests.
c.) Routine tests:
The routine tests are intended to eliminate defective insulators and are carried out
during the manufacturing process. Routine tests are carried out on every insulator.
9.3.4 -General requirements for electrical tests
International standards states the requirements listed below for lightning impulse tests:
a.) Lightning impulse test methods shall be in accordance with IEC 60060-1.
b.) Lightning impulse voltages shall be expressed by their prospective peak values. When
the natural atmospheric conditions at the time of test differ from the standard
values, it is necessary to apply the appropriate correction factors.
c.) The post insulators shall be clean and dry before starting the electrical tests.
d.) Precautions shall be taken to avoid condensation on the surface of the post insulator,
especially when the relative humidity is high.
The standard 1.2/50 lightning impulse shall be used (see IEC 60060-1) with the following
tolerances:
• peak value: ±3 %;
• front time: ±30 %;
• time to half-value: ±20 %.
The standard reference atmospheric conditions for tests shall be in accordance with IEC
60060-1:
• temperature: to = 20 ºC
• pressure: b0 = 101.3 kPa (1013 mbar)
• absolute humidity: h0 = 11 g/m3

113
The correction factors shall be determined in accordance with IEC 60060-1. If the
atmospheric conditions at the time of test differ from the standard reference atmosphere,
then the correction factors for air density (k1) and humidity (k2) shall be calculated, and the
product K=k1k2 determined. The lightning impulse test voltages shall then be corrected as
follows:
• -withstand voltages: applied test voltage = K multiplied with the specified
withstand voltage;
• -flashover voltages: recorded flashover voltage = measured flashover voltage
divided by K.
9.4 - Test waveforms
A full lightning impulse test can have three possible results. Firstly, a high voltage
insulator of organic material under test that withstands the voltage applied without damage.
Air around or along insulator’s surface does not break down and is not able to conduct
through it, therefore, a flashover arc along insulator’s outside does not occur. The test
waveform is shown in figure 9.2 below.
Figure 9.2 - Test waveform of an insulator of organic material. 25kV per stage were applied (125kV). Volts and second per division rate selected: 100V/div, 10µs/div. Prove attenuation: 100X.
If voltage applied on electrical insulator is higher than the maximum lightning voltage
which can be supported, then the air around breaks down and a flashover arc occurs along its
outside. Air around is then able to conduct electricity through it and capacitors discharge
their stored energy through this way. A short circuit is created. This effect is shown in figures
9.3 and 9.4, the wave falls quickly, almost instantaneous because the maximum lightning
impulse withstand voltage for the electrical insulator tested here, JO4-125, is 125 kV.
Figure 9.3 and 9.4 show a chopped-tail and a chopped-front waveforms respectively.
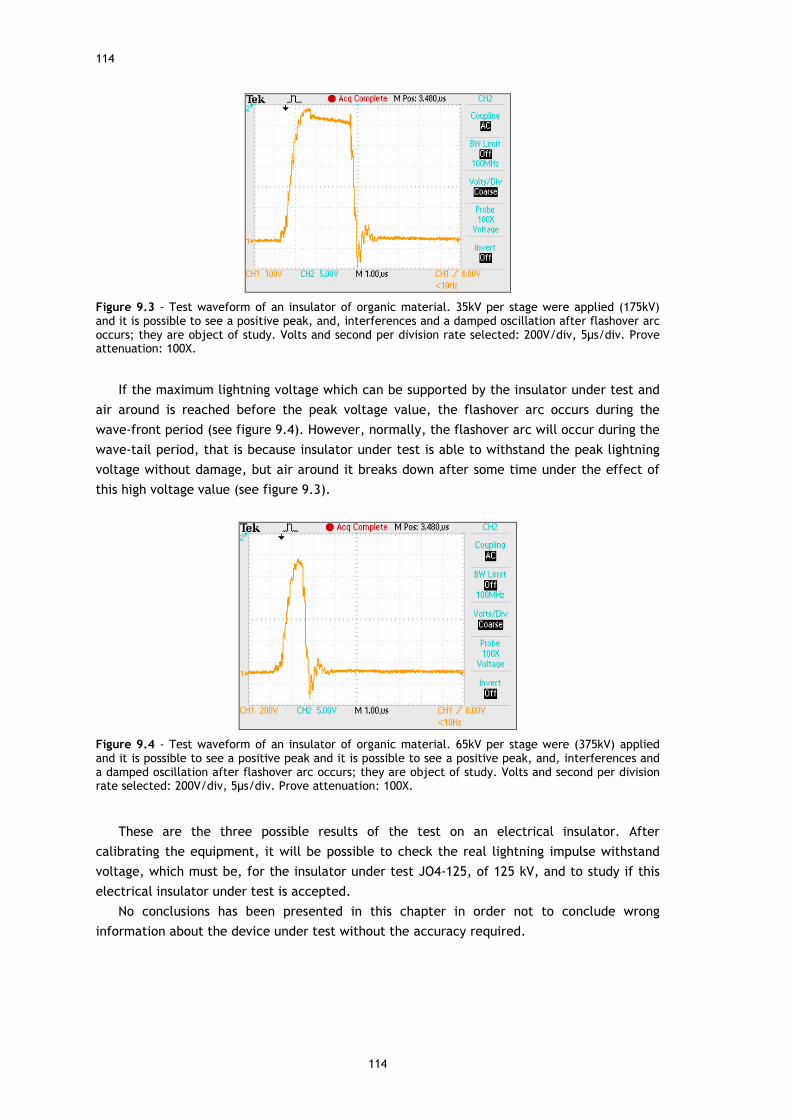
114
114
Figure 9.3 - Test waveform of an insulator of organic material. 35kV per stage were applied (175kV) and it is possible to see a positive peak, and, interferences and a damped oscillation after flashover arc occurs; they are object of study. Volts and second per division rate selected: 200V/div, 5µs/div. Prove attenuation: 100X.
If the maximum lightning voltage which can be supported by the insulator under test and
air around is reached before the peak voltage value, the flashover arc occurs during the
wave-front period (see figure 9.4). However, normally, the flashover arc will occur during the
wave-tail period, that is because insulator under test is able to withstand the peak lightning
voltage without damage, but air around it breaks down after some time under the effect of
this high voltage value (see figure 9.3).
Figure 9.4 - Test waveform of an insulator of organic material. 65kV per stage were (375kV) applied and it is possible to see a positive peak and it is possible to see a positive peak, and, interferences and a damped oscillation after flashover arc occurs; they are object of study. Volts and second per division rate selected: 200V/div, 5µs/div. Prove attenuation: 100X.
These are the three possible results of the test on an electrical insulator. After
calibrating the equipment, it will be possible to check the real lightning impulse withstand
voltage, which must be, for the insulator under test JO4-125, of 125 kV, and to study if this
electrical insulator under test is accepted.
No conclusions has been presented in this chapter in order not to conclude wrong
information about the device under test without the accuracy required.

115
Chapter 10
Results
In this Master’s Thesis has been necessary to study all the equipment conscientiously in
order to carry out tests in the High Voltage Laboratory.
Firstly, the theoretical fundamentals and the equipment available in the High Voltage
Laboratory have been presented in order to set a theoretical base and get to know the
function of each part of the equipment, what is necessary to understand how it works and
may help in studying future problems in the equipment.
Secondly, it has been shown two computer simulators that can be used in order to study
the equipment. On one hand, Pspice is a quick simulator that allows obtaining results with
accuracy in order to compare different configurations of the equipment. On the other hand,
PSCAD is much better computer simulator but slower. Chopped waveforms may only be
simulated with this second one.
Both have their advantages and disadvantages; therefore, the appropriate one must be
chosen according to the requirements and the information given in chapter 4. The main ideas
in designing and simulating an impulse test system were shown.
There were some problems in the measuring device that emerged when tests on electrical
insulators wanted to be performed. Therefore, the main objective of this Master’s Thesis
changed and focused on searching and solving the problem. After a thorough study and
conversations with engineers specialized in High Voltage Engineering, it was discovered that
the problems were caused by the measuring system. Actually, there is not any problem,
because these “interferences” does not affect to the parameters calculated in the test, but if
the standard wave-shape wants to be displayed, it will be necessary to replace the damaged
voltage divider with a new one.
Electromagnetic interferences also affect the low-voltage arm of the voltage divider due
to a bad contact; therefore the digital storage oscilloscope (DSO) input may be affected by
this effect.

116
116
The international standard IEC 60052 has been studied in depth in order to shown the way
how the calibration of the measuring system must be performed. As shown, it is possible to
obtain a linear function that links the peak voltage in the sphere-gap and the peak voltage
measured by the oscilloscope. It will assure accuracy in the results obtained.
In every High Voltage installation, it is necessary to comply with the law assessing risks at
the workplace. This part has been studied in depth showing the safety systems that already
exist in the Laboratory, and suggesting new ones to be implemented in the future in order to
make a safer workplace. It is recommended to enlarge the zone inside the Faraday cage in
order to permit tests using higher voltages, up to 500 kV.
Finally, a summary of the international standards applicable to electrical insulator tests
has been presented, what shows the first steps for future works in the High Voltage
Laboratory.

117
Chapter 11
Further work
Suggested further works may be:
• Adjustment of front and tail times of the generator’s waveform by means of
simulation and implement the findings in the real equipment of the Laboratory
according to international standards here depicted.
• As said, electromagnetic interferences (EMI) affect the normal behaviour of the
equipment. A study about how they affect and how to prevent them is a very
interesting future work.
• To perform the calibration of the laboratory equipment. With the information showed
in chapter 7 and the necessary equipment, a table of equivalences may be obtained,
which will permit to test elements with more accuracy.
• Implementation of a safety system using an optical sensor. Design of the control
electronic circuit and the best place to locate it in order to avoid human errors that
may be fatal in the High Voltage Laboratory.

118
118

119
Chapter 12
Conclusions
A wide knowledge of the High Voltage Laboratory is presented in this Master’s Thesis,
from theoretical fundamentals to application of the international standards. This work has
studied most of the possible future projects which may be carried out and set important
points such as the safety in a high-voltage installation or the solution to the problems with
the measuring device.
The practical part of this work has given a very useful experience in solving real problems
in electrical equipment and it has been collected in this work, so that it can be helpful in the
High Voltage Laboratory.
In short, this report presents a collection of the most important information necessary for
further works at the Laboratory, what will allow reaching deeper points of knowledge in High
Voltage Engineering.

120
120
121
Chapter 13
Glossary of terms
The most relevant terminology of this report is shown in this chapter. In every
engineering work, it is necessary to define the most important terms applicable in a proper
way.
A
accuracy: The degree of agreement between a measured value and the true value.
assured disruptive discharge voltage: The prospective value of the test voltage that causes
disruptive discharge under specified conditions.
B
breakdown voltage is the voltage at which the insulation between two conductors breaks
down. It is the minimum voltage that causes a portion of an insulator to become electrically
conductive. The electrical breakdown of an insulator due to excessive voltage can occur in
one of two ways: puncture voltage or flashover voltage.
C
chopped lightning impulse: A prospective full lightning impulse during which any type of
discharge causes a rapid collapse of the voltage.
chop time is the time interval between virtual origin and break down.
conventional deviation of the disruptive discharge voltage (z): The difference between
the 50% and 16% disruptive discharge voltages.
122
122
creepage distance: Shortest distance along the contours of the external surfaces of the
insulating parts of the post insulator between those parts which normally have the operating
voltage between them. However, to take account of the metal fittings attached to the post
insulator, the distance which in service conditions is covered by metal fittings is not included
in the creepage distance.
corona discharge is the discharge with slight luminosity produced in the neighbourhood of a
conductor, without greatly heating it, and limited to the region surrounding the conductor in
which the electric field exceeds a certain value [14].
cumulonimbus: heavy masses of cloud with great vertical development, the upper parts
having a fibrous appearance and often spreading out in the shape of an anvil. Associated with
violent vertical currents and thundery conditions.
D
design category: Post insulators of organic materials are divided into two different design
categories according to their construction. The design categories covered by this standard
are:
Design category A
Cylindrical post insulators with internal metal fittings in which the length of the shortest
puncture path through solid insulating material is equal to or greater than one-third the
external arcing distance between the metal fittings.
Design category B
Cylindrical post insulators with internal metal fittings in which the length of the shortest
puncture path through solid insulating material is less than one-third the external arcing
distance between the metal fittings.
The term “cylindrical insulators” is intended to cover insulators of the truncated conical
form.
dielectric loss factor: The factor by which the product of a sinusoidal alternating voltage
applied to a dielectric and the component of the resulting current having the same period as
the voltage have to be multiplied in order to obtain the power dissipated in the dielectric.
discharge: The passage of electricity through gaseous, liquid, or solid insulation.
disruptive discharge: A discharge that completely bridges the insulation under test,
reducing the voltage between the electrodes practically to zero. Syn: electrical breakdown.
disruptive discharge probability (p): The probability that one application of a prospective
voltage of a given shape and type will cause a disruptive discharge.
disruptive discharge voltage: The voltage causing the disruptive discharge for tests with
direct voltage, alternating voltage, and impulse voltage chopped at or after the peak; the
123
voltage at the instant when the disruptive discharge occurs for impulses chopped on the
front.
dry lightning impulse withstand voltage: Lightning impulse voltage which the dry post
insulator withstands under the prescribed conditions of test
50 % dry lightning impulse flashover voltage: Value of the lightning impulse voltage which
has a 50% probability of producing flashover on the dry post insulator under the prescribed
conditions of test.
duration of the wave-front (Rise time): The duration of the wave-front of an impulse
voltage is the total time occupied by the impulse-voltage in rising from zero to the peak
value. For the sake of convenience of measurement, the nominal value T1 of the duration of
the wave-front is defined as 1.25x the time interval between points on the wave-front where
the voltage is 10% and 90% of the peak value. T1 is expressed in microseconds
E
error: The difference between the measured value of a quantity and the true value of that
quantity under specified conditions.
external insulation: The air insulation and the exposed surface of the solid insulation of a
piece of equipment, which are subject to both electrical stress and the effects of
atmospheric and other conditions such as contamination, humidity, vermin, etc.
F
fifty percent disruptive discharge voltage (V50): The prospective value of the test voltage
that has a 50% probability of producing a disruptive discharge.
flashover: Disruptive discharge external to the insulator, and over its surface, connecting
those parts which normally have the operating voltage between them. The term “flashover”
used in this standard includes flashover across the insulator surface as well as disruptive
discharges by sparkover through air adjacent to the insulator.
full lightning impulse: A lightning impulse not interrupted by any type of discharge.
G
H

124
124
I
indoor post insulator. A post insulator not intended to be exposed to outdoor atmospheric
conditions. For indoor installations subject to excessive condensation, outdoor post insulators
or special indoor post insulators may be used.
impulse: An intentionally applied transient voltage or current that usually rises rapidly to a
peak value and then falls more slowly to zero.
instant of chopping: The instant when the initial discontinuity appears.
insulation coordination: The selection of the dielectric strength of equipment in relation to
the voltages which can appear on the system for which the equipment is intended and taking
into account the service environment and the characteristics of the available protective
devices. By “dielectric strength” of the equipment, is meant here its rated or its standard
insulation level as defined below.
internal insulation: Insulation comprising solid, liquid, or gaseous elements, which are
protected from the effects of atmospheric and other external conditions such as
contamination, humidity, vermin, etc.
J
K
L
lightning impulse: An impulse with front duration up to a few tens of microseconds.
M
N
nondisruptive discharge: A discharge between intermediate electrodes or conductors in
which the voltage across the terminal electrodes is not reduced to practically zero.
nonself-restoring insulation: Insulation that loses its insulating properties or does not
recover them completely after a disruptive discharge.
nonsustained disruptive discharge: A momentary disruptive discharge.
O
overshoot: The value by which a lightning impulse exceeds the defined crest value.

125
P
partial discharge: A discharge that does not completely bridge the insulation between
electrodes.
peak value of impulse voltages: The maximum value of impulses that are smooth double
exponential waves without overshoot.
post insulator of organic material: Post insulator intended to give a rigid support to a live
part which is to be insulated from earth and from another live part. The whole or part of the
material composing the post insulator consists of organic materials, i.e. of material
pertaining to the chemistry of the compounds produced from carbon or to the chemistry of
the compounds produced from carbon and silicon. These organic materials may be used alone
or in conjunction with other materials (mineral or organic) as fillers, reinforcements, etc.
p-percent disruptive discharge voltage (Vp): The prospective value of the test voltage that
has a p-percent probability of producing a disruptive discharge.
precision: The discrepancy among individual measurements.
prospective characteristics of a test voltage causing disruptive discharge: The
characteristics of a test voltage that would have been obtained if no disruptive discharge had
occurred.
puncture: A disruptive discharge passing through the solid insulating material of the insulator
which produces a permanent loss of dielectric strength.
A fragment breaking away from the rim of a shed or damage to the insulator due to the heat
of the surface discharge is not considered as a puncture.
Q
R
random error: Errors that have unknown magnitudes and directions and that vary with each
measurement.
root-mean-square (rms) value of alternating voltage: The square root of the mean value of
the square of the voltage values during a complete cycle.
S
self-restoring insulation: Insulation that completely recovers its insulating properties after a
disruptive discharge.
sparkover: A disruptive discharge between electrodes in a gas or liquid.

126
126
standard chopped lightning impulse: A standard lightning impulse chopped by an external
gap after 2 - 5 µs .
standard lightning impulse: A full lightning impulse having a virtual front time of 1.2 µs and
a virtual time to half-value of 50 µs.
surge: A transient voltage or current, which usually rises rapidly to a peak value and then
falls more slowly to zero, occurring in electrical equipment or networks in service.
switching impulse is a voltage impulse applied during dielectric tests complying with
standards, with a front duration of 0.1 to 0.3 ms, and a time to half value of a few
milliseconds [14].
switching impulse time to crest is the time interval between real origin and peak value of
the wave.
switching impulse half value is the time interval between real origin and 50 % of peak value
on the wave tail.
systematic error: Errors where the magnitudes and directions are constant throughout the
calibration process.
T
time to half value of the wave tail (Tail time) of an impulse voltage is the total time
occupied by the impulse-voltage in rising to peak value and declining from that place to half
the peak value of the impulse. For the sake of convenience, the nominal value T2 is
measured between the nominal starting point (virtual origin) of the wave and the point on
the wave-tail where voltage is one-half of the peak value. T2 is expressed in microseconds
(µs).
U
uncertainty: An estimated limit based on an evaluation of the various sources of error.
undershoot: The peak value of an impulse voltage or current that passes through zero in the
opposite polarity of the initial peak.
V
value of the test voltage for lightning impulse voltage: The peak value when the impulse
is without overshoot or oscillations.
value of the test voltage for an impulse is the peak value which can be read in the
oscilloscope.

127
virtual front time (T1) of an impulse is defined as time interval between 30 % and 90 % of
the peak value multiply by 1.67.
T1=1.67(T90-T30) (13.1)
virtual origin (01): The intersection with the time axis of a straight line drawn as a tangent
to the steepest portion of the impulse or response curve
virtual origin (O1) is the point where the straight line traced on 30 % and 90 % of the wave
front cut on X axis.
virtual time to half-value (T2): The time interval between the virtual origin and the instant
on the tail when the voltage has decreased to half of the peak value.
voltage at the instant of chopping: The voltage at the instant of the initial discontinuity.
voltage ratio of a voltage divider: The factor by which the output voltage is multiplied to
determine the measured value of the input voltage.
W
withstand voltage: The prospective value of the test voltage that equipment is capable of
withstanding when tested under specified conditions.

128
128

129
References
[1] A. Almeida do Vale: “Técnica das Altas Tensões (apontamentos)”, Faculdade de
Engenharia, Universidade do Porto, Portugal , 1997.
[2] António C. Sepúlveda Machado e Moura: “Técnicas de Alta Tensão (apontamentos)”,
Faculdade de Engenharia, Universidade do Porto, Portugal, 2002/03.
[3] Martin A. Uman: “Lightning”, McGraw-Hill, 1969.
[4] F. H. Kreuger: “Industrial High Voltage”, Volume 1 and 2, Delft University Press, 1991.
[5] Fink Micah: “How lightning works”. Available on-line:
http://www.pbs.org/wnet/savageplanet/03deadlyskies/01lforms/indexmid.html
Access on 30/May/2009.
[6] PBS Teachers: “Physics of Electrical Storms”. Available on-line:
http://library.thinkquest.org/03oct/00758/en/disaster/lightning/physics.html
Access on 30/May/2009.
[7] Vernon Cooray: “Energy dissipation in lightning flashes”, Institute of High Voltage
Research, University of Uppsala, Uppsala, Sweden, 1997. Available on-line:
http://www.agu.org/pubs/crossref/1997/96JD01917.shtml
[8] C. M. Pinto Oliveira, E. S. da Silva Ferraz, H. J. de Sousa Teixeira, T. F. Ferreira dos
Santos: “Descargas Atmosféricas”, Técnicas de Alta Tensão, Faculdade de Engenharia,
Universidade do Porto, Portugal, 2006.
[9] Vasco Fernandes Flores: “Relatório de Actividades do Novo Laboratório de Alta Tensão da
Faculdade de Engenharia da Universidade do Porto”, 2007.
[10] A. J. Neves de Sousa: “Simulação do Gerador de Choque de Alta Tensão”, Projecto
Seminário Trabalho Final de Curso, Faculdade de Engenharia, Universidade do Porto,
Portugal, 2006/07.
[11] Impulse Test System User’s Manual, Model IG 500-12.5, Serial Number 75-23474, Part
Number DS 25-242, Hipotronics, Inc.
[12] Capacitive Mixed Divider User’s Guide, Model CMD-500, Part Number AS45-326,
Hipotronics, Inc.
[13] Website of the Institute of Electrical and Electronics Engineers (IEEE). Available on-line:
http://www.ieee.org/
[14] IATE, The European Union’s multilingual term base. Available on-line:
http://iate.europa.eu/
130
130
[15] IEC 60052, Voltage measurement by means of standard air gaps, International
Electrotechnical Commission, Switzerland, 2002.
[16] 100 Series Impulse Generators, Instruction Manual, Hipotronics, 1992.
[17] A. I. Glendon, S. G. Clarke, E. F. McKenna: Human Safety and Risk Management. Taylor
& Francis Group, 2006.
[18] HSE (Health and Safety Executive): Five steps to risk assessment. United Kingdom, 2006.
[19] Henry W. Ott: Noise Reduction Techniques in Electronic Systems, Wiley-Interscience,
1988.
[20] Francisco Crespo: Sobretensiones en las redes de Alta Tensión, ASINEL, 1975.
[21] IEC 60273, Characteristics of indoor and outdoor post insulators for systems with nominal
voltages greater than 1000V, International Electrotechnical Commission, Switzerland,
1990.
[22] IEC 60060-1, High Voltage Test Techniques Part 1: General Definitions and Test
Requirements, International Electrotechnical Commission, Switzerland, 1989.
[23] IEC 60060-2, High Voltage Test Techniques Part 2: Measuring Systems, International
Electrotechnical Commission, Switzerland, 1994.
[24] IEC 60060-3, High Voltage Test Techniques Part 3: Definitions and Requirements for on-
site testing, International Electrotechnical Commission, Switzerland, 2006.
[25] D. Kind, K. Feser: High Voltage Test Techniques. Available on:
http://books.google.com/books?id=nHqQnSM71_cC&pg=PP1&dq=high+voltage+test+techn
iques+kind+feser&client=firefox-a&hl=es (Section 1.3.2). Access on 30/May/2009.
[26] IEEE Std 4-1995, Standard Techniques for High-Voltage Testing, Institute of Electrical and
Electronics Engineers, USA, 1995.
[27] IEC 60660, Insulators. Tests on indoor post insulators of organic material for systems with
nominal voltages greater than 1000 V up to but not including 300 kV, International
Electrotechnical Commission, Switzerland, 1999.
[28] P. L. Lewin, T. N. Tran, D. J. Swaffield, J. K. Hällström: Zero-Phase Filtering for
Lightning Impulse Evaluation: a K-factor Filter for the Revision of IEC60060-1 and -2.
[29] D. J. Swaffield, P. L. Lewin, N. L. Dao, J. K. Hällström: Lightning impulse wave-shapes:
defining the true origin and its impact on parameter evaluation.
[30] D. Kováč, I. Kováčová: Electromagnetic Coupling of the Electrocal Drive – EMC (Part II).
[31] AGARD, Advisory Group for Aerospace Research & Development: Electromagnetic
Interference and Electromagnetic Compatibility. NATO.
[32] EMC PARTNER AG Company Brochure, Designing and manufacturing portable test and
measurement equipment for lightning tests.
[33] D. Kováč, I. Kováčová: Electromagnetic Coupling of the Electrocal Drive – EMC (Part I).
[34] IEC 60071-1, Insulation coordination. Part 1: Definitions, principles and rules,
International Electrotechnical Commission, Switzerland, 1993.
[35] G. L. Ángel: OrCAD/PSpice Tutorial, 2003.
[36] Guía de Iniciación a la Herramienta OrCAD/PSpice, Departamento de Tecnología
Electrónica. Universidade de Vigo.
[37] Orcad Capture. User’s Guide, 2000.