High Voltage in Noble Liquids for High Energy...
64
High Voltage in Noble Liquids for High Energy Physics Edited by B. Rebel 1 , and C. Hall 2 , with contributions from E. Bernard 3 , C. H. Faham 4 , T. M. Ito 5 , B. Lundberg 1 , M. Messina 6 , F. Monrabal 7 , S. P. Pereverzev 8 , F. Resnati 9 , P. C. Rowson 10 , M. Soderberg 1,11 , T. Strauss 12 , A. Tomas 13 , J. Va’vra 10 , and H. Wang 14 1 Fermi National Accelerator Laboratory, Batavia, IL 60510, USA 2 University of Maryland, College Park, MD 20742, USA 3 Yale University, New Haven, CT 06520, USA 4 Lawrence Berkeley National Laboratory, Berkeley, CA 94720, USA 5 Los Alamos National Laboratory, Los Alamos, NM 87545, USA 6 Columbia University, New York, NY 10027, USA 7 IFIC, E-46980 Paterna, Spain 8 Lawerence Livermore National Laboratory, Livermore, CA 94550, USA 9 ETH Zurich, 8093 Zurich, Switzerland 10 SLAC National Accerlerator Laboratory, Menlo Park, CA 94025, USA 11 Syracuse University, NY 13210, USA 12 University of Bern, 3012 Bern, Switzerland 13 Imperial College London, SW7 2AZ London, UK 14 University of California Los Angeles, Los Angeles, CA 90095, USA March 13, 2014 Abstract A workshop was held at Fermilab November 8-9, 2013 to discuss the challenges of us- ing high voltage in noble liquids. The participants spanned the fields of neutrino, dark matter, and electric dipole moment physics. All presentations at the workshop were made in plenary sessions. This document summarizes the experiences and lessons learned from experiments in these fields at developing high voltage systems in noble liquids. Keywords: Noble liquid detectors, Time projection chambers, Dark Matter detectors, Neu- trino detectors, Neutron detectors 1 FERMILAB-CONF-14-050-PPD Operated by Fermi Research Alliance, LLC under Contract No. De-AC02-07CH11359 with the United States Department of Energy.
-
Upload
nguyenduong -
Category
Documents
-
view
215 -
download
0
Transcript of High Voltage in Noble Liquids for High Energy...
High Voltage in Noble Liquids for High Energy Physics
Edited by B. Rebel1, and C. Hall2, with contributions from E. Bernard3,C. H. Faham4, T. M. Ito5, B. Lundberg1, M. Messina6, F. Monrabal7,
S. P. Pereverzev8, F. Resnati9, P. C. Rowson10, M. Soderberg1,11, T. Strauss12,A. Tomas13, J. Va’vra10, and H. Wang14
1Fermi National Accelerator Laboratory, Batavia, IL 60510, USA2University of Maryland, College Park, MD 20742, USA
3Yale University, New Haven, CT 06520, USA4Lawrence Berkeley National Laboratory, Berkeley, CA 94720, USA
5Los Alamos National Laboratory, Los Alamos, NM 87545, USA6Columbia University, New York, NY 10027, USA
7IFIC, E-46980 Paterna, Spain8Lawerence Livermore National Laboratory, Livermore, CA 94550, USA
9ETH Zurich, 8093 Zurich, Switzerland10SLAC National Accerlerator Laboratory, Menlo Park, CA 94025, USA
11Syracuse University, NY 13210, USA12University of Bern, 3012 Bern, Switzerland
13Imperial College London, SW7 2AZ London, UK14University of California Los Angeles, Los Angeles, CA 90095, USA
March 13, 2014
Abstract
A workshop was held at Fermilab November 8-9, 2013 to discuss the challenges of us-ing high voltage in noble liquids. The participants spanned the fields of neutrino, darkmatter, and electric dipole moment physics. All presentations at the workshop were madein plenary sessions. This document summarizes the experiences and lessons learned fromexperiments in these fields at developing high voltage systems in noble liquids.
Keywords: Noble liquid detectors, Time projection chambers, Dark Matter detectors, Neu-trino detectors, Neutron detectors
1
FERMILAB-CONF-14-050-PPD
Operated by Fermi Research Alliance, LLC under Contract No. De-AC02-07CH11359 with the United States Department of Energy.

Contents
1 Introduction 3
2 Considerations of Fundamental Properties of Noble Liquids 42.1 Electron emission enhancement by positive ions on metal surface . . . . . . 4
2.1.1 Possible effects in liquid argon and xenon . . . . . . . . . . . . . . . 52.1.2 Comparison with effects observable in detectors . . . . . . . . . . . . 62.1.3 Avoiding problems by detector design . . . . . . . . . . . . . . . . . 7
2.2 Resistivity at Cold Temperatures . . . . . . . . . . . . . . . . . . . . . . . . 92.2.1 Summary of measurements . . . . . . . . . . . . . . . . . . . . . . . 92.2.2 Electrodless TPC . . . . . . . . . . . . . . . . . . . . . . . . . . . . . 9
3 EDM Experiments 123.1 SNS nEDM . . . . . . . . . . . . . . . . . . . . . . . . . . . . . . . . . . . . 12
3.1.1 Introduction . . . . . . . . . . . . . . . . . . . . . . . . . . . . . . . 123.1.2 High voltage requirements . . . . . . . . . . . . . . . . . . . . . . . . 133.1.3 General remarks on electrical breakdown in liquid helium . . . . . . 133.1.4 Research & Development (R&D) Approach . . . . . . . . . . . . . . 133.1.5 Medium scale high voltage test apparatus . . . . . . . . . . . . . . . 143.1.6 Progress to date . . . . . . . . . . . . . . . . . . . . . . . . . . . . . 16
4 Liquid Argon Neutrino and Dark Matter Experiments 164.1 MicroBooNE . . . . . . . . . . . . . . . . . . . . . . . . . . . . . . . . . . . 174.2 ArgoNeuT . . . . . . . . . . . . . . . . . . . . . . . . . . . . . . . . . . . . . 184.3 ARGONTUBE . . . . . . . . . . . . . . . . . . . . . . . . . . . . . . . . . . 21
4.3.1 Introduction . . . . . . . . . . . . . . . . . . . . . . . . . . . . . . . 214.3.2 ARGONTUBE detector . . . . . . . . . . . . . . . . . . . . . . . . . 224.3.3 High voltage breakdown measurements . . . . . . . . . . . . . . . . . 25
4.4 LBNE, CAPTAIN, and DarkSide . . . . . . . . . . . . . . . . . . . . . . . . 264.4.1 Physics requirements . . . . . . . . . . . . . . . . . . . . . . . . . . . 264.4.2 High Voltage Feedthroughs . . . . . . . . . . . . . . . . . . . . . . . 27
4.5 GLACIER/LBNO . . . . . . . . . . . . . . . . . . . . . . . . . . . . . . . . 294.5.1 The apparatus . . . . . . . . . . . . . . . . . . . . . . . . . . . . . . 304.5.2 Results . . . . . . . . . . . . . . . . . . . . . . . . . . . . . . . . . . 324.5.3 Conclusions From GLACIER . . . . . . . . . . . . . . . . . . . . . . 33
5 Liquid Xenon Experiments 335.1 The EXO-200 experiment . . . . . . . . . . . . . . . . . . . . . . . . . . . . 33
5.1.1 Introduction . . . . . . . . . . . . . . . . . . . . . . . . . . . . . . . 345.1.2 The Test Apparatus . . . . . . . . . . . . . . . . . . . . . . . . . . . 345.1.3 Measurements . . . . . . . . . . . . . . . . . . . . . . . . . . . . . . 365.1.4 Liquid Xenon Breakdown Field . . . . . . . . . . . . . . . . . . . . . 365.1.5 Surface Field Studies . . . . . . . . . . . . . . . . . . . . . . . . . . . 365.1.6 Dielectrics . . . . . . . . . . . . . . . . . . . . . . . . . . . . . . . . . 375.1.7 Photoelectric Effects . . . . . . . . . . . . . . . . . . . . . . . . . . . 37
2
FERMILAB-CONF-14-050-PPD
Operated by Fermi Research Alliance, LLC under Contract No. De-AC02-07CH11359 with the United States Department of Energy.

5.1.8 Conclusions and Future Plans . . . . . . . . . . . . . . . . . . . . . . 385.2 The LUX experiment . . . . . . . . . . . . . . . . . . . . . . . . . . . . . . . 38
5.2.1 Introduction . . . . . . . . . . . . . . . . . . . . . . . . . . . . . . . 385.2.2 High Voltage Limitations During Surface Operation . . . . . . . . . 395.2.3 High Voltage Limitations During Underground Operation . . . . . . 425.2.4 Tests Performed and Future Work . . . . . . . . . . . . . . . . . . . 43
5.3 The XENON experiment . . . . . . . . . . . . . . . . . . . . . . . . . . . . . 455.3.1 Introduction . . . . . . . . . . . . . . . . . . . . . . . . . . . . . . . 455.3.2 The high voltage experience of the XENON experiments . . . . . . . 455.3.3 R&D for the XENON experiments . . . . . . . . . . . . . . . . . . . 46
5.4 The LZ experiment . . . . . . . . . . . . . . . . . . . . . . . . . . . . . . . . 485.4.1 Introduction . . . . . . . . . . . . . . . . . . . . . . . . . . . . . . . 485.4.2 Cathode high voltage delivery in LZ . . . . . . . . . . . . . . . . . . 495.4.3 The LZ epoxy high voltage feed-through . . . . . . . . . . . . . . . . 505.4.4 The liquid argon high voltage test system for LZ . . . . . . . . . . . 515.4.5 LZ cathode wire R&D . . . . . . . . . . . . . . . . . . . . . . . . . . 52
5.5 The NEXT experiment . . . . . . . . . . . . . . . . . . . . . . . . . . . . . . 535.5.1 NEXT-100 High Voltage Requirements . . . . . . . . . . . . . . . . . 545.5.2 NEXT-DEMO . . . . . . . . . . . . . . . . . . . . . . . . . . . . . . 545.5.3 NEXT-DEMO feed-through . . . . . . . . . . . . . . . . . . . . . . . 555.5.4 NEXT-DEMO High Voltage Tests . . . . . . . . . . . . . . . . . . . 555.5.5 Conclusions . . . . . . . . . . . . . . . . . . . . . . . . . . . . . . . . 57
6 Lessons Learned and Summary 57
7 Acknowledgements 59
1 Introduction
Noble liquids provide ideal detection media for a wide range of particle physics applicationsranging from dark matter searches, to neutrino interaction and oscillation experiments, tosearches for electric dipole moments. Three noble liquids are the primary media used,helium, argon and xenon.
The liquid argon time projection chamber (TPC) is an advanced detector technologysuitable for large-scale neutrino and dark matter detectors. Particle interactions in liquidargon produce both atomic excitation and ionization leading to the creation of scintillationlight. With a uniform electric field in a liquid argon TPC, ionized electrons are driftedtoward segmented readout planes. The liquid argon TPC technique provides efficientparticle identification and background rejection via good dE/dx resolution and millimeterscale 3D precision particle tracking. A key concern of experiments using liquid argonTPCs to track charged particles is the purity of the argon with respect to electronegativeimpurities. These impurities attach to the ionization electrons before the electrons candrift to the readout causing diminished signals.
Experiments searching for dark matter make use of a two-phase liquid argon TPC wherescintillation light (S1) is detected via photodetectors and ionization electrons are drifted
3
FERMILAB-CONF-14-050-PPD
Operated by Fermi Research Alliance, LLC under Contract No. De-AC02-07CH11359 with the United States Department of Energy.

toward a gas phase, where they are converted into luminescent scintillation light (S2) andthe latter is detected by the same photodetectors. This technique offers millimeter scale3D position reconstruction and efficient background rejection via the S1 pulse shape andratio of the S2 to S1 signal. Liquid xenon TPCs use the same technique to search for darkmatter. All TPCs require electric fields on the order of 0.1− 1 kV/cm to drift the ionizedelectrons. For this reason, larger TPCs will require higher cathode voltages to maintainthe same electric field.
This document summarizes the contents of a workshop held at Fermilab November 8-9,2013 to discuss the challenges of using high voltage in noble liquids. The experiences ofseveral experiments in the electric dipole moment, neutrino and dark matter fields at de-veloping high voltage delivery mechanisms inside of noble liquid detectors were presented.This summary first high-lights important considerations based on properties of noble liq-uids, and then details the experiences of experiments in each of the mentioned areas. Thecontributors for each section are identified to allow readers to contact them for furtherinformation. A section high-lighting the important lessons learned based on the collectiveexperience is provided at the end of the document.
2 Considerations of Fundamental Properties of No-
ble Liquids
2.1 Electron emission enhancement by positive ions on metalsurface
Contributed by S. P. Pereverzev, Lawerence Livermore National Laboratory, Livermore,CA 94550, USA
For large detector sizes, even a moderate field in the drift region of the order 500 V/cmresults in a large potential difference between cathode and anode. Consequently, a highvoltage source, high voltage cable and feed-through are required to operate these detectors.In these components and in some regions inside of the detector the electric field can bemuch higher than the drift field in the active region or the amplification field in the gasregion. These high field regions and components are prone to high voltage breakdown. Thedetector and high voltage components must be designed to account for the mechanismsof secondary ion production inside of the detector because the enhancement of electronemission by positive ions is a strong effect.
The Malter effect was described 1937 [1]. An aluminum surface was first oxidizedelectrochemically and then covered with a monatomic layer of cesium oxide. When anelectron beam bombarded the surface in vacuum, the surface was charged positively dueto secondary electron emission. As a result the aluminum surface may emit an electroncurrent three orders of magnitude larger than the initial electron beam current. Thiscold emission can persist for some time after the initial electron beam is turned off. Thisexample illustrates that the effects of positive ions can be very strong.
Another effect can be observed with a thin natural oxide film on aluminum. Studying
4
FERMILAB-CONF-14-050-PPD
Operated by Fermi Research Alliance, LLC under Contract No. De-AC02-07CH11359 with the United States Department of Energy.
argon gas ionization detector with a aluminized Mylar film cathode, the authors of Ref. [2]observed sensitivity of the device to visible light when positive ions were present on thesurface of the aluminum cathode. In the absence of positive ions, visible light cannot causethe photoelectric effect from aluminum. Positive ions can be trapped on a metal surfacedue to the presence of a solid physisorbed film of a rare gas at cryogenic temperatures.Physisorbtion occurs because polarizable atoms are attracted to the metal surface. Fornoble gases, this attraction is weakest for helium and strongest for xenon. Formation ofup to 10 solid monolayers of physisorbed helium film on a solid hydrogen surface wasobserved in [3]. In this experiment, a mobility of electrons localized above the heliumfilm was monitored by capacitance technique. As the helium gas pressure increased atlow temperatures the thickness of equilibrium physisorbed helium film also increased. Themobility exhibited a maximum each time the top-most film layer was completely full. Theformation of several solid monolayers of physisorbed argon, krypton and xenon films oncold surfaces was observed by different methods. It is also well-studied that a monolayerof argon, krypton or xenon on metal surface can change the work function for the metal [4,5, 6]. Because positive ion mobility in solid rare gases is much lower than ion mobility inthe liquid or gas phases, positive ions will be trapped for some time in solid physisorbedlayers before they reach the metal surface and recombine with an electron. This trappingtime can be long, and the enhancement of the photoelectric effect can be significant.
In the above examples, the exact mechanisms leading to the electron emission enhance-ment are not known. The presence of positive ions as well as other impurities on a metalsurface can change the energies of electron states in a metal close to the surface. Thesechanges can alter the work function. For a large ion surface density, an average electricfield produced by ions works as an external electric field which facilitates a photoemissionand field emission. For a small ion concentration, the presence of a positive ion can lower atunneling barrier for an electron, increasing the escape probability for the electron. In thisway, the quantum efficiency of the photoelectric effect can be increased without loweringthe work function. There could be other scenarios of the electron emission enhancement,like resonant tunneling. An ion produces localized states for an electron under the tunnel-ing barrier, and the tunneling can be a two-stage process: from the metal to the localizedstate inside the barrier and then to an unbounded state outside of the metal and thedielectric film.
2.1.1 Possible effects in liquid argon and xenon
The presence of positive ions on a metal surface should cause an enhancement of thephotoelectric effect, either through a red shift of the spectrum or increase of the quantumefficiency in liquid argon and liquid xenon. Positive ions produce sites where the thresholdfor an electron tunneling out of the metal is locally lowered. This lowering of the thresholdshould produce enhancements of other electron emission processes such as field emission,thermal emission or emission caused by positive ion recombination on metal surface. Onecan expect a nonlinear increase of an electron emission with an increasing positive ionsurface density. One reason for this increase is that the collective electric field of ionspromotes the electron tunneling. The other reason is that with the rise of an ion surfacedensity not only does the number of recombination events increase, but also the probability
5
FERMILAB-CONF-14-050-PPD
Operated by Fermi Research Alliance, LLC under Contract No. De-AC02-07CH11359 with the United States Department of Energy.

for an energetic electron to escape from the surface due to the easy tunneling site createdby neighboring positive ions also increases. The ion recombination energy is sufficient forextraction of two electrons out of the metal, so chain events could be possible with theemission of several electrons at a time. Such events can be misinterpreted as low energyionization events in the detector. The combination of a strong electric field near the metalsurface with the presence of positive ions can lead to a non-linear increase of the fieldemission and photoemission. This combination can cause electric breakdowns or otherhigh voltage instabilities.
2.1.2 Comparison with effects observable in detectors
It is known that many of the existing large detectors are operating at lower voltages thaninitially targeted in detector design. Unfortunately, in most cases, a detailed descriptionof the difficulties and high voltage instabilities were never presented to the general pub-lic. Therefore, this discussion focuses on the Livermore dual-phase argon detector. Thisdetector has an approximately 200 ml active volume and was operated in a large rangeof gas amplification fields up to 11 kV/cm and drift fields up to 4 kV/cm, with the totalvoltage on cathode up to 30 kV and up to 24 kV voltage on an extraction grid 8 mm belowthe liquid-gas interface. Single electron sensitivity was achieved with amplification of 8photons detected by photomultiplier tubes (PMT) per each electron injected from liquidinto gas. The system demonstrated ∼ 20% energy resolution for 280 eV ionization events,indicating the detection of the 37Ar line. The goal was to measure the ionization yield oflow energy nuclear recoils directly in liquid argon.
When a solid copper cathode is used instead of a grid cathode, a 10% echo of the S2signals delayed by the time required for the electrons reaching the liquid surface from thecathode is observed. The high amplitude of the echo requires 2-3 orders of magnitudelarger quantum efficiency of the photoelectric effect from copper into liquid argon thanthe known efficiency of the effect from copper into vacuum for the same photon energy asargon scintillation photons. This large efficiency can be due to the presence of positiveions.
The dependence of the breakdown voltage of the cathode voltage lead on the gas am-plification voltage has also been observed. This problem can be overcome by covering thenegative tip of the feed-through with a plastic shrinkable tubing. Likely, large UV produc-tion in the gas during strong events, such as from cosmic ray muons, was triggering thebreakdown on the feed-through.
A stable operation of the detector for a high amplification level was achieved only aftercovering a metal extraction grid frame with Teflon. Doing so means only the grid wireswere exposed to UV radiation from the gas region. Without this cover the detector wasprone to developing a glowing discharge, when the voltage on the grids was stable anddischarge current was below 0.1 mA. After discharge ignition, it was possible to removethe drift field and observe a glowing discharge. It was concluded that the electron emissionfrom the extraction grid and the grid frame was playing the major role to provide secondaryelectron emission, not the cathode grid. It is not known what process is limiting current inthis discharge. Possibly, positive ions are eventually discharging on the metal surface, whilethe production rate of secondary positive ions in high field regions around anode wires is
6
FERMILAB-CONF-14-050-PPD
Operated by Fermi Research Alliance, LLC under Contract No. De-AC02-07CH11359 with the United States Department of Energy.
low. The ion surface concentration also could be limited by a strong recombination ratedependence on a surface ion concentration.
At high amplification, that is high voltage on the extraction grid, a several millisecondslong photon train was observed after some strong ionization events. These photon trainswere observable also without a drift field in liquid, which means they originated on theextraction grid. The electric field around the extraction grid wires in the detector is higherthan the field around the cathode grid wires and a possible explanation could be that forcertain strong events a high positive ion concentration on some wires is obtained when athin liquid layer above extraction grid is ionized. This situation can result in a non-linearincrease in electron field emission similar to the Malter effect, or a non-linear increase inefficiency of the electron emission due to ion recombination on the metal surface. Similarphoton trains were observed in the Russian Emission Detector (RED) xenon detector inMoscow [7]. This detector does not have an extraction grid, but has a strong electric fieldon the cathode wires.
The total ionization load results in an increase of rate of low energy background events.These low energy events can be due to simultaneous emission of several electrons in chainsurface recombination events, as discussed before. An alternative explanation of the fewelectron events could be resonance tunneling; while positive ions drift toward metal surfacethrough a thin solid layer, the resonant tunneling conditions are produced at some ion posi-tion, and a burst of electron emission takes place. Large xenon detectors also demonstratean increase in low-energy background events with fewer than 7 primary electrons in theirspectra [8] with no obvious reason for the increase in the number of events in a low energypart of the spectrum.
2.1.3 Avoiding problems by detector design
It should be possible to avoid or compensate for these adverse effects on high voltagestability, in the case of dark matter searches, and on the low energy background. Thebest approach for doing so is to investigate the mentioned phenomena in detail in directexperiments. Even without such experiments, some recommendations for detector designcan be formulated. An experimental test of high voltage components stability in a liquid orgas in absence of positive ions and UV radiation does not guarantee a stable operation ofthose components in the detector. Ideally, one would avoid having a strong electric field,positive ions and UV radiation near a metal surface anywhere in a liquid or gas insideof the detector. It is impossible to avoid a high field, positive ions and UV light on acathode and on the extraction grid. Still, there are several possible ways to lower positiveion concentration on the wire surface.
Positive ion mobility in a solid increases nonlinearly with an electric field, such thatthe positive ion trapping time on the thin solid film decreases nonlinearly with the fieldstrength. Moreover, one should expect an electric breakdown in this thin solid film at somevoltage. This phenomenon limits the maximum ion surface density on a solid helium film,for example. A solid helium film on a metal surface in liquid helium starts to conductcurrent for the voltage drop at about 50 V. Taking into account a small film thickness,this voltage corresponds to a rather high electric field strength that is far higher than 50kV/cm. For argon and xenon detectors, there could be an optimum cathode wire thickness
7
FERMILAB-CONF-14-050-PPD
Operated by Fermi Research Alliance, LLC under Contract No. De-AC02-07CH11359 with the United States Department of Energy.

Figure 1: Possible design for a large dielectric cryostat.
where the strong electric field decreases the lifetime of trapped positive ions, while it isnot large enough to cause strong field emission. Interestingly, the application of a strongAC electric field activates ion mobility more efficiently than application of a strong DCelectric field. The ion trapping time can be shortened by an application of a strong ACelectric field between cathode wires in addition to a DC drift field. Application of this ACfield will not change the ion and electron drift patterns in the regions away from the grid.
It may be possible to avoid the problems mentioned above using a dielectric cryostat,such as that shown in Fig. 1, where the only high electric field inside the detector iscontained in a small volume around the cathode, anode, and extraction grids. Using sucha design it should be possible to produce an amplification electric field with magnitude of10 kV/cm in gas and between 0.1 − 10 kV/cm in liquid, even for a large liquid volumeof 10 m or more in height. The total potential difference between the cathode and anodecould reach up to 1 MV or more. This design does not require using a high voltage cableor feed-through to bring the high voltage to the cathode in the liquid. It is likely thatsuch a large dielectric cryostat for a DM detector will require development effort to findcomposite polymer structural materials that have low levels of radioactive impurities andsufficiently inert polymer material, such as Teflon, to line the inside of the liquid reservoirto avoid diffusion of organic impurities into the high purity liquid argon or xenon fromthe dielectric walls. The thick outer walls of the cryostat need to hold high voltage, butthey do not need to be made of low out gassing materials or have extremely low levelsof radioactivity. Thus, having two electrostatic cages helps ease the requirements on thematerials used for the cryostat. The covering the inner field cage with Teflon would alsostop ultraviolet radiation originating in the gas amplification region. The Teflon surface
8
FERMILAB-CONF-14-050-PPD
Operated by Fermi Research Alliance, LLC under Contract No. De-AC02-07CH11359 with the United States Department of Energy.

would charge until the electric field component normal to the surface vanishes. The closepotential distribution on the field cage resembles a linear potential drop, where a smallercharge surface density is required to nullify the normal field component. The probability forcharges to move along the surface due to the presence of a tangential electric field decreaseswith decreasing surface charge density and residual events caused by charge trapping andreleased by the Teflon walls can be geometrically rejected.
The effects of positive ions on metal surfaces is in need of theoretical models, anddirect experimental determination of probabilities of electron emission and simultaneousemission of several electrons as a function of electric field and ion surface density arerequired. High voltage stability of large detectors and the non-radioactive part of lowenergy backgrounds are related to those effects. To understand the limits of operation ofdirect dark matter ionization detectors, knowledge of the effects caused positive ions is asimportant as knowledge of ionization efficiency by low energy nuclear recoils.
2.2 Resistivity at Cold Temperatures
Contributed by J. Va’vra, SLAC National Accerlerator Laboratory, Menlo Park, CA 94025,USA
2.2.1 Summary of measurements
The resistivity of various insulators at very low temperatures has been measured [9] and issummarized in Table 1. Many samples, which have a low resistivity at room temperature,show an exponential resistivity increase by approximately 9 orders of magnitude as one goesfrom room to liquid nitrogen temperatures as shown in Fig. 2. Samples such as Raychemshrinkable tubing, Semitron ESd 490 and PEEK Krefine EKH-SS11 have a relatively lowvolume resistance at liquid xenon temperature (−109C). Many of the lower resistivitysamples are loaded by carbon. Several of them show a constant resistivity between roomtemperature and liquid nitrogen temperature as seen in Fig. 3. Among lower resistivitysamples, there is none, which would replace Teflon in terms of the photon reflectivity. Manysamples, such as Teflon, polyethylene, and acrylic have a volume resistance of more than4× 1018Ωcm already at room temperature. Assuming a similar temperature dependence,their resistance may approach a value of ρ ∼ 1027Ωcm at liquid nitrogen temperature.More study is needed to find slightly more conducting material, which is as reflective asTeflon. One should also investigate if Teflon is not shedding its polymer-chain fragments,coating cathode wire surfaces. In the past Teflon tubing was to be avoided as it wouldincrease the wire aging rate [10]. It is assumed that Teflon coated cathode wires with aninsulator triggered the Malter electron emission by approaching ions. This assumptionneeds to be studied in noble liquid TPCs as well.
2.2.2 Electrodless TPC
The Allison paper [11] was the first to show the importance of positive ions in the TPCelectric field uniformity. Their simulation shows that the TPC field has ripples initially
9
FERMILAB-CONF-14-050-PPD
Operated by Fermi Research Alliance, LLC under Contract No. De-AC02-07CH11359 with the United States Department of Energy.

Figure 2: Volume resistivity of insulator materials as a function of temperature.
when there are no free charges on the surface. Once the positive charge is introduced,ripples are removed, and the deposition of positive ions is self-limiting. Allison used fiberglass boards with volume resistivity of about 3×10¹⁷Ωcm and surface resistivity of approx-imately 1015Ω/cm2. The charging time constant was a few seconds. The question is whattime constants are in a structure where there is no amplification to produce positive ions,it is located deeply underground, and uses Teflon with a volume resistivity of 8 orders ofmagnitude higher than G-10. The ion deposition will be driven by the radioactive sourcecalibration. Will it distort the drift field? This question needs to be studied in detail witha laser.
Figure 3: The resistivity of carbon-loaded plastics are nearly constant betweenroom temperature and liquid nitrogen temperatures.
However, one can ask a different question: could one use a carbon-loaded plastic to
10
FERMILAB-CONF-14-050-PPD
Operated by Fermi Research Alliance, LLC under Contract No. De-AC02-07CH11359 with the United States Department of Energy.

Table 1: Volume resistivity measurements at room (20C), liquid nitrogen(−196.4C), and liquid xenon (−109C) temperatures. All values are in unitsof [Ωcm].
Sample Material 20C −196.4C −109C1 Semitron ESd 500 (PTFE) (0.29 inch-thick) 7.5× 10¹⁰ 1018 ≥ 1018
2 Pomalux SD-A natural (0.092 inch-thick) 3.8× 10¹² 1018 1018
3 Semitron ESd 225 (0.052 inch-thick) 8.0× 10¹⁰ 1018 1018
4 Mycalex sheet (0.130 inch-thick) 5× 10¹¹ ∼ 1.5× 10¹⁷ -5 Bakelite sheet (0.080 inch-thick) 1.0× 10¹² ∼ 1.5× 10¹⁷ -6 Raychem shrinkable tubing from CRID days (0.050 inch-thick) 1.9× 10¹² ∼ 1× 10¹⁵ ∼ 3.5× 10¹⁴
7 Teflon PTFE (0.030 inch-thick) - from EXO exp. > 4× 10¹⁸ 1018 1018
8 Fused silica sheet (0.125 inch-thick) ∼ 2.2× 10¹⁸ 1018 1018
9 Mylar (0.005 inch-thick) ∼ 2.1× 10¹⁸ 1018 1018
10 Acrylic sheet used in EXO test (0.057 inch-thick) ∼ 4.0× 10¹⁸ 1018 1018
11 Raychem, RNF-100-4-BK-STK (0.023 inch-thick) ∼ 7× 10¹⁸ 1018 1018
12 Semitron ESd 490HR (0.046 inch-thick) (carbon-loaded) 2.6× 10¹⁰ > 1018 ∼ 5.2× 10¹⁵
13 PEEK Krefine EKH-SS11 (0.042 inch-thick) (carbon-loaded) 8.6× 10⁹ > 1018 1015
14 Raychem, MWTM-115/34-1500/U (0.04 inch-thick) > 6× 10¹⁷ 1018 -15 Rexolite (0.035 inch-thick) > 3× 10¹⁸ 1018 1018
16 PVC (0.043 inch-thick) > 3× 10¹⁸ 1018 1018
17 LDPE (0.039 inch-thick) > 3× 10¹⁸ 1018 1018
18 TIVAR 1000 ESD & EC (0.046 inch-thick) (carbon-loaded) 107 − 108 107 − 108 107 − 108
19 Delrin (0.041 inch-thick) ∼ 5.8× 10¹⁶ 1018 1018
20 Polycarb (0.041 inch-thick) > 3× 10¹⁸ 1018 1018
21 Polypro (0.044 inch-thick) > 3× 10¹⁸ 1018 1018
22 Ultem (0.040 inch-thick) > 3× 10¹⁸ 1018 1018
23 Peek (0.043 inch-thick) > 3× 10¹⁸ 1018 1018
24 Teflon (0.041 inch-thick) > 3× 10¹⁸ 1018 1018
25 Acrylic (0.040 inch-thick) > 3× 10¹⁸ 1018 1018
26 Cast-33 glue (cure 26, TFE) (0.064 inch-thick) 7.8× 10¹² 1018 1018
27 Insul Cast-502 (cure 26,TFE) (0.063 inch-thick) 1.5× 10¹⁶ - -28 Lord-340 glue cast (#70, 100-8) 1.3× 10¹⁵ 1018 1018
29 CLR-1066/CLH 6330/TEE glue cast 7× 10¹⁵ - -30 CAST-502 clear clue, Insulcure-26, BYK-A-500 6.4× 10¹⁶ - -31 Hysol Dexter glue cast (0.057 inch-thick) 2.5× 10¹⁵ 1018 1018
32 Sample 2 - unspecified glue cast (0.059 inch-thick) 2.1× 10¹⁵ - -33 Sample 3 - unspecified glue cast (0.062 inch-thick) 1.0× 10¹⁶ - -34 Sample 4 - unspecified glue cast (0.059 inch-thick) 3.3× 10¹⁵ - -35 PTFE + 25% Carbon - 3M CC100-952 (0.032 inch-thick) 3.4× 10⁵ 1.93× 10⁵ -36 PTFE + 1.5% Carbon - 3M CC100-949 (0.067 inch-thick) 1.46× 10⁷ 1.09× 10⁸ -
produce an electrodeless TPC operating at liquid xenon temperature? A TPC made ofa 1 m-long, 1 cm-thick, 1 m-radius cylinder using material #13 in Table 1, would draw∼ 0.6 nA at 100 kV; one would have to increase the carbon content to get the right currentto prevent distortions, while preventing heating of the liquid. A benefit of such a designis that it would eliminate a resistor chain and the electrode grid, and provide a uniformnon-localized heating.
11
FERMILAB-CONF-14-050-PPD
Operated by Fermi Research Alliance, LLC under Contract No. De-AC02-07CH11359 with the United States Department of Energy.
3 EDM Experiments
3.1 SNS nEDM
Contributed by T. M. Ito, Los Alamos National Laboratory, Los Alamos, New Mexico87545, USA in collaboration withD. H. Beck, University of Illinois, Urbana, Illinois 61801, USA,S. M. Clayton, S. A. Currie, W. C. Griffith, J. C. Ramsey, A. L. Roberts, Los AlamosNational Laboratory, Los Alamos, New Mexico 87545, USA,C. Crawford, University of Kentucky, Lexington, Kentucky 40506, USA,R. Schmid, California Institute of Technology, Pasadena, California 91125, USA,G. M. Seidel, Brown University, Providence, Rhode Island 02912, USA,D. Wagner, University of Kentucky, Lexington, Kentucky 40506, USA,W. Yao, Oak Ridge National Laboratory, Oak Ridge, Tennessee 37831, USA
3.1.1 Introduction
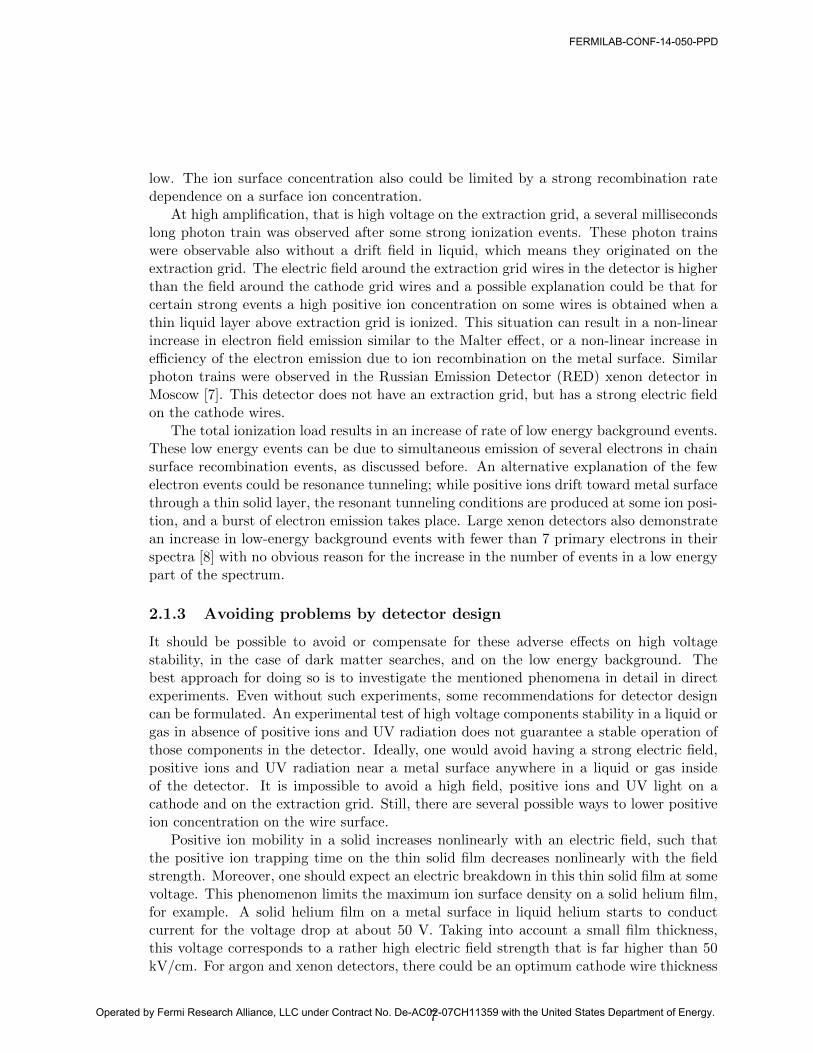
A nonzero permanent electric dipole moment (EDM) of a nondegenerate state of a systemwith spin J 6= 0 violates time reversal invariance as well as invariance under parity op-eration. The time reversal invariance violation implies a CP violation through the CPTtheorem. Given the smallness of the standard model CP violating contributions inducedby quark mixing, an EDM is a sensitive probe of new physics. A new experiment to searchfor the permanent EDM of the neutron, SNS nEDM [12], based on the method proposedby Golub and Lamoreaux [13], is being developed to be mounted at the Spallation NeutronSource at Oak Ridge National Laboratory, with a sensitivity goal of ∼ 5× 10⁻²⁸ e·cm, animprovement of roughy two orders of magnitude over the current limit [14]. A schematicof the apparatus for the SNS nEDM experiment is shown in Fig. 4.
Figure 4: A schematic of the apparatus for the SNS nEDM experiment, as iscurrently designed
12
FERMILAB-CONF-14-050-PPD
Operated by Fermi Research Alliance, LLC under Contract No. De-AC02-07CH11359 with the United States Department of Energy.

3.1.2 High voltage requirements
The SNS nEDM experiment requires that a high, stable electric field of approximately75 kV/cm be applied in the region inside the two measurement cells that are sandwichedbetween electrodes. The measurement cells and electrodes are immersed in 0.4 K liquidhelium. The measurement cells, which store ultracold neutrons, are filled with isotopicallypure liquid 4He at 0.4 K with the relative 3He concentration of 10−10. The measurementcells are made of PMMA and are 10.16 cm× 12.70 cm × 42 cm in outer dimension witha wall thickness of 1.2 cm. The electrodes, roughly 10 cm × 40 cm× 80 cm in size, aremade of PMMA coated with a material that needs to meet various requirements related toelectrical resistivity, neutron activation properties, and magnetic properties. The leakagecurrent along the cell walls need to be minimized.
3.1.3 General remarks on electrical breakdown in liquid helium
Electrical breakdown in liquid helium, or more in general electrical breakdown in anydielectric liquid, is rather poorly understood. Data exist on electrical breakdown in liquidhelium for temperatures of 1.2− 4.2 K, with the bulk of data being taken at 4.2 K, mostlyat the saturated vapor pressure (SVP) for various electrode geometries, including sphere-to-sphere, sphere-to-plane, and plane-to-plane. However, there is little consistency amongthe data, and therefore there is no consistent theoretical interpretation.
However, a rather simple consideration of the mean free path of ions in liquid heliumand the electric field strength necessary to accelerate them to an energy sufficiently high togenerate subsequent ionization leads to a conclusion that the intrinsic dielectric strengthof bulk liquid helium is greater than 10 MV/cm, a field much higher than breakdown fieldsexperimentally observed. This leads to the following generally-accepted picture for themechanism of generation of electrical breakdown in liquid helium:
1. A vapor bubble is formed on the surface of the electrode, e.g. by field emission fromroughness on the cathode
2. The vapor bubble grows, presumably by heating of the gas by accelerated electronsand evaporation of the liquid as a result, and forms a column of gas reaching fromone electrode to the other
3. Electrical breakdown occurs through the gas column
It follows that the parameters that can affect the breakdown field strength include: (i)electrode material, in particular the surface properties,and (ii) liquid helium temperatureand pressure. In addition, because electrical breakdown is a stochastic process, the size ofthe system affects the breakdown field strength and its distribution [15].
3.1.4 Research & Development (R&D) Approach
The consideration given above indicates that the R&D for the SNS nEDM experimentrequires a study of electrical breakdown in liquid helium in a condition (i.e. temperature,pressure, size) as close as possible to that expected for the SNS nEDM experiment, usingsuitable candidate materials.
13
FERMILAB-CONF-14-050-PPD
Operated by Fermi Research Alliance, LLC under Contract No. De-AC02-07CH11359 with the United States Department of Energy.

It is also very important to study the effect of the presence of a dielectric insulatorsandwiched between electrodes, as such will be the geometry for the SNS nEDM experi-ment. Note that even in a room temperature vacuum system, electric fields exceeding afew 100 kV/cm are possible when there is no insulator between the two electrodes. In astudy performed using a room temperature vacuum aparatus [16] similar to those usedin the previous nEDM experiments, such as Ref. [14], the electric field was limited to∼ 30 kV/cm due to the presence of the UCN confining wall that was sandwiched betweenthe two electrodes [16, 17]. Field emission at the cathode-insulator junction is thoughtto be responsible for initiating breakdown [18], which is expected to be suppressed atcryogenic temperatures.
In order to study the relevant aspects of electrical breakdown in liquid helium witha goal of establishing the feasibility of the SNS nEDM experiment as well as guiding thedesign of the apparatus, an apparatus called the Medium Scale High Voltage (MSHV) TestApparatus was constructed and is described below.
Figure 5: A schematic of the MSHV system for the SNS nEDM experiment.
3.1.5 Medium scale high voltage test apparatus
The purpose of the MSHV system is to study electrical breakdown in liquid helium ina condition approximating that of the SNS nEDM experiment using suitable electrodecandidate materials. The lowest operating temperature of the MSHV system is designedto be 0.4 K, corresponding to the operating temperature of the SNS nEDM experiment.Since it is expected that the pressure is an important parameter affecting the breakdownfield strength in liquid helium, the MSHV system is designed so that the pressure of theliquid helium volume in which the electrodes are placed can be varied between the SVP and1 atm. Note that the SVP is approximately 10−6 torr at 0.4 K. The size of the liquid heliumvolume was determined as a compromise between the following two competing factors: i)short turnaround time of the system to allow multiple electrode material candidates to betested, and ii) size large enough to give information relevant for the SNS nEDM experiment.
14
FERMILAB-CONF-14-050-PPD
Operated by Fermi Research Alliance, LLC under Contract No. De-AC02-07CH11359 with the United States Department of Energy.
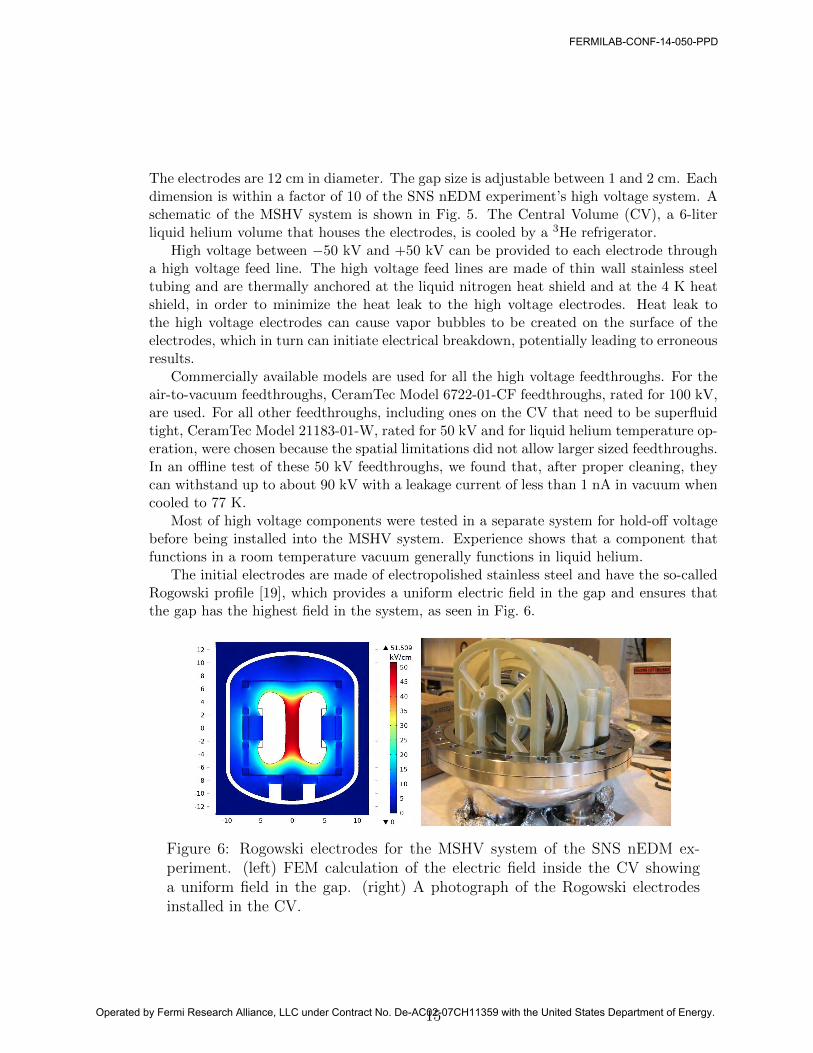
The electrodes are 12 cm in diameter. The gap size is adjustable between 1 and 2 cm. Eachdimension is within a factor of 10 of the SNS nEDM experiment’s high voltage system. Aschematic of the MSHV system is shown in Fig. 5. The Central Volume (CV), a 6-literliquid helium volume that houses the electrodes, is cooled by a 3He refrigerator.
High voltage between −50 kV and +50 kV can be provided to each electrode througha high voltage feed line. The high voltage feed lines are made of thin wall stainless steeltubing and are thermally anchored at the liquid nitrogen heat shield and at the 4 K heatshield, in order to minimize the heat leak to the high voltage electrodes. Heat leak tothe high voltage electrodes can cause vapor bubbles to be created on the surface of theelectrodes, which in turn can initiate electrical breakdown, potentially leading to erroneousresults.
Commercially available models are used for all the high voltage feedthroughs. For theair-to-vacuum feedthroughs, CeramTec Model 6722-01-CF feedthroughs, rated for 100 kV,are used. For all other feedthroughs, including ones on the CV that need to be superfluidtight, CeramTec Model 21183-01-W, rated for 50 kV and for liquid helium temperature op-eration, were chosen because the spatial limitations did not allow larger sized feedthroughs.In an offline test of these 50 kV feedthroughs, we found that, after proper cleaning, theycan withstand up to about 90 kV with a leakage current of less than 1 nA in vacuum whencooled to 77 K.
Most of high voltage components were tested in a separate system for hold-off voltagebefore being installed into the MSHV system. Experience shows that a component thatfunctions in a room temperature vacuum generally functions in liquid helium.
The initial electrodes are made of electropolished stainless steel and have the so-calledRogowski profile [19], which provides a uniform electric field in the gap and ensures thatthe gap has the highest field in the system, as seen in Fig. 6.
Figure 6: Rogowski electrodes for the MSHV system of the SNS nEDM ex-periment. (left) FEM calculation of the electric field inside the CV showinga uniform field in the gap. (right) A photograph of the Rogowski electrodesinstalled in the CV.
15
FERMILAB-CONF-14-050-PPD
Operated by Fermi Research Alliance, LLC under Contract No. De-AC02-07CH11359 with the United States Department of Energy.

3.1.6 Progress to date
The MSHV system was successfully constructed and commissioned. The CV can be cooledto 0.4 K with it filled with liquid helium, and the pressure inside the CV can be variedand controlled easily.
Achievable field was limited by the performance of the HV leads
Figure 7: Electric field strength achieved in liquid helium for a 1 cm gap betweentwo electropolished stainless steel electrodes 12 cm in diameter. Note that theachievable field was limited by the performance of the high voltage leads. Thehydrolic pressure of liquid helium is ∼ 0.1 torr/cm
In addition, an electric field exceeding 100 kV/cm can be stably applied in a 1-cmgap between the two 12-cm diameter electrodes made of electropolished stainless steelfor a wide range of pressures, as seen in Fig. 7. The achievable field was limited by theperformance of the high voltage leads. No breakdown was observed in the gap betweenthe two electrodes. Also the leakage current between the two electrodes was measured tobe less than 1 pA at a 50 kV potential difference. This current was measured with one ofthe high voltage electrodes set to the ground potential to avoid the leakage current in thehigh voltage cable and feedthroughs dominating the measurement.
4 Liquid Argon Neutrino and Dark Matter Ex-
periments
In this section we review the high voltage experience of several working liquid argon ex-periments (MicroBooNE, ArgoNeuT, LBNE, DarkSide, and GLACIER), as well as R&Din preparation for new large-scale experiments (ARGONTUBE and CAPTAIN).
16
FERMILAB-CONF-14-050-PPD
Operated by Fermi Research Alliance, LLC under Contract No. De-AC02-07CH11359 with the United States Department of Energy.

4.1 MicroBooNE
Contributed by B. Lundberg, Fermi National Accelerator Laboratory, Batavia, IL 60510,USA for the MicroBooNE Collaboration
The MicroBooNE experiment at Fermilab is assembling a 170 ton, 70 ton fiducial, liquidargon TPC that will be installed at the Liquid Argon Test Facility (LArTF) site in theBooster Neutrino Beam. This TPC must efficiently drift electrons created from particletracks and collect them on wires up to 2.5 m away from their source. To do so requiresa drift electric field with a magnitude of 300 to 500 V/cm generated by a high potentialapplied at one side of the TPC active volume. In MicroBooNE this cathode plane andthe rectangular TPC assembly are located within the cylindrical volume of the cryostat.Hence there are locations at high potential, near the corners of the TPC framework, thatare places of concern for operating at the highest applied voltages. The literature onliquid dielectrics is extensive and provides general guidance for design. However, the wideranging conditions with very specific intended uses renders predictions of exact behaviorsin the MicroBooNE system ambiguous. The operating condition in MicroBooNE is terraincognita for particle physics detectors, and no guarantee exists for the successful operationwith the highest voltages.
-HVmotordrive
bellows ~100mm
Figure 8: A schematic of the top of the MicroBooNE liquid argon test cryostatshowing the movable feedthrough, bellows and motor drive. The electrodes aremounted below and not shown here.
It is clearly not practical to study the effects of high voltage dielectric breakdown withinthe actual TPC and cryostat assemblies before filling the cryostat at the LArTF. Instead,a smaller, dedicated cryostat will be placed at the LArTF to contain a a few hundredliters of liquid argon, in which tests will be conducted to ascertain with some precision theproperties of the dielectric cryogenic liquid. This dewar will be connected to the LArTF
17
FERMILAB-CONF-14-050-PPD
Operated by Fermi Research Alliance, LLC under Contract No. De-AC02-07CH11359 with the United States Department of Energy.

purification and circulation system and provided with a purity monitor to determine thedrift lifetime of the electrons. The proposed studies include understanding dielectric failurewith respect to electrode surface quality, electrode geometry and liquid argon purity. Thetests are designed to provide generic and useful information for future TPC design, butalso to address MicroBooNE-specific design issues.
At the LArTF, the “test cryostat” will be installed and plumbed at the end of thefull cryogenic system. The outlet of the test cryostat feeds into a purity monitor. Thecommercially-built cryostat has an 880 liter capacity. Inside the cryostat volume, a highvoltage feedthrough charges interchangeable stainless spherical electrodes which are sus-pended above a flat stainless plate electrode at ground. The distance between electrodescan be varied accurately from 0 mm, or contact, to 100 mm. The high voltage powersupply is capable of 150 kV.
The testing apparatus consists three main parts: i) a free-standing cryostat to containliquid argon, ii) the high voltage feed-through and power supply to provide the highpotential to the iii) electrodes which have an accurately maintained distance betweenthem. There are two complications to an otherwise very simple design. First, the feed-through must be easily extracted and the electrode at its end changed-out then reinserted.Secondly, the feed-through must be mounted to a carefully controlled, vertically movingassembly so that the distance between the two electrodes can be varied in a reproducibleway. The feed-through and grounded plate electrode are mounted, aligned and tested priorto attaching the top section to the main part of the cryostat. A schematic of the top ofthe test system is shown in Figure 8.
The tests to be performed include i) measuring breakdown voltage as a function ofelectrode size and shape as well as argon purity, ii)l ooking for corona from current/currentpulses and onset of breakdown, and iii) dielectric constant measurements. These tests willbe conducted before the large MicroBooNE TPC and cryostat are installed at LArTF inMarch 2014.
4.2 ArgoNeuT
Contributed by M. Soderberg, Fermi National Accelerator Laboratory, Batavia, IL 60510,USA and Syracuse University, Syracuse, NY 13210, USA
The ArgoNeuT experiment featured a LArTPC with inner dimensions of 40 cm (height)× 90 cm (length) × 47.5 cm (width). Photographs of the TPC are shown in Fig. 9. Themaximum drift distance of 47.5 cm from the cathode to the innermost anode plane, andthe desired drift electric-field of 500 V/cm, make the required high-voltage 23750 V, or≈25 kV. Neighboring stages within the TPC field cage were connected by four 100 MΩresistors arranged in parallel. The resistance of the TPC, and an external high voltagefilter that was located in series with the TPC, was 670 MΩ.
The feed-through that brings high voltage from the outside to the inside of the cryostatwas constructed by inserting a solid stainless steel (SS) rod with 5/8 inch outer diameterinto a high density polyethylene (HDPE) tube that had been bored out to 0.58 inches. Thepressure required to complete this insertion forms a seal that is leak tight. The outside faceof the HDPE tube is machined to 1.345 inches in diameter at the upper, warm end, while
18
FERMILAB-CONF-14-050-PPD
Operated by Fermi Research Alliance, LLC under Contract No. De-AC02-07CH11359 with the United States Department of Energy.
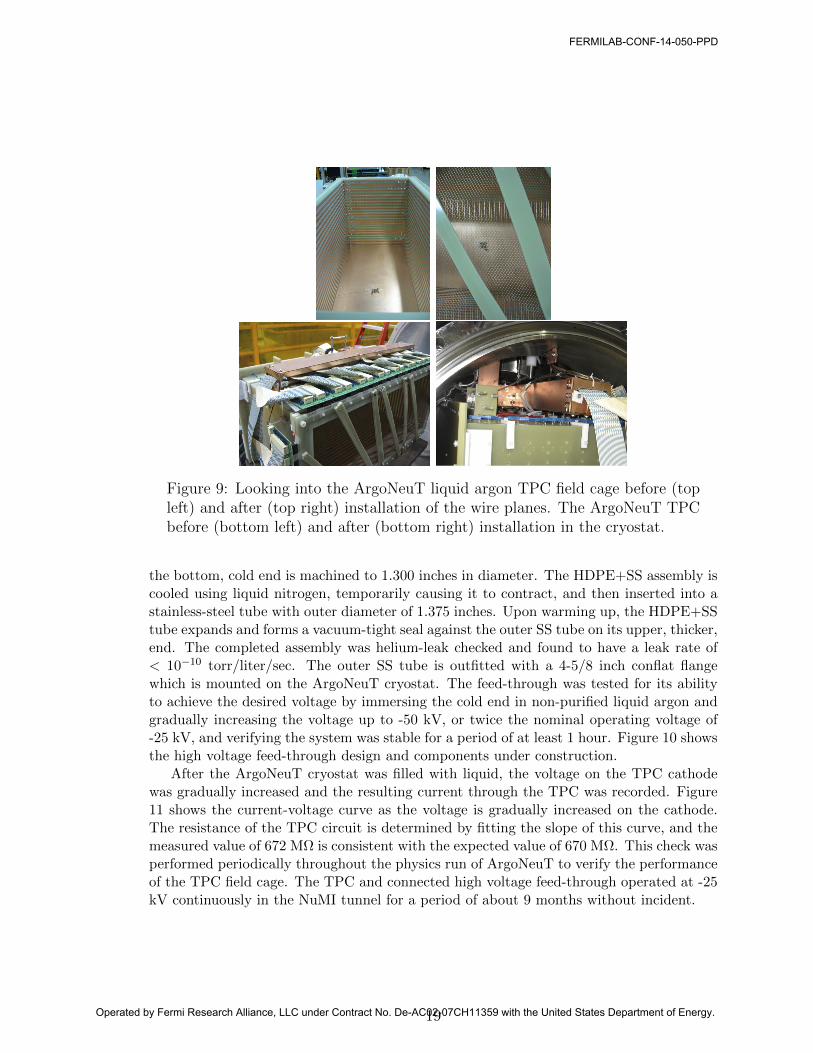
Figure 9: Looking into the ArgoNeuT liquid argon TPC field cage before (topleft) and after (top right) installation of the wire planes. The ArgoNeuT TPCbefore (bottom left) and after (bottom right) installation in the cryostat.
the bottom, cold end is machined to 1.300 inches in diameter. The HDPE+SS assembly iscooled using liquid nitrogen, temporarily causing it to contract, and then inserted into astainless-steel tube with outer diameter of 1.375 inches. Upon warming up, the HDPE+SStube expands and forms a vacuum-tight seal against the outer SS tube on its upper, thicker,end. The completed assembly was helium-leak checked and found to have a leak rate of< 10−10 torr/liter/sec. The outer SS tube is outfitted with a 4-5/8 inch conflat flangewhich is mounted on the ArgoNeuT cryostat. The feed-through was tested for its abilityto achieve the desired voltage by immersing the cold end in non-purified liquid argon andgradually increasing the voltage up to -50 kV, or twice the nominal operating voltage of-25 kV, and verifying the system was stable for a period of at least 1 hour. Figure 10 showsthe high voltage feed-through design and components under construction.
After the ArgoNeuT cryostat was filled with liquid, the voltage on the TPC cathodewas gradually increased and the resulting current through the TPC was recorded. Figure11 shows the current-voltage curve as the voltage is gradually increased on the cathode.The resistance of the TPC circuit is determined by fitting the slope of this curve, and themeasured value of 672 MΩ is consistent with the expected value of 670 MΩ. This check wasperformed periodically throughout the physics run of ArgoNeuT to verify the performanceof the TPC field cage. The TPC and connected high voltage feed-through operated at -25kV continuously in the NuMI tunnel for a period of about 9 months without incident.
19
FERMILAB-CONF-14-050-PPD
Operated by Fermi Research Alliance, LLC under Contract No. De-AC02-07CH11359 with the United States Department of Energy.
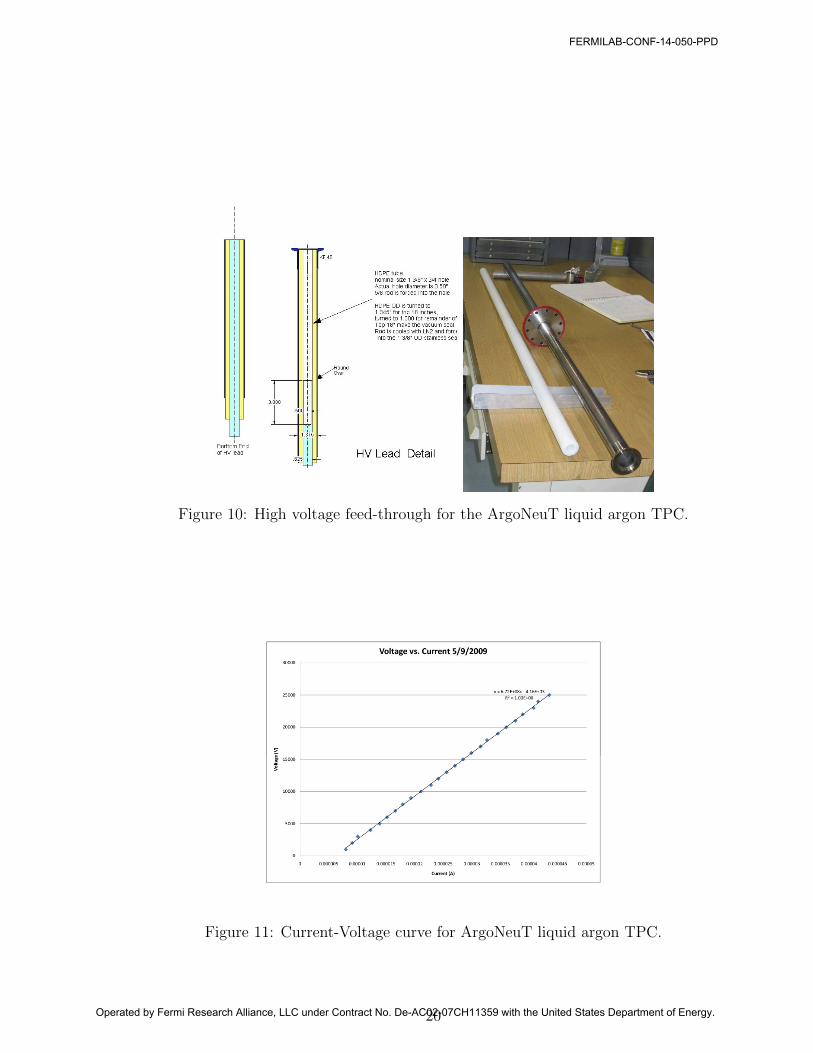
Figure 10: High voltage feed-through for the ArgoNeuT liquid argon TPC.
Figure 11: Current-Voltage curve for ArgoNeuT liquid argon TPC.
20
FERMILAB-CONF-14-050-PPD
Operated by Fermi Research Alliance, LLC under Contract No. De-AC02-07CH11359 with the United States Department of Energy.
4.3 ARGONTUBE
Contributed by T. Strauss, Laboratory for High Energy Physics, Albert Einstein Center forFundamental Physics (AEC), University of Bern, 3012 Bern, Switzerland in collaborationwithA.Blatter, A.Ereditato, C.-C.Hsu, S.Janos, I.Kreslo, M.Luethi, C.Rudolf von Rohr, M.Schenk,M.S.Weber, M.Zeller, Laboratory for High Energy Physics, Albert Einstein Center for Fun-damental Physics (AEC), University of Bern, 3012 Bern, Switzerland
4.3.1 Introduction
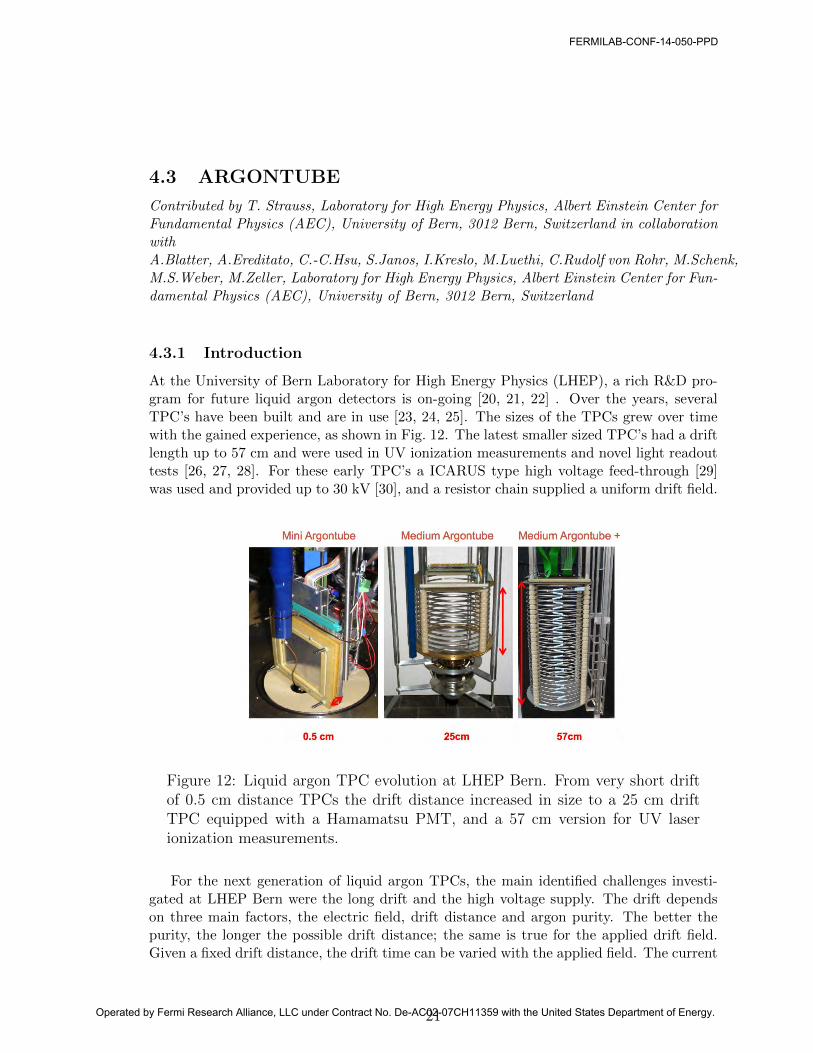
At the University of Bern Laboratory for High Energy Physics (LHEP), a rich R&D pro-gram for future liquid argon detectors is on-going [20, 21, 22] . Over the years, severalTPC’s have been built and are in use [23, 24, 25]. The sizes of the TPCs grew over timewith the gained experience, as shown in Fig. 12. The latest smaller sized TPC’s had a driftlength up to 57 cm and were used in UV ionization measurements and novel light readouttests [26, 27, 28]. For these early TPC’s a ICARUS type high voltage feed-through [29]was used and provided up to 30 kV [30], and a resistor chain supplied a uniform drift field.
Figure 12: Liquid argon TPC evolution at LHEP Bern. From very short driftof 0.5 cm distance TPCs the drift distance increased in size to a 25 cm driftTPC equipped with a Hamamatsu PMT, and a 57 cm version for UV laserionization measurements.
For the next generation of liquid argon TPCs, the main identified challenges investi-gated at LHEP Bern were the long drift and the high voltage supply. The drift dependson three main factors, the electric field, drift distance and argon purity. The better thepurity, the longer the possible drift distance; the same is true for the applied drift field.Given a fixed drift distance, the drift time can be varied with the applied field. The current
21
FERMILAB-CONF-14-050-PPD
Operated by Fermi Research Alliance, LLC under Contract No. De-AC02-07CH11359 with the United States Department of Energy.

Figure 13: TPC of the ARGONTUBE at LHEP Bern. Gold plated field shapingrings to reduce high voltage breakdowns cover 5 m drift length.
magnitude limit of the possible drift fields with a ICARUS design feed-through is about150 kV.
4.3.2 ARGONTUBE detector
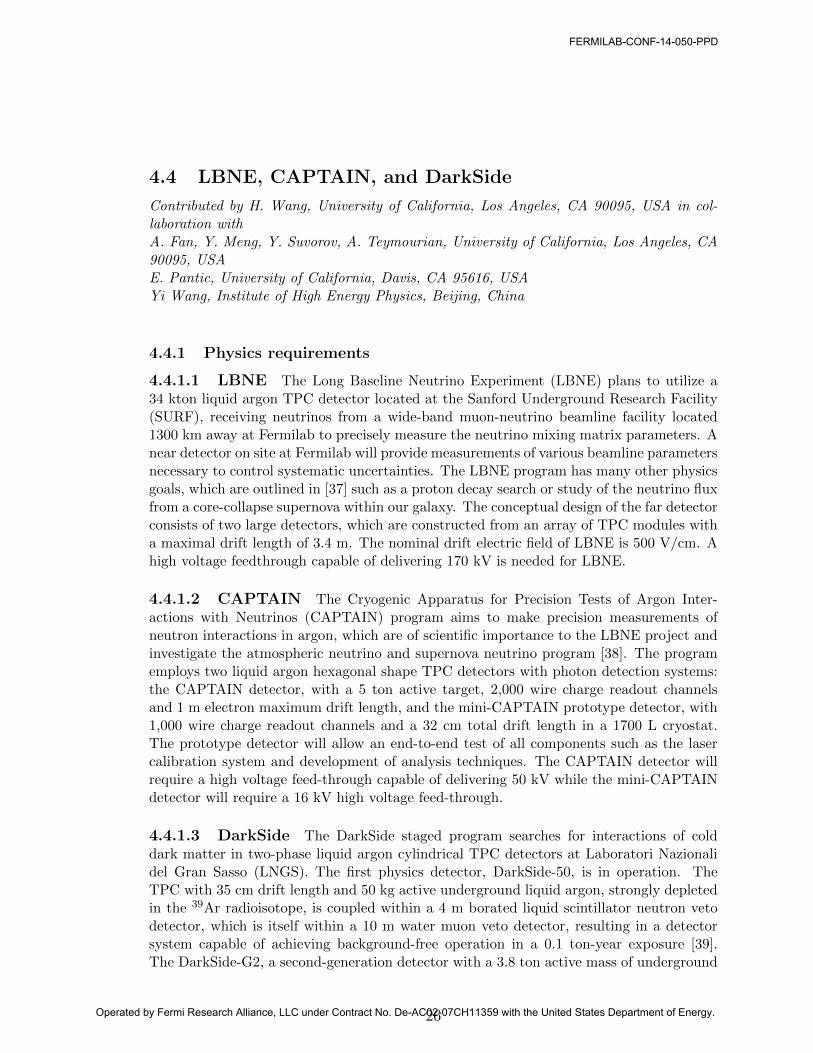
To address these challenges, a 5 m long TPC was designed at the LHEP, called AR-GONTUBE and shown in Fig. 13, which uses a novel idea for applying the high volt-age [31]. A Cockcroft-Walton, or Greinacher, circuit is connected to the field shaping ringsof the detector, with a supply current of 4 VAC, and a total of 125 stages which allow adesign high voltage of up to 500 kV. In Fig. 14 a view inside the TPC shows the circuit.A purification system allows the recirculation of the liquid argon and a cryocooler is usedto close the system and allow long-term runs. An outer bath of liquid argon allows thethermal insulation. The readout is performed with warm pre-amplifiers and CAEN ADC,however a recent test used the MicroBooNE ASIC boards as pre-amplifiers in the liquidargon [32]. A field mill shown in Fig. 15 is used to cross-check the applied high voltageat the cathode. The operating of the field mill is as follows: a rotator with windows spinsabove sensed electrodes; charges are induced and lost when the electrodes are shieldedalong this capacitance, C. This periodic charge and discharge voltage, U , can be measuredand depends on the rotation frequency; the induced charge is proportional to the areaexposed to the electric field, A(t). This allows one to extract the high voltage informationfrom the signal, S, using S ∝ Q = U
C ε0εrA(t), where ε0 is the dielectric constant and εr isthe dielectric strength of argon.
22
FERMILAB-CONF-14-050-PPD
Operated by Fermi Research Alliance, LLC under Contract No. De-AC02-07CH11359 with the United States Department of Energy.
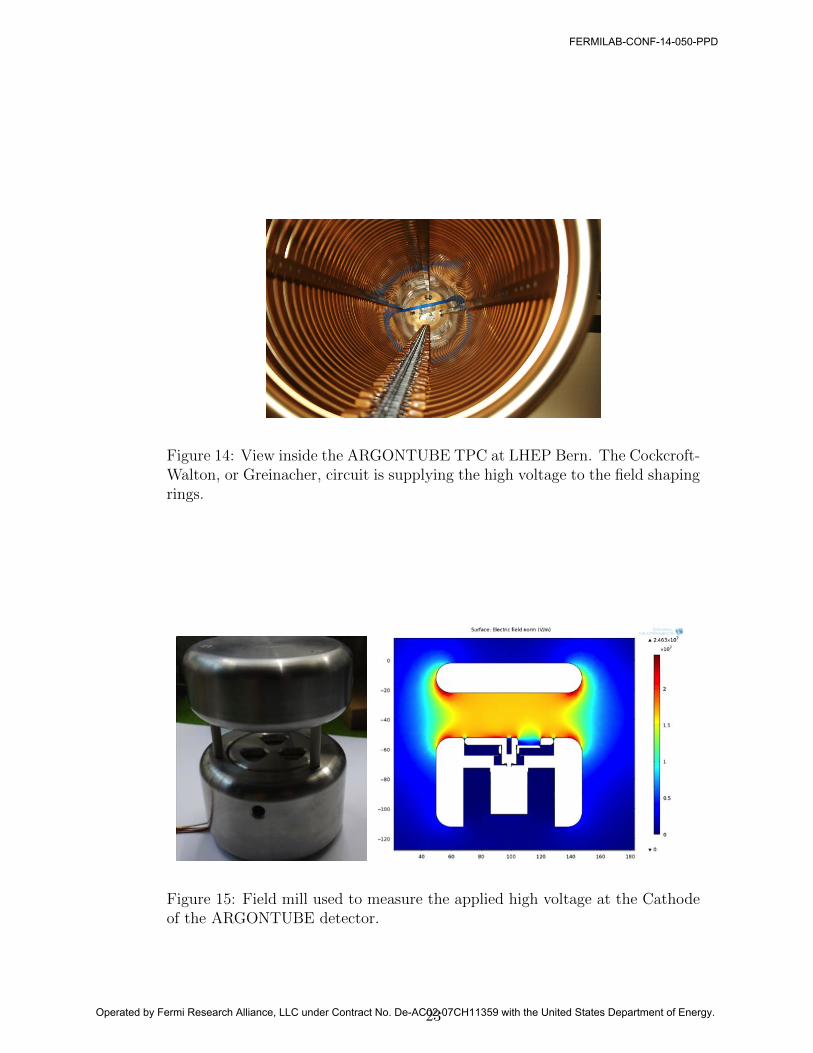
Figure 14: View inside the ARGONTUBE TPC at LHEP Bern. The Cockcroft-Walton, or Greinacher, circuit is supplying the high voltage to the field shapingrings.
Figure 15: Field mill used to measure the applied high voltage at the Cathodeof the ARGONTUBE detector.
23
FERMILAB-CONF-14-050-PPD
Operated by Fermi Research Alliance, LLC under Contract No. De-AC02-07CH11359 with the United States Department of Energy.

Figure 16: Breakdown measurements in liquid argon at the LHEP Bern usinga maximum electric field of 30 kV and a maximum distance of 1 cm distancemeasured with micrometric precision.
Figure 17: Literature versus recent measurements of high voltage breakdownsin liquid argon at LHEP Bern. The higher the argon purity, the lower thebreakdown field. The effect on the cathode ground distance needs to be studiedfurther.
24
FERMILAB-CONF-14-050-PPD
Operated by Fermi Research Alliance, LLC under Contract No. De-AC02-07CH11359 with the United States Department of Energy.

During the operation a maximum stable high voltage of 100 kV was achieved. Around100 kV spontaneous discharges of the circuit took place, which corresponds to about30 kV/cm for the highest field to ground. Several runs investigated the breakdowns andargon bubbles, possible contamination with copper dust from the purity filter and detectormisalignment due to electrostatic forces were all excluded as possible causes. The conclu-sion of these tests was that the value of the breakdown voltage is less than the publishedvalue of 1MV/cm [33, 34, 35] .
Figure 18: New test stand for liquid argon breakdown measurements at theLHEP Bern using a maximum electric field of 1.2 MV/cm, a maximum voltagedifference of 130 kVcm, and a distance range of 1 mm up to 10 cm measuredwith 100 microns accuracy.
4.3.3 High voltage breakdown measurements
A dedicated test stand was used at LHEP Bern to cross-check the literature value of thebreakdown voltage in liquid argon of 1MV/cm with the results shown in Fig. 16.
As summarized in [36] and shown in Fig. 17 the breakdown voltage seems to be muchlower at large distance and high purities compared to the published measurements [33, 34,35].
A new test stand at LHEP Bern is currently used to measure the distance dependencein the range from 1 mm to 10 cm with 100 microns accuracy. This discharge will be to aflat surface using a new ICARUS style high voltage feed through that is protected with a20 MΩ resistor. The test stand is shown in Fig. 18.
25
FERMILAB-CONF-14-050-PPD
Operated by Fermi Research Alliance, LLC under Contract No. De-AC02-07CH11359 with the United States Department of Energy.
4.4 LBNE, CAPTAIN, and DarkSide
Contributed by H. Wang, University of California, Los Angeles, CA 90095, USA in col-laboration withA. Fan, Y. Meng, Y. Suvorov, A. Teymourian, University of California, Los Angeles, CA90095, USAE. Pantic, University of California, Davis, CA 95616, USAYi Wang, Institute of High Energy Physics, Beijing, China
4.4.1 Physics requirements
4.4.1.1 LBNE The Long Baseline Neutrino Experiment (LBNE) plans to utilize a34 kton liquid argon TPC detector located at the Sanford Underground Research Facility(SURF), receiving neutrinos from a wide-band muon-neutrino beamline facility located1300 km away at Fermilab to precisely measure the neutrino mixing matrix parameters. Anear detector on site at Fermilab will provide measurements of various beamline parametersnecessary to control systematic uncertainties. The LBNE program has many other physicsgoals, which are outlined in [37] such as a proton decay search or study of the neutrino fluxfrom a core-collapse supernova within our galaxy. The conceptual design of the far detectorconsists of two large detectors, which are constructed from an array of TPC modules witha maximal drift length of 3.4 m. The nominal drift electric field of LBNE is 500 V/cm. Ahigh voltage feedthrough capable of delivering 170 kV is needed for LBNE.
4.4.1.2 CAPTAIN The Cryogenic Apparatus for Precision Tests of Argon Inter-actions with Neutrinos (CAPTAIN) program aims to make precision measurements ofneutron interactions in argon, which are of scientific importance to the LBNE project andinvestigate the atmospheric neutrino and supernova neutrino program [38]. The programemploys two liquid argon hexagonal shape TPC detectors with photon detection systems:the CAPTAIN detector, with a 5 ton active target, 2,000 wire charge readout channelsand 1 m electron maximum drift length, and the mini-CAPTAIN prototype detector, with1,000 wire charge readout channels and a 32 cm total drift length in a 1700 L cryostat.The prototype detector will allow an end-to-end test of all components such as the lasercalibration system and development of analysis techniques. The CAPTAIN detector willrequire a high voltage feed-through capable of delivering 50 kV while the mini-CAPTAINdetector will require a 16 kV high voltage feed-through.
4.4.1.3 DarkSide The DarkSide staged program searches for interactions of colddark matter in two-phase liquid argon cylindrical TPC detectors at Laboratori Nazionalidel Gran Sasso (LNGS). The first physics detector, DarkSide-50, is in operation. TheTPC with 35 cm drift length and 50 kg active underground liquid argon, strongly depletedin the 39Ar radioisotope, is coupled within a 4 m borated liquid scintillator neutron vetodetector, which is itself within a 10 m water muon veto detector, resulting in a detectorsystem capable of achieving background-free operation in a 0.1 ton-year exposure [39].The DarkSide-G2, a second-generation detector with a 3.8 ton active mass of underground
26
FERMILAB-CONF-14-050-PPD
Operated by Fermi Research Alliance, LLC under Contract No. De-AC02-07CH11359 with the United States Department of Energy.

Figure 19: High voltage feed-throughs designed for the LBNE, DarkSide, andCAPTAIN liquid argon TPCs, from top to bottom.
argon in a 1.5 m long TPC, is proposed and currently in the R&D phase. If approved, theDarkSide-G2 detector will be hosted in the existing muon veto and neutron veto system.The DarkSide-50 high voltage feed-through is designed and built to deliver 43 kV. Theplanned DarkSide-G2 detector will require a high voltage feed-through capable of 75 kV.
4.4.2 High Voltage Feedthroughs
The high voltage feed-through designed and constructed at UCLA for the LBNE, CAPTAIN,and DarkSide projects all consist of an outer stainless steel grounding tube, an innerstainless steel high voltage conductor, and an Ultrahigh Molecular Weight Polyethylene(UHMWPE) dielectric between the two. This design creates a coaxial design capable ofwithstanding very high voltages. Depending on the ultimate design goals, the diametersof the outer grounding tube and inner conductor are tuned to provide the highest volt-age with a given outer diameter of the ground tube, with an appropriate safety factor.UHMWPE can withstand an electric field up to 2,500 kV/cm, and so the dimensions ofthe high voltage feed-through keep the field within the polyethylene well below its limit.The length of the high voltage feed-through is set to accommodate the geometry of theexperiment in which it is used. A flange welded onto the outer ground tube allows for thehigh voltage feed-through to be coupled to the cryostat with an ultra high vacuum seal.At the bottom tip of the high voltage feed-through, the UHMWPE dielectric and innerconductor extend further than the grounding tube. The design at this tip is critical toensure safe operation up to the voltage needed. Although liquid argon has a breakdownstrength of 1.1−1.42 MV/cm, however, because insulating materials are used near the tip,charge buildup can cause sparking even if the field is below the liquid argon breakdownlimit. Ionizing radiation is constantly entering the liquid argon creating charge carriers.The electric field generated by the high voltage feed-through separates the charge carriersand creates a charge buildup on the insulating surfaces when the liquid argon has a reason-ably good purity. If the total surface charge density exceeds the holding, the charges willmove causing a gas bubble to form. The breakdown strength of gaseous argon is very low,6.2 kV/cm [40], and so if the bubble forms in a region with an electric field greater thanthis value, breakdown will occur. This breakdown initiates a spark, and so it is importantto minimize the electric field in the regions around the tip and to prevent the charges frommoving.
27
FERMILAB-CONF-14-050-PPD
Operated by Fermi Research Alliance, LLC under Contract No. De-AC02-07CH11359 with the United States Department of Energy.

Figure 20: (left) A close-up of the tip of the LBNE liquid argon high voltagefeed-through. (right) Electric potential of the LBNE high voltage feed-throughnear the tip.
Any exposed insulators in the region around the tip are grooved in order to trap chargesand prevent any movement, including the UHMWPE dielectric that extends below theouter grounding conductor. The inner conductor extends slightly beyond the dielectricand provides a means to supply the voltage to the cathode. The inner and outer tubesare cut to length, connectors for the air-side and liquid-side of the inner conductor aremachined and welded onto the inner conductor, and the vacuum flange is welded onto theouter ground tube. The dielectric is purchased as an extruded UHMWPE tube with thecorrect inner diameter, and the outer diameter is machined down to be slightly larger thanthe inner diameter of the outer ground tube. Grooves are then machined into the bottomend of the dielectric. The inner conductor is pressed into the dielectric, and the dielec-tric/conductor combination is cryofitted into the outer tube. This simple procedure hasbeen used several times for ICARUS, ZEPLIN II, DarkSide-10, DarkSide-50, XENON1T,LBNE and CAPTAIN with ultra high vacuum seal and operated at the designed voltage.
The high voltage feed-through design is shown in Fig. 19 and is used for the CAPTAINand DarkSide experiments, which require a voltage of ∼50 kV. The LBNE experimenthowever requires a much higher voltage, up to 200 kV. The original design created a highelectric field at the end of the outer ground tube, which did not allow the voltage to reachabove about 150 kV. A modification of the tip of the high voltage feed-through is required.The end of the outer ground tube is flared out to a diameter of more than 4 inches, anda ring shape is machined onto the end. This design lowers the electric field at the end ofthe ground tube as seen in Fig. 20. A second UHMWPE piece is used to fill the regionbetween the ground tube and the dielectric, and grooves are machined into this piece toprevent any charge migration. With this design, the voltage can be held at 200 kV withoutany sparking at zero psig pressure on the liquid argon surface.
The high voltage feed-throughs were tested by submerging them in liquid argon in adewar. A polyethylene cup was placed inside the dewar to shield the walls of the dewarfrom the high voltage feed-through tip. The voltage was gradually increased up to thedesign limit of the specific high voltage feed-through being tested. In some cases, when
28
FERMILAB-CONF-14-050-PPD
Operated by Fermi Research Alliance, LLC under Contract No. De-AC02-07CH11359 with the United States Department of Energy.

Figure 21: (left)The test system for XENON1T including the high voltagefeed-through, two grids, and a PMT. (right) PMT rate versus applied cathodevoltage.
the surfaces were unpolished, a few sparks occurred during the ramping up of the voltage.This sparking was attributed to sharp points on the conductors creating very high electricfields. These initial sparks cause the sharp points to be burned off and allowed the voltageto increase. In all cases, the high voltage feed-through was able to run at the maximumdesigned voltage with no sparking. The tests were run at both atmospheric pressure andalso at a slight overpressure, up to 9 psi.
In addition to high voltage feed-through testing in liquid argon, application of suchhigh voltage feed-through in liquid xenon is planned for XENON1T and its upgrade, see§ 5.3. In the case of liquid xenon TPCs for dark matter search applications, due to highlight yield demands, a high transparency fine mesh cathode is generally used. The abilityof running the fine mesh cathode on the designed voltage while close to ground is essentialto minimize the amount of liquid xenon used between the cathode and the ground plane.A detailed set-up to study the high voltage on a fine cathode mesh was constructed withcare taken on all insulating surfaces, as seen in Fig. 21. The fine cathode mesh, 2 mm pitchhexagonal mesh with 95% optical transparency, was placed 3 cm from another of the samemesh, which was grounded. A 3-inch PMT was placed below the grounded mesh to lookfor any sparking while the voltage was raised up to -100 kV. The voltage was maintainedat this level with no sparking. While increasing the voltage to this level, the count rateat 1/3 pe threshold of the PMT was monitored for any possible electroluminescence ofthe liquid xenon. Beginning at −90 kV, the count rate from the PMT began to steadilyincrease with the voltage, indicating the presence of electroluminesence.
4.5 GLACIER/LBNO
Contributed by F. Resnati, ETH Zurich - Institute for Particle Physics, 8093 Zurich,Switzerland in collaboration withF. Bay, C. Cantini, S. Murphy, A. Rubbia, F. Sergiampietri, S. Wu, ETH Zurich - Insti-tute for Particle Physics, 8093 Zurich, Switzerland
The LBNO experiment [41] aims at very large statistics, excellent background rejec-
29
FERMILAB-CONF-14-050-PPD
Operated by Fermi Research Alliance, LLC under Contract No. De-AC02-07CH11359 with the United States Department of Energy.

tion and good energy resolution in order to measure precisely the oscillation pattern asa function of the neutrino energy. The Giant Liquid Argon Charge Imaging ExpeRiment(GLACIER) is a very large liquid argon TPC that will perform neutrinos physics as well aslook for proton decay. GLACIER plans to use the innovative double phase, liquid-vapor,operation, which permits the amplification of the signal by means of charge avalanche inthe vapor, yielding a larger signal to noise ratio and an overall better image quality thansingle phase operation [42, 43, 44, 45, 46, 47]. Several technological challenges need tobe addressed to achieve the successful operation of this experiment, with the high voltagebeing a critical one. The assumed electron drift length is 20 m, with an electric field of1 kV/cm. These design parameters require a voltage at the cathode of −2 MV. In thecurrent design [48], a distance of 1.5 m is foreseen between the cathode structure and thebottom of the tank at ground, giving an average electric field of 13.3 kV/cm. In the vicin-ity of the cathode tubes the electric field reaches 50 kV/cm over distances of the order ofcentimeter. Therefore, GLACIER performed a dedicated test to measure the maximumelectric field, up to 100 kV over 1 cm, that the liquid argon can sustain. The setup wasoperated for the first time in December 2013. The description is given in § 4.5.1 and theresults obtained in § 4.5.2.
4.5.1 The apparatus
Figure 22 shows the schematic representation of the test setup, which consists of a vacuuminsulated dewar hosting a high voltage feed-through and a couple of electrodes, in betweenwhich the high electric field is generated. During operation, the dewar is filled with liq-uid argon purified through a molecular sieve, ZEOCHEM Z3-06, which blocks the watermolecules, and a custom-made copper cartridge, which absorbs oxygen molecules. Beforethe filling, the vessel is evacuated to residual pressure lower than 10−4 mbar in order toremove air traces, favor the outgassing of the materials in the dewar, and check the absenceof leaks towards the atmosphere. During the filling, the boiled-off argon gas is exhaustedto control the pressure in the dewar. The pressure is always kept at least 100 mbar abovethe atmospheric pressure, so that air contaminations are minimized. Once the detectoris completely full, the exhaust is closed, and the liquid argon is kept cold by means ofliquid nitrogen flowing into a serpentine, which acts as heat exchanger that condenses theboiled-off argon gas. The liquid argon level is visually checked through a vacuum sealedviewport.
The voltage is provided by a 100 kV power supply [49] though a high voltage coaxialcable modified to inductively couple the high voltage wire to an oscilloscope via a 1:1transformer. When a pulsed current flows through the cable, it is detected on the scope.This sensor is used to monitor the frequency of small discharges that are not necessarilyhappening between the electrodes, but rather the feedthrough and the cable may haveleakage currents. It is also used to monitor the current delivered by the power supplyduring the charging up. The cable enters into a custom-made high voltage feedthrough, asseen in Fig. 23, analogous to the one developed by ICARUS [29]. It is vacuum tight anddesigned to sustain voltages larger than 150 kV.
High electric fields can be achieved with low potentials and electrodes with small radiiof curvature, but since the breakdown is a random process, it is important to test a sizable
30
FERMILAB-CONF-14-050-PPD
Operated by Fermi Research Alliance, LLC under Contract No. De-AC02-07CH11359 with the United States Department of Energy.

GA
r ex
haus
t
LN2
exha
ust
LN2
ExternalLArTank
mol
ecul
arsi
eve
copp
erca
rtri
dge
elec
trod
es
μ-dischargemonitor
PMTpuritymonitor
100kV power supply
feed
thro
ugh
pico-ammeter
LAr
inpu
t
view
por
t
Figure 22: Schematic representation of the GLACIER liquid argon test appa-ratus.
Figure 23: (left) Image of the GLACIER test apparatus high voltage feed-through. (right) The electrodes structure.
31
FERMILAB-CONF-14-050-PPD
Operated by Fermi Research Alliance, LLC under Contract No. De-AC02-07CH11359 with the United States Department of Energy.

0 122 4 6 8 10
axia
l sym
met
ry
r (cm)
ground
0 1 2 3 4 50.2
1.0
0.4
0.6
0.9
0.8
0.7
0.5
0.3
r (cm)
elec
tric
fiel
d / n
omin
al fi
eld
Figure 24: (left) Computed electric field for GLACIER test electrodes. Thecross sections of the electrodes are shown in grey, and the color pattern isproportional to the absolute value of the electric field. The electric field isessentially uniform in the central region. (right) Computed electric field onthe profile of the top electrode as a function of the radius. The largest field isattained between the electrodes.
region of the electrodes. For these reasons, a system that provides a uniform electricfield over 20 cm2 area was designed. A picture of the electrodes structure is shown inFig. 23. The two 10 cm diameter electrodes have the same shape and are facing eachother at a distance of 1 cm. The top electrode is connected to the live contact of the highvoltage feedthrough, and the bottom one is connected to ground through the vessel. Theelectrodes, made out of mechanically polished stainless steel, are shaped according to theRogowski profile [50] that guarantees that the highest electric field is almost uniform in aregion of about 5 cm in diameter, and confined between the two electrodes, as shown inFig. 24. The left image shows, in cylindrical coordinates, the absolute value of the electricfield in the vicinity of the electrodes, computed with COMSOL [51]. On the right theelectric field along the profile of the top electrode as a function of the radius is shown.
The two electrodes form a standalone structure, that is assembled first and thenmounted. By construction, the structure ensures the parallelism of the electrodes whencooled down to the liquid argon temperature. The shrinkage of the materials in cold iscomputed to affect the distance between the electrodes less than 1%.
4.5.2 Results
In December 2013 the setup was operated for the first time. The goal of the first test wasto commission the setup and to check if a field of 100 kV/cm can be reached in stableconditions. The operation with the high voltage power supply switched on lasted about4 hours.
With the liquid argon temperature below the boiling point at a given pressure, a voltageof -100 kV was applied to the top electrode. This value was limited by the maximumvoltage of the power supply. This configuration corresponds to a uniform electric field of100 kV/cm in a region of about 20 cm2 area between the electrodes. Several cycles ofdischarging and charging up of the power supply were performed. The system could alsobe stressed several times by ramping up the voltage from 0 V to -100 kV in about 20 s
32
FERMILAB-CONF-14-050-PPD
Operated by Fermi Research Alliance, LLC under Contract No. De-AC02-07CH11359 with the United States Department of Energy.

without provoking any breakdown.A completely different behavior was observed with boiling argon. Several breakdowns
occurred between the electrodes at fields as low as 40 kV/cm. The stillness of the liquidargon was controlled by varying the pressure of the argon vapor and was monitored visuallyby looking through the viewport. The pressure was regulated by acting on the flow of theliquid nitrogen passing through the heat exchanger. In fact, the thermal inertia of theliquid argon bulk makes temperature variations very slow, hence increasing the coolingpower translates in an rapid decrease of the vapor pressure. When the pressure is abovethe boiling one, the liquid argon surface becomes flat and still. On the contrary, the morethe pressure decreases below the boiling point, the more the liquid argon boils.
Above about 1000 mbar the argon was not boiling, and 100 kV/cm could be achieved.Around 930 mbar breakdowns occurred at 70 kV/cm, and below 880 mbar at 40kV/cm.Since argon gas has a much lower dielectric rigidity compared to the liquid, this behavioris interpreted as the evidence that breakdown can be triggered by bubbles in the liquid.
4.5.3 Conclusions From GLACIER
The dielectric rigidity of liquid argon with temperature below the boiling point is largerthan 100 kV/cm. The occurrence of breakdowns was found to be significantly sensitive tothe presence of bubbles: in boiling liquid argon the breakdown field is as low as 40 kV/cm.The breakdown is thought to be due to the bubbles themselves that convey the breakdownforming a preferred channel for the discharge development, because of the much lowerdielectric rigidity of the argon gas. The GLACIER group intends to repeat the test toquantitatively measure the correlation between the bubble formation and the breakdowns.They also plan to test larger electrode distances with larger voltages and measure thedielectric rigidity of liquid argon as a function of the argon purity and electrode distance.The setup will be upgraded installing a PMT, a liquid argon purity monitor and a pico-ammeter, represented with dashed lines in Fig. 22. The main purpose of the PMT is toestablish the presence of luminescent precursors of the breakdown in liquid. The puritymonitor will consist of a small TPC to measure, with cosmic muons, the lifetime of thedrifting ionization electrons. Since this setup will also be used to characterize dielectricmaterials in presence of high electric fields and in cryogenic conditions, a pico-ammeterwill be used to measure the current flowing through the materials placed between the twoelectrodes to measure their volumetric impedance and the surface currents.
5 Liquid Xenon Experiments
In this section we review the high voltage experience of several working liquid xenonexperiments (EXO, LUX, and XENON100), as well as R&D in preparation for new large-scale experiments (nEXO, XENON1T and LZ), and one gas-phase xenon TPC (NEXT).
5.1 The EXO-200 experiment
Contributed by P. C. Rowson, SLAC National Accelerator Laboratory, Menlo Park, CA94025, USA
33
FERMILAB-CONF-14-050-PPD
Operated by Fermi Research Alliance, LLC under Contract No. De-AC02-07CH11359 with the United States Department of Energy.

5.1.1 Introduction
The EXO-200 detector is a liquid xenon TPC and is described elsewhere [52]. The deviceis contained within a copper vessel with a horizontal right-cylindrical layout of ∼40 cmlength and diameter, the TPC itself consisting of a central cathode plane at negative highvoltage, and two anode readout planes for charge and light collection spaced at ∼20 cmon either side. The readout planes contain two orthogonal closely spaced wire planes forcharge collection and position determination in front of a support plane holding a LAAPDarray for light readout. The central cathode is operated a high negative potential, witha design maximum of -75 k), the front wire plane for induction signals at a much lowernegative potential with a design maximum of -4 kV, and the second wire plane for chargecollection at virtual ground. The LAAPD plane is set to ∼ -1.4 kV to bias the diodes. Thetwo drift regions on both sides of the cathode include field shaping rings at large radiusconnected by voltage divider resistors, in front of which are placed thin teflon panels usedto reflect the VUV scintillation light.
EXO-200 has encountered instabilities, in the form of small discharge-like pulses or‘glitches’ observed on an oscilloscope capacitively coupled to the cathode, for cathode volt-ages ∼-10 kV. Presently EXO-200 operates with a cathode voltage of -8 kV, and a inductionplane voltage of -780 V. While there is no clear understanding of this phenomenon, thereis evidence that light production can be associated with a glitch, and that some, but notall, of these events appear to occur at large radii behind our teflon reflectors.
A test apparatus was assembled at SLAC to make controlled measurements of electricfields in liquid xenon, and is described in what follows.
5.1.2 The Test Apparatus
The R&D setup used to design the xenon handling, xenon purification and cryosystems forEXO-200 has been adapted for high voltage studies. A small test cell with a capacity of∼400 cc’s for liquid xenon has been built as seen in Fig. 25. The cell includes a SS smoothhemispherical electrode of 1.5 cm diameter at virtual ground located at the bottom, anda precisely locatable opposing electrode that can be brought to negative high voltage.Various upper electrode designs have been used. The cell includes teflon space-filling partsto reduce the required liquid xenon volume. Xenon gas from a SS storage bottle is purifiedby a single pass through a SAES 3000 series purifier [53], and then into the test cell forcondensation.
A limitation of this experiment is that the xenon purity in the cell is not known. Withthe cell filled to a level visible in an upper viewport, the fill is ended and high voltagetesting begins. Typically, a few hours of testing are followed by xenon recovery. Anotherlimitation of these tests is that they are all short term experiments. Mitigating theseshortcomings are the facts that the high voltage issues observed in EXO-200 do not clearlycorrelate with xenon purity, effects are similar for a wide range of purity levels, and thatthey appeared immediately after high-voltage turn-on, typically on time scales of a fewminutes.
34
FERMILAB-CONF-14-050-PPD
Operated by Fermi Research Alliance, LLC under Contract No. De-AC02-07CH11359 with the United States Department of Energy.
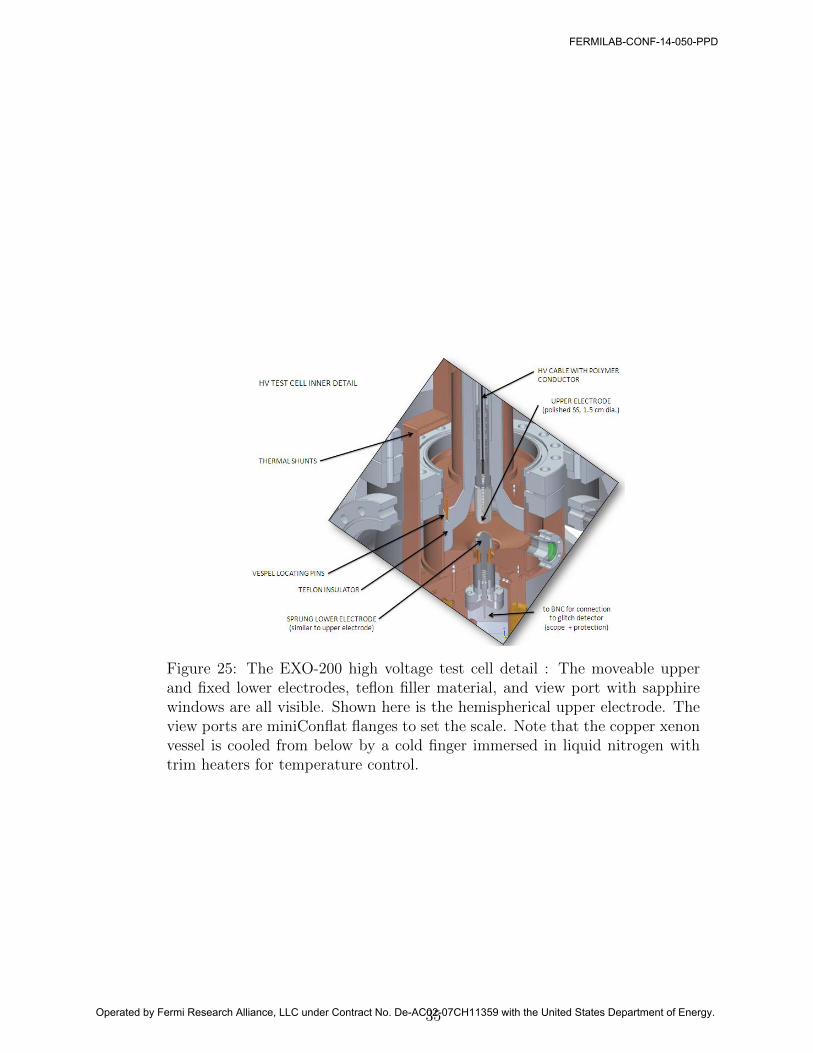
Figure 25: The EXO-200 high voltage test cell detail : The moveable upperand fixed lower electrodes, teflon filler material, and view port with sapphirewindows are all visible. Shown here is the hemispherical upper electrode. Theview ports are miniConflat flanges to set the scale. Note that the copper xenonvessel is cooled from below by a cold finger immersed in liquid nitrogen withtrim heaters for temperature control.
35
FERMILAB-CONF-14-050-PPD
Operated by Fermi Research Alliance, LLC under Contract No. De-AC02-07CH11359 with the United States Department of Energy.

5.1.3 Measurements
Possible causes for the high voltage issues in EXO-200 might fall into several categories: i)mundane causes such as debris and sharp points, ii) bubble formation from heat leaks orelectrostrictive bubble formation, iii) static charge on dielectrics or charge build up includ-ing flow related effects, and iv) inherent liquid xenon effects such as UV transparency andenhanced photoelectric or field emission. Most of these possibilities have been investigatedin the high voltage test cell, as described below, although examining EXO-200 specificeffects requires testing the TPC itself. In what follows, the program MAXWELL [54], in3D format, is used to determine the surface electric fields.
5.1.4 Liquid Xenon Breakdown Field
With a hemispherical electrode installed in the upper position, breakdown is observed witha 1 mm electrode separation at a voltage corresponding to a 250-300 kV/cm electric field,which determines a high dielectric strength, as expected, for liquid xenon. For electrodeseparations greater than 3 mm ,the maximum voltage of the power supply, -75 kV can bemaintained without instability.
5.1.5 Surface Field Studies
A series of measurements have been made to look for surface field limitations in liquidxenon, and to replicate the glitch phenomenon observed in EXO-200. The lower electrodeis connected through a protection circuit to an oscilloscope. An upper electrode holdinga small wire loop of 5mm diameter is employed for testing; first using a sample of EXO-200 125 micron etched phosphor bronze identical to the material used for the wire planes,and then an off-the-shelf round phosphor bronze wire of identical diameter. Gold-platedtungsten wires of 50 and 20 microns have also been tested. Breakdown and glitch instabilitybehavior are observed at surface electric fields of 600 kV/cm and 350 kV/cm respectively,much higher than those nominally encountered in EXO-200 where the highest surfacefields are the ∼4 kV/cm at the induction wires. Relatively small differences , < 20% lowerbreakdown voltages, are seen for the etched wires compared to the round wires.
In addition, the test cell is sometimes instrumented with a Hamamatsu R8520-406PMT that views the electrodes through two sapphire windows, one on the cell, and one onthe cryostat, inside of an evacuated vessel so that UV light can be detected. It is seen thateach glitch observed on the oscilloscope is accompanied by a PMT pulse, and by ventingthe evacuated chamber the light is confirmed via absorption in air to be in the ultravioletregion of the spectrum.
A plot of the data taken for the 20 micron wire as a function of separation distancebetween the electrodes shows the general trend is shown in Fig. 26. For a 1 cm separationdistance, the same distance as between the cathode support ring at high voltage andthe grounded copper xenon vessel in EXO-200, instability occurs at -13 kV, which iscomparable to the behavior seen in the TPC. But there are no features as small as 20microns, or even 100 times this size, standing off 5 mm from any high voltage surface inEXO-200.
36
FERMILAB-CONF-14-050-PPD
Operated by Fermi Research Alliance, LLC under Contract No. De-AC02-07CH11359 with the United States Department of Energy.
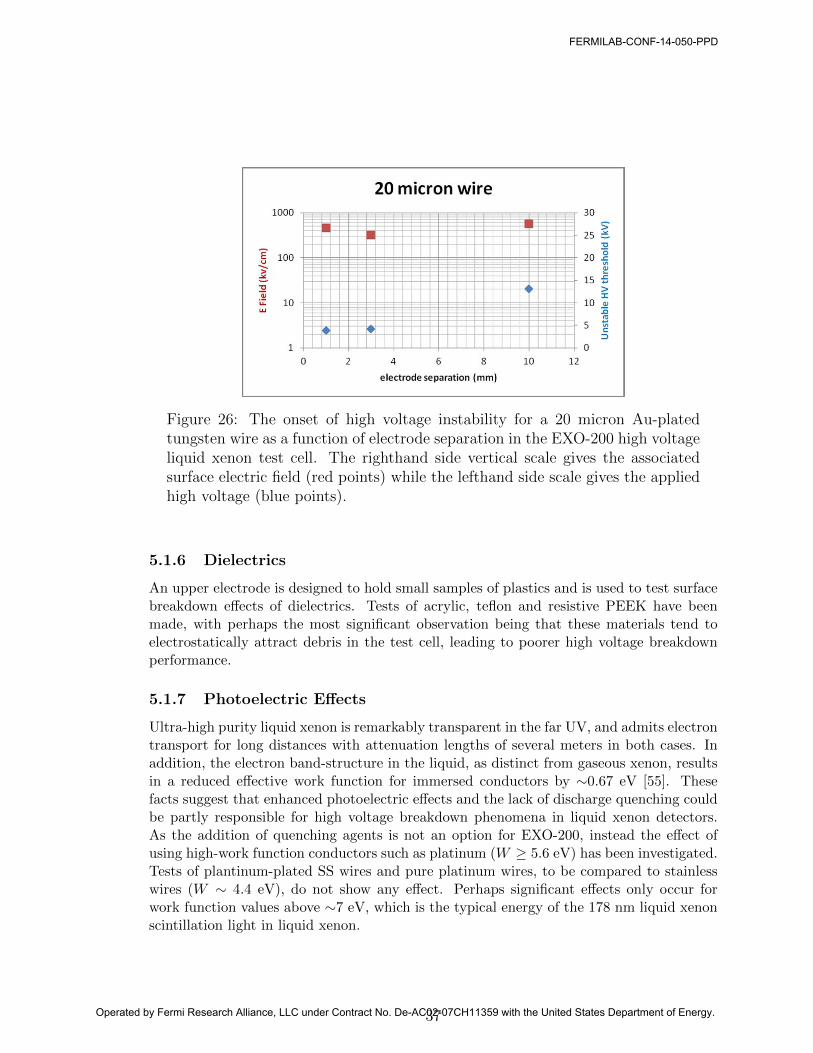
Figure 26: The onset of high voltage instability for a 20 micron Au-platedtungsten wire as a function of electrode separation in the EXO-200 high voltageliquid xenon test cell. The righthand side vertical scale gives the associatedsurface electric field (red points) while the lefthand side scale gives the appliedhigh voltage (blue points).
5.1.6 Dielectrics
An upper electrode is designed to hold small samples of plastics and is used to test surfacebreakdown effects of dielectrics. Tests of acrylic, teflon and resistive PEEK have beenmade, with perhaps the most significant observation being that these materials tend toelectrostatically attract debris in the test cell, leading to poorer high voltage breakdownperformance.
5.1.7 Photoelectric Effects
Ultra-high purity liquid xenon is remarkably transparent in the far UV, and admits electrontransport for long distances with attenuation lengths of several meters in both cases. Inaddition, the electron band-structure in the liquid, as distinct from gaseous xenon, resultsin a reduced effective work function for immersed conductors by ∼0.67 eV [55]. Thesefacts suggest that enhanced photoelectric effects and the lack of discharge quenching couldbe partly responsible for high voltage breakdown phenomena in liquid xenon detectors.As the addition of quenching agents is not an option for EXO-200, instead the effect ofusing high-work function conductors such as platinum (W ≥ 5.6 eV) has been investigated.Tests of plantinum-plated SS wires and pure platinum wires, to be compared to stainlesswires (W ∼ 4.4 eV), do not show any effect. Perhaps significant effects only occur forwork function values above ∼7 eV, which is the typical energy of the 178 nm liquid xenonscintillation light in liquid xenon.
37
FERMILAB-CONF-14-050-PPD
Operated by Fermi Research Alliance, LLC under Contract No. De-AC02-07CH11359 with the United States Department of Energy.

5.1.8 Conclusions and Future Plans
The EXO-200 high voltage test chamber shows that liquid xenon can stably support bulkelectric fields above 200 kV/cm, and local surface fields higher than 300 kV/cm. Exoticeffects in liquid xenon have not been observed so far, but more mundane high voltage break-down issues due to suspended debris or unintended sharp features can not be eliminated.Dielectric charge buildup effects have not been thoroughly tested, but instability effectsin the lab and in EXO-200 do not show the delayed onset expected for these phenomena.Further testing of electron emission and its control, using polarity-reversed electric fieldsand insulating film barriers, is planned. In addition, simple in situ tests of the EXO-200TPC are also under consideration.
5.2 The LUX experiment
Contributed by C. H. Faham, Lawrence Berkeley National Laboratory, Berkeley, CA 94720,USA for the LUX Collaboration
5.2.1 Introduction
The Large Underground Xenon experiment (LUX) is a 370 kg two-phase liquid xenon TPCthat looks for interactions from galactic dark matter in the form of Weakly InteractingMassive Particles (WIMPs). The LUX detector is operating at the 4,850 ft level of theSURF in Lead, South Dakota, USA. LUX recently released its first dark matter searchresults from 85.3 live-days of data collection, which place the world’s most stringent limitson WIMP dark matter interaction rates [56].
The LUX active volume is enclosed by PTFE walls on the sides and is viewed by twoarrays of 61 PMTs, one above the active region in the gas and one below it in the liquid[57]. Electrostatic grids, shown schematically in Fig. 27, are inside the active volumeand produce a vertical electric field. The cathode (C) and gate (G) grids define a regionof electron drift in the liquid, while the anode (A) and gate (G) grids define an electronextraction and electroluminescence (EL) production region in the gas. The liquid xenonlevel is placed halfway between A and G. The top (T) and bottom (B) grids shield thePMT arrays from the drift and EL fields. The grids are made from stainless steel wires.All grids are wire-strung, with the exception of A, which is a woven mesh. Fig. 27 showsthe grid’s wire pitch, wire diameter and their relative spacing.
Higher electric fields, and therefore, higher applied voltages at the grids, yield betterdetector performance and better WIMP sensitivity. For the A and G grids, the magnitudeof the field translates into an electron extraction efficiency from the liquid into the gasphase. In order to achieve near 100% extraction efficiency, a field of 10 kV/cm in the gasphase is required between A and G, which translates into a voltage differential of 8.5 kV.There is some evidence that a higher drift electric field between C and G yields betterdiscrimination between the background electron recoils and signal nuclear recoils in liquidxenon. ZEPLIN-III obtained discrimination between electron and nuclear recoils at nearly99.99% with a drift field of 3.8 kV/cm [58]. In comparison, XENON10 achieved 99.9%
38
FERMILAB-CONF-14-050-PPD
Operated by Fermi Research Alliance, LLC under Contract No. De-AC02-07CH11359 with the United States Department of Energy.
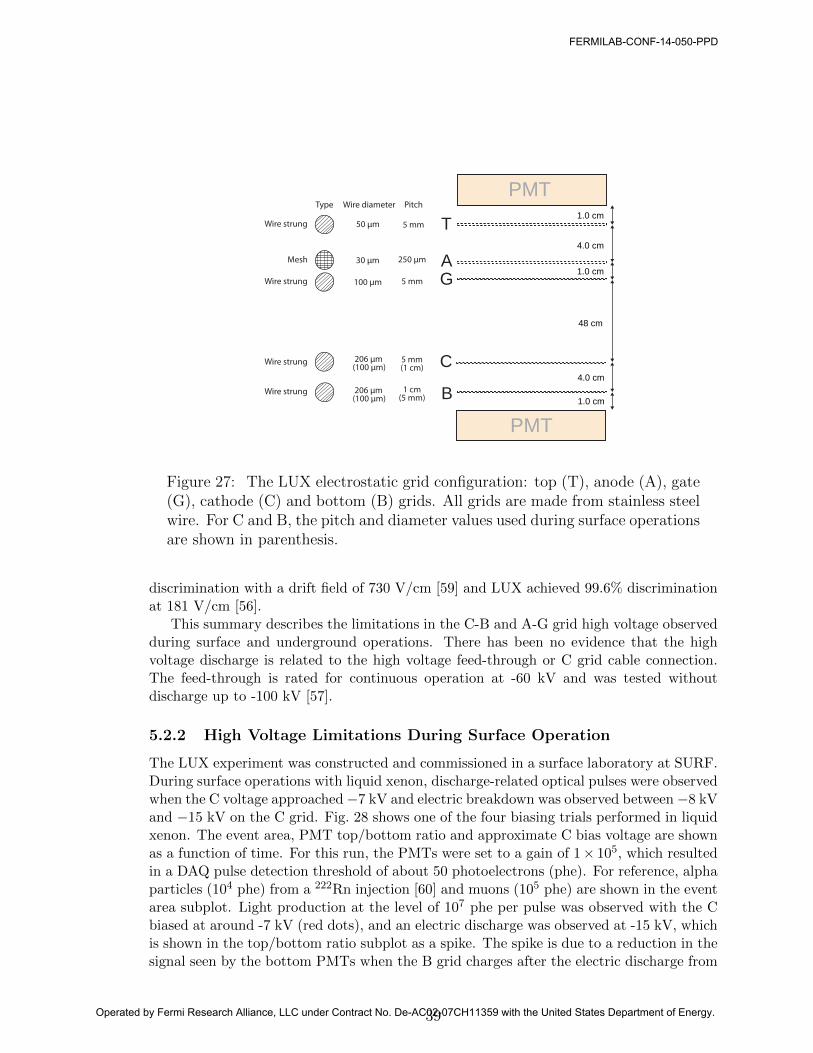
A
C
PMT
PMT
T
G
B4.0 cm
1.0 cm
1.0 cm
4.0 cm
1.0 cm
48 cm
5 mm
250 µm
5 mm
5 mm(1 cm)
1 cm(5 mm)
Type Wire diameter Pitch
50 µmWire strung
Wire strung
Wire strung
Wire strung
Mesh 30 µm
100 µm
206 µm(100 µm)
206 µm(100 µm)
Figure 27: The LUX electrostatic grid configuration: top (T), anode (A), gate(G), cathode (C) and bottom (B) grids. All grids are made from stainless steelwire. For C and B, the pitch and diameter values used during surface operationsare shown in parenthesis.
discrimination with a drift field of 730 V/cm [59] and LUX achieved 99.6% discriminationat 181 V/cm [56].
This summary describes the limitations in the C-B and A-G grid high voltage observedduring surface and underground operations. There has been no evidence that the highvoltage discharge is related to the high voltage feed-through or C grid cable connection.The feed-through is rated for continuous operation at -60 kV and was tested withoutdischarge up to -100 kV [57].
5.2.2 High Voltage Limitations During Surface Operation
The LUX experiment was constructed and commissioned in a surface laboratory at SURF.During surface operations with liquid xenon, discharge-related optical pulses were observedwhen the C voltage approached−7 kV and electric breakdown was observed between−8 kVand −15 kV on the C grid. Fig. 28 shows one of the four biasing trials performed in liquidxenon. The event area, PMT top/bottom ratio and approximate C bias voltage are shownas a function of time. For this run, the PMTs were set to a gain of 1× 10⁵, which resultedin a DAQ pulse detection threshold of about 50 photoelectrons (phe). For reference, alphaparticles (104 phe) from a 222Rn injection [60] and muons (105 phe) are shown in the eventarea subplot. Light production at the level of 107 phe per pulse was observed with the Cbiased at around -7 kV (red dots), and an electric discharge was observed at -15 kV, whichis shown in the top/bottom ratio subplot as a spike. The spike is due to a reduction in thesignal seen by the bottom PMTs when the B grid charges after the electric discharge from
39
FERMILAB-CONF-14-050-PPD
Operated by Fermi Research Alliance, LLC under Contract No. De-AC02-07CH11359 with the United States Department of Energy.

102
104
106107
Even
t top
[phe
] Sparking
100
102
Top/
botto
m ra
tio
0 10 20 30 40 50 60 700
-7
-15
Catho
de bi
as [k
V]
Time [sec]
Approximate values
Alphas
Muons105
103
Figure 28: Event area, top/bottom ratio and C grid bias as a function of timeduring one of the LUX high voltage bias trials in liquid xenon at the surfacelaboratory. For this trial, light production at the 107 phe level appeared atabout -7 kV and electric breakdown took place at -15 kV.
the C. Table 2 lists the bias trials performed and the resulting voltage for light productionand electric breakdown.
When surface operations with liquid xenon were finished, the detector was evacuated,warmed to room temperature and filled with 1 bar of nitrogen gas. A C bias test wasperformed similar to the ones in liquid xenon, and the results are shown in Fig. 29 andlisted in Table 2. Light discharges at the 103 phe level were observed at around a -10 kVbias, and electric breakdown took place at a -11.5 kV bias. This result suggests thata breakdown test with 1 bar of nitrogen gas can be used to identify grid high voltageproblems prior to liquid xenon commissioning.
The average hit patterns for the liquid xenon and nitrogen gas tests are shown in Fig.
Table 2: The LUX liquid xenon and gas nitrogen trials for biasing the C grid.
Conditions Light Breakdownliquid xenon 173 K, 1,280 torr -7 kV -10 kVliquid xenon 173 K, 1,280 torr none -8 kVliquid xenon 178 K, 1,680 torr -7 kV -14 kVliquid xenon 178 K, 1,680 torr -7 kV -15 kV1 bar N2 gas, room temp. -10 kV -11.5 kV
40
FERMILAB-CONF-14-050-PPD
Operated by Fermi Research Alliance, LLC under Contract No. De-AC02-07CH11359 with the United States Department of Energy.
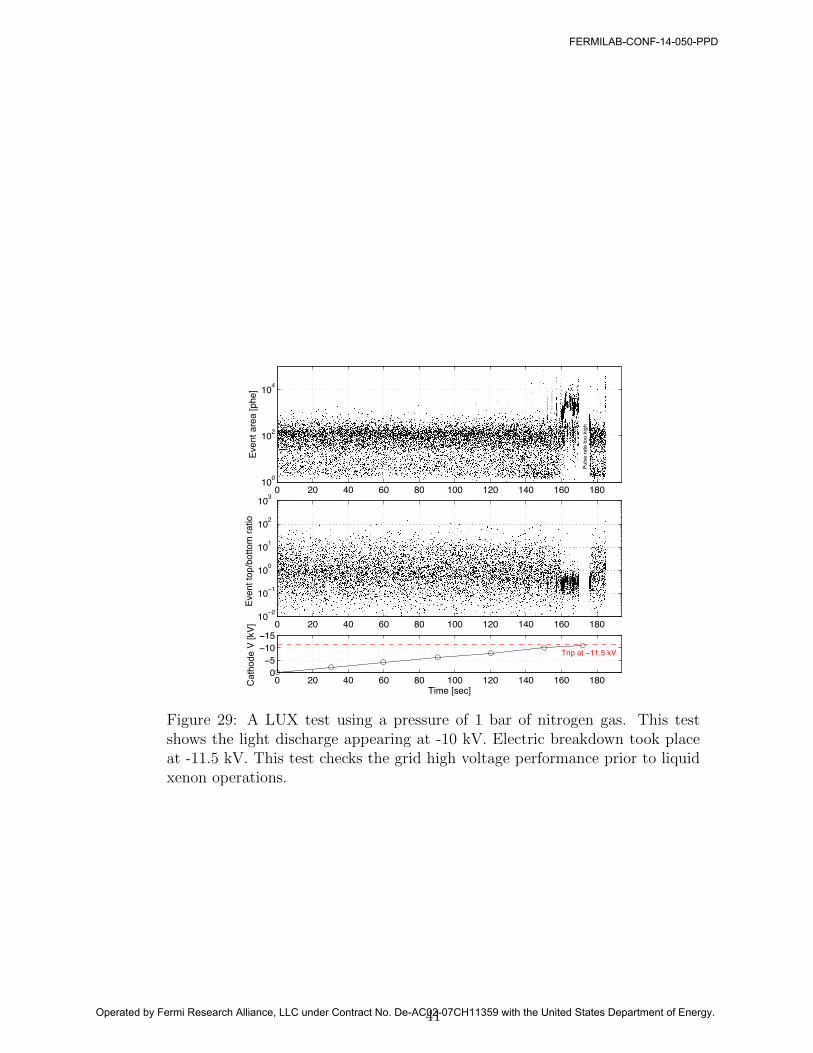
0 20 40 60 80 100 120 140 160 180100
102
104
Even
t are
a [p
he]
0 20 40 60 80 100 120 140 160 18010−2
10−1
100
101
102
103
Even
t top
/bot
tom
ratio
0 20 40 60 80 100 120 140 160 1800−5−10−15
Trip at −11.5 kV
Time [sec]
Cat
hode
V [k
V]
Pul
se ra
te to
o hi
gh
Figure 29: A LUX test using a pressure of 1 bar of nitrogen gas. This testshows the light discharge appearing at -10 kV. Electric breakdown took placeat -11.5 kV. This test checks the grid high voltage performance prior to liquidxenon operations.
41
FERMILAB-CONF-14-050-PPD
Operated by Fermi Research Alliance, LLC under Contract No. De-AC02-07CH11359 with the United States Department of Energy.
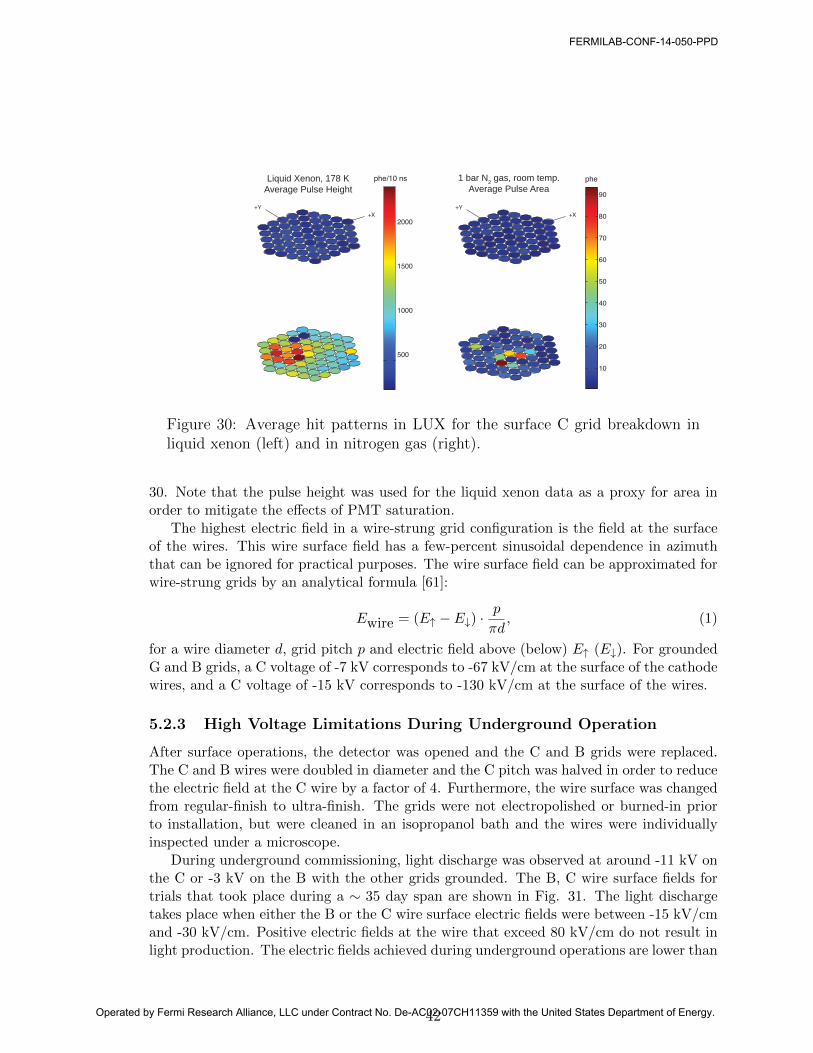
phe/10 ns
500
1000
1500
2000+X
+Y
+X+Y
phe
10
20
30
40
50
60
70
80
90
Liquid Xenon, 178 KAverage Pulse Height
1 bar N2 gas, room temp.Average Pulse Area
Figure 30: Average hit patterns in LUX for the surface C grid breakdown inliquid xenon (left) and in nitrogen gas (right).
30. Note that the pulse height was used for the liquid xenon data as a proxy for area inorder to mitigate the effects of PMT saturation.
The highest electric field in a wire-strung grid configuration is the field at the surfaceof the wires. This wire surface field has a few-percent sinusoidal dependence in azimuththat can be ignored for practical purposes. The wire surface field can be approximated forwire-strung grids by an analytical formula [61]:
Ewire = (E↑ − E↓) ·p
πd, (1)
for a wire diameter d, grid pitch p and electric field above (below) E↑ (E↓). For groundedG and B grids, a C voltage of -7 kV corresponds to -67 kV/cm at the surface of the cathodewires, and a C voltage of -15 kV corresponds to -130 kV/cm at the surface of the wires.
5.2.3 High Voltage Limitations During Underground Operation
After surface operations, the detector was opened and the C and B grids were replaced.The C and B wires were doubled in diameter and the C pitch was halved in order to reducethe electric field at the C wire by a factor of 4. Furthermore, the wire surface was changedfrom regular-finish to ultra-finish. The grids were not electropolished or burned-in priorto installation, but were cleaned in an isopropanol bath and the wires were individuallyinspected under a microscope.
During underground commissioning, light discharge was observed at around -11 kV onthe C or -3 kV on the B with the other grids grounded. The B, C wire surface fields fortrials that took place during a ∼ 35 day span are shown in Fig. 31. The light dischargetakes place when either the B or the C wire surface electric fields were between -15 kV/cmand -30 kV/cm. Positive electric fields at the wire that exceed 80 kV/cm do not result inlight production. The electric fields achieved during underground operations are lower than
42
FERMILAB-CONF-14-050-PPD
Operated by Fermi Research Alliance, LLC under Contract No. De-AC02-07CH11359 with the United States Department of Energy.

0 10 20 30 40 50 60
ï40
ï30
ï20
ï10
0
10
20
30
40
50
60
70
80
Trial number (~35 day span)
Wire
fie
ld [
kV
/cm
]
Bottom grid
Cathode grid
Figure 31: LUX electric field at the surface of the B or C grid wires when lightdischarge appeared during underground operations.
what was achieved during surface operations, which points to a new source of electricaldischarge such as particle debris.
The average pulse height hit patterns for light discharge with the C biased to negativehigh voltage and B grounded, and for the reverse situation are shown in Fig. 32. Thelight discharge waveforms are continuous sphe-level pulses, shown in the bottom subplotof Fig. 32. If the voltage is increased beyond the onset of light discharge, large DAQ-saturating pulses are also produced at a lower rate.
Light discharge is also observed when the voltage difference between the A-G gridsexceeds 5.5 kV, which corresponds to a field at the G grid wire surface of -53 kV/cm. Thehit pattern localization is in the top array, and moves over time. This light discharge limitsthe electron extraction efficiency during underground operations to 65% [56].
5.2.4 Tests Performed and Future Work
Several tests were performed on the C and B grids in an attempt to reach higher voltageswithout light discharge production. First, a “soak-in” of the grids took place, where the Cand B grids were continuously biased for about 2 weeks below the onset of light production.The ZEPLIN-III collaboration utilized this method with modest success to progressivelyachieve higher cathode voltages. In LUX, however, this process yielded no long-termimprovement. Liquid-phase conditioning was performed next, where the C and B gridswere biased at/above the onset of light production for up to 100 minutes. No long-termimprovement was reported with this procedure either.
It has been observed in the literature that bubble nucleation at the surface of a cathodegrid lowers the onset of electric discharge [62, 63]. In order to test whether quenchingbubble formation at the wires would allow higher voltage levels without light discharge,a bubble-quenching test was performed by introducing a 5 K temperature gradient indetector. No effect was observed in the voltage onset of light production with this test.
The leading hypothesis for the underground breakdown behavior is debris in the liquid
43
FERMILAB-CONF-14-050-PPD
Operated by Fermi Research Alliance, LLC under Contract No. De-AC02-07CH11359 with the United States Department of Energy.

+Y+X
phe/10 ns
6000
5000
4000
3000
2000
1000
12000
10000
8000
6000
4000
2000
+Y+X
phe/10 nsCathode grid biased -HVAverage Pulse Height
Bottom grid biased -HVAverage Pulse Height
101
121
4161
81121 0
50100
150
0
5
10
15
20
sPMT number
mV
Figure 32: Average hit pattern in LUX for the underground light discharge be-tween C and B grids (top), and example of light discharge waveform (bottom).
44
FERMILAB-CONF-14-050-PPD
Operated by Fermi Research Alliance, LLC under Contract No. De-AC02-07CH11359 with the United States Department of Energy.
xenon. Due to the high density of liquid xenon, 3 g/cm3, material debris of many types,e.g. aluminum, float in it. There is evidence of conductor debris in LUX during the liquidxenon filling period, when bottom array PMTs temporarily shorted when the liquid surfacecrossed that level. This hypothesis will be tested by moving the liquid xenon level across agrid. There are also small PTFE pieces resting on the anode grid, a fine woven mesh, thatmay be responsible for the A-G behavior. Lastly, there is also the possibility of having wiresurface asperities or insulator film depositions that can enhance the local field and producelight discharge, e.g. the Malter effect. Gas-phase conditioning will be performed on theA-G and C-B grids in order to see if any hypothetical contaminants can be removed.
5.3 The XENON experiment
Contributed by M. Messina, Columbia University, New York, NY 10027, USA
5.3.1 Introduction
The results reported in this section have been obtained in the framework of the R&Deffort of the Columbia University group in the XENON project. The XENON detectorsare dual-phase TPCs in which the liquid xenon is used as a target and detection mediumfor particle interactions in which ultraviolet scintillation photons and ionization electronsare generated. The latter, once extracted into the gas phase, lead to the generation ofdelayed scintillation photons. The generation of high voltage is one of the key technologicalchallenges one faces when constructing such dual-phase TPC’s.
One key of the XENON TPC is the utilization of both the prompt VUV and non-prompt ionization-induced scintillation signals to localize events inside the detector. Thelight is measured by PMT arrays installed on top and bottom of the field cage of the TPC.Measurement of the non-prompt signal requires an electric field to drift electrons from theinteraction point through the liquid. Larger drift volumes require larger fields, and thus alarger applied voltage. Moreover, it is important to understand how the ionization electronyield depends on the field amplitude and if this has any effect on yield per unit energy.The behavior of this yield ultimately determines the minimum energy threshold for thedetector, and thus has important consequences for the sensitivity of the experiments.
5.3.2 The high voltage experience of the XENON experiments
To generate an electric field suitable for a ∼ 1 m drift, a voltage on the order of tensof kV is required. To accomplish this voltagefeed-through, the most common solutionis to feed the voltage from outside by means of a vacuum-compatible feed through feed-through. Although feed-throughs capable of handling very high voltage are commerciallyavailable, they cannot be used in detectors designed for a dark matter search because oftheir high radioactivity. Typically the insulating material is a ceramic which has a largeamount of radioactive 40K and thus a major source of gamma background. Thus, for theXENON project a custom made feed-through has been developed. It has the design of acylindrical capacitor where the outer shell is grounded and the central electrode is biased at
45
FERMILAB-CONF-14-050-PPD
Operated by Fermi Research Alliance, LLC under Contract No. De-AC02-07CH11359 with the United States Department of Energy.

the desired voltage. A plastic dielectric capable of withstanding cryogenic temperatures of98 K is placed between the electrodes. Polytetrafluoroethylene (PTFE) was selected for thispurpose since it is the cleanest commercially available dielectric. The XENON10[64] andXENON100[65] TPCs have used such custom-made feed-throughs developed at Columbia.The XENON100 TPC is the only two-phase liquid xenonTPC which has been operatedwith a voltage in excess of 15 kV, and was limited by the phenomena described below,and not by the feed-through. More recently a new design for much higher voltage andwith PTFE replaced by high-density Polyethylene was developed by the XENON groupat UCLA. Several feed-through prototypes have been rmade, and tested in liquid nitrogenup to 100 kV and in liquid xenon up to 75 kV. Details of this testing are given in § 4.4.
It should be noted that the high voltage required to operate a TPC implies not onlythe presence of an appropriate feed-through, but also that any other components areconstructed to prevent sparking when this voltage is applied. This aspect will be clarifiedin the next section.
5.3.3 R&D for the XENON experiments
In Fig. 33, the drawings of the cathode and the cross-section of the field shaping rings areshown together with a zoom of the drawing of the inner side of the 1 m TPC installed inthe Columba University R&D facility[66]. The flat shape of the rings prevent points wherethe field can reach > 100 kV/cm. The 0.5 cm distance between the rings prevents thefield lines from escaping outside of the field cage, preserving the mean value of the electricfield devoted to drift electrons. Furthermore, the large radius of curvature of the bottompart of the cathode is designed to prevent a large field on its surface. For the cathode,this problem is particularly important since it is the last electrode and is exposed to theground: proximity to the ground drastically increases the probability of a spark startingon its surface. Counter to common practice, it has also been found that installing thevoltage divider and associated electrical components inside the field cage helps mitigatethe effects of irregularities in the resistors and/or the presence of sharp soldering edgeswhich are common in such components, both of which can lead to discharges.
In Fig. 33 , the region between the cathode and the cathode surface of the bottomPMTs is visible. The latter is protected by a screening mesh kept at the same potentialas the PMT’s cathode to prevent the accumulation of ions on the PMT window’s surface.This location is also a region of high electric field, with a sizable distance of 5 cm betweenthe cathode and the PMT, and obtained using a specially designed PTFE spacer. Thesurface of the spacer is corrugated such that the mobility of the ionization electrons acrossthe field lines is greatly reduced. This corrugation is necessary to prevent the productionof scintillation light by means of surface conduction between the cathode and screeningmesh.
46
FERMILAB-CONF-14-050-PPD
Operated by Fermi Research Alliance, LLC under Contract No. De-AC02-07CH11359 with the United States Department of Energy.

Figure 33: (top) A picture and a drawing of the cathode for the 1 m TPCat Columbia University for XENON R&D purposes . On the cathode farmthe 200 µm OD wire are also visible. (middle) Detail of the external of thefield cage and of the copper rod connecting the cathode and the feed-through.(bottom) A zoom of the inside of the TPC where the details of the shapingrings, the cathode with its connection to the feed-through, the mesh protectingthe bottom PMT and the PMT positioning are depicted.
47
FERMILAB-CONF-14-050-PPD
Operated by Fermi Research Alliance, LLC under Contract No. De-AC02-07CH11359 with the United States Department of Energy.
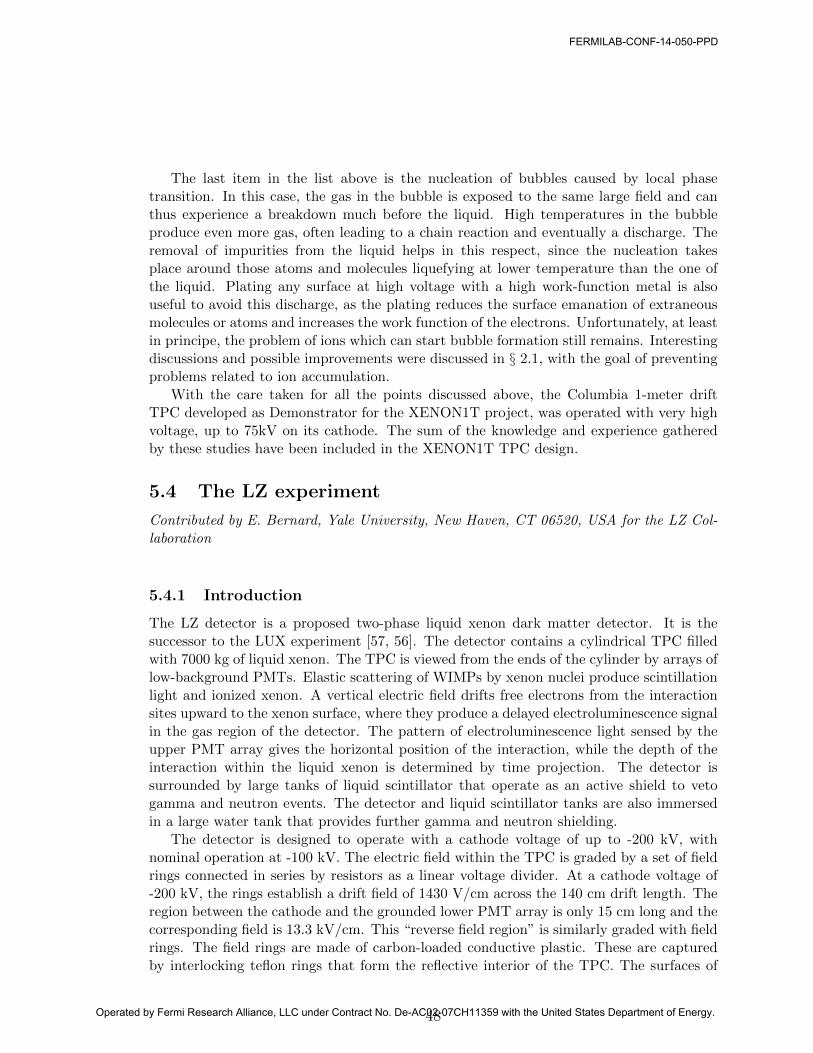
The last item in the list above is the nucleation of bubbles caused by local phasetransition. In this case, the gas in the bubble is exposed to the same large field and canthus experience a breakdown much before the liquid. High temperatures in the bubbleproduce even more gas, often leading to a chain reaction and eventually a discharge. Theremoval of impurities from the liquid helps in this respect, since the nucleation takesplace around those atoms and molecules liquefying at lower temperature than the one ofthe liquid. Plating any surface at high voltage with a high work-function metal is alsouseful to avoid this discharge, as the plating reduces the surface emanation of extraneousmolecules or atoms and increases the work function of the electrons. Unfortunately, at leastin principe, the problem of ions which can start bubble formation still remains. Interestingdiscussions and possible improvements were discussed in § 2.1, with the goal of preventingproblems related to ion accumulation.
With the care taken for all the points discussed above, the Columbia 1-meter driftTPC developed as Demonstrator for the XENON1T project, was operated with very highvoltage, up to 75kV on its cathode. The sum of the knowledge and experience gatheredby these studies have been included in the XENON1T TPC design.
5.4 The LZ experiment
Contributed by E. Bernard, Yale University, New Haven, CT 06520, USA for the LZ Col-laboration
5.4.1 Introduction
The LZ detector is a proposed two-phase liquid xenon dark matter detector. It is thesuccessor to the LUX experiment [57, 56]. The detector contains a cylindrical TPC filledwith 7000 kg of liquid xenon. The TPC is viewed from the ends of the cylinder by arrays oflow-background PMTs. Elastic scattering of WIMPs by xenon nuclei produce scintillationlight and ionized xenon. A vertical electric field drifts free electrons from the interactionsites upward to the xenon surface, where they produce a delayed electroluminescence signalin the gas region of the detector. The pattern of electroluminescence light sensed by theupper PMT array gives the horizontal position of the interaction, while the depth of theinteraction within the liquid xenon is determined by time projection. The detector issurrounded by large tanks of liquid scintillator that operate as an active shield to vetogamma and neutron events. The detector and liquid scintillator tanks are also immersedin a large water tank that provides further gamma and neutron shielding.
The detector is designed to operate with a cathode voltage of up to -200 kV, withnominal operation at -100 kV. The electric field within the TPC is graded by a set of fieldrings connected in series by resistors as a linear voltage divider. At a cathode voltage of-200 kV, the rings establish a drift field of 1430 V/cm across the 140 cm drift length. Theregion between the cathode and the grounded lower PMT array is only 15 cm long and thecorresponding field is 13.3 kV/cm. This “reverse field region” is similarly graded with fieldrings. The field rings are made of carbon-loaded conductive plastic. These are capturedby interlocking teflon rings that form the reflective interior of the TPC. The surfaces of
48
FERMILAB-CONF-14-050-PPD
Operated by Fermi Research Alliance, LLC under Contract No. De-AC02-07CH11359 with the United States Department of Energy.

Figure 34: Features of the high voltage delivery to the cathode of the LZdetector.
each teflon ring terminate at the conductive plastic, leaving a slight gap of xenon betweeneach insulating segment. The teflon rings also contain internal passages for the thick-filmsurface-mount resistors that connect adjacent conductive rings. In both the TPC andreverse field regions the rings repeat with a pitch of 2.5 cm.
To avoid unwanted electroluminescence, the LZ detector limits fields to a maximum of50 kV/cm within the liquid xenon. This limit necessitates placing a gap of 4 cm betweenthe field rings and the wall of the cryostat that contains the detector. The lower thirdof the cryostat wall is bulged outward from the field cage to increase the gap to 8 cmwhere the voltage is highest. The xenon in this gap is observed by PMTs to provide acoincidence signal that is used to veto gamma rays that Compton scatter within the TPCand subsequently interact in the gap.
Differential contraction shortens the height of the plastic field cage relative to thetitanium cryostat. The TPC is supported from below, so that the motion of the TPC dueto thermal contraction is accommodated at the top of the TPC, where the electric fieldsare smallest.
5.4.2 Cathode high voltage delivery in LZ
High voltage is provided to the cathode of the LZ detector through a side arm of the innercryostat, as shown in Fig. 34. This design avoids routing the large high voltage cablealong the side of the TPC or the reverse field regions. Such a routing would require asubstantial reduction in the diameter of the TPC due to the 50 kV/cm field constraint.The high voltage arm extends outward from the inner vessel at an angle of 30 degreesabove the horizontal. The arm is an extension of the xenon space of the inner cryostatand is surrounded by insulating vacuum. In normal operation, liquid xenon fills a lengthof approximately 2.8 meters of the arm, rising to a level equal to that in the detector. The
49
FERMILAB-CONF-14-050-PPD
Operated by Fermi Research Alliance, LLC under Contract No. De-AC02-07CH11359 with the United States Department of Energy.
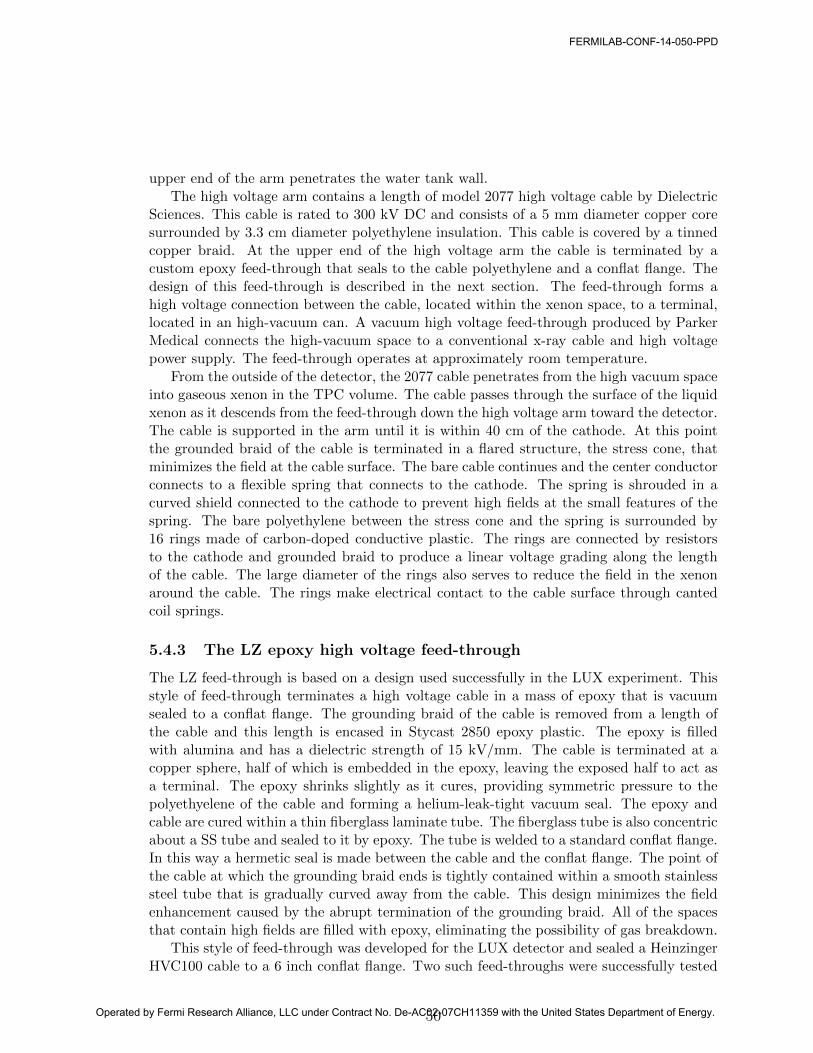
upper end of the arm penetrates the water tank wall.The high voltage arm contains a length of model 2077 high voltage cable by Dielectric
Sciences. This cable is rated to 300 kV DC and consists of a 5 mm diameter copper coresurrounded by 3.3 cm diameter polyethylene insulation. This cable is covered by a tinnedcopper braid. At the upper end of the high voltage arm the cable is terminated by acustom epoxy feed-through that seals to the cable polyethylene and a conflat flange. Thedesign of this feed-through is described in the next section. The feed-through forms ahigh voltage connection between the cable, located within the xenon space, to a terminal,located in an high-vacuum can. A vacuum high voltage feed-through produced by ParkerMedical connects the high-vacuum space to a conventional x-ray cable and high voltagepower supply. The feed-through operates at approximately room temperature.
From the outside of the detector, the 2077 cable penetrates from the high vacuum spaceinto gaseous xenon in the TPC volume. The cable passes through the surface of the liquidxenon as it descends from the feed-through down the high voltage arm toward the detector.The cable is supported in the arm until it is within 40 cm of the cathode. At this pointthe grounded braid of the cable is terminated in a flared structure, the stress cone, thatminimizes the field at the cable surface. The bare cable continues and the center conductorconnects to a flexible spring that connects to the cathode. The spring is shrouded in acurved shield connected to the cathode to prevent high fields at the small features of thespring. The bare polyethylene between the stress cone and the spring is surrounded by16 rings made of carbon-doped conductive plastic. The rings are connected by resistorsto the cathode and grounded braid to produce a linear voltage grading along the lengthof the cable. The large diameter of the rings also serves to reduce the field in the xenonaround the cable. The rings make electrical contact to the cable surface through cantedcoil springs.
5.4.3 The LZ epoxy high voltage feed-through
The LZ feed-through is based on a design used successfully in the LUX experiment. Thisstyle of feed-through terminates a high voltage cable in a mass of epoxy that is vacuumsealed to a conflat flange. The grounding braid of the cable is removed from a length ofthe cable and this length is encased in Stycast 2850 epoxy plastic. The epoxy is filledwith alumina and has a dielectric strength of 15 kV/mm. The cable is terminated at acopper sphere, half of which is embedded in the epoxy, leaving the exposed half to act asa terminal. The epoxy shrinks slightly as it cures, providing symmetric pressure to thepolyethyelene of the cable and forming a helium-leak-tight vacuum seal. The epoxy andcable are cured within a thin fiberglass laminate tube. The fiberglass tube is also concentricabout a SS tube and sealed to it by epoxy. The tube is welded to a standard conflat flange.In this way a hermetic seal is made between the cable and the conflat flange. The point ofthe cable at which the grounding braid ends is tightly contained within a smooth stainlesssteel tube that is gradually curved away from the cable. This design minimizes the fieldenhancement caused by the abrupt termination of the grounding braid. All of the spacesthat contain high fields are filled with epoxy, eliminating the possibility of gas breakdown.
This style of feed-through was developed for the LUX detector and sealed a HeinzingerHVC100 cable to a 6 inch conflat flange. Two such feed-throughs were successfully tested
50
FERMILAB-CONF-14-050-PPD
Operated by Fermi Research Alliance, LLC under Contract No. De-AC02-07CH11359 with the United States Department of Energy.

Figure 35: Block diagram (left) and top flange (right) of the liquid argon highvoltage test system for the LZ experiment.
to −100 kV by terminating the distant end of the cable in silicone transformer oil. For theLZ detector, the epoxy seals the much larger Dielectric Sciences 2077 cable to an 8 inchconflat flange.
5.4.4 The liquid argon high voltage test system for LZ
Although the LZ detector will be a liquid xenon TPC, a liquid argon high voltage testsystem has been constructed at Yale University to test the feed-through design in a lessexpensive medium. The feed-through seals the DS 2077 cable to an 8 inch conflat flange.The bare length of cable surrounded by epoxy is 180 cm long so that fields are verylow outside of the epoxy. This design allows the feed-through to operate with only airinsulation. The outside of the feed-through is surrounded by corona rings and the highvoltage end is terminated in a 22 inch diameter sphere. The sphere is connected to an airinsulated power supply produced by Glassman High Voltage. This feed-through is designedto hold -300 kV; it has been tested to -200 kV for 20 days without any sign of aging orbreakdown.
The feed-through and power supply sit on a metal grating. The cable, enclosed ina vacuum bellows, emerges from the bottom of the feed-through and passes through themetal grating. The bellows seals to the top of a 180 cm tall dewar of liquid argon, andthe cable hangs into the liquid argon from above and terminates at a 4 inch sphere. Thesphere sits 30 cm above a TPB-coated quartz plate that shifts the UV light predominantlyemitted by discharges in liquid argon to 425 nm. This opening is observed by an 8 inchphototube that sits immediately beneath the quartz plate.
51
FERMILAB-CONF-14-050-PPD
Operated by Fermi Research Alliance, LLC under Contract No. De-AC02-07CH11359 with the United States Department of Energy.

This system provides an open cylindrical bore 12 inches in diameter and 45 inches longin which test structures can be observed while supplied with up to -200 kV. This system willbe used to determine if the LZ high voltage structures can operate at full voltage withoutproducing electroluminescence. With the possible addition of an electron lifetime monitor,this system could also explore the relationship between electroluminescence threshold andelectron lifetime.
5.4.5 LZ cathode wire R&D
Contributed by A. Tomas, Blackett Laboratory, Imperial College London, UK in collabora-tion withH. Araujo, Blackett Laboratory, Imperial College London, UKA. Bailey, Blackett Laboratory, Imperial College London, UKT. Sumner, Blackett Laboratory, Imperial College London, UK
The ability of a cathode electrode, usually a wire grid, to withstand the high electric fieldexperienced at the surface of individual wires is under study at Imperial College London.Nominally these fields are much lower than the onset fields for electroluminescence or chargemultiplication in the liquid, the former being 400–700 kV/cm for liquid xenon [67, 68].The fact remains that most practical cathode electrodes in double phase detectors havebeen limited to surface fields of 40–65 kV/cm[69, 70, 71, 72, 73, 74], although the XEDtest chamber operated with substantially higher values of up to 220 kV/cm [75]. Thecold emission of electrons might be a key phenomenon to understand the origin of theselimitations – as well as a useful diagnostic – or an undesirable secondary effect. Singleelectron emission, possibly related with cathode breakdown, is a serious issue to achievethe low energy thresholds, near or below keV energies, which are required in the hunt forlow mass WIMPs.
Electron emission from metal surfaces can be boosted in two different ways: i) a localenhancement of the electric field at a particular point on the surface due to wire imper-fections such as tips, impurities, crystal structure defects, and domain edges, and ii) thepresence of a thin insulator film covering the conductor surface such as xenon ice, deposi-tion of impurities, oxidation and other dynamic effects as described in § 2.1 that will resultin a lower effective work function. The presence of single electron events has been reportedand studied by several experiments [76, 77, 71, 78, 79], although these were mostly foundto be correlated with larger detected interactions – at least below the onset of breakdown.
At Imperial College the R&D activity focusses on a small chamber to test cathodesmade from a single wire; in this way high voltage breakdown issues can be avoided asthe applied voltage will be ∼10 kV and, simultaneously, challenging electric fields canbe applied to the wire surface, i.e. ∼400 kV/cm for 100 µm diameter wire. The uppersurface of the wire will be observed with a PMT looking down from the gas phase, whichwill also detect the VUV electroluminescence (EL) from any charge released from it andthen drifted up and emitted into the vapor. Any electron emission from the cathode can,if accompanied by prompt light, be reconstructed to the cathode depth by electron drifttime with single electron sensitivity allowing the measurement of minute electron emissioncurrents, well before macroscopic breakdown sets in.
52
FERMILAB-CONF-14-050-PPD
Operated by Fermi Research Alliance, LLC under Contract No. De-AC02-07CH11359 with the United States Department of Energy.
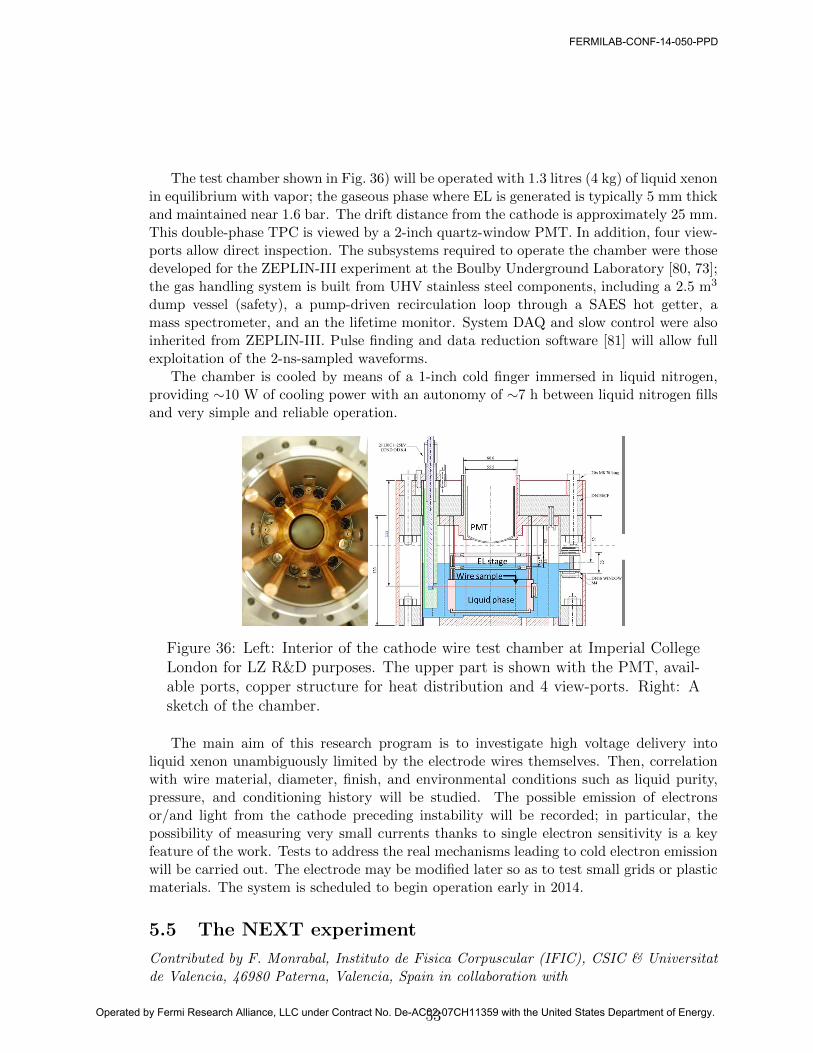
The test chamber shown in Fig. 36) will be operated with 1.3 litres (4 kg) of liquid xenonin equilibrium with vapor; the gaseous phase where EL is generated is typically 5 mm thickand maintained near 1.6 bar. The drift distance from the cathode is approximately 25 mm.This double-phase TPC is viewed by a 2-inch quartz-window PMT. In addition, four view-ports allow direct inspection. The subsystems required to operate the chamber were thosedeveloped for the ZEPLIN-III experiment at the Boulby Underground Laboratory [80, 73];the gas handling system is built from UHV stainless steel components, including a 2.5 m3
dump vessel (safety), a pump-driven recirculation loop through a SAES hot getter, amass spectrometer, and an the lifetime monitor. System DAQ and slow control were alsoinherited from ZEPLIN-III. Pulse finding and data reduction software [81] will allow fullexploitation of the 2-ns-sampled waveforms.
The chamber is cooled by means of a 1-inch cold finger immersed in liquid nitrogen,providing ∼10 W of cooling power with an autonomy of ∼7 h between liquid nitrogen fillsand very simple and reliable operation.
Figure 36: Left: Interior of the cathode wire test chamber at Imperial CollegeLondon for LZ R&D purposes. The upper part is shown with the PMT, avail-able ports, copper structure for heat distribution and 4 view-ports. Right: Asketch of the chamber.
The main aim of this research program is to investigate high voltage delivery intoliquid xenon unambiguously limited by the electrode wires themselves. Then, correlationwith wire material, diameter, finish, and environmental conditions such as liquid purity,pressure, and conditioning history will be studied. The possible emission of electronsor/and light from the cathode preceding instability will be recorded; in particular, thepossibility of measuring very small currents thanks to single electron sensitivity is a keyfeature of the work. Tests to address the real mechanisms leading to cold electron emissionwill be carried out. The electrode may be modified later so as to test small grids or plasticmaterials. The system is scheduled to begin operation early in 2014.
5.5 The NEXT experiment
Contributed by F. Monrabal, Instituto de Fisica Corpuscular (IFIC), CSIC & Universitatde Valencia, 46980 Paterna, Valencia, Spain in collaboration with
53
FERMILAB-CONF-14-050-PPD
Operated by Fermi Research Alliance, LLC under Contract No. De-AC02-07CH11359 with the United States Department of Energy.

C. Sofka, Texas A& M University College Station, Texas 77843-4242, USA,J.J. Gomez-Cadenas, Instituto de Fisica Corpuscular (IFIC), CSIC & Universitat de Va-lencia, 46980 Paterna, Valencia, Spain
The Neutrino Experiment with a Xenon TPC (NEXT) [82] is a search for ββ0ν in 136Xeusing a 100-150 kg high-pressure gaseous xenon (HPGXe) time projection chamber. Toamplify the ionization signal the detector uses EL. Electroluminescence is a linear processwith a large gain that allows to obtain both good energy resolution and event topologicalinformation for background rejection. Compared with the other two Xenon experiment,EXO and KamLAND-ZEN, NEXT displays a much better energy resolution, which canbe as good as 0.5% at Qββ , compared with ∼4% by EXO and 10% by KamLAND-ZEN,and the ability to use the topological information of the event to characterize the signal.
5.5.1 NEXT-100 High Voltage Requirements
The electroluminescence threshold in Xenon is at ∼0.8kV/cm/bar, and the NEXT detectorwill operate well above that threshold. Prototypes have operated stably in a window of 2to 3 kV/cm /bar.With those requirements, the NEXT-100 gate as seen in Fig. 37) shouldbe able to operate up to 25 kV.
Electron recombination is smaller in gas than in liquid Xenon and then, there is nonecessity of using very high fields in the drifting region to preserve the charges and theenergy resolution. The electric field planned for use in the NEXT-100 detector is 300 V/cm.In order to accommodate 100 kg of gas Xenon at 15 bar, a drift volume of 1.2 meters isrequired. This drift distance feed-throughimplies a voltage on the cathode 40kV above thevoltage in the gate of the electroluminescence region. The high voltage feed-through isthen required to hold up to 60-70 kV.
5.5.2 NEXT-DEMO
A large prototype, known as NEXT-DEMO, is operating at IFIC in Valencia, Spain todemonstrate the full NEXT-100 concept. It has two planes of photodetectors, one atthe cathode and one at the anode, a 30 cm long drift region and a field cage capableof withstanding large voltages. The design operative pressure is 10 bar. The vessel is astainless steel cylinder, 60 cm long and 30 cm diameter. The fiducial volume is definedby a hexagonal light-tube made of PTFE reflector panels, 160 mm across the diagonaland 300 mm drift region. The electroluminescence region is made of two parallel gridsseparated by 5 mm. The maximum designed drift field is 1 kV/cm and the maximumelectroluminescence field is 40 kV/cm. Figure 37 shows the field cage of NEXT-DEMO.
Recent results have demonstrated the energy resolution capabilities of the technology,showing energy resolution that extrapolates to 0.87% FWHM at Qββ [83]. The trackingcapabilities of the detector operating with a tracking plane of SiPMs behind the EL regionhas also been shown and first electrons from radioactive sources reconstructed successfully[84].
54
FERMILAB-CONF-14-050-PPD
Operated by Fermi Research Alliance, LLC under Contract No. De-AC02-07CH11359 with the United States Department of Energy.
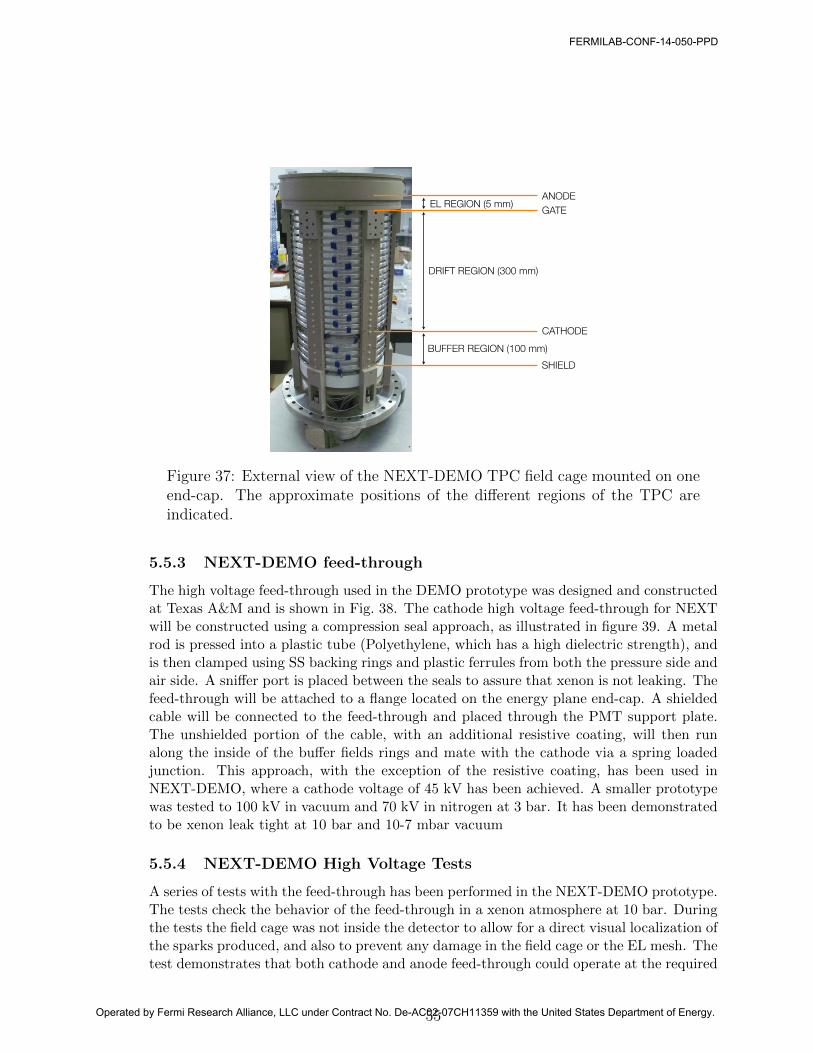
CATHODE
ANODEGATE
DRIFT REGION (300 mm)
EL REGION (5 mm)
SHIELD
BUFFER REGION (100 mm)
Figure 37: External view of the NEXT-DEMO TPC field cage mounted on oneend-cap. The approximate positions of the different regions of the TPC areindicated.
5.5.3 NEXT-DEMO feed-through
The high voltage feed-through used in the DEMO prototype was designed and constructedat Texas A&M and is shown in Fig. 38. The cathode high voltage feed-through for NEXTwill be constructed using a compression seal approach, as illustrated in figure 39. A metalrod is pressed into a plastic tube (Polyethylene, which has a high dielectric strength), andis then clamped using SS backing rings and plastic ferrules from both the pressure side andair side. A sniffer port is placed between the seals to assure that xenon is not leaking. Thefeed-through will be attached to a flange located on the energy plane end-cap. A shieldedcable will be connected to the feed-through and placed through the PMT support plate.The unshielded portion of the cable, with an additional resistive coating, will then runalong the inside of the buffer fields rings and mate with the cathode via a spring loadedjunction. This approach, with the exception of the resistive coating, has been used inNEXT-DEMO, where a cathode voltage of 45 kV has been achieved. A smaller prototypewas tested to 100 kV in vacuum and 70 kV in nitrogen at 3 bar. It has been demonstratedto be xenon leak tight at 10 bar and 10-7 mbar vacuum
5.5.4 NEXT-DEMO High Voltage Tests
A series of tests with the feed-through has been performed in the NEXT-DEMO prototype.The tests check the behavior of the feed-through in a xenon atmosphere at 10 bar. Duringthe tests the field cage was not inside the detector to allow for a direct visual localization ofthe sparks produced, and also to prevent any damage in the field cage or the EL mesh. Thetest demonstrates that both cathode and anode feed-through could operate at the required
55
FERMILAB-CONF-14-050-PPD
Operated by Fermi Research Alliance, LLC under Contract No. De-AC02-07CH11359 with the United States Department of Energy.
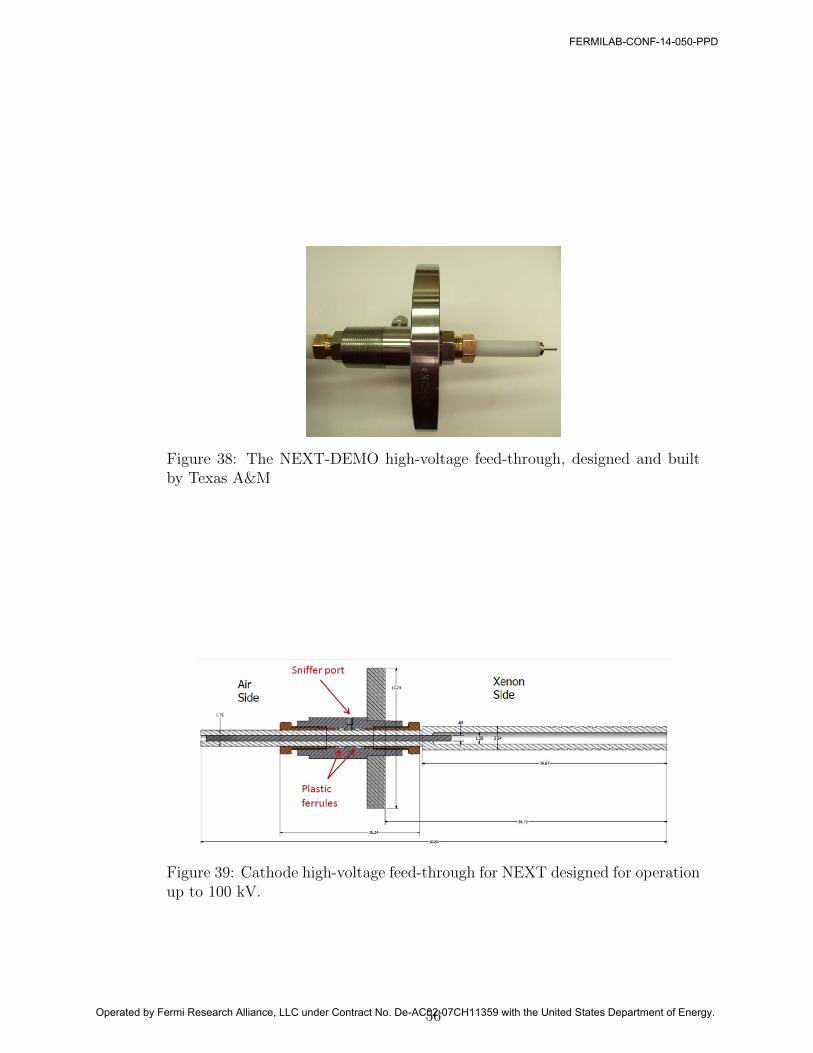
Figure 38: The NEXT-DEMO high-voltage feed-through, designed and builtby Texas A&M
Figure 39: Cathode high-voltage feed-through for NEXT designed for operationup to 100 kV.
56
FERMILAB-CONF-14-050-PPD
Operated by Fermi Research Alliance, LLC under Contract No. De-AC02-07CH11359 with the United States Department of Energy.

Figure 40: Deail of the carbon tracks produced in the polyethylene of thecathode feed-through during the tests in NEXT-DEMO.
Figure 41: Kapton layers preventing charges moving up in the feed-through inNEXT-DEMO.
voltage. However, some carbon tracks did appear in the polyethylene of the feed-throughas seen in Fig. 40. In order to increase the stability of the feed-throughs, a series of kaptonlayers were glued to the polyethylene using vacuum epoxy in order to inhibit the movementof free charges along the dielectric surface of the plastic as shown in Fig. 41. With thisnew configuration NEXT-DEMO detector has been operating in stable conditions the lasttwo years.
5.5.5 Conclusions
The NEXT-DEMO detector has been operating for 2 years without major problems. Thevoltages needed for NEXT-100 detector can be achieved using a very similar design to theone used for the prototype. The NEW detector will placed and operated in LaboratorioSubterrneo de Canfranc (LSC), and the final design for the NEXT-100 feed-through willbe tested there.
57
FERMILAB-CONF-14-050-PPD
Operated by Fermi Research Alliance, LLC under Contract No. De-AC02-07CH11359 with the United States Department of Energy.

6 Lessons Learned and Summary
With proper care it is indeed possible to achieve very high electric fields in the liquidnoble gases. The fundamental dielectric strengths of liquid argon, liquid xenon, and liquidhelium have been measured and found to be greater than 100 kV/cm under good conditions(see Figs. 7, 16, 17, and 26). The ICARUS liquid argon TPC is perhaps the best-knownexample of a working experiment that has achieved stable high voltage performance at-150 kV over a long period of time, and consequently the ICARUS feed-through design hasbeen adopted by many subsequent experiments.
Nevertheless a number of experiments have not achieved their intended high voltagespecification, and, in many cases, the onset of high voltage discharge is far below thatexpected from the dielectric strength of the liquid medium. This indicates that thesedetectors are probably not limited by the fundamental properties of the liquid per se, butare instead limited by practical considerations such as the construction methodology, thebasic design of the high voltage system, or the quality of the conducting and dielectricsurfaces. Indeed, a common element among the successful experiments is that the highvoltage system was treated as a major focus of the design from the beginning. A carefulsimulation of the electric field for a given electrode and insulator geometry followed bybench-top tests seems to be a basic requirement for success, with particular attention paidto the regions with the very highest fields.
There is general agreement that in the presence of a high electric field the interfacebetween dielectric surfaces and the liquid must be treated with care. Charge that ac-cumulates on surfaces could be problematic if it tends to move along the surface in thepresence of a tangential component of the electric field. In the past a common practicewas to avoid all such surfaces in the design phase, protecting dielectrics with field ringsor replacing them with materials of finite resistivity to allow charge to be removed in acontrolled manner. However, for many contemporary applications, exposed dielectrics areunavoidable due to the demanding purity and reflectivity requirements, so this issue mustbe managed in some other way. A common technique is to corrugate the dielectric surfaceso that charge that accumulates becomes trapped and is unable to move across the entiresurface. An electric field simulation plays a major design role here.
Among those experiments that have experienced high voltage difficulties, it seems likelythat a variety of effects are at work. Working hypotheses include gas bubbling, surfaceasperities, the presence of particulates, and the Malter effect. In liquid helium, gas bubblingis believed to be a leading cause of high voltage discharge (§ 3.1.3), and tests in liquid argonprovide supporting evidence (§ 4.5.2). It has been suggested that to mitigate bubblingdifficulties, one should design the high voltage system such that it performs well in apurely gaseous environment. The purity of the liquid medium has also received attentiondue to the evidence that extremely pure liquids have a lower dielectric strength than thosethat are less pure, as shown in Fig. 17.
High voltage performance has long been a central focus in liquid argon TPCs and inliquid helium neutron EDM experiments. The growth of liquid xenon technology in the lastdecade has brought renewed attention from that community as well. Since bench-top testsand working experiments such as ICARUS have demonstrated that the liquid nobles arecapable of withstanding the electric fields that modern experiments require, it seems that
58
FERMILAB-CONF-14-050-PPD
Operated by Fermi Research Alliance, LLC under Contract No. De-AC02-07CH11359 with the United States Department of Energy.

robust performance should be routinely achievable with appropriate engineering, design,testing, and construction controls. This experience bodes well for future experimentalefforts that employ these technologies.
7 Acknowledgements
The speakers at this workshop represented many colleagues from both experimental collab-orations and local university groups. The work they presented was supported by a varietyof funding agencies. The following statements of acknowledgement were supplied by thespeakers and have not been edited.
The work presented in § 4.3 was on behalf of the Albert Einstein Center, Labora-tory of High Energy Physics of the University of Bern. The work presented in § 4.4 issupported by the following research grants: NSF-PHY:1004060, 1242545, and 1104720;URA (Fermilab): 604071; BNL: 238854; LANL:240213-1. It was also supported by thePhysics and Astronomy Machine Shop at UCLA supervised by Harry Lockart. The workin § 5.5 was supported by the Ministerio de Economia y Competitividad of Spain undergrants CONSOLIDER-Ingenio 2010 CSD2008-0037 (CUP) and FPA2009-13697-C04-04;the Director, Office of Science, Office of Basic Energy Sciences, of the US Departmentof Energy under contract number DE-AC02-05CH11231; and the Portuguese FCT andFEDER through the program COMPETE, project PTDC/FIS/103860/2008.
References
[1] L. Malter, Anomalous secondary electron emission, Phys. Rev. 49 (1936) 879.
[2] I. Chirikov-Zorin and O. Pukhov, On sensitivity of gas-discharge detectors to light,Nucl. Instrum. Meth. A 371 (1996) 375–379.
[3] P. L. D. Cieslikowski, A.J. Dahm, Investigation of thin helium films withsurface-bound electrons, Phys. Rev. Lett. 58 (1987) 1751–1754.
[4] J. A. V. L.W. Brush, R. D. Diehl, Progress in the measurement and modeling ofphysisorbed layers, Rev. Mod. Phys. 79 (2007) 1381– 1454.
[5] F. R. F. Forster, S. Hufner, Rare gases on noble-metal surfaces: An angle-resolvedphotoemission study with high energy resolution, J. Phys. Chem. B 108 (2004) 14692.
[6] C. Huuckstadt et al., Work function studies of rare-gas/noble metal adsorptionsystems using a kelvin probe, Phys. Rev. B 73 (2006) 075409.
[7] in preparation.
[8] P. Sorensen et al., Lowering the low-energy threshold of xenon detectors,arXiv:1011.6439.
[9] J. Va‘vra, Volume resistivity of some insulators at cold temperature and electrodlesstpcs, SLAC-PUB-15838.
[10] J. Va‘vra, Review of Wire Chamber Aging, Nucl. Instrum. Meth. A 252 (1986) 547.
59
FERMILAB-CONF-14-050-PPD
Operated by Fermi Research Alliance, LLC under Contract No. De-AC02-07CH11359 with the United States Department of Energy.

[11] J. Allison et al., AN ELECTRODELESS DRIFT CHAMBER, Nucl. Instrum. Meth.201 (1982) 341.
[12] T. M. Ito, Plans for a Neutron EDM Experiment at SNS, J. Phys. Conf. Ser. 69(2007) 012037.
[13] R. Golub and S. K. Lamoreaux, Neutron electric dipole moment, ultracold neutronsand polarized He-3, Phys. Rep. 237 (1994).
[14] C. A. Baker et al., An Improved experimental limit on the electric dipole moment ofthe neutron, Phys. Rev. Lett. 97 (2006) 131801.
[15] K. H. Weber and H. S. Endicott Trans. Am. Inst. Elec. Eng. 75 (1956) 371.
[16] R. Golub Sov. Phys. Tech. Phys. 31 (1986) 945.
[17] In the actual nEDM experiment, the achievable field was further lowered due toother factors.
[18] M. J. Kofoid Trans. Am. Inst. Elec. Eng. 79 (1960) 999.
[19] J. D. Cobine, Gaseous Conductors: Theory and Engineering Applications. McGrawHill, 1958.
[20] A. Ereditato and A. Rubbia, Ideas for future liquid Argon detectors, Nucl. Phys.Proc. Suppl. 139 (2005) 301.
[21] A. Ereditato and A. Rubbia, Conceptual design of a scalable multi-ktonsuperconducting magnetized liquid Argon TPC, Nucl. Phys. Proc. Suppl. 154 (2006)163.
[22] A. Ereditato and A. Rubbia, Conceptual design of a scalable multi-ktonsuperconducting magnetized liquid Argon TPC, Nucl. Phys. Proc. Suppl. 155 (2006)233.
[23] A. Ereditato et al., Study of ionization signals in a liquid Argon TPC doped withNitrogen, JINST 3 (2008) P10002.
[24] A. Ereditato et al., Ionization signals from electrons and alpha-particles in mixturesof liquid Argon and Nitrogen: Perspectives on protons for Gamma Resonant NuclearAbsorption applications, JINST 5 (2010) P10009.
[25] M. Zeller, Development of a tpc filled with a mixture of liquid argon and nitrogen forg-ray resonant absorption applications, Master’s thesis, Universitat Bern, 2009.
[26] B. Rossi et al., A Prototype liquid Argon Time Projection Chamber for the study ofUV laser multi-photonic ionization, JINST 4 (2009) P07011.
[27] I. Badhrees et al., Measurement of the two-photon absorption cross-section of liquidargon with a time projection chamber, New. J. Phys. 12 (2010) 113024.
[28] I. Kreslo et al., Pulse-shape discrimination of scintillation from alpha and betaparticles with liquid scintillator and Geiger-mode multipixel avalanche diodes, JINST6 (2011) P07009.
[29] ICARUS Collaboration, S. Amerio et al., Design, construction and tests of theICARUS T600 detector, Nucl. Instrum. Meth. A 527 (2004) 329.
60
FERMILAB-CONF-14-050-PPD
Operated by Fermi Research Alliance, LLC under Contract No. De-AC02-07CH11359 with the United States Department of Energy.

[30] A. Ereditato et al., 30 kV coaxial vacuum-tight feedthrough for operation atcryogenic temperatures, JINST 5 (2010) T11002.
[31] A. Ereditato et al., Design and operation of argontube: a 5 m long drift liquid argontpc, JINST 8 (2013) P07002.
[32] MicroBooNE collaboration, MicroBooNE technical design review,http://www-microboone.fnal.gov/.
[33] D. Swan, Electron attachment processes in liquid argon containing oxygen ornitrogen impurity, Proc. Phys. Soc. 82 (1963) 74.
[34] D. Swan, Drift velocities of electrons in liquid argon, and the influence of molecularimpurities, Proc. Phys. Soc. 83 (1964) 659.
[35] D. Swan and T. Lewis, The influence of cathode and anode surfaces on the electricstrength of liquid argon, Proc. Phys. Soc. 78 (1961) 448.
[36] M. Zeller, Advances in liquid Argon TPC’s for particle detectors. PhD thesis,Universitat Bern, 2013.
[37] LBNE Collaboration, C. Adams et al., Scientific Opportunities with theLong-Baseline Neutrino Experiment, arXiv:1307.7335.
[38] CAPTAIN Collaboration, H. Berns et al., The CAPTAIN Detector and PhysicsProgram, arXiv:1309.1740.
[39] D. Alton and others, (2010)http://lartpc-docdb.fnal.gov/0005/000581/001/
DarkSide50 DOE Project Narrative FNAL.pdf.
[40] L. G. Christophorou, Insulating gases, Nucl. Instrum. Meth. A 268 (1988) 424–433.
[41] A. Stahl et al., Expression of Interest for a very long baseline neutrino oscillationexperiment (LBNO), CERN-SPSC-2012-021.
[42] C. Cantini et al., Long-term operation of a double phase LAr LEM Time ProjectionChamber with a simplified anode and extraction-grid design, 1312.6487.
[43] A. Badertscher et al., First operation and performance of a 200 lt double phase LArLEM-TPC with a 40x76 cm2 readout, JINST 8 (2013) P04012.
[44] A. Badertscher et al., First operation of a double phase LAr Large ElectronMultiplier Time Projection Chamber with a two-dimensional projective readoutanode, Nucl. Instrum. Meth. A 641 (2011) 48.
[45] A. Badertscher et al., A tagged low-momentum kaon test-beam exposure with a 250LLAr TPC (J-PARC T32), J. Phys. Conf. Ser. 308 (2011) 012016.
[46] A. Badertscher et al., Operation of a double-phase pure argon Large ElectronMultiplier Time Projection Chamber: Comparison of single and double phaseoperation, Nucl. Instrum. Meth. A 617 (2010) 188.
[47] A. Badertscher et al., Construction and operation of a Double Phase LAr LargeElectron Multiplier Time Projection Chamber, 0811.3384.
61
FERMILAB-CONF-14-050-PPD
Operated by Fermi Research Alliance, LLC under Contract No. De-AC02-07CH11359 with the United States Department of Energy.

[48] LAGUNA-LBNO FP7 Design study, EC Grant Agreement no 284518,http://laguna-science.eu.
[49] Heinzinger PNC 100000. Heinzinger electronic GmbH, Rosenheim, Germany.http://www.heinzinger.com.
[50] W. Rogowski, The electrical strength at the edge of flat plate capacitors: Acontribution to the theory of spark gaps and feedthroughs, Arch.Elektrotech. 12(1923) 1.
[51] COMSOL Multiphysics: http://www.comsol.com.
[52] M. Auger et al., The EXO-200 detector, part I: Detector design and construction,JINST 7 (2012) P05010.
[53] SAES, http://www.saespuregas.com/.
[54] ANSYS/Ansoft,http://www.ansoft.com/products/em/maxwell/.
[55] W. Tauchert and W.F. Schmidt, Z. Naturforsch. 30a, (1975) 1085-1086. See alsoLiquid State Electronics of Dielectric Liquids’, W.F. Schmidt, CRC Press, 1997.
[56] LUX Collaboration, D. S. Akerib et al., First results from the LUX dark matterexperiment at the Sanford Underground Research Facility, arXiv:1310.8214.
[57] LUX Collaboration Collaboration, D. S. Akerib et al., The Large UndergroundXenon (LUX) Experiment, Nucl. Instrum. Meth. A 704 (2013) 111.
[58] ZEPLIN-III Collaboration, V. N. Lebedenko et al., Result from the First ScienceRun of the ZEPLIN-III Dark Matter Search Experiment, Phys. Rev. D 80 (2009)052010.
[59] XENON Collaboration, J. Angle et al., First Results from the XENON10 DarkMatter Experiment at the Gran Sasso National Laboratory, Phys. Rev. Lett. 100(2008) 021303.
[60] LUX Collaboration, D. S. Akerib et al., Technical Results from the Surface Run ofthe LUX Dark Matter Experiment, Astropart. Phys. 45 (2013) 34.
[61] K. McDonald, ’Notes on Electrostatic Wire Grids,’www.hep.princeton.edu/∼mcdonald/examples/grids.pdf.
[62] R. Hanaoka et al., Pre-breakdown current in liquid nitrogen under dc nonuniformfield, Nucl. Instrum. Meth. A 327 (1993) 107.
[63] V. Atrazhev et al., Mechanisms of impulse breakdown in liquid: The role of jouleheating and formation of gas cavities, IEEE Transactions on Plasma Science 38(2010), no. 10.
[64] J. Angle et al., First Results from the XENON10 Dark Matter Experiment at theGran Sasso National Laboratory, Phys. Rev. Lett. 100 (2008) 021303.
[65] E. Aprile et al., Dark Matter Results from 225 Live Days of XENON100 Data, Phys.Rev. Lett. 109 (2012) 181301.
62

[66] E. Aprile et al., Performance of a cryogenic system prototype for the XENON1TDetector, JINST 7 (2012) P10001.
[67] S. E. Derenzo, T. S. Mast, H. Zaklad, and R. A. Muller, Electron avalanche in liquidxenon, Phys. Rev. A 9 (1974) 2582–2591.
[68] K. Masuda, S. Takasu, T. Doke, T. Takahashi, A. Nakamoto, S. Kubota, andE. Shibamura, A liquid xenon proportional scintillation counter, Nucl. Instrum.Meth. 160 (1979) 247–253.
[69] A. S. Howard, Dark matter searches by the Boulby Collaboration and liquid xenonprototype development, Phys. At. Nucl. 67 (2004) 2032–2040.
[70] V. N. Lebedenko, H. M. Araujo, E. J. Barnes, A. Bewick, R. Cashmore, V. Chepel,et al., Results from the first science run of the ZEPLIN-III dark matter searchexperiment, Phys. Rev. D 80 (2009) 052010.
[71] A. A. Burenkov, D. Y. Akimov, Y. L. Grishkin, A. G. Kovalenko, V. N. Lebedenko,V. N. Solovov, et al., Detection of a single electron in xenon-based electroluminescentdetectors, Phys. At. Nuc. 72 (2009) 653–661.
[72] V. N. Lebedenko, H. M. Araujo, E. J. Barnes, A. Bewick, R. Cashmore, V. Chepel,et al., Results from the first science run of the ZEPLIN-III dark matter searchexperiment, Phys. Rev. D 80 (2009) 052010.
[73] D. Akimov, I. Aleksandrov, V. Belov, A. Bolozdynya, A. Burenkov, Y. Efremenko,et al., Measurement of single-electron noise in a liquid-xenon emission detector,Instrum. Exp. Tech. 55 (2012) 423–428.
[74] LUX Collaboration, D. S. Akerib et al., First results from the LUX dark matterexperiment at the Sanford Underground Research Facility, ArXiv e-prints (Oct.,2013) [arXiv:1310.8214].
[75] T. Shutt, C. E. Dahl, J. Kwong, A. Bolozdynya, and P. Brusov, Performance andfundamental processes at low energy in a two-phase liquid xenon dark matterdetector, Nucl. Instrum. Meth. A 579 (2007) 451–453.
[76] B. Edwards, H. M. Araujo, V. Chepel, D. Cline, T. Durkin, J. Gao, et al.,Measurement of single electron emission in two-phase xenon, Astropart.Phys. 30(2008) 54–57.
[77] P. F. Sorensen, A Position-Sensitive Liquid Xenon Time-Projection Chamber forDirect Detection of Dark Matter: The XENON10 Experiment. PhD thesis, BrownUniversity, 2008.
[78] E. Santos, B. Edwards, V. Chepel, H. Araujo, D. Akimov, E. Barnes, et al., Singleelectron emission in two-phase xenon with application to the detection of coherentneutrino-nucleus scattering, JHEP 2011 (2011) 1–20.
[79] E. Aprile, M. Alfonsi, K. Arisaka, et al., Observation and applications ofsingle-electron charge signals in the XENON100 experiment, ArXiv e-prints (2013)[arXiv:1311.1088].
63

[80] ZEPLIN-III Collaboration, D. Y. Akimov, G. J. Alner, H. M. Araujo, A. Bewick,C. Bungau, A. A. Burenkov, et al., The ZEPLIN-III dark matter detector:Instrument design, manufacture and commissioning, Astropart. Phys. 27 (2007)46–60.
[81] F. Neves, D. Y. Akimov, H. M. Araujo, E. J. Barnes, V. A. Belov, A. A. Burenkov,et al., ZE3RA: the ZEPLIN-III reduction and analysis package, JINST 6 (2011)P11004.
[82] NEXT Collaboration, V. Alvarez et al., NEXT-100 Technical Design Report(TDR): Executive Summary, JINST 7 (2012) T06001.
[83] NEXT Collaboration, V. Alvarez et al., Initial results of next-demo, a large-scaleprototype of the next-100 experiment, arXiv:1211.4838.
[84] NEXT Collaboration, V. Alvarez et al., Operation and first results of theNEXT-DEMO prototype using a silicon photomultiplier tracking array, JINST 8(2013) P09011, [arXiv:1306.0471].
64