Quality Assurance Project Plan for Noble Energy, Inc ......Quality Assurance Project Plan for Noble...
67
Transcript of Quality Assurance Project Plan for Noble Energy, Inc ......Quality Assurance Project Plan for Noble...

Quality Assurance Project Plan for Noble Energy, Inc. Revision 2
May 5, 2017 Pressurized Hydrocarbon Liquids Sampling & Analysis Study (DJCD-PHLAS-RFP-0002) Page 1 of 66
Section A – Project Management
A.1 QAPP for Noble Energy, Inc. – Pressurized Hydrocarbon Liquids Sampling and Analysis
Study (DJCD-PHLAS-RFP-0002)
Prepared by:
________________________________________________ Date: ________________________
Diana Bowling, Quality Director
Southern Petroleum Laboratories, Inc.
Approved by:
________________________________________________ Date: ________________________
Susan Gomez, EHSR Manager
Noble Energy, Inc.
________________________________________________ Date: ________________________
Joe Landes, Executive V.P. of Technical Services
Southern Petroleum Laboratories, Inc.

Quality Assurance Project Plan for Noble Energy, Inc. Revision 2
May 5, 2017 Pressurized Hydrocarbon Liquids Sampling & Analysis Study (DJCD-PHLAS-RFP-0002) Page 2 of 66
A.2 Table of Contents
SECTION DESCRIPTION PAGE
Section A – Project Management
A.1 QAPP for Noble Energy, Inc. – Pressurized Hydrocarbon Liquids Sampling and
Analysis Study (DJCD-PHLAS-RFP-0002) .......................................................................... 1
A.2 Table of Contents ............................................................................................................. 2
A.3 Distribution and Contact List ........................................................................................... 6
A.4 Project/Task Organization ............................................................................................... 7
A.5 Problem Definition/Background .................................................................................... 11
A.6 Summary of Project/Task Description ........................................................................... 12
A.7 Quality Objectives and Criteria for Measurement Data ................................................ 13
A.8 Special Training Requirements/Certifications ............................................................... 18
A.9 Documents and Records ................................................................................................ 18
Section B – Data Generation and Acquisition
B.1 Sampling Process Design................................................................................................ 20
B.2 Sampling Methods ......................................................................................................... 20
B.3 Sample Handling, Custody, and Preparation ................................................................. 23
B.4 Analytical Methods ........................................................................................................ 25
B.5 Quality Control –Analytical Procedures and Requirements for Data Quality
Objectives (DQOs) .......................................................................................................... 32
B.6 Instrument / Equipment Testing, Inspection, & Maintenance Requirements .............. 53
B.7 Instrument Calibration& Frequency .............................................................................. 53
B.8 Inspection and Acceptance Requirements for Supplies and Consumables .................. 59
B.9 Data Acquisition Requirements for Non-Direct Measurements ................................... 59
B.10 Data Management ......................................................................................................... 60
Section C – Assessment and Oversight
C.1 Assessment and Response Actions ................................................................................ 61
C.2 Reports to Management ................................................................................................ 61
Section D – Data Validation and Usability
D.1 Data Review, Verification, and Validation ..................................................................... 61
D.2 Data Verification and Validation Methods .................................................................... 61
D.3 Reconciliation with User Requirements ........................................................................ 64
Appendix 1 – Summary of Updates to QAPP Revision 2 ........................................................ 65

Quality Assurance Project Plan for Noble Energy, Inc. Revision 2
May 5, 2017 Pressurized Hydrocarbon Liquids Sampling & Analysis Study (DJCD-PHLAS-RFP-0002) Page 3 of 66
List of Tables in QAPP
Table 1. List of Documents Referenced in the QAPP ..................................................................... 5
Table 2. QAPP Distribution and Contact List .................................................................................. 6
Table 3. Results and Reporting Distribution List ............................................................................ 7
Table 4. Responsibilities of Key Personnel ................................................................................... 10
Table 5. PHLSA Study Summary(corresponds to “Tasks” Table in Work Plan Section 2) ............ 12
Table 6. Data Quality Indicators (DQIs) for GC Test Methods ..................................................... 16
Table 7. Data Quality Indicators (DQIs) for ASTM Test Methods ................................................ 17
Table 8. List of Sampling Methods ............................................................................................... 20
Table 9. Number of Purge Cycles for PF&E Method .................................................................... 22
Table 10. Spot Sample Minimum Requirements ......................................................................... 23
Table 11. List of Analytical Methods ............................................................................................ 26
Table 12. Scope for GPA 2103, GPA 2177, and GPA 2186 ............................................................ 29
Table 13. Applicable concentration ranges for GPA 2261 (C6 Gas Analysis) and GPA
2177 (C6 Liquid Analysis) Precision Criteria ................................................................. 41
Table 14. Data Quality Objectives (DQOs) for GPA 2103 C7+ Condensate Test Method ............ 42
Table 15. Data Quality Objectives (DQOs) for GPA 2177 C6+ Liquids Test Method.................... 43
Table 16. Data Quality Objectives (DQOs) for GPA 2186 Extended Liquids Test Method .......... 44
Table 17. Data Quality Objectives (DQOs) for GPA 2103 Extended Condensate (C6-C10
Cuts) Test Method ........................................................................................................ 45
Table 18. Data Quality Objectives (DQOs) for GPA 2261 C6+ Gas (Benchtop GC) Test
Method ......................................................................................................................... 46
Table 19. Data Quality Objectives (DQOs) for GPA 2261 C6+ Gas (Portable GC) Test
Method ......................................................................................................................... 47
Table 20. Data Quality Objectives (DQOs) for GPA 2286 Extended Gas Test Method ................ 48
Table 21. Data Quality Objectives (DQOs) for ASTM D1945-1946 Refinery Gas Test
Method (TCD Channels) ............................................................................................... 49
Table 22. Data Quality Objectives (DQOs) for ASTM D1945-1946 Refinery Gas Test
Method (FID Channel) .................................................................................................. 50
Table 23. Data Quality Objectives (DQOs) for ASTM D2887 High Temperature
Simulated Distillation Test Method .............................................................................. 51
Table 24. Data Quality Objectives (DQOs) for ASTM Test Methods ............................................ 52
Table 25. Bernhardt PC-J31Well Production Facility Instrumentation List and
Specifications ................................................................................................................ 55
List of Figures in QAPP
Figure 1 - SPL Chain of Custody (COC) .......................................................................................... 24
Quality Assurance Project Plan for Noble Energy, Inc. Revision 2
May 5, 2017 Pressurized Hydrocarbon Liquids Sampling & Analysis Study (DJCD-PHLAS-RFP-0002) Page 4 of 66
Documents Referenced in the Quality Assurance Project Plan This Quality Assurance Project Plan (“QAPP”) is intended as a complimentary document to be used in conjunction with the Pressurized HC Liquids Sampling and Analysis Study Work Plan (the “Work Plan”). Extensive references to those documents are made throughout this QAPP. It is necessary to have the referenced versions of the Work Plan and Uncertainty Analysis Processes readily available when reviewing the QAPP, as many of the tables and references are not repeated throughout the various documents. Additional documents referenced in this QAPP are listed in QAPP Table 1 below; SPL SOPs are not included in the QAPP and are available by request. The reference methodology (ASTM, GPA documents, etc.) listed in QAPP Table 1 must be purchased independently by the reader due to licensing and copyright agreements.

Quality Assurance Project Plan for Noble Energy, Inc. Revision 2
May 5, 2017 Pressurized Hydrocarbon Liquids Sampling & Analysis Study (DJCD-PHLAS-RFP-0002) Page 5 of 66
Table 1. List of Documents Referenced in the QAPP
ID/Version Brief Description
Work Plan PHLSA Study Work Plan
GPA 2198 Selection, Preparation, Validation, Care, and Storage of Natural Gas and Natural Gas Liquids Reference Standard Blends
GPA 2177 Analysis of Natural Gas Liquid Mixtures Containing Nitrogen and Carbon Dioxide by Gas Chromatography
GPA 2186 Method for the Extended Analysis of Hydrocarbon Liquid Mixtures Containing Nitrogen and Carbon Dioxide by Temperature Programmed Gas Chromatography
GPA 2261 Analysis for Natural Gas and Similar Gaseous Mixtures by Gas Chromatography
GPA 2286 Method of Extended Analysis for Natural Gas and Similar Gaseous Mixtures by Temperature Programmed Gas Chromatography
GPA 2103 Method for the Analysis of Natural Gas Condensate Mixtures Containing Nitrogen and Carbon Dioxide by Gas Chromatography
GPA 2174 Obtaining Liquid Hydrocarbon Samples for Analysis by Gas Chromatography
GPA 2166 Obtaining Natural Gas Samples for Analysis by Gas Chromatography
API MPMS 8.1
Standard Practice for Manual Sampling of Petroleum and Petroleum Products (Liquid Sampling – Thief Method)
GPA 2145 Table of Physical Properties for Hydrocarbon and Other Compounds of Interest to the Natural Gas Industry
GPA TP 17 Table for Physical Properties of Hydrocarbons for Extended Analysis of Natural Gases
Yaws, 2005 Yaw’s Handbook of Physical Properties, published 2005
ASTM D2887
Boiling Range Distribution of Petroleum Fractions by Gas Chromatography
FLD-L8.1 (SPL SOP) Liquid Sampling
FLD-G14.1 (SPL SOP)Gas Sampling
HY-M10 (SPL SOP) GPA 2261 – C6 Gas Analysis
HY-M9 (SPL SOP) GPA 2286 – Extended Gas Analysis
HY-M6 (SPL SOP) GPA 2177 – C6 Liquid Analysis
HY-M8 (SPL SOP) GPA 2186 – Extended Liquid Analysis
HY-M15 (SPL SOP) GPA 2103 – Condensate Analysis
HY-M33 (SPL SOP) Physical Shrinkage Determination
HY-M32 (SPL SOP) ASTM D2001M / D86M – Distillations for Condensate Analysis
HY-M23 (SPL SOP) ASTM D5001 – Digital Densitometer
HY-13 (SPL SOP) Molecular Weight by Cryette
HY/SM-P15 (SPL SOP) Sample Receipt and Login
QA-P41 (SPL SOP) Validation of New Calibration Standards

Quality Assurance Project Plan for Noble Energy, Inc. Revision 2
May 5, 2017 Pressurized Hydrocarbon Liquids Sampling & Analysis Study (DJCD-PHLAS-RFP-0002) Page 6 of 66
A.3 Distribution and Contact List
This section lists all individuals from each organization who require copies of this Quality
Assurance Project Plan (“QAPP”) and any subsequent revisions, including all persons
responsible for implementation.
Table 2. QAPP Distribution and Contact List
Name Company Title Email Phone
Joe Landes SPL VP Hydrocarbon
Services
[email protected] 713-660-0901
x1242
Jonathan
Ochterbeck
SPL QA
Coordinator/Anal
yst
[email protected] 713-660-0901
x1189
Joel Grice SPL GM,
Houston/Pleasan
ton
[email protected] 713-660-0901
x2207
Meridith
Spurlock
SPL Safety Director [email protected] 713-660-0901
x1255
Diana
Bowling
SPL Quality Director [email protected] 713-660-0901
x1181
Royce
Miller
SPL VP Technical
Services
[email protected] 713-660-0901
x1241
Chris Staley SPL Lab Manager,
Houston/Pleasan
ton
[email protected] 713-660-0901
x1188
Tom Benz SPL Houston Asst.
Lab Manager
[email protected] 713-660-0901
x1182
Ricky Rayon SPL Blending
Manager
[email protected] 713-660-0901
x1171
Bill Theriot SPL Technical
Director -
Allocations
[email protected] 281-485-8705
x115
Ricardo
Aguiar
Movilab General [email protected] 552-129-3434
Bill
Obermann
Noble
Energy
EHSR Manager [email protected] M: 303-947-1446
D: 720-587-2204
Susan Noble EHSR Manager [email protected] 303-228-4089
Quality Assurance Project Plan for Noble Energy, Inc. Revision 2
May 5, 2017 Pressurized Hydrocarbon Liquids Sampling & Analysis Study (DJCD-PHLAS-RFP-0002) Page 7 of 66
Gomez Energy
Alon
Mandel
Noble
Energy
Env. Engineer [email protected] M: 303-717-0369
D: 303-228-4053
Scott
Patefield
EPA TAP Member [email protected] 303-312-6248
Alicia Frazier
CDPHE TAP Member [email protected] M: 720-253-3382 D: 303-692-3179
Mike Pearson
APT Laboratories
TAP Member [email protected] 303-420-5949
Thomas McGrath
IES Engineer [email protected] 714-315-4040
Alex Casetta
Eagle Automation
Instrumentation Lead
[email protected] 970-201-3940
Dave Picard TAP Member
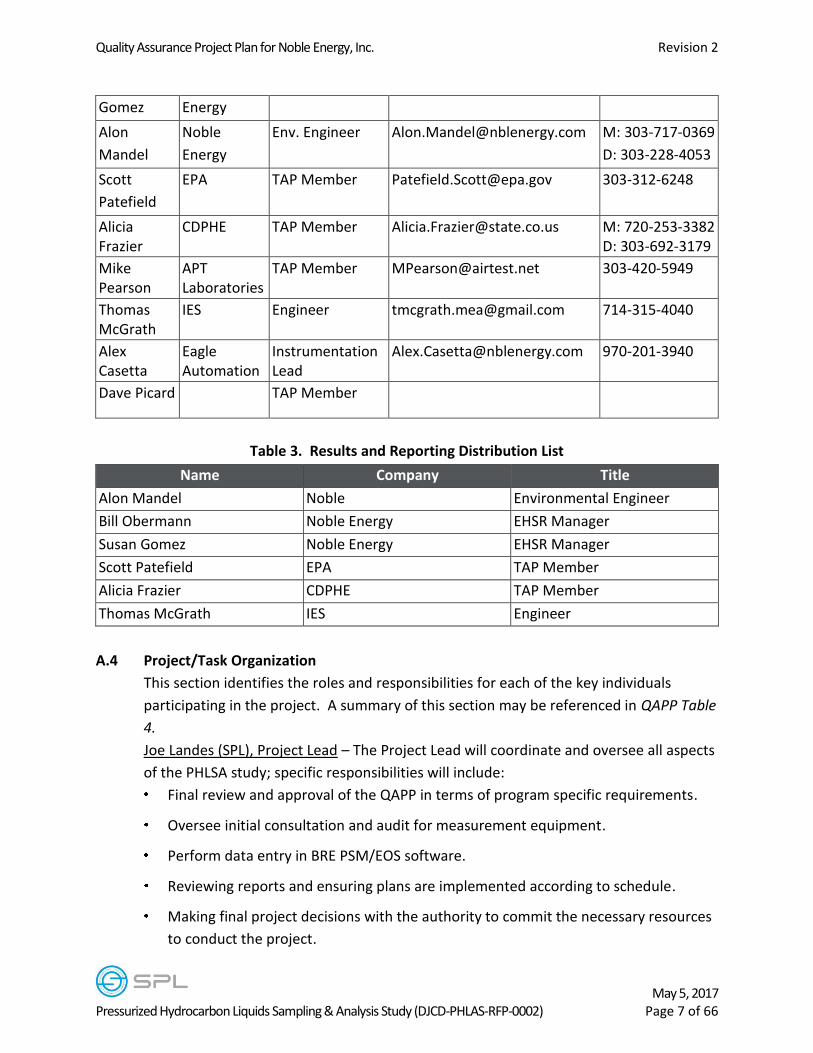
Table 3. Results and Reporting Distribution List
Name Company Title
Alon Mandel Noble Environmental Engineer
Bill Obermann Noble Energy EHSR Manager
Susan Gomez Noble Energy EHSR Manager
Scott Patefield EPA TAP Member
Alicia Frazier CDPHE TAP Member
Thomas McGrath IES Engineer
A.4 Project/Task Organization
This section identifies the roles and responsibilities for each of the key individuals
participating in the project. A summary of this section may be referenced in QAPP Table
4.
Joe Landes (SPL), Project Lead – The Project Lead will coordinate and oversee all aspects
of the PHLSA study; specific responsibilities will include:
Final review and approval of the QAPP in terms of program specific requirements.
Oversee initial consultation and audit for measurement equipment.
Perform data entry in BRE PSM/EOS software.
Reviewing reports and ensuring plans are implemented according to schedule.
Making final project decisions with the authority to commit the necessary resources
to conduct the project.

Quality Assurance Project Plan for Noble Energy, Inc. Revision 2
May 5, 2017 Pressurized Hydrocarbon Liquids Sampling & Analysis Study (DJCD-PHLAS-RFP-0002) Page 8 of 66
Reporting to Noble regarding status of PHLSA study and benchmark results and
preparing interim and final reports.
Chris Staley (SPL), Assistant Project Lead and Houston /Pleasanton Laboratory Manager:
Coordinating receipt of samples at the laboratory.
Selecting the analytical team members.
Distribute applicable sections of the QAPP and subsequent revisions to members of
the analytical team.
Coordinating the analysis of the sample and laboratory validation data.
Report any laboratory problems affecting the project data to the Project Lead.
Will serve as backup for Project Lead for reporting status to Noble, preparing
reports, and making final project decisions as needed.
Joel Grice (SPL), Environmental Regulatory Advisor:
Will remain independent of the groups responsible for data generation.
Provide technical assistance to the Project Lead regarding environmental regulatory
issues.
Oversee and coordinate field and laboratory activities
Will serve as backup for Project Lead for review and approval of QAPP.
Meridith Spurlock (SPL), Advisor for Environmental Health and Safety:
Provide technical assistance to the Project Lead regarding EHS and air quality issues.
Perform data entry and PSM/EOS sensitivity study with E&P Tank software.
Diana Bowling (SPL), Advisor for Quality Assurance and Quality Control:
Will remain independent of the groups responsible for data generation.
Provide technical assistance to the Project Lead regarding QAQC.
Developing, maintaining, and distributing the QAPP to all personnel as detailed in
QAPP Table 2.
Perform laboratory QA audits of the project to verify conformance to QAPP. At this
time, no audits are planned; however, Noble may request an audit at any time
during the project. If an audit is conducted, results will be reported to the Project
Lead who will then submit to Noble.
Royce Miller (SPL), Consulting, Sampling, and Measurement:
Perform initial audit and consultation for measurement equipment needed for
study.

Quality Assurance Project Plan for Noble Energy, Inc. Revision 2
May 5, 2017 Pressurized Hydrocarbon Liquids Sampling & Analysis Study (DJCD-PHLAS-RFP-0002) Page 9 of 66
Select the field technician team members.
Ensure sampling and measurement procedures are performed per the QAPP.
Will serve as backup for Project lead for consultation and audit of measurement
equipment.
Calibration of meters and gauges.
Tom Benz (SPL), ASTM Technical Advisor:
Provide technical assistance to Project Lead regarding ASTM procedures.
Oversee ASTM analytical procedures and verify they are performed per the QAPP.
Review and approve data before reporting.
Perform depentanization of initial samples to obtain hexanes plus “lot” for CRMs.
Jonathan Ochterbeck (SPL), ASTM Analyst and QA Coordinator:
Assist with analytical data review prior to reporting results.
Assist with PSM modeling.
Richard Rayon (SPL), Blending Manager:
Generate Certified Reference Materials (CRMs) in accordance with stated
composition for PHLSA study.
Validate CRMs against alternate vendor’s calibration standards to ensure
composition.
Bill Theriot (SPL), Technical Director Allocations:
Develop PSM model for all PSM/EOS users to implement.
Develop SOP for set up and data entry into PSM/EOS.
Perform data entry in VMG software.
Perform mass balance calculations.
Serve as backup for Project Lead for data entry in BRE PSM/EOS software.
Ricardo Aguiar (Movilab), Consulting, and Measurement:
Perform sensitivity studies.
Perform uncertainty analysis.
Bill Oberman (Noble), EHSR Manager:
Project oversight.
Document review and approval.
Susan Gomez (Noble), EHSR Manager:

Quality Assurance Project Plan for Noble Energy, Inc. Revision 2
May 5, 2017 Pressurized Hydrocarbon Liquids Sampling & Analysis Study (DJCD-PHLAS-RFP-0002) Page 10 of 66
Project oversight.
Document review and approval.
Alon Mandel (Noble), Environmental Engineer:
Responsible for reviewing QAPP, work plans, and reports.
Coordination between SPL sampling team, instrumentation, site operations, and
instrumentation data analysis.
Perform calculations in HYSYS and Promax based on SPL’s modeling instructions.
Alex Casetta (Eagle Automation), Instrumentation Lead:
Responsible for installing, calibrating, and operating instrumentations (e.g. process
temperature, pressure, and flow rate measurements.
Data download and management.
Ed Riggs (Noble), Site Operator and System Foreman:
Well Site Operations.
Scott Patefield, TAP Member:
Project oversight.
Document review and approval.
Alicia Frazier, TAP Member:
Project oversight.
Document review and approval.
Mike Pearson, TAP Member:
Project oversight.
Document review and approval.
Thomas McGrath (IES), Technical Oversight:
Technical Consultant
Project Oversight
Table 4. Responsibilities of Key Personnel (corresponds to “Personnel” Table in Section 5 of Work Plan)
Responsibilities Leader Key Personnel Associated Study Tasks
Project
Management
J. Landes C. Staley
J. Ochterbeck
(ALL)
Process
measurement skid
R. Miller J. Landes (Measurement), Work Plan Sections 2c and
2g

Quality Assurance Project Plan for Noble Energy, Inc. Revision 2
May 5, 2017 Pressurized Hydrocarbon Liquids Sampling & Analysis Study (DJCD-PHLAS-RFP-0002) Page 11 of 66
design, process
measurement
uncertainty
Field sampling R. Miller B. Burns
A. Hartman
(Sampling), Work Plan Sections 2a, 2f, 2g
Analytical Testing C. Staley T. Benz
J. Ochterbeck
(Analysis), Work Plan Sections 2b, 2d, 2e, 2f
CRM Blending R. Rayon (CRM), Work Plan Section 2a
QAPP, QA/QC D. Bowling (QC), Work Plan Section 2e
PSM/EOS
Modeling, Mass
Balance
B. Theriot J. Landes
M. Spurlock
(Mass Balance), Work Plan Section 2g
Uncertainty
Analysis, Sensitivity
Studies
R. Aguiar R. Aguiar (Uncertainty), Work Plan Sections 2a, 2b, 2c,
2d, 2f
(Data Validation), Work Plan Section 2e
(Uncertainty & Sensitivity), 2g
(Data Analyses), 2h
A.5 Problem Definition/Background
A Consent Decree (“CD”) between the United States, the State of Colorado, and Noble
Energy, Inc. (“Noble”), Civil Action No. 1:15-cv-00841-RBJ,was entered by the U.S.
District Court for the District of Colorado as final judgment on June 2, 2015. This CD
addressed volatile organic compound (“VOC”) emissions from condensate storage tanks.
As part of the settlement with the EPA, Noble Energy has been tasked with conducting a
Supplemental Environmental Project (“SEP”) "to improve the reliability of hydrocarbon
liquids sampling and analysis procedures, which can be used to estimate emissions and
properly size condensate storage tanks’ vapor control systems. By identifying techniques
that eliminate potential sources of error, the study should facilitate more accurate and
reliable sampling results that provide better emission estimates for properly engineering
and sizing vapor control systems. This SEP is likely to lead to future emission reductions.”
The purpose of the pressurized hydrocarbon (HC) liquid sampling and analysis (PHLSA)
study is described in paragraph 37 of the Consent Decree:
“The purpose of the study is to isolate individual variables of the sampling and analytical
methods typically used to obtain information regarding the flash potential and makeup
of pressurized hydrocarbon liquids and to identify protocols for determining how these
samples can be reliably obtained, handled, and analyzed to produce accurate analytical
results for practical application in modeling flashing losses.”
Quality Assurance Project Plan for Noble Energy, Inc. Revision 2
May 5, 2017 Pressurized Hydrocarbon Liquids Sampling & Analysis Study (DJCD-PHLAS-RFP-0002) Page 12 of 66
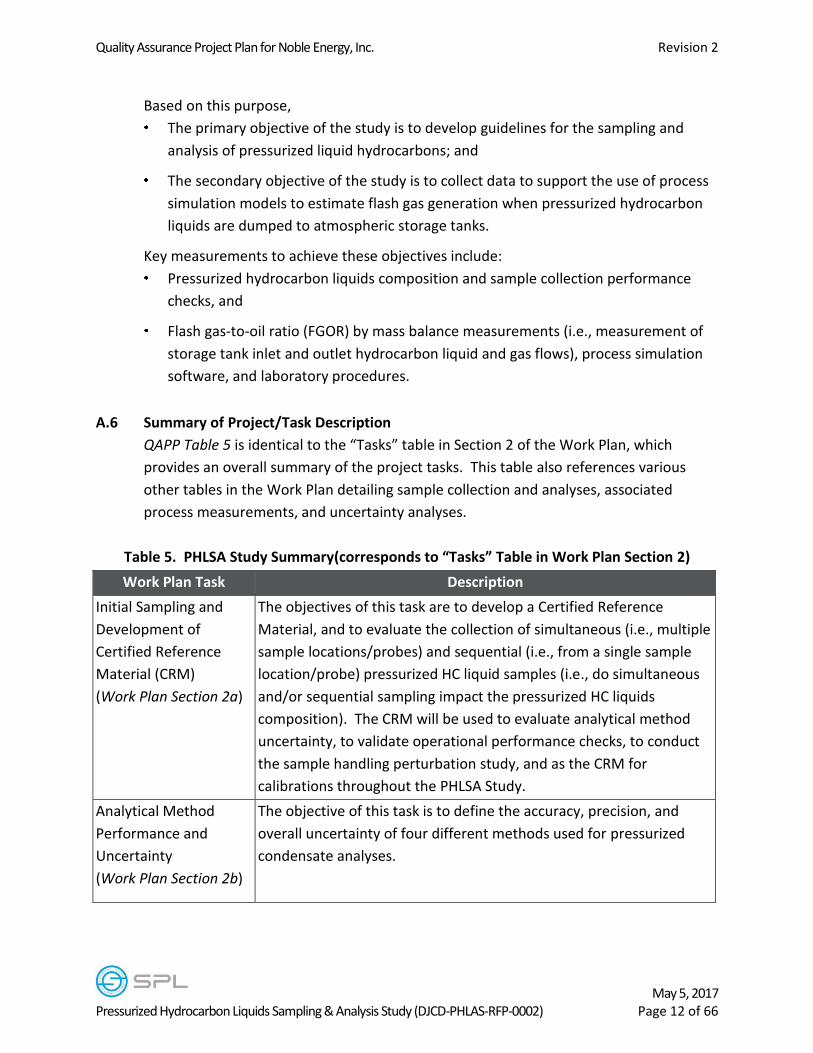
Based on this purpose,
The primary objective of the study is to develop guidelines for the sampling and
analysis of pressurized liquid hydrocarbons; and
The secondary objective of the study is to collect data to support the use of process
simulation models to estimate flash gas generation when pressurized hydrocarbon
liquids are dumped to atmospheric storage tanks.
Key measurements to achieve these objectives include:
Pressurized hydrocarbon liquids composition and sample collection performance
checks, and
Flash gas-to-oil ratio (FGOR) by mass balance measurements (i.e., measurement of
storage tank inlet and outlet hydrocarbon liquid and gas flows), process simulation
software, and laboratory procedures.
A.6 Summary of Project/Task Description
QAPP Table 5 is identical to the “Tasks” table in Section 2 of the Work Plan, which
provides an overall summary of the project tasks. This table also references various
other tables in the Work Plan detailing sample collection and analyses, associated
process measurements, and uncertainty analyses.
Table 5. PHLSA Study Summary(corresponds to “Tasks” Table in Work Plan Section 2)
Work Plan Task Description
Initial Sampling and
Development of
Certified Reference
Material (CRM)
(Work Plan Section 2a)
The objectives of this task are to develop a Certified Reference
Material, and to evaluate the collection of simultaneous (i.e., multiple
sample locations/probes) and sequential (i.e., from a single sample
location/probe) pressurized HC liquid samples (i.e., do simultaneous
and/or sequential sampling impact the pressurized HC liquids
composition). The CRM will be used to evaluate analytical method
uncertainty, to validate operational performance checks, to conduct
the sample handling perturbation study, and as the CRM for
calibrations throughout the PHLSA Study.
Analytical Method
Performance and
Uncertainty
(Work Plan Section 2b)
The objective of this task is to define the accuracy, precision, and
overall uncertainty of four different methods used for pressurized
condensate analyses.

Quality Assurance Project Plan for Noble Energy, Inc. Revision 2
May 5, 2017 Pressurized Hydrocarbon Liquids Sampling & Analysis Study (DJCD-PHLAS-RFP-0002) Page 13 of 66
Work Plan Task Description
Process Measurement
Uncertainty Analysis
(Work Plan Section 2c)
The objective of this task is to minimize process measurement
uncertainty so that the data used for mass balance and flashing
emission models will be of optimum quality.
Sample Handling
Perturbation Study
(Work Plan Section 2d)
The objective of this task is to collect data to develop guidelines for
proper sample handling and to estimate the additional uncertainty
produced from improper sample handling.
Operational
Performance Checks
(Work Plan Section 2e)
The objective of this task is to evaluate operational performance
checks for sampling and analysis of pressurized condensates.
Sampling Perturbation
Study
(Work Plan Section 2f)
The objective of this task is to collect data to develop guidelines for
proper sample collection and to estimate the additional uncertainty
introduced from improper sampling techniques.
Three Separator
Pressure Range and
Seasonal PHLSA Studies
(Work Plan Section 2g)
The objectives of this task are to 1.) Assess seasonal effects on
pressurized condensate sampling and analysis, and modeling of
flashing losses (Winter and Summer testing), and 2.) Assess the effect
of changes in separator operating pressure on pressurized
condensate sampling and analysis, and modeling of flashing losses
(Three separator pressure ranges).
Data Analyses
(Work Plan Section 2h)
The objective of this task is to isolate individual variables of the
sampling, sample handling, and analysis process, as well as PSM/EOS
calculations, to estimate the uncertainties of each variable and the
sensitivity to the mass balance when modeling flashing losses.
A.7 Quality Objectives and Criteria for Measurement Data
A.7.1 Data Quality Indicators (DQIs) and Definitions- Data Quality Indicators (DQIs) to be
implemented throughout the PHSLA study include precision, accuracy,
representativeness, comparability, and completeness. The definition for each DQI is
listed as referenced in EPA’s Guidance for Quality Assurance Project Plans (EPA QA/G-5).
A.7.1.1 Precision is the measurement of agreement among repeated measurements of the
same property under identical or substantially similar conditions.
A.7.1.2 Accuracy is a measure of the overall agreement of a measurement to a known value.

Quality Assurance Project Plan for Noble Energy, Inc. Revision 2
May 5, 2017 Pressurized Hydrocarbon Liquids Sampling & Analysis Study (DJCD-PHLAS-RFP-0002) Page 14 of 66
A.7.1.3 Representativeness is a qualitative term that expresses “the degree to which date
accurately and precisely represents a characteristic of a population, parameter
variations at a sampling point, a process condition, or an environmental condition”
(ANSI/ASQC 1995).
A.7.1.4 Comparability is a qualitative term that expresses the measure of confidence that one
data set can be compared to another and combined.
A.7.1.5 Completeness is a measure of the amount of valid data needed to be obtained from a
measurement system.
A.7.2 Additional Details for Data Quality Indicators (DQIs)
A.7.2.1 Precision – GPA and ASTM methodology implement repeatability criteria to evaluate the
precision of two results obtained under identical operating conditions.
A.7.2.2 Accuracy - Depending on the method referenced, either reproducibility criteria or the
performance evaluation acceptance criteria is intended to evaluate the accuracy of the
results.
A.7.2.3 Representativeness - The Sampling Perturbation Study (Work Plan Section 2f) will
evaluate various protocols for obtaining pressurized hydrocarbon liquid samples to
determine the procedure for obtaining the most representative samples. Once
identified, these procedures will be implemented for the Three Pressure Range and
Seasonal studies (Work Plan Section 2g) to ensure that all samples are obtained in the
same manner. To ensure that a representative sample is obtained once the protocols
have been established, sampling will be performed in accordance with the specified
sampling protocols and sampled in triplicate with additional samples obtained to
provide backup samples, if needed, for analysis.
A.7.2.4 Comparability - The use of standard test methods and/or technically accepted methods
will assure that data may be comparable to other sources of data. The Sampling
Perturbation study (Work Plan Section 2f) and the Sample Handling Perturbation study
(Work Plan Section 2d) will evaluate various protocols for the sampling and laboratory
handling procedures. Once the best procedures are identified, these will be
implemented for the remainder of the PHLSA study to ensure that all samples are
obtained and handled in the same manner.
A.7.2.5 Completeness- The Work Plan specifies the minimum number of samples and analytical
measurements needed for satisfying the requirements of the Consent Decree and for

Quality Assurance Project Plan for Noble Energy, Inc. Revision 2
May 5, 2017 Pressurized Hydrocarbon Liquids Sampling & Analysis Study (DJCD-PHLAS-RFP-0002) Page 15 of 66
the statistical uncertainty analyses. 100% of the samples indicated in the Work Plan
must be obtained and analyzed. The use of backup samples may be implemented to
meet the completeness requirements if necessary. To calculate the uncertainty
associated with each measurement, replicate measurements will be performed.
A.7.3 Operational Performance Checks
A.7.3.1 Operational Performance Checks (Work Plan Section 2e) will be established throughout
the study to provide a means of comparison to determine acceptance criteria for
accepting field samples at the laboratory for testing. These checks will include the Initial
Pressure Test (Pressure Verification) and High Pressure Densitometer Bubble Point
Verification. Details for the criteria implemented will be provided with the final report
submitted for the PHLSA study; additional checks may be developed as determined
necessary.
A.7.4 Correlation of Data Quality Indicators (DQIs) and Data Quality Objectives (DQOs)
A.7.4.1 The DQIs are key factors that have been identified to determine the validity of the
overall results of the PHLSA study. The DQOs are the acceptance criteria applied to
individual analytical results as they are obtained, and are used to measure the
performance of the test method as it correlates to those analytical results. It should be
noted that not all DQIs and/or DQOs are applicable to the results of all test methods;
the QAPP Tables 6 and 7 below show the correlation of each DQO as it pertains to the
key DQIs identified for the PHLSA study. The tables are segregated by GC test methods
and ASTM test methods. Additional details for the DQOs are provided in QAPP Section
B.5.

Quality Assurance Project Plan for Noble Energy, Inc. Revision 2
May 5, 2017 Pressurized Hydrocarbon Liquids Sampling & Analysis Study (DJCD-PHLAS-RFP-0002) Page 16 of 66
Table 6. Data Quality Indicators (DQIs) for GC Test Methods
DQI Precision Accuracy Accuracy Representative Comparability Comparability Completeness
DQO Repeatability Reproducibility Performance Evaluation Criteria
Recovery Fidelity Plots Control Charts Completeness
Dat
a N
ee
de
d f
rom
GC
An
alys
is a
nd
Su
pp
ort
ing
Do
cum
en
tati
on
th
at m
ust
be
Ava
ilab
le
Bla
nk
Ch
eck
s
NA NA NA Un-normalized results for each component from blank analysis; analyzed as an unknown sample.
NA NA 100% of planned QC Checks required; Check should be performed at the beginning of each day samples are analyzed.
Cal
Std
an
d/o
r C
RM
Results from two consecutive analyses from the same instrument under identical operating conditions.
(1) Results from analysis; analyzed as an unknown sample (non-calibration run). (2) NIST traceable cert. for cal. material stating concentrations for each component.
(1) Results from analysis; analyzed as an unknown sample (non-calibration run). (2) NIST traceable cert. for cal. material stating concentrations for each component, must include uncertainty.
(1) Results from analysis; analyzed as an unknown sample (non-calibration run). (2) NIST traceable cert. for cal. material stating concentrations for each component.
(1) Results from analysis; analyzed as an unknown sample (non-calibration run). (2) NIST traceable cert. for cal. material stating concentrations for each component.
Area counts for each component from analysis.
100% of planned QC Checks required; Checks performed at least once per batch of samples analyzed. Duplicate analyses may be required (as applicable) to meet the precision DQO.
Sam
ple
s
NA NA NA NA NA NA 100% of planned analyses of samples indicated as non-backup sample in the Work Plan. Backup samples may be used to meet completion requirements.
Criteria See each GC Test Method DQO Table.
See each GC Test Method DQO Table.
See each GC Test Method DQO Table.
See each GC Test Method DQO Table.
See each GC Test Method DQO Table. Refer to GPA 2198 for additional details.
Western Electric Control Chart Rule Violations as stated in GPA 2198.

Quality Assurance Project Plan for Noble Energy, Inc. Revision 2
May 5, 2017 Pressurized Hydrocarbon Liquids Sampling & Analysis Study (DJCD-PHLAS-RFP-0002) Page 17 of 66
Table 7. Data Quality Indicators (DQIs) for ASTM Test Methods
DQI Precision Accuracy Accuracy Accuracy Completeness
DQO Repeatability Reproducibility Calibration Check Equipment Verification Completeness
Dat
a N
ee
de
d f
rom
AST
M A
na
lysi
s an
d
Sup
po
rtin
g
Do
cum
en
tati
on
th
at m
ust
be
Ava
ilab
le
Cal
Std
an
d/o
r C
RM
Results from two consecutive analyses from the same instrument under identical operating conditions.
(1) Results from analysis; analyzed as an unknown sample (2) NIST traceable cert. (or cert. of purity) for check material used, stating relevant properties for each component.
(1) Results from analysis; analyzed as an unknown sample (2) NIST traceable cert. (or cert. of purity) for check material used, stating relevant properties for each component.
(1) Results from verification procedure; (2) NIST traceable cert. of piston volume (if applicable).
100% of planned QC Checks required. Requirements for frequency of checks are provided for each test method in the ASTM Test Method DQO Table. Duplicate analyses may be required (as applicable) to meet the precision DQO.
Sam
ple
s
Results from two consecutive analyses from the same instrument under identical operating conditions.
NA NA NA 100% of planned analyses of samples indicated as non-backup sample in the Work Plan. Backup samples may be used to meet completion requirements. Requirements for frequency of checks are provided for each test method in the ASTM Test Method DQO Table. Duplicate analyses may be required (as applicable) to meet the precision DQO.
Criteria See ASTM Test Method DQO Table.
See ASTM Test Method DQO Table.
See ASTM Test Method DQO Table.
See ASTM Test Method DQO Table.

Quality Assurance Project Plan for Noble Energy, Inc. Revision 2
May 5, 2017 Pressurized Hydrocarbon Liquids Sampling & Analysis Study (DJCD-PHLAS-RFP-0002) Page 18 of 66
A.8 Special Training Requirements/Certifications
Special training or certifications (in addition to the required initial qualification and any
periodic refresher training) for field sampling, analytical services, blending services,
PSM/EOS modeling, and/or uncertainty analyses have not been identified as necessary
for this project. The supervising manager for each phase will oversee that all
technicians involved in the PHLSA study will be up to date in regard to the routine
training required for the services being performed. The training information will be
maintained in personnel training files at the location where the services are performed,
and will be available for review upon request.
A.9 Documents and Records
The QAPP, and any subsequent revisions, will be distributed by the QAQC Advisor as detailed in QAPP Table 2 to each of the key personnel indicated. Additional copies may be available for distribution within workgroups upon request. Any revisions to the QAPP will be dated and numbered sequentially.
The sampling and measurement records generated for this project will include field data sheets (sample tags), chains of custody (COCs), and verification/calibration, proving, and maintenance records for equipment. Refer to Work Plan Figure5 for details regarding the minimum information required for the field data sheets. Each field data sheet will be recorded with no more than one sample cylinder per data sheet, and will be used to record all pertinent information regarding the sample collection process (cylinder number, date, and time of sampling). Field measurement data will be electronically captured in Noble’s SCADA system and the information will be provided to SPL to populate the remaining fields in the field data sheets. SPL will review the field data sheets prior to shipping samples to the lab, and any discrepancies identified will be reported to Noble to determine if action is required.
SPL’s laboratory login department will review the field data sheets upon receipt. Records retained for the analytical services will include shipping documents, COCs, and field data sheets (sample tags) sent from the field services group. Additional records will consist of calibration and/or maintenance information for equipment, reference standard certificates, original results and observations (electronic and/or hard copy as applicable for testing performed), and any additional login information generated. As samples are received in the laboratory they will be logged in and each sample container will be assigned a unique internal identifier. All similar samples received at the same time will be logged under the same work order, with each individual sample being assigned as a fraction number. Samples that are from the same sampling location, but designated as backups will have the same fraction number with letters assigned to indicate the container as a backup. All samples for each work order will be included in a

Quality Assurance Project Plan for Noble Energy, Inc. Revision 2
May 5, 2017 Pressurized Hydrocarbon Liquids Sampling & Analysis Study (DJCD-PHLAS-RFP-0002) Page 19 of 66
single analytical report, with individual sample fraction results identified in the report. A summary of the calibration and QC data, along with raw analytical data will be included with the final report. The laboratory manager will review all data and associated documentation prior to generating reports and submitting to the Project Lead. Any discrepancies identified will be reported to Noble to determine if action is required.
The blending services group will provide records for receipt and verification of feedstock prior to blending, calibration and/or maintenance information for equipment, and all original data sheets generated during the blending process. Any discrepancies noted during the blending process will be reported to the Project Lead who will discuss with Noble to determine if additional action is required.
The Project Lead will review all field data sheets, analytical reports, and blending data to identify any suspect data to flag and discuss with Noble if necessary. Once approved by the Project Lead, the all data will be sent to Noble and Movilab to begin statistical uncertainty analysis.
SPL will develop the PSM/EOS model and reports, along with required input parameters and procedures for the mass balance and flashing emissions calculations. All PSM/EOS reports along with input parameters used for calculations will be reviewed by SPL to identify any suspect data to flag and discuss with Noble if necessary. Once approved by the Project Lead, the all data will be sent to Noble and Movilab to begin statistical uncertainty analysis.
All source data along with data analysis records will be provided by Movilab from the statistical uncertainty analysis.SPL and Movilab will review to identify any suspect data to flag and discuss with Noble to determine if action is required.
Upon completion of individual perturbation studies, results from each work group will be sent to the Project Lead to review and compile a midterm report to submit to the distribution group identified in QAPP Table 2. As the final phases of the overall PHLSA study are completed, the same convention will be followed by submitting all data to the Project Lead to compile the final PHLSA report.
Refer to Work Plan Section 3 for details of the final PHLSA report deliverable.
A.9.1 Record Retention and Archival
All data and records for this project will be maintained according to SPL’s standard policy regarding data retention; therefore, records will be retained for seven years from the date of submitting the final PHLSA report to Noble, unless requested to do otherwise. Key personnel representing each work group identified in QAPP Table 3 will be responsible for ensuring that all necessary records are submitted to the Project Lead. All hard copy records mentioned in QAPP Section A.9 will be included in the data

Quality Assurance Project Plan for Noble Energy, Inc. Revision 2
May 5, 2017 Pressurized Hydrocarbon Liquids Sampling & Analysis Study (DJCD-PHLAS-RFP-0002) Page 20 of 66
archival. All data will be retained and retrievable via storage/archival accommodations and/or electronic means throughout the duration of the archival period.
Section B – Data Generation and Acquisition
B.1 Sampling Process Design – refer to QAPP Section A.6 and/or Work Plan Section 2 for discussion of the project tasks.
B.2 Sampling Methods The following sampling methods will be implemented for this study. Brief descriptions
for each of the sampling procedures implemented for this study are detailed below;
refer to the referenced documents for additional details if necessary. As the
hydrocarbon samples will be transported, the sample containers must meet the
specifications of and be labeled and packaged according to the Hazardous Materials
Regulations of the Department of Transportation. All procedures must begin with clean,
leak free sample containers appropriate for the type of sampling to be performed. SPL
will provide the cylinders for all sampling events and will be responsible for ensuring
that all cylinders are properly cleaned and inspected prior to use for sampling.
Table 8. List of Sampling Methods
Method Reference Brief Description
GPA 2174 Liquid Sampling – Piston Cylinder Method
GPA 2174 Liquid Sampling – Displacement Method
GPA 2166 Gas Sampling – Purge, Fill, and Empty Method
GPA 2166 Gas Sampling – Evacuated Container Method
GPA 2166 Gas Sampling – Portable GC Method
API MPMS 8.1 Liquid Sampling – Thief Method
B.2.1 GPA 2174 – A hydrocarbon fluid sample will be transferred under pressure from a
source into a sample container, using a sample probe designed to secure product from
the center one-third of the flowing stream to obtain a representative sample. For
floating piston cylinders, it is recommended to use an “inert” charge gas that is not
present in the sample, so that a leak in the cylinder itself can be easily detected during
the analysis. The use of a natural gas as a back-pressure fluid is not recommended
because a leak across the piston may result in compromising the sample with
components that were not present at the source.
B.2.1.1 Piston Cylinder Method – This method requires the displacement end of the piston cylinder to be filled with an inert gas to a pressure at least 100psi above the sampling

Quality Assurance Project Plan for Noble Energy, Inc. Revision 2
May 5, 2017 Pressurized Hydrocarbon Liquids Sampling & Analysis Study (DJCD-PHLAS-RFP-0002) Page 21 of 66
pressure. The product end of the piston cylinder is connected to the sampling source and the sample material is allowed to purge into the cylinder as the pressure is verified not to drop below the original sample pressure (preventing flashing and altering the sample composition). The inert gas is allowed to vent from the displacement end to reduce sample volume to 80% while still verifying that the pressure does not drop below the original sample pressure. This type of sampling method does not require outage or reducing the pressure for transportation.
B.2.1.2 Displacement Method – This method uses single cavity (constant volume) cylinders that have been steam cleaned and water filled with a displacement liquid such as water prior to being placed into service for sampling. The sample cylinder is connected to the sampling source as per GPA 2174 requirements with the cylinder positioned vertically (outage tube upward) over a graduated cylinder. Sample material is allowed to purge into cylinder, while allowing the displacement liquid to drain into the graduated cylinder without allowing the pressure to drop below sampling pressure. This is performed until 80% of the cylinder volume has been displaced into the graduated cylinder. The bottom valve is then opened again to allow the remaining displacement liquid to drain from the sample cylinder.
B.2.2 GPA 2166 – The sampling methods listed for these procedures require that the sampling components are clean and free of contaminants. These methods are designed for sampling natural gas from systems that are at or above the hydrocarbon dew point temperature. Ambient cooling of the sample system can cause heavy hydrocarbons to condense out of the vapor phase. The presence of any condensation in the sample inlet system will cause the sample to be non-representative. Condensation must be avoided in the entire sample system from sample probe to sample cylinder outlet or chromatogram inlet.
Pressure drops due to pressure regulators or flow control devices cause reduction in temperature due to the Joule-Thompson effect which may cause condensation in the sampling system. Therefore, it may be necessary to heat regulators that are used to reduce the sample pressure. Where applicable, flow control devices such as flow control plugs or valves should be located at the outlet of the sample container. These flow-controlling devices can cause cooling due to the Joule-Thompson effect. To thermally isolate this cooling effect from the sample container, the flow control devices should be placed at the outlet end of an extension tube (“pigtail”), which is attached to the outlet of the sample container.
Entrained or free-flowing hydrocarbon liquids are generally collected and accounted for in a condensate recovery system, and are not desired in the vapor phase portion of the accounting system. Other contaminants such as water, oil, etc. are not desirable in the sample container. Since free flowing liquids tend to flow along the bottom of the pipe or, or along the walls of the pipe, it is necessary to have a sample probe extending into the pipe.

Quality Assurance Project Plan for Noble Energy, Inc. Revision 2
May 5, 2017 Pressurized Hydrocarbon Liquids Sampling & Analysis Study (DJCD-PHLAS-RFP-0002) Page 22 of 66
B.2.2.1 Purge, Fill, and Empty Method – refer to QAPP Table 9 the number of cycles required for
this procedure. This method is applicable when the temperature of the sample
equipment downstream of the sample is maintained above the hydrocarbon dew point
throughout the entire sampling process and the source pressure is at least 15psig. A
“pigtail” extension tube with the valve on the discharge end must be connected to the
outlet valve of the sample container. This arrangement places the temperature drop
associated with the Joule-Thomson effect at the end of the extension tube and
eliminates the possibility of heavy hydrocarbon condensation in the sample container
outlet valve. The sample container is held in a vertical position and the entire apparatus
is purged and filled from the sampling point with the sample material at line pressure.
The sampling point valve is closed, and then the entire apparatus is depressurized to
nearly ambient pressure to complete one fill and empty cycle. The entire fill and empty
process must be repeated according to QAPP Table 9 below. After the appropriate
number of purge cycles, the apparatus is filled to line pressure, the valves are closed,
and the pigtail extension is removed for sample transportation.
Table 9. Number of Purge Cycles for PF&E Method
Pressure Range (psig) Purge Cycles
15 – 30 13
30 – 60 8
60 – 90 6
90 – 150 5
150 – 500 4
500+ 3
B.2.2.2 Evacuated Container – This method is applicable when source pressure is at least 15psig.
It should be noted that most valve styles are not vacuum-tight, and is recommended
that the cylinder be evacuated immediately prior to sample procurement. The sample
container must be evacuated to a pressure of 1mm Hg or less and installed in a vertical
position over the sampling point valve. The sample line should be purged to displace
any air and then the sample container valve opened to allow the container pressure to
increase to the desired sampling pressure. The sample container is removed and
checked for leaks prior to transporting.
B.2.2.3 Portable GC – It may be necessary to use a regulator to reduce the line pressure to the
required pressure for the portable or online GC. To counteract the effects of the Joule-
Thompson effect it may be necessary to heat trace the regulator and sample tubing.

Quality Assurance Project Plan for Noble Energy, Inc. Revision 2
May 5, 2017 Pressurized Hydrocarbon Liquids Sampling & Analysis Study (DJCD-PHLAS-RFP-0002) Page 23 of 66
B.2.3 API 8.1 – Thief Method – This method is designed such that a core type sampling thief,
when lowered slowly, is capable of trapping a vertical column of liquid at any selected
level below the surface. The closing of the lower end of the tube to trap the sample at
the desired level may be achieved by various closure mechanisms. If samples are
required at more than one location (refer to QAPP Table 10), the sample must be
measured out with a graduated cylinder and poured into the sample container. The
amount of sample measured will depend on the size of the thief and the tests to be
performed.
Table 10. Spot Sample Minimum Requirements
Liquid Level Number of Samples
Upper Middle Lower
Liquid Level ≤ 3m X
3m < Liquid Level ≤ 6m X X
6m < Liquid Level X X X
B.3 Sample Handling, Custody, and Preparation
B.3.1 Field Data Sheets (Sample Tags) - The example Field Data Sheet in Work Plan Figure 5
(Section 2g) have been designed specifically for the needs of this PHLSA study, and
should contain the minimum required information requested on the form.
B.3.2 Chain of Custody (COC)- The COC is intended as a means of physically tracking the
sample up to the point where it is submitted to the laboratory for analysis. It serves as a
legally defensible document stating the specific date and time that a sample was
relinquished to the sample custodian of the laboratory. Additionally, pertinent
information for testing, reporting, and invoicing is included on this document. It is SPL’s
policy that a COC be completed for every sample (or “batch” of samples) relinquished to
the laboratory. The example Chain of Custody (COC) QAPP Figure 1 – SPL Chain of
Custody (COC) is available for use for the PHLSA study.

Quality Assurance Project Plan for Noble Energy, Inc. Revision 2
May 5, 2017 Pressurized Hydrocarbon Liquids Sampling & Analysis Study (DJCD-PHLAS-RFP-0002) Page 24 of 66
Figure 1 - SPL Chain of Custody (COC).

Quality Assurance Project Plan for Noble Energy, Inc. Revision 2
May 5, 2017 Pressurized Hydrocarbon Liquids Sampling & Analysis Study (DJCD-PHLAS-RFP-0002) Page 25 of 66
B.3.3 Sample Preparation for Gas Samples – There is no prescribed preservation technique or
holding time for samples collected for this analysis. Samples shall be heated prior to
testing. Samples collected at temperatures below 120°F shall be equilibrated in the
laboratory at 20-50°F above the source temperature of the field sampling. For small
sample containers of approximately 300cc’s, an equilibration time of approximately 2
hours using a heating blanket or oven is recommended. The time the sample is placed
under the heating blanket or in the oven must be documented and retained with the
sample records. Due to safety reasons, samples collected above 120°F will not be
heated 20°F above collection temperature.
B.3.4 Sample Preparation for Liquid Samples - There is no prescribed preservation technique
or holding time for samples collected for this type of analysis. The sample handling
perturbation study will investigate various sample handling procedures as part of the
baseline study. The normal, routine procedure for sample handling is described below;
however, the deviations explored as part of the perturbation study will be documented
to determine the best handling practice to implement for the remainder of the PHLSA
project.
All samples should be collected, transported and stored prior to analysis in containers
and using sampling methodologies that minimize any chance of sample loss or leakage.
Normally samples should be stored at ambient temperature prior to analysis. Samples
should not be chilled as this may lead to condensation (however, this will be
investigated in more detail as part of the Sample Handling Perturbation study). Samples
shall not be stored at elevated temperatures due to safety concerns, as liquid samples
have a tremendous expansion capability. Immediately prior to analysis, samples shall
have a back pressure of a minimum of 200psi over the pressure indicated on the sample
tag to ensure that flashing does not occur.
B.4 Analytical Methods
The following analytical methods will be implemented for this study. Due to the nature
of testing to be performed, a single/main method reference may be listed in conjunction
with a suite of other procedures to obtain physical properties and/or direct
measurements needed for calculations and unit conversions required to complete the
main method reference. Methods may have an “M” added to the end of the method
reference to indicate a modification not listed in the reference method, with the
modification detailed in the SPL SOP for that procedure. Brief descriptions for each of
the analytical procedures implemented for this study are detailed below; refer to the
reference document(s) for additional details. QAPP Table 11 lists the analytical

Quality Assurance Project Plan for Noble Energy, Inc. Revision 2
May 5, 2017 Pressurized Hydrocarbon Liquids Sampling & Analysis Study (DJCD-PHLAS-RFP-0002) Page 26 of 66
reference methods used for this study (including methods where a suite of testing is
required, but are listed as the Main Method Reference on the COA report).
Table 11. List of Analytical Methods
Main Method References Associated Testing
References
Brief Description of Procedure
Bubble Point Verification ASTM D4052 Bubble Point Verification
Initial Pressure Test Proprietary Initial Pressure Test
GPA 2186 (Extended Liquid
Analysis)
GPA 2177 TCD C6+ Liquid Analysis
GPA 2186 FID Extended Liquid Analysis
GPA 2286 (Extended Gas
Analysis)
GPA 2261 TCD C6+ Gas Analysis
GPA 2286 FID Extended Gas Analysis
GPA 2103 (Condensate
Analysis)
GPA 2103 TCD C1-C6Condensate Analysis
Proprietary Physical Shrinkage Determination
ASTM D2001 Depentanization (C6+ residue)
ASTM D86 Naphtha Cut (C6 – C10 cut, C11+ residue)
Proprietary Molecular Weight Determination
ASTM D4052 Digital Densitometer
ASTM D2887 High Temperature Simulated Distillation
ASTM D323 ASTM D323 Reid Vapor Pressure
ASTM D1945-1946
(Proprietary Refinery Gas
Analysis)
ASTM D1945 FID Analysis for C2–C6 and Olefin
Components
ASTM D1946 TCD Analysis for C1–C2 and Inert
Components
B.4.1 HP Densitometer Bubble Point Verification- The high-pressure density measurements by
densitometer procedure will not only give a means of QC for calculated density, but also
provide a bubble point determination as a QC measure for the calculated bubble point.
A sample will be introduced into the high-pressure densitometer and the density will be
measured. The pressure will be slowly released in increments with the density

Quality Assurance Project Plan for Noble Energy, Inc. Revision 2
May 5, 2017 Pressurized Hydrocarbon Liquids Sampling & Analysis Study (DJCD-PHLAS-RFP-0002) Page 27 of 66
measured at each increment of pressure. The resulting plot of measured density vs.
measured pressure will have a slope change at the bubble point of the fluid (refer to
Work Plan Figure 4, Section 2e). The CRM analysis calculated density vs. measured
density and CRM analysis calculated bubble point vs. measured bubble point form the
baseline for Sampling & Analysis QC. All subsequent analytical results will be validated
on this basis to measure the combined uncertainty.
B.4.2 Initial Pressure Test (Pressure Verification) -The Initial Pressure Test is used to estimate
the bubble point of a high-pressure liquid sample. It will be performed in the field at
the time of sampling prior to outage being taken, and upon receipt of the sample in the
lab after re-pressurization and mixing. In the lab, it may also be used to validate the
samples prior to analysis to ensure that the sample has not been compromised in
transit. If the lab pressure differs significantly from the tag pressure, the sample will be
rejected without being analyzed and an alternate or backup sample will be verified and
analyzed instead. The lab may also analyze the bubble point by high pressure
densitometer and then compare the densitometer result to the field estimate as an
additional QC parameter to validate samples prior to analysis.
For single cavity cylinders (constant volume), if a sample tag indicates that 250psi
sample has been obtained, back pressure will be applied until the digital pressure gauge
attached to the cylinder reads 500psi. This can be achieved by using a sprague pump to
pump water into the bottom of a cylinder held in a vertical position. Once the desired
pressure has been reached, the Sprague pump should be shut off, and then the valve
should be opened to allow a few drops of water to fall out of the cylinder. The resulting
pressure (for example now at 259psi) would be the bubble point.
B.4.3 GPA 2186 (Extended Liquid Analysis) - This method covers the compositional analysis of
natural gas liquid streams where precise physical property data of the Hexanes and
heavier (C7+) fraction are required by combining the analysis described in GPA 2177 with
an extended analysis of the Hexanes and heavier components using capillary gas
chromatography according to GPA 2186. This method is applicable for de-methanized
mixes through light gasoline fractions that may contain components such as nitrogen,
carbon dioxide and/or hydrocarbon complexes (C1 –C14) that fall within the ranges
shown in QAPP Table 12, from GPA 2186.
Components to be determined in the hydrocarbon liquid mixture are physically
separated by gas chromatography and compared to calibration data previously obtained
under identical operating conditions on a mixture of known composition. Two separate
fixed volumes of sample in the liquid phase are isolated in suitable sample inlet valves.
Quality Assurance Project Plan for Noble Energy, Inc. Revision 2
May 5, 2017 Pressurized Hydrocarbon Liquids Sampling & Analysis Study (DJCD-PHLAS-RFP-0002) Page 28 of 66
Each volume is injected into its corresponding chromatographic system, effectively
splitting the analysis into two sections. These two chromatographic systems may be in
the form of two different instruments, such as a TCD instrument with a packed column
and an FID instrument with a capillary column.
The front end TCD instrument is essentially a GPA 2177 analysis which will analyze from
Nitrogen through N-Pentane, with the Hexanes plus (C6+) components grouped as a
single composite peak at the beginning of the chromatogram. This is accomplished by
using a precut column, which is back-flushed when N-Pentane has eluted into the main
analytical column. The advantages of this method are that better precision is achieved
in measuring the Hexanes plus portion of the sample and the analysis time is reduced
compared to the single column approach.
The same sample will be injected on to the extended instrument with an FID. Once the
raw area counts for the hexanes plus (C6+) components have been obtained, they are
normalized so that each component of hexanes plus from the FID can be allocated to
the total hexanes plus determined from the TCD analysis. The FID type detector is
effectively a mass sensitive device. With the exception of benzene and toluene, the
response (area percent) is proportional to component mass (weight percent). The
response factors correct the benzene and toluene peaks so that the determination of
weight percent is simply a ratio of component peak area to total peak area multiplied by
the hexanes plus weight percent determined in the TCD portion of the analysis.
The molecular weight and density is calculated for the hexanes plus from the FID
portion of the analysis, and then used in the calculation of weight percent for the TCD
portion, since the molecular weight of the Hexanes plus (C6+) fraction is an unknown in
the TCD analysis. All other compounds from the TCD analysis will use the molecular
weights and densities from GPA Standard 2145. The weight percent of the TCD is
calculated, and the Hexanes plus in the FID portion is allocated to the weight percent of
the Hexanes plus in the TCD portion.
B.4.4 GPA 2186M (Extended Liquid Analysis - modified) - This method is analytically similar to
the GPA 2186 described above, however FID portion of the analysis is not normalized
before adding to the TCD portion of the analysis. Any difference from 100% will be
added to the C10+ component. Also, the molecular weight and density of the C10+ will
be physically determined and used in subsequent calculations. The chromatographic
data from the GPA 2186 analysis will be used in this modification.
B.4.5 GPA 2103M-C10 (Extended Condensate Analysis) - Due to the nature of this test
method, several analytical methods are necessary to directly measure the physical

Quality Assurance Project Plan for Noble Energy, Inc. Revision 2
May 5, 2017 Pressurized Hydrocarbon Liquids Sampling & Analysis Study (DJCD-PHLAS-RFP-0002) Page 29 of 66
properties to perform the calculations needed to complete the overall analysis. The
additional analyses required to calculate the heptanes and heavier (C7+)fraction include
a physical shrinkage determination (modified from API 20.1), de-pentanization (ASTM
D2001), an atmospheric distillation (modified ASTM D86), a molecular weight
determination(by cryoscopic method), a density by digital density meter (ASTM D4052),
and an extended liquid analysis (GPA 2186).
B.4.5.1 GPA 2103 TCD Analysis - This analysis is intended for mixtures containing greater than
20mol% hexanes and heavier (C6+), or 5 mol% of heptanes and heavier (C7+) fractions.
The 2103 TCD analysis is similar to the 2177 chromatographic analysis, except that the
back-flushed heptanes plus is directed to vent out of the chromatographic system
instead of onto the column; therefore, this fraction is ignored in the chromatographic
analysis. The physical properties of the heptanes and heavier are determined
volumetrically by direct measurements.
Table 12. Scope for GPA 2103, GPA 2177, and GPA 2186
Component Applicable Concentration Ranges
GPA 2103 (Mol %) GPA 2177 (Wt %) GPA 2186 (Wt %)
Nitrogen 0.01 – 5.0 0.005 – 5.0 0.005 – 5.000
Carbon Dioxide 0.01 – 5.0 0.005 – 5.0 0.005 – 5.000
Methane 0.01 – 40.0 0.001 – 5.0 0.001 – 5.000
Ethane 0.01 – 15.0 0.001 – 95.0 0.001 – 95.000
Propane 0.01 – 15.0 0.001 – 100.0 0.001 – 100.000
Iso-Butane 0.01 – 15.0 0.001 – 100.0 0.001 – 100.000
N-Butane (2,2-
Dimethylpropane)
0.01 – 15.0 0.001 – 100.0 0.001 – 100.000
Iso-Pentane 0.01 – 15.0 0.001 – 15.0 0.001 – 50.000
N-Pentane 0.01 – 15.0 0.001 – 15.0 0.001 – 50.000
Hexanes 0.01 – 50.0 0.001 – 15.0 0.001 – 30.000
Heptanes+ 5.0 – 80.0 0.001 – 5.0 0.001 – 30.000
B.4.5.2 Physical Shrinkage Determination – This method covers the determination of the
physical volume shrinkage of pressurized crudes and condensates from meter
conditions to stock tank conditions at atmospheric pressure and ambient temperature.
After the TCD portion of the analysis is complete, the sample is physically flashed to
atmospheric pressure. Approximately 200cc of liquid sample will be displaced by water
into a piston with known volume from the pressurized sample cylinder at ambient

Quality Assurance Project Plan for Noble Energy, Inc. Revision 2
May 5, 2017 Pressurized Hydrocarbon Liquids Sampling & Analysis Study (DJCD-PHLAS-RFP-0002) Page 30 of 66
temperature and a pressure slightly above sampling conditions. The sample will be
slowly flashed from the top of the piston and the remaining liquid portion is collected
and measured in a graduated buret. The amount of gas flashed will be measured and a
physical shrink factor calculated for the sample material.
B.4.5.3 ASTM D2001 Depentanization - This test method covers the removal of Pentanes and
lighter hydrocarbons from gasolines, naphthas, and similar petroleum distillates to
prepare samples suitable for further analysis. This test method determines the volume
percent of bottoms remaining after depentanization. An aliquot of sample is distilled
into an overhead (C5 and lighter) fraction and a bottoms hexanes and heavier (C6+)
fraction or “cut”. The volume of bottoms is measured and the volume present, based
on the charge, is calculated as per ASTM D2001 methodology.
B.4.5.4 ASTM D86M Modified Atmospheric Distillation – This distillation process is performed in
the D86 manual distillation apparatus but the procedure is modified to distill only the
hexanes and heaver (C6+) bottom cut from the ASTM D2001 depentanization process
described above. Instead of measuring the entire boiling point range of the sample
material, the cut off temperature corresponds to a predetermined decane
component(C10) temperature in order to produce a bottom cut of components.
B.4.5.5 ASTM D4052 Density by Digital Density Meter – This test method covers the
determination of the density, API gravity, and specific gravity of petroleum distillates
and viscous oils that can be handled as liquids with vapor pressures below 14.5psi and
viscosities below approximately 15,000cSt at the temperature of the test. A small
volume of sample liquid is introduced into an oscillating sample tube and the change in
oscillating frequency cause by the change in the mass of the tube is used in conjunction
with calibration data to determine the density of the sample. This procedure is
performed on the original liquid volume from the shrinkage determination, the hexanes
and heaver (C6+) cut from the depentanization, and the undecanes and heavier (C11+)
cut from the additional D86 modified distillation.
B.4.5.6 Molecular Weight by Cryette - This test method covers the calibration and operation of
a cryette for the determining the molecular weight of an unknown sample by freeze
point depression of a non-aqueous solution of the compound. The instrument is
calibrated with a solvent blank and a known calibration standard on each day, prior to
analysis of samples and throughout each batch of samples to verify that the calibration
has not shifted.
B.4.6 GPA 2103M-C30+ (Modified Extended Condensate Analysis) –the GPA 2103 C10+ analysis
listed above may implement an additional modification to extend values out to
Quality Assurance Project Plan for Noble Energy, Inc. Revision 2
May 5, 2017 Pressurized Hydrocarbon Liquids Sampling & Analysis Study (DJCD-PHLAS-RFP-0002) Page 31 of 66
triacontane (C30+) carbon group values. In these instances, the ASTM D2887M
procedure listed below would be performed in addition to those listed above.
B.4.6.1 ASTM D2887M (High Temperature Simulated Distillation) – This is a chromatographic
method utilizing an inlet and a capillary column, both of which are subject to a
temperature program. An FID is used with a data acquisition system operating in the
slice mode. A retention time calibration mixture is used to develop a retention time
versus a boiling point curve. A solution of the reference oil is used to determine the
response factor. Solvent injections are made and the resulting signal is subtracted from
both the response factor standard and the sample chromatogram. Finally, the sample
solution is injected and, with the use of the response factor, the amount of sample
recovered is calculated. After converting the retention times of the sample slices to
temperature, the boiling point distribution can be calculated up to the recovered
amount.
Since the FID is essentially a mass sensitive device, the area percent is equivalent to the
weight percent of each carbon grouping (sample sliced by carbon number) from the
D2887 analysis. This procedure is modified to allocate the weight percent for each
carbon number grouping to the total undecanes and heavier (C11+) determined from
the GPA 2186 extended liquid analysis.
B.4.7 ASTM D323 (Reid Vapor Pressure) – The procedure implemented for this test method
covers the determination of vapor pressure of non-oxygenated gasoline and other
volatile petroleum products with a vapor pressure of less than 26psi. The pre-chilled
liquid chamber of the vapor pressure apparatus is filled with a sample that is also pre-
chilled, and is then connected to the vapor chamber that has been heated to 100°F in a
bath. The assembled apparatus is immersed in a bath at 100°F until a constant pressure
is observed. The reading, suitably corrected by comparison of the RVP gauge with a
pressure measuring device, is reported as the Reid Vapor Pressure.
B.4.8 ASTM D1945-1946 (Proprietary Refinery Gas Analysis) - This test method covers the
determination of the chemical composition of reformed gases and similar gaseous
mixtures by injecting a gaseous sample into the instrument through separate injection
points for analysis by three separate chromatographic systems housed within the same
instrument. When the sample is purged through the sample inlet, small aliquots of
sample are retained in each valve and the sample is injected simultaneously from each
valve and is routed to all columns simultaneously. The first chromatographic system has
a separate carrier gas and is used exclusively for the detection of helium and hydrogen
via an adsorption column and a TCD type detector. The second system is used to detect
Quality Assurance Project Plan for Noble Energy, Inc. Revision 2
May 5, 2017 Pressurized Hydrocarbon Liquids Sampling & Analysis Study (DJCD-PHLAS-RFP-0002) Page 32 of 66
carbon monoxide, oxygen, nitrogen, methane, carbon dioxide, ethane, and ethylene
components via a partition column and TCD type detector. The third system will analyze
the olefin (alkene) components and C2-C6 components, and requires an alumina PLOT
column and FID type of detector. The composition of the components determined by
the TCD detectors are calculated by comparison of the response of each component in
the sample to the corresponding value of that component in the reference or calibration
standard. The weight percent of the components determined from the FID-type
detector will be obtained after bridging to TCD components and subsequent
normalization. Calculations and reports for this analysis will use the physical properties
from GPA Standard 2145 for all components detected.
B.5 Quality Control –Analytical Procedures and Requirements for Data Quality Objectives
(DQOs)
B.5.1 Data Quality Objectives (DQOs) - Provided below are brief descriptions of the laboratory
quality control procedures implemented for the PHLSA study, information regarding
applicability and/or limitations of each DQO, and an explanation for interpreting the
results. Additional details and information regarding the quality control procedures for
the laboratory may be referenced in the method SOP’s and are available upon request.
The DQO Tables in QAPP Section B.5showthe QC procedures applied to each of the
analytical methods and lists the calculations and specific criteria used for each DQO.A
summary of the results of the quality control performed for each phase of testing will be
provided with the analytical results in the final PHLSA report; additional details and
supporting documentation of the quality control performed will be available a part of
the QC report submitted with the final PHLSA report.
B.5.2 Explanation of “Pass/Fail/Review” Evaluations Used for DQOs
B.5.2.1 Each data quality objective applied will be listed with either a “Pass/Fail” or a
“Pass/Review” type of evaluation in the QC Reports to provide a means of
differentiating and interpreting the various DQOs; additional details are provided for the
“Pass/Fail/Review” evaluation applied to each DQO below. Overall, if method specified
criteria is published and available, a “Pass/Fail” evaluator will be listed on the QC
Report. The “Pass/Review” evaluator will be used in various other instances such as
when the criteria from one test method is substituted for another test method, in cases
where no published or method specified criteria is available, or where the method
criteria provides guidance but does not list exact specifications or requirements.

Quality Assurance Project Plan for Noble Energy, Inc. Revision 2
May 5, 2017 Pressurized Hydrocarbon Liquids Sampling & Analysis Study (DJCD-PHLAS-RFP-0002) Page 33 of 66
B.5.2.2 The “Fail” or “Review” evaluation shown on the QC Report also provides a means of
gauging the severity of any suspect data that is flagged on a QC Report. A “Fail” shows
deviation from definitive data quality objectives specified by the reference method and
will carry more weight for the suspect data to be investigated, whereas a “Review” may
be interpreted as a warning to monitor data for trends before a major problem arises.
B.5.2.3 Additionally, it should be noted that for the purposes of simplification, the “Pass/Fail”
evaluations listed on the QC summaries provided with the final results may be listed as a
“% Pass” on the QC summary reports to provide a more accurate description in cases
where the DQO is applied to multiple components (i.e., for a 10-component calibration
blend, if 8 components pass the DQO but 2 components fail the DQO, an “80% Pass”
evaluator will be listed rather than a “Fail”, which would imply 100% failure for all
components).
B.5.3 Repeatability DQO
B.5.3.1 Description of DQO - Repeatability criteria provides a means to determine if an
instrument can produce a repeatable response by comparing the results of two
consecutive analyses. GPA defines it as “the expected precision within a laboratory
using the same equipment and same analyst, and represents the difference in analyzed
values between two sequential runs.” The two analyses must be obtained under
identical operating conditions with identical test material.
B.5.3.2 Applicability and Limitations - Repeatability may be applied to the analyses of a
calibration standard and/or sample material, provided enough sample material is
available to perform the duplicate analysis. For some test methods, the nature of the
testing prevents the same sample material from being analyzed consecutively, as the
original sample composition may be permanently altered as part of the normal testing
process.
B.5.3.3 “Pass/Fail/Review” QC Evaluation – The Repeatability DQO is gauged with a “Pass/Fail”
type of evaluation for the test methods that have published criteria available. It should
be noted that the GPA 2103 test method does not have published criteria available and
GPA 2177 criteria is implemented for comparison purposes throughout the PHLSA study.
As the composition of materials analyzed for GPA 2103 are outside the scope of GPA
2177, a “Pass/Review” type of evaluator would the most appropriate for gauging the
repeatability DQOs for the GPA 2103 analysis. However; the LIMS used to generate the
QC reports does not differentiate between the test methods that the formulas are used
for, and will automatically generate the QC reports using a “Pass/Fail” evaluator for the
repeatability DQO of the GPA 2103 analysis.

Quality Assurance Project Plan for Noble Energy, Inc. Revision 2
May 5, 2017 Pressurized Hydrocarbon Liquids Sampling & Analysis Study (DJCD-PHLAS-RFP-0002) Page 34 of 66
B.5.4 Reproducibility DQO
B.5.4.1 Description of DQO - Overall, reproducibility is used to determine if an instrument can
produce reliable and accurate results by comparing the analysis of calibration standard
to the results listed on the certificate for that standard; however, GPA and ASTM
methodology have slight differences in how the criteria is implemented. Reproducibility
is defined by GPA as the difference between two analyzed values by different
laboratories using different equipment and different analysts, but identical operating
conditions. For GPA test methods, reproducibility does not represent the difference
between an analyzed value and the certified value listed on a blend; however, in cases
where the uncertainty of the blend is not known, reproducibility will be implemented in
lieu of the performance evaluation criteria (see below). ASTM methodology implements
reproducibility to compare the results of a calibration standard or certified reference
material to the values listed on the certificate of the standard or reference material.
B.5.4.2 Applicability and Limitations - As implemented for the purposes of the PHLSA study,
reproducibility criteria are only applied to the analyses of calibration standards and/or
certified reference materials; it is not applicable to the analyses of sample materials.
B.5.4.3 “Pass/Fail/Review” QC Evaluation - Reproducibility is gauged with a Pass/Fail type of
indicator for the test methods that have published criteria available. It should be noted
that the GPA 2103 test method does not have published criteria available and GPA 2177
criteria is implemented for comparison purposes throughout the PHLSA study. As the
composition of materials analyzed for GPA 2103 are outside the scope of GPA 2177, a
“Pass/Review” type of evaluator would be the most appropriate for gauging the
reproducibility DQOs for the GPA 2103 analysis. However; the LIMS used to generate
the QC reports does not differentiate between the test methods that the formulas are
used for, and will automatically generate the QC reports using a “Pass/Fail” evaluator
for the reproducibility DQO of the GPA 2103 analysis.
B.5.5 Performance Evaluation Acceptance Criteria DQO
B.5.5.1 Description of DQO - The performance evaluation criteria is the true means by which
GPA test methods will determine if an instrument can produce reliable and accurate
results. GPA defines this as “the ability of an instrument to match the certified values
from a gravimetric blend”. The uncertainty of the blend must be known, as both the
reproducibility criteria and the uncertainty of the blend are used to calculate the
performance evaluation criteria.

Quality Assurance Project Plan for Noble Energy, Inc. Revision 2
May 5, 2017 Pressurized Hydrocarbon Liquids Sampling & Analysis Study (DJCD-PHLAS-RFP-0002) Page 35 of 66
B.5.5.2 Applicability and Limitations - ASTM methods do not implement this type of DQO. The
performance evaluation DQO is only applied to the GC analyses of calibration standards
and/or certified reference materials; it is not applicable to the analyses of sample
materials.
B.5.5.3 “Pass/Fail/Review” QC Evaluation - Performance evaluation criteria is gauged with a
“Pass/Fail” type of evaluator for the test methods that have published criteria available.
It should be noted that the GPA 2103 test method does not have published criteria
available and GPA 2177 criteria is implemented for comparison purposes throughout
the PHLSA study. As the composition of materials analyzed for GPA 2103 are outside
the scope of GPA 2177, a “Pass/Review” type of evaluator would be the most
appropriate for gauging the reproducibility DQOs for the GPA 2103 analysis. However;
the LIMS used to generate the QC reports does not differentiate between the test
methods that the formulas are used for, and will automatically generate the QC reports
using a “Pass/Fail” evaluator for the performance evaluation DQO of the GPA 2103
analysis.
B.5.6 Recovery DQO (Calibration Standards for GC Test Methods)
B.5.6.1 Description of DQO- For analysis of the calibration standard, the recovery criterium is
implemented to provide a means of monitoring the calibration of the instrument as well
as verifying that a repeatable sample volume is introduced into the GC. The recovery is
considered to be the un-normalized sum of all components when the standard is
analyzed as an unknown sample (i.e., a non-calibration run such that the un-normalized
sum will not be equal to the normalized sum). The un-normalized sum is compared
against the calibration amount for the test method analyzed.
B.5.6.2 Applicability and Limitations - The GPA 2261 and GPA 2177 test methods calibrate to
100% of the sample composition. The GPA 2103 analysis does not calibrate for the
heptanes plus (C7+) components, therefore the calibration amount will vary based on
the composition of each blend.
B.5.6.3 “Pass/Fail/Review” QC Evaluation - For the analysis of a calibration standard, the
recovery DQO criteria are gauged with a “Pass/Review” evaluation of the QC data.
B.5.7 Recovery DQO (Instrument Blanks for GC Test Methods)
B.5.7.1 An instrument blank is performed to verify that the analytical system is free from residual
sample material and/or contaminants that would interfere with the results of an
analysis. The blank check consists of the analysis of a component free matrix such as

Quality Assurance Project Plan for Noble Energy, Inc. Revision 2
May 5, 2017 Pressurized Hydrocarbon Liquids Sampling & Analysis Study (DJCD-PHLAS-RFP-0002) Page 36 of 66
the carrier gas of the instrument. In this case, the recovery is defined to be the un-
normalized result of each component.
B.5.7.2 This DQO is only applicable for the hexanes plus (C6+) and heptanes plus (C7+)GC test
methods implemented on thermal conductivity detectors (TCDs). The extended analysis
test methods implemented on flame ionization detectors (FIDs) do not require
calibration and the analyst must visually gauge the raw instrument response to
determine if the analytical system is free of residual sample material.
B.5.7.3 “Pass/Fail/Review” QC Evaluation - For the instrument blank checks, the recovery DQO
criteria are gauged with a “Pass/Review” evaluation of the QC data.
B.5.8 Recovery DQO (Analysis of Unknown Sample for GC Test Methods)
B.5.8.1 For analysis of an unknown sample, the recovery may be used as a rough means of
comparing how similar the compositions are between the calibration standard and the
sample analyzed. In this case, the recovery is referring to the un-normalized sum of all
components detected from the analysis of the unknown sample relative to the
calibration amount.
B.5.8.2 The composition of the calibration standard must be selected such that it resembles the
composition of the samples expected to be analyzed and a sample recovery that differs
greatly from that of the calibration standard may be an indication that the composition
of the calibration standard is not representative of the composition of the sample that
was analyzed. This similarity comparison is only applicable for the hexanes plus (C6+)
and heptanes plus (C7+) GC test methods implemented on thermal conductivity
detectors (TCDs). For purposes of the PHLSA study, the composition of the calibration
standards may be intentionally selected with varying compositions as a predetermined
investigation and is expected due to the nature of this project.
B.5.8.3 “Pass/Fail/Review” QC Evaluation - For the analysis of a calibration standard and the
instrument blank checks, the recovery DQO criteria are gauged with a “Pass/Review”
evaluation of the QC data. The recovery comparison implemented with the analysis of
an unknown sample is a simple ballpark observation to assist with troubleshooting if
needed, and no definitive “Pass/Fail/Review” type of evaluator is required.
B.5.9 Fidelity Plot DQOs
B.5.9.1 Description of DQO - Fidelity plots are log-log plots of the molecular weight vs. the
response factor of the instrument for each component in the reference blend. The plot

Quality Assurance Project Plan for Noble Energy, Inc. Revision 2
May 5, 2017 Pressurized Hydrocarbon Liquids Sampling & Analysis Study (DJCD-PHLAS-RFP-0002) Page 37 of 66
provides a means for comparison of the actual vs. expected response relative to the
concentration of each component stated on the certificate. The molecular weight
increases incrementally for the normal alkane components, and a linear response of the
TCD type detector should provide a proportionate response for each of those
components (regardless of the actual concentration of the components). The Pearson
Correlation Coefficient (R2 Value) is determined for the normal alkane series, with a 1.0
representing a linear response of the instrument. A non-linear fidelity plot may indicate
a potential problem with the GC or with the calibration standard. For an instrument
that has been previously verified to be in control, the plot provides a means for
determining if the standard is suitable for service. Prior to placing the standard in
service, the composition of the standard must be verified to match the values stated on
the certificate for the blend. Once placed in service, the fidelity plots monitor the
condition of the standard to verify that it has not become compromised over time. For
example, if the standard is not stored or handled properly and the lighter components
are allowed to flash out of the blend, the composition of the standard is permanently
altered and the standard may no longer be used for instrument calibrations. GPA 2198
should be referenced if needed to provide additional details and information regarding
fidelity plots.
B.5.9.2 Applicability and Limitations-Fidelity Plots are applicable to calibration standards
analyzed by the C6+ and C7+ GC test methods implemented on thermal conductivity
detectors (TCDs). As the fidelity plots are dependent on a stable and linear instrument
response, all components must be plotted from the same detector. This DQO is not
applicable to test methods that implement multiple columns and detectors to analyze
the complete sample such as the portable GCs and the ASTM D1945-1946 methods.
Additionally, the components plotted must have a linear correlation between the
molecular weight; therefore, the plot is not applicable to components with identical
molecular weights such as isomers.
B.5.9.3 “Pass/Fail/Review” QC Evaluation - There are no published criteria available from GPA
for the fidelity plot DQOs; therefore, the criteria implemented is gauged with a
“Pass/Review” type of evaluator.
B.5.10 Control Charts DQO
B.5.10.1 Description of DQO - Control charts are a statistical tool used to provide a means for
distinguishing a pattern of normal, random variations of the instrument response. The
charts are generated to monitor both the instrument as well as the condition of the
calibration standard over a period of time. Individual charts must be maintained for

Quality Assurance Project Plan for Noble Energy, Inc. Revision 2
May 5, 2017 Pressurized Hydrocarbon Liquids Sampling & Analysis Study (DJCD-PHLAS-RFP-0002) Page 38 of 66
each component in each reference standard, for each detector the standards are
consistently analyzed on. A maximum of 20 data points of history will be plotted on the
control charts for each component, along with the average of the most recent 20 data
points, and ±1 standard deviations, ±2 standard deviations, and ±3 standard deviations.
As new data from current analyses are added, the older data in the chart is replaced by
the FIFO (first in, first out) method. Trends are identified and flagged using the Western
Electric Control Chart Rule Violations listed in GPA 2198, as stated below.
4 of 5 consecutive points above or below the ± 1 Standard Deviation Limits (± 1σ).
Any point outside of the Control Limits (± 3σ).
2 of 3 points outside the Warning Limits (± 2σ).
7 consecutive points, all above or all below the average
8 consecutive points within ± 1 Standard Deviation Limits (± 1σ).
5 consecutive points moving in the same vertical direction, either increasing or decreasing
B.5.10.2 Applicability and Limitations - Control charting is applicable to all components for nearly
all GC test methods used throughout the PHLSA study, provided that the operating
conditions, instrument response, and the composition of the calibration standard must
all remain stable throughout the duration of the data plotted. If operating conditions
change and/or outlier data is included, the control chart will not be useful in flagging
data trends or to diagnose potential problems. If a new standard is placed in service
that differs in composition from the previous standard, or if major maintenance is
performed that results in a change of instrument response, new charts must be started
for all components for that instrument. Additionally, control charts must be generated
with consistent data inputs over the period of time that the data is plotted. Charts that
are generated with infrequent or inconsistent data inputs will not provide a true
indication of the normal variation of instrument response, and will not be useful in
flagging data trends (i.e., if large periods of time elapse without data input, or if large
amounts of data are added within a small amount of time).
B.5.10.3 “Pass/Fail/Review” QC Evaluation – Control charts provide a means to focus on data
trends that have the potential to indicate minor problems with an instrument or
calibration standard, before the problem develops into a more severe problem. Flagged
data does not necessarily indicate that the analysis is out of control and/or that
corrective actions are necessary. GPA 2198 specifies the control chart rule violations
that should be used to monitor and flag trends and/or suspect data; however, there are
no requirements or guidelines for gauging the severity of the flagged data. Therefore,

Quality Assurance Project Plan for Noble Energy, Inc. Revision 2
May 5, 2017 Pressurized Hydrocarbon Liquids Sampling & Analysis Study (DJCD-PHLAS-RFP-0002) Page 39 of 66
the criteria implemented for the control chart rule violations are gauged with a
“Pass/Review” type of evaluator. An analyst that is familiar with the day to day
operation and maintenance of the instrument, how long a particular standard has been
in service, and the normal deviation of the instrument response may use their discretion
in the interpretation of any flagged data.
B.5.11 Equipment Verification DQO (Physical Shrinkage Determination)
B.5.11.1 Description and Applicability of DQO- Equipment verifications are performed to verify
that the equipment used for analyses have not been damaged and are suitable for
continued service. The physical shrinkage determination uses a water draw procedure
to compare the volume within the piston to the NIST traceable volume stated on the
corresponding certificate for that piston.
B.5.11.2 Applicability and Limitations - This DQO is only applicable to the physical shrinkage
determination.
B.5.11.3 “Pass/Fail/Review” QC Evaluation - The physical shrinkage determination does not have
published criteria available and this DQO is gauged with a “Pass/Review” type of
evaluator.
B.5.12 Equipment Verification DQO (Reid Vapor Pressure)
B.5.12.1 Description and Applicability of DQO- Equipment verifications are performed to verify
that the equipment used for analyses have not been damaged and are suitable for
continued service. The ASTM D323 RVP test method specifies a procedure to verify the
accuracy of the RVP gauges used for the analytical testing process. After the sample
analysis is complete, the RVP gauge pressure is compared against a manometer with an
equal amount of pressure applied.
B.5.12.2 Applicability and Limitations - This DQO is only applicable to the Reid Vapor Pressure
analysis.
B.5.12.3 “Pass/Fail/Review” QC Evaluation - The ASTM D323 Reid Vapor Pressure (RVP) method
published criteria is implemented for the verification; however, a “Pass/Review” type of
evaluator is used to gauge this DQO criterium since the method does not specify the
frequency of the verifications and/or provide guidelines regarding when to remove a
gauge from service. This verification is performed with each sample analyzed and is
implemented as a means to monitor the accuracy of each gauge in service. Experience
has shown that a particular sample result may result in a “Review” QC evaluation of the

Quality Assurance Project Plan for Noble Energy, Inc. Revision 2
May 5, 2017 Pressurized Hydrocarbon Liquids Sampling & Analysis Study (DJCD-PHLAS-RFP-0002) Page 40 of 66
RVP gauge used for one analysis, but may result in a “Pass” once the gauge is properly
cleaned and used for the next sample analysis. Gauges that frequently result in a
“Review” may be removed from service at the discretion of the laboratory supervisor.
Additionally, it should be noted that regardless of the resulting “Pass/Review”
evaluation, all final results are reported from the manometer reading and not the RVP
gauge reading.
B.5.13 Calibration Check DQO
B.5.13.1 Description of DQO–The calibration check DQO is performed to verify the calibration of
a balance. On each day that the balance is used, NIST traceable weights will be used to
verify the calibration across the working range of the balance; and the weights are
selected such that verifications are performed at approximately 1%, 50%, and 100% of
the balance capacity. The balance result for each weight is then compared against the
corresponding NIST value stated on the certificate for that weight. This DQO is a
separate requirement from the annual verifications/calibrations that are provided by an
external vendor for the NIST traceability of the balance.
B.5.13.2 Applicability and Limitations - This DQO is only applicable for use to verify the
calibration of a balance.
B.5.13.3 “Pass/Fail/Review” QC Evaluation - The balance acceptance limits published for
ANSI/ASTM class I weights are implemented as the balance calibration DOQs criteria;
therefore, a “Pass/Fail” type of evaluator is used.
B.5.14 Data Quality Objectives (DQOs) for Each Analysis
The DQO tables below provide additional details for each DQO as it pertains to each test
method and, if applicable, each component in that test method. These tables also
include the formulas used to determine the criteria along with brief definitions and
notes that are helpful to understand how the calculations are applied. For ease of
reference, the DQO Tables are grouped similarly to the DQI Tables in QAPP Section A.7,
and are also segregated by GC and ASTM testing. However, to provide the detail
needed, each GC test method has an individual table listing the DQOs for each GC test
method. All of the ASTM test methods are grouped in a single table.

Quality Assurance Project Plan for Noble Energy, Inc. Revision 2
May 5, 2017 Pressurized Hydrocarbon Liquids Sampling & Analysis Study (DJCD-PHLAS-RFP-0002) Page 41 of 66
Table 13. Applicable concentration ranges for GPA 2261 (C6 Gas Analysis) and GPA 2177 (C6 Liquid Analysis) Precision Criteria
Component 2261 Range (Mol %) 2177 Range (Mol %)
(*also implemented for GPA 2103)
Nitrogen 0.02 - 15 *0.01 – 5.0
Methane 50 - 100 *0.01 – 5.0
Carbon Dioxide 0.2 – 15 *0.01 – 5.0
Ethane 0.2 - 15 *0.01 – 95.0
Propane 0.2 - 15 *0.01 – 100.0
Iso-Butane 0.2 - 8 *0.01 – 100.0
N-Butane 0.2 - 8 *0.01 – 100.0
Iso-Pentane 0.2 – 8 *0.01 – 15.0
N-Pentane 0.2 - 4 *0.01 – 15.0
Hexanes Plus 0.2 - 2 0.01 – 15.0

Quality Assurance Project Plan for Noble Energy, Inc. Revision 2
May 5, 2017 Pressurized Hydrocarbon Liquids Sampling & Analysis Study (DJCD-PHLAS-RFP-0002) Page 42 of 66
Table 14. Data Quality Objectives (DQOs) for GPA 2103 C7+ Condensate Test Methoda
Blank Component Recovery
Sum of Component Recoveries
Method Reproducibility (R)b
Performance Evaluation Criteria
(PE)c
Method Repeatability (r)b
Fidelity Plot Control Charts
Blank Check Result ≤ 0.01 LV % - - - - - -
Nitrogen -
Sum ± 5% of Cal Amt R = 0.8*X(2/7) PE = X ± (U2 + R2)(1/2) r = 0.1233*X (1/3) N Alkane Series R2> 0.990
Area counts plotted for each component with average, ± 1, ±2, and ± 3 standard deviations.
Methane
Carbon Dioxide
Ethane
Propane
Iso-Butane
N-Butane
Iso-Pentane
N-Pentane
DQO Notes Result is the un-normalized concentration of each component detected from analysis of a component free matrix, such as the carrier gas.
Sum is the sum of all un-normalized concentrations of a standard. Cal Amt refers to the total concentration that the method is calibrated for. GPA 2103 does not calibrate for the C6+ components.
X is component concentration listed on the certificate of the blend.
U is the uncertainty of blend component. R is Reprod for component. X is component concentration listed on the certificate of the blend.
X is the component concentration of run 1 out of 2 consecutive runs.
R2 is the Pearson Correlation Coefficient indicating a measure of the linear correlation between the two variables (in this case, molecular weight vs. instrument response for each component).
Trending of each component is monitored as per GPA 2198.
a. All DQOs apply to all components, QC checks must be performed at least once per batch of samples analyzed.
b. No GPA published criteria available for GPA 2103, therefore GPA 2177-13 Reproducibility (R) and Repeatability (r) criteria are applied for
comparison purposes. GPA 2177 Reproducibility and Repeatability criteria may be applied in any unit of concentration, but is listed here in
LV%.
c. If the Uncertainty (U) of the calibration blend is known, the Performance Evaluation (PE) criteria will be used in lieu of Reproducibility (R).

Quality Assurance Project Plan for Noble Energy, Inc. Revision 2
May 5, 2017 Pressurized Hydrocarbon Liquids Sampling & Analysis Study (DJCD-PHLAS-RFP-0002) Page 43 of 66
Table 15. Data Quality Objectives (DQOs) for GPA 2177 C6+ Liquids Test Methodd
Blank Component Recovery
Sum of Component Recoveries
Method Reproducibility (R)e
Performance Evaluation Criteria
(PE)f
Method Repeatability (r)e
Fidelity Plot Control Charts
Blank Check Result ≤ 0.01 LV % - - - - - -
Nitrogen -
Sum ± 5% of Cal Amt
R = 0.8*X(2/7) PE = X ± (U2 + R2)(1/2) r = 0.1233*X (1/3) N Alkane Series R2> 0.990
Area counts plotted for each component with average, ± 1, ±2, and ± 3 standard deviations.
Methane
Carbon Dioxide
Ethane
Propane
Iso-Butane
N-Butane
Iso-Pentane
N-Pentane
Hexanes Plus
DQO Notes Result is the un-normalized concentration of each component detected from analysis of a component free matrix, such as the carrier gas.
Sum is the sum of all un-normalized concentrations of a standard. Cal Amt refers to the total concentration that the method is calibrated for. GPA 2177 is calibrated for 100% of sample components present.
X is component concentration listed on the certificate of the blend.
U is the uncertainty of blend component. R is Reprod for component. X is component concentration listed on the certificate of the blend.
X is the component concentration of run 1 out of 2 consecutive runs.
R2 is the Pearson Correlation Coefficient indicating a measure of the linear correlation between the two variables (in this case, molecular weight vs. instrument response for each component).
Trending of each component is monitored as per GPA 2198.
d. All DQOs apply to all components, QC checks must be performed at least once per batch of samples analyzed.
e. GPA 2177-13 Reproducibility (R) and Repeatability (r) criteria applied; may be used in any unit of concentration, but is listed here in LV%.
f. If the Uncertainty (U) of the calibration blend is known, the Performance Evaluation (PE) criteria will be used in lieu of Reproducibility (R).
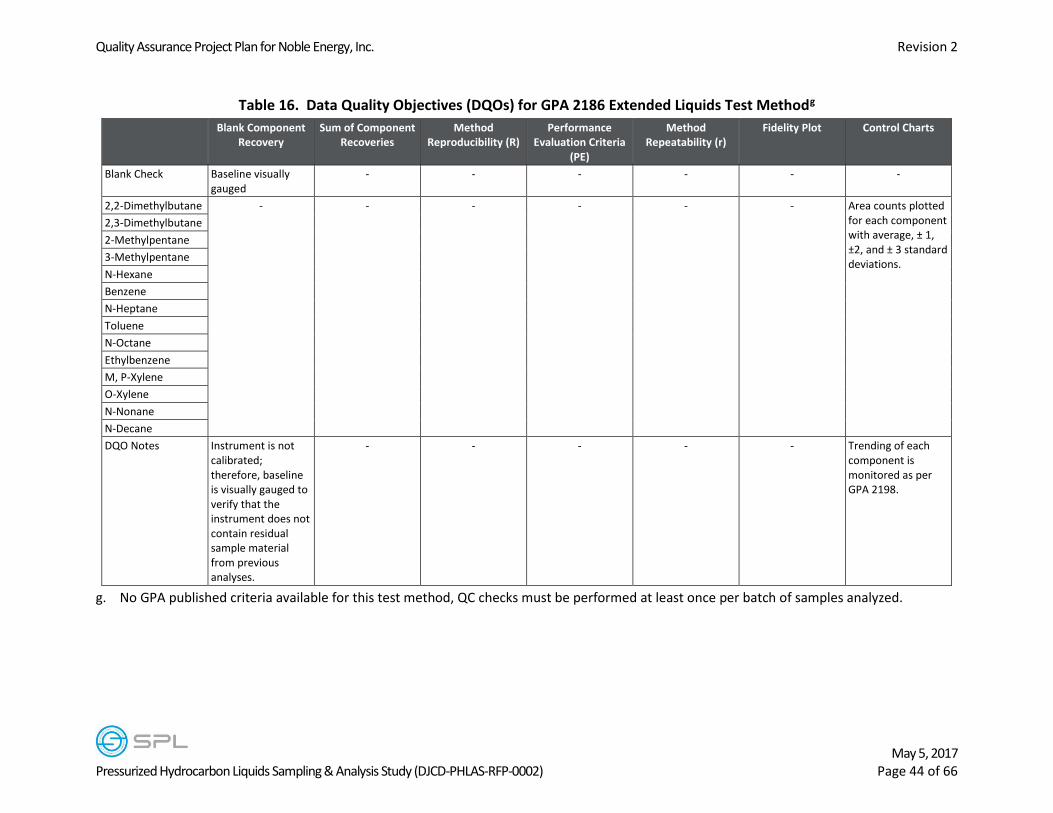
Quality Assurance Project Plan for Noble Energy, Inc. Revision 2
May 5, 2017 Pressurized Hydrocarbon Liquids Sampling & Analysis Study (DJCD-PHLAS-RFP-0002) Page 44 of 66
Table 16. Data Quality Objectives (DQOs) for GPA 2186 Extended Liquids Test Methodg
Blank Component Recovery
Sum of Component Recoveries
Method Reproducibility (R)
Performance Evaluation Criteria
(PE)
Method Repeatability (r)
Fidelity Plot Control Charts
Blank Check Baseline visually gauged
- - - - - -
2,2-Dimethylbutane -
-
-
-
-
-
Area counts plotted for each component with average, ± 1, ±2, and ± 3 standard deviations.
2,3-Dimethylbutane
2-Methylpentane
3-Methylpentane
N-Hexane
Benzene
N-Heptane
Toluene
N-Octane
Ethylbenzene
M, P-Xylene
O-Xylene
N-Nonane
N-Decane
DQO Notes Instrument is not calibrated; therefore, baseline is visually gauged to verify that the instrument does not contain residual sample material from previous analyses.
-
-
-
-
-
Trending of each component is monitored as per GPA 2198.
g. No GPA published criteria available for this test method, QC checks must be performed at least once per batch of samples analyzed.

Quality Assurance Project Plan for Noble Energy, Inc. Revision 2
May 5, 2017 Pressurized Hydrocarbon Liquids Sampling & Analysis Study (DJCD-PHLAS-RFP-0002) Page 45 of 66
Table 17. Data Quality Objectives (DQOs) for GPA 2103 Extended Condensate (C6-C10 Cuts) Test Methodh
Blank Component Recovery
Sum of Component Recoveries
Method Reproducibility (R)
Performance Evaluation Criteria
(PE)
Method Repeatability (r)
Fidelity Plot Control Charts
Blank Check Baseline visually gauged
- - - - - -
2,2-Dimethylbutane
-
-
-
-
-
-
Area counts plotted for each component with average, ± 1, ±2, and ± 3 standard deviations.
2,3-Dimethylbutane
2-Methylpentane
3-Methylpentane
N-Hexane
Benzene
N-Heptane
Toluene
N-Octane
Ethylbenzene
M, P-Xylene
O-Xylene
N-Nonane
N-Decane
DQO Notes Instrument is not calibrated; therefore, baseline is visually gauged to verify that the instrument does not contain residual sample material from previous analyses.
-
-
-
-
-
Trending of each component is monitored as per GPA 2198.
h. No GPA published criteria available for this test method, QC checks must be performed at least once per batch of samples analyzed.

Quality Assurance Project Plan for Noble Energy, Inc. Revision 2
May 5, 2017 Pressurized Hydrocarbon Liquids Sampling & Analysis Study (DJCD-PHLAS-RFP-0002) Page 46 of 66
Table 18. Data Quality Objectives (DQOs) for GPA 2261 C6+ Gas (Benchtop GC) Test Methodi
Blank Component Recovery
Sum of Component Recoveries
Method Reproducibility (R)j
Performance Evaluation Criteria
(PE)k
Method Repeatability (r)j
Fidelity Plot Control Charts
Blank Check Result ≤ 0.01 Mol% - - - - - -
Nitrogen -
Sum ± 5% of Cal Amt
R = 0.158*X(1/2) PE = X ± (U2 + R2)(1/2) r = 0.039*X(1/4) N Alkane Series R2> 0.990
Area counts plotted for each component with average, ± 1, ±2, and ± 3 standard deviations.
Methane R = 91000*X(-3) r = 0.0079*X(1/3)
Carbon Dioxide R = 0.12*X(1/3) r = 0.0042*X(1/3)
Ethane R = 0.0315*X(1/3) r = 0.0124*X(1/3)
Propane R = 0.026*X(1/2) r = 0.0084*X(1/8)
Iso-Butane R = 0.018*X(1/2) r = 0.01*X(1/5)
N-Butane R = 0.033*X(1/2) r = 0.0117*X(2/5)
Iso-Pentane R = 0.025*X(1/4) r = 0.009*X(1/4)
N-Pentane R = 0.026*X(1/3) r = 0.01*X(1/5)
Hexanes Plus R = 0.051*X(1/2) r = 0.0135*X(1/4)
DQO Notes Result is the un-normalized concentration of each component detected from analysis of a component free matrix, such as the carrier gas.
Sum is the sum of all un-normalized concentrations of a standard. Cal Amt refers to the total concentration that the method is calibrated for. GPA 2261 is calibrated for 100% of sample components present.
X is component concentration listed on the certificate of the blend.
U is the uncertainty of blend component. R is Reprod for component. X is component concentration listed on the certificate of the blend.
X is the component concentration of run 1 out of 2 consecutive runs.
R2 is the Pearson Correlation Coefficient indicating a measure of the linear correlation between the two variables (in this case, molecular weight vs. instrument response for each component).
Trending of each component is monitored as per GPA 2198.
i. All DQOs apply to all components, unless specific formula is present for that component. QC checks must be performed at least once per
batch of samples analyzed.
j. GPA 2261-13 Reproducibility (R) and Repeatability (r) criteria applied, must be implemented in Mol%.
k. If the Uncertainty (U) of the calibration blend is known, the Performance Evaluation (PE) criteria will be used in lieu of Reproducibility (R).

Quality Assurance Project Plan for Noble Energy, Inc. Revision 2
May 5, 2017 Pressurized Hydrocarbon Liquids Sampling & Analysis Study (DJCD-PHLAS-RFP-0002) Page 47 of 66
Table 19. Data Quality Objectives (DQOs) for GPA 2261 C6+ Gas (Portable GC) Test Methodl
Blank Component Recovery
Sum of Component Recoveries
Method Reproducibility (R)m
Performance Evaluation Criteria
(PE)n
Method Repeatability (r)m
Fidelity Plot Control Charts
Blank Check Result ≤ 0.01 Mol% - - - - - -
Nitrogen -
-
R = 0.158*X(1/2) PE = X ± (U2 + R2)(1/2) r = 0.039*X(1/4) -
- Methane R = 91000*X(-3) r = 0.0079*X(1/3)
Carbon Dioxide R = 0.12*X(1/3) r = 0.0042*X(1/3)
Ethane R = 0.0315*X(1/3) r = 0.0124*X(1/3)
Propane R = 0.026*X(1/2) r = 0.0084*X(1/8)
Iso-Butane R = 0.018*X(1/2) r = 0.01*X(1/5)
N-Butane R = 0.033*X(1/2) r = 0.0117*X(2/5)
Iso-Pentane R = 0.025*X(1/4) r = 0.009*X(1/4)
N-Pentane R = 0.026*X(1/3) r = 0.01*X(1/5)
Hexanes Plus R = 0.051*X(1/2) r = 0.0135*X(1/4)
DQO Notes Result is the un-normalized concentration of each component detected from analysis of a component free matrix, such as the carrier gas.
Port. GCs use multiple columns/detectors to calculate groups of components and recovery criteria is not applicable.
X is component concentration listed on the certificate of the blend.
U is the uncertainty of blend component. R is Reprod for component. X is component concentration listed on the certificate of the blend.
X is the component concentration of run 1 out of 2 consecutive runs.
Port. GCs use multiple columns/detectors to calculate groups of components. Fidelity plots must have all data available from same detector, and are not applicable.
Control charts must have consistent use and data to plot a stable response over time. Port. GCs used intermittently throughout study.
l. All DQOs apply to all components, unless specific formula is present for that component. QC checks must be performed at least once per
batch of samples analyzed.
m. GPA 2261-13 Reproducibility (R) and Repeatability (r) criteria applied, must be implemented in Mol%.
n. If the Uncertainty (U) of the calibration blend is known, the Performance Evaluation (PE) criteria will be used in lieu of Reproducibility (R).

Quality Assurance Project Plan for Noble Energy, Inc. Revision 2
May 5, 2017 Pressurized Hydrocarbon Liquids Sampling & Analysis Study (DJCD-PHLAS-RFP-0002) Page 48 of 66
Table 20. Data Quality Objectives (DQOs) for GPA 2286 Extended Gas Test Methodo
Blank Component Recovery
Sum of Component Recoveries
Method Reproducibility (R)
Performance Evaluation Criteria
(PE)
Method Repeatability (r)
Fidelity Plot Control Charts
Blank Check Baseline visually gauged
- - - - - -
2,2-Dimethylbutane -
-
-
-
-
-
Area counts plotted for each component with average, ± 1, ±2, and ± 3 standard deviations.
2,3-Dimethylbutane
2-Methylpentane
3-Methylpentane
N-Hexane
Benzene
N-Heptane
Toluene
N-Octane
Ethylbenzene
M, P-Xylene
O-Xylene
N-Nonane
N-Decane
DQO Notes Instrument is not calibrated; therefore, baseline is visually gauged to verify that the instrument does not contain residual sample material from previous analyses.
-
-
-
-
-
Trending of each component is monitored as per GPA 2198.
o. No GPA published criteria available for this test method, QC checks must be performed at least once per batch of samples analyzed.

Quality Assurance Project Plan for Noble Energy, Inc. Revision 2
May 5, 2017 Pressurized Hydrocarbon Liquids Sampling & Analysis Study (DJCD-PHLAS-RFP-0002) Page 49 of 66
Table 21. Data Quality Objectives (DQOs) for ASTM D1945-1946 Refinery Gas Test Method (TCD Channels)p
Blank Component Recovery
Sum of Component Recoveries
Method Reproducibility
(R)q
Performance Evaluation Criteria
(PE)
Method Repeatability (r)q
Fidelity Plot Control Charts
Helium -
-
Reprod calculated for each component based on concentration, see below.
-
Repeat calculated for each component based on concentration, see below.
-
Area counts plotted for each component with average, ± 1, ±2, and ± 3 standard deviations.
Hydrogen
Carbon Dioxide
Ethylene
Ethane
Argon/Oxygen
Nitrogen
Methane
Carbon Dioxide
Mo l% (0 ≤ X ≤ 1) R = 0.1 r = 0.05
Mol % (1 ≤ X ≤ 5) R = 0.2 r = 0.1
Mol % (5 ≤ X ≤ 25) R = 0.5 r = 0.3
Mol %(25 ≤ X ≤ 100) R = 1.0 r = 0.5
DQO Notes Result is the un-normalized concentration of each component detected from analysis of a component free matrix, such as the carrier gas.
This instrument configuration uses multiple columns/detectors to calculate groups of components and recovery criteria is not applicable.
X is component concentration listed on the certificate of the blend.
-
X is the component concentration of run 1 out of 2.
This instrument uses multiple columns/detectors to calculate groups of components. Fidelity plots must have all data available from same detector, and are not applicable.
Trending of each component is monitored as per GPA 2198.
p. All DQOs apply to all components; formula used is dependent on the concentration detected for each component. QC checks must be
performed at least once per batch of samples analyzed.
q. ASTM D1946-90 (2015) Reproducibility (R) and Repeatability (r) criteria applied, must be implemented in Mol%.

Quality Assurance Project Plan for Noble Energy, Inc. Revision 2
May 5, 2017 Pressurized Hydrocarbon Liquids Sampling & Analysis Study (DJCD-PHLAS-RFP-0002) Page 50 of 66
Table 22. Data Quality Objectives (DQOs) for ASTM D1945-1946 Refinery Gas Test Method (FID Channel)r
Blank Component Recovery
Sum of Component Recoveries
Method Reproducibility (R)s
Performance Evaluation Criteria
(PE)
Method Repeatability (r)s
Fidelity Plot Control Charts
Propane -
-
Reprod calculated for each component based on concentration, see below.
-
Repeat calculated for each component based on concentration, see below.
-
Area counts plotted for each component with average, ± 1, ±2, and ± 3 standard deviations.
Propylene
Iso-Butane
N-Butane
Propadiene
Trans-2-Butene
1-Butene
Iso-Butylene
Cis-2-Butene
Iso-Pentane
N-Pentane
1,3-Butadiene
Hexanes Plus
Mol %(0 ≤ X ≤ 0.09) R = 0.02 r = 0.01
Mol %(0.1 ≤ X ≤ 0.9) R = 0.07 r = 0.04
Mol%(1.0 ≤ X ≤ 4.9) R = 0.10 r = 0.07
Mol %(5.0 ≤ X ≤ 10) R = 0.12 r = 0.08
Mol %(10 ≤ X) R = 0.15 r = 0.10
DQO Notes Result is the un-normalized concentration of each component detected from analysis of a component free matrix, such as the carrier gas.
This instrument configuration uses multiple columns/detectors to calculate groups of components and recovery criteria is not applicable.
X is component concentration listed on the certificate of the blend.
-
X is the component concentration of run 1 out of 2.
This instrument uses multiple columns/detectors, fidelity plots must have all data available from same detector, and are not applicable.
Trending of each component is monitored as per GPA 2198.
r. All DQOs apply to all components, unless specific formula is present for the concentration detected for that component. QC checks must be
performed at least once per batch of samples analyzed
s. ASTM D1945-14 Reproducibility (R) and Repeatability (r) criteria applied, must be implemented in Mol%.

Quality Assurance Project Plan for Noble Energy, Inc. Revision 2
May 5, 2017 Pressurized Hydrocarbon Liquids Sampling & Analysis Study (DJCD-PHLAS-RFP-0002) Page 51 of 66
Table 23. Data Quality Objectives (DQOs) for ASTM D2887 High Temperature Simulated Distillation Test Methodt
Blank Component Recovery
Sum of Component Recoveries
Method Reproducibility (R)u
Performance Evaluation Criteria
(PE)
Method Repeatability (r)
Fidelity Plot Control Charts
% Off - IBP -
-
R = 0.066*X - -
-
- % Off – 5% R =
0.015*(X + 100)
% Off – 10 - 20% R = 0.015*(X + 100)
% Off – 30% R = 0.015*(X + 100)
% Off – 40% R = 4.3
% Off – 50 - 90% R = 4.3
% Off – 95% R = 5
% Off – FBP R = 11.8
DQO Notes -
-
X = average of two results (in °C). Reproducibility criteria used for both Diesel Fuel Crosscheck and Lab Control Sample (LCS).
-
-
-
-
t. ASTM D2887-15 Reproducibility (R) criteria applied. QC checks must be performed at the beginning of each batch of samples, and after
every 10th sample analyzed.
u. Reproducibility Criteria used for both Diesel Fuel Crosscheck and Lab Control Sample (LCS).
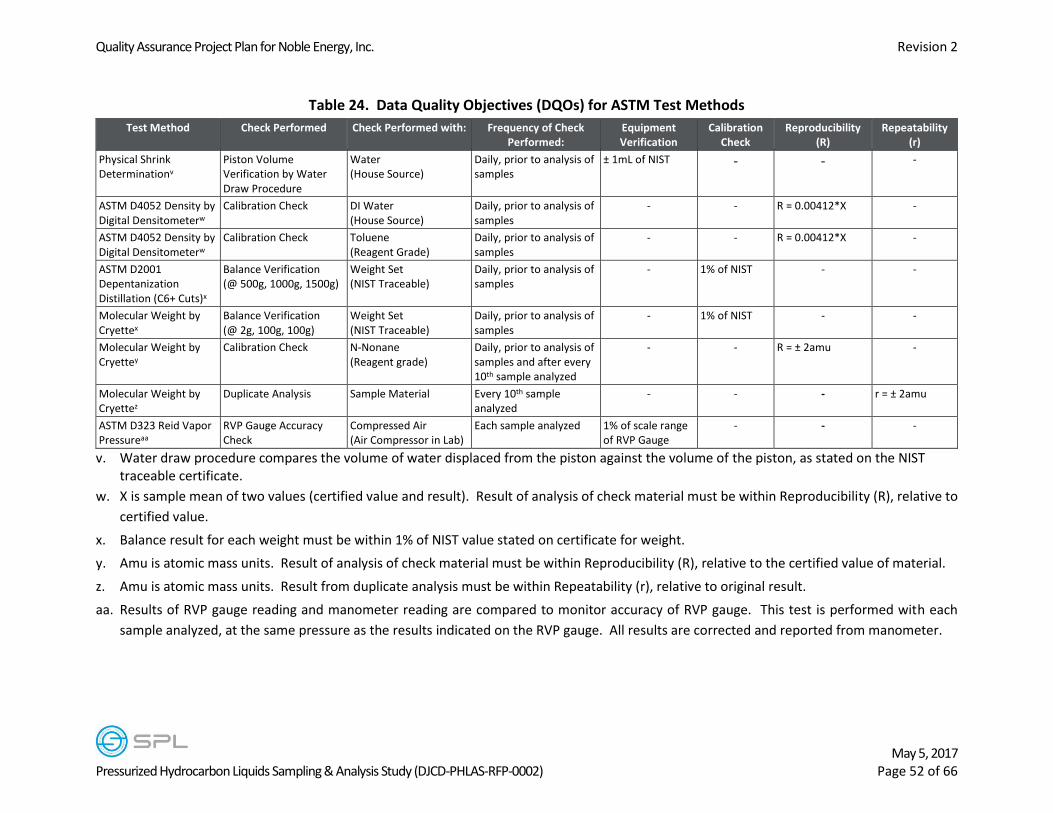
Quality Assurance Project Plan for Noble Energy, Inc. Revision 2
May 5, 2017 Pressurized Hydrocarbon Liquids Sampling & Analysis Study (DJCD-PHLAS-RFP-0002) Page 52 of 66
Table 24. Data Quality Objectives (DQOs) for ASTM Test Methods
Test Method Check Performed Check Performed with: Frequency of Check Performed:
Equipment Verification
Calibration Check
Reproducibility (R)
Repeatability (r)
Physical Shrink Determinationv
Piston Volume Verification by Water Draw Procedure
Water (House Source)
Daily, prior to analysis of samples
± 1mL of NIST -
- -
ASTM D4052 Density by Digital Densitometerw
Calibration Check DI Water (House Source)
Daily, prior to analysis of samples
- - R = 0.00412*X -
ASTM D4052 Density by Digital Densitometerw
Calibration Check Toluene (Reagent Grade)
Daily, prior to analysis of samples
- - R = 0.00412*X -
ASTM D2001 Depentanization Distillation (C6+ Cuts)x
Balance Verification (@ 500g, 1000g, 1500g)
Weight Set (NIST Traceable)
Daily, prior to analysis of samples
- 1% of NIST - -
Molecular Weight by Cryettex
Balance Verification (@ 2g, 100g, 100g)
Weight Set (NIST Traceable)
Daily, prior to analysis of samples
- 1% of NIST - -
Molecular Weight by Cryettey
Calibration Check N-Nonane (Reagent grade)
Daily, prior to analysis of samples and after every 10th sample analyzed
- - R = ± 2amu -
Molecular Weight by Cryettez
Duplicate Analysis Sample Material Every 10th sample analyzed
- - - r = ± 2amu
ASTM D323 Reid Vapor Pressureaa
RVP Gauge Accuracy Check
Compressed Air (Air Compressor in Lab)
Each sample analyzed 1% of scale range of RVP Gauge
- - -
v. Water draw procedure compares the volume of water displaced from the piston against the volume of the piston, as stated on the NIST traceable certificate.
w. X is sample mean of two values (certified value and result). Result of analysis of check material must be within Reproducibility (R), relative to
certified value.
x. Balance result for each weight must be within 1% of NIST value stated on certificate for weight.
y. Amu is atomic mass units. Result of analysis of check material must be within Reproducibility (R), relative to the certified value of material.
z. Amu is atomic mass units. Result from duplicate analysis must be within Repeatability (r), relative to original result.
aa. Results of RVP gauge reading and manometer reading are compared to monitor accuracy of RVP gauge. This test is performed with each
sample analyzed, at the same pressure as the results indicated on the RVP gauge. All results are corrected and reported from manometer.

Quality Assurance Project Plan for Noble Energy, Inc. Revision 2
May 5, 2017 Pressurized Hydrocarbon Liquids Sampling & Analysis Study (DJCD-PHLAS-RFP-0002) Page 53 of 66
B.6 Instrument / Equipment Testing, Inspection, & Maintenance Requirements
B.6.1 All laboratory instrumentation and equipment used for process measurements will be verified for calibration as per the procedures detailed in QAPP Section B.7. All equipment that requires periodic certifications and/or calibrations will have records available showing that the equipment has been either certified by an external vendor or verified in-house with NIST traceable equipment. This is required for equipment such as thermometers, pressure gauges, balances, weights, flowmeters, and deadweight testers. A detailed report of all equipment used throughout the study, along with dates and records of certification, will be provided as part of the final QC Report submitted.
B.6.2 GC instruments used in the laboratory for analysis will verified for calibration as per the schedule detailed in QAPP Section B.7; and as a general rule, the GC instrumentation will not be recalibrated unless necessary. If the GC is found to be out of calibration, it will be investigated to determine if a corrective action is necessary or if it simply needs to be recalibrated. If the findings of the investigations warrant maintenance or repairs, the maintenance will be documented in dedicated maintenance logbooks, and include symptoms/cause for maintenance, repairs or modifications made, the date the maintenance was performed, and the initials of the individual performing the maintenance.
B.7 Instrument Calibration& Frequency
B.7.1 GC Laboratory - Instruments will have the calibration procedures (as listed in QAPP Section B.5) for each analysis performed according to the frequency stated in the GC test method DQO tables (QAPP Tables 14 -23).
B.7.2 ASTM Laboratory
B.7.2.1 Primary calibration equipment thermometers, weights, balances, pressure gauges, and dead weight testers will be calibrated annually by an external vendor to a NIST traceable source, unless the certificate provided by the vendor states otherwise for the recertification period. Secondary working thermometers will be verified against the primary calibration thermometer annually. Balances will be verified daily, prior to use with the NIST traceable weights. Pressure gauges will be verified annually with NIST traceable dead weight testers. Documentation for outside calibrations will be maintained by the individual responsible for coordinating the calibration services. Documentation of daily verifications will be maintained in dedicated logbooks and/or with worksheets specific for each set of analytical data.
B.7.2.2 The DQOs required for the ASTM test methods will be performed according to the frequency stated in the ASTM Test Method DQO Table (QAPP Table 24).

Quality Assurance Project Plan for Noble Energy, Inc. Revision 2
May 5, 2017 Pressurized Hydrocarbon Liquids Sampling & Analysis Study (DJCD-PHLAS-RFP-0002) Page 54 of 66
B.7.3 Blending Equipment – weights and balances will be calibrated annually by an external vendor to a NIST traceable source. Balances will be verified daily, prior to use, with the NIST traceable weights.
B.7.4 Field Equipment
B.7.4.1 Pressure gauges implemented for measurements made in the field will be verified in SPL’s corporate office prior to each sampling event, using a NIST traceable dead weight tester and/or pressure gauge.
B.7.4.2 Process measurement instrumentation will be maintained by Noble. Documentation and maintenance records will be provided to SPL and Movilab for all applicable instrumentation used for the PHLSA study.

Quality Assurance Project Plan for Noble Energy, Inc. Revision 2
May 5, 2017 Pressurized Hydrocarbon Liquids Sampling & Analysis Study (DJCD-PHLAS-RFP-0002) Page 55 of 66
Table 25. Bernhardt PC-J31Well Production Facility Instrumentation List and Specifications
Parameter Datalogger ID Location Instrument Range Accuracy Calibration
Method Data Collection
FrequencyB Units
Ambient pressure (Pamb)
PIT 4 Automation Stand Pressure transducer
0-1.5 psig (0-24 oz)
+/- 2% of measured value
3 Point linear 1 second PSIG
Ambient temperature (Tambient)
RTD 7 Vicinity of tank, upwind RTD -25 – 175ºF +/- 2 ºF 1 second ºF
Separator Oil Temperature (Tsep oil)
RTD 1 Separator oil layer RTD 0 – 200ºF +/- 2 ºF 1 second ºF
Separator Gas Temperature (Tsep gas)
RTD 2 Separator gas headspace RTD 0 – 200ºF +/- 2 ºF 1 second ºF
Separator Pressure (Psep)
PIT 1 Separator headspace Pressure transducer
0-500 psi +/- 2 psi 3 Point linear 1 second PSIG
Separator produced gas Velocity (Qsales gas)
ABB Velocity Separator gas leg TBD TBD (scfm) +/- 2% of measured value?
1 second Standard MCF per day
Separator produced gas flowrate (Qsales
gas) ABB Flow Separator gas leg TBD TBD (scfm)
+/- 2% of measured value?
1 second Standard MCF per day
Separator produced gas Temperature (Qsales gas)
ABB Temp Separator gas leg TBD TBD (scfm) +/- 2% of measured value?
1 second Fahrenheit
Separator oil flowrate to tank (Qoil)
CM Flow Separator oil leg upstream of dump valve
Coriolis meter TBD, Coriolis meters Standard?
Coriolis meters “prove” spec? +/- 2% of measured value?
1 second Barrels Per Day
Separator oil to tank density (ρoil)
CM Density Separator oil leg upstream of dump valve
Coriolis meter TBD +/- 2 ºF 1 second SGU
Separator oil to tank temperature (TCM oil)
CM RTD Separator oil leg upstream of dump valve
Coriolis meter 0 – 200ºF +/- 2 ºF 1 second Fahrenheit
Coriolis meter drive gain
CM DG Separator oil leg upstream of dump valve
Coriolis meter TBD TBD 1 second Percent

Quality Assurance Project Plan for Noble Energy, Inc. Revision 2
May 5, 2017 Pressurized Hydrocarbon Liquids Sampling & Analysis Study (DJCD-PHLAS-RFP-0002) Page 56 of 66
Parameter Datalogger ID Location Instrument Range Accuracy Calibration
Method Data Collection
FrequencyB Units
Coriolis meter left output
CM Left Separator oil leg upstream of dump valve
Coriolis meter TBD TBD 1 second Volts
Coriolis meter right output
CM Right Separator oil leg upstream of dump valve
Coriolis meter TBD TBD 1 second Volts
Coriolis meter damping
CM Damp Separator oil leg upstream of dump valve
Coriolis meter TBD TBD 1 second Seconds
Separator water flowrate to tank (Qwater)
CM W Flow Separator water leg upstream of dump valve
Coriolis meter TBD, Coriolis meters Standard?
Coriolis meters “prove” spec? +/- 2% of measured value?
1 second Barrels Per Day
Coriolis water meter drive gain
CM W DG Separator water leg upstream of dump valve
Coriolis meter TBD TBD 1 second Percent
Oil dump valve on/off position & dump time/ duration (τdump, Idump)
O Dump Po Oil dump valve Valve position indicator
0 or 1 NA NA 1 second 0,1,2,3
Separator-to-oil tank pipe gas/liquids temperature (Tdump
flow)
RTD 4
Separator-to-oil tank pipe, just prior to entering the tank on the horizontal section
Thermocouple 25 – 175ºF +/- 2ºF 1 second ºF
Separator-to-oil tank pipe gas/liquids pressure (Pdump flow)
PIT 5 Where the sep-to-oil tank pipeline comes to the surface, base of upcomer
Pressure transducer
0 – 15 psig +/- 2% of measured value
3 Point linear 1 second PSIG
Oil tank headspace gas temperature (Ttank gas)
RTD 3 In tank, at top of tank, centerline
RTD -25 – 175ºF +/- 2ºF 1 second ºF
Oil tank gas/liquids temperature (Ttank 1)
RTD 15 In tank, cernterline,152” above tank bottom
RTD -30 – 150ºF +/- 2ºF 1 second ⁰F
Oil tank gas/liquids temperature (Ttank 2)
RTD 14 In tank, centerline, 132” above tank bottom
RTD -30 – 150ºF +/- 2ºF 1 second ⁰F
Oil tank gas/liquids temperature (Ttank 3)
RTD 13 In tank, centerline, 112” above tank bottom
RTD -30 – 150ºF +/- 2ºF 1 second ⁰F
Oil tank gas/ liquids RTD 12 In tank, centerline, 92” RTD -30 – 150ºF +/- 2ºF 1 second ⁰F
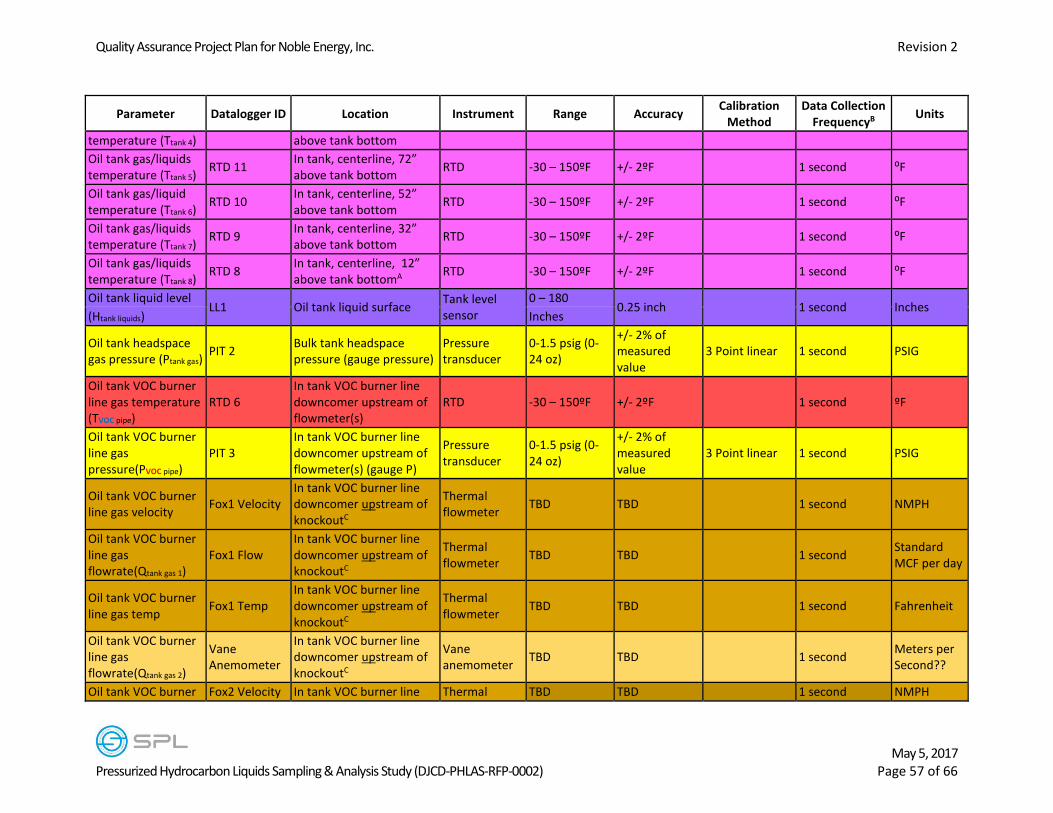
Quality Assurance Project Plan for Noble Energy, Inc. Revision 2
May 5, 2017 Pressurized Hydrocarbon Liquids Sampling & Analysis Study (DJCD-PHLAS-RFP-0002) Page 57 of 66
Parameter Datalogger ID Location Instrument Range Accuracy Calibration
Method Data Collection
FrequencyB Units
temperature (Ttank 4) above tank bottom
Oil tank gas/liquids temperature (Ttank 5)
RTD 11 In tank, centerline, 72” above tank bottom
RTD -30 – 150ºF +/- 2ºF 1 second ⁰F
Oil tank gas/liquid temperature (Ttank 6)
RTD 10 In tank, centerline, 52” above tank bottom
RTD -30 – 150ºF +/- 2ºF 1 second ⁰F
Oil tank gas/liquids temperature (Ttank 7)
RTD 9 In tank, centerline, 32” above tank bottom
RTD -30 – 150ºF +/- 2ºF 1 second ⁰F
Oil tank gas/liquids temperature (Ttank 8)
RTD 8 In tank, centerline, 12” above tank bottomA
RTD -30 – 150ºF +/- 2ºF 1 second ⁰F
Oil tank liquid level LL1 Oil tank liquid surface
Tank level sensor
0 – 180 0.25 inch 1 second Inches
(Htank liquids) Inches
Oil tank headspace gas pressure (Ptank gas)
PIT 2 Bulk tank headspace pressure (gauge pressure)
Pressure transducer
0-1.5 psig (0-24 oz)
+/- 2% of measured value
3 Point linear 1 second PSIG
Oil tank VOC burner line gas temperature (TVOC pipe)
RTD 6 In tank VOC burner line downcomer upstream of flowmeter(s)
RTD -30 – 150ºF +/- 2ºF 1 second ºF
Oil tank VOC burner line gas pressure(PVOC pipe)
PIT 3 In tank VOC burner line downcomer upstream of flowmeter(s) (gauge P)
Pressure transducer
0-1.5 psig (0-24 oz)
+/- 2% of measured value
3 Point linear 1 second PSIG
Oil tank VOC burner line gas velocity
Fox1 Velocity In tank VOC burner line downcomer upstream of knockoutC
Thermal flowmeter
TBD TBD 1 second NMPH
Oil tank VOC burner line gas flowrate(Qtank gas 1)
Fox1 Flow In tank VOC burner line downcomer upstream of knockoutC
Thermal flowmeter
TBD TBD 1 second Standard MCF per day
Oil tank VOC burner line gas temp
Fox1 Temp In tank VOC burner line downcomer upstream of knockoutC
Thermal flowmeter
TBD TBD 1 second Fahrenheit
Oil tank VOC burner line gas flowrate(Qtank gas 2)
Vane Anemometer
In tank VOC burner line downcomer upstream of knockoutC
Vane anemometer
TBD TBD 1 second Meters per Second??
Oil tank VOC burner Fox2 Velocity In tank VOC burner line Thermal TBD TBD 1 second NMPH

Quality Assurance Project Plan for Noble Energy, Inc. Revision 2
May 5, 2017 Pressurized Hydrocarbon Liquids Sampling & Analysis Study (DJCD-PHLAS-RFP-0002) Page 58 of 66
Parameter Datalogger ID Location Instrument Range Accuracy Calibration
Method Data Collection
FrequencyB Units
line gas Velocity downcomer upstream of knockoutC
flowmeter
Oil tank VOC burner line gas Flowrate(Qtank gas)
Fox2 Flow In tank VOC burner line downcomer upstream of knockoutC
Thermal flowmeter
TBD TBD 1 second Standard MCF per day
Oil tank VOC burner line gas Temp
Fox2 Temp In tank VOC burner line downcomer upstream of knockoutC
Thermal flowmeter
TBD TBD 1 second Fahrenheit
Separator Dump Temp, Just prior to coriolis meter.
RTD 5 Separator Dump leg, Just prior to coriolis meter.
RTD 0 – 200ºF +/- 2ºF 1 second ºF
Separator Dump Pressure, Just prior to coriolis meter.
PIT 6 Separator Dump leg, Just prior to coriolis meter.
Pressure transducer
0-500 psig +/- 2% of measured value
3 Point linear 1 second PSIG
Oil tank PRV vent gas flowrate(QPRV gas)
Fox3 Velocity In tank PRV vent line upstream of the PRVC
Thermal flowmeter
TBD +/- 2% of measured value
1 second NMPH
Oil tank PRV vent gas flowrate(QPRV gas)
Fox3 Flow In tank PRV vent line upstream of the PRVC
Thermal flowmeter
TBD +/- 2% of measured value
1 second Standard MCF per day
Oil tank PRV vent gas flowrate(QPRV gas)
Fox3 Temp In tank PRV vent line upstream of the PRVC
Thermal flowmeter
TBD +/- 2% of measured value
1 second Fahrenheit
Auxiliary AUX 1 Extra datalog space for additional variable
1 Second
Auxiliary AUX 2 Extra datalog space for additional variable
1 Second
Auxiliary AUX 3 Extra datalog space for additional variable
1 Second
Auxiliary AUX 4 Extra datalog space for additional variable
1 Second
Auxiliary AUX 5 Extra datalog space for additional variable
1 Second
Quality Assurance Project Plan for Noble Energy, Inc. Revision 2
May 5, 2017 Pressurized Hydrocarbon Liquids Sampling & Analysis Study (DJCD-PHLAS-RFP-0002) Page 59 of 66
B.8 Inspection and Acceptance Requirements for Supplies and Consumables
B.8.1 Standard Receipt and Validation Procedures
B.8.1.1 Analytical Calibration Standards– As new calibration standards are received by the laboratory, they are logged into a dedicated standard receipt log and assigned a unique internal identification number (however, in some cases the lot or QC number of the material may be used as the internal identification number). Information such as concentration, manufacture date, and NIST traceability are recorded in the log book. Calibration standards must be validated before placing into service to verify that the concentrations listed on the certificate accompanying the standard are correct, and that the standard is suitable for the intended use. This is accomplished by analyzing the new standard as an unknown in duplicate on an instrument that has been previously verified to be in calibration. Applicable QC criteria for the material being validated and the method being performed will be used to determine if the material is representative of what is listed on the certificate. Records of the validation procedure is maintained with the vendor certificate and any other documentation accompanying the material such as the MSD.
B.8.1.2 Laboratory Reagents and Materials - As new reagents and pure materials/solvents are received by the laboratory, they are logged into a dedicated standard receipt log and assigned a unique internal identification number. Information regarding concentration, manufacture date, NIST traceability, etc. are recorded in the log book. Documentation accompanying the material such as the MSD sheet is maintained along with the certificate provided by the material manufacturer.
B.8.1.3 Blending Feedstock – All raw materials received are logged in and assigned a unique internal identification number for future reference. Vendor or manufacturer records regarding the purity of the material must accompany the material, or the material may not be accepted. The material will be validated by GC analysis from an instrument that is calibrated to detect the component of interest and verified for purity (unless analytical capability for a given component is not available). Documentation of the validation procedure is maintained with the certificate and any other documentation accompanying the material such as the MSD.
B.9 Data Acquisition Requirements for Non-Direct Measurements
GPA Standard 2145 lists the constants and physical properties for components up
through N-Decane. GPA Technical Publication 17 (TP-17) lists the physical properties
and constants for each component of interest through Tetradecane. When components
greater than Tetradecane are identified (such as with the ASTM D2887 analysis), Yaws
Handbook of Physical Properties will be used to reference the properties and constants

Quality Assurance Project Plan for Noble Energy, Inc. Revision 2
May 5, 2017 Pressurized Hydrocarbon Liquids Sampling & Analysis Study (DJCD-PHLAS-RFP-0002) Page 60 of 66
of the normal alkane for the corresponding carbon number grouping identified in the
analysis.
B.10 Data Management
Data for this project will be produced in multiple locations. Key personnel representing
each work group identified in QAPP Table 4 will be responsible for ensuring that all
necessary records are submitted to the Project Lead, who will review and approve
results before sending to the panel.
The sampling and measurement records generated for this project will include field data
sheets (sample tags), chains of custody (COCs), and calibration/maintenance/service
records for equipment. The VP of Technical Services overseeing the sampling and
measurement procedures will review the field data sheets prior to shipping samples to
the lab, and any problems identified will be reported to the Project Lead. Field data
sheets (sample tags) and COCs will accompany the samples to the laboratory.
The laboratory login department will review field data sheets and COCs upon receipt,
and log the samples in according to the testing required. Final analytical results
generated from the laboratory will have a minimum of two levels of review before being
submitted to the Project Lead, along with the field data sheets and COCs. The Project
Lead will review all field data sheets and analytical reports to identify any suspect data
to flag and discuss with the panel if necessary. Once approved by the Project Lead, the
all data will be sent to Movilab to begin statistical uncertainty analysis.
The blending services group will generate certificates for each CRM blend that will
accompany each CRM. Each certificate will include information regarding composition
of each component in the CRM, details of the hexanes plus (C6+) lot composition,
verification records and data, and date of completion.
Upon completion of individual perturbation studies, results from each work group will
be sent to the Project Lead to review and compile a midterm report to submit to the
distribution group identified in QAPP Table 2. As the final phases of the overall PHLSA
study are completed, the same convention will be followed by submitting all data to the
Project Lead to compile the final PHLSA report.
All data and records for this project will be maintained according to SPL’s policy
regarding data retention; therefore records will be retained for seven years from the
date of submitting the final PHLSA report to Noble, unless requested to do otherwise.
All hard copy records listed in QAPP Section A.9 will be included in the data archival.

Quality Assurance Project Plan for Noble Energy, Inc. Revision 2
May 5, 2017 Pressurized Hydrocarbon Liquids Sampling & Analysis Study (DJCD-PHLAS-RFP-0002) Page 61 of 66
Electronic records (from data acquisition software, PSM/EOS data, etc.) will be able to
be retrieved electronically for review for the duration of the archival period, unless
provisions are made to retain hard copies of data in sufficient enough detail to
reconstruct the original results if necessary.
Section C – Assessment and Oversight
C.1 Assessment and Response Actions
The laboratory is subject to an annual internal performance audit. Additional audits
have not been scheduled for this project specifically, however Noble may request to
schedule an audit to be performed throughout the duration of this project.
C.2 Reports to Management
Due to the nature of this project, it is anticipated that the Project Lead will be in
frequent contact with the Noble TAP giving informal status updates throughout the
study. Upon completion of the perturbations and methods assessment, a formal
midterm report will be presented to the panel by the Project Lead per the anticipated
timeline as shown in the schedule (refer to Work Plan Section 4). This report will include
a summary of QA/QC activities, measurements, calculations, and list and discuss
deviations and exceedances. A semiannual status report is expected to be completed in
January 2016 with the final report to be completed in March 2017.
Section D – Data Validation and Usability
D.1 Data Review, Verification, and Validation
Data will be analyzed by an independent third party (Movilab) to ensure the validity of
the results and estimate the uncertainties of measured and calculated values. The
results and all intermediate steps to reach the results will be documented in a data
analysis report which the third party will supply along with any relevant calculations,
Excel worksheets, etc.
D.2 Data Verification and Validation Methods
D.2.1 Data Validation and Verification
D.2.1.1 Storage tank input and output process measurements, and mass balance calculations - To perform an accurate mass balance of a storage tank, it is imperative that all inputs, outputs, and storage in the tank be measured for both quantity and quality. The uncertainty will be estimated for each measurement based on best available

Quality Assurance Project Plan for Noble Energy, Inc. Revision 2
May 5, 2017 Pressurized Hydrocarbon Liquids Sampling & Analysis Study (DJCD-PHLAS-RFP-0002) Page 62 of 66
information. This information may come from the manufacturer, industry research, or engineering judgment of the company performing the data analyses. The mass balance will be completed on a component basis from the quantity and quality determinations. While the details associated with making these measurements are yet to be determined, the basic mass balance and related process measurement calculations are well understood.
D.2.1.2 Comparison of various pressurized HC liquids S&A procedures and modifications - Sampling and analysis methodologies will be separately compared and evaluated. Two sampling methods (constant volume and constant pressure) will be evaluated, and four analysis methods will be evaluated. A certified reference standard, with low uncertainty, will be utilized as a basis for comparison. First, four analysis methods will be tested for accuracy and repeatability. Based on the test results the “best” methodology will be identified. This method may be a modified method based on the expertise of the testing company and the results. Second, with customer agreement, the selected analysis methodology along with the GPA 2103M C10+ methodology will be utilized to evaluate several sampling methodologies. The two analysis methodologies and sampling methodologies will be utilized over the remainder of the testing.
D.2.1.3 Sensitivity of measured values to changes in S&A procedures and/or changes to separator and storage tank operation - For example, impacts of S&A modifications on pressurized HC liquids results, and impacts of instrumented well production facility process parameters on flash gas-to-oil ratio (FGOR) (i.e., experimentation and measurements sensitivity analysis). To accurately determine uncertainties and sensitivities associated with each component of the S&A procedures, data must be collected for each component. The testing as described in Section B above will allow us to independently analyze each process component and assign uncertainty and sensitivity values to each component based on the methodology implemented.
D.2.1.4 Sensitivity of process simulation software program outputs, such as FGOR, to variations in required input values (i.e., calculations and simulations sensitivity analysis) - Each software package to be tested will be analyzed over a range of values to determine the sensitivities of output values to input data. A test matrix will be developed by the independent third party and agreed upon by all parties involved. This test matrix will be based on real world data that has been collected to this point. Comparisons between software packages will be made on both calculated values and input data sensitivities.
D.2.1.5 Uncertainty of primary study parameters - including, but not limited to:
Measured FGORs -Uncertainties of the measured FGORs will be estimated based on the
measurement equipment and techniques used to obtain the information. System balance
information will also be utilized to verify the measured FGORs. All comparisons will be
made with respect to the uncertainty associated with each measured value.

Quality Assurance Project Plan for Noble Energy, Inc. Revision 2
May 5, 2017 Pressurized Hydrocarbon Liquids Sampling & Analysis Study (DJCD-PHLAS-RFP-0002) Page 63 of 66
Bubble point pressures estimated from process simulation software and a pressurized HC
liquids analysis- Bubble point pressures will be determined experimentally from the
certified reference blends. These values will be compared to calculated values to estimate
the uncertainty associated with each software package.
FGORs estimated from process simulation software and a pressurized HC liquids analysis -
Information gathered from the S&A testing will be combined with data from the FGOR
testing and the software simulation testing to determine an overall uncertainty associated
with the final tested methodology.
Maximum potential flash gas generation rates during separator dumps estimated from process simulation software and a pressurized HC liquids analysis. For example, pressurized HC liquid samples are often collected at a separator pressure less than the maximum, and a tank control system designer would like to understand the uncertainty in process simulation software estimates of flash gas generation rate at the maximum separator operating pressure and tank temperature.
Based on all of the information gathered, it will be possible to estimate (with an associated uncertainty) the maximum potential flash gas generation rates. By combining all uncertainties (in accordance with the ISO Guide to Uncertainty in Measurement), the overall uncertainty of this value will also be determined. Only once the data has been analyzed will the sensitivities of each component be understood. It appears there will be enough data collected to determine the uncertainty of the processes from experimental data. If there is not, the third party may run Monte Carlo simulations to estimate the overall uncertainty. Utilizing real data to determine uncertainties is always the preferred method for determining the overall uncertainty of a process, and Monte Carlo is meant to be utilized when that data is not present.
D.2.2 Reconciliation with Data Quality Objectives The sampling plan allows enough data to be collected to determine the uncertainty of the processes from experimental data. If extenuating circumstances prevent enough data from being collected, Movilab may run Monte Carlo simulations to estimate the overall uncertainty. Utilizing real data to determine uncertainties is always the preferred method for determining the overall uncertainty of a process, and Monte Carlo is meant to be utilized when that data is not present. Once the statistical method selection is determined, this information will be submitted to the Project Lead and the Quality Director to update the QAPP. Uncertainty reports will then be submitted to the Project Lead for review.
Upon receipt of the uncertainty results, the Project Lead will compile a midterm report containing applicable information regarding sample collection, laboratory handling and analysis results, and the uncertainty results. Midterm reports will then be submitted and/or presented to the Noble TAP for review.

Quality Assurance Project Plan for Noble Energy, Inc. Revision 2
May 5, 2017 Pressurized Hydrocarbon Liquids Sampling & Analysis Study (DJCD-PHLAS-RFP-0002) Page 64 of 66
D.3 Reconciliation with User Requirements
D.3.1 Data Validation and Usability - Data will be accepted providing the following criteria are met:
D.3.1.1 Sample collection procedures are documented on the chain of custody (COC) forms, and actual sample collection procedures match the collection procedures identified in QAPP Section B.2.
D.3.1.2 Field data sheets are complete. Refer to Work Plan Figure5 for details regarding the minimum information required for each sample obtained.
D.3.1.3 Field data and laboratory data were validated to correspond to each other to verify that the samples were not compromised in transit (this is the Initial pressure verification and bubble point verification).
D.3.1.4 Actual sample handling procedures in the laboratory correspond to the handling procedures identified in Work Plan Tables 5a and 5b. Any measurement or analytical deviations from the QAPP shall be documented in detail in either the sampling information sheet or with the analytical report. The Project Lead will review all documented deviations and flag items to discuss with the project team and/or Noble panel to determine whether to include the data for statistical evaluation or to reject and resample.

Quality Assurance Project Plan for Noble Energy, Inc. Revision 2
May 5, 2017 Pressurized Hydrocarbon Liquids Sampling & Analysis Study (DJCD-PHLAS-RFP-0002) Page 65 of 66
Appendix 1 – Summary of Updates to QAPP Revision 2
Version 1 Reference Description of Update
QAPP Reformatted entire document to reflect PHCLSA Report Format Guidelines. All updates to QAPP sections as described below reference the original section/table ID from the version 1 document.
Cover Page Date Submitted changed for QAPP revisions to reflect target date of final report.
Section A.1 Approval from Alon Mandel changed to Susan Gomez.
Section A.4 Susan Gomez responsibilities added
Section A.7 Additional clarifications made for Data Quality Indicators (DQIs) and corresponding tables
Section B.4 Updated to include descriptions for the additional analyses performed throughout PHLSA study (not included in original scope).
Section B.5 Updated to better correlate analytical QC procedures and DQOs. Updates were made to each DQO and included a description of the DQO, the applicability and limitations of the DQO, and an explanation of how each DQO is evaluated and/or represented in the QC documentation provided with the final report.
Section B.7.2 Consolidated instrument calibration requirements for ASTM. Much of the detail provided in original document is included in DQO Tables and Section B.5.
Section E.1 Placeholder for the Brief Description of Uncertainty Analysis was removed, as this will be provided in final PHLSA report.
Table 3 – QAPP Distribution and Contact List
Susan Gomez contact information added.
Table 4 – Results and Reporting Distribution List
Removed Alon Mandel, added Susan Gomez.
Table 6 – Applicable Concentration Ranges for GPA 2177 and GPA 2261 Precision
Moved from Section A.7.2 to Section B.5 to better correlate with Data Quality Objectives (DQOs) and quality control procedures. Now table 13.
Tables 7–12 – DQOs for Methods
Moved from Section A.7.2 to Section B.5 to maintain correlation with Data Quality Objectives (DQOs) and quality control procedures. Reformatted and provided additional clarifications/information. Now tables 14-24 (includes DQOs for additional analyses not included in original scope).
Table 13 - Bernhardt Instrumentation List and Specifications
Moved from Section A.7.2 to Section B.7 to maintain correlation with Data Quality Objectives (DQOs) and quality control procedures. Reformatted and provided additional clarifications/information. Now table 25.

Quality Assurance Project Plan for Noble Energy, Inc. Revision 2
May 5, 2017 Pressurized Hydrocarbon Liquids Sampling & Analysis Study (DJCD-PHLAS-RFP-0002) Page 66 of 66
Table 14 – List of Sampling Methods
Now table 8.
Table 15 – Number of Purge Cycles for PF&E Method
Now table 9.
Table 16 – Spot Sample Minimum Requirements
Now table 10.
Table 17 – List of Analytical Methods
Updated to include additional analyses performed throughout PHLSA study (not included in original scope). Now table 11.
Tables 18-21 - Scopes for Methods
Merged tables for GPA 2103, GPA 2177, and GPA 2186 into a single table Now table 12.
New table added Data Quality Indicators for GC Test Methods (table 6).
New table added Data Quality Indicators for ASTM Test Methods (table 7).