HIGH RECOVERY DESALINATION IN DEVELOPING ... RECOVERY DESALINATION IN DEVELOPING COUNTRIES Malynda...
16
HIGH RECOVERY DESALINATION IN DEVELOPING COUNTRIES Malynda Cappelle, UTEP Center for Inland Desalination Systems 500 W University Ave/Kelly 208/El Paso, TX 79902 Email: [email protected] Phone: 915-747-8953 Thomas A. Davis, UTEP Center for Inland Desalination Systems, El Paso, Texas W. Shane Walker, UTEP Civil Engineering Department, El Paso, Texas Abstract Fresh water scarcity is a global problem. Rivers, aquifers, and other fresh water resources are becoming more strained because of population increases, climate change, and overallocation. According to the U.S. Agency for International Development (USAID), global water demand is expected to increase by 55% by 2050, and much of this increase is related to food production. The USAID and the Bureau of Reclamation, in partnership with the Swedish International Development Cooperation Agency and the Ministry of Foreign Affairs of the Kingdom of The Netherlands, sponsored the Desal Prize in April 2015. This competition was designed to spur innovation in efficient desalination technology development for small, rural farmers in developing countries. The University of Texas at El Paso (UTEP) was one of five finalists to compete. Teams were required to produce 250 liters of drinking water with less than 600 mg/L total dissolved solids (TDS) and 8000 liters of irrigation water with no more than 550 mg/L TDS with appropriate calcium, magnesium, and sodium concentrations suitable for crop irrigation. The desalination systems were powered completely by renewable energy. UTEP’s process is a PV-powered hybrid membrane process called Zero Discharge Desalination (ZDD). ZDD can achieve greater than 95% recovery and is able to recover (1) a solid byproduct (mostly gypsum) which can be used to improve soil conditions and (2) a liquid stream (mostly NaCl) which is used in the EDM process. This paper describes the ZDD design process and optimization, as well as plans for pilot testing in Honduras in 2016. Background Water scarcity is an issue for people, the global economy, and the environment. According to the UN, groundwater is the sole source of water for an estimated 2.5 billion people globally. Seven hundred million people experience water scarcity; this figure is estimated to increase to 1.8 billion by the year 2025 (United Nations, 2013). These figures include physical (lack of available usable water) and economic water scarcity (lack of adequate and affordable treatment systems, storage, distribution, access of usable water). Compounding this problem is the need for water from the agriculture sectors around the world. Globally, about 70% of the world’s fresh water is used for agriculture (United Nations, 2015). Using data from The World Bank for freshwater withdrawals (includes desalination) and GDP, some interesting observations can be made. First, if all countries’ data are graphed (Figure 1), there is a fair amount of scatter. In general, increasing water withdrawals are associated with increased GDP, but the correlation is weak (R 2 =0.45). If the same dataset is graphed by
Transcript of HIGH RECOVERY DESALINATION IN DEVELOPING ... RECOVERY DESALINATION IN DEVELOPING COUNTRIES Malynda...
HIGH RECOVERY DESALINATION IN DEVELOPING COUNTRIES
Malynda Cappelle, UTEP Center for Inland Desalination Systems
500 W University Ave/Kelly 208/El Paso, TX 79902
Email: [email protected] Phone: 915-747-8953
Thomas A. Davis, UTEP Center for Inland Desalination Systems, El Paso, Texas
W. Shane Walker, UTEP Civil Engineering Department, El Paso, Texas
Abstract
Fresh water scarcity is a global problem. Rivers, aquifers, and other fresh water resources are
becoming more strained because of population increases, climate change, and overallocation.
According to the U.S. Agency for International Development (USAID), global water demand is
expected to increase by 55% by 2050, and much of this increase is related to food production.
The USAID and the Bureau of Reclamation, in partnership with the Swedish International
Development Cooperation Agency and the Ministry of Foreign Affairs of the Kingdom of The
Netherlands, sponsored the Desal Prize in April 2015. This competition was designed to spur
innovation in efficient desalination technology development for small, rural farmers in
developing countries. The University of Texas at El Paso (UTEP) was one of five finalists to
compete. Teams were required to produce 250 liters of drinking water with less than 600 mg/L
total dissolved solids (TDS) and 8000 liters of irrigation water with no more than 550 mg/L TDS
with appropriate calcium, magnesium, and sodium concentrations suitable for crop irrigation.
The desalination systems were powered completely by renewable energy.
UTEP’s process is a PV-powered hybrid membrane process called Zero Discharge Desalination
(ZDD). ZDD can achieve greater than 95% recovery and is able to recover (1) a solid byproduct
(mostly gypsum) which can be used to improve soil conditions and (2) a liquid stream (mostly
NaCl) which is used in the EDM process. This paper describes the ZDD design process and
optimization, as well as plans for pilot testing in Honduras in 2016.
Background
Water scarcity is an issue for people, the global economy, and the environment. According to the
UN, groundwater is the sole source of water for an estimated 2.5 billion people globally. Seven
hundred million people experience water scarcity; this figure is estimated to increase to
1.8 billion by the year 2025 (United Nations, 2013). These figures include physical (lack of
available usable water) and economic water scarcity (lack of adequate and affordable treatment
systems, storage, distribution, access of usable water). Compounding this problem is the need for
water from the agriculture sectors around the world. Globally, about 70% of the world’s fresh
water is used for agriculture (United Nations, 2015).
Using data from The World Bank for freshwater withdrawals (includes desalination) and GDP,
some interesting observations can be made. First, if all countries’ data are graphed (Figure 1),
there is a fair amount of scatter. In general, increasing water withdrawals are associated with
increased GDP, but the correlation is weak (R2=0.45). If the same dataset is graphed by

geographic location and income levels (Figure 2), the correlation between freshwater extraction
and GDP is more apparent (R2=0.58). In general, as more freshwater is extracted, GDP increases.
The UN estimates that 850 million people in rural communities lack access to reliable irrigation
water for agriculture, their primary source of income (United Nations, 2015).
Honduras is a striking example of a country with a potential for growth with more sustainable
water resources. In part of the country, they have lost 70% of their crops due to drought. In other
parts, farmers’ wells have gone brackish and the water is unusable without severe losses in crop
yield. Desalination would be able to supplement or replace a portion of the water supply in many
cities and regions, but conventional approaches like reverse osmosis are usually limited to 75-
85% recovery. Sustainable concentrate management is key to the implementation of desalination
in inland areas. ZDD offers up to a 33% improvement in recovery compared to conventional
approaches and is able to provide useful byproducts instead of a liquid waste stream.
Figure 1. Global water extractions and economy (by country)
Sources: The World Bank, 2015a and 2015b

Figure 2. Global water extractions and economy (by category)1
Sources: The World Bank, 2015a and 2015b
Remote Desalination with Renewable Energy
Desalination can be grouped into two categories: phase change (thermal desalination) and
processes that utilize membranes. Thermal desalination processes include multi-stage flash
(MSF), multiple effect distillation (MED), vapor compression (VC), freezing,
humidification/dehumidification and solar stills (Charcosset, 2009). Membrane desalination
systems include reverse osmosis (and nanofiltration), electrodialysis (ED), and membrane
distillation. Of all desalination systems powered by renewable energy, reverse osmosis accounts
for the vast majority (62%), followed by MED (14%), MSF (10%), VC (5%), ED (5%), and
others (4%) (Ghaffour et al., 2015). Ghaffour also summarized the distribution of installed
capacity with respect to specific combinations of renewable energy and desalination, as shown in
Table 1.
1 OECD stands for Organisation for Economic Co-operation and Development

Table 1. Distribution of renewable energy desalination by source
Source: Modified from Ghaffour et al., 2015
Renewable Energy Source Desalination Type Installed Capacity (%)
Photovoltaic Reverse Osmosis 32
Wind Reverse Osmosis 19
Solar Thermal MED 13
Photovoltaic Electrodialysis 6
Solar Thermal MSF 6
Wind Vapor Compression 5
Others 19
Tradeoffs & Cost Comparison
In general, thermal desalination processes require substantially more energy than membrane
processes, but pairing renewable energy sources may allow for more implementation. Thermal
processes may be more forgiving in terms of biological fouling and scale formation. Membrane
processes typically offer higher recovery, but are typically more susceptible to fouling and
scaling.
The cost of desalination is related to many factors, some of which are in competition with one
another – especially when considering remote, inland, arid locations. The salinity, pre-treatment
requirements, temperature, and recovery (product water/feed water) will impact the cost of the
desalination system and will impact the size (and type) of the renewable energy system (Table
2).
Table 2. Cost tradeoffs in desalination design
Capital Cost Operating Cost
↑Salinity ↑ Cost ↑Salinity ↑ Energy Cost
↑Pre-treatment ↑ Cost ↑Temperature ↓ Energy Cost
↑Recovery ↑ Cost ↑Pre-treatment ↑ Chemical Cost
↑Energy Intensity ↑ Cost ↑Recovery ↑ Energy Cost
↑Post-treatment ↑ Cost ↑Post-treatment ↑ Chemical Cost
↑Product Water Quality (↓TDS) ↑Cost ↑Salt Recovery ↓ Operating Cost
(potentially)
Many researchers have evaluated desalination systems that utilize renewable energy, and good
summaries are provided by Ghaffour et al. (2015) and Charcosset (2009). Again, many factors
affect the cost of desalination systems, but some general trends are observed when comparing
systems, as shown in Figure 3. The thermal approaches appear to have a lower cost per unit of
product water ($/m3); however, they generally have very low flux (≤ 5-10 LMH) and low
recovery (<40%). Many of the sites where pilot testing has occurred, or where renewable/remote
desalination systems have been installed, intentionally target low recovery so that the concentrate
can be used for other non-potable purposes such as toilet flushing, showering, and feed stock
(Werner & Schafer, 2007) or can be disposed of with less environmental impact. One must
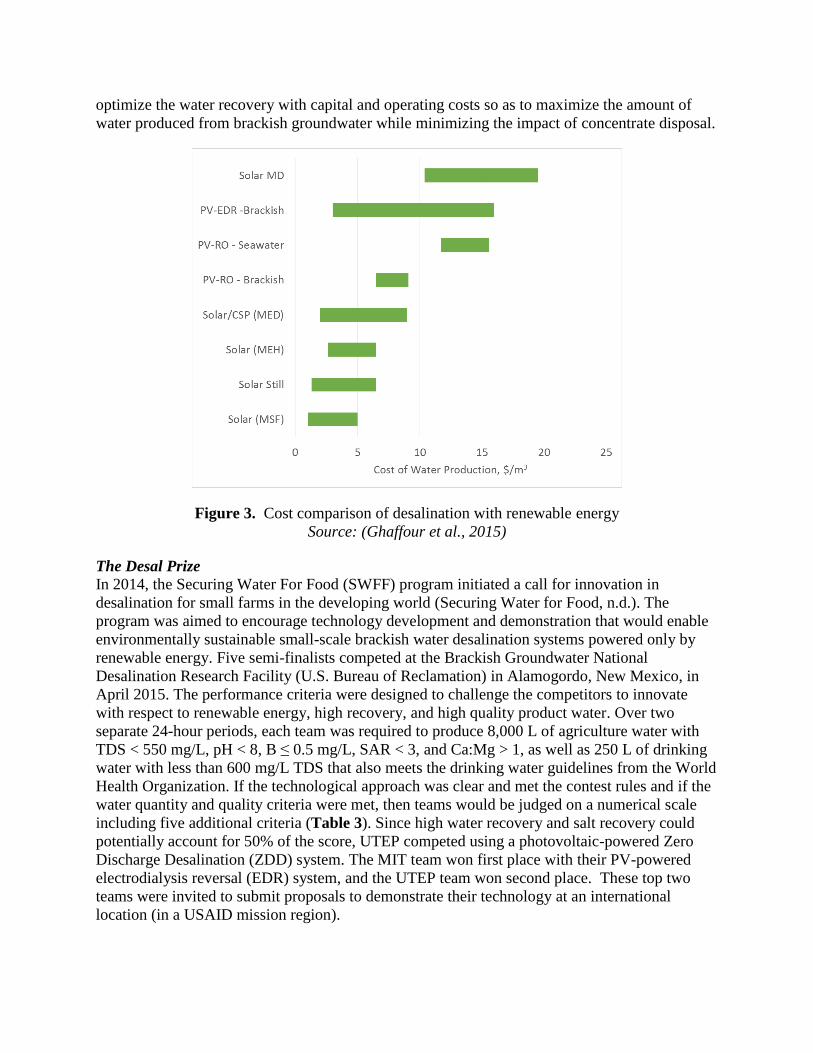
optimize the water recovery with capital and operating costs so as to maximize the amount of
water produced from brackish groundwater while minimizing the impact of concentrate disposal.
Figure 3. Cost comparison of desalination with renewable energy
Source: (Ghaffour et al., 2015)
The Desal Prize
In 2014, the Securing Water For Food (SWFF) program initiated a call for innovation in
desalination for small farms in the developing world (Securing Water for Food, n.d.). The
program was aimed to encourage technology development and demonstration that would enable
environmentally sustainable small-scale brackish water desalination systems powered only by
renewable energy. Five semi-finalists competed at the Brackish Groundwater National
Desalination Research Facility (U.S. Bureau of Reclamation) in Alamogordo, New Mexico, in
April 2015. The performance criteria were designed to challenge the competitors to innovate
with respect to renewable energy, high recovery, and high quality product water. Over two
separate 24-hour periods, each team was required to produce 8,000 L of agriculture water with
TDS < 550 mg/L, pH < 8, B ≤ 0.5 mg/L, SAR < 3, and Ca:Mg > 1, as well as 250 L of drinking
water with less than 600 mg/L TDS that also meets the drinking water guidelines from the World
Health Organization. If the technological approach was clear and met the contest rules and if the
water quantity and quality criteria were met, then teams would be judged on a numerical scale
including five additional criteria (Table 3). Since high water recovery and salt recovery could
potentially account for 50% of the score, UTEP competed using a photovoltaic-powered Zero
Discharge Desalination (ZDD) system. The MIT team won first place with their PV-powered
electrodialysis reversal (EDR) system, and the UTEP team won second place. These top two
teams were invited to submit proposals to demonstrate their technology at an international
location (in a USAID mission region).

Table 3. Judging Criteria for 2015 USAID Desal Prize Competition
Performance Criteria Scale Weight
Technological Approach Yes/No --
Water Quantity & Water Quality Yes/No --
Powered Solely by Renewable Energy Yes/No --
System Water Recovery 1-4 30%
Chemical Treatment 1-4 15%
Concentrate Minimization/Concentrate Disposal Process 1-4 20%
Durability, Reliability, and Practicality 1-4 15%
Life Cycle Cost Analysis 1-4 20%
Planned Pilot: Honduras
The UTEP team has partnered with a Honduran university, Universidad Politécnica de
Ingenierías (UPi), the national water service of Honduras, Servicio Autonomo Nacional de
Acueductos y Alcantarillados (SANAA), and an American company, JCI Industries, to
demonstrate ZDD in Honduras. UPi is a relatively new private university that specializes in
engineering and environmental sciences. They will assist with training activities. SANAA has
assisted UTEP in locating potential pilot sites and providing preliminary water quality analysis.
JCI Industries supplies and services water & wastewater equipment for both the industrial and
municipal markets.
Piloting activities are expected to begin in early 2016 in the region of Valle, Honduras
(southwest of Tegucigalpa) or another site. SANAA, in coordination with the other national
partnering agencies, has identified three potential brackish water well sites in Valle and another
potential site in Tegucigalpa. All brackish water wells are located on 3-5 acre farms of plantains
and watermelons in the in Ojustal Costa de Amates in the County of Alianza in the Department
of Valle in southern Honduras. These wells are active, but their brackish condition limits the
usage of their water. The pilot demonstration will last at least one month and will involve
transferring knowledge and technology to farmers and regional trainers (professors, agricultural
extension agents, etc.). Local and regional suppliers will be identified for equipment and
consumables necessary for the pilot and future installations. A suitable concentrate management
strategy, with possible salt recovery, will also be investigated. The proposed work will address
the following issues requested by USAID:
Simplification of the operational process to include control set points through
automation
Development of an enhanced evaporative process for reduction of concentrate volume
and recovery of salts
Demonstrate the recycle of NaCl recovered from the concentrate as feed in the
process (i.e., closing the NaCl loop)
Market study to assess and target the unit costs and plan to reduce cost to achieve
market access in Honduras
Detailed description of plans to work with local agriculture extension agents to
provide farmer education and outreach

State of drought in Honduras
Valle is located in one of the most arid areas in Honduras. The Vice President of the Honduran
Association of Farmers (ASOHAGRI), stated that in 2014, the farmers in Valle and Choluteca
(east of Valle) lost approximately 70% of their crops as a result of the drought. Average rainfall
decreases towards the south and west in Honduras. The average annual precipitation is 29.6
inches (75 cm), and Figure 4 shows the average monthly rainfall for Valle (World Weather
Online, n.d.).
Figure 4. Average monthly rainfall in Valle, Honduras
The drought conditions in Valle result in critical impacts on water availability for human
consumption and especially for crop irrigation. The impact on agriculture by the yearly droughts
in southern Honduras, especially in Valle, Choluteca and El Paraiso has implications ranging
from the reduction of cultivated areas and the consequent drop in production, resulting in
unemployment. The multiplier effect from this condition means serious economic, social and
environmental consequences for the citizens of these regions. The environmental consequences
caused by the drought can be seen in the transformation of the landscape by the abandonment of
farmland resulting in additional arid territory.
The chief of the Ministry of Agriculture and Livestock (SAG), has stated that measures need to
be implemented to ensure food security and a steady income for families in the region. However,
the erratic and low rainfall in the south of Honduras makes this mandate difficult.
According to a 2013 USAID report (USAID, 2013), fish and shellfish, which are harvested from
the Gulf of Fonseca, are important ecosystem products that support livelihoods in Honduras.
Additionally maize and beans, which are grown on small-scale subsistence farms, are the
“foundation for food security in the area” and depend on the reduction of soil erosion and
maintaining soil fertility. Sugar, melons, and shrimp generate a “very important fraction of the
employment and all income that drives the economy of the region.” Reliable fresh water is

necessary for this to occur. “All current livelihoods (subsistence to agro-industrial) are sensitive
to changes in ecosystem products and services and will need to adapt to potential climate-driven
changes.”
Equipment Description
ZDD has been described in other papers and sources (Cappelle, et al., 2015), (Cappelle & Davis,
2016 (in press)) and is briefly summarized here. As illustrated in Figure 5, brackish water is fed
to the primary desalter, which will be fitted with reverse osmosis (RO) and/or nanofiltration (NF)
membranes. A small portion of the permeate will be sent to a second NF to produce high quality
process water needed for salt solution preparation, stream dilutions, and system shutdown
flushes. The concentrate from both the primary RO/NF and process NF will be sent to an
electrodialysis metathesis (EDM) system where approximately 50% of the ions will be removed,
and the treated stream from the EDM (diluate) will be fed back to the original NF for additional
water recovery. The only chemical feed for the EDM is salt (NaCl). Cations in the NF
concentrate will combine with the Cl- from NaCl to form a highly soluble mixture in a highly
concentrated waste stream called mixed chloride. Anions in the NF concentrate will combine
with Na+ from the NaCl to form a highly soluble mixture in a highly concentrated waste stream
called mixed sodium. These waste streams, one which in calcium and the other rich in sulfate,
can be combined to precipitate calcium and magnesium salts (mostly gypsum and calcium
carbonate) that can be used to improve irrigation water quality. The supernatant liquid will
mostly contain NaCl, which can be recycled as feed for the EDM. The estimated hydraulic
recovery of the entire treatment system is 93-95%.
Figure 5. Process flow schematic for proposed ZDD system in Honduras
Design Optimization
The irrigation water quality objectives for The Desal Prize are required for the pilot
demonstration and will dictate the maximum recovery achievable by the ZDD system. These
standards were designed to provide minimal impact on water infiltration and crop yield. Several
sources provide guidance for irrigation water and salinity management (Grattan, 2002; Ayers &
Westcot, 1994; Fipps, 2003; Yadav & Massoud, 1988). Water quality parameters and their
effects on agriculture include:
Salinity: each plant has a different tolerance for water salinity. Some can be irrigated for
a short period of time with saline water, however, salts will build up in the soil and will
need to be flushed.
Sodium content: a high concentration of sodium relative to calcium and magnesium
(calculated using the sodium adsorption ratio, or SAR2) will lead to reduced infiltration.
Toxicity of certain constituents: boron, selenium, and chloride can cause severe damage
to crops and recommended limits should be implemented for the best yield. Some heavy
metals, like arsenic, can be taken up by crops (e.g., rice) and could present health
concerns for those eating them.
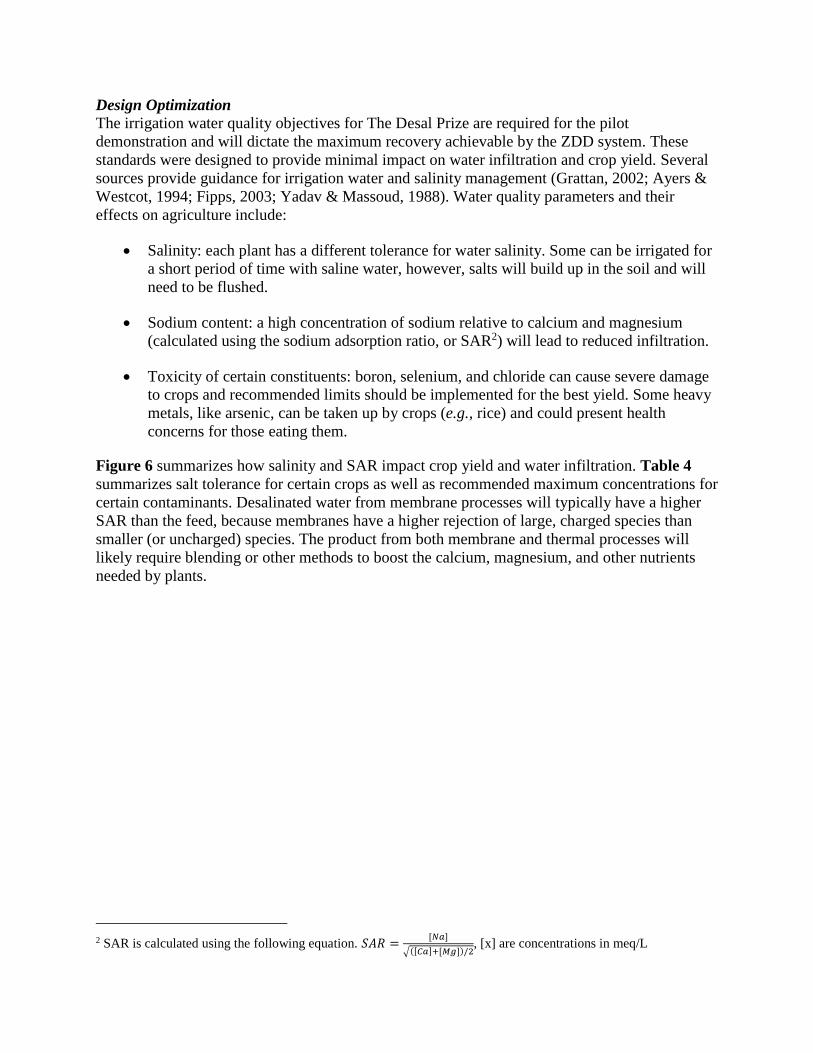
Figure 6 summarizes how salinity and SAR impact crop yield and water infiltration. Table 4
summarizes salt tolerance for certain crops as well as recommended maximum concentrations for
certain contaminants. Desalinated water from membrane processes will typically have a higher
SAR than the feed, because membranes have a higher rejection of large, charged species than
smaller (or uncharged) species. The product from both membrane and thermal processes will
likely require blending or other methods to boost the calcium, magnesium, and other nutrients
needed by plants.
2 SAR is calculated using the following equation. 𝑆𝐴𝑅 =
[𝑁𝑎]
√([𝐶𝑎]+[𝑀𝑔])/2, [x] are concentrations in meq/L

Figure 6. Effects of conductivity and SAR on (a) crop yield and (b) infiltration rate
Sources: Dow ROSA and GE Winflows RO design programs; water quality guidelines from
Ayers & Westcot, 1994
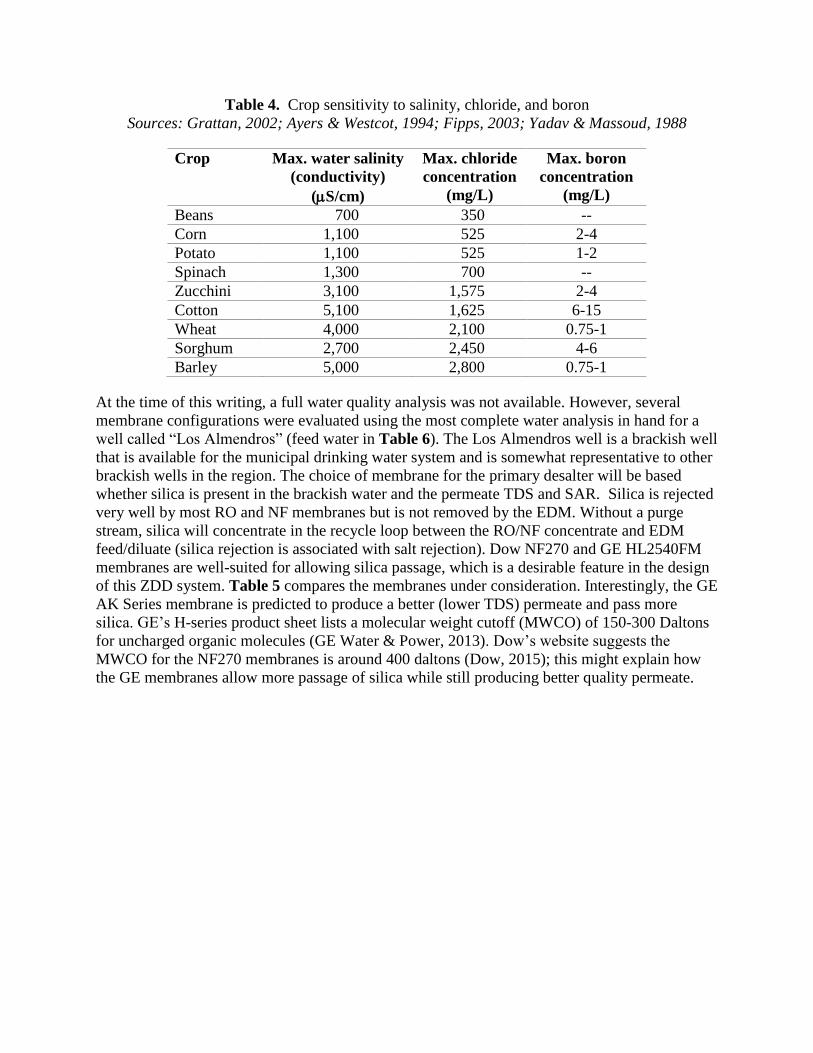
Table 4. Crop sensitivity to salinity, chloride, and boron
Sources: Grattan, 2002; Ayers & Westcot, 1994; Fipps, 2003; Yadav & Massoud, 1988
Crop Max. water salinity
(conductivity)
(S/cm)
Max. chloride
concentration
(mg/L)
Max. boron
concentration
(mg/L)
Beans 700 350 --
Corn 1,100 525 2-4
Potato 1,100 525 1-2
Spinach 1,300 700 --
Zucchini 3,100 1,575 2-4
Cotton 5,100 1,625 6-15
Wheat 4,000 2,100 0.75-1
Sorghum 2,700 2,450 4-6
Barley 5,000 2,800 0.75-1
At the time of this writing, a full water quality analysis was not available. However, several
membrane configurations were evaluated using the most complete water analysis in hand for a
well called “Los Almendros” (feed water in Table 6). The Los Almendros well is a brackish well
that is available for the municipal drinking water system and is somewhat representative to other
brackish wells in the region. The choice of membrane for the primary desalter will be based
whether silica is present in the brackish water and the permeate TDS and SAR. Silica is rejected
very well by most RO and NF membranes but is not removed by the EDM. Without a purge
stream, silica will concentrate in the recycle loop between the RO/NF concentrate and EDM
feed/diluate (silica rejection is associated with salt rejection). Dow NF270 and GE HL2540FM
membranes are well-suited for allowing silica passage, which is a desirable feature in the design
of this ZDD system. Table 5 compares the membranes under consideration. Interestingly, the GE
AK Series membrane is predicted to produce a better (lower TDS) permeate and pass more
silica. GE’s H-series product sheet lists a molecular weight cutoff (MWCO) of 150-300 Daltons
for uncharged organic molecules (GE Water & Power, 2013). Dow’s website suggests the
MWCO for the NF270 membranes is around 400 daltons (Dow, 2015); this might explain how
the GE membranes allow more passage of silica while still producing better quality permeate.

Table 5. Comparison of select 2.5-inch membranes for primary RO/NF design
Source: Product sheets found on GE and Dow websites (GE, n.d.) (Dow, n.d.)
Membrane Dow
XLE
Dow
NF90
Dow
NF270
GE
AK Series
GE
HL Series
Salt Rejection >99% >97% >97% >96% (99%
average)
>95% (98%
average)
Challenge Salt 200 ppm
NaCl
2,000 ppm
MgSO4
2000 ppm
MgSO4
500 ppm
NaCl
2000 ppm
MgSO4
Active area (ft2) 28 28 28 27 27
Permeate Flow (gpd) 850 700 850 710 780
Max Pressure (psi) 600 600 600 400 450
Max Pressure Drop
(psi)
13 13 12 12
A combination of low-pressure RO and lower salt rejection membranes will likely produce the
best quality permeate while also allowing enough silica to pass through into the RO permeate to
minimize the volume of purge water needed to prevent silica scale formation (with antiscalant
addition). A spreadsheet model was used to evaluate the ZDD system with different RO/NF
membrane combinations. This model is able to estimate the steady state silica for each design.
Table 6 summarizes the predicted RO/NF process stream compositions at steady state. The GE
membranes produce permeate with a higher SAR and lower Ca:Mg ratio. This can be improved
with the recovered CaSO4 product from the EDM concentrate streams and still meet the required
TDS limit.
Table 6. Comparison of product water quality from select RO membranes
Brackish
Feed (Los
Almendros) XLE/NF270 GE AK/HL
GE AK/HL +
150 mg/L
CaSO4
pH 7.6 7.1 7.1 7.1
TDS 3064 543 362 512
SAR 2.8 2.0 3.8 2.4
Ca:Mg 2.0 1.2 0.4 1.0
Na 276.0 76.0 76.6 76.6
Mg 144.0 16.3 4.3 4.3
Ca 480.0 79.9 23.4 67.4
HCO3 383.8 84.3 85.7 85.7
NO3 2.56 1.63 1.11 1.11
Cl 712 243 112 112
SO4 1032.0 20.4 30.5 136.1
SiO2 30.0 20.9 28.9 28.9
Feed P (psi) 93 98
Recovery (%) 94 98
Concentrate SiO2 125 80

As described earlier, solid calcium salts will be recovered from the EDM concentrate streams.
This solid can be added to the water or soil, depending on the actual type of calcium present
(Fipps, 2003). If the byproduct has too much calcium carbonate, it will be added directly to the
soil as an amendment. If it is mostly (or contains enough) calcium sulfate, it can be added to the
water.
Photovoltaic System
The photovoltaic (PV) system used for the Desal Prize competition (Figure 7) was designed for
maximum reliability and performance. Since the competition required discharging batteries to
50% charge and April weather can be variable, a large capacity system was designed. The PV
system comprised: (a) a 10.3 kWp array (42 Canadian Solar 255 Watt panels), (b) a 4 kWp
inverter (Shneider Electric Conext 4024), (c) four charge controllers (Xantrex XW MPPT), and
(d) a 24-VDC battery system (40 Trojan L16H 6 V batteries, each with a capacity of 435 AH for
20 hrs, for a total of 104 kWh). The average electrical load of the entire desalination process
during the April 2015 competition was approximately 3.1 kW. The desalination container to be
transported to Honduras will have a different load depending on the actual flowrate and salinity.
The optimized design minimizes the size of the RO/NF pump, shifts as much equipment from
AC to DC power (saves energy by eliminating need for inversion), and reduces redundant pumps
and other systems. However, the batteries will now be installed inside the equipment trailer,
which will require venting, and minimal cooling is necessary for long term operation.
Figure 7. Photovoltaic system with (a) solar panels, (b) batteries, (c) power inverter, and (d)
charge controllers

Conclusions
ZDD is a commercially viable process that has been evaluated in Texas, New Mexico, Colorado,
California, and Florida. ZDD is a hybrid process which uses reverse osmosis or nanofiltration as
the primary desalter for the production of drinking and irrigation water. The concentrate from the
primary desalter is sent to a process called electrodialysis metathesis or EDM, which acts as a
kidney by removing troublesome salts. The EDM’s product is returned to the primary desalter
for recovery of additional water. Useful byproducts can be recovered from the EDM waste
streams, namely gypsum (which can improve soil quality) and NaCl (which is needed in the
EDM). The waste management strategy employs low cost collection, mixing, and concentration
techniques and is expected to achieve at least 94% water recovery with zero liquid discharge.
The primary goal with the planned pilot is to transfer what has been learned in research projects
into processes to purify water for farmers around the world. With funding from USAID and other
sources, we are planning a pilot demonstration in Honduras in early 2016. We are partnering
with UPI, a university in the capital city, Tegucigalpa, for this endeavor. The pilot will
demonstrate our full concept of ZDD for rural applications, including the potential for salt
recovery. The system will be powered entirely by the sun.
Acknowledgments
This paper is made possible by the generous support of the American people through the United
States Agency for International Development (USAID). The contents are the responsibility of the
authors and do not necessarily reflect the views of USAID or the United States Government.
References Ayers, R., & Westcot, D. (1994). Water quality for agriculture, FAO irrigation and drainage
paper (29 Rev. 1). Retrieved 11 29, 2015, from
http://www.fao.org/DOCReP/003/T0234e/T0234e00.htm
Cappelle, M., & Davis, T. (2016 (in press)). Ion Exchange Membranes for Water Softening and
High-Recovery Desalination. In R. Singh, & N. Hankins (Eds.), Emerging Membrane
Technology for Sustainable Water Treatment, 1st Edition. Elsevier Science.
Cappelle, M., Alspach, B., Gilron, J., Russell, C., Davis, T., Asaf, N., & Trejo, G. (2015). High
recovery desalination with enhanced evaporation: Achieving zero liquid discharge sustainably.
Orlando, FL: AMTA.
Charcosset, C. (2009). A review of membrane processes and renewable energies for desalination.
245, 214-231.
Dow. (2015, 9 23). FILMTEC Membranes - Nanofiltration - MWCO. Retrieved 11 29, 2015,
from Dow Answer Center: http://dowac.custhelp.com/app/answers/detail/a_id/4925
Dow. (n.d.). Products. Retrieved from http://www.dow.com/en-us/water-and-process-
solutions/products#q=%20
Fipps, G. (2003). Irrigation water quality standards and salinity management strategies.
Retrieved 11 29, 2015, from http://soiltesting.tamu.edu/publications/B-1667.pdf
GE. (n.d.). Spiral Wound Membranes. Retrieved from http://www.gewater.com/products/spiral-
wound-membranes.html
GE Power & Water. (2015). AK Series Low Energy Brackish Water RO Elements. Retrieved 11
29, 2015, from
https://www.gewater.com/kcpguest/salesedge/documents/Fact%20Sheets_Cust/Americas/Englis
h/FS1263EN.pdf
GE Water & Power. (2013). HL Series water softening NF elements. Retrieved 11 29, 2015,
from
https://www.espwaterproducts.com/content/GE_HL_Series_Nanofiltration_Membrane_Spec_Sh
eet.pdf
Ghaffour, N., Bundschuh, J., Mahmoudi, H., & Goosen, M. (2015). Renewable energy-driven
desalination technologies: A comprehensive review on challenges and potential applications of
integrated systems. 356, 94-114.
Grattan, S. (2002). Irrigation Water Salinity and Crop production. Retrieved 11 29, 2015, from
http://www.nrcs.usda.gov/Internet/FSE_DOCUMENTS/nrcs143_010748.pdf
Securing Water for Food. (n.d.). The Desal Prize. Retrieved 11 29, 2015, from
http://www.securingwaterforfood.org/the-desal-prize/

The World Bank. (2015a, 11 12). World Bank Open Data. Retrieved 11 29, 2015, from GDP
(current US$): http://data.worldbank.org/indicator/NY.GDP.MKTP.CD/
The World Bank. (2015b, 11 12). World Bank Open Data. Retrieved 11 29, 2015, from Annual
freshwater withdrawals, total (billion cubic meters):
http://data.worldbank.org/indicator/ER.H2O.FWTL.K3
United Nations. (2013). Water Scarcity Factsheet. Retrieved 11 29, 2015
United Nations. (2015). The UN World Water Development Report 2015, Water for a sustainable
world. UNESCO. Retrieved from http://www.unesco.org/new/en/natural-
sciences/environment/water/wwap/wwdr/2015-water-for-a-sustainable-world/
USAID. (2013). Vulnerability and resilience to climate change in southern Honduras. USAID.
Retrieved from
http://community.eldis.org/.5b9bfce3/Southern%20Honduras%20Vulnerability%20Assessment
%20Report_CLEARED.pdf
Werner, M., & Schafer, A. (2007). Social aspects of a solar-powered desalination unit for remote
Australian communities. 203, 375-393.
World Weather Online. (n.d.). Valle Monthly Climate Average (2000-2012), Honduras.
Retrieved 11 29, 2015, from http://www.worldweatheronline.com/Valle-weather-averages/Santa-
Barbara/HN.aspx
Yadav, J., & Massoud, F. (1988). Salt-Affected Soils and their Management. Food and
Agriculture Organization. Retrieved 11 29, 2015, from
http://www.fao.org/docrep/x5871e/x5871e00.htm#Contents