zerobrine.eu · ZERO BRINE – Industrial Desalination – Resource Recovery – Circular Economy...
145
D6.1 Wastewater and solution provider knowledge models, correlations and interlinks May 2018 Ref. Ares(2018)3922914 - 24/07/2018
Transcript of zerobrine.eu · ZERO BRINE – Industrial Desalination – Resource Recovery – Circular Economy...
D6.1 Wastewater and solution provider knowledge models, correlations and interlinks
May 2018
Ref. Ares(2018)3922914 - 24/07/2018

ZERO BRINE – Industrial Desalination – Resource Recovery – Circular Economy
ZERO BRINE – Industrial Desalination – Resource Recovery – Circular Economy
Deliverable 6.1 Wastewater and solution provider knowledge models, correlations and
interlinks
Related Work Package WP6 – Online Brine Platform – Application of the software for the case of the Netherlands
Deliverable lead NTUA
Authors Eva Skourtanioti (NTUA), Despina Bakogianni (NTUA)
Reviewer Frans van den Akker (ISPT)
Contact(s) [email protected] , [email protected] , [email protected]
Grant Agreement Number 730390
Funding body(ies) European Union’s Horizon 2020 Framework Program
Start date 1-June-2017
Project duration 48 months
Type of Delivery (R, DEM, DEC, Other)1 R = Report
Dissemination Level (PU, CO, Cl)2 PU = Public
Date last update 06 July 2018
Approved by Frans van den Akker (ISPT)
Website www.zerobrine.eu
History of changes
Date Description / Change Authors
0.1 2 May 2018 First draft Eva Skourtanioti, Despina
Bakogianni
0.2 14 May 2018 Reviewing Frans van den Akker
1 31 May 2018 Final version Eva Skourtanioti, Despina
Bakogianni
2 6 July 2018
Revision of final version (revision took place due to a format problem when the
deliverable was uploaded to the Participants Portal)
Eva Skourtanioti, Despina Bakogianni
1 R=Document, report; DEM=Demonstrator, pilot, prototype; DEC=website, patent fillings, videos, etc.; OTHER=other
2 PU=Public, CO=Confidential, only for members of the consortium (including the Commission Services), CI=Classified

ZERO BRINE – Industrial Desalination – Resource Recovery – Circular Economy

ZERO BRINE – Industrial Desalination – Resource Recovery – Circular Economy
Contents
ABBREVIATIONS ....................................................................................................... i
INDEX OF TABLES .................................................................................................... ii
INDEX OF FIGURES ................................................................................................. iv
1 INTRODUCTION ............................................................................................ 1
1.1 Scope of the deliverable ........................................................................................................ 1
1.2 The Online Brine Platform ..................................................................................................... 1
1.3 The role of Ontologies in the Online Brine Platform ............................................................................................................................................ 2
2 ONTOLOGIES AND GRAPH THEORY ............................................................... 3
2.1 What is an Ontology .............................................................................................................. 3
2.2 Components of Ontologies .................................................................................................... 4
2.3 Types of Ontologies ............................................................................................................... 4
2.4 Methodologies ...................................................................................................................... 5
2.4.1 Types of Methodologies ........................................................................................................... 5
2.4.2 Criteria of Analysis for ontology Methodologies ...................................................................... 7
2.5 Ontology development editors ............................................................................................. 8
2.6 Ontology Languages .............................................................................................................. 9
2.7 Graph Theory .......................................................................................................................10
3 DEVELOPING SYMBIOTIC BRINE ONTOLOGY (SBO) 11
3.1 The purpose of ontology .....................................................................................................11
3.2 Methodology .......................................................................................................................12
3.2.1 Determine the domain and the scope of the
ontology 12
3.2.2 Reuse of existing ontologies ................................................................................................... 13
3.2.3 Enumerate important terms in ontology ............................................................................... 14
3.2.4 Define the classes of the Symbiotic Brine Ontology ............................................................... 15
3.2.5 Create Instances ..................................................................................................................... 28
3.2.6 Conventions ............................................................................................................................ 29
4 GROUPS OF SB STAKEHOLDERS ................................................................... 30

ZERO BRINE – Industrial Desalination – Resource Recovery – Circular Economy
4.1 Introduction .........................................................................................................................30
4.2 Brine Generators .................................................................................................................32
4.2.1 Food industry –Dairies (NACE code: C10.5) ............................................................................ 32
4.2.2 Food industry - Meat process (NACE code: C10.1) ................................................................. 35
4.2.3 Food industry - Pickling vegetables (NACE code:
C10.3) 37
4.2.4 Food industry - fish and shellfish industry (NACE
code: C10.2) ............................................................................................................................................ 40
4.2.5 Textile industries (NACE codes: C13.3, C13.9) ........................................................................ 43
4.2.6 Water treatment (NACE code: E36.0) .................................................................................... 55
4.2.7 Oil - Petroleum refinery (NACE code: C19.2) .......................................................................... 65
4.2.8 Paper and Pulp Industry (NACE code: C17.1) ......................................................................... 69
4.2.9 Leather industry (NACE code: C15.1) ..................................................................................... 74
4.2.10 Non-ferrous metal production (NACE codes: C24.4.2,
C24.4.4) 87
4.2.11 Iron & Steel Production (NACE codes: C24.1, C24.2,
C24.3) 89
4.2.12 Inorganic Chemical Industry (NACE codes: C 20.13) .............................................................. 91
4.3 Solution Providers ...............................................................................................................97
4.4 End-users .............................................................................................................................98
4.4.1 End-users of Minerals ............................................................................................................. 98
4.4.2 Water end-users and water recovery ................................................................................... 101
4.4.3 Targeted products for the SB domain .................................................................................. 106
5 REFERENCES ............................................................................................. 108
6 ANNEX ...................................................................................................... 118

ZERO BRINE – Industrial Desalination – Resource Recovery – Circular Economy I
ABBREVIATIONS
BAT: Best Available Techniques
BOD: Biological Oxygen Demand
BREF: BAT Reference Documents
COD: Chemical Oxygen Demand
EC: Electrical Conductivity
EWC: European Waste Catalogue
NACE: Nomenclature Statistique des Activités Économiques
OBP: Online Brine Platform
PC: Product Category
SAR: Sodium Absorption Ratio
SB: Symbiotic Brine
SBI: Standard Industrial Classifications
SBO: Symbiotic Brine Ontology
SS: Suspended Solids
SU: Sector of Use
TP: Total Phosphorus
TS: Total Solids
TSS: Total Suspended Solids
TVS: Total Volatile Solids
VSS: Volatile Suspended Solids
WUC: Water Use Category
Ww: Wastewater
WWTP: Wastewater Treatment Plant

ZERO BRINE – Industrial Desalination – Resource Recovery – Circular Economy II
INDEX OF TABLES
Table 1: Classes Definition, SB Ontology ............................................................................................................... 17
Table 2: symbr:BrineOwner class properties, SB ontology ................................................................................... 18
Table 3: symbr:EndUser class properties, SB ontology ......................................................................................... 18
Table 4: symbr:SalineWwStream class properties, SB ontology ........................................................................... 19
Table 5: symbr:EWC class properties, SB ontology ............................................................................................... 20
Table 6: symbr:WwTreatment class properties, SB ontology ............................................................................... 20
Table 7: symbr:SolutionProvider class properties, SB ontology ........................................................................... 21
Table 8: symbr:Use class properties, SB ontology ................................................................................................ 21
Table 9: symbr:SU class properties, SB ontology .................................................................................................. 22
Table 10: symbr:PC class properties, SB ontology ................................................................................................ 22
Table 11: symbr:AC class properties, SB ontology ................................................................................................ 22
Table 12: symbr:TF class properties, SB ontology ................................................................................................ 23
Table 13: symbr:SBI class properties, SB ontology ............................................................................................... 23
Table 14: symbr:WUC class properties, SB ontology ............................................................................................ 23
Table 15: Properties of symbr:Use class, SB ontology .......................................................................................... 24
Table 16: Properties of symbr:Product class, SB ontology ................................................................................... 26
Table 17: NACE codes of brine producers ............................................................................................................. 31
Table 18: Water consumption in European dairies (data taken from TWG 2015) ................................................ 33
Table 19: Key parameters for cheese brine wastewater characterization ........................................................... 34
Table 20: Key parameters for meat brine wastewater characterization .............................................................. 36
Table 21: Vegetables submitted in pickling process (data taken from BREF (a) (2017) ........................................ 37
Table 22: Wastewater volume and water pollution per unit of product generated in the processing of some
vegetables (data taken from: BREF (a) 2017, FDM) .............................................................................................. 38
Table 23: Main characteristics of the wastewater stream from pickling process ................................................. 38
Table 24: Key parameters for pickling vegetables effluent characterization ........................................................ 39
Table 25: Typical wastewater production rates and characteristics for fish processing in Germany ................... 41
Table 26: Key parameters for the brine wastewater from fish processing characterization ................................ 42
Table 27: Country breakdown of the EU-15 textile and clothing industry in 2000 (Data taken from EURATEX
2000) ..................................................................................................................................................................... 43
Table 28: Mail charging loads from Textile Industry in Europe (data taken from EURATEX, 2000) ...................... 44
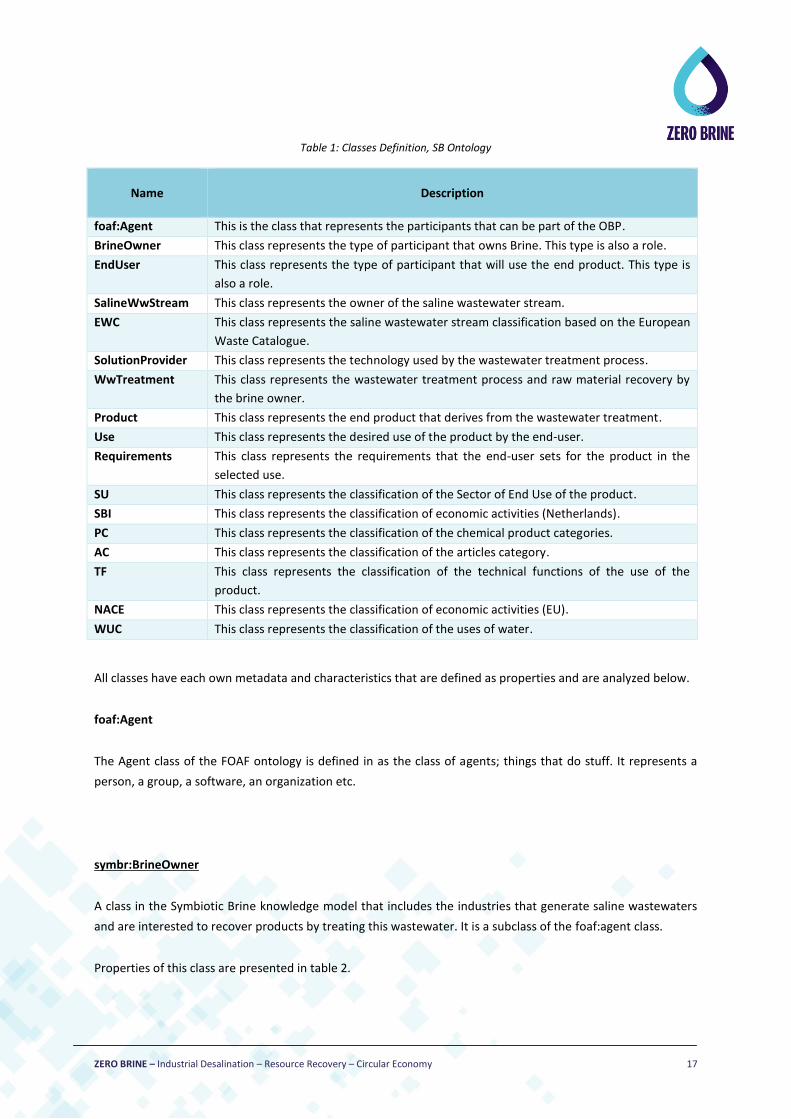
Table 29: Wastewater generation in textile production processes (Data taken from Ghal et al., 2014) ............. 47
Table 30: List of some of the pollutant generated at each level of textile wet processing (Data taken from:
Holkar et al., 2016 ................................................................................................................................................. 47
Table 31: Effluent characteristics in textile production processes (Data taken from PATEL & VASHI, 2015 ........ 48
Table 32: Standard recipe for bleaching with hydrogen peroxide of knit fabric................................................... 49
Table 33: Standard recipe for reductive bleaching and optical brightening of polyamide ................................... 49
Table 34: Standard recipe for bleaching of Polyester (PES) and Polyacrylic (PAN) with sodium chlorite ............. 49
Table 35: Bleaching process characteristics .......................................................................................................... 49
Table 36: Salts as raw materials- salts in wastewaters ......................................................................................... 50
Table 37: Key parameters for brine from bleaching process (in textile industries) characterization ................... 50
Table 38: Classification of dyes in textile processes (adapted from: BREF (c),2003.) ........................................... 51

ZERO BRINE – Industrial Desalination – Resource Recovery – Circular Economy III
Table 39: Salts used in dyeing process (Adapted from: (BREF (c), 2003) .............................................................. 52
Table 40 List of pollutants in dyeing process (Correia et al., 1994). ..................................................................... 53
Table 41: list of pollutants in dyeing process (data taken from Correia, et al., 1994). ......................................... 54
Table 42: Principal processes applied for water desalination ............................................................................... 57
Table 43: Indicative composition of important minerals in seawater (data taken from: Hultman, 2011) ........... 59
Table 44: Comparison between the chemical characteristics of the feed and brine water (adapted from:
Alameddine, & El-Fadel, 2007) .............................................................................................................................. 60
Table 45: Major ions presented in inland waters.................................................................................................. 60
Table 46: Brine constituents resulted by desalination process............................................................................. 61
Table 47: Key parameters for desalination wastewater characterization ............................................................ 62
Table 48: Concentration in saline wastewaters resulted from ion exchange processes. ..................................... 64
Table 49: Typical operating conditions of the desalting process (data taken from: (BREF (b), 2015) .................. 67
Table 50: Composition of the wastewater generated in the desalting process.................................................... 67
Table 51: The most common used bleaching chemicals (CEPI 1997 & EPA 2009) ................................................ 72
Table 52: Typical discharges of metals from kraft pulp mills (BREF (d), 2015) ..................................................... 73
Table 53: Key parameters for bleaching effluent characterization ....................................................................... 73
Table 54: Structure of the European leather Industry, 2007 (data taken from BREF (h) 2013) ............................ 74
Table 55: Wastewater loads (before treatment) per tonne of raw hide achieved by good practice (data taken
from: BREF (h) 2013) ............................................................................................................................................. 80
Table 56: Wastewater discharge in individual processing operations (data taken from: Ludvik, 2000) .............. 80
Table 57: Salts and their use in leather industry (data taken from: BREF (h) 2013) ............................................. 81
Table 58: Key parameters for soaking process wastewater characterization....................................................... 82
Table 59: Key parameters for liming and unhairing process wastewater characterization .................................. 83
Table 60: Key parameters for deliming-bating process wastewater characterization ......................................... 84
Table 61: Key parameters for pickling effluent characterization .......................................................................... 85
Table 62: Types of tannage, main tanning agents and auxiliaries (taken from: BREF (h) 2013) .......................... 85
Table 63: Key parameters for tanning wastewater characterization .................................................................... 86
Table 64: Kinds of non-ferrous metals .................................................................................................................. 87
Table 65: Sludge composition of copper production (based on BREF (e),2017) ................................................... 88
Table 66: Key parameters for non-ferrous metals wastewater characterisation ................................................. 88
Table 67: Composition of wastewater of two wet oxidative desulphurization processes (adapted from BREF(f),
2013) ..................................................................................................................................................................... 90
Table 68: Key parameters for iron and steel metals production wastewater characterization ........................... 90
Table 69: Raw and purified brines (typical composition ranges) (CEFIC-ESAPA, 2004 &(BREF(g), 2007)). ........... 92
Table 70: Wastewater from distillation (CEFIC-ESAPA, 2004). .............................................................................. 93
Table 71: Effluent from brine purification (typical composition) (CEFIC-ESAPA, 2004). ....................................... 94
Table 72: Emissions to water – mean concentrations and mean yearly load (the Netherlands) (InfoMil, 2004) . 95
Table 73: Key parameters for chemical industry wastewater characterization.................................................... 96
Table 74: Technology toolbox of ZERO BRINE project .......................................................................................... 97
Table 75: Use descriptor category-related key elements according to REACH .................................................... 99
Table 76: Guidelines for interpretations of water quality for irrigation adapted from FAO 1985 and JRC 2017)
............................................................................................................................................................................ 102

ZERO BRINE – Industrial Desalination – Resource Recovery – Circular Economy IV
Table 77: Laboratory determinations needed to evaluate common irrigation water quality problems (FAO,
1985) ................................................................................................................................................................... 103
Table 78: Selected water quality criteria for irrigational waters (mg l-1) (FAO, 1985 WHO 2006;) .................... 103
Table 79: Minimum quality requirements for reclaimed water in agricultural irrigation (JRC, 2017) ................ 104
Table 80: Potential water-related problems associated with various industrial processes (IWA, 1996)............ 105
Table 81: Constituents which may be associated with water-related problems in industrial processes (indicated
with blue color) (IWA, 1996) ............................................................................................................................... 106
Table 82: Targeted salts and minerals for the SB domain................................................................................... 107
Table 83: Descriptor list for Life cycle stages ...................................................................................................... 118
Table 84: List for Chemical Products Category.................................................................................................... 119
Table 85: Descriptor list for Articles Categories .................................................................................................. 120
Table 86: Descriptor list for Technical functions ................................................................................................. 124
Table 87: Water Use Category (WUC) ................................................................................................................. 133
Table 88: Parameters to consider for salt reuse ................................................................................................. 133
INDEX OF FIGURES
Figure 1: Symbiotic Brine Ontology ....................................................................................................................... 16
Figure 2: Collection of cows’ milk by dairies in 2014 (% share of EU-28 total) (data taken from Eurostat 2015) 32
Figure 3: General flowchart for processes taking place in textile manufacturing. (Taken from: Bisschops &
Spanjers, 2003)...................................................................................................................................................... 46
Figure 4: Global desalination capacity by end-user (based on Alvarado-Revilla et al., 2015) .............................. 56
Figure 5: Global Desalination Capacity by feed water type (based on Alvarado-Revilla et al.,2015) ................... 58
Figure 6: Chemical composition of seawater with salinity of 35% (Illustrated in 1kg of seawater) ..................... 59
Figure 7: Pulp production per region in 2008 (Data taken from: CEPI (2009)) ..................................................... 69
Figure 8: Mass stream overview of input and output of a kraft pulp mill (taken from BREF (d), 2015) ............... 71
Figure 9: Process steps in leather making (chromium tanning) (taken from: BREF (h) 2013) .............................. 75
Figure 10: Main inputs and aqueous effluents (taken from: BREF (h) 2013) ........................................................ 76
Figure 11: Comparison of the mean chloride loads (taken from: Ludvik, 2000). .................................................. 77
Figure 12: Comparison of the mean sulphate loads (taken from: Ludvik, 2000) .................................................. 78
Figure 13: Comparison of the mean sulphide loads (taken from: Ludvik, 2000) .................................................. 78
Figure 14: Comparison of the mean ammonium loads (taken from: Ludvik, 2000) ............................................. 79
Figure 15: Comparison of the mean chromium loads (taken from: Ludvik , 2000) .............................................. 79
Figure 16: Crude steel production in Europe and worldwide since 1870 (Stahl, 2008) ........................................ 89
Figure 17: EU Chemical Industry sales by geographic breakdown (data taken from CEFI, 2017) ......................... 91

ZERO BRINE – Industrial Desalination – Resource Recovery – Circular Economy 1
1 INTRODUCTION
1.1 Scope of the deliverable
This deliverable includes the results from subtask 6.1.1 entitled “Design and implementation of knowledge
based support in both wastewater stream (brine) and solution provider domain”. The subtask is led by NTUA.
During ZERO BRINE project an active web service for promoting and practically implement Industrial Symbiosis
will be developed. The work presented in this deliverable was concentrated on the design and implementation
of wastewater streams, solution provider and material recovery knowledge models to support description of
user services. The knowledge model is built by ontology engineering. Before building the knowledge model, a
detailed literature review was carried out in the domain of saline wastewater generation by process industries.
This literature review prepared the ground for the design of light weight correlations and interlinks in order to
capture knowledge in the domain of saline wastewater, solution provider technologies and material recovery.
At a next stage, descriptive attributes, properties and restriction of properties was added to the knowledge
model.
1.2 The Online Brine Platform
The Online Brine Platform (OBP) aims at promoting the secondary raw materials flow, by linking the brine
owners with the end-users. Online Brine Platform will play a key role in replicating the paradigms generated in
the framework of the ZERO BRINE project. In ZERO BRINE, a new, disruptive resource management concept of
systemic eco-innovation is proposed, through the development of an industrial symbiosis platform for brine
recovery. In OBP platform, the brine streams generated from process industries can be mapped and possible
interactions for reuse and recycling of resources between the industries across the value chain can be
identified.
The OBP will be applied for the case of the Netherlands. Brine owners and possible end-users of recovered
materials will be able to register to the OBP by providing their address, contact information and industrial
activity. Hence, a network of the interested stakeholders will be created. Users registered to the platform will
have the possibility to have access to information with respect to the available quantities of both virgin and
recovered materials, as well as, on the proximity of both supplier and process industries to their location. Thus,
industries will be able to make informed decisions regarding the management of their own resources.

ZERO BRINE – Industrial Desalination – Resource Recovery – Circular Economy 2
1.3 The role of Ontologies in the Online Brine Platform
Ontologies are widely recognized and established as a means to model, represent and share domain knowledge
in a formal way. Ontologies in the Online Brine Platform (OBP) are semantic structures encoding concepts,
relations and axioms applicable and necessary for the Symbiotic Brine (SB) domain. They are the backbone of
the OBP allowing it to be semantically enriched. This is a pre-condition to provide new, advanced services over
the web, such as the semantic search and retrieval of web resources.
The development of SB ontology aims to offer appropriate conceptual and representational semantics through
the use of ontology engineering, ultimately aiming to provide added value in the domain of wastewater brines
and their recovered products as resources to process industry. The proposed ontology offers classification of
materials, technology, processes and uses related to the brine processing and engineering domain.
Knowledge modeling in process systems engineering and the potential of ontology engineering have already
been realized and researched, hence efforts are directed to create semantic models representing the process
industry domain (Munoz et al, 2013). Moreover, ontologies have been developed to represent the domain of
process engineering (Morbach et al., 2007), industrial standards (Batres et al., 2007) and process in general (Hai
et al., 2009). Specifically for the case of waste processing, an ontology model has already been proposed in
order to support the reuse of waste and consequently to support waste processing (Trokanas et al., 2014),
(Trokanas & Raafat, 2014). Nonetheless, no ontology has been proposed to support the reuse of recovered
inorganic products by industrial wastewater brines and hence to create semantic and cognitive models for
brine waste processing.
The SB ontology has the potential to play an important role in defining the terms used to describe and
represent the domain of brine waste processing, thus providing a common vocabulary and a shared
understanding of the structure of information among individuals and/or organizations, promoting collaboration,
enabling reuse of domain knowledge, making domain assumption explicit, separating domain knowledge from
operational knowledge, analyzing domain knowledge and contributing to the overall standardization of the
domain (Sheeba et al., 2012).
Besides offering common knowledge upon the domain of brine processing and re-use of recovered by-products,
the proposed ontology will be the common ground for the development of information applications and
platforms, in order to generate and disseminate knowledge to final users. The development of user interface
through the OBP will facilitate the use of the ontology as a tool for saline waste management.

ZERO BRINE – Industrial Desalination – Resource Recovery – Circular Economy 3
2 ONTOLOGIES AND GRAPH THEORY
2.1 What is an Ontology
By Ontology we refer to the explanation (λόγος – logos) of being (ον – on) or to the science of the being, to the
philosophical quest that examines the principles and constitution of it and studies the nature and essence of
the beings. The term “Ontology” may also refer to a philosophical discipline that is the branch of philosophy
which deals with the nature and structure of “reality” (Guarino et. al, 2009). In difference with experimental
sciences, which aim at discovering and modeling reality under a certain perspective, Ontology concentrates on
the nature and structure of things per se, independently of any further considerations, and even independently
of their actual existence (Guarino et. al, 2009).
In computer science and knowledge engineering, the Artificial-Intelligence literature contains many definitions
of an ontology; many of these contradict one another. An ontology is a formal naming and definition of the
types, properties, and interrelationships of the entities that really exist in a particular domain of discourse.
It is a special kind of information object or computational artifact. Gruber (1993) defines ontology as an explicit
specification of a conceptualization. This indicates that an ontology is a simplified view or representation of a
given domain of interest.
Guarino and Giaretta (1995) identified several different notions for the term ontology:
Ontology as a philosophical discipline
Ontology as an informal conceptual system
Ontology as a formal semantic account
Ontology as a specification of a conceptualization
Ontology as a representation of a conceptual system via a logical theory either characterized by
specific formal properties or only by its specific purposes
Ontology as the vocabulary used by a logical theory
Ontology as a (meta-level) specification of a logical theory
In the same paper Guarino and Giaretta described the ontology as a logical theory that gives an explicit, partial
account of a conceptualization.
The meaning of ontology is obviously highly dependent on the point of view of the author as well as on the use
of the ontology itself. Its definition is not the most important aspect of it but instead the respective use, the
capabilities, the potentials, the challenges and the benefits related to it are far more important. Summarizing,
an ontology, provides a common vocabulary (terms) for a domain of interest as well as the properties of those
terms and the relation among them.

ZERO BRINE – Industrial Desalination – Resource Recovery – Circular Economy 4
2.2 Components of Ontologies
An ontology may consist of individuals, classes, attributes and relations. Individuals (also known as instances or
particulars) are specific instances of the concept objects (Lord, 2010). The sets of individuals are the classes of
the ontology. Classes may be referred to as types or categories and they can be organized into a taxonomy or
hierarchy. A set of common attributes can describe a concept such as parts of an object. Attributes can also be
other concepts in their own right (i.e. individuals or classes) but they define the context for other concepts.
Lastly, relations define how pairs of concepts can be related. They can also have specific properties such as
symmetry or transitivity. (eSymbiosis, 2012)
2.3 Types of Ontologies
There exist several different categorizations of ontologies, depending on the point of view and intended use.
One categorization by Mizoguchi and colleagues (1995) is as follows:
Content Ontologies used for knowledge reuse. This category includes task, domain and general
ontologies.
Communication Ontologies used for knowledge sharing.
Indexing Ontologies used for case retrieval.
Meta-ontologies also known as Knowledge Representation Ontologies.
Another two-dimensional categorization is provided by Van Heijst and colleagues (1997). The first dimension is
the amount and type of the structure and the classification proposed is:
Terminological Ontologies which specify the terms used for knowledge representation.
Information Ontologies which specify storage structure data.
Knowledge Modeling Ontologies which specify the conceptualization of knowledge
The second one is the issue of the conceptualization. The classification proposed is:
Representation ontologies.
Generic ontologies.
Domain ontologies.
Application ontologies.
A categorization by their dependence on particular tasks or points of view was introduced by Guarino (1998)
who identified the following four types:

ZERO BRINE – Industrial Desalination – Resource Recovery – Circular Economy 5
Top-level Ontologies which are general ontologies.
Domain Ontologies which represent knowledge of a specific domain.
Task Ontologies which are dependent on certain tasks.
Application Ontologies which are dependent on particular applications.
Finally, a classification of ontologies focused on the design of them was proposed by Gómez-Péréz et al. (2006).
They proposed two types of ontologies:
Lightweight ontologies which include concepts organized in taxonomies, the relationships between
those concepts and properties that describe the concepts.
Heavyweight ontologies which add axioms and constraints to lightweight ontologies.
The Symbiotic Brine Ontology developed is an ontology categorized as a representation, application and
domain ontology with knowledge of a specific domain (the domain of Brine Symbiosis) at the same time.
2.4 Methodologies
2.4.1 Types of Methodologies
Many methodologies have been developed in the domain of ontology engineering until today. These
methodologies either have been proposed initially or they have emerged from experiences from different
projects such as the methodology By Grüninger and Fox that is based on the TOVE project ontology [Grü95] or
the approach of Amaya Berneras et al (KACTUS project [KAC96]) (Fernández López, 1999). Although, it is
remarkable that the results that came of a survey conducted in 2007 among developers by University of
Madeira (Cardoso, 2007), showed that 60% of the respondents do not use any methodology when they
develop an ontology. Gómez-Péréz et al. (2006) suggest a general framework for any methodology based on
the software development process identified by IEEE. They defined three different kinds of activities, namely
(i) managerial activities such as scheduling, control and quality assurance, (ii) development-oriented activities
such as implementation and maintenance, and (iii) support activities such as evaluation, documentation and
knowledge acquisition (Iqbal et al., 2013).
Over time, several methodologies have been evolved. Below it follows a brief presentation of some of them,
depending on their significance:
CYC Method
CYC Method was one of the early approaches of ontology development methodology suggested by Lenat and
Guha (1990) which emerged from the experience of developing the CYC knowledge base. Most of the enabling

ZERO BRINE – Industrial Desalination – Resource Recovery – Circular Economy 6
technologies for ontologies were not in place at the moment when CYC was created and as a result CYC
methodology is based on three phases. The first phase requires manual coding, the second one proposes
knowledge codification aided by tools, whereas the third phase relies majorly on the tools for work requiring
little human intervention (Fernández- López and Gómez-Pérez, 2006 and Iqbal et al., 2013).
TOVE Method
Grüninger and Fox proposed a methodology related to the domain of business (Gruninger & Fox, 1995 and
Iqbal et al., 2013). More specifically, it was proposed on the experience of enterprise ontology (Toronto Virtual
Enterprise – TOVE). The key point of TOVE Method is that it first focuses on capturing the ontology
requirements by means of informal description.
METHONTOLOGY
Μethontology was introduced for ontology engineering to build domain ontologies from scratch (Fernández-
López et al., 2006 and Iqbal et al., 2013). Hence, Methontology focuses on the knowledge level of ontologies.
Software development process is the basis of METHONTOLOGY, where processes are divided into three
categories (Management, Development and Support), and on knowledge engineering methodologies (e-
symbiosis). Management activities include scheduling, control and quality assurance. On the other hand,
Development includes activities namely conceptualization, formalisation, specification, implementation and
maintenance of the ontology (eSymbiosis, 2012). Finally, Support activities involve knowledge acquisition,
evaluation, integration and documentation and configuration management.
SENSUS METHOD
SENSUS method was developed using various sources of knowledge including PENMAN Upper Model, ONTOS,
WordNet and some electronic dictionaries (Swartout et al., 1996 and Iqbal et al., 2013). This method attempts
to promote knowledge sharing, by using a base ontology on which new domain ontologies are built.
ON-TO-KNOWLEDGE METHOD
The methodology focuses on knowledge meta process and knowledge process (Iqbal et al., 2013). It suggests a
method for ontology learning which aims to reduce the effort of developing an ontology. In order to serve this
purpose, ON-TO-KNOWLEDGE method provides the tools, the methods and the techniques.
Noy and McGuinness (2001) proposed, a combination of all the aforementioned methodologies to be adopted
when developing an ontology. They suggest a combination of all these methods in self-explanatory steps:
1. Determine the domain and the scope of the ontology.
2. Consider reusing existing ontologies.
3. Enumerate important terms in the ontology.
4. Define the classes and the class hierarchy (Top-down, Bottom-up, Combination).
5. Create instances.

ZERO BRINE – Industrial Desalination – Resource Recovery – Circular Economy 7
2.4.2 Criteria of Analysis for ontology Methodologies
The wide range of ontology applications in different sectors has led to the emergence of a need of developing
several criteria in order to achieve the evaluation of each ontology engineering methodology. The criteria that
were developed cover eight different aspects of any ontology engineering methodology. A brief presentation
and description of these criteria follows (Iqbal et al., 2013):
Criterion 1: Type of development
Μethodologies can be divided in to three broad categories: stage based model, evolving prototype model and
guidelines, depending on the type of development model they follow.
Criterion 2: Support for collaborative construction
Ontologies can be constructed either in isolation or in collaboration as well. Collaborative construction support
allows different members of the ontology development team to work on the same ontology, at the same time.
Criterion 3: Support for reusability
Ontology development is a time consuming and tedious task. Consequently, the notion of ontology reusability
is a characteristic that gained popularity over the years.
Criterion 4: Support for interoperability
Interoperability is an important factor for ontology engineering. Some methodologies support interoperability
between systems. Domain ontologies developed under those methodologies share the same backbone or high
level concepts. Hence, systems adopting such ontologies will have a similar knowledge backbone and it would
be easier for them to communicate and share knowledge with each other.
Criterion 5: Degree of application dependency
Different methodologies adopt distinct approaches for application dependency, during ontology development.
A methodology can opt for one of three scenarios, namely:
- application dependent: ontology is developed on the basis of an application knowledge base in mind,
- application semi-independent: possible scenarios of ontology use are kept in mind during the
specification stage, and
- application independent: no assumption is made regarding the uses to which the ontology will be put
in knowledge-based systems, agents, etc.
ZERO BRINE – Industrial Desalination – Resource Recovery – Circular Economy 8
Criterion 6: Life-cycle recommendation
An ontology life cycle is identified as the set of stages through which the ontology moves during its life. Many
methodologies do not clearly recommend a life cycle, so it is crucial to distinct them according to this
characteristic.
Criterion 7: Strategies for identifying concepts
The process of identification of possible concepts for inclusion in the ontology is of high importance. Some
techniques that are used commonly for this purpose are the bottom-up approach, top-down approach and
middle-out approach.
Criterion 8: Details of methodology
Every methodology comprises of some activities and techniques to support ontology development.
Nonetheless, several methodologies do not provide sufficient details of their employed techniques and
activities. Therefore, methodologies are classified into three categories according to the degree of details they
provide; methodologies with sufficient details, methodologies with some details and methodologies with
insufficient details.
2.5 Ontology development editors
Ontology development editors aid data publishers build their own ontology. These editors are based on RDF(s)
and OWL but support other languages and frameworks as well. Most popular editors include but are not
limited to:
Protégé3
“Protégé is one of the most commonly used editors because it is free, open-source and provides a suite of tools
to construct domain models and knowledge-based applications with ontologies. It can be customized and
extended. The significant advantage of Protégé is its scalability and extensibility.”
NeOn Toolkit4
“The NeOn Toolkit is an open source, multi-platform ontology editor, which supports the development of
ontologies in F-Logic and OWL/RDF. The editor is based on the Eclipse platform and provides a set of plug-ins
3 https://protege.stanford.edu/ 4 http://neon-toolkit.org/wiki/Main_Page.html https://en.wikipedia.org/wiki/NeOn_Toolkit

ZERO BRINE – Industrial Desalination – Resource Recovery – Circular Economy 9
covering a number of ontology engineering activities, including Annotation and Documentation,
Modularization and Customization, Reuse, Ontology Evolution, translation and others. “
TopBraid Composer5
“TopBraid Composer is a component of TopBraid Suite and is a professional development tool for semantic
models (ontologies). It comes in three editions: Free Edition (FE) is an introductory version with only a core set
of features. Standard Edition (SE) that includes all features of FE plus some additional features such as graphical
viewers, import facilities, and much more. Maestro Edition (ME) includes all features of SE plus support for
TopBraid Live, EVN and Ensemble as well as SPARQLMotion and many other power user features.”
Fluent Editor6
“Fluent Editor 2 is a comprehensive tool for editing and manipulating complex ontologies that uses Controlled
Natural Language. Fluent editor provides one with a more suitable for human users alternative to XML-based
OWL editors. Its main feature is the usage of Controlled English as a knowledge modeling language.”
2.6 Ontology Languages
In computer science and artificial intelligence, ontology languages are formal languages used to construct
ontologies. They allow the encoding of knowledge about specific domains and often include reasoning rules
that support the processing of that knowledge. The most common ones are:
OWL: Web Ontology Language (OWL)
The W3C Web Ontology Language (OWL) is a Semantic Web language designed to represent rich and complex
knowledge about things, groups of things, and relations between things. It is the most common used ontology
language. The OWL family contains many species, serializations, syntaxes and specifications with similar names.
For example, OWL and OWL2 are used to refer to the 2004 and 2009 specifications.
XML: eXtensible Markup Language
XML is a general purpose language. The fact that the user can define his own tags classifies it as an extensible
language. XML has been the base for development of other later languages such as RDF, DAML-OIL and others
(eSymbiosis, 2012).
RDF: Resource Description Framework
RDF stands for Resource Description Framework. It is a multi-purpose representation model that provides the
ability to capture information in the form of directed labelled graphs. It provides concrete syntax that can be
5 https://www.topquadrant.com/ http://www.ef.uns.ac.rs/mis/archive-pdf/2013%20-%20No2/MIS2013-2-4.pdf 6 http://www.cognitum.eu/Semantics/FluentEditor/ http://semanticweb.org/wiki/Fluent_Editor.html

ZERO BRINE – Industrial Desalination – Resource Recovery – Circular Economy 10
used to represent both data and metadata and to describe the semantics of information in a software readable
way. RDF comes in many forms of serialization, including RDF/XML that is based on XML and represents
resources on the web in a standardised way with the use of IRIs (eSymbiosis, 2012).
RDF(s)
RDF(s) is a specification of the RDF vocabulary description language. It is the second most common language
for ontology development. It defines the classes (e.g. rdfs:Class, rdfs:Resource) and properties (e.g.
rdfs:Domain, rdfs:subClassOf) that can be used in RDF in order to describe classes and properties in a machine
understandable way (eSymbiosis, 2012).
The language that will be used for SB ontology will be OWL/DL.
2.7 Graph Theory
Graph theory is the study of graphs, which are structures used to model pairwise relations between objects. A
graph is made up of vertices, nodes, or points which are connected by edges. In the most common sense of the
term, a graph is an ordered pair G = (V, E) comprising a set V of vertices or nodes or points together with a set E
of edges, which are 2-element subsets of V (i.e. an edge is associated with two vertices, and that association
takes the form of the unordered pair comprising those two vertices).
Ontologies and their data can be modeled as a graph since ontologies explicate the contents, essential
properties and relationships between terms in a knowledge base.

ZERO BRINE – Industrial Desalination – Resource Recovery – Circular Economy 11
3 DEVELOPING SYMBIOTIC BRINE ONTOLOGY (SBO)
3.1 The purpose of ontology The use of ontologies in the framework of Zero Brine Project aims to capture knowledge in the domain of saline
wastewater streams (brines) and material recovery and act as the base that will be used and enriched for
further uses on the domain. Ontologies are mainly used in order to represent knowledge in the form of a group
of terms. The domain of knowledge is structured hierarchically and enriched with properties and attributes of
these models, combined with restrictions on these properties.
An ontology is associated with instances (cases) which represent specific objects of the domain. An advantage
of ontologies is that they are flexible to implement, share and reuse. This characteristic of ontologies is very
useful especially in conjunction with web technologies and applications.
When users register and edit their profiles in the OBP, they are requested to fill data in the fields that
correspond to properties that are connected to the defined concepts. Ontology forms a knowledge model that
due to its structure implies or helps build the navigation path that users have to follow during the registration
process.
The use of ontologies in the domain of saline wastewater and material recovery provides a standardized
vocabulary resulting in elimination of syntactic issues. The creation of a common vocabulary is crucial for the
brine domain in order to facilitate communication between the relevant stakeholders. Moreover, ontologies
allow to informally express the given knowledge. This characteristic makes them attractive to all audiences no
matter the level of coding skills and background (Trokanas et al. 2012). Last but not least, ontologies facilitate
the use of synonyms (hence removing the jargon barrier), sharing and reasoning that can automatically
generate new knowledge.
The ontology design is compliant with the FAIR data Principles as in order to be findable most (meta)data have
a unique identifier and data are described with rich metadata. Also there are (meta)data that are retrievable by
their identifier using a standardized communications protocol (USES description). (Meta)Data use a formal,
accessible, shared, and broadly applicable language for knowledge representation and they use vocabularies
that follow FAIR principles (Dublin Core, GEO ontology, FOAF). Last but not least, (meta)data have a plurality of
accurate and relevant attributes in order to make the ontology re-usable.
ZERO BRINE – Industrial Desalination – Resource Recovery – Circular Economy 12
3.2 Methodology
As mentioned before, most ontology developers do not follow a specific methodology. One main reason is that
the methodologies may be too sophisticated for an inexperienced user in software development. Moreover,
most of the existing methodologies are highly dependent on the project they are based on. Based on the
approach proposed by Noy & McGuinness (2001) the ISB ontology uses a middle-out approach when defining
the classes and the class hierarchy, leaving room for re-use of pre-existing ontologies whilst creating new ones.
Most ontology developers do not follow a specific methodology (Cardoso, 2007) because most of them are
project based and usually they require some customization and can’t be adopted as they are. The methodology
used in this project is similar to the one suggested by Noy & McGuinness (2001).
3.2.1 Determine the domain and the scope of the ontology
The ontology purposes on representing the knowledge of the Symbiotic Brine domain that aims the treatment
of saline wastewater streams driven by the recovery and use of targeted products. Industrial Symbiosis (IS) is
an innovative approach and environmental practice that brings together companies from different business
sectors targeting in improving cross industry resource efficiency through the commercial trading of materials,
energy and water and additionally sharing expertise, assets and logistics. IS is a key factor for enabling Circular
Economy.
This includes the required knowledge of the use of the recovered products derived from the wastewater
treatment process as well as details of the participants and their sector of use. It tries to explain their symbiotic
relationship and identifies the necessary data and object properties. In order to build the ontology in a way
that is theoretically sound, reusable in the domain and extendable it is important to create a set of competency
questions in order for them to act as the requirements or specification and make the ontology development
easier to comprehend. They are also used as a guide for the validation of the ontology after the stage of the
ontology development completion.
Some of these questions that determine the domain and are quite generic can be the following :
1) What is the domain of the ontology?
2) What will be the exact use of the ontology?
3) Who will use the ontology?
4) Is it a standalone ontology or part of a semantic application?
Next, a set of questions that are more specific and have as a purpose the definition of some, if not all, of the
requirements of the ontology are:
5) What type of participants are there?
6) Which are the industrial and business sectors of the participants?

ZERO BRINE – Industrial Desalination – Resource Recovery – Circular Economy 13
7) What kind of information is needed for the establishment of a symbiotic synergy?
This set of seven questions is answered in the next sections.
3.2.2 Reuse of existing ontologies
An ontology that represents the Symbiotic Brine domain doesn’t exist. An ontology considered but rejected is
the one that represents the United Nations Standard Products and Services Code (UNSPSC). The UNSPSC
ontology for products and services is an ontology that consists of more than 10,000 concepts divided into 54
categories (eSymbiosis, 2012). It is way more detailed for the Symbiotic Brine domain and lacked of the
necessary specialization at the same time. Thus, it was found best if a new one was developed to be more
specific and domain representative. However, an ontology about the industry classification already exists and
has been used as a part of our ontology. This is the NACE Economic Activities ontology:
The Statistical Classification of Economic Activities in the European Community is commonly referred to as
NACE7 (the abbreviation derives from the French term Nomenclature statistique des Activités économiques
dans la Communauté Européenne) and is the industry standard classification system that the European Union
uses.
Other relevant ontologies that represent the units of measurement, the processes and materials could have
been used but were found either too detailed or very domain specific allowing no flexibility. If needed in the
future they can be imported to the SB ontology. Some of them are:
http://sweet.jpl.nasa.gov/2.0/chem.owl
http://sweet.jpl.nasa.gov/2.0/chemElement.owl
https://sweet.jpl.nasa.gov/2.0/chemCompound.owl
https://sweet.jpl.nasa.gov/2.3/matr.owl
https://sweet.jpl.nasa.gov/1.1/substance.owl
Some notary ontologies and vocabularies that are also used are the following:
FOAF8
Friend-of-a-friend (FOAF) is an established ontology that is widely used to describe agents (e.g., people,
organizations) and relationships between them. In the context of the SB ontology, FOAF will be used to
describe agents such as Brine Owners and End-Users.
GEO Ontology9
7 http://ec.europa.eu/eurostat/ramon/ontologies/nace.rdf 8 http://xmlns.com/foaf/spec/
9 https://www.w3.org/2003/01/geo/wgs84_pos

ZERO BRINE – Industrial Desalination – Resource Recovery – Circular Economy 14
GEO Ontology is a vocabulary for representing latitude, longitude and altitude information in the WGS84
geodetic reference datum. (WGS84 Geo Positioning, 2009). The geo:location property will be used for location
description.
Dublin Core10
A simplified technique of standardizing the most popular domain terms where a set of terms like dc:title,
dc:creator, and dc:publisher with agreed meanings are introduced. This gives the ability to attach meaning with
resources. (Brickley and Guha, 2004, Dublic Core Metadata Initiative, 2016). Dublin Core vocabulary introduces
properties such as the description that will be used in the Symbiotic Brine Ontology.
XML Schema
Datatypes is part 2 of the specification of the XML Schema language. It defines facilities for defining datatypes
to be used in XML Schemas as well as other XML specifications. The datatype language, which is itself
represented in XML, provides a superset of the capabilities found in XML document type definitions (DTDs) for
specifying datatypes on elements and attributes.
xsd: XML Schema Definition Language11. For example xsd:double represents that the type of value a resource
has is a double number.
RDF Schema
The RDF Schema as described also in the previous section provides a data-modelling vocabulary for RDF data.
RDF Schema is an extension of the basic RDF vocabulary.12
rdfs:label is used to provide a human-readable version of a resource's name.
The namespace of the Symbiotic Brine ontology is http://www.zerobrine.eu/ontology# and the abbreviated
prefix is symbr.
3.2.3 Enumerate important terms in ontology
Existing classifications have been reused for the representation of the industrial sectors (NACE, SU, PC, SBI, AC,
TF). However, only NACE has an associated published ontology, which is reused accordingly in SBO. Besides
reusing the existing classifications, custom abstract classifications have been developed and are the main core
of the SBO.
10 http://dublincore.org/documents/dcmi-terms/ 11 https://www.w3.org/TR/xmlschema11-2/
12 https://www.w3.org/TR/rdf-schema/

ZERO BRINE – Industrial Desalination – Resource Recovery – Circular Economy 15
3.2.4 Define the classes of the Symbiotic Brine Ontology
In the SBO there are two types of agents: (i) the one who owns (BrineOwners) saline wastewater streams
(SalineWwStream) and (ii) the one who uses (Enduser) the recovered products (Product) after the treatment
(Wwtreatment) of the brine stream. The BrineOwners could be either process industries that produce saline
effluents or aggregators. For brine treatment are used the technologies proposed by the ZERO BRINE
consortium (SolutionProvider). The saline wastewater streams can be classified using the EWC categorization.
The final use (Use) of the recovered products has specific requirements (Requirements) that refer to the
recovered product. Moreover, the use of the recovered product can be categorized in six classes: SU, SBI, PC,
NACE, AC, TF, WUC. All the classes of the SBO have metadata and other characteristics.
The definition and the characteristics of each class is following.
The Symbiotic Brine ontology’s design is shown in the next figure (figure 1).

ZERO BRINE – Industrial Desalination – Resource Recovery – Circular Economy 16
Figure 1: Symbiotic Brine Ontology
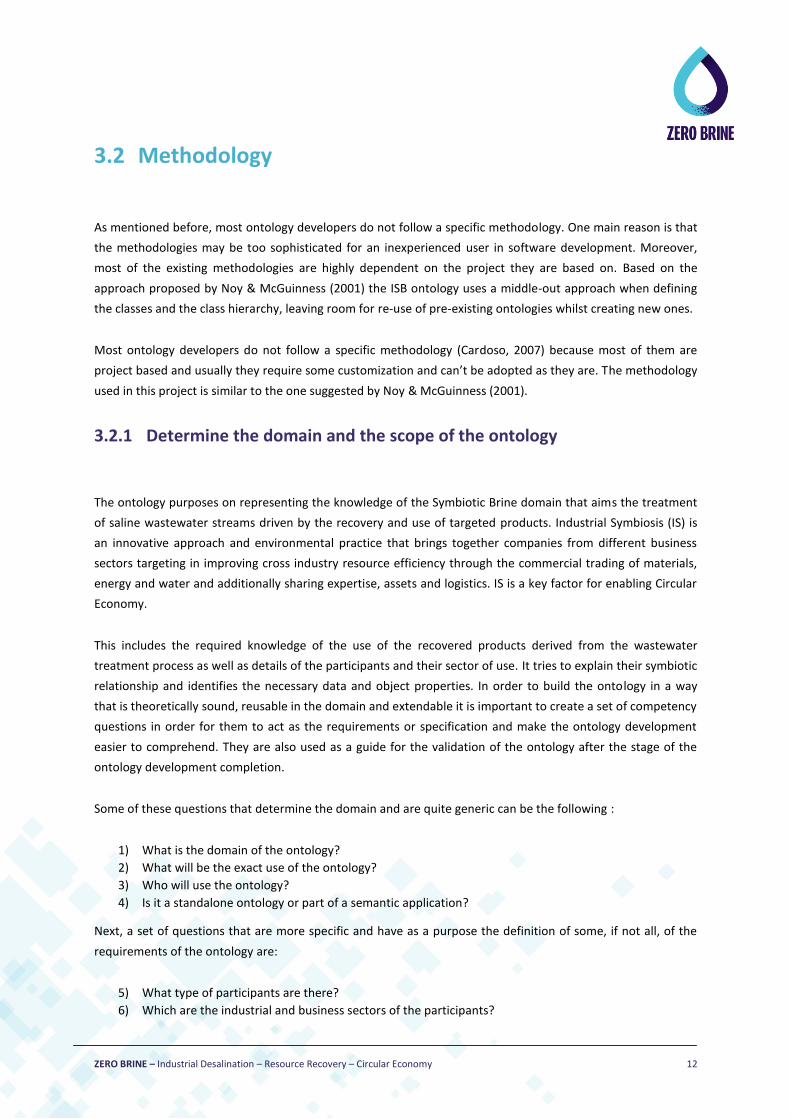
ZERO BRINE – Industrial Desalination – Resource Recovery – Circular Economy 17
Table 1: Classes Definition, SB Ontology
Name Description
foaf:Agent This is the class that represents the participants that can be part of the OBP.
BrineOwner This class represents the type of participant that owns Brine. This type is also a role.
EndUser This class represents the type of participant that will use the end product. This type is
also a role.
SalineWwStream This class represents the owner of the saline wastewater stream.
EWC This class represents the saline wastewater stream classification based on the European
Waste Catalogue.
SolutionProvider This class represents the technology used by the wastewater treatment process.
WwTreatment This class represents the wastewater treatment process and raw material recovery by
the brine owner.
Product This class represents the end product that derives from the wastewater treatment.
Use This class represents the desired use of the product by the end-user.
Requirements This class represents the requirements that the end-user sets for the product in the
selected use.
SU This class represents the classification of the Sector of End Use of the product.
SBI This class represents the classification of economic activities (Netherlands).
PC This class represents the classification of the chemical product categories.
AC This class represents the classification of the articles category.
TF This class represents the classification of the technical functions of the use of the
product.
NACE This class represents the classification of economic activities (EU).
WUC This class represents the classification of the uses of water.
All classes have each own metadata and characteristics that are defined as properties and are analyzed below.
foaf:Agent
The Agent class of the FOAF ontology is defined in as the class of agents; things that do stuff. It represents a
person, a group, a software, an organization etc.
symbr:BrineOwner
A class in the Symbiotic Brine knowledge model that includes the industries that generate saline wastewaters
and are interested to recover products by treating this wastewater. It is a subclass of the foaf:agent class.
Properties of this class are presented in table 2.

ZERO BRINE – Industrial Desalination – Resource Recovery – Circular Economy 18
Table 2: symbr:BrineOwner class properties, SB ontology
Property Name Description Range of Values
foaf:name The Name of the Brine Owner xsd:string
geo:location Term of a basic RDF vocabulary that provides the Semantic Web community with a namespace for representing latitude, longitude and other information about spatially-located things, using WGS84 as a reference datum.
geo:SpatialThing
symbr:controls A property that denotes the relationship between the brine owner and the saline wastewater treatment.
symbr:WwTreatment
symbr:produces A property that denotes the relationship between the brine owner and the saline wastewater stream.
symbr: SalineWwStream
symbr:is-a A property that denotes that the BrineOwner is a FOAF Agent. foaf:Agent
symbr:EndUser
A class in the Symbiotic Brine knowledge model that includes the industries that use the minerals and water
and also the salt producers/suppliers who produce salts or supply salts in the industrial market.
Properties of this class are presented in table 3:
Table 3: symbr:EndUser class properties, SB ontology
Property Name Description Range of Values
foaf:name The Name of the End -ser. xsd:string
geo:location Term of a basic RDF vocabulary that provides the Semantic Web community with a namespace for representing latitude, longitude and other information about spatially-located things, using WGS84 as a reference datum.
geo:SpatialThing
symbr:hasUse A property that denotes the relationship between the end-user and the Use class.
symbr:Use
symbr:is-a A property that denotes that the EndUser is a FOAF Agent. foaf:Agent
symbr:SalineWwStream
The class symbr:SalineWwStream represents the wastewater stream produced by the Brine Owner with its
own chemical (e.g. salinity, Na+, COD e.t.c.) and physical characteristics (e.g. flow). The produced saline
wastewater stream has an EWC classification and is used in the wastewater treatment
Properties of this class are presented in table 4.

ZERO BRINE – Industrial Desalination – Resource Recovery – Circular Economy 19
Table 4: symbr:SalineWwStream class properties, SB ontology
Property Name Description Range of Values rdfs:label A name of the Saline wastewater stream xsd:string
symbr:hasFlowValue Flow Value xsd:double
symbr:hasSalinityValue Salinity Value xsd:double
symbr:hasElectricConductivityValue Electric Conductivity Value xsd:double
symbr:haspHValue pH Value xsd:double
symbr:hasDensityValue Density Value xsd:double
symbr:hasTDSValue TDS Value xsd:double
symbr:hasTSSValue TSS Value xsd:double
symbr:hasTSValue TS Value xsd:double
symbr:hasSSValue SS Value xsd:double
symbr:hasCODValue COD Value xsd:double
symbr:hasBODValue BOD Value xsd:double
symbr:hasTCValue TC Value xsd:double
symbr:hasTOCValue TOC Value xsd:double
symbr:hasICValue IC Value xsd:double
symbr:hasNaPValue Na+ Value xsd:double
symbr:hasNH4PValue NH4+ Value xsd:double
symbr:hasKPValue K+ Value xsd:double
symbr:hasCa2PValue Ca2+ Value xsd:double
symbr:hasMg2PValue Mg2+ Value xsd:double
symbr:hasZr4PValue Zr4+ Value xsd:double
symbr:hasCr3PValue Cr3+ Value xsd:double
symbr:hasClNValue Cl- Value xsd:double
symbr:hasClONValue ClO- Value xsd:double
symbr:hasSiO3NValue SiO3- Value xsd:double
symbr:hasHSO4NValue HSO4- Value xsd:double
symbr:hasS2NValue S2- Value xsd:double
symbr:hasNO3NValue NO3- Value xsd:double
symbr:hasHSO3NValue HSO3- Value xsd:double
symbr:hasCO32NValue CO32- Value xsd:double
symbr:hasSiF62NValue SiF62- Value xsd:double
symbr:hasHCO3NValue HCO3- Value xsd:double
symbr:hasFe2PValue Fe2+ Value xsd:double
symbr:hasNO2NValue NO2- Value xsd:double
symbr:hasPO43NValue PO43- Value xsd:double
symbr:hasS2O3NValue S2O3- Value xsd:double
symbr:hasS2O42NValue S2O42- Value xsd:double
symbr:hasSO42NValue SO4 2- Value xsd:double
symbr:hasSiO42NValue SiO42- Value xsd:double
symbr:hasΗPO42NValue ΗPO42- Value xsd:double
symbr:hasPbValue Pb Value xsd:double
symbr:hasAsValue As Value xsd:double
symbr:hasHgValue Hg Value xsd:double
symbr:hasCdValue Cd Value xsd:double
symbr:hasAlValue Al Value xsd:double
symbr:hasOthermetalsValue Other metals Value xsd:double
symbr:hasIValue I Value xsd:double
symbr:hasFValue F Value xsd:double
symbr:hasAOXValue AOX Value xsd:double
symbr: hasTemperature Temperature xsd:double
symbr: hasClassification A property that denotes the relationship between the wastewater stream and the EWC classification.
symbr:EWC
symbr: isUsedBy A property that denotes the relationship between the wastewater stream and the wastewater treatment process.
symbr:WwTreatment

ZERO BRINE – Industrial Desalination – Resource Recovery – Circular Economy 20
symbr:EWC 13
A class that defines the classification of the saline wastewater stream. The EWC classification is a standardized
way of describing waste that is used in several reports including quarterly/annual waste data returns to SEPA,
waste transfer notes and special waste consignment notes. The EWC is a list of waste types, established by the
European Commission Decision 2000/532/EC1, which categorizes wastes based on a combination of what they
are, and the process or activity that produces them. It provides a standard framework for the comparison of
waste data (statistics) across all member states.
The EWC is divided into 20 chapters, most of which are industry-based, although some are based on materials
and processes. Individual waste types are assigned a six-digit code: the first two digits specify the chapter, the
next two specify the subchapter, and the last two are specific to the waste type.
Properties of this class are presented in table 5:
Table 5: symbr:EWC class properties, SB ontology
Property Name Description Range of Values
symbr:ewcCode The category code of the wastewater stream. xsd:string
rdfs:label The category name of the wastewater stream. xsd:string
symbr:WwTreatment
A class that represents the processes that takes place resulting in water and mineral recovery (ZERO BRINE
Consortium Technologies).
Properties of this class are presented in table 6.
Table 6: symbr:WwTreatment class properties, SB ontology
Property Name Description Range of Values rdfs:label A name (label) of the wastewater Treatment. xsd:string
symbr:capexValue CAPEX Value xsd:double
symbr:opexValue OPEX Value xsd:double
symbr:humanToxicityValue Human Toxicity Value. xsd:double
symbr:respiratoryEffectsValue Respiratory effects Value xsd:double
symbr:ionizingRadiationValue Ionizing radiation Value xsd:double
symbr:ozoneLayerDepletionValue Ozone layer depletion Value xsd:double
symbr:photochemicalOxidationValue Photochemical oxidation Value xsd:double
symbr:aquaticEcotoxicityValue Aquatic ecotoxicity Value xsd:double
symbr:terrestialEcotoxicityValue Terrestial ecotoxicity Value xsd:double
symbr:aquaticAcidificationValue Aquatic acidification Value xsd:double
symbr:aquaticEutrophicationValue Aquatic eutrophication Value xsd:double
symbr:terrestialAcidNutrValue Terrestial acid/nutr Value xsd:double
symbr:landOccupationValue Land occupation Value xsd:double
symbr:globalWarmingValue Global warming Value xsd:double
symbr:nonRenewableEnergyValue Non-renewable energy Value xsd:double
symbr:mineralExtractionValue Mineral extraction Value xsd:double
symbr:humanHealthValue Human health Value xsd:double
13 http://www.nwcpo.ie/forms/EWC_code_book.pdf

ZERO BRINE – Industrial Desalination – Resource Recovery – Circular Economy 21
symbr:ecosystemQualityValue Ecosystem quality Value xsd:double
symbr:climateChangeValue Climate change Value xsd:double
symbr:resourcesValue Resources Value xsd:double
symbr:uses A property that denotes the relationship between the wastewater treatment and the solution provider.
symbr:SolutionProvider
symbr:produces A property that denotes the relationship between the wastewater treatment and the product.
symbr:Product
symbr:SolutionProvider
A class that represents the innovative saline wastewater treatment technologies for water and mineral
recovery developed in the framework of ZEROBRINE project.
Properties of this class are presenter in table 7.
Table 7: symbr:SolutionProvider class properties, SB ontology
Property Name Description Range of Values
rdfs:label The name of the technology used. xsd:string
symbr:Use
The role of the class symbr:Use in the knowledge model is to define the desired use of the product by the
symbr:EndUser.
Properties of this class are presented in table 8.
Table 8: symbr:Use class properties, SB ontology
Property Name Description Range of Values
rdfs:label A label for the desired use by the EndUser. xsd:string
symbr: UseΟfproduct The name of the product that the end-user uses. xsd:string
symbr:hasClassificationSU A property that denotes the relationship between the desired use and the SU categorization.
symbr:SU
symbr:hasClassificationSBI A property that denotes the relationship between the desired use and the SBI categorization.
symbr:SBI
symbr:hasClassificationPC A property that denotes the relationship between the desired use and the PC categorization.
symbr:PC
symbr:hasClassificationNACE A property that denotes the relationship between the desired use and the NACE categorization.
symbr:NACE
symbr:hasClassificationAC A property that denotes the relationship between the desired use and the AC categorization.
symbr:AC
symbr:hasClassificationTF A property that denotes the relationship between the desired use and the TF categorization.
symbr:TF
symbr:hasClassificationWUC A property that denotes the relationship between the desired use and the WUC categorization.
xsd:string
symbr:hasRequirements A property that denotes the relationship between the desired use and the requirements of the end-user.
symbr:Requirements

ZERO BRINE – Industrial Desalination – Resource Recovery – Circular Economy 22
symbr:SU
A class that represents the categories of the Sector of End-use. This categorization is meant to provide
information on the sector of the economy or market area where the use takes place. They therefore indicate
types of industries or industry segments where the substance is present.
Properties of this class are presented in table 9.
Table 9: symbr:SU class properties, SB ontology
Property Name Description Range of Values
symbr:suCode The SU category code. xsd:string
rdfs:label The SU category name. xsd:string
symbr:PC (Product Category)
A class that represents the Chemical Product categorization as defined by REACH. This categorization has two
functions:
i) it describes the sectors formulating mixtures by mixture types (information relevant at formulation life-cycle
stage). The categories listed help to further structure the uses of the substance along the supply chain based on
the product types;
ii) it describes the product types used by the end-users (industrial, professional or consumer end-users). The
product type implicitly includes some information on the potential for exposure/release of the substance.
Properties of this class are presented in table 10:
Table 10: symbr:PC class properties, SB ontology
Property Name Description Range of Values
symbr:pcCode The PC category code. xsd:string
rdfs:label The PC category name. xsd:string
dc:description The PC description. xsd:string
symbr:AC (Articles Category)
A class that represents the Articles Categories (AC), a categorization that is designed to describe the types of
article in which the substance is contained or on which the substance has been applied.
Properties of this class are presented in table 11.
Table 11: symbr:AC class properties, SB ontology
Property Name Description Range of Values
symbr:acCode The AC category code. xsd:string
rdfs:label The AC category name. xsd:string
dc:description The AC description. xsd:string

ZERO BRINE – Industrial Desalination – Resource Recovery – Circular Economy 23
symbr:TF (Technical Functions)
A class that represents the Technical Function categorization (TF). This categorization is designed to describe
the role that the substance fulfils when it is used (what it actually does as such in a process or what it actually
does in a mixture or article).
Properties of this class are presented in table 12.
Table 12: symbr:TF class properties, SB ontology
Property Name Description Range of Values
rdfs:label The TF name. xsd:string
dc:description The TF description. xsd:string
symbr:SBI (Standaard Bedrijfsindeling)
A class that represents the Dutch Standaard Bedrijfsindeling (SBI 2008). This standard is based upon the activity
classification of the European Union (Nomenclature statistique des activités économiques dans la Communauté
Européenne, NACE) and on the classification of the United Nations (International Standard Industrial
Classification of All Economic Activities, ISIC).
Properties of this class are presented in table 13.
Table 13: symbr:SBI class properties, SB ontology
Property Name Description Range of Values
symbr:sbiCode The SBI category code. xsd:string
rdfs:label The SBI category name. xsd:string
symbr:WUC (Water Use Category)
Water Use Category (WUC) is a class that represents the categories of the water end-use. This categorization is
meant to provide information for the general water uses in industries and agriculture. Properties of this class
are presented in table 9.
Table 14: symbr:WUC class properties, SB ontology
Property Name Description Range of Values
rdfs:label The WUC category name. xsd:string
NACE
NACE codes for activities statistical classification of economic activities

ZERO BRINE – Industrial Desalination – Resource Recovery – Circular Economy 24
NACE is the acronym used to designate the various statistical classifications of economic activities developed in
the European Union. NACE provides the framework for collecting and presenting a large range of statistical
data according to economic activity in the fields of economic statistics (e.g. production, employment, national
accounts) and in other statistical domains.
The ontology for NACE exists and has been reused:
NACE Economic Activities ontology: http://ec.europa.eu/eurostat/ramon/ontologies/nace.rdf
symbr:Requirements
A class that represents the requirements set from end-users for a specific desired USE of the mineral in
question. This class contains the technical specifications and limitations provided by the end-user about the
desired product. This class is a subclass of the class symbr:Use.
More specifically the properties of this class are presented in table 14.
Table 15: Properties of symbr:Use class, SB ontology
Property Name Description Range of Values symbr:hasPurityValue Purity Value xsd:double
symbr:hasMoistureValue Moisture Value xsd:double
symbr:haspH pH Value xsd:string
symbr:hasVolatilematterValue volatile matter Value xsd:double
symbr:hasNonvolatilematterValue nonvolatile matter Value xsd:double
symbr:hasOrganicmatterValue organic matter Value xsd:double
symbr:hasNH4PValue NH4+ Value xsd:double
symbr:hasNO3NValue NO3- Value xsd:double
symbr:hasNO2NValue NO2- Value xsd:double
symbr:hasNH3Value NH3 Value xsd:double
symbr:hasPValue P Value xsd:double
symbr:hasPO43NValue PO43- (phosphates) Value xsd:double
symbr:hasP2O5Value P2O5 Value xsd:double
symbr:hasClNValue Cl- Value xsd:double
symbr:hasCO32NValue CO32- Value xsd:double
symbr:hasFeValue Fe Value xsd:double
symbr:hasFe2O3Value Fe2O3 Value xsd:double
symbr:hasCaValue Ca Value xsd:double
symbr:hasCaOValue CaO Value xsd:double
symbr:hasHeavyMetalsValue heavy metals Value xsd:double
symbr:hasPbValue Pb (Pb) Value xsd:double
symbr:hasAsValue As (Arsenic) Value xsd:double
symbr:hasHgValue Hg (Mercury) Value xsd:double
symbr:hasCdValue Cd (cadmium) Value xsd:double
symbr:hasCrValue Cr (Chromium) Value xsd:double
symbr:hasMnValue Mn (Manganese) Value xsd:double
symbr:hasMnO2Value MnO2 Value xsd:double
symbr:hasNiValue Ni (Nickel) Value xsd:double
symbr:hasNiOValue NiO Value xsd:double
symbr:hasNi2O3Value Ni2O3 Value xsd:double

ZERO BRINE – Industrial Desalination – Resource Recovery – Circular Economy 25
symbr:hasCuValue Cu Value xsd:double
symbr:hasCuOValue CuO Value xsd:double
symbr:hasCu2O3Value Cu2O3 Value xsd:double
symbr:hasAlValue Al (Aluminium) Value xsd:double
symbr:hasAl2O3Value Al2O3 Value xsd:double
symbr:hasZnValue Zn (Zinc) Value xsd:double
symbr:hasZnOValue ZnO Value xsd:double
symbr:hasSeValue Se (Sellenium) Value xsd:double
symbr:hasSeO2Value SeO2 Value xsd:double
symbr:hasBrValue Br (Bromide) Value xsd:double
symbr:hasBr2O3Value Br2O3 Value xsd:double
symbr:hasBrO2Value BrO2 Value xsd:double
symbr:hasSrValue Sr (Strontium) Value xsd:double
symbr:hasSrOValue SrO Value xsd:double
symbr:hasZrValue Zr (Zirconium) Value xsd:double
symbr:hasZrO2Value ZrO2 Value xsd:double
symbr:hasMoValue Mo (Molybdenum) Value xsd:double
symbr:hasMoO3Value MoO3 Value xsd:double
symbr:hasSnValue Sn (Tin) Value xsd:double
symbr:hasSnOValue SnO Value xsd:double
symbr:hasSnO2Value SnO2 Value xsd:double
symbr:hasSbValue Sb (Antimony) Value xsd:double
symbr:hasSb2O3Value Sb2O3 Value xsd:double
symbr:hasBeValue Be (Beryllium) Value xsd:double
symbr:hasBeOValue BeO Value xsd:double
symbr:hasVValue V (Vanadium) Value xsd:double
symbr:hasVOValue VO Value xsd:double
symbr:hasV2O3Value V2O3 Value xsd:double
symbr:hasTiValue Ti (Titanium) Value xsd:double
symbr:hasTiO2Value TiO2 Value xsd:double
symbr:hasBaValue Ba (barium) Value xsd:double
symbr:hasBaOValue BaO Value xsd:double
symbr:hasSiO2Value SiO2 Value xsd:double
symbr:hasSiValue Si (Silicon) Value xsd:double
symbr:hasSValue S (Sulphur) Value xsd:double
symbr:hasSO42NValue SO42- (Sulphates) Value xsd:double
symbr:hasSulphurcompoundsValue Sulphur compounds Value xsd:double
symbr:hasS2NValue S2- (Sulphides) Value xsd:double
symbr:hasNaPValue Na+ (Sodium) Value xsd:double
symbr:hasMg2PValue Mg2+ (Magnesium) Value xsd:double
symbr:hasMgOValue MgO Value xsd:double
symbr:hasKValue K (Potassium) Value xsd:double
symbr:hasK2OValue K2O Value xsd:double
symbr:hasFValue F (Fluoride) Value xsd:double
symbr:hasIValue I (Iodine) Value xsd:double
symbr:hasNaClValue NaCl (sodium chloride) Value xsd:double
symbr:hasNa2SO4Value Na2SO4 (sodium sulphate) Value xsd:double
symbr:hasNa2CO3Value Na2CO3 (sodium carbonate) Value xsd:double
symbr:hasNa2SValue Na2S (disodium sulphide) Value xsd:double
symbr:hasK2SO4Value K2SO4 (potassium sulphate) Value xsd:double
symbr:hasCH3COONaValue CH3COONa (sodium acetate) Value xsd:double
symbr:hasNaNO2Value NaNO2 (sodium nitrite) Value xsd:double
symbr:hasH2SO4Value H2SO4 (sulphuric acid) Value xsd:double
symbr:hasNa2S2O5Value Na2S2O5 (sodium metabisulphite) Value xsd:double
symbr:hasSO2Value SO2 (sulphure dioxide) Value xsd:double
symbr:hasNa2O7S2Value Na2O7S2 (disodium disulphate) Value xsd:double
symbr:hasNa2SO3Value Na2SO3 (sodium sulphite) Value xsd:double

ZERO BRINE – Industrial Desalination – Resource Recovery – Circular Economy 26
symbr:hasNa2S2O3Value Na2S2O3 (sodium thiosulphate) Value xsd:double
symbr:hasMgCl2Value MgCl2 (magnesium chloride) Value xsd:double
symbr:hasCaSO4Value CaSO4 (Calcium sulphate) Value xsd:double
symbr:hasCa(OH)2Value Ca(OH)2 (Calcium hydroxide) Value xsd:double
symbr:hasMgSO4Value MgSO4 (Magnesium sulphate) Value xsd:double
symbr:hasCaCl2Value CaCl2 (Calcium Chloride) Value xsd:double
symbr:hasKClValue KCl (Potassium Chloride) Value xsd:double
symbr:hasMgCO3Value MgCO3 (Magnesium Carbonate) Value xsd:double
symbr:hasSARValue SAR Value xsd:double
symbr:hasECValue EC Value xsd:double
symbr:hasCODValue COD Value xsd:double
symbr:hasBOD5Value BOD5 Value xsd:double
symbr:hasTSSValue TSS Value xsd:double
symbr:hasTDSValue TDS Value xsd:double
symbr:hasSSValue SS Value xsd:double
symbr:hasTurbidityValue Turbidity Value xsd:double
symbr:hasEcoliValue Ecoli Value xsd:double
symbr:hasSiO2Value SiO2 Value xsd:double
symbr:hasTotalHardnessValue TotalHardness Value xsd:double
symbr:refersTo A property that denotes the relationship between the requirements and the Product derived from the wastewater treatment.
symbr:Product
symbr:Product
A class that represents the product produced by the wastewater treatment and/or raw mineral and water
recovery. Product properties are composed of a chemical components’ list and of other characteristics such as
purity. These properties in the knowledge model are presented in table:
Table 16: Properties of symbr:Product class, SB ontology
Property Name Description Range of Values rdfs:label The name of the product. xsd:string
symbr:hasQuantityValue Quantity Value xsd:double
symbr:hasPurityValue Purity Value xsd:double
symbr:hasMoistureValue Moisture Value xsd:double
symbr:haspHValue pH xsd:string
symbr:hasVolatileMatterValue volatile matter Value xsd:double
symbr:hasNonVolatileMatterValue nonvolatile matter Value xsd:double
symbr:hasOrganicMatterValue organic matter Value xsd:double
symbr:hasNH4PValue NH4+ Value xsd:double
symbr:hasNO3NValue NO3- Value xsd:double
symbr:hasNO2NValue NO2- Value xsd:double
symbr:hasNH3Value NH3 Value xsd:double
symbr:hasPValue P Value xsd:double
symbr:hasPO43NValue PO43- (phosphates) Value xsd:double
symbr:hasP2O5Value P2O5 Value xsd:double
symbr:hasClNValue Cl- Value xsd:double
symbr:hasCO32NValue CO32- Value xsd:double
symbr:hasFeValue Fe Value xsd:double
symbr:hasFe2O3Value Fe2O3 Value xsd:double

ZERO BRINE – Industrial Desalination – Resource Recovery – Circular Economy 27
symbr:hasCaValue Ca Value xsd:double
symbr:hasCaOValue CaO Value xsd:double
symbr:hasHeavyMetalsValue heavy metals Value xsd:double
symbr:hasPbValue Pb (Pb) Value xsd:double
symbr:hasAsValue As (Arsenic) Value xsd:double
symbr:hasHgValue Hg (Mercury) Value xsd:double
symbr:hasCdValue Cd (cadmium) Value xsd:double
symbr:hasCrValue Cr (Chromium) Value xsd:double
symbr:hasMnValue Mn (Manganese) Value xsd:double
symbr:hasMnO2Value MnO2 Value xsd:double
symbr:hasNiValue Ni (Nickel) Value xsd:double
symbr:hasNiOValue NiO Value xsd:double
symbr:hasNi2O3Value Ni2O3 Value xsd:double
symbr:hasCuValue Cu Value xsd:double
symbr:hasCuOValue CuO Value xsd:double
symbr:hasCu2O3Value Cu2O3 Value xsd:double
symbr:hasAlValue Al (Aluminium) Value xsd:double
symbr:hasAl2O3Value Al2O3 Value xsd:double
symbr:hasZnValue Zn (Zinc) Value xsd:double
symbr:hasZnOValue ZnO Value xsd:double
symbr:hasSeValue Se (Sellenium) Value xsd:double
symbr:hasSeO2Value SeO2 Value xsd:double
symbr:hasBrValue Br (Bromide) Value xsd:double
symbr:hasBr2O3Value Br2O3 Value xsd:double
symbr:hasBrO2Value BrO2 Value xsd:double
symbr:hasSrValue Sr (Strontium) Value xsd:double
symbr:hasSrOValue SrO Value xsd:double
symbr:hasZrValue Zr (Zirconium) Value xsd:double
symbr:hasZrO2Value ZrO2 Value xsd:double
symbr:hasMoValue Mo (Molybdenum) Value xsd:double
symbr:hasMoO3Value MoO3 Value xsd:double
symbr:hasSnValue Sn (Tin) Value xsd:double
symbr:hasSnOValue SnO Value xsd:double
symbr:hasSnO2Value SnO2 Value xsd:double
symbr:hasSbValue Sb (Antimony) Value xsd:double
symbr:hasSb2O3Value Sb2O3 Value xsd:double
symbr:hasBeValue Be (Beryllium) Value xsd:double
symbr:hasBeOValue BeO Value xsd:double
symbr:hasVValue V (Vanadium) Value xsd:double
symbr:hasVOValue VO Value xsd:double
symbr:hasV2O3Value V2O3 Value xsd:double
symbr:hasTiValue Ti (Titanium) Value xsd:double
symbr:hasTiO2Value TiO2 Value xsd:double
symbr:hasBaValue Ba (barium) Value xsd:double
symbr:hasBaOValue BaO Value xsd:double
symbr:hasSiO2Value SiO2 Value xsd:double
symbr:hasSiValue Si (Silicon) Value xsd:double
symbr:hasSValue S (Sulphur) Value xsd:double
symbr:hasSO42NValue SO42- (Sulphates) Value xsd:double
symbr:hasSulphurCompoundsValue Sulphur compounds Value xsd:double
symbr:hasS2NValue S2- (Sulphides) Value xsd:double
symbr:hasNaPValue Na+ (Sodium) Value xsd:double
symbr:hasMg2PValue Mg2+ (Magnesium) Value xsd:double
symbr:hasMgOValue MgO Value xsd:double
symbr:hasKValue K (Potassium) Value xsd:double
symbr:hasK2OValue K2O Value xsd:double
symbr:hasFValue F (Fluoride) Value xsd:double

ZERO BRINE – Industrial Desalination – Resource Recovery – Circular Economy 28
symbr:hasIValue I (Iodine) Value xsd:double
symbr:hasNaClValue NaCl (sodium chloride) Value xsd:double
symbr:hasNa2SO4Value Na2SO4 (sodium sulphate) Value xsd:double
symbr:hasNa2CO3Value Na2CO3 (sodium carbonate) Value xsd:double
symbr:hasNa2SValue Na2S (disodium sulphide) Value xsd:double
symbr:hasK2SO4Value K2SO4 (potassium sulphate) Value xsd:double
symbr:hasCH3COONaValue CH3COONa (sodium acetate) Value xsd:double
symbr:hasNaNO2Value NaNO2 (sodium nitrite) Value xsd:double
symbr:hasH2SO4Value H2SO4 (sulphuric acid) Value xsd:double
symbr:hasNa2S2O5Value Na2S2O5 (sodium metabisulphite) Value xsd:double
symbr:hasSO2Value SO2 (sulphure dioxide) Value xsd:double
symbr:hasNa2O7S2Value Na2O7S2 (disodium disulphate) Value xsd:double
symbr:hasNa2SO3Value Na2SO3 (sodium sulphite) Value xsd:double
symbr:hasNa2S2O3Value Na2S2O3 (sodium thiosulphate) Value xsd:double
symbr:hasMgCl2Value MgCl2 (magnesium chloride) Value xsd:double
symbr:hasCaSO4Value CaSO4 (Calcium sulphate) Value xsd:double
symbr:hasCa(OH)2Value Ca(OH)2 (Calcium hydroxide) Value xsd:double
symbr:hasMgSO4Value MgSO4 (Magnesium sulphate) Value xsd:double
symbr:hasCaCl2Value CaCl2 (Calcium Chloride) Value xsd:double
symbr:hasKClValue KCl (Potassium Chloride) Value xsd:double
symbr:hasMgCO3Value MgCO3 (Magnesium Carbonate) Value xsd:double
symbr:hasSiO3NValue SiO3- Value xsd:double
symbr:hasHSO4NValue HSO4- Value xsd:double
symbr:hasHSO3NValue HSO3- Value xsd:double
symbr:hasCO32NValue CO32- Value xsd:double
symbr:hasSiF62NValue SiF62- Value xsd:double
symbr:hasHCO3NValue HCO3- Value xsd:double
symbr:hasS2O3NValue S2O3- Value xsd:double
symbr:hasS2O42NValue S2O42- Value xsd:double
symbr:hasSO4N2Value SO4 2- Value xsd:double
symbr:hasSiO42NValue SiO42- Value xsd:double
symbr:hasΗPO42NValue ΗPO42- Value xsd:double
symbr:hasSARValue SAR Value xsd:double
symbr:hasECValue EC Value xsd:double
symbr:hasCODValue COD Value xsd:double
symbr:hasBOD5Value BOD5 Value xsd:double
symbr:hasTSSValue TSS Value xsd:double
symbr:hasTDSValue TDS Value xsd:double
symbr:hasSSValue SS Value xsd:double
symbr:hasTurbidityValue Turbidity Value xsd:double
symbr:hasEcoliValue E.coli Value xsd:double
symbr:hasTotalHardnessValue Total Hardness Value xsd:double
3.2.5 Create Instances
Instances will be created in the framework of sub-task 6.1.2: Design and implementation of analysis, feedback
and interface tools and will be presented in deliverable 6.2: Report on system tools for analysis, feedback and
interface.

ZERO BRINE – Industrial Desalination – Resource Recovery – Circular Economy 29
3.2.6 Conventions
In order to allow useful information to be assumed from the names of the concepts and properties it has been
decided to adopt the following two conventions.
Class Names: No whitespaces CamelCase. (e.g. SolutionProvider)
Property Names: No whitespaces, starting with a lower case (usually for the prefix) and capitalising
every word after that (e.g. hasUse)

ZERO BRINE – Industrial Desalination – Resource Recovery – Circular Economy 30
4 GROUPS OF SB STAKEHOLDERS
4.1 Introduction
“Salinity” is a term used to describe the concentration of inorganic dissolved salts (Cuenca, 2013).According to
the classification of Global Water Intelligence (GWI); water bodies can be classified into the following four
categories based on their salt content (salinity):
pure water: less than 500 mg/l,
river water: 500-3,000 mg/l,
brackish water: 1,500-15,000 mg/l and,
seawater: 15,000 – 50,000 mg/l.
Another common classification of water based on the salt content is the following (Wang et al., 2008):
recycled water with less than 1,500 mg/L TDS,
slightly saline water with 1,000–3,000 mg/L TDS,
moderately saline water with 3,000–10,000 mg/L TDS and,
highly saline water with over 10,000 mg/L TDS.
Several studies also use the term “brine” for water with a salt content greater than 50,000 mg/l. According to
WssTP (2012) as brine can be defined a water stream which has almost reached saturation point with dissolved
salt content (> 50 g/l). The composition of brines depends on the nature of the water source or on the process
producing brine as a waste stream. Many industrial processes produce considerable amounts of wastewater
with high salt concentrations. Even though these saline impaired wastewater streams may have salinity less
than 50g/l, it is common to characterize them as brines. These saline impaired water streams can be generated
mainly from the industrial activities as presented in the following sections.
In the following sections a brief presentation the stakeholders groups engaged to the knowledge model
described in chapter 2 is taking place. These stakeholders groups are: (i) brine owners ((ia) Brine waste stream
producers, and (ib) Aggregators who collect waste streams from several producers, (ii) solution providers and
(iii) end-users of the recovered products. This information is crucial for the knowledge model development
procedure, for the creation of the relevant fields of the OBP, and for the simplification of the data procedure.
The composition of industrial brines varies from branch to branch and from site to site, making each saline
wastewater stream generated in process industries almost unique. To deal with this variety, for brine
generators the general information for each sector and the main characteristics of the brine streams produced
are provided based mainly on BREF documents in order to obtain broad information about the targeted sectors.

ZERO BRINE – Industrial Desalination – Resource Recovery – Circular Economy 31
Table 17: NACE codes of brine producers
Section Division Group
C
MANUFACTURING
C10 Manufacture of food products
C10.1 Processing and preserving of meat and production of meat products
C10.2 Processing and preserving of fish, crustaceans and molluscs
C10.3 Processing and preserving of fruit and vegetables
C10.5 Manufacture of dairy products
C13 Manufacture of textiles
C13.3 Finishing of textiles
C13.9 Manufacture of other textiles
C15 Manufacture of leather and
related products
C15.1 Tanning and dressing of leather; manufacture of luggage, handbags, saddlery and harness; dressing and dyeing of fur
C17 Manufacture of paper and
paper products C17.1 Manufacture of pulp, paper and paperboard
C19 Manufacture of coke and
refined petroleum products C19.2 Manufacture of refined petroleum products
C20 Manufacture of chemicals and
chemical products
C20.13 Manufacture of other inorganic basic chemicals
C24 Manufacture of basic metals
C24.1 Manufacture of basic iron and steel and of ferro-alloys
C24.2 Manufacture of tubes, pipes, hollow profiles and related fittings, of steel
C24.3 Manufacture of other products of first processing of steel
C24.4 Manufacture of basic precious and other non-ferrous metals
C24.4.2 Aluminium production C24. 4.4 Copper production
E WATER SUPPLY;
SEWERAGE, WASTE MANAGEMENT AND
REMEDIATION ACTIVITIES
E 36 Water collection, treatment
and supply E 36.0 Water collection, treatment and supply

ZERO BRINE – Industrial Desalination – Resource Recovery – Circular Economy 32
4.2 Brine Generators
4.2.1 Food industry –Dairies (NACE code: C10.5)
4.2.1.1 General information about the sector
In the European Union (EU) there are allocated more than 12,000 dairy processing sites where 300,000 direct
jobs are involved. Worldwide, five of the ten top dairy companies are European. According to the information
provided in the BREF document “Food, Drink and Milk Industries”, the European industry of milk production
brings more than 9.3 billion euros to the EU trade. In 2014, in EU-28 there were produced almost 164.8 million
tonnes of milk, 96.8% of which was cows’ milk, while a percentage of 3.2% of the total production was derived
from ewes, goats and buffalos. Dairy industries were the main receiver of the produced milk while the rest was
used on farms. The production of cows’ milk increased by 3.8% between years 2013 and 2014, while the dairy
cows increased by 0.4%. The number of cows that produce milk for dairies is 23.6 millions with an average yield
of 6,777 kg per head.
As shown in the figure below, in EU-28 Germany holds the first place in the collection of cow’s milk, followed
by France and UK.
Figure 2: Collection of cows’ milk by dairies in 2014 (% share of EU-28 total) (data taken from Eurostat 2015)
21%
17%
10%9%
7%
7%
29%
Germany
France
United Kingdom
Netherlands
Poland
Italy
Others

ZERO BRINE – Industrial Desalination – Resource Recovery – Circular Economy 33
4.2.1.2 Wastewater generation
The main environmental issue in the dairy sector is the generation of a wastewater stream. The high demands
of dairies in cleanliness and hygiene lead to the use of vast amounts of water, resulting in the immense
production of wastewater (BREF (a) 2017). In UK for example, the dairy sector uses 21% of the UK’s fresh water
resources (The Water Network, 2018).
The following table shows the water consumption expressed in m3 per tonne of processed raw material.
Table 18: Water consumption in European dairies (data taken from TWG 2015)
Product Water consumption
(m3/tonne of processed raw material)
Market milk 0.33-8.12
Cheese 0.25-4.12
Powder (e.g. milk, whey) 0.50-3.19
The wastewater generated in dairy industry, like most other agro-industries, is characterized by high Biological
Oxygen Demand (BOD) and Chemical Oxygen Demand (COD) concentrations because of their high organic
content (Demirel et al., 2004).
Brine effluent in cheese production
The processes of ice-cream, butter, whey and cheese production result all in wastewater generation. However,
cheese production is the one, found to generate saline effluents (with the presence of salts and minerals) as a
result of the brining process. For that reason, following, the focus will be on the cheese production sector.
Salt brine that is used to cure many different varieties of cheese can end up as a saline wastewater
(international Dairy Federation, Dairy Industry Salts IDF Factsheet – February 2012).
The brine used in the brining process of cheese production consists of salts (mainly NaCl or KCl or both) and
water in different ratios (Thibaudeau et al., 2015, Madadlou et al., 2007). The salt concentration of brine can
reach up to 26% (Fucà et al., 2012, Guinee, 2004). As a result, in the brine wastewater the K+, Na+, Cl- ions are
expected to be found in high concentrations. When a block of cheese is placed into the brine, there is a net
movement of Na+ and Cl− ions from the brine into the cheese. Ions such as Ca2+and H2PO4− move into the brine
if their concentration is higher in the cheese than in the brine (Fucà, et al., 2012). Additionally, it is expected
that other cheese components are transferred to the brine. Some parameters to consider in the brine effluent
composition are the following: COD, BOD, TSS, SS, VSS, TS, TVS, oils and fats, proteins, alkalinity, pH, EC, sodium,
sulphates, potassium, calcium, chlorides, nitrates, magnesium, TKN, Total phosphorous. (Demirel & Yenigun,
2004 and Noorjahan et al., 1970).

ZERO BRINE – Industrial Desalination – Resource Recovery – Circular Economy 34
It is found that brine wastewater from cheese production can be used in road de-icing: «When rock salt is
combined with cheese brine – a liquid waste product from cheese making – it helps the salt stick to the roadway
(rather than flowing into storm drains and waterways beyond) and speeds up melting» (Conservation law
foundation)14.
As a result of the abovementioned information, in the following table are summarized the key parameters to
take into consideration in order to characterize the cheese brine wastewater.
Table 19: Key parameters for cheese brine wastewater characterization
cations other
Νa+ COD
K+ BOD
TSS
Ca2+ VSS
TVS
anions TS
Cl- Oils and fats
alkalinity
PO43- pH
EC
H2PO4- TKN
14 https://www.clf.org/

ZERO BRINE – Industrial Desalination – Resource Recovery – Circular Economy 35
4.2.2 Food industry - Meat process (NACE code: C10.1)
4.2.2.1 General information about the sector
The biggest part of EU meat consumption is attributed to processed meat (as canned, cured, cooked etc.). The
meat processing sector consists of every activity related to the production of meat preparation and meat
products.
In EU-28 more than 24,000 companies exist under the umbrella of meat the processing sector with a total
production value of 86 billion EUR. Additionally, a number of more than 421,000 persons are employed in meat
processing sector, being one of the largest number for the whole EU food process industry (Clitravi-Avec, 2016).
The majority (90%) of enterprises in EU meat processing is SMEs and is characterized by specialization in
operating independently at different stages of the supply chain. This is specifically the case of the beef and pig
meat sectors. Larger companies (processing facility storages, owning slaughterhouses) are only a small part of
the EU meating process industry and they are mainly in the poultry sector (BREF (a) 2017).
There are many stages in meat processing such as canning, cooking etc. However, according to BREF (a) (2017)
and Johnson et al., (2004) the processes that generate brine wastewater are curing (Salting, dry salting, vessel
salting, injection) and pickling. These processes generate wastewaters containing brines and meat juice.
4.2.2.2 Wastewater generation
Curing and pickling
Curing is the process where salt compounds are used for meat preservation and development of characteristic
flavor and appearance of meat as well. Two methods of curing meats exist: (a) dry curing, during of which solid
salt is rubbed on the surface of meats and (b) immersion method (the most common method) in which meat is
submersed into a liquid solution of salts. Pickling is a method in which the injection of pickling solution in the
meat takes place. This process is followed by the tumbling of meat with rotating drums in order to aid the
distribution. In addition to NaCl, other salts are used for the brine solutions, often substituting the common
table salt (NaCl). These salts are potassium nitrate (KNO3), sodium nitrate (NaNO3) and sodium nitrite (NaNO2).
Brines for pickling and curing contain also other substances with properties of enhancing flavor, prevention of
discoloration, improvement of water-holding capacity of the meat. Substances with these properties are sugars,
ascorbic acid and polyphosphates. The salts used in brines can be introduced in the wastewaters. Johnson et al.
(2004) also mentioned that many of the ingredients of pickle solutions represent polluting material in high
concentrations and add significantly to the raw waste load from the pickle operation. The large amount of
spillage in this operation comes from runoff from the pickle injection, from pickle oozing out of the meat after
injection, from dumping of cover pickle, and from dumping of residual pickle from the injection machine at the

ZERO BRINE – Industrial Desalination – Resource Recovery – Circular Economy 36
end of each operating day. These practices contribute substantially to the wastewater and waste load from a
meat processing plant (Johnson et al., 2004).
It is necessary for the operators to minimize the over production of brine (BREF (a) 2017). There would be a
positive impact as a result of this reduction as the discharge of raw material would be avoided and the
detrimental effect of brines on the Waste Water Treatment Plant (WWTP) as well. Chlorides contained in
brines are not reduced through a biological WWTP. The chloride concentration is reducing because of the
dilution that takes place in WWTP (BREF (a) 2017).
Salt concentration in brines is reported to be in the range of 8-14% (Heinz & Hautzinge, 2007 and Peterson et
al., 2017). Other sources mention that brine is usually prepared by dissolving sodium chloride and sodium
nitrite in cold water at concentrations of 15-20%. 15
Taking into consideration the components of brine, it is expected that wastewater from brining and pickling
meat will contain ions such as Na+, Cl- , K+, NO3-, NO2
-, phosphates (PO4
3-) and is to be characterized with
significant levels of COD and BOD (because of the presence of sugar and ascorbic acid). Additionally, the
presence of COD, BOD, NH4 and phosphorous is expected because of the meat components that are maybe
transferred in the brine.
The table that follows summarizes the components and the parameters to consider for the brine wastewater
characterization. As there are no data for the concentrations, the ions that are expected to be in the higher
concentrations (depending on the salts used in brine) are indicated with bold letters.
Table 20: Key parameters for meat brine wastewater characterization
Anions Other parameters
NO3- pH
NO2- COD
Cl- BOD5
Cations TSS
Na+ TKN
K+ Alkalinity
Other Compounds Electric conductivity (due to the presence of salts)
NH4-N
Phosphate(P)
15 https://condorchem.com/en/brine-treatment/

ZERO BRINE – Industrial Desalination – Resource Recovery – Circular Economy 37
4.2.3 Food industry - Pickling vegetables (NACE code: C10.3)
4.2.3.1 General information about the sector
The varied climatic and topographic conditions of Europe play a very important role in the production of broad
range of fruits and vegetables in the European Union. Typically, southern EU members follow “openair”
production, while countries as Belgium and the Netherland have mainly all-season greenhouse production. The
two thirds of total production of EU-28 come from Italy and Spain (BREF (a) 2017).
Fruit and vegetable processing includes many different steps accordingly to the final product characteristics.
The present study will focus on the pickling process of vegetables as it is found that it is the process generating
most of saline wastewater.
Pickling of vegetables
In a typical pickling process, raw vegetables are delivered, washed and then screened to remove extraneous
matter such as stones. Depending upon the vegetable, the raw material might be steam cooked and then
cooled. The product is then peeled, typically using steam, and reinspected before being cut to the required
dimensions, e.g. sliced/diced/shredded, and transported to the filling line. The chopped vegetables are then
filled into containers. An acidifying liquor is mixed with spices and transferred to the filling line to be used in
the pickling sauce. This liquor typically consists of acetic acid, malt vinegar, spirit vinegar, distilled malt vinegar,
liquid sugar and salt, depending upon the formulation. The acidifying liquor is deposited into the container. The
container is sealed and typically pasteurised before cooling and packaging.
In a typical pickling process, raw vegetables are delivered, washed and then screened to remove extraneous
matter such as stones (BREF (a) 2017).
Table 21: Vegetables submitted in pickling process (data taken from BREF (a) (2017)
Garden vegetables Processing
Olives, cabbage, artichokes, mushrooms, onions, peppers, carrots and cucumbers
Put in oil, pickling/brining, sulphited

ZERO BRINE – Industrial Desalination – Resource Recovery – Circular Economy 38
4.2.3.2 Wastewater generation
In the following table the wastewater volume and water pollution per unit of product generated in the
processing of some vegetables are shown.
Table 22: Wastewater volume and water pollution per unit of product generated in the processing of some vegetables (data taken from: BREF (a) 2017, FDM)
Pickles Wastewater volume
(m3/U) BOD
(kg/U) TSS
(kg/Unit of product)
Fresh packed 8.5 9.5 1.9
Process packed 9.6 18 3.3
Salting stations 1.1 8 0.4
Linda et al. (1976), described as the basic characterisation parameters the following: ΒΟD5, TS, SS, Cl-, TKN, TP,
acidity, electric conductivity and pH. Duangsri et al. (2011), presented the following parameters and their
values for the wastewater characterization collected from a local pickling factory: of 82 g/l total soluble solid,
11 g/l total sugar, 0.9g/l total acidity, 0.2g/l nitrogen, 1.6g/l phosphorus, 64 g/l NaCl and 10,800 mg/l BOD with
a pH of 4.8. The high salinity of this wastewater stream is mainly attributed to the presence of NaCl.
Rosenberg et al. (2013), mention that manufacturers replace NaCl with calcium chloride (CaCl2), as it is more
environmental friendly. Traditionally, the production of pickles used to take place with the use of NaCl and
although manufacturers of pickles recycle brines before discharge, the generation of effluents with high NaCl
concentration is inevitable. In addition, Wilson et al. (2015), mention also that the use of CaCl2 instead of NaCl
for brining in pickling process is a good alternative choice in order to avoid the environmental impact of
discharging an effluent with high NaCl concentration. Concluding, replacing NaCl with CaCl2 can lead to the
presence of Ca2+, in pickling effluent. In the present study there are not available data for the concentration of
calcium in the effluent of pickling process.
Taking into account the above mentioned information, the key parameters for the characterization of pickling
wastewater are summarized in the following table:
Table 23: Main characteristics of the wastewater stream from pickling process
Parameters Tankyard Brines from cucumbers (Little et al., 1974)
Cauliflower (Little et al.,
1974)
Pepper (Little et
al., 1974)
Onion (Little et al., 1974)
Pickling Vegetables (Duangsri et
al., 2011)
Pickling cucumber (Rosenberg et al.,
2013 and Wilson et al., 2015)
pH 3.4 4 4.2 3.9 4.8 n.a.
TOC (mg/l) 3,400 6,200 6,300 <100 n.a. n.a.
SS (mg/l) 330 219 310 620 n.a. n.a..
TKN (mg/l) 732 233 95 20 n.a. n.a
TP (mg/l) 87 142 80 9.6 1,600 n.a.
BOD (mg/l) 2,000 >2,700 >2,700 630 10,800 n.a
Na+ *** *** *** *** 25,200 n.a
Cl- (g/l) 111 79 184 113 38.4
Acidity (mg/l) 2,324 1,850 800 170 900 n.a

ZERO BRINE – Industrial Desalination – Resource Recovery – Circular Economy 39
Conductivity (mmhos)
159 138 202 172 - n.a.
Ca2+ n.a. n.a. n.a. n.a. n.a.
Total sugar (g/l) n.a. n.a. n.a. n.a. 11 n.a.
Total nitrogen (mg/l)
n.a. n.a. n.a. n.a. 200 n.a.
***: the presence of NaCl is mentioned, but there are only data for chloride concentration
N.A.: Non available, there are only information about the use of CaCl2 in brining, and it is concluded
its presence in the brine wastewater.
The presence is mentioned, but there are no concentration data.
The ingredients that are presented in the table are the ingredients that are possible in the wastewater. That
does not necessarily mean that all these ingredients are present in the vegetable brining wastewater.
Due to the high concentration of NaCl or/and CaCl2 in the pickling liquid, the recovery of NaCl and CaCl2 can be
proposed.
Table 24: Key parameters for pickling vegetables effluent characterization
Anions Other parameters
Cl-
pH
TOC
SS
Cations Total nitrogen
TP
Na+ BOD
Acidity
Ca2+
Conductivity
TSS
Total sugar

ZERO BRINE – Industrial Desalination – Resource Recovery – Circular Economy 40
4.2.4 Food industry - fish and shellfish industry (NACE code: C10.2)
4.2.4.1 General information about the sector
The sector of fish processing is widely spread and is characterized by big variability. Fish processing includes the
processing of white or pelagic fish, fatty fish, shellfish and fresh water fish. There are also species of fish that
are mass processed as cod, herring, tuna, mackerel, pollock, haddock ect (BREF (a) 2017).
A preliminary processing of fish aiming at the partial, or full, separation of the edible and the inedible parts of
fish usually precedes the main fishing processing. Modern preliminary process is mainly mechanized and is
supported by special machines for the following:
Freezing/Thawing.
Grading.
Scaling.
Deheading and gutting.
Filleting and skinning.
Fish preservation methods include canning, salting/pickling, smoking and drying (BREF (a) 2017). The present
study focuses on salting/pickling method as these methods result in generation of high salinity wastewater.
Salting/pickling
The salting process is applied in order to lower the moisture or the water content of fish or other fishery
products. The moisture is reduced to such a level that microorganism growth will be inhibited. Sodium chloride
(NaCl) improves fish texture as it firms up the fish (BREF (a) 2017). The role of salt addition is the dehydration of
fish combined with elimination of bacteria growth as well.
There are three basic methods of salt applying for fish preserving (BREF (a) 2017):
Pickle salting: the fish is covered with salt and packed in layers in watertight containers. This forms the
pickle that serves as the saturated brine solution that covers the fish completely. Brine salting: the fish is immersed in a saturated solution made up of 25 parts of salt and 100 parts of
water. Brine salting is done only as a temporary way to preserve fish before they are dried, smoked, or processed;
Dry salting: the fish is run granular by salt. The proportion of salt to fish varies from 10 % to 35 % of the fish weight.

ZERO BRINE – Industrial Desalination – Resource Recovery – Circular Economy 41
4.2.4.2 Water consumption and wastewater generation
The vast water consumption in fish processing industry combined with the generation of wastewater with high
pollution load are matters of great concern about the sector. Huge amounts of water are consumed and a big
part ends up as wastewater. Wastewater is generated during different processing steps of the fish industry
such as thawing, washing, skinning and trimming, filleting, cleaning and salting. In the table below are
presented the volumes and some main characteristics of the wastewater that is generated during different fish
production in Germany (BREF (a) 2017).
Table 25: Typical wastewater production rates and characteristics for fish processing in Germany (data taken from ATV 2000)
Production Wastewater
production (m3/t) TSS (mg/l) BOD5 (mg/l)
Herring 17-40 220-1520 2300-4000
Fresh fish About 8 170-3650 1000-6250
Smoking of fish About 8 14-845 1000-1700
Salting of salmon About 35 NI NI
Deep frozen fish 2-15 NI NI
Thawing NI 0-70 30-1800
NI= No information provided
Brine characteristics
When the fish is processed in brine, there is a high salt concentration in the wastewater ((BREF (a) 2017).).
Industrial production of salted fish products is based on fish pickling in concentrated NaCl brines. The waste
brine generated after the fish pickling is a complex biochemical system consisting of concentrated NaCl solution,
salt-soluble proteins, tissular and bacterial enzymes.16
Instead of NaCl, other salts such as KCl, CaCl2 and MgCl2 can be also used in fish brining (Martínez-Alvarez, &
Gómez-Guillén, 2005). From these salts, NaCl and KCl are the main salts used in brining while MgCl2 and CaCl2
are added in portions of less than 1% of salt content. The total salt concentration is possible to have different
values and can reach levels up to 25% (saturated brines) (Martínez-Alvarez & Gómez-Guillén, 2005).
Summarizing the abovementioned data, the parameters of interest in brines from fish processing are presented
in the following table.
16 http://hydropark.ru/projects.en.htm

ZERO BRINE – Industrial Desalination – Resource Recovery – Circular Economy 42
Table 26: Key parameters for the brine wastewater from fish processing characterization
Anions Other parameters
Chlorides (Cl-) pH
Sulphates SO42- Total Nitrogen
Τotal phosphates Oil and grease (and fats)
Cations COD
Na+ BOD5
K+ Total Suspended Solids
Ca2+
Mg2+
The salts that could be recovered are NaCl and KCl that are used in brining in high concentrations (up to 25%).
As mentioned by Afonso & Bórquez (2002) it was investigated the treatment of this brine (used during the
salting of herring) with the use of RO and UF in order to reuse the permeate in the final herring products.

ZERO BRINE – Industrial Desalination – Resource Recovery – Circular Economy 43
4.2.5 Textile industries (NACE codes: C13.3, C13.9)
4.2.5.1 General information about the sector
.
The textile industry is probably one of the most complicated industrial branch chain of the manufacturing
industry. This sector is characterized by fragmentation and heterogeneity and is dominated mainly by Small
and Medium Enterprises (SMEs). Clothing, home furnishing and industrial use are the predominant end-users
of textile products. Textile industry’s activities are distributed all over EU, but only in a few EU states textile
industries are concentrated. In textile industry, the leading producers are Italy, France, the United Kingdom,
Germany and Spain. These countries together account for about three quarters of EU production. (EU, 2018d).
The following table presents the percentages of textile and clothing production for each of EU-15 countries in
2000: (BREF (c), 2003)
Table 27: Country breakdown of the EU-15 textile and clothing industry in 2000 (Data taken from EURATEX 2000)
Country Share of Textile
(%) in 2000 Share of Clothing
(%) in 2000 Share of Textile & Clothing
(% )in 2002
Germany 14.4 13.1 13.8
France 13.1 13.0 12.9
Italy 29.7 30.8 30.1
Netherlands 2.0 0.8 1.5
Belgium 5.6 2.2 4.2
United Kingdom 12.5 14.3 13.4
Ireland 0.7 0.5 0.6
Denmark 1.0 1.1 1.1
Spain 8.4 11.4 9.6
Greece 2.1 2.5 2.3
Portugal 6.1 7.9 6.9
Austria 2.8 1.2 2.1
Finland 0.8 1.0 0.9
Sweden 0.8 0.2 0.6
Luxembourg 0 0 0
EU-15 100 100 100
The textile industry can be classified into three main categories taking into consideration the kind of processed
fibres (Ghaly et al., 2014):
cellulose fibres (cotton, rayon, linen, ramie, hemp and lyocell),
protein fibres (wool, angora, mohair, cashmere and silk) and ,
synthetic fibres (polyester, nylon, spandex, acetate, acrylic, ingeo and polypropylene).

ZERO BRINE – Industrial Desalination – Resource Recovery – Circular Economy 44
The major environmental issues emerging from the textile industry’s activities are related mainly to water and
air emissions and to energy consumption. Water is the most crucial concern, as the textile industry uses water
for applying dyes and finishing agents, for removing impurities, and for steam generation.
Water losses to the product are not important and only a small part of water used is evaporated during drying.
The major amount of water used ends up as an aqueous effluent and consequently the main important issue of
the process is the volume of water discharged and the chemical load it carries.
In the table below an overview of the environmental loads of wastewater generated by textile industries is
presented. The reported data have been extrapolated to European level.
Table 28: Mail charging loads from Textile Industry in Europe (data taken from EURATEX, 2000)
Substances Environmental load (t/yr)
Salts 200,000 – 250,000
Natural fibre impurities (including biocides) and associated material (e.g. lignin, sericine, wax, etc.)
50,000 – 100,000
Sixing agents (mainly starch, starch derivatives, but also polyacrylates, polyvinylalcohol, carboxymethylcellulose and galactomannans)
80,000 – 100,000
Preparation agents (mainly mineral oils, but also ester oils) 25,000 – 30,000
Surfactants (dispersing agents, emulsifiers, detergents and wetting agents) 20,000 – 25,000
Carboxylic acids (mainly acetic acid) 15,000 – 20,000
Thickeners 10,000 – 15,000
Urea 5,000 – 10,000
Complexing agents <5,000
Organic solvents n.d.
Special auxiliaries with more or less ecotoxicological <5,000
It can be seen that salt contained in the wastewater from textile industry is a significant part of the wastewater
load in Europe. From the reported data, it is also indicated that a considerable percentage of the total
wastewater load from textile processing is due to substances used as raw materials prior to the finishing
process sequence. Typically, these raw materials are:
-preparation agents
-sizing agents
-natural fibres impurities and associated material
Although dyestuffs do not represent a significant load in comparison to other raw materials used in textile
processing, they play an adverse role in the effluent produced. Not only as an aesthetic problem, but also as an
environmental problem since color in natural water is responsible for the reduction of light transmission to
aquatic plants. In addition substances included in colors are related with other environmental problems such as
organic load, AOX and metal elimination (BREF (c), 2003).

ZERO BRINE – Industrial Desalination – Resource Recovery – Circular Economy 45
Textile processing includes many different steps in most of which wastewater is generated. The volume of the
wastewater and the composition depend on many different factors such as the type of process applied and the
processed fabric (Bisschops & Spanjers, 2003).
The dyeing process can be separated in two categories:
a. Dry process
The dry process comprises of (i) opening, blending and mixing, (ii) carding, (iii) combing, (iv) spinning, (v)
weaving and (vi) knitting. Generally in dry processing the amount of water used is negligible.
b. Wet process
The wet process comprises of (i) singeing, (ii) desizing, (iii) kiering, (iv) bleaching, (v) mercerizing and (vi) dyeing.
The wet process consists of a series of operations and requires vast amounts of water at each stage.
In the following figure is presented a flowchart for the processes that take place in textile manufacturing
industry.

ZERO BRINE – Industrial Desalination – Resource Recovery – Circular Economy 46
Figure 3: General flowchart for processes taking place in textile manufacturing. (Taken from: Bisschops &
Spanjers, 2003)
Note: Square boxes are processes that always take place in that order, and “diamond” shaped boxes are
processes that can occur at different places in the chain. The line style indicates if the process is only used for a
certain fabric type: (- - -) for synthetic fibres, (- . -) for cotton and (….) for wool.
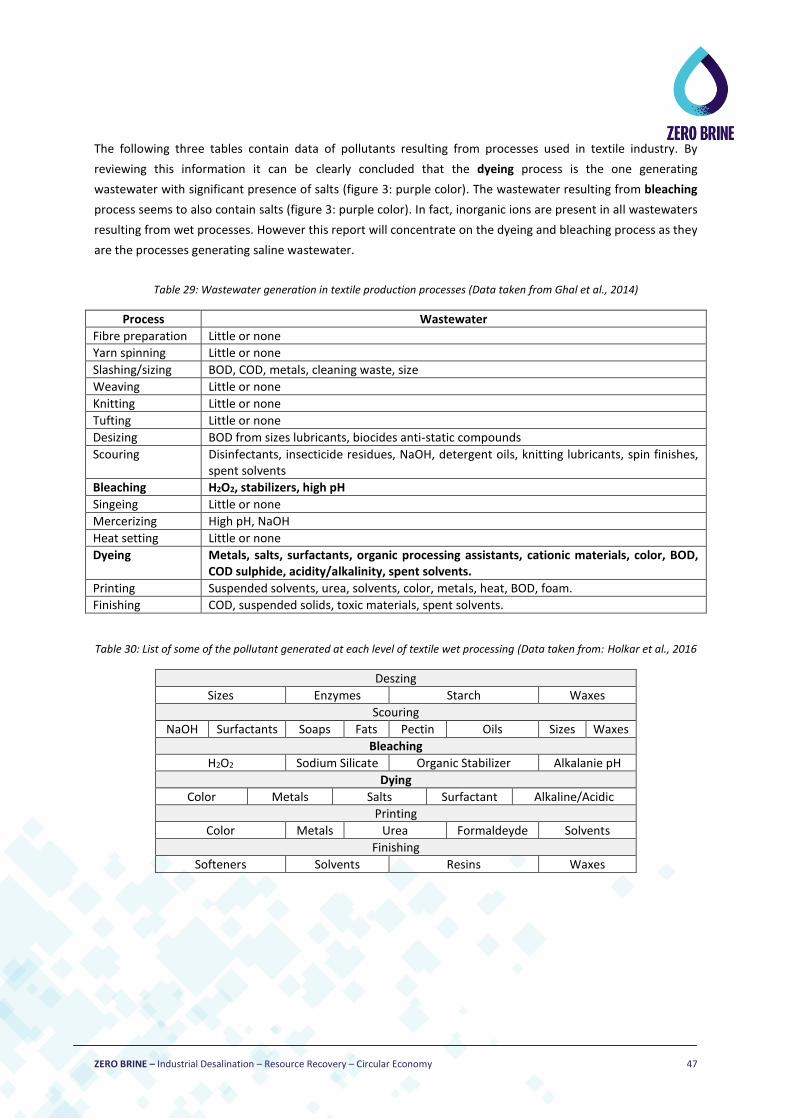
ZERO BRINE – Industrial Desalination – Resource Recovery – Circular Economy 47
The following three tables contain data of pollutants resulting from processes used in textile industry. By
reviewing this information it can be clearly concluded that the dyeing process is the one generating
wastewater with significant presence of salts (figure 3: purple color). The wastewater resulting from bleaching
process seems to also contain salts (figure 3: purple color). In fact, inorganic ions are present in all wastewaters
resulting from wet processes. However this report will concentrate on the dyeing and bleaching process as they
are the processes generating saline wastewater.
Table 29: Wastewater generation in textile production processes (Data taken from Ghal et al., 2014)
Process Wastewater
Fibre preparation Little or none
Yarn spinning Little or none
Slashing/sizing BOD, COD, metals, cleaning waste, size
Weaving Little or none
Knitting Little or none
Tufting Little or none
Desizing BOD from sizes lubricants, biocides anti-static compounds
Scouring Disinfectants, insecticide residues, NaOH, detergent oils, knitting lubricants, spin finishes, spent solvents
Bleaching H2O2, stabilizers, high pH
Singeing Little or none
Mercerizing High pH, NaOH
Heat setting Little or none
Dyeing Metals, salts, surfactants, organic processing assistants, cationic materials, color, BOD, COD sulphide, acidity/alkalinity, spent solvents.
Printing Suspended solvents, urea, solvents, color, metals, heat, BOD, foam.
Finishing COD, suspended solids, toxic materials, spent solvents.
Table 30: List of some of the pollutant generated at each level of textile wet processing (Data taken from: Holkar et al., 2016
Deszing
Sizes Enzymes Starch Waxes
Scouring
NaOH Surfactants Soaps Fats Pectin Oils Sizes Waxes
Bleaching
H2O2 Sodium Silicate Organic Stabilizer Alkalanie pH
Dying
Color Metals Salts Surfactant Alkaline/Acidic
Printing
Color Metals Urea Formaldeyde Solvents
Finishing
Softeners Solvents Resins Waxes

ZERO BRINE – Industrial Desalination – Resource Recovery – Circular Economy 48
Table 31: Effluent characteristics in textile production processes (Data taken from PATEL & VASHI, 2015
Process Effluent Composition Nature
Sizing Starch, waxes, carboxymethyl, cellulose (CMC), polyvilyl alcohol (PVA), wetting agents
High in BOD, COD
Desizing Starch, CMC, PVA, fats, waxes, pectin High in BOD, COD, SS, DS
Bleaching Sodium hypochlorite, Cl2, NaOH, H2O2, acids, surfactant, NaSiO3, sodium phosphate, cotton fiber
High alkalinity, high SS (suspended solid)
Mercerizing Sodium hydroxide, cotton wax High pH, low BOD, high DS
Dyeing Dyestuffs urea, reducing agents, oxidizing agents, acetic acid, detergents, wetting agents
Strong colored, high BOD, high DS, low SS, low heavy metals
Printing Pastes, urea, starches, gums, oils, binders, acids, thickeners, cross-linkers, reducing agents, alkali
Highly colored, high BOD, oily appearance, High Suspended Solid, slightly alkaline, low BOD
4.2.5.2 Bleaching process: salts as raw materials and wastewater generation
Bleaching process aims at increasing the whiteness of cotton and other fibres by removing the natural
yellowish coloring. The bleaching process is typically necessary if the finished fabric is to be white or dyed a
light color (Correia et al., 1994).
After the scouring process, the fabric is treated with bleach liquor. Bleaching is actually an oxidation process
that takes place with the use of hydrogen peroxide, sodium hypochlorite or sodium chlorite (Correia et al.,
1994). Other chemicals used in this process are formic acid, caustic soda, sodium bisulphite, surfactants and
chelating agents (Vashi, 2015). A percentage of 10-20% of the total pollution load of textile processing comes
from the bleaching process. Bleaching wastewater is characterized by a high solids content and low to
moderate BOD levels. This effluent has uncommonly significant dissolved oxygen content due to the
decomposition of hydrogen peroxide.
Nevertheless, chloride or hydrogen peroxide can cause toxicity problems in biological treatment processes (6).
The wastewaters from this unit contain soap and optical whitening agents. (Vashi, 2015).
The most frequently used for cellulosic fibres oxidative bleaches are namely:
_ hydrogen peroxide (H2O2),
_ sodium hypochlorite (NaClO) and,
_ sodium chlorite (NaClO2).
Typical recipes for bleaching are included in the following table (BREF (c), 2003).

ZERO BRINE – Industrial Desalination – Resource Recovery – Circular Economy 49
Table 32: Standard recipe for bleaching with hydrogen peroxide of knit fabric
Chemicals g Telquel/kg textile substrate
Continuous and optimized process
Discontinuous process
H2O2 (100%) 5-15 5-15
NaOH (100%) 4-10 4-30
Complexing agents 0-2 0-2
Organic stabilizer 0-10 0-20
Surfactant 2-5 2-10
Sodium Silicate 8-20 0-20
Water Consumption (1/kg textile substrate)
n.d. n.d.
Table 33: Standard recipe for reductive bleaching and optical brightening of polyamide
Chemicals (g Telquel/kg textile substrate)
Sodium dithionite containing formulation 10-30
Optical brightener 5-15
Surfactant 1-2
Water Consumption (1/kg textile substrate) n.d.
Table 34: Standard recipe for bleaching of Polyester (PES) and Polyacrylic (PAN) with sodium chlorite
Chemicals (g Telquel/kg textile substrate)
NaClO2 (100%) 5-15
Formic acid pH 2.5-3.5 or oxalic acid pH 2.5 n.d
Corrosion inhibitor 10-20
Water Consumption (1/kg textile substrate) n.d.
Depending on the recipe applied some salts can be in higher concentrations. For example, when bleaching with
hydrogen peroxide, sodium silicate is one of the main components of the recipe, while when bleaching PES or
PAN sodium chlorite is one of the main components.
Information concerning bleaching processes retrieved from the different literature sources is integrated in the
following table.
Table 35: Bleaching process characteristics
Process Effluent composition Nature
Bleaching Sodium hypochlorite, Cl2, NaOH, H2O2, acids, surfactant, NaSiO3, sodium phosphate, cotton fiber, COD, BOD
High alkalinity, high SS (suspended solid), low BOD

ZERO BRINE – Industrial Desalination – Resource Recovery – Circular Economy 50
Several studies mention that NaSiO3 can be inserted as raw material in bleaching solution in concentration up
to 10g/l. That means that NaSiO3 may present in high concentration in bleaching wastewater 17. For
environmental reasons the use of sodium hypochlorite is now limited in Europe to just a few particular cases,
connected with knitted fabric and, in some cases, bleaching of yarn when a high degree of whiteness is
required (BREF (c), 2003).
Table 36: Salts as raw materials- salts in wastewaters
Salt name Raw material in bleaching Presence in wastewater
NaCl + +
NaSiO3 maybe +
NaHSO4 + +
NaClO + +
Sodium Phosphates Maybe +
Table 37: Key parameters for brine from bleaching process (in textile industries) characterization
Pollutants Parameters
ClO BOD
ClO2- pH
O22- EC
Cl- DS
PO43- SS
Na+
F-
SiO32-
As mentioned before, some salts can be used in large amounts in bleaching process and consequently it is
expected to be found in higher concentrations in the wastewater. The ions written with bold letters are the
ones expected to be found in higher concentrations.
4.2.5.3 Dyeing process: salts as raw materials and wastewater generation
During dyeing process the textile material is given the desired color according to its final use. A dyestuff is a
molecule containing a chromophoric group (conjugated system) capable of interacting with light, thus giving
the impression of color (BREF (c), 2003)
The predominant pollution problem of dyeing process is the color. Color, as mentioned also before, can cause
several problems in water as it decreases its transparency combined with the fact that some of dyes and of
their degradation products are toxic to aquatic organisms.
17 http://textilelearner.blogspot.com/2014/09/bleaching-recipe-of-hydrogen-peroxide.html

ZERO BRINE – Industrial Desalination – Resource Recovery – Circular Economy 51
Dyeing processing requires large amounts of water. Water is used in the dyeing process and in the rinsing
processes of the dyed products. Water use depends on the process characteristics (the equipment, fabric and
dyestuff used). Except for the dyes, the different auxiliary chemicals that are used, end up in the wastewater
(ΒΤΤG, 1999). Typical pollutants generated in the dyeing step are colour and different auxiliary chemicals, such
as organic acids, fixing agents, defoamers, oxidising/reducing agents, and diluents. A large amount of dyes end
up in wastewater in an unfixed state. The amounts and adverse effects pollution depend on the dyes and
process employed (EPA Office of Compliance, 1997).
(Dyeing contributes most of the metals and almost all of the salts and colour present in textile effluents (US
EPA, 1996). For some dyeing processes, about 75% of the salts end up in the wastewater (Danish
Environmental Protection Agency, 1997), (Bisschops & Spanjers, 2003).
Table 38: Classification of dyes in textile processes (adapted from: BREF (c),2003.)
Dyes Applicability
Acid dyes polyamide (70 – 75 %) and wool (25 – 30 %). They are also used for silk and some modified acrylic fibres.
Basic (cationic) dyes Basic dyes were initially used to dye silk and wool (using a mordant), but they exhibited poor fastness properties. Nowadays these dyestuffs are almost exclusively used on acrylic fibres, modified polyamide fibres, and blends.
Direct (substantive) dyes Direct dyes are used for dyeing cotton, rayon, linen, jute, silk and polyamide fibres.
Disperse dyes Disperse dyes are used mainly for polyester, but also for cellulose (acetate and triacetate), polyamide and acrylic fibres.
Metal-complex dyes Metal-complex dyes (also called pre-metallised dyes) have great affinity for protein fibres. Among metal-complex dyes, 1:2 metal-complex dyes are also suitable for polyamide fibres. More than 65 % of wool is today dyed with chrome dyes (see next section) or metal-complex dyes and about 30 % of PA is dyed with 1:2 metal-complex dyes.
Mordant dyes (chrome dyes) Mordant dyestuffs are generally used for protein (wool and silk). They are practically no longer used for polyamide fibres or for printing.
Naphthol dyes (azoic dyes developed on the fibre)
Azoic dyes, also known as naphthol dyes, are used for cellulosic fibres (particularly cotton), but may also be applied to viscose, cellulose acetate, linen and sometimes polyester.
Reactive dyes Reactive dyes are mainly used for dyeing cellulose fibres such as cotton and viscose, but they are also increasingly gaining importance for wool and polyamide.
Sulphur dyes Sulphur dyes are mainly used for cotton and viscose substrates. They may also be used for dyeing blends of cellulose and synthetic fibres, including polyamides and polyesters. They are occasionally used for dyeing silk. Apart from black shades, sulphur dyes play almost no part in textile printing.
Vat dyes Vat dyes are used most often in dyeing and printing of cotton and cellulose fibres. They can also be applied for dyeing polyamide and polyester blends with cellulose fibres.
Pigments Pigments are widely used in printing processes (pigment printing).

ZERO BRINE – Industrial Desalination – Resource Recovery – Circular Economy 52
Dyeing processes require also the use of auxiliary chemicals. These sometimes are contained in the dyestuff are
usually added to the dye liquor.
A table that summarizes the different salts that are used during the dyeing process according to dye category
follows.
Table 39: Salts used in dyeing process (Adapted from: (BREF (c), 2003)
Dye Substance name Molecular form Role in the dyeing process
Acid dyes
sodium sulphate Na2SO4 for level dyeing & fast acid
sodium acetate CH₃COONa for acid milling dyes
ammonium sulphate (NH4)2SO4 for acid milling dyes
ammonium salt, ammonium chloride
NH4Cl pH regulator
Direct dyes sodium chloride NaCl electrolytes
sodium sulphate Na2SO4 electrolytes
Disperse dyes sodium hydrosulphite ΝaHS reducing agent
Metal-complex dyes
ammonium acetate NH4C2H3O2 chemicals and auxiliaries
ammonium sulphate (NH4)2SO4 chemicals and auxiliaries
sodium sulphate Na2SO4 chemicals and auxiliaries
Mordant dyes (chrome dyes)
sodium sulphate Na2SO4 chemicals and auxiliaries
ammonium sulphate (NH4)2SO4 chemicals and auxiliaries
Dichromate salt contain the dichromate anion, Cr2O2
−7 chemicals and auxiliaries
Naphthol dyes sodium nitrite NaNO3 chemicals and auxiliaries
Reactive dyes
sodium carbonate Na2CO3 chemicals and auxiliaries
sodium chloride NaCl NaCl chemicals and auxiliaries
sodium sulphate Na2SO4 chemicals and auxiliaries
ammonium sulphate (NH4)2SO4 chemicals and auxiliaries
sodium silicate Na2SiO3 sodium silicate
Reactive dyes (printing)
sodium carbonate Na2CO3 chemicals and auxiliaries
Sulphur dyes
sodium hydrosulphite or Sodium dithionite
NaHSO3 chemicals and auxiliaries
Sodium hydrosulfide NaHS chemicals and auxiliaries
sodium chloride NaCl NaCl chemicals and auxiliaries
sodium sulphate Na2SO4 chemicals and auxiliaries
Vat dyes
Sodium dithionite Na2S2O4 reducing agent
sodium sulphate Na2SO4 chemicals and auxiliaries
potassium carbonate K2CO3 chemicals and auxiliaries
sodium carbonate Na2CO3 chemicals and auxiliaries

ZERO BRINE – Industrial Desalination – Resource Recovery – Circular Economy 53
Dyeing process wastewater
Some common auxiliaries used in dyeing process are organic acids, fixing agents, defoamers, oxidizing/reducing
agents and diluents. A significant number of dyes used in dyeing process leaves the process in an unfixed state.
The exact amounts of these pollutants depend on the dyes and the process used (EPA Office of Compliance,
1997).
Dyeing wastewater contribute most of the metals and almost all of the salts and color present in the overall
textile effluent. For some dyeing processes, about 75% of the salts used end up in the wastewater (Bisschops &
Spanjers, 2003).
However, dyeing wastewater characteristics shows a very high variability in composition because of the
different dyes, auxiliary chemicals and processes employed. The salinity depends on the process and on the
chemicals used. There are no available data for the concentrations of salts of the dyeing effluent wastewater,
but information on the inorganic ions present in the dyeing effluent is summarized in the following table.
Table 40 List of pollutants in dyeing process (Correia et al., 1994).
Process/Fibres Dyeing
Substances
Inorganic Organic
Cations Anions
Cotton Viscose Linen
Na+ Cl-
-Naphthol (A), Acetate (B), Amides of naphtholic acid (B), Anionic surfactants (A), Cationic fixing agents (NB), Anionic dispersing agents (NB), Chloro amines (SB), formaldehyde (A), Formate (B), Nitro amines (SB), Non-anionic surfactants, residual dyes (NB), Soaps (A), Soluble oils (SB), Sulphated oils (A), tannic acid (A), tartrate (B), Urea (B)
Cr3+ CO32-
Cu2+ CO42-
Sb3+ F-
K+ NO2-
NH4+ O2
2-
S2-
S2O32-
SO32-
SO42-
Wool
Na+ SO42- ,SO3
2- Acetate (B), dispersing agents (U), Formate (B), Lactate (B), residual dyes (NB), sulphonated oils (A), Tartrate (B)
K+, NH4+ S2O4
-, CO32-
Cr3+, Cu2+ Cl-
Al3+, Sb3+
Polyamide Na+ Cl- Acetate (B), Formate (B), Polyamide oligeines (U),
residual dyes (NB), sulphonated oils (A) CO32-
Acrylic
Na+ SO42- Acetate (B), aromatic amines (A), formate (B), levelling
agents (U), phenolic compounds (A), residual dyes (NB), retardants (U), surfactants, thioreia dioxide (A)
Cu2+
NH4+
Polyester
Na+ S4O62-
Acetate (B), anionic surfactants (A), Antistatic agents (NB), dispersing agents (A), dye carriers (SB), EDTA (NB), Ethylene oxide condensates (U), formate (B), mineral oils (SB), non-ionic surfactants (A), residual dyes (NB), soaps (A), solvents (A)
NH4+ ClO-
NO3-
Cl-
SO32-

ZERO BRINE – Industrial Desalination – Resource Recovery – Circular Economy 54
Table 41: list of pollutants in dyeing process (data taken from Correia, et al., 1994).
Dye Fibre Color ADMI1
BOD (mg l-1)
TOC (mg l-1)
SS (mg l-1)
DS (mg l-1)
pH
Acid Polyamide 4000 240 315 14 2028 5.1
Acid/Chrome Wool 3200 135 210 9 1086 4.0
1:2 Metal Complex Polyamide 370 570 400 5 3945 6.8
Basic Acrylic 5600 210 255 13 1469 4.5
Basic Polyester 1300 1470 1120 4 1360 5.0
Direct developed Viscose 2730 12 55 13 918 3.2
Direct Viscose 12500 15 140 26 2669 6.6
Direct after cooperable Cotton 525 87 135 41 2763 5.0
Reactive (batch) Cotton 3890 0 150 32 12500 11.2
Reactive (continuous) Cotton 1390 102 230 9 691 9.1
Naphtols Cotton 2415 200 170 387 10900 9.3
Sulphur (Continuous) Cotton 450 990 400 34 2000 3.7
Vat Cotton 1910 294 265 41 3945 11.8
Disperse Polyester 1245 198 360 76 1700 10.2
Disperse Polyester 315 234 300 39 914 7.8
Disperse Polyester (carpet)
215 159 240 101 771 7.1
Disperse Polyamide (carpet)
100 78 130 14 396 8.3
Disperse/Acid/Basic (continuous)
Polyamide (carpet)
<50 130 160 49 258 6.5
Disperse/Acid/basic (batch) Polyamide (carpet)
210 42 130 8 450 6.7
Disperse/Vat Cotton & polyester
365 360 350 9 691 9.1

ZERO BRINE – Industrial Desalination – Resource Recovery – Circular Economy 55
4.2.6 Water treatment (NACE code: E36.0)
4.2.6.1 General information about the sector
The predominant water treatment method resulting in a high salinity waste stream is desalination. A
desalination plant separates saline water into two streams, as shown in the figure below: (i) one with a low
concentration of dissolved salts (the fresh water stream) and (ii) another containing the remaining dissolved
salts (the concentrate or brine stream). The desalination process requires energy to operate and can use a
number of different technologies for the separation (Buros, 2000).
Adapted from Buros (2000)
Production of treated water with desalination techniques is a widely used practice. In general, desalination
refers to the process of removing salts from waters of different qualities (Cooley et al., 2006)).
4.2.6.2 Desalination for the production of drinking water from saline ore brackish water
Production of drinking water form brackish water sources by desalination processes is a common practice in
Mediterranean Region Countries but not in Western Europe. In addition to drinking water, desalination process
produces vast amounts of brine as a waste stream. Also, several industries around the world use water
processed to a high quality by desalination techniques that result in a concentrate stream with a high salt
content (WssTP,2012).
Worldwide, the total volume of desalinated water produced is approximately 83 million m3/day derived from
14,220 plants (Alvarado-Revilla et al., 2015). As shown in Figure 5, the vast majority of desalination plants work
ZERO BRINE – Industrial Desalination – Resource Recovery – Circular Economy 56
in order to produce drinking water for municipalities. Another significant end-user of desalinated water is the
industrial and power sector. As shown in figure 6, the total capacity of desalinated water is served mainly by
seawater and brackish water.
Figure 4: Global desalination capacity by end-user (based on Alvarado-Revilla et al., 2015)
The composition of brine effluent from desalination technologies depends mainly on the feed water type and
on the technology applied.
Desalination techniques
A variety of desalination technologies exist today. These technologies remove salts effectively from saline
water (or extract fresh water from salty water), producing a water stream with a low concentration of salt (the
product stream) and another with a high concentration of remaining salts (the brine or concentrate). Most of
industrial desalination technologies use either phase change or involve semipermeable membranes to separate
the solvent or some solutes (Xevgenos et al., 2018). The final selection of the proper desalination process
depends on conditions of the installation site, including the salt content of the feed water, economic issues, the
quality of water needed by the end-user, and on the local engineering experience and available techniques
(Berkün, 2016).
Desalination techniques may be classified into the following categories (Xevgenos et al.,2016):
phase-change or thermal processes,
membrane or single-phase processes; and
hybrid processes.
29%
2%
60%
5%2%2%
Industry
Irrigation
Municipality
Power
Tourist
other
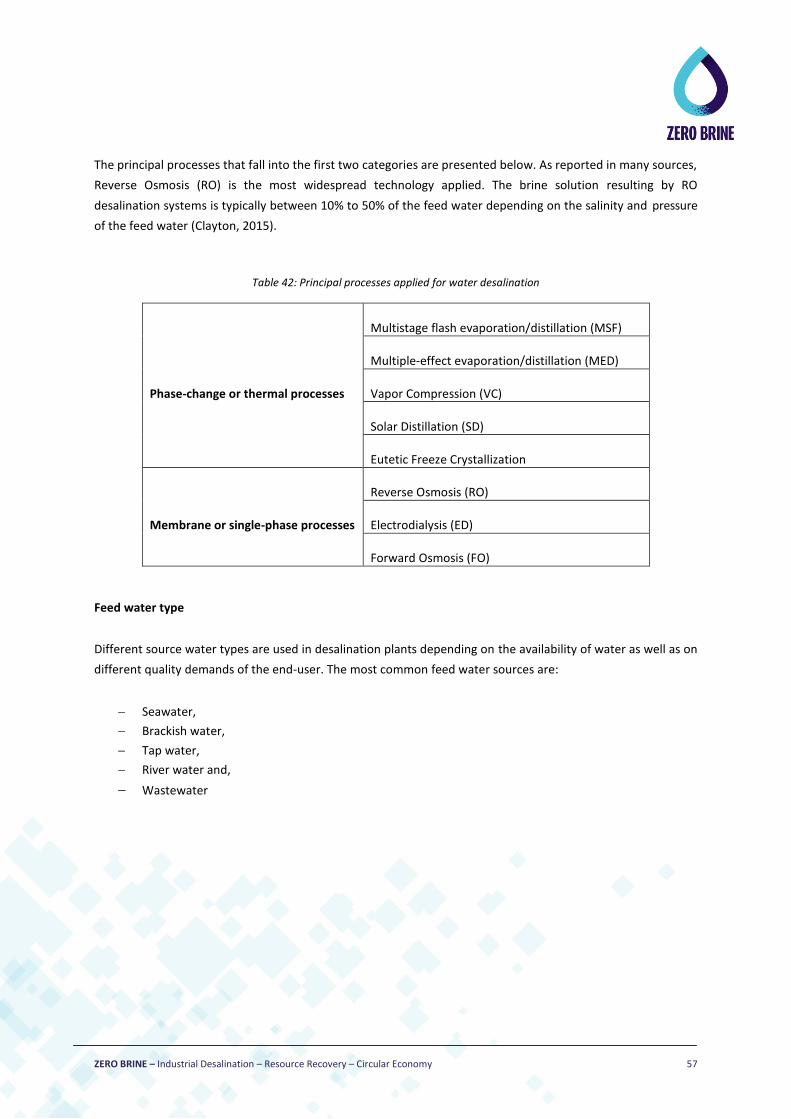
ZERO BRINE – Industrial Desalination – Resource Recovery – Circular Economy 57
The principal processes that fall into the first two categories are presented below. As reported in many sources,
Reverse Osmosis (RO) is the most widespread technology applied. The brine solution resulting by RO
desalination systems is typically between 10% to 50% of the feed water depending on the salinity and pressure
of the feed water (Clayton, 2015).
Table 42: Principal processes applied for water desalination
Phase-change or thermal processes
Multistage flash evaporation/distillation (MSF)
Multiple-effect evaporation/distillation (MED)
Vapor Compression (VC)
Solar Distillation (SD)
Eutetic Freeze Crystallization
Membrane or single-phase processes
Reverse Osmosis (RO)
Electrodialysis (ED)
Forward Osmosis (FO)
Feed water type
Different source water types are used in desalination plants depending on the availability of water as well as on
different quality demands of the end-user. The most common feed water sources are:
Seawater,
Brackish water,
Tap water,
River water and,
Wastewater

ZERO BRINE – Industrial Desalination – Resource Recovery – Circular Economy 58
Figure 5: Global Desalination Capacity by feed water type (based on Alvarado-Revilla et al.,2015)
Brine Composition
The characteristics of the concentrate resulting in desalination plants reflect the chemical constituents of the
feedwater. The MSF effluents are approximately 1.1 times more concentrated than the original feedwater
( Alameddine & El-Fadel 2007). On the other hand, RO desalination effluents can be 2 times more concentrated
than the original feedwater (Alameddine & El-Fadel 2007). Brine stream contains 2 or 4-5 folds the salinity of
the feed water in case of seawater and brackish water respectively (Elsaid et al., 2012). Brine derived from
desalination processes, along with diluted salts existing in the feed water, can contain residues of
pretreatment and cleaning chemicals, their reaction byproducts and heavy metals occurred originating from
corrosion as indicated and explained in the table 41.
As shown in figure 5 seawater represents worldwide the most common feed water in desalination plants.
Seawater comprises a complex solution of water containing nearly all elements of the periodic table in varying
amounts (Geertman, 2000). However it can be characterized sufficiently by the following six elements, since
these represent more than 99% of the dissolved solids: chloride (Cl-), sodium (Na+), sulfate (SO42-), magnesium
(Mg2+), calcium (Ca2+), and potassium (K+). The composition of seawater is illustrated in Figure 6.
62%20%
4%
9%
5%
Global Desalination capacity
83 million m3/day
Seawater
Brackish water
Pure or tap water
River
Wastewater

ZERO BRINE – Industrial Desalination – Resource Recovery – Circular Economy 59
Figure 6: Chemical composition of seawater with salinity of 35% (Illustrated in 1kg of seawater)
In the following table the mineral composition of seawater is shown.
Table 43: Indicative composition of important minerals in seawater (data taken from: Hultman, 2011)
Species Concentration (g l-1)
NaCl 27.319
MgCl2 4.176
MgSO4 1.668
MgBr2 0.076
CaSO4 1.268
Ca(HCO3)2 0.178
K2SO4 0.869
B2O3 0.029
SiO2 0.008
Iron/Alumina 0.022
Alameddine, & El-Fadel (2007) made a comparison between source feed water (seawater) and brine effluent
from different desalination plants as shown in table 41.
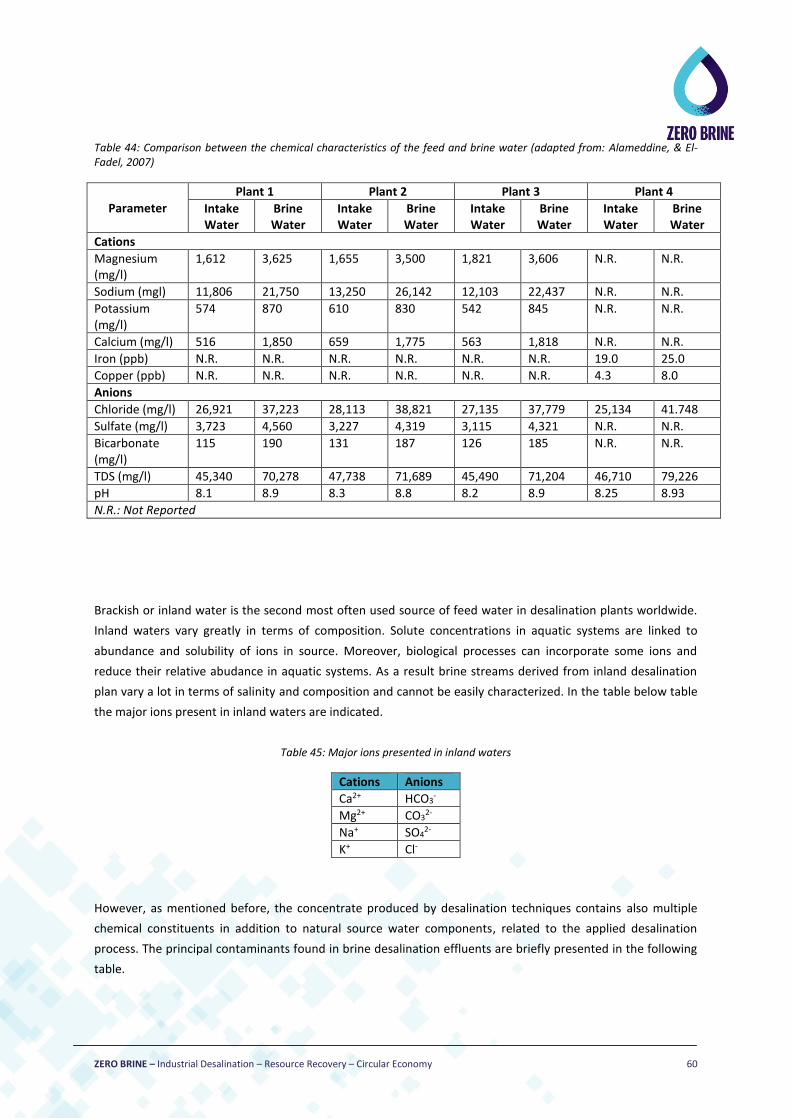
ZERO BRINE – Industrial Desalination – Resource Recovery – Circular Economy 60
Table 44: Comparison between the chemical characteristics of the feed and brine water (adapted from: Alameddine, & El-Fadel, 2007)
Parameter
Plant 1 Plant 2 Plant 3 Plant 4
Intake Water
Brine Water
Intake Water
Brine Water
Intake Water
Brine Water
Intake Water
Brine Water
Cations
Magnesium (mg/l)
1,612 3,625 1,655 3,500 1,821 3,606 N.R. N.R.
Sodium (mgl) 11,806 21,750 13,250 26,142 12,103 22,437 N.R. N.R.
Potassium (mg/l)
574 870 610 830 542 845 N.R. N.R.
Calcium (mg/l) 516 1,850 659 1,775 563 1,818 N.R. N.R.
Iron (ppb) N.R. N.R. N.R. N.R. N.R. N.R. 19.0 25.0
Copper (ppb) N.R. N.R. N.R. N.R. N.R. N.R. 4.3 8.0
Anions
Chloride (mg/l) 26,921 37,223 28,113 38,821 27,135 37,779 25,134 41.748
Sulfate (mg/l) 3,723 4,560 3,227 4,319 3,115 4,321 N.R. N.R.
Bicarbonate (mg/l)
115 190 131 187 126 185 N.R. N.R.
TDS (mg/l) 45,340 70,278 47,738 71,689 45,490 71,204 46,710 79,226
pH 8.1 8.9 8.3 8.8 8.2 8.9 8.25 8.93
N.R.: Not Reported
Brackish or inland water is the second most often used source of feed water in desalination plants worldwide.
Inland waters vary greatly in terms of composition. Solute concentrations in aquatic systems are linked to
abundance and solubility of ions in source. Moreover, biological processes can incorporate some ions and
reduce their relative abudance in aquatic systems. As a result brine streams derived from inland desalination
plan vary a lot in terms of salinity and composition and cannot be easily characterized. In the table below table
the major ions present in inland waters are indicated.
Table 45: Major ions presented in inland waters
Cations Anions
Ca2+ HCO3-
Mg2+ CO32-
Na+ SO42-
K+ Cl-
However, as mentioned before, the concentrate produced by desalination techniques contains also multiple
chemical constituents in addition to natural source water components, related to the applied desalination
process. The principal contaminants found in brine desalination effluents are briefly presented in the following
table.

ZERO BRINE – Industrial Desalination – Resource Recovery – Circular Economy 61
Table 46: Brine constituents resulted by desalination process.
Contaminant Characteristics Type Reference
Antiscalling additives Used to remove the scales formations
Polymeric substances such as polyphosphates, phosphonates and polycarbonic acids, orthophosphates Membrane desalination plants
Lattemann &Höpner (2003)
Antifouling additives
Used to hinder the potential of bacterial, algal and other marine organisms to foul the desalination plant
Chlorine, hypochlorite, sodium hypochlorite, calcium hypochlorite, ozone
Alameddine & El-Fadel (2007)
Coagulatnts/ Flocculants
Used to bind together particulate and colloidal matter so they may be filtered from the feed before the membrane process. Prevents Fouling and Clogging of the Membranes
Ferric chloride, ferric sulphate, polyelectrolytes
Lattemann &Höpner (2003)
Ladewig, B., & Asquith (2012)
Antifoaming additives Used to prevent foam formation in MSF units
Polyglycol blends Lattemann &Höpner (2003)
Corrosion products (heavy metals)
Resulted mainly in MSF plants from the corrosion of copper alloy tubing. The copper concentration increases under high operation temperatures in thermal desalination plants.
Copper (the most significant heavy metal discharged from desalination plants) , iron, nickel, chromium, zinc, molybdenum
Alameddine & El-Fadel (2007)
Acids in pretreatment – pH adjustment
Used mainly as an antiscalant and can produce effluents with significant low pH values
Sulphuric acid, hydrochloric acid
Lattemann &Höpner (2003) Ladewig & Asquith (2012)
pH Adjustment to 7 at post-treatment
Prevent Corrosion in Distribution System, Protect Aquatic Life in case of Surface Discharge Increase sodium level in produced water and brine concentrate
Caustic soda, soda ash, lime
Lattemann &Höpner (2003)

ZERO BRINE – Industrial Desalination – Resource Recovery – Circular Economy 62
Summarizing all the above mentioned information regarding brine effluents generated at desalination plants,
the key parameters for the characterization of these streams are presented in the following table.
Table 47: Key parameters for desalination wastewater characterization
Anions Other parameters
SO42-
TDS / electric conductivity Cl-
Cations pH
Ca2+ Temperature
Mg2+ Other impurities
Na+ Contaminants/impurities
K+
4.2.6.3 Industrial water production
Several industries use water processed to high quality resulting to a concentrate stream with a high salt
content.
As indicated in figure 5 the second end-user of desalinated water after municipalities (for drinking water
purposes) are industries. According to WssTP (2012), the principal end-users of desalinated water for industrial
use are:
-food industry, -agriculture for green house irrigation and, -chemical industry.
The feed water type in the industrial water production can be saline (seawater or brackish water) but also tap
water, if the process demands water of high quality.
The raw water is softened and/or demineralised using techniques like RO, nano-filtration or ion exchange (IE).
The resulted brine stream can be characterized by the parameters described in the previous section for
drinking water desalination (see table 25).

ZERO BRINE – Industrial Desalination – Resource Recovery – Circular Economy 63
4.2.6.4 Water softening - Ion exchange re generation
The ion exchange is a process mainly applied for hard waters softening. Hardwater is softened (for domestic
users), so as to reduce the amount of soap used, increase the life of water heaters, and reduce encrustation of
pipes (cementing together the individual filter media grains). The reduction of hardness is a common process in
water treatment sector. Chemical precipitation and ion exchange are the two predominant softening processes.
(Spellman, 2013)
The principal benefit of the ion exchange process is the production of a softer water in comparison with the
water softened by chemical precipitation. Moreover, an ion exchange process does not produce large quantity
of sludge as does the traditional lime–soda process. However, the major disadvantage of the process is the
production of a concentrated brine effluent. (Cheremisinoff, 2011)
In ion exchange processes, water passes through a bed of resin that adsorbs undesirable ions from the water,
replacing them with less undesired ions. The available ion exchange resins are natural and synthetic. Salt brine
is flushed through the resins and the sodium ions attach to the resin. Once the resin is charged, water passes
through the resin, and the resin exchanges the sodium ions attached to the resin with the undesired ions, thus
removing them from the water (Spellman, 2013).
When the resin has given up all of its donor ions, it is regenerated with strong salt brine (sodium chloride); the
sodium ions from the brine replace the adsorbed ions and restore the ion exchange capabilities.
(Cheremisinoff, 2011)
To be more specific, when hardness-causing cations such as calcium and magnesium ions replace the sodium
ions in the ion-exchange resin, the resin can no longer remove the hardness ions from the water. At this stage,
a concentrated solution (10 to 14% sodium chloride solution) is pumped on the resin in order to regenerate it.
When the resin is completely recharged with sodium ions, it is ready for softening again. The needed salt
dosage to prepare the brine solution ranges from 80 to 240 kg of NaCl/m3 resin (Spellman, 2013). The typical
concentration of brine solution used to regenerate the resins containing 10-15% of NaCl.
Characteristics of spent brine depend on the components adsorbed by the resins and also the initial salt
concentration (Ariono et al., 2016). In general, spent brine is characterized by high salinity (about 50g/l or
higher), hardness and in some cases organic compound content (Gryta et al., 2005). In the table below is
presented in the concentration of the major components in saline wastewater resulting from ion exchange
processes.

ZERO BRINE – Industrial Desalination – Resource Recovery – Circular Economy 64
Table 48: Concentration in saline wastewaters resulted from ion exchange processes.
Concentration (ppm)
Wastewater from cationic ion
exchanger Mixed wastewater from anion and cation
exchangers regeneration
Ions Gryta et al., 2005 Gryta et al.,
2016 Gryta et al., 2005
Ghasemipanah et al., 2013
Ca2+ 2,030 4,040 953 150
Mg2+ 1,380 1,730 310 20
Na+ 2,250 2,560 6,700 2,300
K+ 834 n.a. 187 6.5
Si- 73.3 112 40.7 1.5
Cl- 34,500 65,500 9,300 1,900
SO42- 119.5 37.1 1,010 2,600
The spent brine regenerant from the ion-exchange softening process, contains multivalent ions (Ariono et al.,
2016). The discharge of the spent brine regenerant into a disposal well requires attention to the scaling
tendencies in plumbing systems. Anti-scaling agent should be incorporated during the injection of the brine,
which increases the cost of discharge. In the case of organic matter contained in the spent brine Barranco et al.
(2001) mention that cannot be easily treated in conventional sewage systems. Since, the high concentration of
salts inhibits biological activities. For this reason salt tolerant microorganisms are required to digest the organic
substances.
4.2.6.5 Solar ponds
Solar ponds or solar salterns are traditionally applied for the production of salt (mainly NaCl) from seawater.
During water evaporation in solar ponds, various salts are precipitated in different stages. By this process, the
brine remaining in the ponds mainly contains magnesium chloride (MgCl2) after NaCl precipitation. (Ariono et
al., 2016) The remaining brine (known as bittern salt) is usually considered a byproduct. The disposal of the
bittern brine is not considered a serious environmental issue as it can be easily treated to recover valuable
components (Ahmad & Baddour, 2014). Further treatment of this brine stream can result in the recovery of
magnesium, potassium, bromide, boron, and other constituents as valuable products (Nayaka & Pandab. 2014).
4.2.6.6 Landfill Leachate
Municipal solid waste (MSW) landfill sites generate leachate effluents that must be treated in order to be
discharged properly. It is common, after the application of various processes, that the treated effluent is
subjected to a reverse osmosis process unit in order to obtain a pure water flow that can be reused or
discharged and a smaller flow containing the concentrated contaminants. This effluent has a high salt content
as it contains all the salts originally present in the leachates.
ZERO BRINE – Industrial Desalination – Resource Recovery – Circular Economy 65
4.2.7 Oil - Petroleum refinery (NACE code: C19.2)
4.2.7.1 General Information about the sector
Crude oil and natural gas as natural raw materials need to be treated in order to obtain the necessary
characteristics to turn to useful saleable products. For this reason, refining process is carried out. Both crude oil
and natural gas are natural hydrocarbons and are found in many and different areas of the world, in a variety
of composition and quantities. These hydrocarbons are transformed into different products in refineries. Some
examples are the following:
1) Fuels for different means of transport (cars, ships, airplanes etc.)
2) Combustion fuels for heat and power generation for industrial, commercial and domestic use.
3) Raw materials for chemical and petrochemical industries.
4) Other products as paraffins/waxes, bitumen and lubricating oils.
5) Energy as by-product in the form of the heat (steam) and power (electricity).
The manufacturing of the aforementioned products requires the handling and processing of these raw
materials in a number of different refining facilities, either alone or as a mixture with biofuels. Refinery is the
combination of the processing units whose purpose is to convert natural gas and crude oil into products. The
size, the configuration and the complexity of a refinery is defined by the desirable characteristics of the final
product, the available crude oil quality and the requirements set by authorities. Consequently and as the
factors mentioned before vary from location to location, there are no identical refineries (BREF (b), 2015).
The total capacity of oil refineries is around 4,400 million tonnes per year while the number of refineries
worldwide is 655 (year of reference 2012). The world's largest refining region is Asia (25 %), followed by North
America and Europe (around 20 % each). The top refining countries in the world are the US, followed by China,
Russia and Japan (O&Gas Journal, 2011 and BREF (b), 2015).
General overview of refinery processes
In order to convert crude oil to usable petroleum products, refining is necessary and can be separated into two
phases and a number of supporting operations.
The first phase includes the desalting of the crude oil and the subsequent distillation into its various
components. A further distillation of the lighter components and naphtha is carried out to recover methane
and ethane for use as refinery fuel, LPG (propane and butane), gasoline-blending components and
petrochemical feedstocks. This light product separation is done in every refinery.
The second phase consists of three different types of ‘downstream’ process and includes: (i) breaking, (ii)
combining and (iii) reshaping fractions.

ZERO BRINE – Industrial Desalination – Resource Recovery – Circular Economy 66
The above processes change the molecular structure of hydrocarbon molecules either by breaking them into
smaller molecules, combining them to form larger molecules, or reshaping them into higher quality molecules.
The aim of these processes is to convert some of the distillation fractions into marketable petroleum products
through a combination of downstream processes.
Desalting process description
Desalting units are used for the removal of contaminants as water inorganic salts, sand, water-soluble trace
metals, silt, rust and other suspended solids from crude oil. These impurities are characterized as bottom
sediment (BREF (b), 2015, Pak & Mohammadi, 2008).
The crude oil salts are in the form of dissolved or suspended salt crystals in water emulsified with the crude.
The crude oil impurities and especially salts, can cause fouling and corrosion of heat exchangers and especially
in the crude distillation unit overhead system. Salts also can damage the activity of many catalysts used in the
downstream conversion processes, while sodium salts stimulate coke formation (BREF (b), 2015).
Desalting aims to wash the crude oil or heavy residues with water at high temperature and pressure in order to
dissolve, separate and remove the salts and other water extractable components. The feed of the desalter is
crude oil and/or heavy residues and reused and fresh water, while the output of the desalting process are the
stream of the desalted crude oil and the stream of contaminated water (brine). The water phase from the
crude distillation unit overhead and other used water streams are normally fed to the desalter as wash water.
The design of the desalter and the crude source play a very important role in the concentrations of inorganic
impurities in the cleaned stream.
There are two predominant methods of crude-oil desalting: (i) chemical separation and (ii) electrostatic
separation. For both methods, the extraction agent is hot water. The steps followed at a typical
desalting/dehydration plant operation are: separation of gravity settling, chemical injection, heating, adding of
fresh water, mixing and electrical coalescing (Al-Otaibi et al., 2005 and Pak, & Mohammadi, 2008).
In chemical desalting, water and chemical surfactants (demulsifiers) are added to the crude oil, then they are
heated so that salts and other impurities dissolve into the water or are attached to the water. At the end, they
settle out. Electrical desalting refers to the application of high-voltage electrostatic charges to concentrate on
suspended water globules in the bottom of the settling tank. When the crude oil has a large amount of
suspended solids are also added surfactants (Pak & Mohammadi, 2008)

ZERO BRINE – Industrial Desalination – Resource Recovery – Circular Economy 67
4.2.7.2 Water consumption and wastewater volume in petroleum desalting process
In the crude oil desalting process, the water that is used is either untreated or partially treated from other
refining processes. In the following table the typical operating conditions and the water consumption in the
desalters, depending on the type of crude oil used are presented.
Table 49: Typical operating conditions of the desalting process (data taken from: (BREF (b), 2015)
Crude oil density (kg/m3 at 15 oC) Water wash (% v/v) Temperature (oC)
<825 3 - 4 115 - 125
825 - 875 4 - 7 125 - 140
>875 7 - 10 140 - 150
The output wastewater of the desalter contributes a high percent to the total process wastewater (30 – 100
litres/tonne feedstock desalted) (BREF (b), 2015).
Brine Wastewater characteristics from desalting process
The wastewater generated from desalting process is an oily desalter sludge characterized by high temperature
and high salinity level. Typically, this wastewater is possibly the most polluted in the refinery and has awide
variety of pollutants in considerable amounts. This wastewater stream cannot be discharged without proper
treatment (BREF (b), 2015).
EPA18 states that the major salts that contribute to the salinity of brine from oil production contain mainly ions
of Na+, Ca2+, Cl-, Mg2+, HCO3- and SO4
2-. Additionally, Pak & Mohammadi (2008) mention sodium, calcium and
magnesium chlorides (NaCl, CaCl2 and MgCl2) are the main salts found in the wastewater generated from
desalting process.
The table below summarizes the key parameters and their approximate values based on different references.
Table 50: Composition of the wastewater generated in the desalting process
Water pollutants (mg/l) BREF (b) (2015) EPA (1997) Pak & Mohammadi (2008)
Suspended solids 50 – 100* N.A. N.A.
Oil/oil emulsions High N.A. N.A.
Dissolved hydrocarbons 50 – 300* N.A. N.A.
Phenols 5 – 30* N.A. N.A.
Benzene 30 – 100* N.A. N.A.
BOD High* N.A. N.A.
COD 500 – 2000* N.A. N.A.
Ammonia 50 – 100* N.A. N.A.
Nitrogen compounds (N-Kj) 15 – 20* N.A. N.A.
Sulphides (as H2S) 10* N.A. N.A.
18 https://nepis.epa.gov/Exe/ZyPURL.cgi?Dockey=50000HE9.TXT

ZERO BRINE – Industrial Desalination – Resource Recovery – Circular Economy 68
Na+ N.A. 12 000 – 150 000 65 633
Mg2+ N.A. 500 – 25 000 1 000
Ca2+ N.A. 1 000 – 120 000 8 350
Cl- N.A. 20 000 – 250 000 118 925
SO42 N.A. 0 – 3 600 216
HCO3- N.A. 0 – 1 200 153
K+ N.A. 30 – 4 000 N.A
Br- N.A. 50 – 5 000 N.A.
I- N.A. 1 - 300 N.A
Temperature (oC) 115 – 150* N.A. N.A.
*N.A. : Not applicable

ZERO BRINE – Industrial Desalination – Resource Recovery – Circular Economy 69
4.2.8 Paper and Pulp Industry (NACE code: C17.1)
4.2.8.1 General Information about the sector
The pulp and paper industry is one of the most important industrial sectors worldwide because of the
economic benefits that arise from this activity. At the same time, pulp and paper is one of the predominant
contributors of industrial water pollution. Additionally, pulp and paper industry is increasing rapidly. There is a
strong correlation between the increase in the consumption of paper products and the growth in the gross
national product (GNP). This means that the consumption of paper and board products is related to the
standards of living and the economic situation of the user populations. (BREF (d), 2015)
Europe’s role in global pulp and pare industry is very important, as Europe is the second largest producer after
North America (as indicated also in the following figure) and the third largest consumer of paper and board.
The production of wood pulp in Europe is about 41.8 million tonnes per year, which corresponds to 22% of the
world’s total pulp production (192.4 million tonnes) (BREF (d), 2015)
Figure 7: Pulp production per region in 2008 (Data taken from: CEPI (2009))
The principal types of pulp and paper mills are the following:
kraft pulp mills,
sulphite pulp mills,
mechanical and semi-mechanical pulp and paper mills,
mills processing paper for recycling, and,
non-integrated paper mills including specialty paper mills.
.
37%
25%
24%
11%
3%
North america
Europe
Asia
Latin America
Rest of world

ZERO BRINE – Industrial Desalination – Resource Recovery – Circular Economy 70
From the aforementioned groups of papermaking the most common in Europe is sulphate pulping covering a
percentage of 60% of total pulp production, followed by semi-chemical pulp that represents the 32% of total
pulp production and sulphite pulp that represents the 5% of the total pulp production.
In Europe, 192 pulp mills (of all kinds) are operating. Most mills (77 mills in total) use sulphate pulping.
Mechanical pulp is produced by 72 mills in Europe which are located in Finland (20), Germany (14), Sweden (9),
Norway (7), France (6), Italy (4) and Austria (4). The main producers of semi-chemical pulp (a total of 18 mills)
are Sweden (7), Finland (3), Italy (2) and the Netherlands (2) with single mills operating in some other countries
(BREF (d), 2015).
4.2.8.2 Wastewater generation from kraft pulp process
The sulphate or kraft process
The present report will focus on the sulphate process (or kraft process), as it is the most applied process in
Europe. Worldwide approximately 80% of the world pulp production arise from sulphate processes. On the
other hand, sulphite process has decreased and today only a 10% of the global production is obtained by this
method. In both techniques, the wood chips are cooked under pressure with a mixture of sodium sulphide
(Na2S) and caustic soda (NaOH) in order to break various ether bonds in the lignin. The inorganic chemicals that
are existing in the black liquor are recovered. The process stages of the sulphate (kraft) pulp processes are the
following:
Reception and storage of wood
Debarking
Wood chipping and screening
Cooking and delignification
Washing and screening
Oxygen delignification
Bleaching An overview of the input (raw materials and energy) and the output (products and major releases such as
emissions, waste, etc.) of the production of kraft pulp is presented in the following figure.
The way of delignification and bleaching defines the use of some chemicals. The release of these chemicals to
the environment is depended on the process design and operation (recirculation flows, recovery system e.t.c.)
and the wastewater treatment plant.
As it is shown in the figure below, the emissions to water coming from kraft pulp mills are generated from
different process stages.

ZERO BRINE – Industrial Desalination – Resource Recovery – Circular Economy 71
Figure 8: Mass stream overview of input and output of a kraft pulp mill (taken from BREF (d), 2015)
The oxygen-consuming organic substances (measured as BOD, COD and/or TOC) are predominant in the
effluent concentration. The bleach plant effluent (use of bleaching chemicals) contain AOX and chlorate.
Additionally, kraft pulp mill effluent contains substances with toxic effects on aquatic organisms when treated,
while emissions can affect the living species negatively, by decreasing the water transparency. Nitrogen and
phosphorous (nutrients) can cause eutrophication. Finally, metals extracted from the wood can end-up in the
effluents.
As noticed in the previous figure the two process stages that produce wastewaster including salts are (i) white
liquor preparation and (ii) bleaching. Description of the chemicals used and the wastewater generated from the
bleaching process follows. Bleaching process is a process with very large volume with high concentration of
pollutants. Almost 60-65% of wastewater is contributed to this section. Bleach effluent contains dissolved

ZERO BRINE – Industrial Desalination – Resource Recovery – Circular Economy 72
organic substances, chlorinated substances, chlorate, phosphorous, nitrogen and salts. Bleaching chemical can
end-up as pollutants (e.g. NaOH) in bleaching effluent.
Bleaching Process description
After the removal of spent cooking and dissolved wood organics, the pulp is produced as slurry. Then bleaching
process takes place in order to remove further lignin and to make the pulp whiter. Usually, bleaching is done in
different steps by the use of a combination of chlorine dioxide and oxygen-based chemicals. According to EPA
(2006) the vast majority of pulp is bleached. The number of stages for the bleaching of kraft pulp is usually four
to five, while recently the “three stage bleaching” is reaching ground. The chemicals that are commonly used
are oxygen (O2), sodium hydroxide (NaOH), chlorine dioxide (ClO2), hydrogen peroxide (H2O2) and sometimes
ozon (O3). In recent years paracetic oxide (CH3CO3H) is also available in market as a bleaching chemical. In EU,
hypochlorite (e.g. NaOCl) and chlorine (Cl2) have been phased out as primary bleaching chemicals. The
chemicals that are used for bleaching are summarized in the tables below (BREF (d) 2015, EPA 2009).
Table 51: The most common used bleaching chemicals (CEPI 1997 & EPA 2009)
Bleaching Chemicals
NaOH
O2
NaOCl
NaClO3
EDTA
SO2
MgSO4
CaO
Ca(OCl)2
H2SO4
Discharges from the bleach plant
The effluent of the bleach plant is the most polluted wastewater in a pulp mill. The bleach plant could be partly
or entirely a closed process, resulting to a substantial further reduction in discharge of nutrients, metals and
organic substances.
Chlorinated organic substances (AOX)
The mills in the EU have stopped the use of molecular chlorine for the bleaching and bleaching takes place with
chlorine dioxide bleaching sequences. There are also mills that have been adapted to market demands and
have completely eliminated the use of bleaching chemicals that contain chlorinated compounds by combining
oxygen delignification with an ozone stage and/or a peroxide stage (TCF pulp).
Chelating agents (EDTA/DTPA)
In order to achieve metal removal in bleaching process, a chelating treatment or an acid wash of the pulps
takes place. Chelating agents such as EDTA or DTPA are poorly biodegradable in normal conditions.

ZERO BRINE – Industrial Desalination – Resource Recovery – Circular Economy 73
Organic substances (COD or TOC)
The bleach plant is the main contributor of organic discharges (COD or TOC) in the pulp paper mills, as
mentioned before. Other processes that conclude to high organic load are wood handling, condensates,
spillage and washing losses.
Discharges of nutrients (nitrogen and phosphorous)
Normally, wood is a source of nutrients but sometimes it is necessary for the biological effluent to add
nutrients if deficient. Studies about nutrient issues show that in kraft pulp mills nitrogen discharges derive
mainly from the unbleached part of the process, while phosphorous discharges come from the bleach plant. In
general, the emissions from unbleached pulp production are lower than from bleached pulp mills.
Discharges of metals
In the bleach wastewater, metals from the wood are contained which come from the wood. The following table
shows typical discharges of metals coming from pulp mills. By increasing the degree of process closure, a
reduction in discharges of metals is possible.
Table 52: Typical discharges of metals from kraft pulp mills (BREF (d), 2015)
Concentration (g/ADt)
Process Cd Pb Cu Cr Ni Zn
Unbleached pulp 0.03 0.3 0.5 0.2 0.4 5
Bleached pulp 0.1 0.4 1 0.7 0.9 15
The key parameters to consider for the bleaching effluent characterization are presented in the following table.
Table 53: Key parameters for bleaching effluent characterization
Chemical elements (anions & cations) Other parameters
Na+ pH
Ca2+ Electric conductivity
Mg2+ COD
SO42- SS
OCl- Color
ClO3- AOX
Pb VOCs
Ni
Cu
Cd
Zn
Nitrogen
Phosphorous

ZERO BRINE – Industrial Desalination – Resource Recovery – Circular Economy 74
4.2.9 Leather industry (NACE code: C15.1)
4.2.9.1 General information about the sector
The activity of leather making consists of converting the skin or raw hide (which is a very putrscrible material)
into a stable material called leather. Leather is involved in the manufacturing of a wide range of products. The
process of leather manufacturing consists of both mechanical processes and complex chemical reactions.
Amongst these, the process stage that gives leather its stability and essential character is tanning. There is a
variety of desirable leather characteristics, such as: appearance, stability, water and temperature resistance,
permeability and elasticity, ect. These properties are achieved by tanning (preservation of hides and skins) and
by performing various steps of preparation and finishing.
As leather is a material that is used in the manufacturing of a wide range of products, different types of leather
are required to meet the standards for each application. Some of the sectors where leather is used are the
folowing: clothing, shoes, leather goods, upholstery for cars, boats and aircraft, furniture and many other items
in daily use.
The recent years, there is a continuous decrease of tanneries in EU. Comparatively to 1998 there were over
3,000 tanneries and almost 50,000 workers in the EU-15, in EU-27 the leather sector has shrunk to fewer than
3,000 enterprises and less than 50,000 workers. The following table shows the distridution of leather
manufacturing in European countries in 2007.
Table 54: Structure of the European leather Industry, 2007 (data taken from BREF (h) 2013)
Country Employees Companies Turnover
(thousand EUR) Exports
(%)
Production (thousand m2)
Cattle/calf Sheep/goat
Belgium 124 1 21742 94.70 492
Finland 147 12 19000 80.00
France 1721 62 296000 41.00 3490 3247
Germany 2125 30 440000 60.00 12000 500
Greece 476 68
Hungary 65 3 4200 67.20
Italy 17175 1496 5435578 67.00 126742 40603
Netherlands 380 15 85000 75.00 3500
Portugal
Slovenia
Spain 3974 140 851407 39.90 20950 11792
Sweden 430 4 76500 90.00 2400 80
UK 1300 25 220000 75.00 3890 2170
Lithuania 200 4 15000 90.00 750
Bulgaria 19
EU Total 28117 1879 7464427 70.90 170714 58392
Norway 102 2 19000 95.00 431
Switzerland
EU + EFTA 28219 1881 7483427 171145 58392

ZERO BRINE – Industrial Desalination – Resource Recovery – Circular Economy 75
Environmental relevance of the leather industry
Most of the processes in tanneries are carried out in water. Therefore, wastewater generation must be taken
into account in tanneries. Wastewater generated from tanneries is characterized by high chemical and
biochemical oxygen demand (COD and BOD), high salt and specific chemical used in tanning processes.
Applied processes and techniques
The following figure shows schematically the possible steps involved in leather production. It must be
mentioned that there is a high variation between tanneries as far as the process steps are concerned, reliant on
the type of leather that is produced.
Figure 9: Process steps in leather making (chromium tanning) (taken from: BREF (h) 2013)

ZERO BRINE – Industrial Desalination – Resource Recovery – Circular Economy 76
Figure 10: Main inputs and aqueous effluents (taken from: BREF (h) 2013)

ZERO BRINE – Industrial Desalination – Resource Recovery – Circular Economy 77
As it is shown in the figure above, in the beamhouse, the tanyard and the post-tanning areas are the ones that
generate wastewaters. Consequently, the present research will be focused in the wet processes that are
responsible for saline wastewater generation.
4.2.9.2 Main pollutants in leather manufacturing effluents
Salt (NaCl)
Sodium chloride (common salt) is a pollutant that is found in tannery effluents and mainly in the effluents
coming from the soaking and the tanning process. Sodium chloride arises usually in the effluent from soaking
process, if hides or skin. Additionally, it can be found in the effluent from the tanyard because of the use of salt
in pickling processes. The following figure shows the salt loads in effluents from various stages of processing:
Figure 11: Comparison of the mean chloride loads (taken from: Ludvik, 2000).
Sulphates (SO42-)
The deliming process is the main source of sulphate in tanneries. Additionally, sulphates come from other
processes as tanning and post-tanning. The oxidation of sulphides in the wastewater leads in formation of
sulphates.
The use of sulphuric acid, ammonium sulphate or products with high sodium sulphate contentin these
processes results in the presence of sulphates in the effluents. It has to be mentioned that many process
chemicals contain sodium sulphate. The following figure shows the sulphate loads in effluents from various
stages of processing.

ZERO BRINE – Industrial Desalination – Resource Recovery – Circular Economy 78
Figure 12: Comparison of the mean sulphate loads (taken from: Ludvik, 2000)
Sulphides (S2-)
Due to the use of sodium sulphide and hydrosulphide in the unhairing process, sulphides are found in tannery
effluents. The following figure shows the sulphide loads in effluents from various stages of processing:
Figure 13: Comparison of the mean sulphide loads (taken from: Ludvik, 2000)
Nitrogen (N)
Tannery wastewaters contain nitrogenous compounds which come mainly from ammonium salts used for
deliming and the breakdown products of proiteins that are removed from skins and hides during the unhairing
and liming process.
Ammonium (NH4+)
Deliming process is responsible for the ammonium in the wastewater from tanneries. The following figure
shows the ammonium loads resulting from various stages of processing.

ZERO BRINE – Industrial Desalination – Resource Recovery – Circular Economy 79
Figure 14: Comparison of the mean ammonium loads (taken from: Ludvik, 2000)
Chromium(III) salts (tanning agent)
Tanning process is the main source of chromium in water effluents. However, when chromium retanning takes
place, chromium is also contained in effluents generated from post-tanning processes. Additionally, leaching of
chromium (wet process steps following chromium tanning and retanning) is a source of chromium. The
following figure shows the chromium loads in effluents from various stages of processing.
Figure 15: Comparison of the mean chromium loads (taken from: Ludvik , 2000)
pH regulators
Acids, organic acids, buffering salts, or mixtures of these chemicals

ZERO BRINE – Industrial Desalination – Resource Recovery – Circular Economy 80
4.2.9.3 Tannery Wastewater generation
The composition of wastewater effluents varies a lot between tanneries. The most common parameters to
consider in order to set the requirements for waste effluents are COD , BOD5, SS, N-tot (total nitrogen), TKN
(total Kjeldahl nitrogen), NH4-N (ammoniacal nitrogen), P-total (phosphorus), sulphide (S2-), chromium (total),
grease and fat content, pH and temperature. Other parameters are Cl- (chlorides), SO42- (sulphates), TDS (Total
Dissolved Solids), AOX (adsorbable organic halogenated compounds), pesticides, surfactants, fish toxicity and
phenols but are not as common. The following table shows the wastewater loads (before treatment) per tonne
of raw hide:
Table 55: Wastewater loads (before treatment) per tonne of raw hide achieved by good practice (data taken from: BREF (h) 2013)
Unit Soaking Unhairing
Deliming-bating
Pickling-tanning
Wet after treatments
Various Total
Water consumption
(m3/t) 2 5 2.5 0.5 2 3 15
Total solids (kg/t) 35 70 20 80 30 10 245
Suspended solids
(kg/t) 10 19 6 7 7 1 50
BOD (kg/t) 12 20 5 3 6 0 46
COD (kg/t) 23 45 12 8 13 1 102
Total Kjeldahl Nitrogen
(kg/t) 2 2.5 1.1 0.5 0.1 0 6.2
Ammonia Nitrogen
(kg/t) 0 0.3 0.2 0.1 0.1 0 0.7
Sulphide (kg/t) 0.7 0.03 0.7
Chromium (kg/t) 0.1 0.15 0.25
Chloride (kg/t) 5 3 1 28 3 2 42
Sulphate (kg/t) 2 16 4 1 23
Grease and oil (kg/t) 5 1.5 2 0.1 8
The following table shows the water consumption in different process stages.
Table 56: Wastewater discharge in individual processing operations (data taken from: Ludvik, 2000)
Process stage Wastewater volume
(m3 per tonne of raw hide)
Soaking 2
Liming 4.5
Deliming, bating 2
Tanning 0.5
Post-tanning 3
Finishing 0
Total 12

ZERO BRINE – Industrial Desalination – Resource Recovery – Circular Economy 81
In the present research, the focus will be in soaking, liming, deliming-bating, tanning and post tanning
processes as they generate the effluents with possible high concentrations of ions such as Na+, Cl-, NH4+, CO3
2-,
Ca2+, SO42-, OCl-, S2-, HSO3
- and Cr6+ .
4.2.9.4 Salts as raw materials in different process and operation stages
Leather industry consumes different salts in their process. Basing on BREFs the salts that are used in leather
industries for different processes and operations are the following:
Table 57: Salts and their use in leather industry (data taken from: BREF (h) 2013)
Salt name Formula Process stage Operation Use
Sodium chloride NaCl
curing beamhouse
biostat pickling
Chromium tanning tanyard
Sodium silicofluorade Na2SiF6
curing Post-tanning biocide
bleaching
Sodium hypochlorite NaOCl
soaking beamhouse
Sodium bisulphite NaHSO3
soaking beamhouse
Deliming & Bating beamhouse
neutralisation Post-tanning
Sodium carbonate Na2CO3
soaking beamhouse
bleaching Post-tanning
neutralisation Post-tanning
Liming & unhairing beamhouse Sharpening agents
tanning tanyard
Sodium sulphide Na2S
Liming & unhairing
beamhouse
Painting
Chrome tanning tanyard
Sodium hydrogen sulphide NaHSO3
Liming & unhairing beamhouse
Painting
Calcium Chloride CaCl2
Liming & unhairing beamhouse Sharpening agents
Ammonium Chloride NH4Cl Deliming & Bating beamhouse
Ammonium Sulphate (NH4)2SO4 Deliming & Bating beamhouse
Sodium sulphate Na2SO4 pickling beamhouse
Potassium chloride KCl
pickling beamhouse
Sodium bicarbonate NaHCO3
Chrome tanning tanyard
bleaching Post-tanning
neutralisation Post-tanning
Aluminium salts Mineral tanning tanyard
Zirconium sulphate Zr(SO4)2 Mineral tanning tanyard
Chromium sulphate Cr2(SO4)3 Chrome tanning tanyard
Ammonium bicarbonate NH4HCO3 neutralisation Post-tanning
Sodium triosulphate Na2S2O3 neutralisation Post-tanning

ZERO BRINE – Industrial Desalination – Resource Recovery – Circular Economy 82
Curing
Curing is a preservation process where salting of hides and skins takes place. Typically the sodium chloride used
is 15% of the salted hide weight. Another preservation technique is brining which is mainly used in US and
involves dragging the hides through a salt solution. Sometimes, the salts may include biocides (e.g. sodium
silicofluoride) to prevent the growth of salt tolerant bacteria but this is not very common in Europe.
Soaking
Soaking is a process where the skins and hides are soaked in processing water filled vessels. The water
consumption may be between 200% and 3000% of the hides and skin. In certain cases, biocides are used so as
to minimize the bacterial damage to the hides and the production of foul odours. The biocides are added
particularly if the soaking is taking place at an elevated temperature, at a rate about 0.1% of the hide weight
(Sharphouse, 1983). Additionally, other substances such as surfactants, enzymes and alkali may be added in
order to achieve higher efficiency in the soaking process. Sodium hypochlorite (Rydin & Frendrup, 1993) is
added, although it can cause problems with the presence of AOX in wastewater effluents. Instead of sodium
hypochlorite (Rydin & Frendrup, 1993), weak acids (e.g. formic acid or sodium bisulphite) can be used. In
general, alkali, biocides for example sodium carbonate or caustic soda, surfactants and enzymes are added
each in amounts of less than 1% of the weight of the salted hides and skins. If the hides and skins were
preserved, the effluent contains most of the salt and biocides which were on the hides. The salinity of the soak
liquor varies from 11 200 to 23600 mg/l (as Cl).
The following table shows the main pollutants and parameters to consider (based on the research of BREF (h)
2013 & Cooman et al. 2002) for wastewater generated from soaking process:
Table 58: Key parameters for soaking process wastewater characterization
Anions Other Parameters
Cl- pH
OCl- Electric conductivity
CO32- COD
SiF62- BOD
HSO3- TS
Cations TDS
Na+
EC Organic nitrogen
AOX
Emulsifiers, sufractants, biocides
Liming and unhairing
The incoming raw material will affect the environmental impact of the liming and unhairing process of hides
and skins. Generally, the unhairing and liming of hides takes place in the same float. The use of alkali and

ZERO BRINE – Industrial Desalination – Resource Recovery – Circular Economy 83
sharpening agents is required in order to attack the hairs. The most common recipe is the fοllowing: 150-400%
water, 1-5 % Na2S (or plus NaHS), 3-6% hydrated lime. Water consumption, including the rinsing afterwards, is
considerable (almost a quarter of overall consumption in the tannery). The following table shows the main
parameters and pollutants to consider for the liming and unhairing process.
Table 59: Key parameters for liming and unhairing process wastewater characterization
Anions Other Parameters
S2- pH
Cl- EC
CO32- TDS
Cations TS
Ca2+ SS
Na+ BOD
COD
NH4+ Grease and oil
TKN
Sodium hydroxide, sodium carbonate and calcium chloride can also be used as 'sharpening' agents. The
concentration of chemicals varies greatly depending on the type of raw stock processed. For example, small
calfskins will require higher chemical concentrations to achieve successful hair removal.
The wastewater generated from liming and unhairing is characterized by high COD and sulphide concentration
values. Additionally, high suspended solids loading is observed in this wastewater and it is estimated that the
effluent coming from the liming process contains more than 50% of total suspended solids and more than 70%
of BOD loading comes from the beamhouse (preparation area) (Rydin & Frendrup, 1993).
Deliming and bating
Deliming agents and a combination of washes is used to reduce the alkalinity and to remove the calcium from
limed hides. Washing can remove the calcium held on the surface of the hides. Also, deliming salts (e.g.
ammonium chloride, ammonium sulphate and organic ammonium salts) can further reduce pH (BASF 1997).
The amount that is added is about 2-3% of the weight of raw hides (Spain 1997, Frendrup 1999), but also a use
of 2.5-4% has also been reported reported (Pearson et al. 1999).
Emissions
If the pH is adequately low, sulphides carried over with the hides from the liming give rise to free hydrogen
sulphide in the drum. This happens in the case of deliming with the use of CO2. Additionally, there is a large
contribution of the ammonium salts to the total NH4-N release (Frendrup 1999).
The following table presents the key parameters and pollutants to consider (based on the research of BREF (h)
2013, Abdallh et al., 2016 , Das et al., 2008) for the deliming – bating process:

ZERO BRINE – Industrial Desalination – Resource Recovery – Circular Economy 84
Table 60: Key parameters for deliming-bating process wastewater characterization
Anions Other Parameters
Cl- pH
S2- Electric Conductivity
SO4 2- TS
HSO3 - SS
Cations TDS
Ca2+
COD
BOD
ΑΟΧ
NH4-N
Tanyard operations
Pickling
Several quality requirements exist for the leathers such as softness, strength and suppleness. For this purpose,
the pickling of hides and certain skins with acid and salt is necessary for their preparation and for the tanning
process. Usually, during the pickling process sulphuric acid and sodium chloride (NaCl) are added to the
delimed pelts. In general, there are different combinations of acids added to the pickle, the choice depending
on the type of tanning employed and the desired properties of the tanned leather. As mentioned before, the
most used acid is sulphuric formic acid. There also other acids used in pickling process including hydrochloric
acid, boric acid and other weak organic acids.
The quantities of acids used are a 0.5% - 3% of the weight of the raw materials, while the quantities of salts are
used in concentrations from 6% (bovine hides) to 14% (mainly pickled pelt skins). Instead of sodium chloride,
potassium chloride and sodium sulphate can be used.
4.2.9.5 Wastewater from pickling process
The wastewater generated from pickling is acidic with a pH value at about to 2 (pH=2) and has a very high salt
concentration. This wastewater stream has the second higher salinity level after the soaking effluent, in the
tannery. The following table shows the pollutants/parameters to consider (based on the research of Galiana-
Aleixandre, 2005 and BREF(h), 2013) for the wastewater characterization.

ZERO BRINE – Industrial Desalination – Resource Recovery – Circular Economy 85
Table 61: Key parameters for pickling effluent characterization
Anions Other Parameters
Cl- BOD
SO42- COD
Cations pH
Na+ TDS
SS
K+ TSS
EC
Tanning
Tanning is a process where hides and skin are converted into non-putrescible material. This process includes
the introduction of tanning agents to the pelts. Depending on the quantity and the type of the tanning agent
that are added to the pelts, different leathers are produced. The following table shows the types of
tannage,main tanning agents and auxiliaries.
Table 62: Types of tannage, main tanning agents and auxiliaries (taken from: BREF (h) 2013)
Types of tannage Tanning agents used Auxiliaries used
Chrome tannage Basic sulphate complex of trivalent chromium
Salt, basifying (magnesium oxide, sodium carbonate, or sodium bicarbonate), fungicides, masking agents (e.g. formic acid, sodium diphthalate, oxalic acid, sodium sulphite), fatliquors, syntans, resins.
Other mineral tannages Aluminium, zirconium and titanium salts
Masking agents, basifying agents, fatliquors, salts, syntans, resins, etc.
Vegetable tannage
Polyphenolic compounds leached from vegetable material (e.g. quebracho, mimosa, oak)
Pretanning agents, bleaching and sequesting agents, fatliquors, formic acid, syntans, resins, etc.
Synthetic tannage (resin-syntans)
Sulphonated products of phenol, cresol, naphthalene, cresylics, polyacrylates, melamine resins, etc.
Fixing agents, either acid or alkali, fatliquors
Aldehyde tannage Glutaraldehyde and modified aldehydes
Alkali, bleaching agents, tanning agent carrier
Oil tannage Cod oil and marine oils Catalysts such as manganese, copper, or chromium. Sodium bicarbonate or other alkali, aldehydes, emulsifiers.

ZERO BRINE – Industrial Desalination – Resource Recovery – Circular Economy 86
The following table summarizes the parameters/pollutants (collected from different sources) to consider for
the characterization of tannery wastewaters (BREF (h) 2013, Tahiri et al. 2013, Cooman et al. 2003).
Table 63: Key parameters for tanning wastewater characterization
Anions Other Parameters
SO42- pH
Cl- Electric conductivity (EC)
Cations Turbidity (NTU)
Cr6+ TS
Na+ VSS
COD
BOD
TDS
TKN
NH4-N
SS
It has to be mentioned that these parameters are the same for the post tanning effluent characterization.

ZERO BRINE – Industrial Desalination – Resource Recovery – Circular Economy 87
4.2.10 Non-ferrous metal production (NACE codes: C24.4.2, C24.4.4)
4.2.10.1 General information about the sector
As reported by the European Commission, non-ferrous metals are important for EU’s manufacturing industries,
economic growth and sustainability. Non-ferrous metals have unique characteristics that allow their wide use.
These characteristics are: (i) low weight (aluminium) (ii) high conductivity (copper), (iii) resistance to corrosion
and (iv) non-magnetic property (zinc). Because of the last two properties, they are recognized from ferrous
materials. Non-ferrous metal are utilized in mechanical engineering, transport, aerospace, construction,
packaging, electricity and energy sector, electronics, and medical devices. (EU, 2018a )
Table 64: Kinds of non-ferrous metals
Copper (Cu) and its alloys
Aluminium (Al)
Lead (Pb)
Tin (Sn)
Zinc (Zn)
Cadmium (Cd)
Precious metals
Ferro-alloys
Nickel (Ni)
Cobalt (Co)
Carbon and graphite
4.2.10.2 Wastewater generation
Copper & its Alloys Production
The wastewater generated from primary copper production contains dissolved and suspended solids. These
suspended solids may include copper, lead, cadmium, zinc, arsenic, and mercury and also residues from mold
release agents (lime or aluminum oxides). In some cases fluoride is presented, leading to a low pH of the
effluent. Typically, the smelting process does not result in a liquid effluent other than cooling water,
wastewaters that come from scrubbers, wet electrostatic precipitators and cooling of copper cathodes. Sources
of wastewater include spent electrolytic baths, slimes recovery, spent acid from hydrometallurgy processes,
cooling water, air scrubbers washdowns, stormwater, and sludges from wastewater treatment processes that
require reuse/recovery or appropriate disposal. (WBG, 1998b)
In the BREF (BREF (e),2017) document for the Non-Ferrous Metals Industries, is reported that the wastewater
treatment is environmental beneficial if suspended and coarse particles, metals, acids, sulphates and fluorides
are removed, rendering it suitable for discharge or reuse.

ZERO BRINE – Industrial Desalination – Resource Recovery – Circular Economy 88
In an example industry described in BREF (e),2017, during the water treatment process weak acid from the acid
plant, bleed from the electrolytic refining, and wet scrubber water from the smelter secondary gas cleaning
and some surface water are collected together. The combined stream is processed in a central multistage
chemical water treatment plant consisting of three stages:
1) clean gypsum precipitation (treatment with lime milk, pH 1–1.3, flocculant, precipitation of clean
gypsum);
2) metal precipitation (treatment with lime milk, FeCl3, H2O2, flocculant and increase of pH to 9–10;
capture of metals by precipitation);
3) arsenic removal (treatment with lime milk, FeCl3 and H2O2 to capture the remaining arsenic, pH 6–8).
The inlet water composition varies depending on the concentrate quality, the off-gas properties and
the operation of the wet gas cleaning systems.
The inlet water composition varies depending on the quality of the concentrate, the off-gas properties and the
operation of the wet gas cleaning systems. The sludge produced is 6-7 t/h, with a moisture level of 40-50% and
a composition as shown in the below table.
Table 65: Sludge composition of copper production (based on BREF (e),2017)
Component Concentration (%)
CaSO4 30-35
As 1
Cu 1
Fe 1-2
Pb 1
Ni 0.1
Cd 0.1
Aluminium Production
The processes included in Aluminium production are in general dry processes. By melting light metals, salt slag
is generated. There are different ways to minimise the amount of salt flux used, as well as different treatment
techniques for salt and metal recovery. The output of a typical salt slag recycling process is NaCl and KCl that
can be used for internal valorization in secondary Al melter. When a “partial recycling process” takes place the
product resulting from the process is KCl (95% purity) that could be sold in fertilizer industry.
Table 66: Key parameters for non-ferrous metals wastewater characterisation
Anions Cations
SO4 2- Ca2+
Cl- Na+
Heavy metals K+
As Other parameters
Cu pH
Fe TDS
Pb SS
Ni Conductivity
Cd

ZERO BRINE – Industrial Desalination – Resource Recovery – Circular Economy 89
4.2.11 Iron & Steel Production (NACE codes: C24.1, C24.2, C24.3)
4.2.11.1 General Information about the sector
The steel industry has long held a strategic place in the EU economy, fostering innovation, growth, and
employment (EU, 2018b). Iron and steel have found uses in agriculture, construction, in the generation and
distribution of power, in the manufacturing of machinery and equipment, in household and in medicinal uses.
In 2006 steel production increased up to a world total of more than 1200 million tonnes (figure below) (BREF(f),
2013).
Figure 16: Crude steel production in Europe and worldwide since 1870 (Stahl, 2008)
According to BREF(f), 2013 document, there are four routes that are currently used worldwide for the steel
production:
Classic blast furnace/basic oxygen furnace route
Direct melting of scrap (electric arc furnace)
Smelting reduction
Direct reduction
Integrated steelworks consist of networks of interdependent material and energy flows between the various
production units:
sinter plants
pelletisation plants
coke oven plants
blast furnaces and basic oxygen steelmaking plants with Iron and Steel Production subsequent casting.
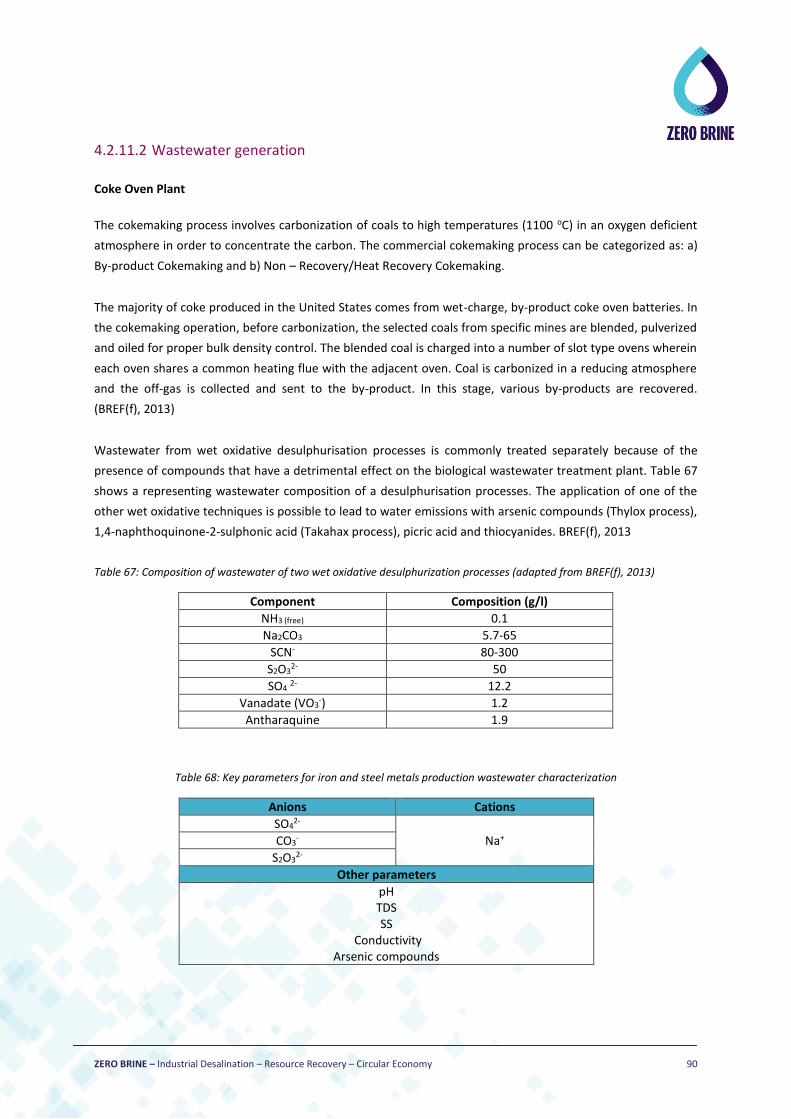
ZERO BRINE – Industrial Desalination – Resource Recovery – Circular Economy 90
4.2.11.2 Wastewater generation
Coke Oven Plant
The cokemaking process involves carbonization of coals to high temperatures (1100 oC) in an oxygen deficient
atmosphere in order to concentrate the carbon. The commercial cokemaking process can be categorized as: a)
By-product Cokemaking and b) Non – Recovery/Heat Recovery Cokemaking.
The majority of coke produced in the United States comes from wet-charge, by-product coke oven batteries. In
the cokemaking operation, before carbonization, the selected coals from specific mines are blended, pulverized
and oiled for proper bulk density control. The blended coal is charged into a number of slot type ovens wherein
each oven shares a common heating flue with the adjacent oven. Coal is carbonized in a reducing atmosphere
and the off-gas is collected and sent to the by-product. In this stage, various by-products are recovered.
(BREF(f), 2013)
Wastewater from wet oxidative desulphurisation processes is commonly treated separately because of the
presence of compounds that have a detrimental effect on the biological wastewater treatment plant. Table 67
shows a representing wastewater composition of a desulphurisation processes. The application of one of the
other wet oxidative techniques is possible to lead to water emissions with arsenic compounds (Thylox process),
1,4-naphthoquinone-2-sulphonic acid (Takahax process), picric acid and thiocyanides. BREF(f), 2013
Table 67: Composition of wastewater of two wet oxidative desulphurization processes (adapted from BREF(f), 2013)
Component Composition (g/l)
NH3 (free) 0.1
Na2CO3 5.7-65
SCN- 80-300
S2O32- 50
SO4 2- 12.2
Vanadate (VO3-) 1.2
Antharaquine 1.9
Table 68: Key parameters for iron and steel metals production wastewater characterization
Anions Cations
SO42-
Na+ CO3-
S2O32-
Other parameters
pH TDS SS
Conductivity Arsenic compounds
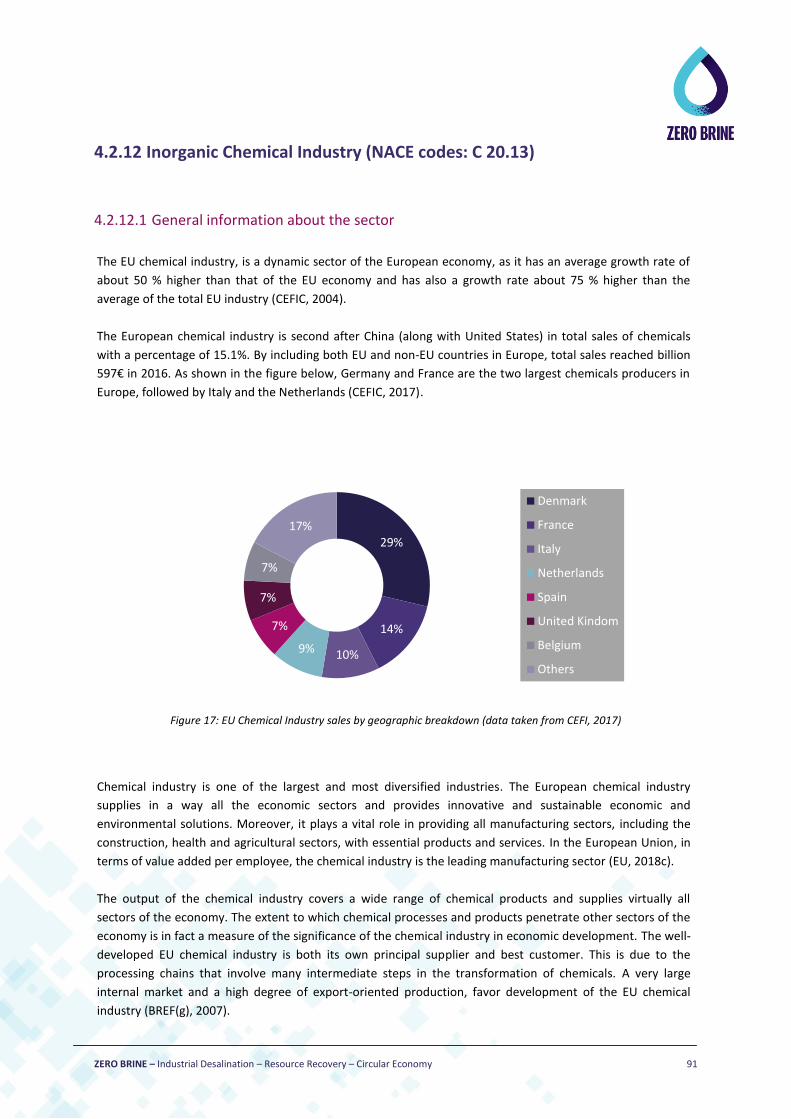
ZERO BRINE – Industrial Desalination – Resource Recovery – Circular Economy 91
4.2.12 Inorganic Chemical Industry (NACE codes: C 20.13)
4.2.12.1 General information about the sector
The EU chemical industry, is a dynamic sector of the European economy, as it has an average growth rate of
about 50 % higher than that of the EU economy and has also a growth rate about 75 % higher than the
average of the total EU industry (CEFIC, 2004).
The European chemical industry is second after China (along with United States) in total sales of chemicals
with a percentage of 15.1%. By including both EU and non-EU countries in Europe, total sales reached billion
597€ in 2016. As shown in the figure below, Germany and France are the two largest chemicals producers in
Europe, followed by Italy and the Netherlands (CEFIC, 2017).
Figure 17: EU Chemical Industry sales by geographic breakdown (data taken from CEFI, 2017)
Chemical industry is one of the largest and most diversified industries. The European chemical industry
supplies in a way all the economic sectors and provides innovative and sustainable economic and
environmental solutions. Moreover, it plays a vital role in providing all manufacturing sectors, including the
construction, health and agricultural sectors, with essential products and services. In the European Union, in
terms of value added per employee, the chemical industry is the leading manufacturing sector (EU, 2018c).
The output of the chemical industry covers a wide range of chemical products and supplies virtually all
sectors of the economy. The extent to which chemical processes and products penetrate other sectors of the
economy is in fact a measure of the significance of the chemical industry in economic development. The well-
developed EU chemical industry is both its own principal supplier and best customer. This is due to the
processing chains that involve many intermediate steps in the transformation of chemicals. A very large
internal market and a high degree of export-oriented production, favor development of the EU chemical
industry (BREF(g), 2007).
29%
14%
10%9%
7%
7%
7%
17%
Τίτλος γραφήματος
Denmark
France
Italy
Netherlands
Spain
United Kindom
Belgium
Others

ZERO BRINE – Industrial Desalination – Resource Recovery – Circular Economy 92
4.2.12.2 Wastewater generation – Soda Ash Production
Soda ash is a raw material of great importance for the glass, detergent and chemical industries and
consequently is of strategic importance in the European and global manufacturing framework (BREF(g), 2007).
The present European soda ash capacity is over 15 million tonnes per year, and of that approximately 7.7
million tonnes per year are produced in the EU-25 (CEFIC-ESAPA, 2004).
The major industrial process for the production of sodium carbonate (soda ash) is the Solvay process or
ammonia-soda (Kostick Dennis, 2006). The Solvay process is the process used in almost all European soda ash
plants. The typical plant capacity ranges from 160 to 1200 kt per year. The production of soda ash in Europe by
the Solvay process has been developing for over 140 years (BREF(g), 2007).
The large production capacity of the salts results in huge requirements of primary raw materials and also
energy, cooling water and a range of secondary raw materials, including ammonia are also required (BREF(g),
2007).
Use of raw materials
Sodium chloride (NaCl), Limestone (CaCO3) and Brine (NaCl with impurities) are the principal raw materials of
the Solvay process. Ammonia, is also used in the process and is principally totally regenerated and recycled.
Essentially, a high content of CaCO3 in the limestone used plays and an important role in order to avoid
problems associated to the limestone calcination and also to improve production efficiency.
As far as the raw brine is concerned, the basic selection criteria are (CEFIC-ESAPA, 2005): •maximum purity of salt, to avoid excessive purification costs and, • appropriate thickness of the deposit, allowing technically viable extraction and economic exploitation.
In the Solvay process, the NaCl reacts in a liquid phase. This is known as brine which has reached saturation
point (around 300 g NaCl/l). This brine contains impurities, mainly magnesium, calcium and sulphate. Purified
brine is produced during the brine purification procedure on the Solvay process.
A typical composition of raw and purified brine is given in the following table.
Table 69: Raw and purified brines (typical composition ranges) (CEFIC-ESAPA, 2004 &(BREF(g), 2007)).
Component Raw brine composition
(g/l)
Purified brine composition
(g/l)
Na+ 120-125 115-125
Cl- 186-192 180-190
SO42- 2.4-10 2.6-8.5
Ca2+ 0.8-1.7 0-0.2
Mg2+ 0-1.5 0-0.1
CO32- 0.4-0.9
OH- 0-0.3

ZERO BRINE – Industrial Desalination – Resource Recovery – Circular Economy 93
It should be noted that raw brine also contains heavy metals, however the importance of heavy metals in raw
brine is relatively low, at about 6 % of the total heavy metals entering the soda ash plant. Also, the heavy
metals content in raw brine varies over time.
The principal environmental impacts caused by the Slovay process are the atmospheric and aqueous emissions
associated with the calcination of limestone, carbonation of ammoniated brine and, predominantly, with the
wastewaters from the ‘distillation’ stage of the process In several EU-25 locations, the disposal of the post-
distillation liquid effluent without a proper post treatment is a significant environmental issue, because of the
the volume and composition of the post-distillation slurry (inorganic chlorides, carbonates, sulphates, alkali,
ammonia and suspended solids, including heavy metals). The discharge of wastewaters into a local low
flowrate water source is normally only possible after removal of suspended solids and possible pH adjustment,
if required by the local conditions. The solids (usually CaCl2) are then disposed off in settling ponds, a normal
practice in the EU-25 soda ash industry, provided that the measures prescribed for liquid effluent discharge
management are adopted and observed, to avoid the contamination of groundwaters by the leaking of chloride
solutions drained from settling ponds
The main sources of liquid effluent from the soda ash process are typically:
i. wastewater from the distillation (after treatment) and,
ii. wastewater from the brine purification.
Wastewater from distillation
Flowrates and concentrations of the major components present in the liquid outlet distillation are given in the
following table. These indicative ranges represent distiller effluent prior to any form of treatment and should
not necessarily be considered as levels or concentrations emitted to the environment.
Table 70: Wastewater from distillation (CEFIC-ESAPA, 2004).
Component Quantity (kg/t soda ash) Concentration
(kg/m3 post-distillation liquid)
Cl- 850-1100 99-115
OH- 9-30 1-2.7
SO42- 1-11 0.1-1.2
Ca2+ 340-400 39-45
Na+ 160-220 18-25
NH4+ 0.3-2.0 0.03-0.24
CaCO3 30-110 3.8-11
SO4 as CaSO4 15-90 1.7-7.1
Wastewater from brine purification
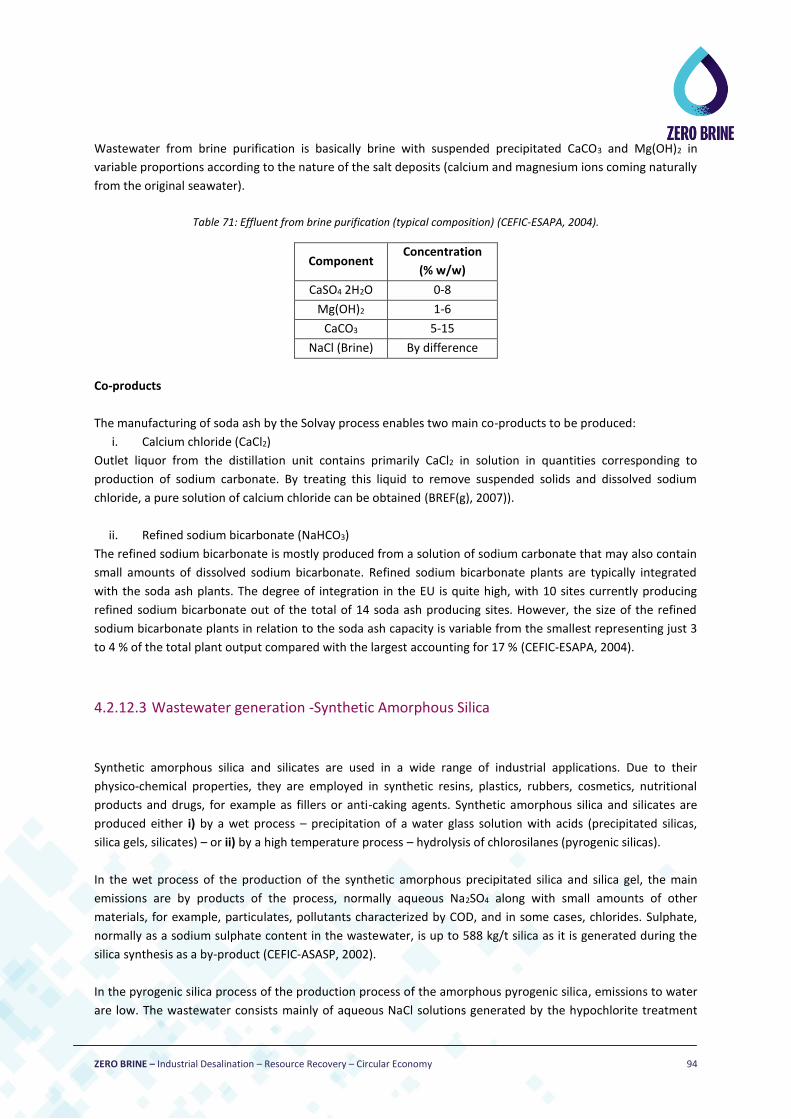
ZERO BRINE – Industrial Desalination – Resource Recovery – Circular Economy 94
Wastewater from brine purification is basically brine with suspended precipitated CaCO3 and Mg(OH)2 in
variable proportions according to the nature of the salt deposits (calcium and magnesium ions coming naturally
from the original seawater).
Table 71: Effluent from brine purification (typical composition) (CEFIC-ESAPA, 2004).
Component Concentration
(% w/w)
CaSO4 2H2O 0-8
Mg(OH)2 1-6
CaCO3 5-15
NaCl (Brine) By difference
Co-products
The manufacturing of soda ash by the Solvay process enables two main co-products to be produced:
i. Calcium chloride (CaCl2)
Outlet liquor from the distillation unit contains primarily CaCl2 in solution in quantities corresponding to
production of sodium carbonate. By treating this liquid to remove suspended solids and dissolved sodium
chloride, a pure solution of calcium chloride can be obtained (BREF(g), 2007)).
ii. Refined sodium bicarbonate (NaHCO3)
The refined sodium bicarbonate is mostly produced from a solution of sodium carbonate that may also contain
small amounts of dissolved sodium bicarbonate. Refined sodium bicarbonate plants are typically integrated
with the soda ash plants. The degree of integration in the EU is quite high, with 10 sites currently producing
refined sodium bicarbonate out of the total of 14 soda ash producing sites. However, the size of the refined
sodium bicarbonate plants in relation to the soda ash capacity is variable from the smallest representing just 3
to 4 % of the total plant output compared with the largest accounting for 17 % (CEFIC-ESAPA, 2004).
4.2.12.3 Wastewater generation -Synthetic Amorphous Silica
Synthetic amorphous silica and silicates are used in a wide range of industrial applications. Due to their
physico-chemical properties, they are employed in synthetic resins, plastics, rubbers, cosmetics, nutritional
products and drugs, for example as fillers or anti-caking agents. Synthetic amorphous silica and silicates are
produced either i) by a wet process – precipitation of a water glass solution with acids (precipitated silicas,
silica gels, silicates) – or ii) by a high temperature process – hydrolysis of chlorosilanes (pyrogenic silicas).
In the wet process of the production of the synthetic amorphous precipitated silica and silica gel, the main
emissions are by products of the process, normally aqueous Na2SO4 along with small amounts of other
materials, for example, particulates, pollutants characterized by COD, and in some cases, chlorides. Sulphate,
normally as a sodium sulphate content in the wastewater, is up to 588 kg/t silica as it is generated during the
silica synthesis as a by-product (CEFIC-ASASP, 2002).
In the pyrogenic silica process of the production process of the amorphous pyrogenic silica, emissions to water
are low. The wastewater consists mainly of aqueous NaCl solutions generated by the hypochlorite treatment

ZERO BRINE – Industrial Desalination – Resource Recovery – Circular Economy 95
with small amounts of other materials, giving minor particulates and COD contributions to the effluent
(BREF(g), 2007)).
A detailed characterization of the wastewater produced in the production process of precipitated silica was
carried out in the framework of the deliverable 4.1 of ZERO BRINE project. The results showed that the main
ions in solution were sulphate and sodium, which come from the reagents used in the production process. The
presence of Al, Fe and Si as well as the high turbidity of the effluents are inhibiting for the treatment of the
wastewater by nanofiltration.
4.2.12.4 Wastewater generation - Magnesium Compounds Production
Magnesium is the eighth most frequent element in the earth’s crust and the third most frequent element in
seawater. In industry, the most important magnesium minerals that are used are magnesium carbonate
(MgCO3, magnesite), calcium magnesium carbonate (CaCO3.MgCO3, dolomite), magnesium chloride (MgCl2) and
its double salt with potassium chloride (KCl. MgCl2.6H2O, carnallite), magnesium sulphate (MgSO4 . H2O,
kieserite) and magnesium silicates such as asbestos or olivine. Magnesium compounds are widely used to
produce metallic magnesium, refractories and insulating compounds, and find applications in the rubber,
printing ink, pharmaceutical and toilet industries (Ashton Acton, 2013).
As described in the BREF(g), (2007) document for an industry in the Netherlands used as an example,
approximately, 3 million m3 of wastewater are discharged every year by a pipeline to surface waters. Calcium
chloride brine from the magnesium hydroxide thickener has the largest concentration in this effluent. The
other effluent streams come from the purification of magnesium chloride, from the boron/sulphate reduction
and spent wash-water from the magnesium hydroxide washing process. The effluent contains ions of Mg2+,
Ca2+, K+, Na+, Cl-, SO42-, B3+ and also chromium (Cr) and zinc (Zn). Chromium and zinc come from the raw
materials used, and the other elements from the dolime magnesium chloride brine. The suspended solids
content is normally below 0.01 kg/m3 (BREF(g), 2007).
In the following table the mean concentrations and mean yearly load based on the average concentration and
flow in the magnesia plant of the Netherlands for the year 2002 are presented. In 2002 the magnesia plant in
the Netherlands discharged 3329400 m3/yr of which 340000 m3 was from a neighboring company. As
mentioned before, the load of wastewaters from MgO production is estimated to about 3 million m3/year.
(BREF(g), 2007)
Table 72: Emissions to water – mean concentrations and mean yearly load (the Netherlands) (InfoMil, 2004)
Mg2+ Ca2+ K+ Na+ Cl- SO42- B3+ Cr Zn
Conc. mg/l 2.5 0.064 0.032
Load kg/yr 213.5 105.5
Conc. g/l 0.33 21.11 0.54 2.21 41.99 0.37
Load tonne/yr 1099 70285 1785 7359 139807 1163 8.6

ZERO BRINE – Industrial Desalination – Resource Recovery – Circular Economy 96
Table 73: Key parameters for chemical industry wastewater characterization
Anions Cations
SO4 2- Ca2+
Cl- Na+
OH- K+
CO32- Mg2+
Other parameters NH4+
pH Other elements
TDS Cr
SS Zn
Conductivity Al
COD Fe
Turbidity Si

ZERO BRINE – Industrial Desalination – Resource Recovery – Circular Economy 97
4.3 Solution Providers
As defend also in the SBO, the solution providers will consist of the technologies for treating saline wastewater
proposed in ZERO BRINE project.
As described in Deliverable 5.1 “ Plans for shared use of the BEC modules by project partners”, the methods
applied for brine processing as it regards the technologies to be adopted are grouped in the following four (4)
categories:
ORganics (OR)
Brine Purification (BP)
Brine Concentration (BC)
Brine CRystallization (BCR)
Table 74: Technology toolbox of ZERO BRINE project
Technology Groups Technologies
Organics Adsorption with electrochemical destruction
Advanced oxidation (ozone/ hydrogen peroxide)
Brine purification / Ion Separation
Nanofiltration
Regeneration of membranes
Electrodialysis
Electrodialysis Metathesis/ ED with bipolar membranes
Ion exchange
Brine Concentration
Electrodialysis
Electrodialysis Metathesis
Membrane Distillation
Reverse Osmosis / UF / MF
Forward-feed MED evaporator*
Brine Crystallization Eutectic Freeze Crystallization (EFC)*
Crystallization with Ion Exchange Membranes (CrIEM)*
The information regarding the solution providers will be enriched at the time that the BECs and the case study
will be operational.

ZERO BRINE – Industrial Desalination – Resource Recovery – Circular Economy 98
4.4 End-users
Activity sectors using salts as raw material or water for different purposes and companies producing or
supplying salts or water in market are possible end-users interested in the Symbiotic Brine Ontology. The two
categories (salts/minerals and water) are going to be examined apart in the present report.
4.4.1 End-users of Minerals
Each chemical substance used in industries has certain technical specifications according to its use taking into
consideration the recipe of the process, environmental parameters etc.
Under REACH (EC1907/2006)19 regulation, “each manufacturer and importer of a substance is obliged to
provide a brief general description of the identified uses in his registration dossier. A use in this context means
any utilisation of a substance as such or in a mixture. Article 3(24) of the REACH legal text includes a definition
of use: “ use: means any processing, formulation, consumption, storage, keeping, treatment, filling into
containers, transfer from one container to another, mixing, production of an article or any other utilisation”.
This includes for example: formulation of mixtures, or production of an article” . (Guidance on Information
Requirements and Chemical Safety Assessment, Chapter R.12: Use description, Version 3.0, December 2015)20.
REACH also refers to the recovered substances and points out the following in the Guidance on waste and
recovered substances (ECHA, 2010):
“As soon as a material ‘ceases to be waste’, REACH requirements apply in principle in the same way as to any
other material, with a number of exceptions granted conditionally. The point at which waste ‘ceases to be
waste’ has been the subject of long debates. According to Article 6 (1) and (2) of the new Waste Framework
Directive, certain specified waste shall cease to be waste when it has undergone a recovery operation and
complies with specific criteria to be developed in line with certain legal conditions, in particular:
(a) the substance or object is commonly used for specific purposes;
(b) a market or demand exists for such a substance or object;
(c) the substance or object fulfils the technical requirements for the specific purposes and meets the existing
legislation and standards applicable to products; and
(d) the use of the substance or object will not lead to overall adverse environmental or human health impacts.”
In this context, it is clear that the technical characteristics (for specific uses) in the material recovery process
are of high importance. A recovered substance must be “useful” in market and consequently this implies that it
must have specific technical characteristics.
19 http://eur-lex.europa.eu/legal-content/EN/TXT/?uri=CELEX:32006R1907 20 https://echa.europa.eu/documents/10162/13632/information_requirements_r12_en.pdf

ZERO BRINE – Industrial Desalination – Resource Recovery – Circular Economy 99
Moreover, as each manufacturer of a substance must create a dossier in REACH providing information for the
suitability of specific uses of the substance, it is of high importance for brine owners who would like to recover
a material to know the required characteristics for its final use. For this reason, OBP aims to contribute in the
recovery process for raw materials, by giving to the brine owners a general idea about the technical
characteristics that are demanded in the market in different sectors and for different uses of the recovered
materials. At this point is very important to be clarified the meaning of use. REACH sets key elements to
describe a use as follows:
- Life cycle stage
- Use name and further description of use
- Identification of the markets in which the substance is used
- Description of the different activities contributing to the uses (from human health and environment
perspectives)
- Technical function of the substance in the use.
Table 75: Use descriptor category-related key elements according to REACH
Use descriptor category Related key element(s)
Life cycle stage (LCS) Life cycle stage
Sector of use (SU) Market description (sector of economy where the use takes place)
Product category (PC) Market description (type of product), Contributing activities (consumers)
Product category (PROC) Contributing activities (workers)
Environmental release category (ERC) Contributing activities (environment)
Article category (AC) Market description (type of article), Contributing activities (service life)
Technical function (TF) Technical function of the substance
For the SBO there will be used the key elements that have to do with market (SU, PC and AC) and the key
element TF, as it is assumed to be important to find out who are the users of the salts (SU), for which reason
they use them (AC and PC) and which are the technical functions (TF) of these salts. This information is useful
for those who recover raw material because it will be necessary to define the suitability of these materials for
specific uses as they are obligated by REACH. End-users set their technical specifications/restrictions according
the use of the mineral (SU, AC, TF, PC) and this way brine owners will have the possibility to know in advance
which characteristics must have the desirable recovery materials.
A brief description of the key elements (according REACH) follows:
SU: Sector of End-use
The categories for Sector of use are meant to provide information on the sector of the economy or market area
where the use takes place. Therefore, they indicate types of industries or industry segments where the
substance is present.

ZERO BRINE – Industrial Desalination – Resource Recovery – Circular Economy 100
PC: Product Category
The Chemical Product Categories as defined by REACH have two functions:
i) they describe the sectors formulating mixtures by mixture types (information relevant at formulation life-
cycle stage). The categories listed help to further structure the uses of the substance along the supply chain
based on the product types;
ii) they describe the product types used by the end-users (industrial, professional or consumer end-users). The
product type implicitly includes some information on the potential for exposure/release of the substance.
AC: Articles Category
The Articles Categories (AC) are designed to describe the types of article in which the substance is contained or
on which the substance has been applied.
TF: Technical Functions
The Technical Function categories (TF) are designed to describe the role that the substance fulfils when it is
used (what it actually does as such in a process or what it actually does in a mixture or article).
Requirements/Restrictions
As mentioned before, end-users could define the salt use taking into consideration the criteria of SU, TF, PC,
and AC as set by REACH. Subsequently, they will be asked to give information for the requirements/restrictions
they set for the use for the salt. The restrictions have to do with properties such as purity and chemical
characteristics of impurities. The Technical Specifications Sheets for the salts that are of concern in Symbiotic
Brine domain have been reviewed and all the parameters set are collected and presented in the table 88 of the
ANNEX.

ZERO BRINE – Industrial Desalination – Resource Recovery – Circular Economy 101
4.4.2 Water end-users and water recovery
The recovery of water from brine streams is very important. Although water is used for many purposes (such as
domestic use, for agricultural and industrial purposes etc), in the building of SBO we will focus on the use in
agriculture and in industry. These sectors are the ones to be considered as end-users and the principal quality
requirements are examined below.
4.4.2.1 Water used for irrigation
In EU οn average 44 % of total water abstraction is used for agriculture (EU, 2017)
Water quality denotes the characteristics of a water supply that will define if it is suitable for a specific use, i.e.
how well the quality meets the standards set for the need of the user. In order to define the quality, physical,
chemical and biological characteristics are taken into consideration (FAO, 1985). Application of low quality
water for irrigation purposes may result in accumulation of salts in the root zone, leading in loss of permeability
of the soil because of the excess sodium or calcium leaching, or in contaminants which are directly toxic to
plants or to those who consume them. In addition, if contaminants are accumulated in the soil, the soil will be
unsuitable for irrigation after years. If pesticides or pathogenic organisms are present in irrigation water, they
may not affect the growth of the plants, but will affect the suitability of agricultural products for consumption.
Food and Agriculture Organization of the United Nations (FAO) has published criteria for irrigation water, but
many countries have published their own criteria. From country to country, differences in the criteria can be
found because of the different annual application rates of irrigation water and local characteristics. (WHO,
2016)
The quality irrigation water used varies greatly depending on the type and the quantity of dissolved salts. Salts
concentration of irrigation water is quite low but significant. Salts in the water come from the dissolution or
weathering of the rocks and soil, including dissolution of gypsum, lime and other soil mineral that are slowly
dissolved. The salts are applied with the water and remain behind in the soil as the water evaporates or is used
by the crop. Except of the quantity of salts that defines the suitability of irrigation of water, the kind of salts
present plays also an important role. As the salt content increases, various soil and cropping problems arise.
The water suitability for use and quality are judged on the potential severity of problems that can be expected
to be developed during long-term use. (FAO, 1985)
Four problem categories are used for evaluation:
Salinity,
Infiltration,
Toxicity, and
Miscellaneous

ZERO BRINE – Industrial Desalination – Resource Recovery – Circular Economy 102
The following table presents the guidelines for the evaluation of irrigation water quality. The guidelines
emphasize the long-term influence of water quality on soil conditions, crop production and farm management
Table 76: Guidelines for interpretations of water quality for irrigation adapted from FAO 1985 and JRC 2017)
Potential Irrigation Problem Units
Degree of Restriction on Use
None Slight to
Moderate Severe
Salinity (affects crop water availability)
ECw dS/m < 0.7 0.7 – 3.0 > 3.0
(or)
TDS mg/l < 450 450 – 2000 > 2000
Infiltration (affects infiltration rate of water into the soil. Evaluate using ECw and SAR together)
SAR
= 0 – 3
and ECw
(dS/m)
= > 0.7 0.7 – 0.2 < 0.2
= 3 – 6 = > 1.2 1.2 – 0.3 < 0.3
= 6 – 12 = > 1.9 1.9 – 0.5 < 0.5
= 12 – 20 = > 2.9 2.9 – 1.3 < 1.3
= 20 – 40 = > 5.0 5.0 – 2.9 < 2.9
Specific Ion Toxicity (affects sensitive crops)
Sodium (Na)
surface irrigation SAR < 3 3 – 9 > 9
sprinkler irrigation me/l < 3 > 3
Chloride (Cl)
surface irrigation me/l < 4 4 – 10 > 10
sprinkler irrigation me/l < 3 > 3
Boron (B) mg/l < 0.7 0.7 – 3.0 > 3.0
Miscellaneous Effects (affects susceptible crops)
Nitrogen (NO3 - N) mg/l < 5 5 – 30 > 30
Bicarbonate (HCO3)
(overhead sprinkling only) me/l < 1.5 1.5 – 8.5 > 8.5
pH Normal Range 6.5 – 8.4
The following table shows the parameters for determinations and calculations needed to use the guidelines,
along with the symbols used.

ZERO BRINE – Industrial Desalination – Resource Recovery – Circular Economy 103
Table 77: Laboratory determinations needed to evaluate common irrigation water quality problems (FAO, 1985)
Water parameter Symbol Unit Usual range in
irrigation water
Salinity-Salt content
Electrical Conductivity ECw dS/m 0 – 3
(or)
Total Dissolved Solids TDS mg/l 0 – 2000
Cations and Anions
Calcium Ca2+ me/l 0 – 20
Magnesium Mg2+ me/l 0 – 5
Sodium Na+ me/l 0 – 40
Carbonate CO2-3 me/l 0 – .1
Bicarbonate HCO3- me/l 0 – 10
Chloride Cl- me/l 0 – 30
Sulphate SO42- me/l 0 – 20
Nutrients
Nitrate-Nitrogen NO3-N mg/l 0 – 10
Ammonium-Nitrogen NH4-N mg/l 0 – 5
Phosphate-Phosphorus PO4-P mg/l 0 – 2
Potassium K+ mg/l 0 – 2
Miscellaneous
Boron B mg/l 0 – 2
Acid/Basicity pH 1–14 6.0 – 8.5
Sodium Adsorption Ratio SAR (me/l) 0 – 15
The presence of phytotoxic trace elements such as, heavy metals, boron and pesticides may inhibit the growth
of plants or make the crop unsuitable for human consumption or other uses.
Table 78: Selected water quality criteria for irrigational waters (mg l-1) (FAO, 1985 WHO 2006;)
Element Concentration (mg/l)
Aluminium 5.0
Arsenic 0.1
Cadmium 0.01
Chromium 0.1
Copper 0.2
Manganese 0.2
Nickel 0.2
Zinc 2.0

ZERO BRINE – Industrial Desalination – Resource Recovery – Circular Economy 104
Moreover, according to the report of the JRC (2017) the Joint Research Centre (JRC) was asked by the European
Commission to develop and set the minimum quality requirements for water reuse in groundwater discharge
and agricultural irrigation. The purpose of this action was to foster water reuse as a core element in the
framework of Circular Economy. The core water quality requirements for water reuse in agricultural irrigation
that were proposed by JRC report are summarized in the following table:
Table 79: Minimum quality requirements for reclaimed water in agricultural irrigation (JRC, 2017)
Reclaimed water quality
Indicative technology
target
Quality criteria
E. coli (cfu/100 ml)
BOD5
(mg/l) TSS
(mg/l) Turbidity
(NTU) Additional
criteria
Class A
Secondary treatment, filtration and disinfenction (advanced water treatments)
≤ 10 ≤ 10 ≤ 10 ≤ 5
Legionella spp.: <1,000 cfu/l when there is risk of aerosolization in greenhouses. Intestinal nematodes (helminth eggs): ≤ egg/l when irrigation of pastures or fodder for livestock.
Class B Secondary treatment, and disinfection
≤ 100 According to Directive 91/271/EEC
According to Directive 91/271/EEC
-
Class C Secondary treatment and disinfection
≤ 1,000 According to Directive 91/271/EEC
According to Directive 91/271/EEC
-
Class D Secondary treatment and disinfection
≤ 10,000 According to Directive 91/271/EEC
According to Directive 91/271/EEC
-
4.4.2.2 Water Use in Industry sector
Industries can be considered as systems whose operation demands water for different uses. The suitability of
water in different industrial uses is defined by the parameters below (IWA, 1996)
the potential for causing damage to equipment (e.g. abrasion, corrosion)
problems that can be caused in the manufacturing process (e.g. color changes, precipitates)
damage of product quality (e.g. discoloration, taste)
complexity of waste handling as a result of using water of the quality available.
The following table presents the potential water-related problems associated with various industrial processes.

ZERO BRINE – Industrial Desalination – Resource Recovery – Circular Economy 105
Table 80: Potential water-related problems associated with various industrial processes (IWA, 1996)
Water Use Equipment damage Process problems Product problems Waste disposal
Cooling water
Corrosion Scaling Fouling Blockages
Foaming Sediments Gas production Odours HE impairment
pH TDS COD SS
Water for steam
generation
Resin film Resin poison Corrosion Scaling
Resin impairment Competition
Inadequate treatment
pH TDS
Process water
Corrosion Scaling Fouling Blockages Abrasion embrittlement Discoloration
Precipitates Foaming Color effects Gas production Interference
Sediment Foam Color Taste/odour Tarnish
SS Fe/Mn TDS
Product water
Corrosion Scaling Fouling Blockages
Precipitates Foaming Gas production Interference
Sediment Turbidity Foam Color Taste/odor Coagulation
Utility water
Corrosion Scaling Fouling Blockages Abrasion
Sediment Turbidity Foam Color Taste/odour Intestinal irritation Breath hazards
pH TDS SS Fe/Mn COD
Wash water
Corrosion Scaling Fouling Blockages Abrasion
contamination
Contamination blemishes Sediment Process solutions
pH TDS SS Fe/Mn COD
The water quality problems listed in the table above can be identified with constituents that contribute to
them. Frequently, water quality problems are associated not only with the presence of a variable but with the
interaction between variables, as is the case with corrosion and scaling. The table below indicates the
constituents which may be associated with water-related problems in industrial processes.

ZERO BRINE – Industrial Desalination – Resource Recovery – Circular Economy 106
Table 81: Constituents which may be associated with water-related problems in industrial processes (indicated with blue color) (IWA, 1996)
Problem pH Conductivity Total
Hardness Fe Mn Alkalinity SO4 Cl- SiO2 SS COD
Corrosion
Scaling
Fouling
Blockage
Abrasion
Embrittlement
Discoloration
Resin blinding
Foaming
Sediment
Gas production
Taste/odours
Precipitates
Turbidity
Color
Biological growth
4.4.3 Targeted products for the SB domain
Targeted products for the SB domain are the salts and minerals presented in the following table and water as
described in the previous section.
During the procedure of developing the SBO a research took place for the sectors that generate saline
wastewater. Most of them are also users of the salt that end up as pollutants. Additionally, studying ECHA
(European Chemical Agency) some information about the salts that are widely used was retrieved. This
research resulted in a list of targeted salts which includes salts that have been found in saline wastewaters, and
salts that are widely used.
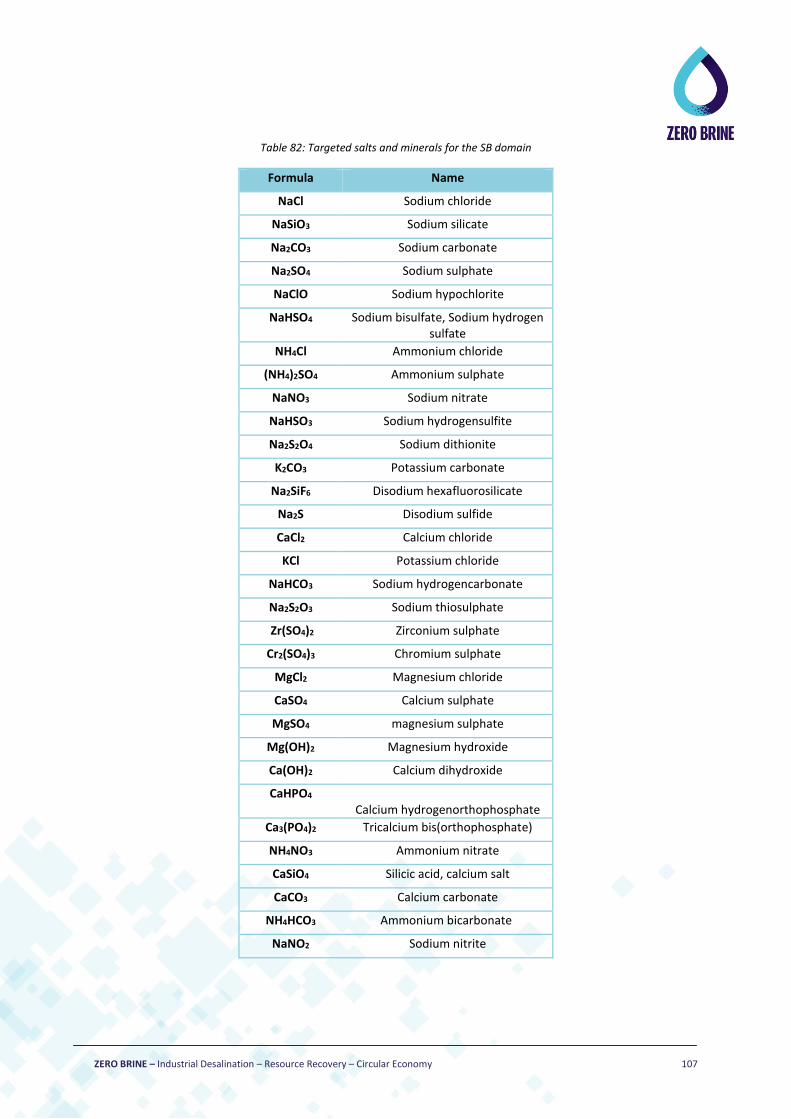
ZERO BRINE – Industrial Desalination – Resource Recovery – Circular Economy 107
Table 82: Targeted salts and minerals for the SB domain
Formula Name
NaCl Sodium chloride
NaSiO3 Sodium silicate
Na2CO3 Sodium carbonate
Na2SO4 Sodium sulphate
NaClO Sodium hypochlorite
NaHSO4 Sodium bisulfate, Sodium hydrogen sulfate
NH4Cl Ammonium chloride
(NH4)2SO4 Ammonium sulphate
NaNO3 Sodium nitrate
NaHSO3 Sodium hydrogensulfite
Na2S2O4 Sodium dithionite
K2CO3 Potassium carbonate
Na2SiF6 Disodium hexafluorosilicate
Na2S Disodium sulfide
CaCl2 Calcium chloride
KCl Potassium chloride
NaHCO3 Sodium hydrogencarbonate
Na2S2O3 Sodium thiosulphate
Zr(SO4)2 Zirconium sulphate
Cr2(SO4)3 Chromium sulphate
MgCl2 Magnesium chloride
CaSO4 Calcium sulphate
MgSO4 magnesium sulphate
Mg(OH)2 Magnesium hydroxide
Ca(OH)2 Calcium dihydroxide
CaHPO4 Calcium hydrogenorthophosphate
Ca3(PO4)2 Tricalcium bis(orthophosphate)
NH4NO3 Ammonium nitrate
CaSiO4 Silicic acid, calcium salt
CaCO3 Calcium carbonate
NH4HCO3 Ammonium bicarbonate
NaNO2 Sodium nitrite

ZERO BRINE – Industrial Desalination – Resource Recovery – Circular Economy 108
5 REFERENCES
Abdallh, M. N., & WalidSayedAbdelhalim, H. (2016). Biological treatment of leather tanneries wastewater
effluent-bench scale modeling. International Journal of Engineering Science, 9(6), 2272-2286.
Afonso, M. D., & Bórquez, R. (2002). Review of the treatment of seafood processing wastewaters and recovery
of proteins therein by membrane separation processes—prospects of the ultrafiltration of wastewaters from
the fish meal industry. Desalination, 142(1), 29-45.
Ahmad, N., & Baddour, R. E. (2014). A review of sources, effects, disposal methods, and regulations of brine
into marine environments. Ocean & coastal management, 87, 1-7.
Alameddine, I., & El-Fadel, M. (2007). Brine discharge from desalination plants: a modeling approach to an optimized outfall design. Desalination, 214(1-3), 241-260.
Alvarado-Revilla, F., Brown, H., Charamidi, M., Elkins, I., Filou, E., Gasson, C., Uzelac, J. (2015). Desalination markets 2016. United Kingdom: Media Analytics Ltd.
Al-Otaibi, M. B., Elkamel, A., Nassehi, V., & Abdul-Wahab, S. A. (2005). A computational intelligence based
approach for the analysis and optimization of a crude oil desalting and dehydration process. Energy & fuels,
19(6), 2526-2534.
Ariono, D., Purwasasmita, M., & Wenten, I. G. (2016). Brine Effluents: Characteristics, Environmental Impacts,
and Their Handling. Journal of Engineering and Technological Sciences, 48(4), 367-387
Ashton Acton (2013), "Magnesium Compounds—Advances in Research and Application: 2013 Edition",
ScholarlyEditions.
Barranco, C. R., Balbuena, M. B., Garcıa, P. G., & Fernández, A. G. (2001). Management of spent brines or osmotic solutions. Journal of food engineering, 49(2-3), 237-246. Barthe, P., Chaugny, M., Roudier, S., & Sancho, L. D. (2015). Best available techniques (BAT) reference
document for the refining of mineral oil and gas. European Commission.
BASF (1997) The ecological aspects of leather manufacture.
Batres, R., West, M., Leal, D., Price, D., Naka, Y. (2005). An upper ontology based on ISO (15926). Computer
Aided Chemical Engineering, 20, 1543-1548
Berkün, M. (2016). Coastal environmental impact overview of desalination plants. Retrieved from:
https://www.researchgate.net/profile/Mehmet_Berkun/publication/302874368_COASTAL_ENVIRONMENTAL_
IMPACT_OVERVIEW_OF_DESALINATION_PLANTS/links/57322d8008aea45ee8364073.pdf
ZERO BRINE – Industrial Desalination – Resource Recovery – Circular Economy 109
Bisschops, I., & Spanjers, H. (2003). Literature review on textile wastewater characterisation. Environmental technology, 24(11), 1399-1411.
BREF (a) (2017) Best Available Techniques (BAT) Reference Document in the Food, Drink and Milk Industries.
European IPPC Bureau First Draft , JRC, European Commission.. Available on:
http://eippcb.jrc.ec.europa.eu/reference/BREF/FDM/FDM_31-01-2017-D1_b_w.pdf
BREF (b) (2015) Best Available Techniques (BAT) Reference (BREF) Document for the Refining of Mineral Oil and Gas, European IPPC Bureau First Draft JRC, European Commission.. Available on: http://eippcb.jrc.ec.europa.eu/reference/BREF/REF_BREF_2015.pdf
BREF (c) (2003) Best Available Techniques (BAT) Reference (BREF) Document for the Textiles Industry, European
IPPC Bureau First Draft JRC, European Commission. Available on:
http://eippcb.jrc.ec.europa.eu/reference/BREF/txt_bref_0703.pdf
BREF (d) (2015) Best Available Techniques (BAT) Reference Document for the Production of Pulp, Paper and
Board. European IPPC Bureau, JRC, European Commission Available on:
http://eippcb.jrc.ec.europa.eu/reference/BREF/PP_revised_BREF_2015.pdf
BREF (e) (2017) Best Available Techniques (BAT) Reference Document for the Non-Ferrous Metals Industries.
European IPPC Bureau, JRC, European Commission Available on:
http://eippcb.jrc.ec.europa.eu/reference/BREF/NFM/JRC107041_NFM_Bref_2017.pdf
BREF (f) (2013) Best Available Techniques (BAT) Reference Document for Iron and Steel Production . European
IPPC Bureau, JRC, European Commission Available on:
http://eippcb.jrc.ec.europa.eu/reference/BREF/IS_Adopted_03_2012.pdf
BREF (g) (2007) Best Available Techniques (BAT) Reference Document for the Manufacture of Large Volume
Inorganic Chemicals - Solids and Others industry. European IPPC Bureau, JRC, European Commission Available
on: http://eippcb.jrc.ec.europa.eu/reference/BREF/lvic-s_bref_0907.pdf
BREF (h) (2013) Best Available Techniques (BAT) Reference Document for the Tanning of Hides and Skins.
European IPPC Bureau, JRC, European Commission Available on:
http://eippcb.jrc.ec.europa.eu/reference/BREF/TAN_Published_def.pdf
Brickley, D. and Guha, R. “RDF Schema 1.1,” (2004):http://www.w3.org/TR/rdf-schema/. (Accessed 5/4/ 2018).
Buros, O. K. (2000). The ABCs of desalting (p. 30). Topsfield, MA: International Desalination Association. Bussemaker, M., Trokanas, N., & Cecelja, F. (2017). An Ontological Approach to Chemical Engineering
Curriculum Development. Computers and Chemical Engineering, 106, 927-941.
Cardoso, J. (2007). The semantic web vision: Where are we?. IEEE Intelligent systems, 22(5). Retrieved from:
https://eden.dei.uc.pt/~jcardoso/Index/sw-survey-2007.pdf (11/4/2018)

ZERO BRINE – Industrial Desalination – Resource Recovery – Circular Economy 110
CEFIC (2004), "The European chemical industry in a worldwide perspective - Facts and Figures 2004". Available
on: http://www.cefic.org/Documents/FactsAndFigures/2013/Cefic-Facts-and-Figures-2013.pdf
CEFIC (2014) The European Chemical Industry Council "Facts and Figures 2014 - The Brochure". Available on:
http://www.cefic.org/Documents/FactsAndFigures/2014/Facts%20and%20Figures%202014%20-
%20The%20Brochure.pdf
CEFIC (2017), “Chemical Industry Profile”, available on: http://fr.zone-secure.net/13451/451623/#page=10
CEFIC-ASASP (2002), "BREF Working Group - Synthetic Amorphous Silica".
CEFIC-ESAPA (2004). "IPPCB BAT Reference Document Large Volume Solid Inorganic Chemicals Family, Process
BREF for Soda Ash", Issue No: 3.
CEPI (1997), BAT in the Manufacturing of Pulp, CEPI, 1997.
CEPI (2009), Annual Statistics 2008. European Pulp and Paper Industry, CEPI.
Cheremisinoff, N. P. (2001). Handbook of water and wastewater treatment technologies. Butterworth-Heinemann.
Clayton, R. (2015). Desalination for water supply. Foundation for Water Research. Retrieved from:
http://www.fwr.org/desal.pdf.
Clitravi-Avec (2016) Bulk information AVEC CLITRAVI . http://www.clitravi.com/
Condorchem Envitech: https://condorchem.com/en/company/
Conservation law foundation, retrieved at 18 January 2018, available in https://www.clf.org/blog/rind-hits-
road-decreasing-food-waste-de-icing-cheese-brine/
Cooley, H., Gleick, P. H., & Wolff, G. (2006). Desalination, with a grain of salt. Pacific Institute. June.
Cooman, K., Gajardo, M., Nieto, J., Bornhardt, C., & Vidal, G. (2003). Tannery wastewater characterization and
toxicity effects on Daphnia spp. Environmental toxicology, 18(1), 45-51.
Correia, V. M., Stephenson, T., & Judd, S. J. (1994). Characterisation of textile wastewaters‐a
review. Environmental technology, 15(10), 917-929.
Cuenca, J. C. (2013). Report on water desalination status in the Mediterranean Countries. Instituto Murciano de Investigación y Desarrollo Agrario y Alimentario.
Das, C., DasGupta, S., & De, S. (2008). Treatment of deliming-bating effluent from tannery using membrane
separation processes. J. Environ. Prot. Sci, 2, 11-24.

ZERO BRINE – Industrial Desalination – Resource Recovery – Circular Economy 111
Demirel, B., & Yenigun, O. (2004). Anaerobic acidogenesis of dairy wastewater: the effects of variations in
hydraulic retention time with no pH control. Journal of Chemical Technology and Biotechnology, 79(7), 755-760.
Duangsri, P., & Satirapipathkul, C. (2011, February). Spirulina sp. production in brine wastewater from pickle
factory. In Proceedings of the lnternational Conference on Bioscience, Biochemistry and Bioinformatics (pp. 415-
418).
Dublic Core Metadata Initiative (2016), http://dublincore.org/documents/dcmi-terms/
ECHA (2010) Guidance on waste and recovered substances. Available on:
https://echa.europa.eu/documents/10162/13632/waste_recovered_en.pdf/657a2803-710c-472b-8922-
f5c94642f836
EDA, Annual Report, 2014, 2015.
Elsaid, K., Bensalah, N., & Abdel-Wahab, A. (2012). Inland desalination: potentials and challenges. In Advances in Chemical Engineering. InTech.
EPA (2009) Final Report: Pulp, paper and paperboard detailed study, EPA, U.S. Environmental Protection
Agency, engineering and analysis division, office of water, Pensylvania, November 2009.
eSymbiosis (2012), Deliverable 2.1: Waste stream and solution provider knowledge models, ontologies. Available on: http://uest.ntua.gr/esymbiosis/uploads/files/eSymbiosisdeliverable2.1v0.3.pdf
EU (2017), Agriculture and the environment: Introduction , Agriculture and water. Available on:
https://ec.europa.eu/agriculture/envir/water_en
EU (2018a), Raw materials, metals, minerals and forest-based industries, Metal industries, Non-ferrous metals.
Available on: https://ec.europa.eu/growth/sectors/raw-materials/industries/metals/non-ferrous_en
EU (2018b), Raw materials, metals, minerals and forest-based industries, Metal industries, The EU steel
industry. Available on: https://ec.europa.eu/growth/sectors/raw-materials/industries/metals/steel_en
EU (2018c), Chemicals, Importance of the EU Chemicals Industry, Available on:
https://ec.europa.eu/growth/sectors/chemicals_en
EU (2018d), Textiles, Fashion and Creative Industries, Textiles and clothing in the EU, Available on:
https://ec.europa.eu/growth/sectors/fashion/textiles-clothing/eu_en
FAO (1985). Water Quality for Agriculture. FAO Irrigation and Drainage Paper 29, rev. 1. Food and Agriculture
Organization of the United Nations, Rome, Italy Retrieved from:
http://www.fao.org/docrep/003/t0234e/T0234E00.htm#TOC

ZERO BRINE – Industrial Desalination – Resource Recovery – Circular Economy 112
Fernández-López, M. (1999). Overview of methodologies for building ontologies.
FOAF Vocabulary Specification 0.99, http://xmlns.com/foaf/spec/ (Accessed 5/4/2018)
Frendrup (1999), Practical Possibilities for Cleaner Production in Leather Processing, Danish Technological
Institute.
Fucà, N., McMahon, D. J., Caccamo, M., Tuminello, L., La Terra, S., Manenti, M., & Licitra, G. (2012). Effect of
brine composition and brining temperature on cheese physical properties in Ragusano cheese. Journal of dairy
science, 95(1), 460-470.
Galiana-Aleixandre, M. V., Iborra-Clar, A., Bes-Piá, B., Mendoza-Roca, J. A., Cuartas-Uribe, B., & Iborra-Clar, M. I.
(2005). Nanofiltration for sulfate removal and water reuse of the pickling and tanning processes in a
tannery. Desalination, 179(1-3), 307-313.
Geertman, R. M. (2000). Sodium chloride: Crystallization. Reference Module in Chemistry, Molecular Sciences and Chemical Engineering, 4127-4134. Retrieved from: https://www.thevespiary.org/library/Files_Uploaded_by_Users/Sedit/Chemical%20Analysis/Encyclopedia%20of%20Separation%20Science/Level%20III%20-%20Practical%20Applications/SODIUM%20CHLORIDE%20-%20CRYSTALLIZATION.pdf
Ghaly, A. E., Ananthashankar, R., Alhattab, M. V. V. R., & Ramakrishnan, V. V. (2014). Production,
characterization and treatment of textile effluents: a critical review. J Chem Eng Process Technol, 5(1), 1-18.
Ghasemipanah, K. (2013). Treatment of ion-exchange resins regeneration wastewater using reverse osmosis method for reuse. Desalination and Water Treatment, 51(25-27), 5179-5183.
Giaretta, P., & Guarino, N. (1995). Ontologies and knowledge bases towards a terminological clarification.
Towards very large knowledge bases: knowledge building & knowledge sharing, 25(32), 307-317.
Global Water Intelligence (GWI) (2006). 19th IDA worldwide desalting plant inventory. Global Information, Inc. Oxford, England.
Gómez-Pérez, A., Fernández-López, M., & Corcho, O. (2006). Ontological Engineering: with examples from the
areas of Knowledge Management, e-Commerce and the Semantic Web. Springer Science & Business Media.
Gruber, T. R. (1993). A translation approach to portable ontology specifications. Knowledge acquisition, 5(2), 199-220.
Grüninger, M., & Fox, M. S. (1995). Methodology for the design and evaluation of ontologies.
Gryta, M., Karakulski, K., & Morawski, A. (2006). Separation of effluents from regeneration of a cation exchanger by membrane distillation. Desalination, 197(1-3), 50-62.
Gryta, M., Karakulski, K., Tomaszewska, M., & Morawski, A. (2005). Treatment of effluents from the regeneration of ion exchangers using the MD process. Desalination, 180(1-3), 173-180.

ZERO BRINE – Industrial Desalination – Resource Recovery – Circular Economy 113
Guarino, N., & Poli, R. (1993). Toward principles for the design of ontologies used for knowledge sharing. In In
Formal Ontology in Conceptual Analysis and Knowledge Representation, Kluwer Academic Publishers, in press.
Substantial revision of paper presented at the International Workshop on Formal Ontology.
Guarino, N., Oberle, D., & Staab, S. (2009). What is an ontology?. In Handbook on ontologies (pp. 1-17).
Springer, Berlin, Heidelberg.
Guidance on Information Requirements and Chemical Safety Assessment, Chapter R.12: Use description,
Version 3.0, December 2015).
Guinee, T. P. (2004). Salting and the role of salt in cheese. International Journal of Dairy Technology, 57(2‐3),
99-109.
Hai, R., Theiβen, M., Marquardt, W. (2009). An Integrated Ontology for Operational Processes. Computer Aided
Chemical Engineering, 26, 1087-1091
Heinz, G., & Hautzinger, P. (2007). Meat processing technology for small to medium scale producers.
Holkar, C. R., Jadhav, A. J., Pinjari, D. V., Mahamuni, N. M., & Pandit, A. B. (2016). A critical review on textile
wastewater treatments: possible approaches. Journal of environmental management, 182, 351-366.
HP (1998), Refining Processes
Hultman, B. (2011). Components in seawater as a resource in wastewater treatment, Use of magnesium
compounds in wastewater treatment. KTH Land And Water Resources Engineering.
InfoMil (2004). "Dutch Fact sheet on Magnesium compounds".
International dairy federation, Dairy Industry Salts IDF Factsheet – February 2012, retrieved at 13 of December
2017, available at https://www.fil-idf.org/wp-content/uploads/2016/05/IDF-Factsheet-SCENV-Salts-2.pdf
Iqbal, R., Murad, M. A. A., Mustapha, A., & Sharef, N. M. (2013). An analysis of ontology engineering
methodologies: A literature review. Research journal of applied sciences, engineering and technology, 6(16),
2993-3000.
IWA (1996), Water Quality Guidance, Industrial Use. Retrieved from: http://www.iwa-network.org/filemanager-
uploads/WQ_Compendium/Database/Future_analysis/079.pdf
Johnson, S. L., Grumbles, B., Grubbs, G., Smith, M., Rubin, M., Goodwin, J., & Jordan, M. (2004). Technical
Development Document for the Final Effluent Limitations Guidelines and New Source Performance Standards
for the Concentrated Aquatic Animal Production Point Source Category (Revised August 2004).

ZERO BRINE – Industrial Desalination – Resource Recovery – Circular Economy 114
JRC (2017) Minimum quality requirements for water reuse in agricultural irrigation and aquifer recharge,
Towards a legal instrument on water reuse at EU level. Joint Research Centre, European Commission.
Kostick Dennis (2006), "Soda Ash", 2005 Minerals Yearbook, United States Geological Survey.
Ladewig, B., & Asquith, B. (2012). Characteristics of Membrane Concentrate. In Desalination Concentrate
Management (pp. 5-15). Springer Berlin Heidelberg.
Lattemann, S., & Höpner, T. (2003). Seawater desalination: Impacts of brine and chemical discharge on the
marine environment. L’Aquila, Italy: Balaban Desalination Publications.
Lenat, D., & Guha, R. V. (1990). Cyc: A midterm report. AI magazine, 11(3), 32.
Little, L. W., Lamb III, J. C., & Horney, L. F. (1976). Characterization and treatment of brine wastewaters from
the cucumber pickle industry. Water Resources Research Institute of the University of North Carolina.
Lord, P. (2010). Components of an Ontology. Ontogenesis. Retrieved from:
http://ontogenesis.knowledgeblog.org/514 (13/4/2018)
Ludvik, J (2000) Chrome balance in Leather Processing, UNIDO.
Ludvik, J (2000) Chromium Management in the Tanyard, UNIDO.
Madadlou, A., Mousavi, M. E., & Farmani, J. (2007). The influence of brine concentration on chemical
composition and texture of Iranian white cheese. Journal of food engineering, 81(2), 330-335.
Martínez-Alvarez, O., & Gómez-Guillén, M. C. (2005). The effect of brine composition and pH on the yield and
nature of water-soluble proteins extractable from brined muscle of cod (Gadus morhua). Food chemistry, 92(1),
71-77.
Mizoguchi, R., Vanwelkenhuysen, J., & Ikeda, M. (1995). Task ontology for reuse of problem solving
knowledge. Towards Very Large Knowledge Bases: Knowledge Building & Knowledge Sharing, 46, 59.
Morbach, J., Yang, A., & Marquardt, W. (2007). Ontocape: A large-scale ontology for chemical process
engineering. Engineering Applications of Artificial Intelligence, 20, 147-161
Munoz, E., Capon-Garcia, E., Lainez, JM, Espuna, A., Puigjaner, I. (2013). Integration of enterprise levels based
on an ontological framework. Chemical Engineering Research and Design, 91(8), 1542-1556
National Research Council (NRC) (2008). Desalination: A National Perspective. Washington, D.C.: National Nayaka, N., & Pandab, C. R. (2014). Determination of Major and Trace Elements in Bittern for Possible Value
Addition. International Journal of Energy and Environmental Engineering, 1, 8-12. Retrieved from:
http://oec.ac.in/journals/IJESEE_V1_I1.pdf#page=10

ZERO BRINE – Industrial Desalination – Resource Recovery – Circular Economy 115
Noorjahan, C. M., Sharief, S. D., & Dawood, N. (1970). Characterization of dairy effluent. I Control
Pollution, 20(1).
Noy, N. F., & McGuinness, D. L. (2001). Ontology development 101: A guide to creating your first ontology.
O&Gas Journal, 'Worldwide refineries -Capacities as of January 2012 Oil & Gas Journal/Dec. 5, 2011', 2011
Pak, A., & Mohammadi, T. (2008). Wastewater treatment of desalting units. Desalination, 222(1-3), 249-254.
Patel, H., & Vashi, R. T. (2015). Characterization and treatment of textile wastewater. Elsevier.
Pearson et al., BLC Information Document -No 200- Best Available Technologies, 1999.
Peterson, B. C., Overholt, M. F., Holmer, S. F., Dilger, A. C., & Boler, D. D. (2017). Characteristics of Ham
Knuckles and Bacon Cured Using Different Brine and Meat Temperatures. Meat and Muscle Biology, 1(1), 35-45.
Reid, G. W. (1974). Brine disposal treatment practices relating to the oil production industry (Vol. 1). Office of
Research and Development, US Environmental Protection Agency: for sale by the Supt. of Docs., US Govt. Print.
Off.
Rosenberg, L. B. (2013). Texture Retention in Pickles Produced from Commercial Scale Cucumber Fermentation
using Calcium Chloride instead of Sodium Chloride.
Rydin and Frendrup, Possibilities for a Reduction of the Pollution Load from Tanneries, Nordiske Seminar, 1993.
Sharphouse, Leather Technician's Handbook (Revised Edition), Leather Producers'Association (UK),
Northampton, 1983.
Sheeba, T., Krishnan, R., & Bernard, M. (2012). An Ontology in Project Management Knowledge
Domain. International Journal of Computer Applications, 56(5), 0975-8887, 1-2.
Spain (1997), Aplicaciones del Manual Media a Sectores Industriales - Sector de Curtidos de Pieles Animales
Spellman, F. R. (2013). Handbook of water and wastewater treatment plant operations. CRC press.
Swartout, B., Patil, R., Knight, K., & Russ, T. (1996, November). Toward distributed use of large-scale ontologies. In Proc. of the Tenth Workshop on Knowledge Acquisition for Knowledge-Based Systems (pp. 138-148). Tahiri, S., Hassoune, J., Alami Younssi, S., El Krati, M., Albizane, A., Luisa Cervera, M., & de la Guardia, M. (2013).
Management of tannery wastewaters: treatment of spent chrome tanning bath and vegetable tanning
effluents. Desalination and Water Treatment, 51(22-24), 4467-4477.
The Water Network (2018): https://thewaternetwork.com/_/sustainable-agriculture/article-FfV/over-60-
percent-of-uk-dairy-producers-using-water-inefficiently-GHBSzb67chSeiq2J8mEaHw
ZERO BRINE – Industrial Desalination – Resource Recovery – Circular Economy 116
Thibaudeau, E., Roy, D., & St-Gelais, D. (2015). Production of brine-salted Mozzarella cheese with different
ratios of NaCl/KCl. International Dairy Journal, 40, 54-61.
Transnational Ecological Project, Fish Processing Wastewater Treatment. Retrieved from:
http://hydropark.ru/projects.en.html
Trokanas, N., & Raafat, T. (2014). Towards a Re-Usable Ontology for Waste Processing (F. Cecelja, Ed.). In 24th
European Symposium on Computer Aided Process Engineering: Part A and B (1st ed., Vol. 33, pp. 841-846).
Amsterdam, Netherlands: Elsevier.
Trokanas, N., Cecelja, F., & Raafat, T. (2014). Semantic input/output matching for waste processing in industrial
symbiosis. Computers and Chemical Engineering, 66, 259-268.
Trokanas, N., Raafat, T., Cecelja, F., Kokossis, A., & Yang, A. (2012). Semantic formalism for waste and
processing technology classifications using ontology models. In Computer aided chemical engineering (Vol. 30,
pp. 167-171). Elsevier.
TWG, Emission and consumption data from data collection , 2015.
Van Heijst, G., Van Der Spek, R., & Kruizinga, E. (1997). Corporate memories as a tool for knowledge
management. Expert systems with applications, 13(1), 41-54.
Büchel, K. H., Moretto, H. H., & Werner, D. (2008). Industrial inorganic chemistry. John Wiley & Sons.
Wang, L. K., Chen, J. P., Hung, Y. T., & Shammas, N. K. (Eds.). (2008). Membrane and desalination technologies (Vol. 13). Springer Science+ Business Media, LLC.
Warriss, P.D. 2000. Meat Science: An Introductory Text. CABI Publishing, New York, NY. (DCN 00103, 00104, and
00105)
WBG (1998a) Pollution prevention and abatement handbook. Petroleum refining
WBG (1998b) Pollution prevention and abatement handbook. Copper Smelting Available on:
https://www.ifc.org/wps/wcm/connect/45bb400048865823b456f66a6515bb18/copper_PPAH.pdf?MOD=AJPE
RES
WGS84 Geo Positioning: an RDF vocabulary (2009), https://www.w3.org/2003/01/geo/wgs84_pos (Accessed
5/4/2018) Last update 20/04/2009
WHO (2006) Guidelines for the safe use of wastewater, excreta and greywater. Volume 2: Wastewater use in
agriculture. World Health Organization, Geneva, Switzerland.

ZERO BRINE – Industrial Desalination – Resource Recovery – Circular Economy 117
Wilson, E. M., Johanningsmeier, S. D., & Osborne, J. A. (2015). Consumer acceptability of cucumber pickles
produced by fermentation in calcium chloride brine for reduced environmental impact. Journal of food
science, 80(6).
WssTP. (2012). Brines Management - Research and Technology Development Needs Water in Industry
Xevgenos, D., Bakogianni, D., Haralambous, K.,J., Loizidou, M. (2018). Integrated Brine Management: A Circular
Economy Approach. In Smart Water Grids: A Cyber-Physical Systems Approach (pp. 203-227). CRC Press
Xevgenos, D., Moustakas, K., Malamis, D., & Loizidou, M. (2016). An overview on desalination & sustainability: renewable energy-driven desalination and brine management. Desalination and Water Treatment, 57(5), 2304-2314.

ZERO BRINE – Industrial Desalination – Resource Recovery – Circular Economy 118
6 ANNEX
Table 83: Descriptor list for Life cycle stages
CODE NAME NACE CODES
SU1 Agriculture, forestry, fishery A
SU2a Mining, (without offshore industries) B
SU2b Offshore industries B 6
SU4 Manufacture of food products C 10,11
SU5 Manufacture of textiles, leather, fur C 13-15
SU6a Manufacture of wood and wood products C 16
SU6b Manufacture of pulp, paper and paper products C 17
SU7 Printing and reproduction of recorded media C 18
SU8 Manufacture of bulk, large scale chemicals (including petroleum products)
C 19.2+20.1
SU9 Manufacture of fine chemicals C 20.2 -20.6
SU11 Manufacture of rubber products C 22.1
SU12 Manufacture of plastics products, including compounding and conversion
C 22.2
SU13 Manufacture of other non-metallic mineral products, e.g. plasters, cement
C 23
SU14 Manufacture of basic metals, including alloys C 24
SU15 Manufacture of fabricated metal products, except machinery and equipment
C 25
SU16 Manufacture of computer, electronic and optical products, electrical equipment
C 26-27
SU17 General manufacturing, e.g. machinery, equipment, vehicles, other transport equipment
C 28-30,33
SU18 Manufacture of furniture C 31
SU19 Building and construction work F
SU20 Health services Q 86
SU23 Electricity, steam, gas water supply and sewage treatment D 35, D 36-37
SU24 Scientific research and development M 72
SU0 Other

ZERO BRINE – Industrial Desalination – Resource Recovery – Circular Economy 119
Table 84: List for Chemical Products Category
CODE
NAME Explanation and examples
PC1 Adhesives, sealants
PC2 Adsorbents
PC3 Air care products
PC4 Anti-Freeze and de-icing products
PC7 Base metals and alloys
PC8 Biocidal products Includes e.g. disinfectant products, pest control products.Note that the category refers to types of products, not to the technical function of the substance. PC 35 should be assigned to disinfectants being used as a component in a cleaning product.
PC9a Coatings and paints, thinners, paint removers
PC9b Fillers, putties, plasters, modelling clay
PC9c Finger paints
PC11 Explosives
PC12 Fertilizers
PC13 Fuels
PC14 Metal surface treatment products This covers substances permanently binding with the metal surface. It includes e.g. galvanic and electroplating products.
PC15 Non-metal-surface treatment products
It includes e.g. example treatment of walls before painting.
PC16 Heat transfer fluids
PC17 Hydraulic fluids
PC18 Ink and toners
PC19 Removed from PC list and relocated in the technical function list (Table R.12- 15)24.
PC20 Processing aids such as pH-regulators, flocculants, precipitants, neutralization agents
This category covers processing aids used in the chemical industry.
PC21 Laboratory chemicals
PC23 Leather treatment products This category includes dyes, finishing, impregnation and care products.
PC24 Lubricants, greases, release products
PC25 Metal working fluids
PC26 Paper and board treatment products
This category includes e.g. bleaches, dye, finishing, impregnation products and other processing aids.
PC27 Plant protection products
PC28 Perfumes, fragrances
PC29 Pharmaceuticals

ZERO BRINE – Industrial Desalination – Resource Recovery – Circular Economy 120
PC30 Photo-chemicals
PC31 Polishes and wax blends
PC32 Polymer preparations and compounds
PC33 Semiconductors
PC34 Textile dyes, and impregnating products
This category includes e.g. bleaches and other processing aids.
PC35 Washing and cleaning products This category includes water and solvent based products.
PC36 Water softeners
PC37 Water treatment chemicals
PC38 Welding and soldering products, flux products
PC39 Cosmetics, personal care products This category includes products covered by the Cosmetics Regulation (EU Regulation 1223/2009) and other personal care products. It includes products such as toothpaste, deodorants, etc.
PC40 Extraction agents
PC41 Oil and gas exploration or production products
PC42 Electrolytes for batteries Mixtures (liquids or pastes) designed to serve as electrolytes in batteries.
PC0 Other
List for Chemical Products Category 1
Table 85: Descriptor list for Articles Categories
CODE NAME EXPLANATION & EXAMPLES
Categories of complex articles
AC1 Vehicles
AC1a Vehicles covered by End of Life Vehicles (ELV) directive
e.g. personal vehicles, delivery vans
AC1b Other vehicles e.g. boat, train, metro, planes
AC2 Machinery, mechanical appliances, electrical/electronic articles
AC2a Machinery, mechanical appliances, electrical/electronic articles covered by the Waste Electrical and Electronic Equipment (WEEE) directive
e.g. refrigerators, washing machines, vacuum cleaners, computers, telephones, drills, saws, smoke detectors, thermostats, radiators
AC2b Other machinery, mechanical appliances, electrical/electronic articles
e.g. large-scale stationary industrial tools
AC3 Electrical batteries and accumulators

ZERO BRINE – Industrial Desalination – Resource Recovery – Circular Economy 121
Material-based categories of articles
AC4 Stone, plaster, cement, glass and ceramic articles
AC4a Stone, plaster, cement, glass and ceramic articles: Large surface area articles
Construction and building materials e.g. floor coverings, isolation articles
AC4b Stone, plaster, cement, glass and ceramic articles: Toys intended for children’s use (and child dedicated articles)
AC4c Stone, plaster, cement, glass and ceramic articles: Packaging (excluding food packaging)
AC4d Stone, plaster, cement, glass and ceramic articles: Articles intended for food contact
e.g. dinner ware, drinking glasses, pots, pans, food storage containers
AC4e Stone, plaster, cement, glass and ceramic articles: Furniture & furnishings
AC4f Stone, plaster, cement, glass and ceramic articles: Articles with intense direct dermal contact during normal use
e.g. jewellery
AC4g Other articles made of stone, plaster, cement, glass or ceramic
AC5 Fabrics, textiles and apparel
AC5a Fabrics, textiles and apparel: Large surface area articles
Construction and building materials e.g. floor or wall materials: carpets, rugs, tapestries
AC5b Fabrics, textiles and apparel: Toys intended for children’s use (and child dedicated articles)
e.g. stuffed toys, blankets, comfort objects
AC5c Fabrics, textiles and apparel: Packaging (excluding food packaging)
AC5d Fabrics, textiles and apparel: Articles intended for food contact
AC5e Fabrics, textiles and apparel: Furniture & furnishings, including furniture coverings
e.g. sofa cover, car seat cover, fabric chair, hammock
AC5f Fabrics, textiles and apparel: Articles with intense direct dermal contact during normal use
e.g. clothing, shirts, pants, shorts

ZERO BRINE – Industrial Desalination – Resource Recovery – Circular Economy 122
AC5g Fabrics, textiles and apparel: Articles with intense direct dermal contact during normal use: bedding and mattresses
e.g. blankets, sheets
AC5h Other articles made of fabrics, textiles and apparel
AC6 Leather articles
AC6a Leather articles: Large surface area articles
Construction and building materials
AC6b Leather articles: Toys intended for children’s use (and child dedicated articles)
AC6c Leather articles: Packaging (excluding food packaging)
AC6d Leather articles: Articles intended for food contact
AC6e Leather articles: Furniture & furnishings, including furniture coverings
e.g. sofa, car seat, chair
AC6f Leather articles: Articles with intense direct dermal contact during normal use
e.g. clothing such as jackets, shoes, or gloves
AC6g Other leather articles e.g. domestic articles such as decoration articles, leather boxes
AC7 Metal articles
AC7a Metal articles: Large surface area articles
Construction and building materials e.g. roof sheets, pipes,
AC7b Metal articles: Toys intended for children’s use (and child dedicated articles)
AC7c Metal articles: Packaging (excluding food packaging)
AC7d Metal articles: Articles intended for food contact
e.g. packaging containers, metal tins, knifes, cooking pots
AC7e Metal articles: Furniture & furnishings
e.g. outdoor furniture, benches, tables
AC7f Metal articles: Articles with intense direct dermal contact during normal use
e.g. handles, jewellery
AC7g Other metal articles
AC8a Paper articles: Large surface area articles
Construction and building materials e.g. insulation panels, wall papers
AC8b Paper articles: Toys intended for children’s use (and child dedicated articles)
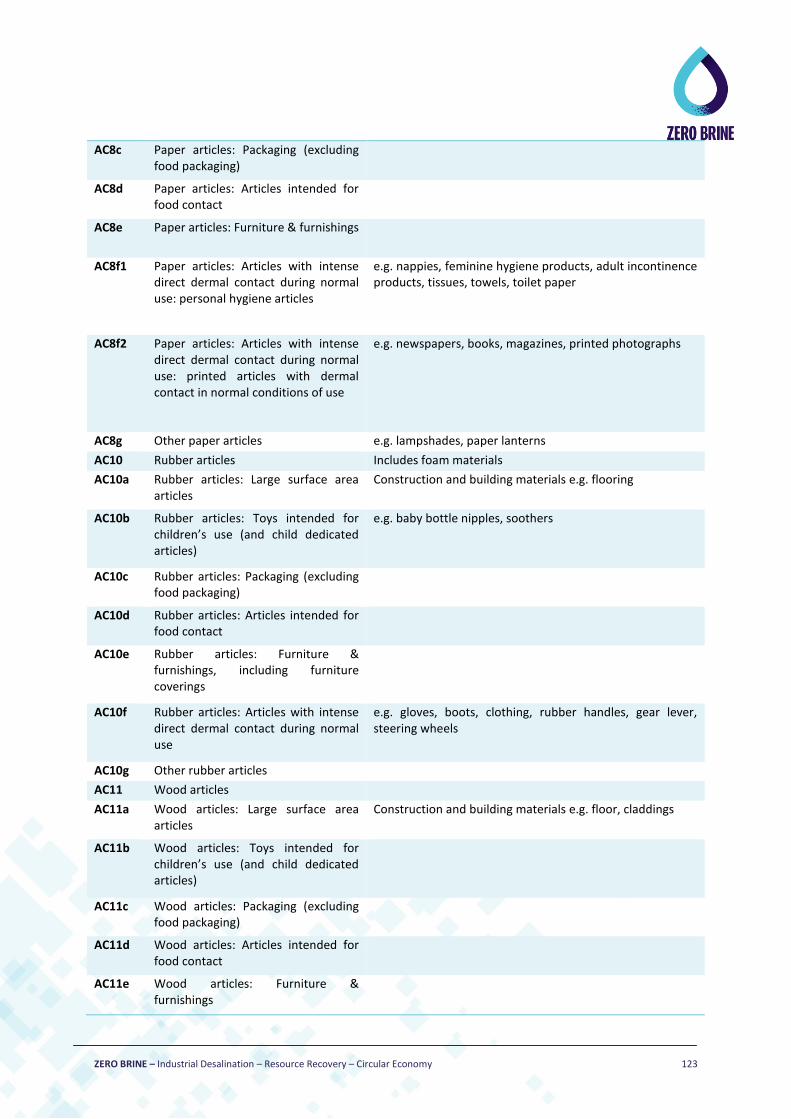
ZERO BRINE – Industrial Desalination – Resource Recovery – Circular Economy 123
AC8c Paper articles: Packaging (excluding food packaging)
AC8d Paper articles: Articles intended for food contact
AC8e Paper articles: Furniture & furnishings
AC8f1 Paper articles: Articles with intense direct dermal contact during normal use: personal hygiene articles
e.g. nappies, feminine hygiene products, adult incontinence products, tissues, towels, toilet paper
AC8f2 Paper articles: Articles with intense direct dermal contact during normal use: printed articles with dermal contact in normal conditions of use
e.g. newspapers, books, magazines, printed photographs
AC8g Other paper articles e.g. lampshades, paper lanterns
AC10 Rubber articles Includes foam materials
AC10a Rubber articles: Large surface area articles
Construction and building materials e.g. flooring
AC10b Rubber articles: Toys intended for children’s use (and child dedicated articles)
e.g. baby bottle nipples, soothers
AC10c Rubber articles: Packaging (excluding food packaging)
AC10d Rubber articles: Articles intended for food contact
AC10e Rubber articles: Furniture & furnishings, including furniture coverings
AC10f Rubber articles: Articles with intense direct dermal contact during normal use
e.g. gloves, boots, clothing, rubber handles, gear lever, steering wheels
AC10g Other rubber articles
AC11 Wood articles
AC11a Wood articles: Large surface area articles
Construction and building materials e.g. floor, claddings
AC11b Wood articles: Toys intended for children’s use (and child dedicated articles)
AC11c Wood articles: Packaging (excluding food packaging)
AC11d Wood articles: Articles intended for food contact
AC11e Wood articles: Furniture & furnishings

ZERO BRINE – Industrial Desalination – Resource Recovery – Circular Economy 124
AC11f Wood articles: Articles with intense direct dermal contact during normal use
e.g. handles, pencils
AC11g Other wood articles
AC13 Plastic articles includes foam materials
AC13a Plastic articles: Large surface area articles
Construction and building materials e.g. flooring, insulation
AC13b Plastic articles: Toys intended for children’s use (and child dedicated articles)
includes baby-bottles
AC13c Plastic articles: Packaging (excluding food packaging)
AC13d Plastic articles: Articles intended for food contact
e.g. plastic dinner ware, food storage
AC13e Plastic articles: Furniture & furnishings, including furniture coverings
AC13f Plastic articles: Articles with intense direct dermal contact during normal use
e.g. handles, ball pens
AC13g Other plastic articles
AC0 Other
Descriptor list for Articles Categories 1
Table 86: Descriptor list for Technical functions
TECHNICAL FUNCTION
NAME EXPLANATION
Ablative Substance that is applied to a substrate to protect it from heat by dissipating heat through the process of erosion, melting, or vaporization of the material.
Abrasive An abrasive is a substance used to abrade, smooth, or polish an object. Abrasives are used to remove imperfections from a surface; used to smooth, scour, scrub, clean, wear down, or polish surfaces by rubbing against the surface; usually fine powders of hard substances. Examples include sandstones, pumice, quartz, silicates, aluminium oxides, and glass.
Absorbent Chemical substance used to retain other substances by assimilation.
Adhesion promotor Any substance, inorganic or organic, natural or synthetic, used to join opposite surfaces to each other, promote bonding between other substances, promote adhesion of surfaces, or fasten other materials together. They are generally applied from a solvent solution and allowed to dry on the two facing surfaces.
Adsorbent Chemical substance used to retain other substances by accumulation on their surface; substance with a large surface area which can attract dissolved or finely dispersed substances from another medium.
Aerating and dearating agents
Substance that influences the amount of air or gases entrained in a material.

ZERO BRINE – Industrial Desalination – Resource Recovery – Circular Economy 125
Antiadhesive Substance that prevents or reduces the adhesion of a material to itself or to another material; prevents bonding between other substances by discouraging surface attachment; functions as the antitheses of adhesive.
Alloying element Substances that are added to metals alloys like steel to modify its properties such as strength, hardness, or to facilitate its treatment.
Anticaking agent Substance that prevents granular or particulate materials from sticking or caking during transfer, storage, or use.
Anticondensation agent
Substance or material that is used to avoid condensation on surfaces and in the atmosphere.
Antifreeze agent A substance added to fluids, especially water, to reduce the freezing point of the mixture, or applied to surfaces to melt or prevent the build-up of ice. Examples of products include antifreeze liquids, windshield de-icers, aircraft de-icers, lock release agents, ice melting crystals, and rock salt.
Antioxidant Substance that retards oxidation, rancidity, deterioration, and gum formation; used to maintain the quality, integrity, and safety of finished products by inhibiting the oxidative degradation of the ingredients in the formulation. Saturated polymers have greater oxidative stability and require relatively low concentrations of stabilizers.
Antiredeposition agent
Any substance that prevents dirt and grease from resettling on a cleaned surface or that helps keep soils from re-depositing onto clothing in the wash water after they have been removed. Antiredeposition agents are water-soluble and typically negatively charged.
Antiscaling agent Substances added to products to prevent the build-up of inorganic oxide deposits. The formation of scale can be caused by the deposition of salts or minerals and may not necessarily lead to surface corrosion, therefore these chemicals are not corrosion inhibitors. Substances prevent the build-up or removes limescale and fouling. These substances are also called ‘Descalers’.
Antistain agent Antistain agent is a substance that provides stain blocking and soil resistance to soft surface cleaners and protectors.
Antistatic agent Any substance that prevents or reduces the tendency of a material to accumulate a static charge or alters the electrical properties of materials by reducing their tendency to acquire an electrical charge.
Antistreaking agent A substance which serves to enhance evaporation or reduce film formation in order to prevent the formulation of streaks on a surface during cleaning.
Barrier (Sealant) Material designed only to fill up a space, prevent seepage of moisture or air, passage of liquid or gas. The spaces can be joints, gaps or cavities that occur between two substrates.
Binder Any cementitious material that is used to hold dry powders or aggregate together; added to compounded dry powder mixtures of solids to provide adhesive qualities during and after compression to make tablets or cakes; is soft at high temperatures and hard at room temperature.
Biocide Substance intended for preventing, neutralizing, destroying, repelling, or mitigating the effects of any pest or microorganism; that inhibits the growth, reproduction, and activity of organisms, including fungal cells; decreases the number of fungi or pests present; deters microbial growth and degradation of other ingredients in the formulation.

ZERO BRINE – Industrial Desalination – Resource Recovery – Circular Economy 126
Bleaching agent A bleaching agent is a material that lightens or whitens a substrate through chemical reaction. The bleaching reactions usually involve oxidative or reductive processes that degrade colour systems. Bleaching and decolourization can occur by destroying one or more of the double bonds in the conjugated chain, by cleaving the conjugated chain, or by oxidation of one of the other moieties in the conjugated chain.
Brightener Substance that is used to brighten, whiten, or enhance the appearance of colour of fabric and paper, usually by absorbing light in the ultraviolet and violet region (340-370 nm) of the electromagnetic spectrum, and re-emitting light in the blue region (420-470 nm). This causes a "whitening" effect by increasing the overall amount of blue light reflected. Optically colourless on the substrate and do not absorb in the visible part of the spectrum.
Catalyst Substances that increase the efficiency of a chemical reaction e.g. reaction needs less energy. Catalysts take part in the reaction but are not consumed during the process.
Chain transfer agent Substance that terminates the growth of a molecular chain and forms a new radical that can act as the initiator for a new chain.
Chelating agent A substance that has the ability to complex with inactivate metallic ions; used to remove ions from solutions and soils by forming a type of coordination complex so that the ions usual precipitation reactions are prevented; material that cleans oxide films from metals by stabilizing metal ions through complexing heterocyclic rings around each ion. They contain two or more electron donor atoms that can form coordinate bonds to a single metal atom. After the first such coordinate bond, each successive donor atom that binds creates a ring containing the metal atom; this cyclic structure is called a chelation complex or chelate.
Cleaning agent Substance or material used to remove dirt or impurities from surfaces; acts to loosen and remove dirt and grease from surfaces.
Cloud-point depressant
Substance that depresses the temperature at which solids begin to separate from a liquid, at a temperature lower than that normally allowed.
Coalescing agent Ingredients that decrease the minimum film-forming temperature (MFT) and, upon evaporation, yield a hard film. In polishes, the most common coalescing agent is glycol ether however, pyrrolidines and benzoates are also used.
Compatibilizer Enables a reaction between two or more dissimilar polymers, allowing them to become more intimately mixed than before.
Conductive agent Material used to conduct electrical current.
Corrosion inhibitor Chemical substance used to prevent or retard corrosion metallic materials. They are needed in many products packaged in metal containers (such as aerosol products) and also used in such products as lubricants and other metal treatment products to provide protection to the substrates or surfaces on which the lubricants are used.
Crystal growth modifiers (nucleating agents)
Substance used to reduce or increase crystal growth.
Deflocculant Substance used to fluidize concentrated slurries to reduce their bulk viscosity or stickiness in processing or handling.

ZERO BRINE – Industrial Desalination – Resource Recovery – Circular Economy 127
Defoamer Chemical that is used to control foam; prevents foam from forming; breaks down any foam that does form; reduces foaming from proteins, gases, or nitrogenous materials. They reduce the tendency of finished products to generate foam on shaking or agitation. The ability of a material to act as an antifoam depends on its tendency to concentrate on the surface of existing or forming bubbles and to disrupt the continuous films of liquid surrounding them. As process aid, it improves filtration, dewatering, washing, and drainage of many types of suspensions, mixtures, and slurries.
Demulsifier Substance used to destroy an emulsion or prevent its formation.
Density modifier Substance that modifies the density of a material.
Deodorizer Substance that reduces or eliminates unpleasant odour and protects against the formation of malodour on body surfaces. Counteraction, sometimes referred to as neutralization, occurs when two odorous substances are mixed in a given ratio and the resulting odour of the mixture is less intense than that of the separate components.
Diluent Substance that serves primarily to reduce the concentration of the other ingredients in a formulation; volatile liquid that is added to modify the consistency or other properties. The term is most often used for liquid formulations, with the term filler used for solid or powder formulations.
Dispersing agent Substance added to a suspending medium or suspension to improve the separation of particles; to ensure proper dispersion; to prevent settling or clumping; to encourage uniform and maximum separation of individual, extremely fine solid particles or liquid droplets, often of colloidal size. A typical use is dispersal of dyes to ensure uniform coloration.
Drier These substances, which speed the drying of paint, ink, etc., are often organometallic compounds.
Durability agent Durability agents are ingredients added to increase the durability and therefore the functional life of a material.
Dust suppressant Substance used to control finely grained solid particles to reduce their discharge into the air.
Dusting agent Substance that is dusted onto the surface of a material (e.g., rubber) to reduce surface tack.
Dye Substance used to impart colour to other materials or mixtures; added to a material to add colour; soluble. Molecularly dispersed within a liquid, transferred to a material, and bound to that material through intermolecular forces. Typically an organic substance, although exceptions do exist. A dye requires some degree of solubility that allows it diffuse into the polymeric matrix of a textile fibre.
Elasticizer Substance that increases the elasticity of a material.
Embalming agent Substance used for the preservation of biological tissue.
Energy releasers (explosives, motive propellant)
Substance characterized by chemical stability, but may be induced to undergo rapid chemical change without an outside source of oxygen, rapidly producing a large quantity of energy and gas accompanied by a large increase in volume and an explosion, bursting, or expansion.

ZERO BRINE – Industrial Desalination – Resource Recovery – Circular Economy 128
Etching agent Etching Agent is a substance that removes unprotected areas of metal or glass surfaces. Etching agents are usually acids or bases.
Explosion inhibitor Substance used to reduce the explosion potential of flammable materials.
Fertilizers (soil amendments)
Chemical substance used to increase the productivity and quality of farm crops, including plants, animals, and forestry; added to soil to supply chemical elements needed for plant nutrition.
Filler Ingredient added to fill out a dry product formulation and to lower the concentration of other ingredients; used to provide bulk, increase strength, increase hardness, or improve resistance to impact; used to extend a material and to reduce its cost by minimizing the amount of more expensive substances used in the production of articles; used to fill cavities or tighten joints; relatively inert and normally non-fibrous, finely divided substance added usually to extend volume and sometimes to improve desired properties, such as whiteness, consistency, lubricity, density or tensile strength.
Film former Any component of a material that aids the material in forming a thin continuous sheet on its substrate. This sheet will act as a barrier between the environment and its substrate. Silicone is a good film-former in furniture polishes because of its ease of application, soil removal, and depth of glossiness. Polymers are the most commonly used film formers.
Finishing agents Chemical substances used to impart such functions as softening, staticproofing, wrinkle resistance, and water repellence. Substances may be applied to textiles, paper, and leather.
Fire extinguishing agent
Any agent incorporated or applied to slow down combustion once started; Removes heat faster than it is released; separates the fuel and oxidizing agent; dilutes the vapour phase concentration of the fuel and oxidizing agent below what is needed for combustion.
Fixing agent (mordant)
Substance used to interact with a dye on fibres to improve fastness.
Flame retardant Flame retardation is a process by which the normal degradation or combustion processes of polymers have been altered by the addition of certain chemicals. They are substances used on the surface of or incorporated into combustible materials to reduce or eliminate their tendency to ignite when exposed to heat or a flame for a short period of time; used to raise its ignition point; used to slow down or prevent combustion.
Flocculating agent A flocculating agent is a chemical or substance that facilitates flocculation of suspended solids in liquid. Flocculating agents are chemical additives, which, at relatively low levels compared to the weight of the solid phase, increase the degree of flocculation of a suspension. They act on a molecular level on the surfaces of the particles to reduce repulsive forces and increase attractive forces. The principal use of flocculating agents is to aid in making solid–liquid separations.
Flotation agent Substance used to concentrate and obtain minerals from ores.
Flow promoter Substance that reduces drag in fluids in motion and between a fluid and a conduit surface.
Flux agent Substance used to promote the fusing of minerals or prevent oxide formation; for casting or joining materials.
Foamant Any substance that promotes or enhances formation of a lather or foam (i.e., a dispersion of a gas in a liquid or solid); used to form physically, by expansion of compressed gases or vaporization of liquid, or chemically, by decomposition evolving a gas, a foam or cellular structure in a plastic or rubber material.
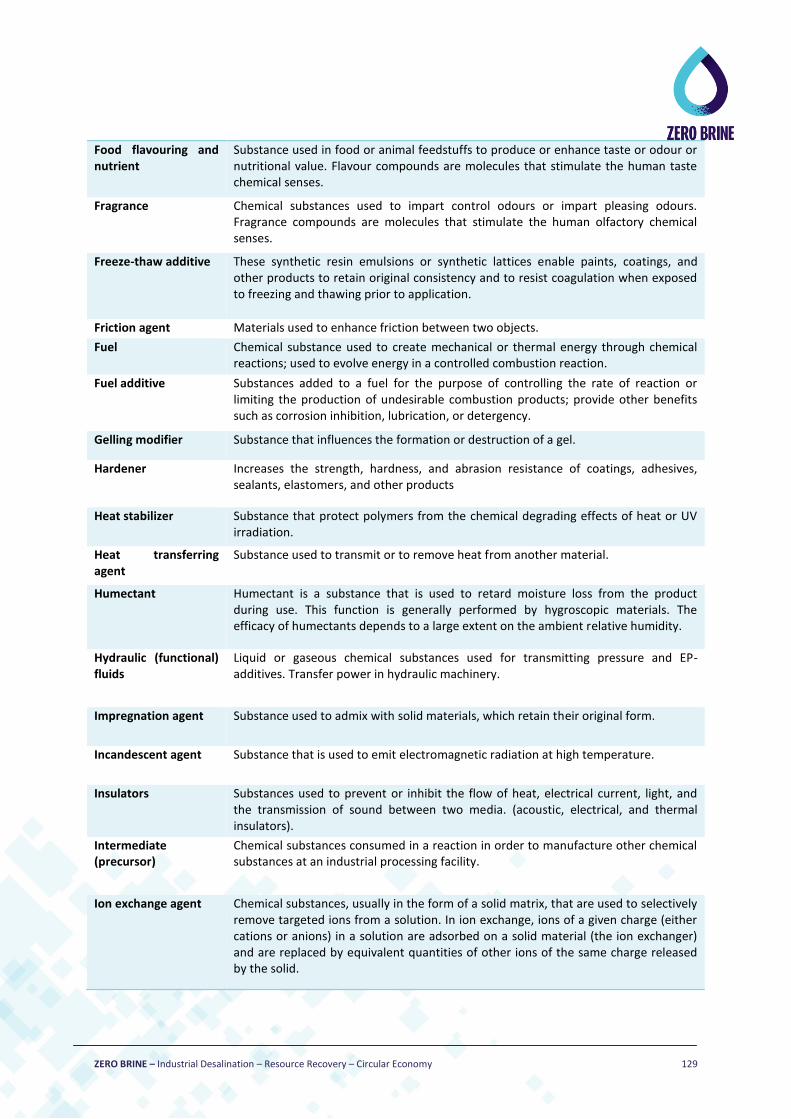
ZERO BRINE – Industrial Desalination – Resource Recovery – Circular Economy 129
Food flavouring and nutrient
Substance used in food or animal feedstuffs to produce or enhance taste or odour or nutritional value. Flavour compounds are molecules that stimulate the human taste chemical senses.
Fragrance Chemical substances used to impart control odours or impart pleasing odours. Fragrance compounds are molecules that stimulate the human olfactory chemical senses.
Freeze-thaw additive These synthetic resin emulsions or synthetic lattices enable paints, coatings, and other products to retain original consistency and to resist coagulation when exposed to freezing and thawing prior to application.
Friction agent Materials used to enhance friction between two objects.
Fuel Chemical substance used to create mechanical or thermal energy through chemical reactions; used to evolve energy in a controlled combustion reaction.
Fuel additive Substances added to a fuel for the purpose of controlling the rate of reaction or limiting the production of undesirable combustion products; provide other benefits such as corrosion inhibition, lubrication, or detergency.
Gelling modifier Substance that influences the formation or destruction of a gel.
Hardener Increases the strength, hardness, and abrasion resistance of coatings, adhesives, sealants, elastomers, and other products
Heat stabilizer Substance that protect polymers from the chemical degrading effects of heat or UV irradiation.
Heat transferring agent
Substance used to transmit or to remove heat from another material.
Humectant Humectant is a substance that is used to retard moisture loss from the product during use. This function is generally performed by hygroscopic materials. The efficacy of humectants depends to a large extent on the ambient relative humidity.
Hydraulic (functional) fluids
Liquid or gaseous chemical substances used for transmitting pressure and EP-additives. Transfer power in hydraulic machinery.
Impregnation agent Substance used to admix with solid materials, which retain their original form.
Incandescent agent Substance that is used to emit electromagnetic radiation at high temperature.
Insulators Substances used to prevent or inhibit the flow of heat, electrical current, light, and the transmission of sound between two media. (acoustic, electrical, and thermal insulators).
Intermediate (precursor)
Chemical substances consumed in a reaction in order to manufacture other chemical substances at an industrial processing facility.
Ion exchange agent Chemical substances, usually in the form of a solid matrix, that are used to selectively remove targeted ions from a solution. In ion exchange, ions of a given charge (either cations or anions) in a solution are adsorbed on a solid material (the ion exchanger) and are replaced by equivalent quantities of other ions of the same charge released by the solid.
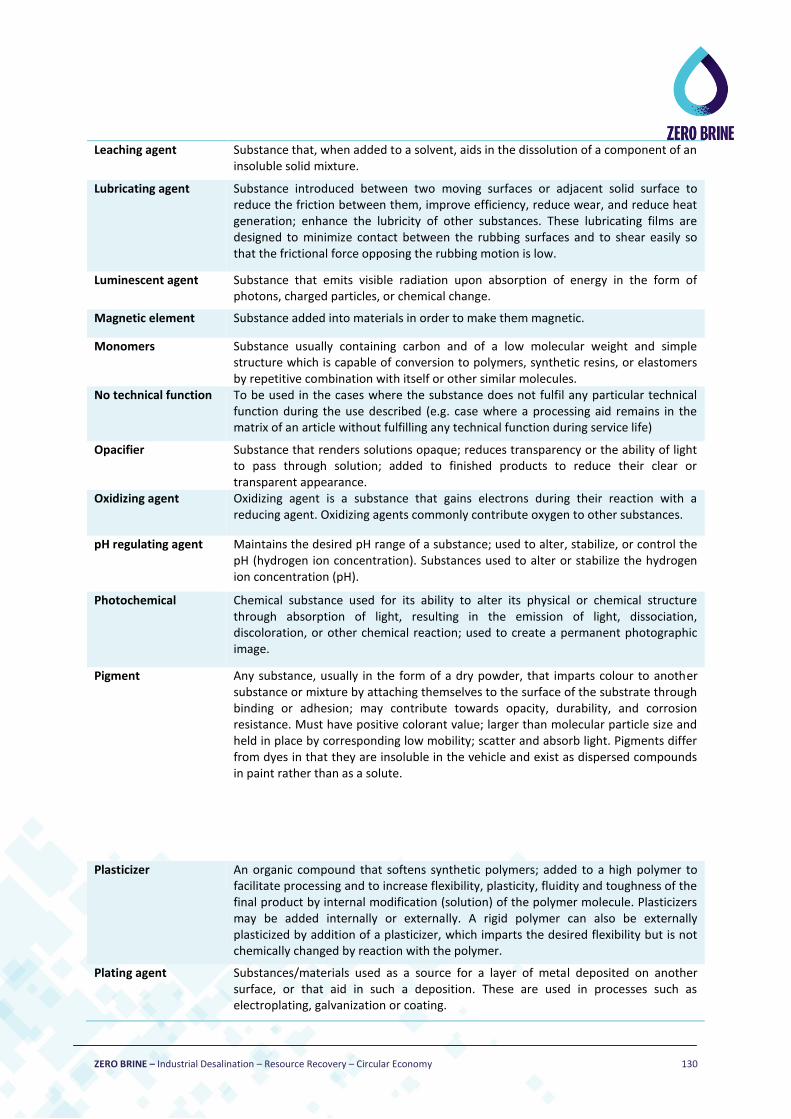
ZERO BRINE – Industrial Desalination – Resource Recovery – Circular Economy 130
Leaching agent Substance that, when added to a solvent, aids in the dissolution of a component of an insoluble solid mixture.
Lubricating agent Substance introduced between two moving surfaces or adjacent solid surface to reduce the friction between them, improve efficiency, reduce wear, and reduce heat generation; enhance the lubricity of other substances. These lubricating films are designed to minimize contact between the rubbing surfaces and to shear easily so that the frictional force opposing the rubbing motion is low.
Luminescent agent Substance that emits visible radiation upon absorption of energy in the form of photons, charged particles, or chemical change.
Magnetic element Substance added into materials in order to make them magnetic.
Monomers Substance usually containing carbon and of a low molecular weight and simple structure which is capable of conversion to polymers, synthetic resins, or elastomers by repetitive combination with itself or other similar molecules.
No technical function To be used in the cases where the substance does not fulfil any particular technical function during the use described (e.g. case where a processing aid remains in the matrix of an article without fulfilling any technical function during service life)
Opacifier Substance that renders solutions opaque; reduces transparency or the ability of light to pass through solution; added to finished products to reduce their clear or transparent appearance.
Oxidizing agent Oxidizing agent is a substance that gains electrons during their reaction with a reducing agent. Oxidizing agents commonly contribute oxygen to other substances.
pH regulating agent Maintains the desired pH range of a substance; used to alter, stabilize, or control the pH (hydrogen ion concentration). Substances used to alter or stabilize the hydrogen ion concentration (pH).
Photochemical Chemical substance used for its ability to alter its physical or chemical structure through absorption of light, resulting in the emission of light, dissociation, discoloration, or other chemical reaction; used to create a permanent photographic image.
Pigment Any substance, usually in the form of a dry powder, that imparts colour to another substance or mixture by attaching themselves to the surface of the substrate through binding or adhesion; may contribute towards opacity, durability, and corrosion resistance. Must have positive colorant value; larger than molecular particle size and held in place by corresponding low mobility; scatter and absorb light. Pigments differ from dyes in that they are insoluble in the vehicle and exist as dispersed compounds in paint rather than as a solute.
Plasticizer An organic compound that softens synthetic polymers; added to a high polymer to facilitate processing and to increase flexibility, plasticity, fluidity and toughness of the final product by internal modification (solution) of the polymer molecule. Plasticizers may be added internally or externally. A rigid polymer can also be externally plasticized by addition of a plasticizer, which imparts the desired flexibility but is not chemically changed by reaction with the polymer.
Plating agent Substances/materials used as a source for a layer of metal deposited on another surface, or that aid in such a deposition. These are used in processes such as electroplating, galvanization or coating.
ZERO BRINE – Industrial Desalination – Resource Recovery – Circular Economy 131
Pressure transfer agent
Lubricating oil and grease additive that prevents metal to metal contact at high temperatures or under heavy loads where severe sliding conditions exist. Functions by reacting with the sliding metal surfaces to form oil-insoluble surface films.
Process regulator Chemical substance used to change the rate of a chemical reaction, start or stop the reaction, or otherwise influence the course of the reaction. May be consumed or become part of the reaction product.
Processing aid Chemical substances used to improve the processing characteristics or the operation of process equipment or to alter or buffer the pH of the substance or mixture, when added to a process or to a substance or mixture to be processed. Processing agents do not become a part of the reaction product and are not intended to affect the function of a substance or article created.
Propellants, non-motive (blowing agents)
Substance that is used for expelling products from pressurized containers (aerosol products); used to dissolve or suspend other substances and either to expel those substances from a container in the form of an aerosol or to impart a cellular structure to plastics, rubber, or thermo set resins; provides the force necessary to expel the contents of aerosol containers; liquefied or compressed gas within which substances are dissolved or suspended and expelled from a container upon discharge of the internal pressure through expansion of the gas. The formulated product in the pressurized container may be solution, emulsion, or suspension.
Reactive cleaning/removal agent
Substance that reacts with and removes surface contaminants and is generally consumed, e.g., oxides, sulfides.
Reducing agent Substance that during reactions with oxidizing agents lose electrons; commonly contributes hydrogen to other substances; used to remove oxygen, hydrogenate or, in general, acts as electron donor in chemical reactions.
Refrigerants Substances used within machines such as air conditioning units, refrigerators, and walk in freezers to cool indoor air and reduce temperatures.
Resins (prepolymers) Usually high molecular weight polymers that lower viscosity. Thermoplastic resins soften when exposed to heat and return to original form at room temperature, and thermosetting resins solidify irreversibly when heated due to cross-linking.
Semiconductor and photovoltaic agent
Substance that has resistivity between that of insulators and metals; usually changeable by light, heat or electrical or magnetic field; generates electromotive force upon the incidence of radiant energy.
Sizing agent Substance applied to substrates such as fabric, yarn, paper products, or plaster to increase abrasive resistance, stiffness, strength, smoothness, or reduce absorption.
Softener Substance used for softening materials to improve feel, to facilitate finishing process, or to impart flexibility or workability; used in textile finishing to impart superior "hand" to the fabric and facilitate mechanical processing; has the capability of imparting softness and pliability to washable textile fabrics.
Solids separation (precipitating) agent
Chemical substances used to promote the separation of suspended solids from a liquid.
Solubility enhancer A chemical additive that prevents chemicals or materials from separating or falling out of solution. Solubility enhancers are often used in concentrated formulations.

ZERO BRINE – Industrial Desalination – Resource Recovery – Circular Economy 132
Solvent Any substance that can dissolve another substance (solute) to form a uniformly dispersed mixture (solution) at the molecular or ionic size level; provides dissolving capability required for a stable formulation; dissolves certain components of the formulation to aid dispersion of components; aids oil cleansing power and controls film drying rate; allows the product to solubilize soils on surfaces and facilitate removal; used to dissolve, thin, dilute, and extract.
A substance that tends to keep a compound, solution, or mixture from changing its form or chemical nature; renders or maintains a solution, mixture, suspension, or state resistant to chemical change; used to prevent or slow down spontaneous changes in and ageing of materials.
A substance that tends to keep a compound, solution, or mixture from changing its form or chemical nature; renders or maintains a solution, mixture, suspension, or state resistant to chemical change; used to prevent or slow down spontaneous changes in and ageing of materials.
Surface modifier Substance that may be added to other ingredients to adjust the optical properties associated with the surface of a material. These substances are designed to affect the luster, increase gloss, and alter the reflectance exhibited by a surface.
Surfactant A surface active agent (surfactant) which, when added to water, causes it to penetrate more easily into, or to spread over the surface of another material by reducing the surface tension of the water (see detergent).
Swelling agent Substance added to a material to cause that material to increase in volume and become softer.
Tackifier Provides stickiness
Tanning agent Substance used for treating hides and skins.
Terminator/Blocker Substance that reacts with the end of a growing polymer chain, stopping further polymerization (terminator) or a substance used to protect a reactive moiety on a precursor during organic synthesis of a product that is subsequently removed regenerating the reactive moiety (blocker).

ZERO BRINE – Industrial Desalination – Resource Recovery – Circular Economy 133
Thickener/Thickening agentThickener/Thickening agent
Any of a variety of hydrophilic substances used to increase the viscosity of liquid mixtures and solutions and to aid in maintaining stability by their emulsifying properties. Four classifications are recognized: 1) Starches, gums, casein, gelatin and phycocolloids; 2) semisynthetic cellulose derivatives (e.g. carboxymethyl-cellulose); 3) polyvinyl alcohol and carboxy-vinylates (synthetic); and 4) bentonite, silicates, and colloidal silica.
Tracer Substance that possesses a readily detectable radioactive/isotopic label or chemical moiety which is added to biological/environmental media or chemical reactions to elucidate the transformation/transportation processes that are occurring.
UV stabilizer Substance that protects the product from chemical or physical deterioration induced by ultraviolet light; absorbs UV radiation, thereby protecting varnishes and pigments against UV degradation.
Vapour pressure modifiers
Substance added to a liquid to modify its vapour pressure (e.g., to reduce evaporation).
Vehicle (carrier) The vehicle dissolves or disperses solid components of a substance, allowing even dispersion throughout application. The vehicle carries the other particles within a substance.
Viscosity modifier Substance used to alter the viscosity of another substance; used to decrease or increase the viscosity of finished products; used to modify the flow characteristics of other substances, or mixtures, to which they are added; controls the deformation or flow ability of a wax product. Resins generally lower viscosity while thickeners (e.g., gums and hydroxyethyl cellulose) increase viscosity.
Waterproofing agent A water repellent material functions by lowering the surface energy to protect surfaces against water by making water bead.
X-Ray Absorber Substance use to block or attenuate X-rays.
Table 87: Water Use Category (WUC)
Irrigation Water
Process water Product Water
Water for steam generation Cooling Water Utility Water Wash Water
Table 88: Parameters to consider for salt reuse
Quantity Purity
Moisture pH
volatile matter non volatile matter
organic matter
NH4+ Sb (Antimony)

ZERO BRINE – Industrial Desalination – Resource Recovery – Circular Economy 134
NO3- Sb2O3
NO2- Be (Beryllium)
NH3 BeO
P V (Vanadium)
PO43- (phosphates) VO
P2O5 V2O3
Cl- Ti (Titanium)
CO32- TiO2
Fe Ba (barium)
Fe2O3 BaO
Ca SiO2
CaO Si (Silicon)
heavy metals S (Sulphur)
Pb (Pb) SO42- (Sulphates)
As (Arsenic) Sulphur compounds
Hg (Mercury) S2- (Sulphides)
Cd (cadmium) Na+ (Sodium)
Cr (Chromium) Mg2+ (Magnesium)
Mn (Manganese) MgO
MnO2 K (Potassium)
Ni (Nickel) K2O
NiO F (Fluoride)
Ni2O3 I (Iodine)
Cu NaCl (sodium chloride)
CuO Na2SO4 (sodium sulphate)
Cu2O3 Na2CO3 (sodium carbonate)
Al (Aluminium) Na2S (disodium sulphide)
Al2O3 K2SO4 (potassium sulphate)
Zn (Zinc) CH3COONa (sodium acetate)
ZnO NaNO2 (sodium nitrite)

ZERO BRINE – Industrial Desalination – Resource Recovery – Circular Economy 135
Se (Sellenium) H2SO4 (sulphuric acid)
SeO2 Na2S2O5 (sodium metabisulphite)
Br (Bromide) SO2 (sulphure dioxide)
Br2O3 Na2O7S2 (disodium disulphate)
BrO2 Na2SO3 (sodium sulphite)
Sr (Strontium) Na2S2O3 (sodium thiosulphate)
SrO MgCl2 (magnesium chloride)
Zr (Zirconium) CaSO4 (Calcium sulphate)
ZrO2 Ca(OH)2 (Calcium hydroxide)
Mo (Molybdenum) MgSO4 (Magnesium sulphate)
MoO3 CaCl2 (Calcium Chloride)
Sn (Tin) KCl (Potassium Chloride)
SnO MgCO3 (Magnesium Carbonate)
SnO2