
HIGH PROFILE HARD CORNER PAD IN GILBERT€¦ · HIGH PROFILE HARD CORNER PAD IN GILBERT. Guadalupe...
14
PROPERTY HIGHLIGHTS SITE PLAN / AVAILABILITY AERIAL CONTACT DEMOGRAPHICS Brian Gast 602.682.8155 [email protected] HIGH PROFILE HARD CORNER PAD IN GILBERT Guadalupe Rd & Gilbert Rd - Southeast Corner Gilbert, Arizona
Transcript of HIGH PROFILE HARD CORNER PAD IN GILBERT€¦ · HIGH PROFILE HARD CORNER PAD IN GILBERT. Guadalupe...
PROPERTY HIGHLIGHTS SITE PLAN / AVAILABILITY AERIAL CONTACT DEMOGRAPHICS
Brian [email protected]
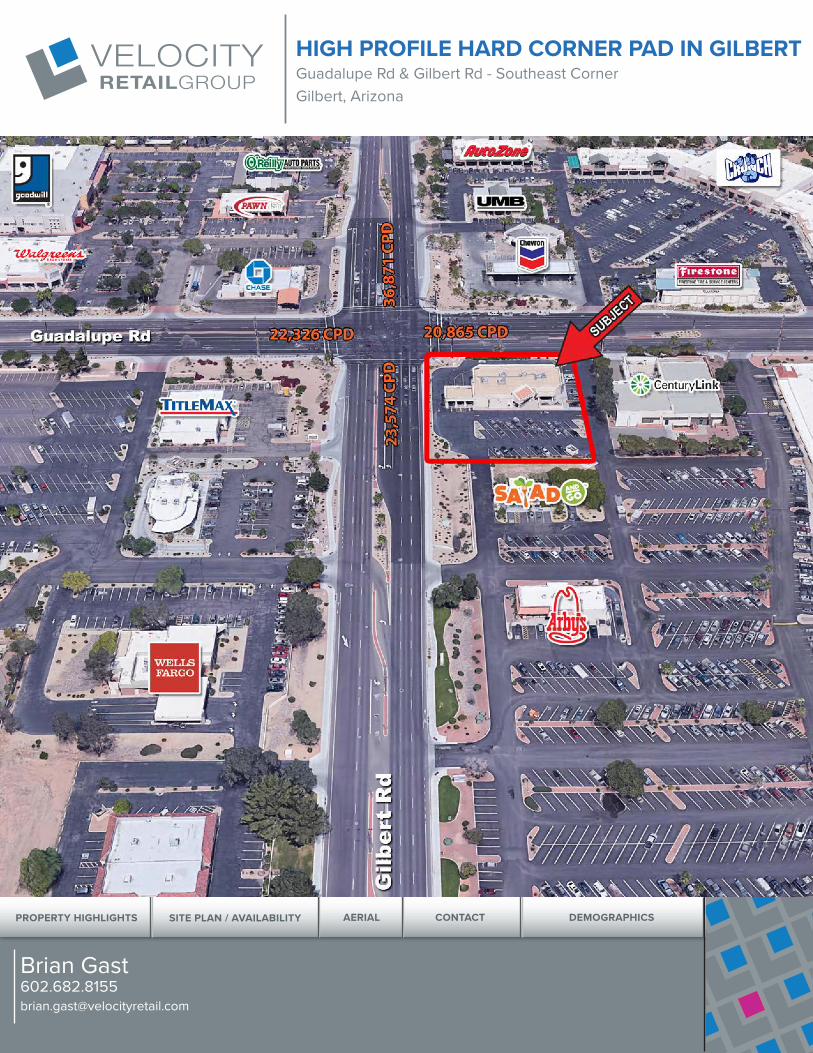
HIGH PROFILE HARD CORNER PAD IN GILBERTGuadalupe Rd & Gilbert Rd - Southeast CornerGilbert, Arizona
PROPERTY HIGHLIGHTS SITE PLAN / AVAILABILITY AERIAL CONTACT DEMOGRAPHICS
Brian [email protected]
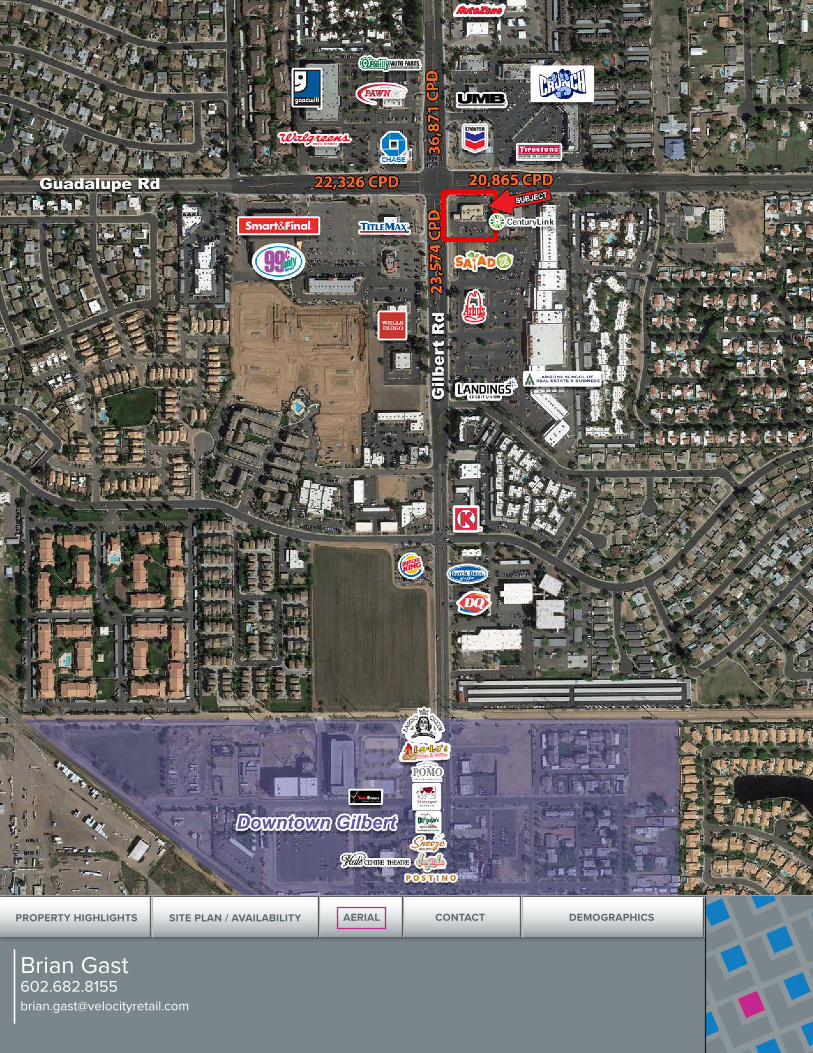
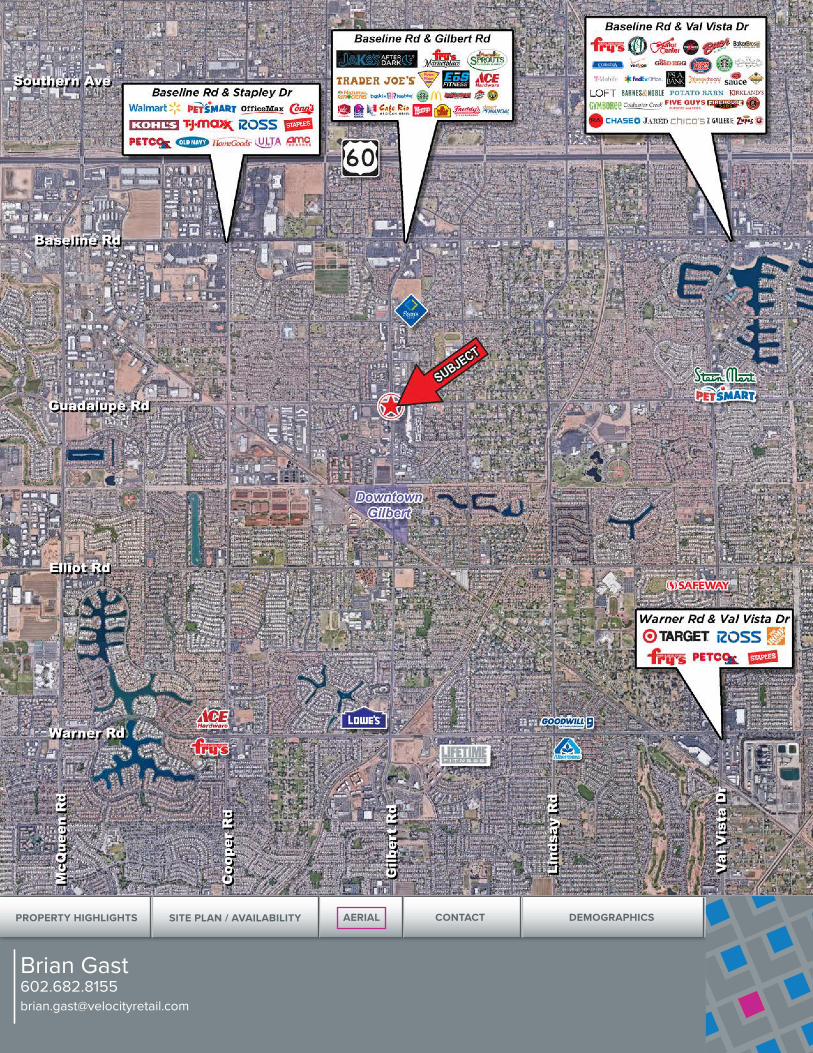
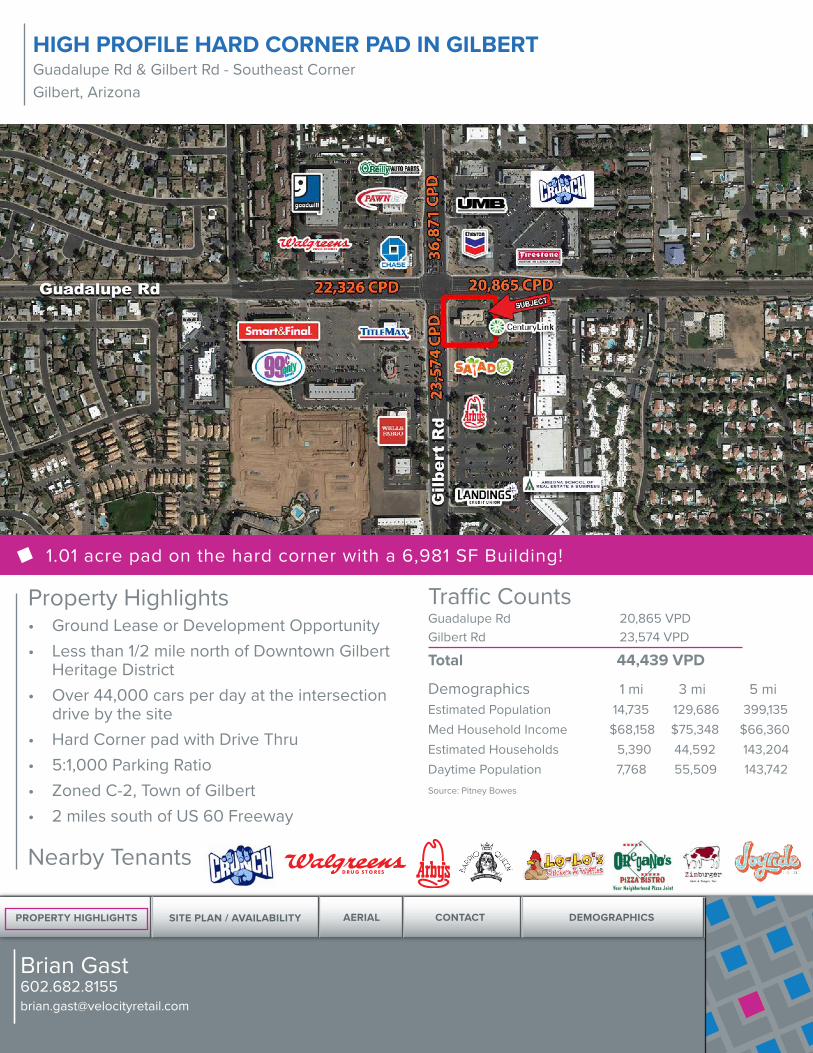
Property Highlights• Ground Lease or Development Opportunity• Less than 1/2 mile north of Downtown Gilbert
Heritage District• Over 44,000 cars per day at the intersection
drive by the site• Hard Corner pad with Drive Thru• 5:1,000 Parking Ratio• Zoned C-2, Town of Gilbert• 2 miles south of US 60 Freeway
Traffic CountsGuadalupe Rd 20,865 VPDGilbert Rd 23,574 VPD
Total 44,439 VPD
Demographics 1 mi 3 mi 5 miEstimated Population 14,735 129,686 399,135Med Household Income $68,158 $75,348 $66,360Estimated Households 5,390 44,592 143,204Daytime Population 7,768 55,509 143,742Source: Pitney Bowes
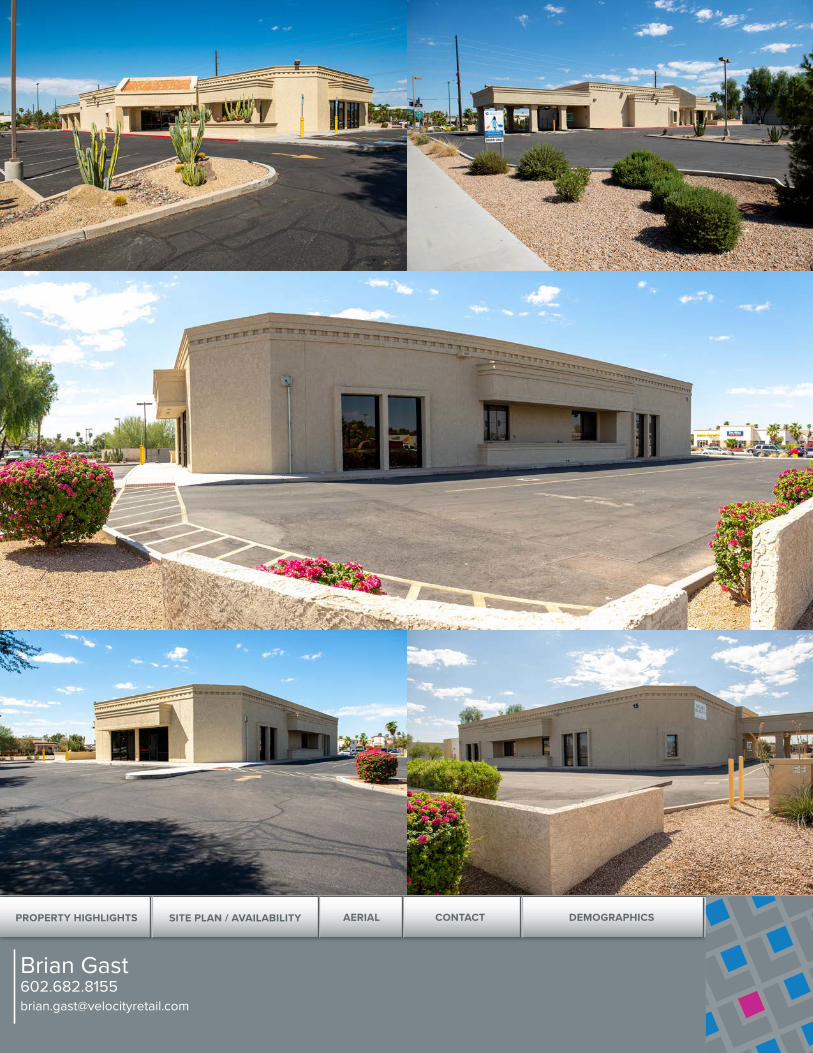
1.01 acre pad on the hard corner with a 6,981 SF Building!
HIGH PROFILE HARD CORNER PAD IN GILBERTGuadalupe Rd & Gilbert Rd - Southeast CornerGilbert, Arizona
Nearby Tenants
PROPERTY HIGHLIGHTS SITE PLAN / AVAILABILITY AERIAL CONTACT DEMOGRAPHICS
Brian [email protected]
HIGH PROFILE HARD CORNER PAD IN GILBERTGuadalupe Rd & Gilbert Rd - Southeast CornerGilbert, Arizona
VA
N
DRI
VE
THRU
DRI
VE
THRU
LEGEND
PLAN NOTES
FE
P6
DEMISING WALL
INTERIOR PARTION
DOOR NUMBER, SEE DOORSCHEDULE
GLAZING, AS OCCURS
2A10BC FIRE EXTINGUISHERMOUNTED ON WALL BRACKET AT48" A.F.F.
PARTITION TAG, SEE A8.1/A8.2FOR TYPE/STYLE/DETAIL
ITEMS DEPICTED WITH DASHEDLINES ARE FURNITURE AND/OREQUIPMENT PROVIDED BY THETENANT AND NOT IN THIS SCOPE,U.N.O.
DIMENSIONS AS SHOWN IN THE DRAWINGS ARE TO THECENTERLINE OF NEW INTERIOR PARTITION WALLS AND THE TOINSIDE FACE OF EXISTING PARTITIONS OR EXTERIORWALLS/SYSTEMS, U.N.O.
COORDINATE WITH STRUCTURAL, MECHANICAL, PLUMBING,ELECTRICAL FOR ALL STRUCTURAL, EQUIPMENT AND/ORITEMS FOR DIMENSIONS AND ADDITIONAL REQUIREMENTS
AT FLOORING MATERIALS CHANGE, LOCATE TRANSITION ATTHE CENTERLINE OF THE DOOR. VERIFY WITH ARCHITECT FORSPECIAL CASES PRIOR TO PLACEMENT. FLOAT FLOOR ASREQUIRED TO MANUFACTURER/INDUSTRY STANDARDS PRIORTO INSTALLATION OF FLOOR MATERIALS
MAINTAIN A MINIMUM CLEAR, UNOBSTRUCTED EXIT WIDTHOF 48" TO ALL REQUIRED EXITS
ALL PARTITIONS/FURRING AT CONFERENCE AND TOILETROOMS TO HAVE SOUND BATTS, R-11 IN 3 5/8" STUDS ANDR-19 IN 6" STUDS, U.N.O.
BLOCKING IS REQUIRED IN/BEHIND ALL WALL MOUNTEDMILLWORK, DOOR STOPS, OTHER FURNITURE ANDEQUIPMENT. ALL 2x WOOD BLOCKING SHALL BE FIRERETARDANT TREATED OR USE 6"x16 GA METAL STRAPPING.
101A
1A8.1
DETAIL TAG / SECTION KEY, SEEPLAN SET
A WINDOW ELEVATION TAG, SEEA4.1
VERIFY CASEWORK, EQUIPMENTWITH OWNER FORREQUIREMENTS
CMU WALL
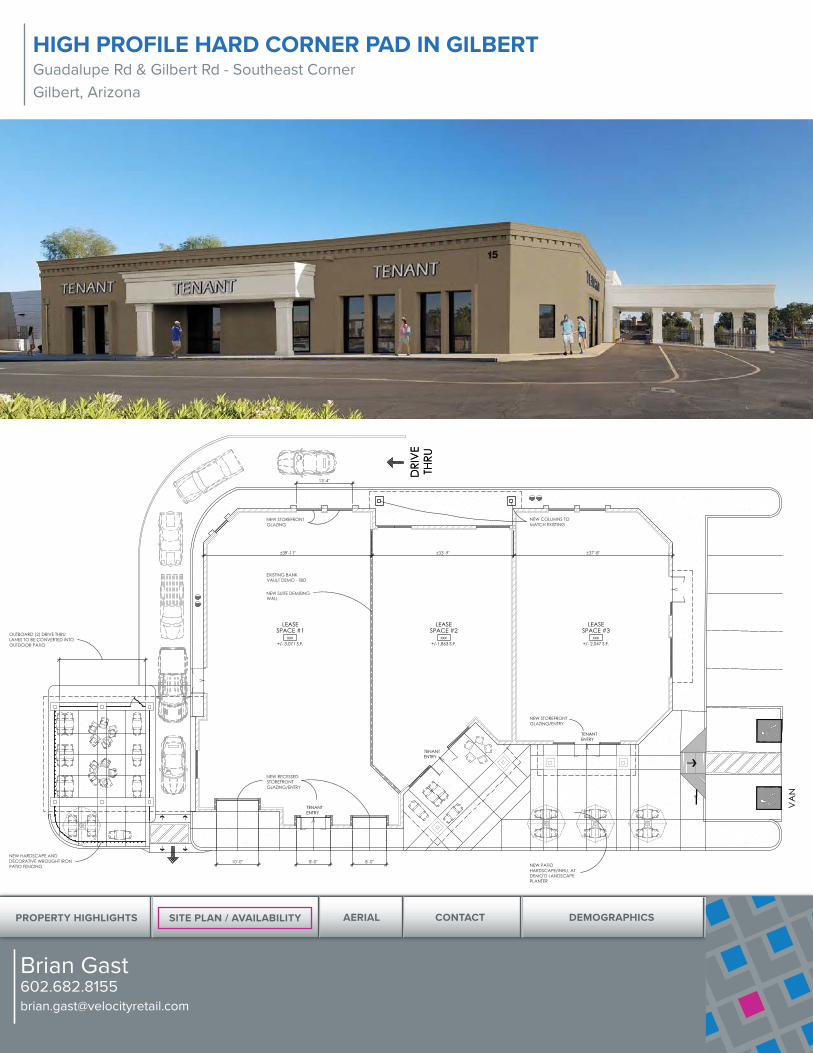
LEASESPACE #1
xxx+/- 3,071 S.F.
LEASESPACE #2
xxx+/-1,863 S.F.
LEASESPACE #3
xxx+/- 2,047 S.F.
TENANTENTRY
TENANTENTRY
TENANTENTRY
±39'-11" ±33'-9" ±37'-8"
10'-0" 8'-0" 8'-0"
NEW RECESSEDSTOREFRONTGLAZING/ENTRY
NEW STOREFRONTGLAZING/ENTRY
EXISTING BANKVAULT DEMO - TBD
NEW SUITE DEMISINGWALL
13'-4"
NEW STOREFRONTGLAZING
NEW COLUMNS TOMATCH EXISTING
NEW PATIOHARDSCAPE/INFILL ATDEMO'D LANDSCAPEPLANTER
OUTBOARD (2) DRIVE THRULANES TO BE CONVERTED INTOOUTDOOR PATIO
NEW HARDSCAPE ANDDECORATIVE WROUGHT IRONPATIO FENCING
EXISTING BUILDING +/-6,981 S.F.
floor planscale: 1/8"-1'-0"
PRELIMINARY
NOT FOR
CONSTRUCTION
schematic designseptember 25, 2018
mixe
d u
se c
orne
r pad
finnarchitects.com
15 e
. gilb
ert r
oad
gilb
ert,
arizo
na
architects, llcfinnarchitects.com
the architectural design, conceptionand data presented hereinrepresents an instrument of serviceprovided in connection with thedesign build agreement for theexclusive use of FINN architects, llc.any other use or release or thesedrawings may result in civildamages.
this plan/site plan has beenprepared without the benefit of asurvey. depictions may not beaccurate or fully reflect alldimensions, data, etc. which mayaffect the design and usability of thissite. all design shown here is strictlyconceptual.
FINN0 0/ 00 /2
0 18
1810 west loemann drive, queen creek, arizona 85142 (480-206-8229)
A2.1
PROPERTY HIGHLIGHTS SITE PLAN / AVAILABILITY AERIAL CONTACT DEMOGRAPHICS
Brian [email protected]
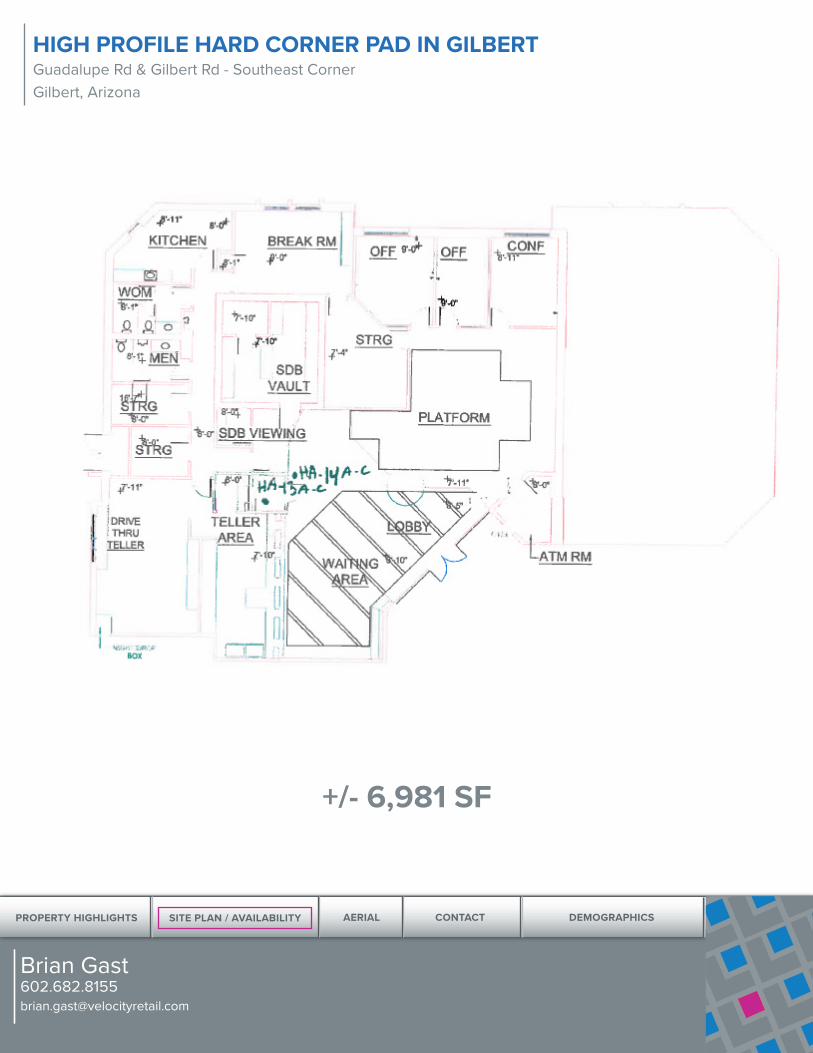
+/- 6,981 SF
HIGH PROFILE HARD CORNER PAD IN GILBERTGuadalupe Rd & Gilbert Rd - Southeast CornerGilbert, Arizona

PROPERTY HIGHLIGHTS SITE PLAN / AVAILABILITY AERIAL CONTACT DEMOGRAPHICS
Brian [email protected]
© Jones Lang LaSalle IP, Inc. All rights reserved. All information contained herein is from sources deemed reliable; however, no representation or warranty is made to the accuracy thereof.
15 East Guadalupe Road
For additional information:
Mark F. Gustin, SIOR, CCIMManaging Director+1 602 282 [email protected]
Gilbert, Arizona

PROPERTY HIGHLIGHTS SITE PLAN / AVAILABILITY AERIAL CONTACT DEMOGRAPHICS
Brian [email protected]
Demographic Source: Applied Geographic Solutions 04/2018, TIGER Geography page 1 of 5©2018, Sites USA, Chandler, Arizona, 480-491-1112
Thi
s re
port
was
pro
duce
d us
ing
data
from
priv
ate
and
gove
rnm
ent s
ourc
es d
eem
ed to
be
relia
ble.
The
info
rmat
ion
here
in is
pro
vide
d w
ithou
t rep
rese
ntat
ion
or w
arra
nty.
EXPANDED PROFILE2000-2010 Census, 2018 Estimates with 2023 ProjectionsCalculated using Weighted Block Centroid from Block Groups
Lat/Lon: 33.3646/-111.7897RF5
N Gilbert Rd & E Guadalupe Rd1 mi radius 3 mi radius 5 mi radius
Gilbert, AZ 85234
PopulationEstimated Population (2018) 14,735 129,686 399,135Projected Population (2023) 15,964 141,031 434,607Census Population (2010) 14,521 126,483 371,342Census Population (2000) 15,409 128,190 352,436Projected Annual Growth (2018 to 2023) 1,229 1.7% 11,345 1.7% 35,472 1.8%
Historical Annual Growth (2010 to 2018) 214 0.2% 3,203 0.3% 27,793 0.9%
Historical Annual Growth (2000 to 2010) -888 -0.6% -1,707 -0.1% 18,906 0.5%
Estimated Population Density (2018) 4,694 psm 4,589 psm 5,084 psm
Trade Area Size 3.14 sq mi 28.26 sq mi 78.51 sq mi
HouseholdsEstimated Households (2018) 5,390 44,592 143,204Projected Households (2023) 5,648 46,977 151,226Census Households (2010) 5,281 43,267 132,202Census Households (2000) 5,032 41,371 121,981Estimated Households with Children (2018) 2,050 38.0% 17,792 39.9% 52,390 36.6%
Estimated Average Household Size (2018) 2.73 2.90 2.77
Average Household IncomeEstimated Average Household Income (2018) $86,053 $94,168 $82,161Projected Average Household Income (2023) $98,865 $107,726 $93,502
Estimated Average Family Income (2018) $93,403 $104,429 $96,693
Median Household IncomeEstimated Median Household Income (2018) $68,158 $75,348 $66,360Projected Median Household Income (2023) $79,135 $86,665 $76,127
Estimated Median Family Income (2018) $79,777 $86,107 $78,904
Per Capita IncomeEstimated Per Capita Income (2018) $31,502 $32,421 $29,537Projected Per Capita Income (2023) $35,006 $35,922 $32,589Estimated Per Capita Income 5 Year Growth $3,504 11.1% $3,501 10.8% $3,052 10.3%
Estimated Average Household Net Worth (2018) $863,228 $931,322 $793,065
Daytime Demos (2018)Total Businesses 895 6,027 15,447Total Employees 7,768 55,509 143,742Company Headquarter Businesses 3 0.4% 23 0.4% 47 0.3%
Company Headquarter Employees 425 5.5% 1,194 2.2% 3,854 2.7%
Employee Population per Business 8.7 9.2 9.3Residential Population per Business 16.5 21.5 25.8
PROPERTY HIGHLIGHTS SITE PLAN / AVAILABILITY AERIAL CONTACT DEMOGRAPHICS
Brian [email protected]
Demographic Source: Applied Geographic Solutions 04/2018, TIGER Geography page 2 of 5©2018, Sites USA, Chandler, Arizona, 480-491-1112
Thi
s re
port
was
pro
duce
d us
ing
data
from
priv
ate
and
gove
rnm
ent s
ourc
es d
eem
ed to
be
relia
ble.
The
info
rmat
ion
here
in is
pro
vide
d w
ithou
t rep
rese
ntat
ion
or w
arra
nty.
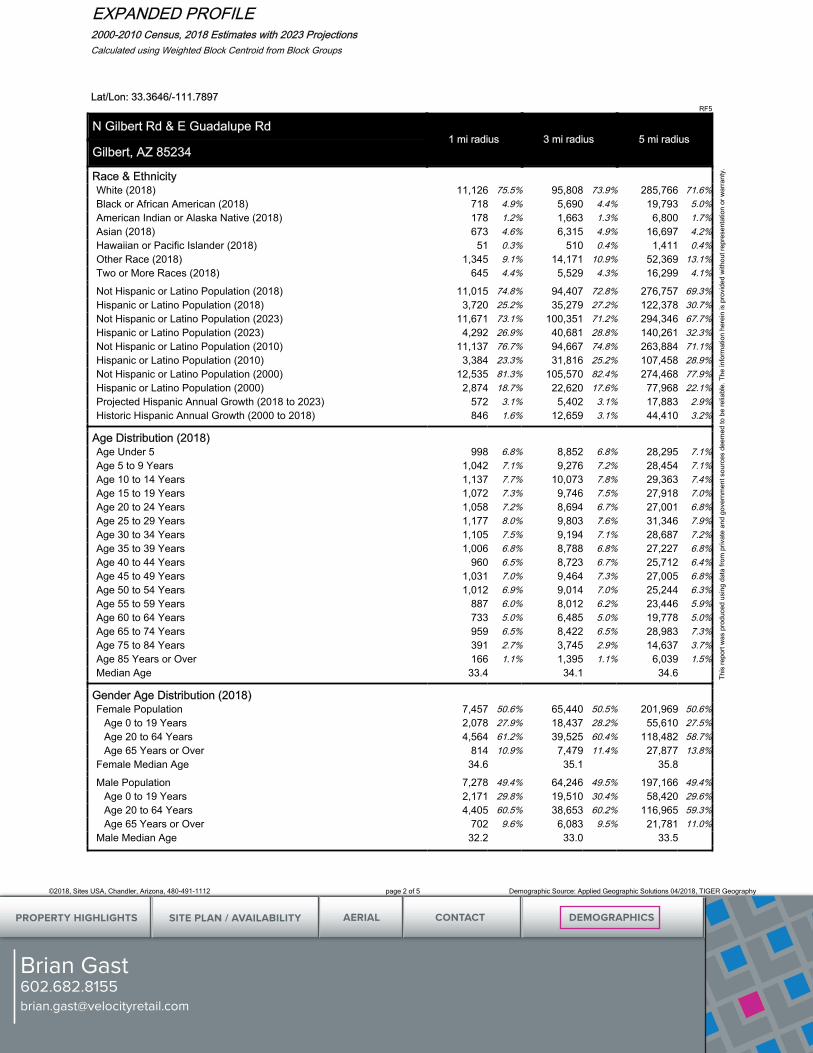
EXPANDED PROFILE2000-2010 Census, 2018 Estimates with 2023 ProjectionsCalculated using Weighted Block Centroid from Block Groups
Lat/Lon: 33.3646/-111.7897RF5
N Gilbert Rd & E Guadalupe Rd1 mi radius 3 mi radius 5 mi radius
Gilbert, AZ 85234
Race & EthnicityWhite (2018) 11,126 75.5% 95,808 73.9% 285,766 71.6%Black or African American (2018) 718 4.9% 5,690 4.4% 19,793 5.0%American Indian or Alaska Native (2018) 178 1.2% 1,663 1.3% 6,800 1.7%Asian (2018) 673 4.6% 6,315 4.9% 16,697 4.2%Hawaiian or Pacific Islander (2018) 51 0.3% 510 0.4% 1,411 0.4%Other Race (2018) 1,345 9.1% 14,171 10.9% 52,369 13.1%Two or More Races (2018) 645 4.4% 5,529 4.3% 16,299 4.1%
Not Hispanic or Latino Population (2018) 11,015 74.8% 94,407 72.8% 276,757 69.3%Hispanic or Latino Population (2018) 3,720 25.2% 35,279 27.2% 122,378 30.7%Not Hispanic or Latino Population (2023) 11,671 73.1% 100,351 71.2% 294,346 67.7%Hispanic or Latino Population (2023) 4,292 26.9% 40,681 28.8% 140,261 32.3%Not Hispanic or Latino Population (2010) 11,137 76.7% 94,667 74.8% 263,884 71.1%Hispanic or Latino Population (2010) 3,384 23.3% 31,816 25.2% 107,458 28.9%Not Hispanic or Latino Population (2000) 12,535 81.3% 105,570 82.4% 274,468 77.9%Hispanic or Latino Population (2000) 2,874 18.7% 22,620 17.6% 77,968 22.1%Projected Hispanic Annual Growth (2018 to 2023) 572 3.1% 5,402 3.1% 17,883 2.9%Historic Hispanic Annual Growth (2000 to 2018) 846 1.6% 12,659 3.1% 44,410 3.2%
Age Distribution (2018)Age Under 5 998 6.8% 8,852 6.8% 28,295 7.1%Age 5 to 9 Years 1,042 7.1% 9,276 7.2% 28,454 7.1%Age 10 to 14 Years 1,137 7.7% 10,073 7.8% 29,363 7.4%Age 15 to 19 Years 1,072 7.3% 9,746 7.5% 27,918 7.0%Age 20 to 24 Years 1,058 7.2% 8,694 6.7% 27,001 6.8%Age 25 to 29 Years 1,177 8.0% 9,803 7.6% 31,346 7.9%Age 30 to 34 Years 1,105 7.5% 9,194 7.1% 28,687 7.2%Age 35 to 39 Years 1,006 6.8% 8,788 6.8% 27,227 6.8%Age 40 to 44 Years 960 6.5% 8,723 6.7% 25,712 6.4%Age 45 to 49 Years 1,031 7.0% 9,464 7.3% 27,005 6.8%Age 50 to 54 Years 1,012 6.9% 9,014 7.0% 25,244 6.3%Age 55 to 59 Years 887 6.0% 8,012 6.2% 23,446 5.9%Age 60 to 64 Years 733 5.0% 6,485 5.0% 19,778 5.0%Age 65 to 74 Years 959 6.5% 8,422 6.5% 28,983 7.3%Age 75 to 84 Years 391 2.7% 3,745 2.9% 14,637 3.7%Age 85 Years or Over 166 1.1% 1,395 1.1% 6,039 1.5%Median Age 33.4 34.1 34.6
Gender Age Distribution (2018)Female Population 7,457 50.6% 65,440 50.5% 201,969 50.6%
Age 0 to 19 Years 2,078 27.9% 18,437 28.2% 55,610 27.5%Age 20 to 64 Years 4,564 61.2% 39,525 60.4% 118,482 58.7%Age 65 Years or Over 814 10.9% 7,479 11.4% 27,877 13.8%
Female Median Age 34.6 35.1 35.8
Male Population 7,278 49.4% 64,246 49.5% 197,166 49.4%Age 0 to 19 Years 2,171 29.8% 19,510 30.4% 58,420 29.6%Age 20 to 64 Years 4,405 60.5% 38,653 60.2% 116,965 59.3%Age 65 Years or Over 702 9.6% 6,083 9.5% 21,781 11.0%
Male Median Age 32.2 33.0 33.5

PROPERTY HIGHLIGHTS SITE PLAN / AVAILABILITY AERIAL CONTACT DEMOGRAPHICS
Brian [email protected]
Demographic Source: Applied Geographic Solutions 04/2018, TIGER Geography page 3 of 5©2018, Sites USA, Chandler, Arizona, 480-491-1112
Thi
s re
port
was
pro
duce
d us
ing
data
from
priv
ate
and
gove
rnm
ent s
ourc
es d
eem
ed to
be
relia
ble.
The
info
rmat
ion
here
in is
pro
vide
d w
ithou
t rep
rese
ntat
ion
or w
arra
nty.
EXPANDED PROFILE2000-2010 Census, 2018 Estimates with 2023 ProjectionsCalculated using Weighted Block Centroid from Block Groups
Lat/Lon: 33.3646/-111.7897RF5
N Gilbert Rd & E Guadalupe Rd1 mi radius 3 mi radius 5 mi radius
Gilbert, AZ 85234
Household Income Distribution (2018)HH Income $200,000 or More 338 6.3% 3,272 7.3% 8,041 5.6%HH Income $150,000 to $199,999 376 7.0% 3,228 7.2% 8,850 6.2%HH Income $100,000 to $149,999 887 16.5% 7,574 17.0% 21,046 14.7%HH Income $75,000 to $99,999 798 14.8% 7,131 16.0% 19,807 13.8%HH Income $50,000 to $74,999 955 17.7% 9,154 20.5% 27,949 19.5%HH Income $35,000 to $49,999 709 13.2% 5,513 12.4% 19,223 13.4%HH Income $25,000 to $34,999 563 10.4% 3,338 7.5% 13,207 9.2%HH Income $15,000 to $24,999 425 7.9% 2,743 6.2% 12,166 8.5%HH Income Under $15,000 338 6.3% 2,639 5.9% 12,916 9.0%
HH Income $35,000 or More 4,064 75.4% 35,872 80.4% 104,916 73.3%HH Income $75,000 or More 2,399 44.5% 21,205 47.6% 57,744 40.3%
Housing (2018)Total Housing Units 5,569 45,923 152,414Housing Units Occupied 5,390 96.8% 44,592 97.1% 143,204 94.0%
Housing Units Owner-Occupied 3,133 58.1% 29,532 66.2% 87,075 60.8%Housing Units, Renter-Occupied 2,257 41.9% 15,060 33.8% 56,129 39.2%
Housing Units, Vacant 179 3.2% 1,331 2.9% 9,209 6.0%
Marital Status (2018)Never Married 4,251 36.8% 34,327 33.8% 107,988 34.5%Currently Married 5,110 44.2% 48,356 47.6% 139,827 44.7%Separated 429 3.7% 3,438 3.4% 12,960 4.1%Widowed 347 3.0% 3,242 3.2% 13,203 4.2%Divorced 1,419 12.3% 12,122 11.9% 39,045 12.5%
Household Type (2018)Population Family 12,431 84.4% 112,874 87.0% 335,576 84.1%Population Non-Family 2,273 15.4% 16,406 12.7% 61,653 15.4%Population Group Quarters 31 0.2% 407 0.3% 1,907 0.5%
Family Households 3,679 68.3% 32,558 73.0% 96,921 67.7%Non-Family Households 1,711 31.7% 12,033 27.0% 46,283 32.3%Married Couple with Children 1,233 24.1% 11,675 24.1% 32,774 23.4%Average Family Household Size 3.4 3.5 3.5
Household Size (2018)1 Person Households 1,271 23.6% 8,777 19.7% 34,853 24.3%2 Person Households 1,600 29.7% 13,369 30.0% 42,844 29.9%3 Person Households 995 18.5% 8,113 18.2% 23,238 16.2%4 Person Households 796 14.8% 7,303 16.4% 20,722 14.5%5 Person Households 448 8.3% 3,830 8.6% 11,686 8.2%6 or More Person Households 278 5.2% 3,199 7.2% 9,862 6.9%
Household Vehicles (2018)Households with 0 Vehicles Available 291 5.4% 1,396 3.1% 7,605 5.3%Households with 1 Vehicles Available 1,714 31.8% 12,987 29.1% 49,383 34.5%Households with 2 or More Vehicles Available 3,384 62.8% 30,209 67.7% 86,216 60.2%
Total Vehicles Available 10,209 88,741 263,731Average Vehicles Per Household 1.9 2.0 1.8

PROPERTY HIGHLIGHTS SITE PLAN / AVAILABILITY AERIAL CONTACT DEMOGRAPHICS
Brian [email protected]
Demographic Source: Applied Geographic Solutions 04/2018, TIGER Geography page 4 of 5©2018, Sites USA, Chandler, Arizona, 480-491-1112
Thi
s re
port
was
pro
duce
d us
ing
data
from
priv
ate
and
gove
rnm
ent s
ourc
es d
eem
ed to
be
relia
ble.
The
info
rmat
ion
here
in is
pro
vide
d w
ithou
t rep
rese
ntat
ion
or w
arra
nty.
EXPANDED PROFILE2000-2010 Census, 2018 Estimates with 2023 ProjectionsCalculated using Weighted Block Centroid from Block Groups
Lat/Lon: 33.3646/-111.7897RF5
N Gilbert Rd & E Guadalupe Rd1 mi radius 3 mi radius 5 mi radius
Gilbert, AZ 85234
Labor Force (2018)Estimated Labor Population Age 16 Years or Over 11,370 99,585 307,544Estimated Civilian Employed 8,187 72.0% 69,146 69.4% 203,587 66.2%Estimated Civilian Unemployed 285 2.5% 2,397 2.4% 8,128 2.6%Estimated in Armed Forces 16 0.1% 34 - 210 0.1%Estimated Not in Labor Force 2,882 25.4% 28,008 28.1% 95,619 31.1%Unemployment Rate 2.5% 2.4% 2.6%
Occupation (2015)Occupation: Population Age 16 Years or Over 8,180 69,167 203,856Management, Business, Financial Operations 1,236 15.1% 10,605 15.3% 30,054 14.7%Professional, Related 1,814 22.2% 15,700 22.7% 44,510 21.8%Service 1,474 18.0% 12,318 17.8% 38,334 18.8%Sales, Office 2,254 27.6% 18,834 27.2% 54,057 26.5%Farming, Fishing, Forestry 9 0.1% 106 0.2% 318 0.2%Construct, Extraction, Maintenance 700 8.6% 5,112 7.4% 16,880 8.3%Production, Transport Material Moving 693 8.5% 6,493 9.4% 19,703 9.7%
White Collar Workers 5,304 64.8% 45,138 65.3% 128,621 63.1%Blue Collar Workers 2,876 35.2% 24,029 34.7% 75,235 36.9%
Consumer Expenditure (2018)Total Household Expenditure $343 M $3.01 B $8.72 B
Total Non-Retail Expenditure $178 M 52.0% $1.57 B 52.0% $4.53 B 51.9%Total Retail Expenditure $165 M 48.0% $1.44 B 48.0% $4.19 B 48.1%
Apparel $12.0 M 3.5% $106 M 3.5% $306 M 3.5%Contributions $15.1 M 4.4% $136 M 4.5% $383 M 4.4%Education $12.9 M 3.8% $116 M 3.8% $327 M 3.7%Entertainment $19.3 M 5.6% $170 M 5.7% $491 M 5.6%Food and Beverages $50.0 M 14.6% $438 M 14.5% $1.28 B 14.6%Furnishings and Equipment $11.9 M 3.5% $106 M 3.5% $302 M 3.5%Gifts $8.60 M 2.5% $76.5 M 2.5% $217 M 2.5%Health Care $26.9 M 7.9% $233 M 7.8% $687 M 7.9%Household Operations $9.98 M 2.9% $89.0 M 3.0% $253 M 2.9%Miscellaneous Expenses $5.01 M 1.5% $43.6 M 1.4% $128 M 1.5%Personal Care $4.45 M 1.3% $39.0 M 1.3% $113 M 1.3%Personal Insurance $2.59 M 0.8% $23.1 M 0.8% $65.6 M 0.8%Reading $759 K 0.2% $6.67 M 0.2% $19.3 M 0.2%Shelter $70.4 M 20.6% $618 M 20.5% $1.79 B 20.6%Tobacco $2.04 M 0.6% $17.4 M 0.6% $52.3 M 0.6%Transportation $65.0 M 19.0% $571 M 19.0% $1.65 B 19.0%Utilities $25.5 M 7.4% $221 M 7.4% $651 M 7.5%
Educational Attainment (2018)Adult Population Age 25 Years or Over 9,428 83,045 258,104Elementary (Grade Level 0 to 8) 229 2.4% 3,132 3.8% 14,181 5.5%Some High School (Grade Level 9 to 11) 516 5.5% 4,239 5.1% 17,046 6.6%High School Graduate 1,993 21.1% 17,273 20.8% 57,806 22.4%Some College 2,530 26.8% 22,607 27.2% 68,450 26.5%Associate Degree Only 1,114 11.8% 8,066 9.7% 23,716 9.2%Bachelor Degree Only 2,096 22.2% 18,457 22.2% 51,654 20.0%Graduate Degree 951 10.1% 9,270 11.2% 25,251 9.8%

PROPERTY HIGHLIGHTS SITE PLAN / AVAILABILITY AERIAL CONTACT DEMOGRAPHICS
Brian [email protected]
Demographic Source: Applied Geographic Solutions 04/2018, TIGER Geography page 5 of 5©2018, Sites USA, Chandler, Arizona, 480-491-1112
Thi
s re
port
was
pro
duce
d us
ing
data
from
priv
ate
and
gove
rnm
ent s
ourc
es d
eem
ed to
be
relia
ble.
The
info
rmat
ion
here
in is
pro
vide
d w
ithou
t rep
rese
ntat
ion
or w
arra
nty.
EXPANDED PROFILE2000-2010 Census, 2018 Estimates with 2023 ProjectionsCalculated using Weighted Block Centroid from Block Groups
Lat/Lon: 33.3646/-111.7897RF5
N Gilbert Rd & E Guadalupe Rd1 mi radius 3 mi radius 5 mi radius
Gilbert, AZ 85234
Units In Structure (2015)1 Detached Unit 3,569 67.6% 33,760 78.0% 94,513 71.5%1 Attached Unit 329 6.2% 1,990 4.6% 7,098 5.4%2 to 4 Units 244 4.6% 1,696 3.9% 7,641 5.8%5 to 9 Units 371 7.0% 2,238 5.2% 8,401 6.4%10 to 19 Units 293 5.6% 2,017 4.7% 9,209 7.0%20 to 49 Units 156 3.0% 624 1.4% 2,965 2.2%50 or More Units 353 6.7% 1,541 3.6% 6,183 4.7%Mobile Home or Trailer 66 1.2% 700 1.6% 7,168 5.4%Other Structure 3 0.1% 39 0.1% 237 0.2%
Homes Built By Year (2015)Homes Built 2010 or later 64 1.2% 656 1.5% 2,216 1.7%Homes Built 2000 to 2009 661 12.5% 5,236 12.1% 20,170 15.3%Homes Built 1990 to 1999 1,580 29.9% 16,095 37.2% 37,246 28.2%Homes Built 1980 to 1989 1,856 35.1% 11,782 27.2% 36,552 27.6%Homes Built 1970 to 1979 826 15.6% 7,136 16.5% 28,112 21.3%Homes Built 1960 to 1969 143 2.7% 1,853 4.3% 9,269 7.0%Homes Built 1950 to 1959 128 2.4% 827 1.9% 4,668 3.5%Homes Built Before 1949 75 1.4% 378 0.9% 2,262 1.7%
Home Values (2015)Home Values $1,000,000 or More 16 0.5% 185 0.6% 519 0.6%Home Values $500,000 to $999,999 188 6.1% 1,811 6.3% 4,936 5.9%Home Values $400,000 to $499,999 222 7.2% 2,042 7.1% 5,735 6.9%Home Values $300,000 to $399,999 462 14.9% 4,770 16.5% 12,136 14.6%Home Values $200,000 to $299,999 1,013 32.7% 10,004 34.5% 27,811 33.4%Home Values $150,000 to $199,999 696 22.5% 5,776 19.9% 17,017 20.4%Home Values $100,000 to $149,999 288 9.3% 2,973 10.3% 9,487 11.4%Home Values $70,000 to $99,999 124 4.0% 869 3.0% 3,030 3.6%Home Values $50,000 to $69,999 40 1.3% 288 1.0% 1,157 1.4%Home Values $25,000 to $49,999 13 0.4% 116 0.4% 1,112 1.3%Home Values Under $25,000 53 1.7% 565 2.0% 3,777 4.5%Owner-Occupied Median Home Value $228,922 $241,458 $223,085Renter-Occupied Median Rent $888 $938 $871
Transportation To Work (2015)Drive to Work Alone 5,686 80.7% 48,565 78.2% 147,178 77.0%Drive to Work in Carpool 612 8.7% 6,356 10.2% 21,220 11.1%Travel to Work by Public Transportation 79 1.1% 1,006 1.6% 3,682 1.9%Drive to Work on Motorcycle 65 0.9% 428 0.7% 1,030 0.5%Walk or Bicycle to Work 264 3.8% 1,340 2.2% 4,480 2.3%Other Means 75 1.1% 522 0.8% 2,100 1.1%Work at Home 261 3.7% 3,869 6.2% 11,505 6.0%
Travel Time (2015)Travel to Work in 14 Minutes or Less 2,004 29.5% 13,611 23.4% 41,980 23.4%Travel to Work in 15 to 29 Minutes 3,298 48.6% 27,803 47.8% 81,596 45.4%Travel to Work in 30 to 59 Minutes 2,168 32.0% 19,881 34.1% 56,630 31.5%Travel to Work in 60 Minutes or More 397 5.8% 3,429 5.9% 11,391 6.3%Average Minutes Travel to Work 21.6 22.8 22.5
PROPERTY HIGHLIGHTS SITE PLAN / AVAILABILITY AERIAL CONTACT DEMOGRAPHICS
Brian [email protected]
2415 East Camelback Road, Suite 400Phoenix, Arizona 85016602.682.8100
Brian [email protected]
The information contained in this brochure has been obtained from sources believed reliable. We have not verified the information, and make no guaran-tee, warranty or representation about it. Any financial projections, assumptions or estimates used are for example only and do not represent the current or future performance of the property. We recommend that you and/or your advisors conduct a complete analysis of the property and make your own deter-mination on the suitability of the property for your specific needs. Velocity Retail Group, LLC and the VRG logo are service marks of Velocity Retail Group, LLC. All other marks displayed in this document are the property of their respective owners.