High Frequency Trading & Flash Crash
44
Content High Frequency Trading Mini Flash Crashes References High Frequency Trading Anton Golub Manchester Business School April 19, 2011 Anton Golub High Frequency Trading
-
Upload
sukju-hwang -
Category
Documents
-
view
2.592 -
download
2
Transcript of High Frequency Trading & Flash Crash
ContentHigh Frequency Trading
Mini Flash CrashesReferences
High Frequency Trading
Anton Golub
Manchester Business School
April 19, 2011
Anton Golub High Frequency Trading

ContentHigh Frequency Trading
Mini Flash CrashesReferences
High Frequency TradingCharacteristicsMarket MicrostructureHigh Frequency Trading Strategies
Mini Flash CrashesIntroductionDefinitionExamplesStatistics
References
Anton Golub High Frequency Trading

ContentHigh Frequency Trading
Mini Flash CrashesReferences
CharacteristicsMarket MicrostructureHigh Frequency Trading Strategies
Definition & Characteristics
High Frequency Trading (HFT):
I extremely fast, fully automated and computerized trading
I short trading time horizon
I benefits from market liquidity imbalances and short-term pricinginefficiencies
I require real-time data analysis and trading decisions
I do not carry overnight positions
As HFT is sensitive to latency, high frequency trading firms:
I co-locate their computers next to exchanges
I buy raw data from exchanges and reconstruct the order book bythem self
Anton Golub High Frequency Trading

ContentHigh Frequency Trading
Mini Flash CrashesReferences
CharacteristicsMarket MicrostructureHigh Frequency Trading Strategies
Volume & Who is trading & Annual Profits
HFT represents 70% of U.S equity volume (77% in UK) - done by only2% of traders;
Biggest traders: Goldman Sachs, Credit Suisse, GETCO, RenaissanceTechnologies, Citadel. Yearly profits in U.S. are estimated to $21 billion.
Anton Golub High Frequency Trading
ContentHigh Frequency Trading
Mini Flash CrashesReferences
CharacteristicsMarket MicrostructureHigh Frequency Trading Strategies
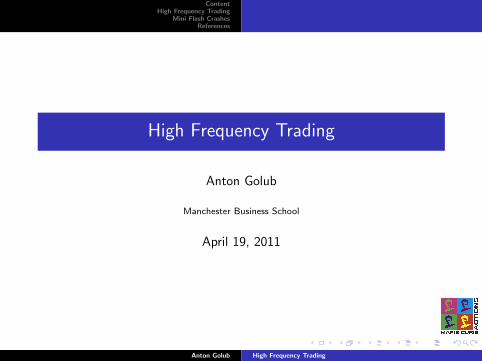
Strategies
HFT can be broadly categorized into:
I liquidity detection strategies: Rebate Trading, Automated MarketMaking
I pricing inefficiencies strategies: Scalping, Latency Arbitrage,Statistical Arbitrage
I predatory strategies: Flash Trading, Quote Stuffing
Anton Golub High Frequency Trading

ContentHigh Frequency Trading
Mini Flash CrashesReferences
CharacteristicsMarket MicrostructureHigh Frequency Trading Strategies
What is the essence of HFT strategies?
Customer: How much are those?Merchant: A buck fifty.Customer: I’ll take some.Merchant: They’re a buck fifty-one.Customer: Um, you said a buck fifty.Merchant: That was before I knew you wanted some.Customer: You can’t do that!Merchant: It’s my shop.Customer: But I need to buy a hundred!Merchant: A hundred? Then it’s buck fifty-two.Customer: You’re ripping me off.Merchant: Supply and demand, pal. You want ’em or not?
Anton Golub High Frequency Trading

ContentHigh Frequency Trading
Mini Flash CrashesReferences
CharacteristicsMarket MicrostructureHigh Frequency Trading Strategies
Rebate Trading
Exchanges pay HF traders that post best limit sell or best limit buyorders - Liquidity Rebate: $0,003/share.HF traders plan:
I place a limit buy order
I if his order is matched, he turns around and place a limit sell orderat the same price
I profit from trading will be $0,00, but he will collect rebates!
Anton Golub High Frequency Trading

ContentHigh Frequency Trading
Mini Flash CrashesReferences
CharacteristicsMarket MicrostructureHigh Frequency Trading Strategies
Rebate Trading
Price Sharesbest offer 10,02 600
best bid 10,01 100 ← HFT buy orderbid 10,00 100
Price Sharesoffer 10,02 600
best offer 10,01 100 ← HFT sell order
best bid 10,00 100
Total profit = Profit from trading + Rebates =$0, 00× 200 + $0, 003× 200 = $0, 60.
Anton Golub High Frequency Trading
ContentHigh Frequency Trading
Mini Flash CrashesReferences
CharacteristicsMarket MicrostructureHigh Frequency Trading Strategies
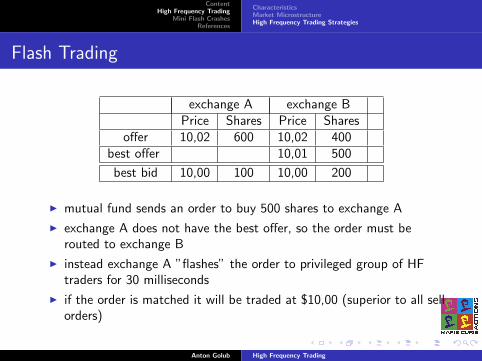
Flash Trading
exchange A exchange BPrice Shares Price Shares
offer 10,02 600 10,02 400best offer 10,01 500
best bid 10,00 100 10,00 200
I mutual fund sends an order to buy 500 shares to exchange A
I exchange A does not have the best offer, so the order must berouted to exchange B
I instead exchange A ”flashes” the order to privileged group of HFtraders for 30 milliseconds
I if the order is matched it will be traded at $10,00 (superior to all sellorders)
Anton Golub High Frequency Trading

ContentHigh Frequency Trading
Mini Flash CrashesReferences
CharacteristicsMarket MicrostructureHigh Frequency Trading Strategies
Flash Trading
What is the problem with Flash Trading?
I creating a tiered market - some traders see the incoming order, otherdo not
I ”gaming” the exchange fee structure - orders must be routed to thevenue with the best possible price
I allows front running - HF traders have the upper hand in knowingmutual funds’ intentions
Anton Golub High Frequency Trading

ContentHigh Frequency Trading
Mini Flash CrashesReferences
IntroductionDefinitionExamplesStatistics
Flash Crash
FLASH CRASH
Anton Golub High Frequency Trading

ContentHigh Frequency Trading
Mini Flash CrashesReferences
IntroductionDefinitionExamplesStatistics
May 6th Flash Crash
May 6th Flash Crash:
I second largest point swing of 1,010.14 points
I biggest one-day point decline of 998.5 points, on an intraday basis inDJIA history
I markets crashed in less than 5 minutes, just to soon recover
Figure: Flash Crash
Flash Crash + scaling laws/fractal nature of price⇒ mini Flash crash
Anton Golub High Frequency Trading
ContentHigh Frequency Trading
Mini Flash CrashesReferences
IntroductionDefinitionExamplesStatistics
Definition of Mini Flash Crash
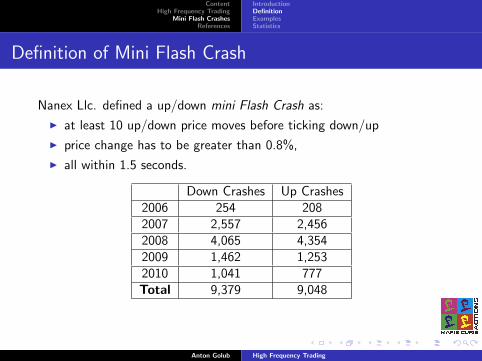
Nanex Llc. defined a up/down mini Flash Crash as:
I at least 10 up/down price moves before ticking down/up
I price change has to be greater than 0.8%,
I all within 1.5 seconds.
Down Crashes Up Crashes2006 254 2082007 2,557 2,4562008 4,065 4,3542009 1,462 1,2532010 1,041 777Total 9,379 9,048
Anton Golub High Frequency Trading

ContentHigh Frequency Trading
Mini Flash CrashesReferences
IntroductionDefinitionExamplesStatistics
Figure: Daily occurrences between January 1, 2006 and November 3, 2010
Anton Golub High Frequency Trading

ContentHigh Frequency Trading
Mini Flash CrashesReferences
IntroductionDefinitionExamplesStatistics
Example of Up Crash
Figure: Goldman Sachs (GS) Up Crash
Anton Golub High Frequency Trading

ContentHigh Frequency Trading
Mini Flash CrashesReferences
IntroductionDefinitionExamplesStatistics
Example of Down Crash
Figure: Goldman Sachs (GS) Down Crash
Anton Golub High Frequency Trading
ContentHigh Frequency Trading
Mini Flash CrashesReferences
IntroductionDefinitionExamplesStatistics
Important Research Questions
I How is getting hurt by mini Flash Crashes?
I How can we prevent mini Flash Crashes? Should we penalize theparties involved?
I What is the most likely time for a mini Flash Crash to occur?
I Which companies are most likely to get hit?
I Can HFT be singled out as the main source?
I Does the behavior of price change before/after the mini Flash Crash?
I Can mini Flash Crashes be predicted?
Anton Golub High Frequency Trading
ContentHigh Frequency Trading
Mini Flash CrashesReferences
IntroductionDefinitionExamplesStatistics
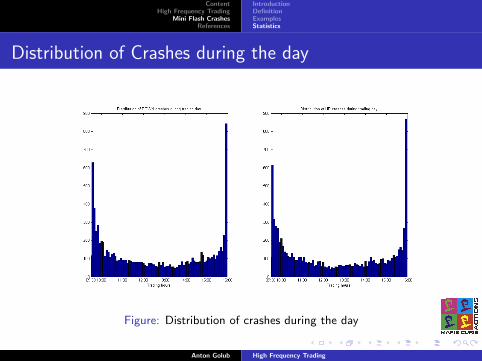
Distribution of Crashes during the day
Figure: Distribution of crashes during the day
Anton Golub High Frequency Trading

ContentHigh Frequency Trading
Mini Flash CrashesReferences
IntroductionDefinitionExamplesStatistics
Average Price before the Crash
Figure: Average Price before the crash
Anton Golub High Frequency Trading

ContentHigh Frequency Trading
Mini Flash CrashesReferences
IntroductionDefinitionExamplesStatistics
Average Price vs. Intensity of the Crash
Figure: Average Price of the down-crash vs. Intensity of the down-crash
Anton Golub High Frequency Trading

ContentHigh Frequency Trading
Mini Flash CrashesReferences
IntroductionDefinitionExamplesStatistics
Average Price vs. Intensity of the Crash
Figure: Average Price of the down-crash vs. Intensity of the down-crash
Anton Golub High Frequency Trading
ContentHigh Frequency Trading
Mini Flash CrashesReferences
IntroductionDefinitionExamplesStatistics
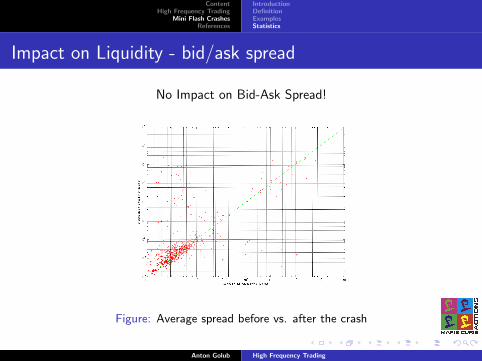
Impact on Liquidity - bid/ask spread
No Impact on Bid-Ask Spread!
Figure: Average spread before vs. after the crash
Anton Golub High Frequency Trading
ContentHigh Frequency Trading
Mini Flash CrashesReferences
IntroductionDefinitionExamplesStatistics
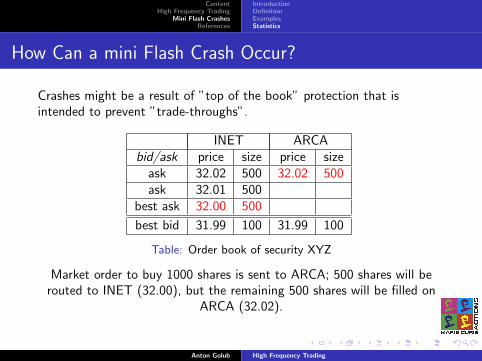
How Can a mini Flash Crash Occur?
Crashes might be a result of ”top of the book” protection that isintended to prevent ”trade-throughs”.
INET ARCAbid/ask price size price size
ask 32.02 500 32.02 500ask 32.01 500
best ask 32.00 500
best bid 31.99 100 31.99 100
Table: Order book of security XYZ
Market order to buy 1000 shares is sent to ARCA; 500 shares will berouted to INET (32.00), but the remaining 500 shares will be filled on
ARCA (32.02).
Anton Golub High Frequency Trading
ContentHigh Frequency Trading
Mini Flash CrashesReferences
References
High Frequency Trading and its Impact on Market Quality, Jonathan A.Brogaard, November 2010Low-Latency Trading, Joel Hasbrouck, Gideon Saar, November 2010Does Algorithmic Trading Improve Liquidity, Terrence Hendershott,Charles M. Jones, Albert J. Menkveld, Journal of Finance, ForthcomingThe Effect of High-Frequency Trading on Stock Volatility and PriceDiscovery, X. Frank Zhang, August 2010Market Efficiency and Microstructure Evolution in U.S. Equity Markets:A High-Frequency Perspective, Jeff Castura, Robert Litzenberger,Richard Gorelick, Yogesh Dwivedi, August 2010Empirical Limitations on High Frequency Trading Profitability, MichaelKerns, Alex Kulesza, Yuriy Nevmyvaka, June 2010Nanex LLc, - nanex.net -
Anton Golub High Frequency Trading
1 Introduction
On May 6th 2010, the U.S stock market experienced one of the most severe price dropsin its history; the Dow Jones Industrial Average (DJIA) index dropped almost 9% fromthe beginning of the day - the second largest point swing, 1,010.14 points, and the biggestone-day point decline, 998.5 points, on an intra-day basis in the history of the DJIAindex. The crash was so rapid that the index tumbled 900 points in less than 5 minutes,to later recover a bulk of its losses in the next 15 minutes of trading - this event has beentermed the ”May 6th Flash Crash” in the mainstream media. Such a large, rapid dropand subsequent recovery has raised many concerns about the stability of capital markets,resulting in a U.S. Securities and Exchange Commission investigation of the U.S. equitymarkets[12].
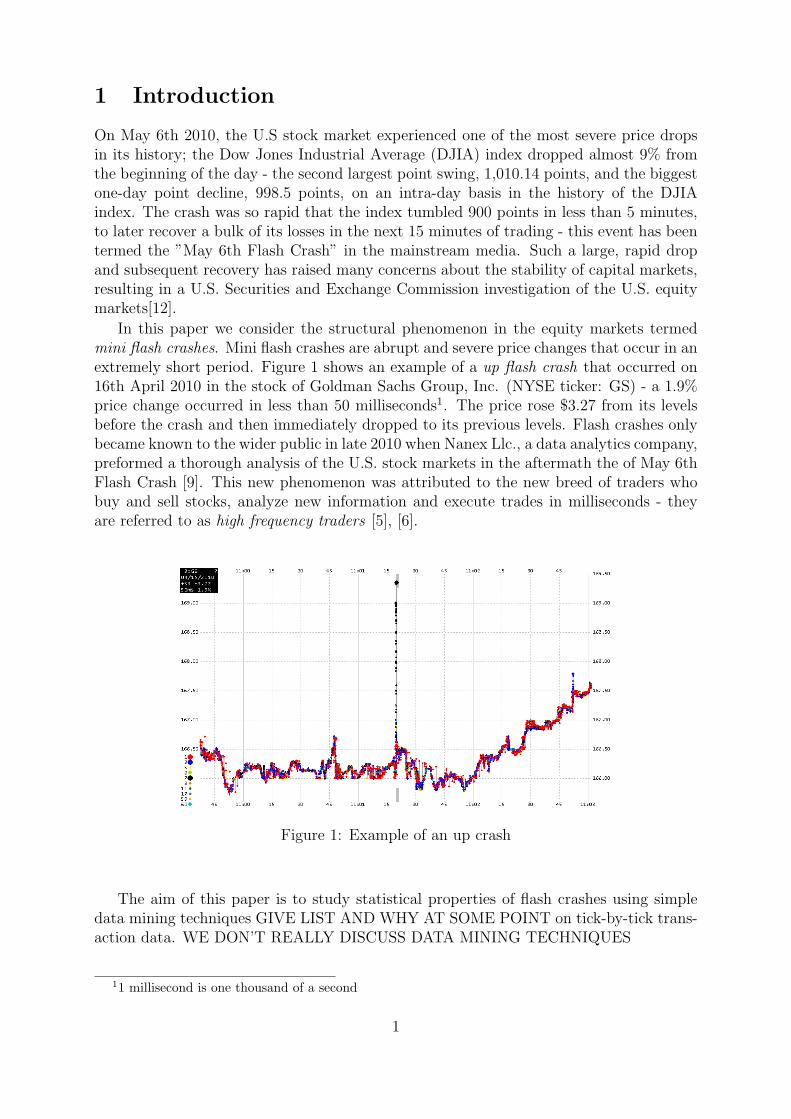
In this paper we consider the structural phenomenon in the equity markets termedmini flash crashes. Mini flash crashes are abrupt and severe price changes that occur in anextremely short period. Figure 1 shows an example of a up flash crash that occurred on16th April 2010 in the stock of Goldman Sachs Group, Inc. (NYSE ticker: GS) - a 1.9%price change occurred in less than 50 milliseconds1. The price rose $3.27 from its levelsbefore the crash and then immediately dropped to its previous levels. Flash crashes onlybecame known to the wider public in late 2010 when Nanex Llc., a data analytics company,preformed a thorough analysis of the U.S. stock markets in the aftermath the of May 6thFlash Crash [9]. This new phenomenon was attributed to the new breed of traders whobuy and sell stocks, analyze new information and execute trades in milliseconds - theyare referred to as high frequency traders [5], [6].
Figure 1: Example of an up crash
The aim of this paper is to study statistical properties of flash crashes using simpledata mining techniques GIVE LIST AND WHY AT SOME POINT on tick-by-tick trans-action data. WE DON’T REALLY DISCUSS DATA MINING TECHNIQUES
11 millisecond is one thousand of a second
1

Previous work has suggested that one-sidedness of the market can be the cause forflash crash; Easley et. al. [3] construct Volume-Synchronized Probability of InformedTrading (VPIN)2 and show that this metrics had among the highest values in on May6th. Chakravarty et. al. [13] use Intermarket Sweep Orders (ISO)3 as a proxy foraggressive liquidity taking, and find that elevated use of ISO on May 6th. Kirilenko et.al. [1] performed extensive analysis of May 6th Flash Crash and found that high frequencytraders did not trigger the crash, but their activities increased market volatility. NanexLlc., used order book data [9] of May 6th and found that quote stuffing4 and delays inNYSE Consolidated Quotation System caused the crash.
The aim of this paper is to study statistical properties of flash crashes on tick-by-ticktransaction data. We investigate a number of relationships that have not been reportedin the previous work: the price movement behaviour before crashes, the influence of flashcrashes on bid-ask spread, the average price before the crash compared with the crashintensity and the effect of particular sectors and geographic region on the crash etc. Ourconclusions suggest... IN PARTICULAR, WHAT IS UNUSUAL OR UNEXPECTED?
The rest of the paper is structured as follows: in section 2 we present backgroundmaterial on flash crashes, define up and down flash, describe the data used in the anal-ysis and present statistical characteristics of the crashes; in section 3 relationship amongdifferent aspects of flash crashes are presented - relationship of the stock price before thecrash and the severeness of the crash, trading dynamics of different geographical locationsduring the crash, price movement bias prior to the crash, evolution of price changes dur-ing the crash and impact of flash crash on liquidity. Findings in section 3 provide novelinsight into flash crashes. Chapter 4 discuss regulations that might be the catalyst foeoccurrences of flash crashes.
2 Background
2.1 May 6th Flash Crash
In this section we present some of the work on May 6th Flash Crash.
Kirilenko, Kyle, Samadi and Tuzun [1] describe the market structure of the E-miniS&P 500 stock index futures market on the day of the Flash Crash. They use audit-trail, transaction-level data for all regular transactions to classify over 15,000 ?CHECK?trading accounts that traded on May 6 into six categories: High Frequency Traders, Inter-mediaries, Fundamental Buyers, Fundamental Sellers, Opportunistic Traders, and SmallTraders. They asked the following: how did High Frequency Traders and other categoriestrade on May 6? what may have triggered the Flash Crash? what role did High FrequencyTraders play in the Flash Crash?. They concluded that High Frequency Traders did nottrigger the Flash Crash, but their responses to the unusually large selling pressure on thatday exacerbated market volatility. The U.S. Securities and Exchange Commission report
2VPIN is trademark of Tudor Investment3Intermarket sweep orders are limit orders that require they be executed in one specific market center
even if another market center is publishing a better quote4Quote-stuffing is a malicious technique of placing and then almost immediately cancelling large
numbers of rapid-fire orders to buy or sell stocks
2

on May 6th Market Events[12] was based on this paper.
Easley, Lopez de Prado and O’Hara [4] highlight the role played by order toxicityin affecting liquidity provision, and show that a measure of this toxicity, the Volume-Synchronized Probability of Informed Trading (VPIN) [3], captures the increasing toxicityof order flow in the hours and days prior to collapse. As the ”flash crash” might havebeen avoided had liquidity providers remained in the marketplace, a solution is proposedin the form of a ”VPIN contract” which would allow them to dynamically monitor andmanage their risks. IS THEIR DETAIL ON THE LIQUIDITY?
Chakravarty, Upson and Wood [13] investigate the contribution of trading aggressive-ness and liquidity supply to the flash crash. They find that trading aggressiveness wassignificantly higher for the entire day of the flash crash, as proxied through the use ofIntermarket Sweep Orders (ISO). ISO have been found to be primarily used by informedinstitutional traders and are allowed to trade through the best prices in the market. Theyshow that the information content of ISO trades on the day of the flash crash was highlyinformed, as measured by the information shares method of Hasbrouck [8]. During theflash crash, while the ISO volume was on 32% of total volume, ISO trades account forover 50% of the contribution to the price variance. Faced with this large increase in in-formed trading, liquidity suppliers withdrew from the market, decreasing overall liquidity.They show that as liquidity decreases in the market, it leads to an increase in ISO use,accelerating the market decline, but also speeding the market recovery - they recommendconsiderations of an ISO halt during periods of high market wide volatility. HOW TYP-ICAL IS THIS ISO BEHAVIOUR AROUND THE TIME OF THE FLASH CRASH
Lee, Cheng and Koh [2] produce 9 different simulations created by using a large-scale computer model to reconstruct the critical elements of the market events of May 6,2010. The resulting price distribution provides a reasonable resemblance to the descrip-tive statistics of the second-by-second prices of S&P 500 E-mini futures from 14:30 to15:00 on the day of the crash. Their results lead to a natural question for policy makers:if certain prescriptive measures such as position limits have a low probability of meetingthis policy objectives on a day like May 6, will there be any other more effective countermeasures without unintended consequences?
Nanex Llc. [9] found that quote saturation and NYSE Consolidated Quotation Sys-tem delays, combined with negative news from Greece and sale of E-mini S&P 500 fu-tures ”...was the beginning of the freak sell-off which became known as the flash crash”.They also disproved some of the theories about the cause of the crash: NYSE ”SlowQuote” mode or LRP’s (Liquidity Replenishment Point); movements in price of AppleInc. (AAPL) and stub quotes5. Nanex Llc. was the first to define and discover mini flashcrashes.
5Stub orders are limit orders placed well off a stock’s market price, e.g. buy order for $0.01 or sellorder for $100,000.00. A stub quote also serves as a safety net in that if a market maker does notn’t haveenough liquidity available to trade a stock near its recent price range, then a stub quote is entered sothat the market maker complies with its requirements without extending its quotes beyond its availableliquidity.
3

2.2 Definitions and Data Characteristics
Nanex Llc., a data analytics company, was the first to identify and define mini flashcrashes and we present their definition [9]. To qualify as a down crash candidate, thestock price change has to satisfy the following conditions:
1. it has to tick down at least 10 times before ticking up,
2. price changes have to occur within 1.5 seconds,
3. price change has to exceed -0.8%.
Down crashes are usually referred to as flash crashes, but in order to avoid confusion withthe May 6th Flash Crash, we will use the term down crashes here.
Likewise, to qualify as an up crash candidate, the stock price change has to satisfythe following conditions:
1. it has to tick up at least 10 times before ticking down,
2. price changes have to occur within 1.5 seconds,
3. price change has to exceed 0.8%.
Up crashes are usually referred to as flash dashes, but we will use the term up crashes here.
Figure 2: Occurrences of up and down crashes from 2006 to November 2010
2.3 Data Characteristics
Figure 2 shows the number of daily occurrences of up and down crashes and Table 1presents the number of occurrences in each year, from January 1st 2006 until November11th 2010. This period includes both the Lehman Brothers collapse and the May 6thFlash Crash, and it can be clearly seen that there is no bias towards up or down crashes.Ironically, as 2008 can be characterized as the most devastating year for U.S. equities
4
Year Down Crashes Up Crashestill November 2010 1041 777
2009 1462 12532008 4065 43542007 2576 24562006 254 208
Table 1: Yearly Occurrences of Crashes
markets, there are in fact more up crashes than down ones.
Data used to analyze the crashes has been downloaded from Wharton Research DataServices (WRDS) [10]6.
The data for each stock contains the following information:
• time stamp of trade - measured in seconds,
• price at which the trade occurred,
• volume of the trade,
• exchange from which the trade originated,
• type of order - relevant for Intermarket Sweep Orders (ISO).
The downloaded data for each crash contains 3 minutes of trading information sur-rounding the crash WHY NOT GO FOR A FIXED PERIOD BEFORE AND AFTER? ;for instance if the crash occurred at 12:45:11, we downloaded the trade data from 12:44:00to 12:46:59. As given above, the definition of a flash crash requires that 10 trades, ex-ceeding 0.8% change are executed within 1.5 seconds. As the obtained data is secondtime-stamped, we modify the second condition to require the trades to be executed within2 seconds, i.e. there has to be at least 10 consecutive price changes, greater than 0.8%,occurring within 2 seconds.
Nanex Llc. provided the following information about the crashes [9]:
• date of the crash
• ticker of the stock in which the crash occurred
• hour and minute of the crash.
The exact second of the crash, as well as confirmation that the crash occurred hasbeen verified by our analysis. This has though revealed certain discrepancy discrepanciesin the number of confirmed crashes between our and Nanex’s analysis. We were able toverify 5001 out of a suggested 9048 up crashes and 4765 out of a suggested 9389 downcrashes. Though in some cases it was obvious that trading characterized as a crash mighthave occurred, the condition of a 10 consecutive price changes, in either direction, was
6We thank the University of Manchester for providing access to WRDS Trade and Quote data
5

not satisfied. For our investigation, the candidates for flash crashes that did not satisfythe strict definition, were removed from further analysis.
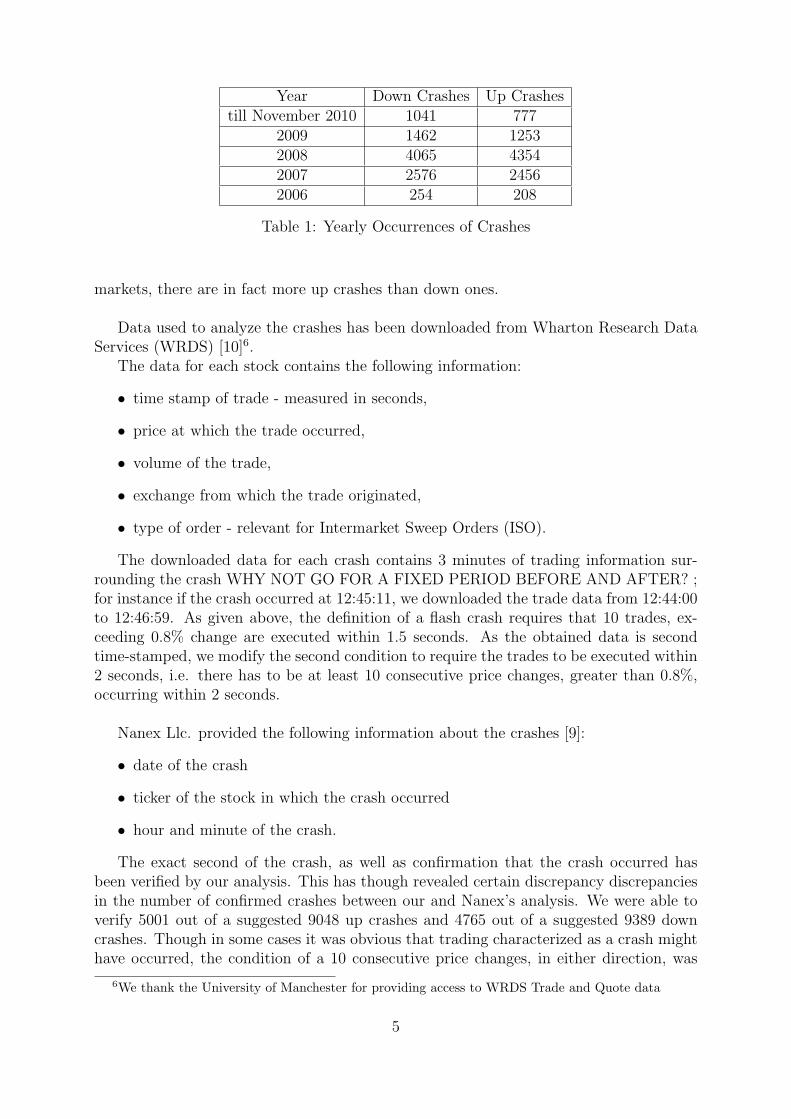
Figure 3 shows the occurrences of flash crashes during the trading day. It can be seenthat most (up or down) crashes occurred during the start and the end of the tradingday. This can easily be related to intra-day volatility; the most volatile periods are at thebeginning and end of trading day [7]. Furthermore, it is interesting to note that thereappears to be no difference between the up crashes and down crashes - both histogramslook the same.
Figure 3: Distribution of crashes during the trading day
We examined next how a crash relates to the sector of the targeted stock. High fre-quency trading has been concentrated in a few very ”liquid” stock, with low-priced stockfrom financial and IT sectors7 being the favorites in for high frequency traders [11]. Fig-ure 4 represents the most targeted sectors in the (up and down) crashes; most crashesoriginated from the Finance, Insurance and Real Estate sector and Manufacturing sectors,accounting for 31% and 30% of the crashes, respectively.
Finally at this state, we note that 39% of trades in the crashes occurred on the NewYork Stock Exchange, with both NASDAQ and ARCA each accounting for 28% of thetrades and American Stock Exchange, BATS, Boston stock Exchange, Chicago BoardOptions Exchange, Chicago Stock Exchange, International Securities Exchange and Na-tional Stock Exchange accounting for the remaining 5% of trades. This segmentation istypical and as expected.
7Citigroup (C), Bank of America (BAC), Fannie Mae (FNM) and Freddie Mac (FRE) represent closeto 20% of U.S. equity volume. Citigroup announced 1 for 10 reserve stock split in the near future, whichwill most likely change its status among HFT.
6

Figure 4:
3 Analysis of Flash Crashes
3.1 Characteristics of Flash Crashes
In this section we begin to characterise some properties of the flash crashes, as well as therelationships that appear to hold several different aspects of flash crashes. We concentrateon the average price before the up or down crash, computed as the average of the pricebefore the occurrence of the crash. Next, we analyze the relationship between the averageprice before the crash and the intensity of the crash, defined as the total percentage pricechange of the crash. Finally, as trading occurs on at more than one exchange locatedin the same geographical location, we analyze the geographical movement of trading incrashes between different trading centers: New York and the greater New York area,Chicago, Kansas and Boston.
Figure 5 shows the average price of the stock before the up and down crash. As a crashis defined as involving at least 10 consecutive price changes, in computing the averageprice before the crash we consider all of the prices leading up to the crash.
Formally, if P ki : i ∈ 1, . . . , n are prices considered for stock k = 1, . . . ,m, and
P kij
: j ≥ 10 are prices related to the crash, then the average price before the crash forthe stock k is computed as
〈P k〉 =1
|l : l < i1|∑l : l<i1
P kil.
In layman terms, all of the prices before the first price that sparked the crash are takenand their corresponding average is computed.
The bulk of stocks that were involved in the crashes were priced at less than $100,with two notable peaks: the first one around $50 and the second around stocks priced
7
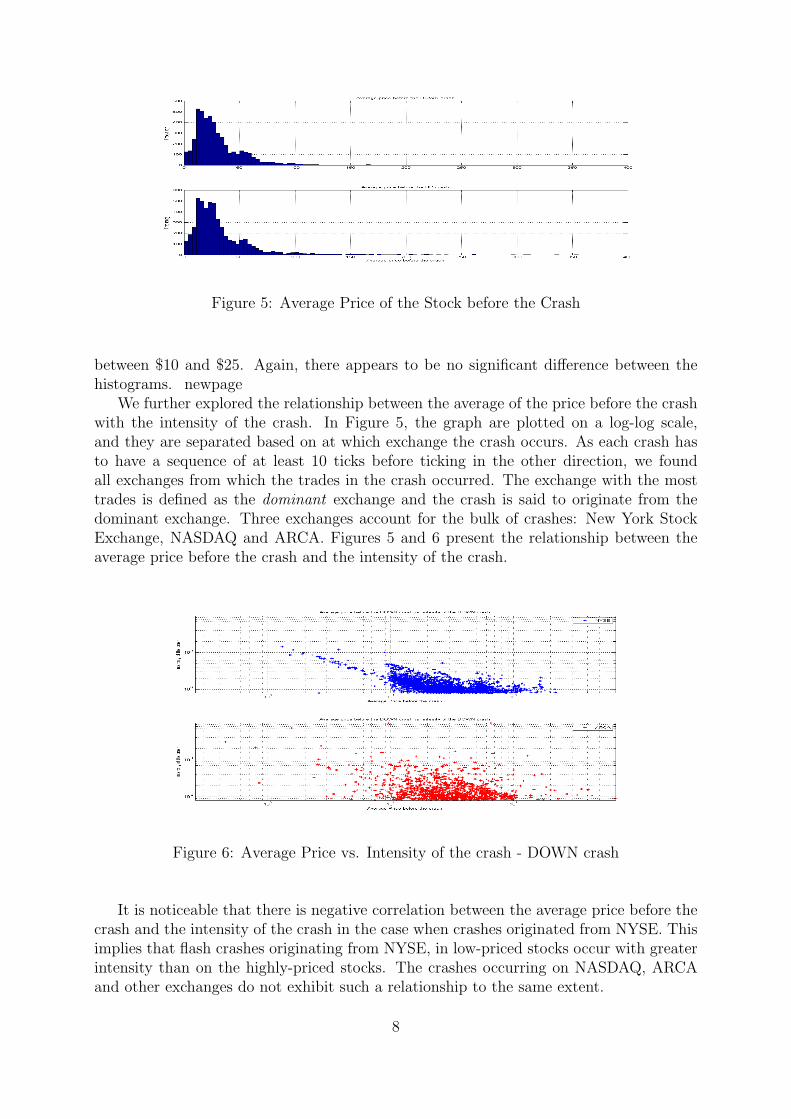
Figure 5: Average Price of the Stock before the Crash
between $10 and $25. Again, there appears to be no significant difference between thehistograms. newpage
We further explored the relationship between the average of the price before the crashwith the intensity of the crash. In Figure 5, the graph are plotted on a log-log scale,and they are separated based on at which exchange the crash occurs. As each crash hasto have a sequence of at least 10 ticks before ticking in the other direction, we foundall exchanges from which the trades in the crash occurred. The exchange with the mosttrades is defined as the dominant exchange and the crash is said to originate from thedominant exchange. Three exchanges account for the bulk of crashes: New York StockExchange, NASDAQ and ARCA. Figures 5 and 6 present the relationship between theaverage price before the crash and the intensity of the crash.
Figure 6: Average Price vs. Intensity of the crash - DOWN crash
It is noticeable that there is negative correlation between the average price before thecrash and the intensity of the crash in the case when crashes originated from NYSE. Thisimplies that flash crashes originating from NYSE, in low-priced stocks occur with greaterintensity than on the highly-priced stocks. The crashes occurring on NASDAQ, ARCAand other exchanges do not exhibit such a relationship to the same extent.
8

INTERESTING BUT SO WHAT? GOOD POINT
Figure 7: Average Price vs. Intensity of the crash - DOWN crash
The corresponding graphs for up crashes are given in the Appendix.
We have separated the crashes according to which sector the stocks belong, as well asto time of the crash8 and found no relationship.
The next two graphs, Figures 7 and 8, show the movement of trading in the crashesthroughout different geographical regions. The New York and greater New York areaaccount for trading from BATS9, NYSE, NASDAQ, ISE and AMEX; Chicago area cov-ers ARCA, CBOE, CSX and NSX; Boston covers the Boston stock exchange. One canthink of the graphs as dynamical systems of trading during a crash, with the empiricalpercentages representing transitional probabilities. For instance, if the current trade inthe down crash occurred in Chicago, with 95.182% probability that the next trade in thedown crash will occur in New York.
3.2 Price Movement Bias & Adverse Selection Hypothesis
We analyzed the number of consecutive movements before the crashes. In a simple theo-retical 3-valued model the price can either stay at the same level or move up or down bysome fixed amount and each of these movements has an equal probability of 1
3.
We computed the number of consecutive up or down price movements before the crashand divided it by the total number of trades before the crashes and obtained an empiricalprobability of consecutive price movements for one crash. Figure 9 shows the empiricalprobabilities of one price up and down movement before the down crash and it shows thatthe empirical probabilities of down movements are marked higher than the empirical upmovements. In layman terms, before the down crash there are more down price move-
8We separated the crashes into the following time bins: 9:30-10:00, 10:00-11:00, 11:00-12:00, 12:00-13:00, 13:00-14:00, 14:00-15:00 and 15:00-16:00
9BATS is a Kansas based company, but its servers are located in New Jersey
9

Figure 8: Trading between geographical regions - DOWN crashes
ments than up price movements.
The corresponding figures for up crashes are given in the Appendix.
consecutive movementsDown Crashes Up Crashes
down prob. up prob. down prob. up prob.mean-median mean-median mean-median mean-median
1 -0.001 -0.006 -0.006 -0.0022 0.024 0.017 0.016 0.0213 0.016 0.007 0.008 0.0154 0.007 0.002 0.002 0.009
Table 2: Consecutive Price Movements
Next, we determined whether a flash crash in either direction, up or down, is pre-ceded by more consecutive movements in the same direction as the direction of the crash.Working backwards from the occurrence of the crash, we determine the number of con-secutive price changes (i.e. 2 consecutive up and down movements) from the beginningof the downloaded data to the moment of the crash - recall that we have three minutesof data surrounding the crash; if the crash occurred on 12:45:11, our time window willbe from 12:44:00 till 12:45:11. This total value is divided by the total number of 2 pricemovements in the time window to give an empirical probability of two consecutive up ordown price changes. BETTER?
For each type of crash, up and down, we computed the difference between the samplemedian and the sample mean of up and down empirical probabilities, i.e. we computed
median(X)− mean(X),
10

Figure 9: Trading between geographical regions - UP crashes
where X is either the sample of empirical down or up probabilities. If empirical up proba-bilities are marked-up higher than empirical down probabilities then the difference shouldbe greater for empirical up probabilities. Indeed, the results in the table 2 confirm this.
This finding allows us to conjecture a hypothesis for relating to the cause and oc-currence of flash crashes. High frequency traders in essence appear to act as marketmakers, i.e. they provide liquidity by buying and selling the stocks rapidly, trying toearn the difference between the bid (best buying price) and the ask (best selling price),while maintaining a low exposure - usually a couple of thousand shares. When a stockprice has a distinct price movement, market makers receive an overabundance of ordersthat work against them, for instance, if there is a distinct down trend in the stock pricemovement, market makers will receive sell orders from other market participants - marketmakers will then be the buyers. As the price moves further down, market makers willhave larger and larger inventory exposure obtained at less and less favourable prices. Assoon as the market maker’s risk management limits are breached - this limit, is comprisedof the size of the inventory and the (unrealized) profit & loss - , the market maker has tostop providing liquidity and start to aggressively take liquidity, by selling back the sharesbought moments earlier. This way they push the price further down and thus exaggeratethe downward movement. As waiting for a price to revert to favourable levels is not afeasible option due to the speed of trading, high frequency traders have to ”dump” theiraccumulated inventory on the market as soon as possible -, i.e. they have to immediatelysell shares in their inventory. This action is, in turn, likely to cause a sharp downwardspike in the price movement. HOW OFTEN MIGHT ONE EXPECT THIS TO HAP-PEN?
11

Figure 10: Empirical Probabilities of Up and Down Price Movements before the DOWNCrash
3.3 A Look With through the Microscope
OF THE OBESRVATIONS YOU MAKE, HOW MANY ARE NOVEL (NOT BEENREPORTED PREVIOUSLY)?
In this section we report findings on the severeness severity of price changes in theflash crashes and the pattern between the average price before the crash and the intensity.We find that the first price change in the flash crash is, in fact, the strongest largest one.This comes as a surprise as intuitively there should not be anybe no meaningful differencebetween the price changes in the crashes.
We observe that the first price change in the crash is the largest of the at least 10ones that are required by the definition. This observation holds regardless of whetherwe examine down or up crashes. Figure 10 shows, on a log-log scale, the distribution ofpercentage price changes of the first ten movements in the down crashes. The first pricechange is coloured red.THE ULTIMATE PAPER (ASSUMING WE SUBMIT) WILL LIKELY BE BLACK ANDWHITE HENCE YOU WILL NEED TO USE GRAY SCALES AND PATTERNS
This finding shows that the distribution of first price change in the crashes stochasti-cally dominates10, in the sense of first order, the other price changes. For random variablesX, Y with cumulative distribution functions FX , FY , we say that the random variable Xstochastically dominates in the sense of first order random variable Y , which we write as
X >2nd order Y
if for all x ∈ RFX(x) ≤ FY (x)
10Stochastic dominance is a form of stochastic ordering, where one outcome can be ranked superior toanother outcome..
12

Figure 11: Cumulative Distributions of the First 10 Price Changes - DOWN crash
and the strict inequality holds for at least one value x∗ ∈ R. As, for random variable Zwith cumulative distribution function FZ , the following holds
E[Z] =
∫z : z=Z(ω), ω∈Ω
(1− FZ(z))dz,
and we immediately obtain that if X dominates Y in the sense of first order, then
E[X] > E[Y ].
Therefore, we also obtain that the expected size of the first price change in the flash crashis the largest.
Finally, we report the pattern found in the average price and the intensity of thecrashes that occurred at NYSE. We separated the crashes that occurred before and afterthe introduction of the Supplemental Liquidity Provider program on NYSE.
Supplemental Liquidity Providers (SLPs) are market participants that who use sophis-ticated high-speed computers and algorithms to create high volume on exchanges in orderto add liquidity to the markets. As an incentive for providing liquidity, the exchange paysthe SLP a rebate or fee, which was 0.15 cents per share as of 2009. The SLP programwas introduced shortly after the collapse of Lehman Brothers.
At this moment we do not have an understanding why this pattern exists and whetherthe disappearance of the pattern after introduction of the SLP program is merely a coin-cidence.
Corresponding scatter plots for other type of crash are given in the appendix.
3.4 Impact on Liquidity
In this section we report influence of flash crashes on bid-ask spread. For each stock thatexperienced a flash crash, we computed the average bid-ask spread before and after thecrash. Analysis was done on a sub-sample of 1000 crashes. Intuitively, one should think
13
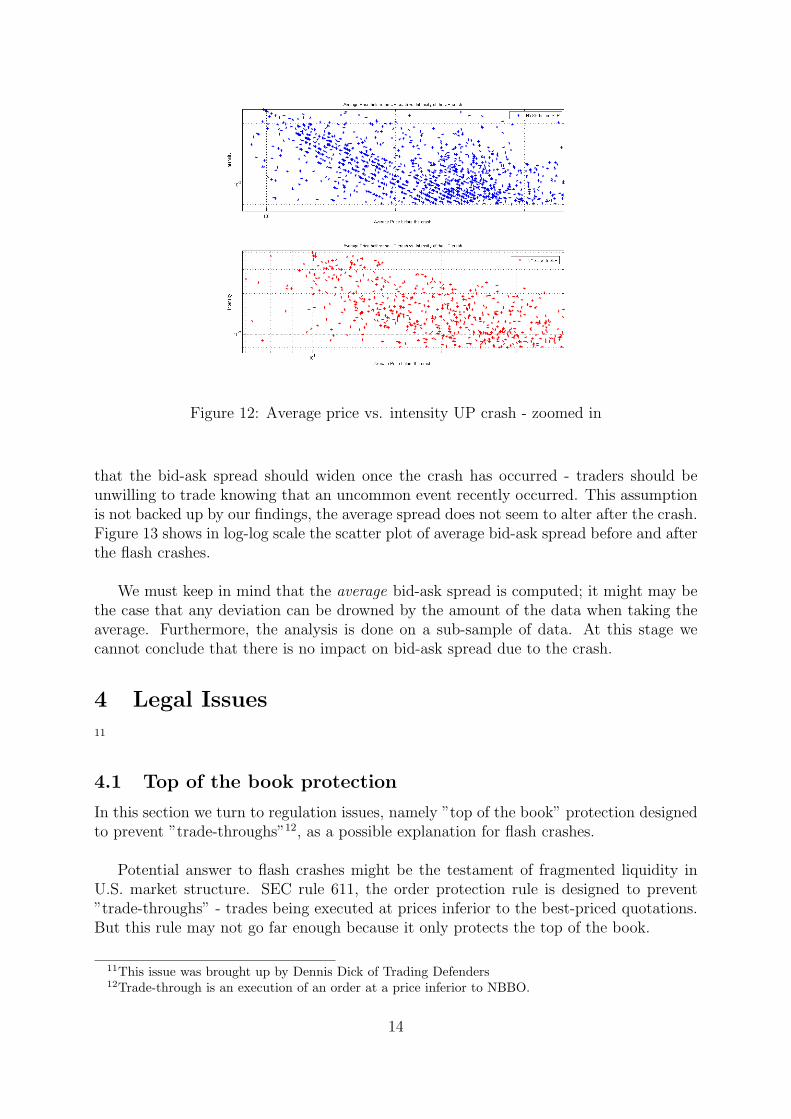
Figure 12: Average price vs. intensity UP crash - zoomed in
that the bid-ask spread should widen once the crash has occurred - traders should beunwilling to trade knowing that an uncommon event recently occurred. This assumptionis not backed up by our findings, the average spread does not seem to alter after the crash.Figure 13 shows in log-log scale the scatter plot of average bid-ask spread before and afterthe flash crashes.
We must keep in mind that the average bid-ask spread is computed; it might may bethe case that any deviation can be drowned by the amount of the data when taking theaverage. Furthermore, the analysis is done on a sub-sample of data. At this stage wecannot conclude that there is no impact on bid-ask spread due to the crash.
4 Legal Issues
11
4.1 Top of the book protection
In this section we turn to regulation issues, namely ”top of the book” protection designedto prevent ”trade-throughs”12, as a possible explanation for flash crashes.
Potential answer to flash crashes might be the testament of fragmented liquidity inU.S. market structure. SEC rule 611, the order protection rule is designed to prevent”trade-throughs” - trades being executed at prices inferior to the best-priced quotations.But this rule may not go far enough because it only protects the top of the book.
11This issue was brought up by Dennis Dick of Trading Defenders12Trade-through is an execution of an order at a price inferior to NBBO.
14

Figure 13: Average bid-ask spread, before vs. after the flash crash
Consider the following example of a fictitious order book for security XYZ:
INET ARCAbid/ask price size price size
ask 32.02 500 32.02 500ask 32.01 500
best ask 32.00 500
best bid 31.99 100 31.99 100
Table 3: Order book of security XYZ
Suppose ARCA receives a market order to buy 1000 shares of XYZ, and the best avail-able offer is on INET for 500 shares. ARCA must route the first 500 shares to INET, so asto not violate the order protection rule (because the 500 shares on INET is at the top ofthe book and is therefore a ”protected quotation”). After that, the remaining 500 sharescan be filled back on the original exchange that received the order, in this case ARCA,regardless of whether there is better quotations on other trading centers. In this case,500 shares would be executed against the 32.00 INET offer, and the remaining 500 sharescould then be executed against the 32.02 ARCA offer. The 500 shares offered at 32.01on INET would remain unfilled. The buyer in this case actually pays a penny more thanthey should of had to for the last 500 shares. That is because the only ”protected quo-tation” is the top of the book which in this case is the 500 shares offered on INET at 32.00.
Previous example demonstrates the issues that might arise if a large buy or sell orderwould be routed to an exchange; the ”domestic” exchange would route a part of the orderto the exchange with the NBBO, so as to not violate the order protection rule, and thenwould filled the remaining shares on its own quotes; it could easily result in an dramaticprice change if there is lack of liquidity on ”domestic” exchange.
15
This series of trades exemplifies the lack of protection for depth of book quotations -there might have been a significant amount of additional liquidity on the other exchangesduring the time frame under question. However, because the order protection rule onlyprotects the top of the book, trades can occur at inferior prices despite there being liquidityon other trading centers. The domestic exchange did nothing wrong in our example andthey should not be villainized. The problem lies in the order protection rule, and the SECshould consider expanding this rule to provide protection to the depth of book quotations.
These trade-throughs occur every day, just usually on a smaller scale as in the firstexample. They can sometimes occur on larger scales, especially on exchanges with lessliquidity - the media would report these incidents as ”mini flash crashes” (or mini flashdashes in the case that the stock spikes higher). These incidents might be nothing morethan a testament to the fragmented liquidity that is indicative of the current marketstructure.
As more and more exchanges are created, traders need to be more aware of how theirorders are routed. In the example, the trader could of sent the order using some type of”smart” order router. This order type would have sought out liquidity on all exchanges aswell as on dark pools and ECN’s. Unfortunately, not all participants of the capital marketsunderstand how their orders are routed and therefore it may become necessary for the SECto expand the order protection rule to include depth of book quotations. Otherwise asthe market structure becomes more and more complex, expect trade-throughs to becomethe norm.
YOU NEED TO TIDY=UP THE REFERENCES - NEED FULL REF and PAGENUMBERS; NEED web-page and time and data accessed,
5 Contribution
16
References
[1] Mehrdad Samadi Tugkan Tuzun Andrei Kirilenko, Albert S. Kyle. The flash crash:The impact of high frequency trading on an electronic market. January 12 2011.
[2] Annie Koh Bernard Lee, Shih-fen Cheng. Would position limits have made anydifference to the flash crash on may 6, 2010.
[3] Maureen O’Hara David Easley, Marcos M. Lopez de Prado. Measuring flow toxicityin a high frequency world. October 21 2010.
[4] Maureen O’Hara David Easley, Marcos M. Lopez de Prado. The microstructureof the flash crash: Flow toxicity, liquidity crashes and the probability of informedtrading. The Journal of Portfolio Management, 2011.
[5] Michael Durbin. All About High Frequency Trading. McGraw Hill, 2010.
[6] Cristina McEachern Gibbs. Breaking it down: An overview of high frequency trading.Advanced Trading, 2009.
[7] L. Harris. A transaction data survey of weekly and intraday patterns in stock prices.Journal of Financial Economics, 1986.
[8] J. Hasbrouck. One security, many markets: Determining the contributions to pricediscovery. Journal of Finance, 1995.
[9] Nanex Llc. Flash equity failures, 2010.
[10] The Wharton School of the University of Pennsylvania. Wharton research dataservice.
[11] TA researcher. Citigroup - why aren’t you hft’ing it?, 2010.
[12] U.S. Commodities Futures Trading Commission U.S. Securities and Exchange Com-mission. Findings regarding the market events of may 6, 2010. September 2010.
[13] Robert Wood Sugato Chakravarty, James Upson. The flash crash: Trading aggres-siveness, liquidity supply, and the impact of intermarket sweep orders. January 2011.
6 Appendix
17
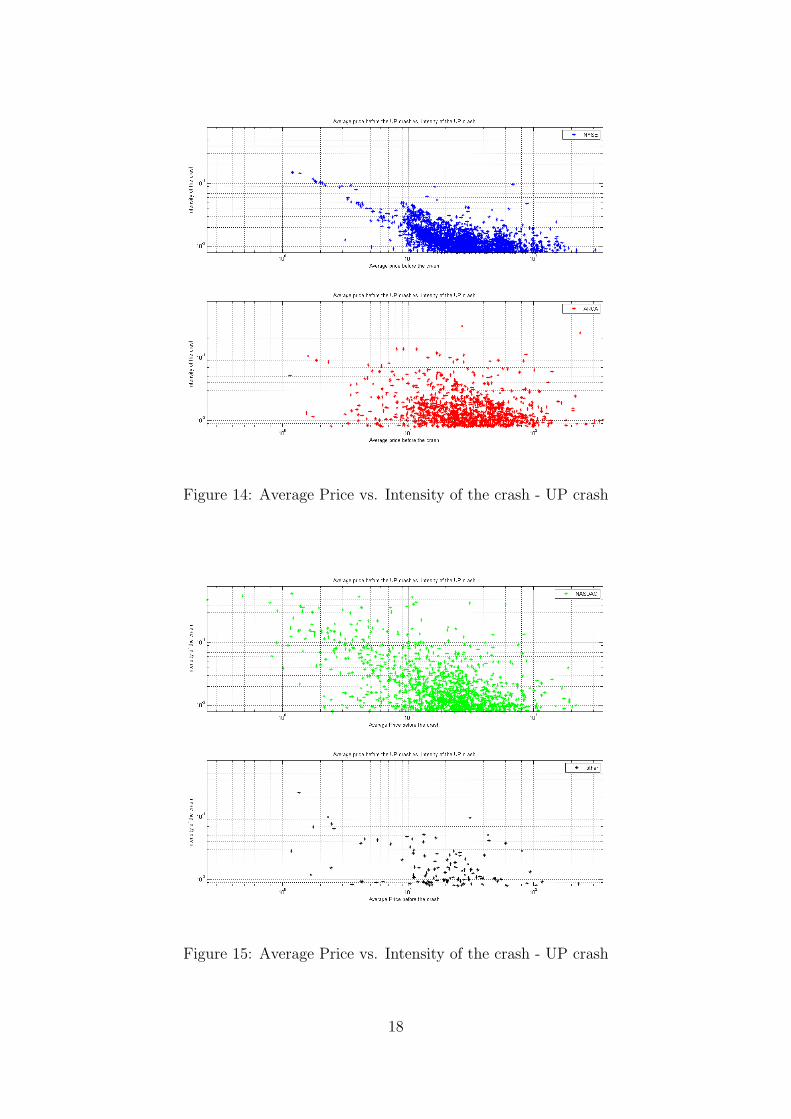
Figure 14: Average Price vs. Intensity of the crash - UP crash
Figure 15: Average Price vs. Intensity of the crash - UP crash
18
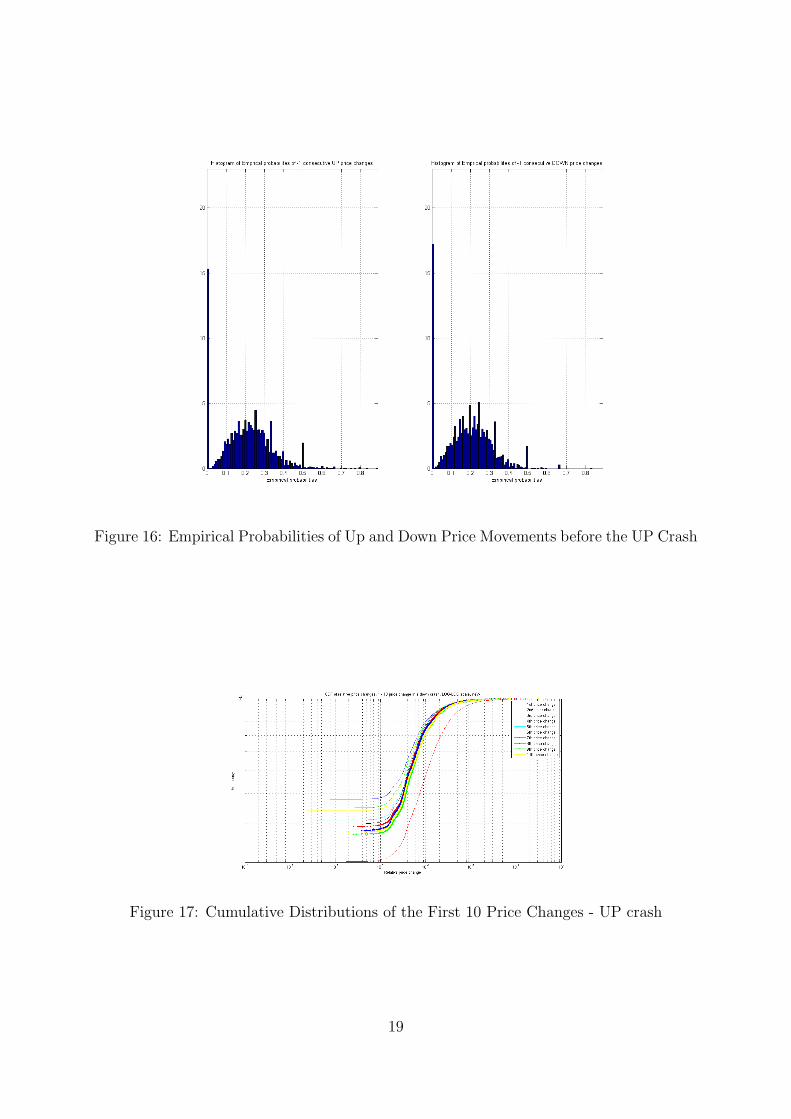
Figure 16: Empirical Probabilities of Up and Down Price Movements before the UP Crash
Figure 17: Cumulative Distributions of the First 10 Price Changes - UP crash
19

Figure 18: Average price vs. intensity UP crash - zoomed in
20
![Sink or Swim - CODF · 2017. 2. 15. · The May 6, 2010 Flash Crash[1] also known as The Crash of 2:45, the 2010 Flash Crash, or simply the Flash Crash, was a United States stock](https://static.fdocuments.us/doc/165x107/6005d939e19b73501064e4f7/sink-or-swim-codf-2017-2-15-the-may-6-2010-flash-crash1-also-known-as.jpg)