HICL Infrastructure Company Limited
30
www.hicl.com HICL Infrastructure Company Ltd Summer 2014 Overview of the Company, its Investment Adviser and performance
Transcript of HICL Infrastructure Company Limited
www.hicl.com
HICL Infrastructure Company Ltd
Summer 2014
Overview of the Company, its Investment Adviser and performance
2 www.hicl.com
Important information
By attending the meeting where this presentation is made, or by reading the presentation slides, you agree to be bound by the following limitations: This document is an advertisement and is not a prospectus. Any decision to purchase shares in HICL Infrastructure Company Limited (the "Company") should be made solely on the basis of the prospectus and trading updates published by the Company, which are available from the HCIL Website, www.hicl.com. The information in this document has been prepared by the Company solely to give an overview of the Company. This document is being distributed in the UK to, and is directed only at, persons who have professional experience in matters relating to investments who fall within the definition of "investment professionals" in Article 19(5) of, or a person falling within Article 49(2) (High Net Worth Companies, etc.) of, the Financial Services and Markets Act 2000 (Financial Promotion) Order 2005 of the United Kingdom (all such persons together being referred to as "relevant persons"). Any person who is not a relevant person should not act or rely on this presentation or this document or any of its contents. The information in this presentation is given in confidence and the recipients of this presentation should not engage in any behavior in relation to qualifying investments or related investments (as defined in the Financial Services and Markets Act 2000 ("FSMA") and the Code of Market Conduct made pursuant to FSMA) which would or might amount to market abuse for the purposes of FSMA. In EU member states which have implemented on time and which have transitional arrangements for marketing, marketing of the Company which was permitted (either on the basis of a licence or an exemption) prior to the implementation of the Alternative Investment Fund Managers Directive (2011/61/EU) (the “AIFMD”) may continue (on the basis of the transitional provisions under Article 61 of the AIFMD as implemented into local law) until the end of the transitional period in the relevant member state. Where transitional arrangements do not/ no longer apply, the Company’s shares will only be offered to the extent that the Company: (i) is permitted to be marketed into the relevant EEA jurisdiction pursuant to either Article 36 or 42 of the AIFMD (if and as implemented into local law); or (ii) can otherwise be lawfully offered or sold (including on the basis of an unsolicited request from a professional investor). No representation or warranty, express or implied, is made as to, and no reliance should be placed on, the fairness, accuracy, completeness or correctness of the information, or opinions contained herein. Neither the Company, nor any of the Company's advisers or representatives, including its investment adviser, InfraRed Capital Partners Limited, shall have any responsibility or liability whatsoever (for negligence or otherwise) for any loss howsoever arising from any use of this document or its contents or otherwise arising in connection with this document. The information set out herein may be subject to updating, completion, revision, verification and amendment and such information may change materially. Neither the Company nor any other person is under an obligation to keep current the information contained in this document. This document has not been approved by the UK Financial Conduct Authority or any other regulator. This document does not constitute or form part of, and should not be construed as, an offer, invitation or inducement to purchase or subscribe for any securities nor shall it or any part of it form the basis of, or be relied upon in connection with, any contract or commitment whatsoever. This document does not constitute a recommendation regarding the securities of the Company. The information communicated in this document contains certain statements that are or may be forward looking. These statements typically contain words such as "expects" and "anticipates" and words of similar import. By their nature forward looking statements involve risk and uncertainty because they relate to events and depend on circumstances that will occur in the future. An investment in the Company will involve certain risks. In particular, certain figures provided in this presentation rely in part on large and detailed financial models; there is a risk that errors may be made in the assumptions or methodology used in a financial model. The Company’s targeted returns are based on assumptions which the Company considers reasonable. However, there is no assurance that all or any assumptions will be justified, and the Company’s returns may be correspondingly reduced. In particular, there is no assurance that the Company will achieve its distribution and IRR targets (which for the avoidance of doubt are targets only and not profit forecasts). A summary of the material risks relating to the Company and an investment in the securities of Company are set out in the section headed "Risk Factors" in the February 2013 Prospectus. The publication and distribution of this document may be restricted by law in certain jurisdictions and therefore persons into whose possession this document comes or who attend the presentation should inform themselves about and observe any such restrictions. Any failure to comply with these restrictions could result in a violation of the laws of such jurisdiction. In particular, this document and the information contained herein, are not for publication or distribution, directly or indirectly, to persons in the United States (within the meaning of Regulation S under the US Securities Act of 1933, as amended (the "Securities Act")) or to entities in Canada, Australia or Japan. The securities of the Company have not been and will not be registered under the Securities Act and may not be offered or sold in the United States except to certain persons in offshore jurisdictions in reliance on Regulation S. Neither these slides nor any copy of them may be taken or transmitted into or distributed in Canada, Australia, Japan or any other jurisdiction which prohibits the same except in compliance with applicable securities laws. Any failure to comply with this restriction may constitute a violation of the United States or other national securities laws.
This presentation and subsequent discussion may contain certain forward looking statements with respect to the financial condition, results of operations and business of HICL Infrastructure Company Limited and its corporate subsidiaries (the “Group”). These forward-looking statements represent the Group’s expectations or beliefs concerning future events and involve known and unknown risks and uncertainty that could cause actual results, performance or events to differ materially from those expressed or implied in such statements. Additional detailed information concerning important factors that could cause actual results to differ materially is available in our Annual Report & Consolidated Financial Statements for the year ended 31 March 2014 available from the Company's website.
Past performance is not a reliable indicator of future performance.
3 www.hicl.com
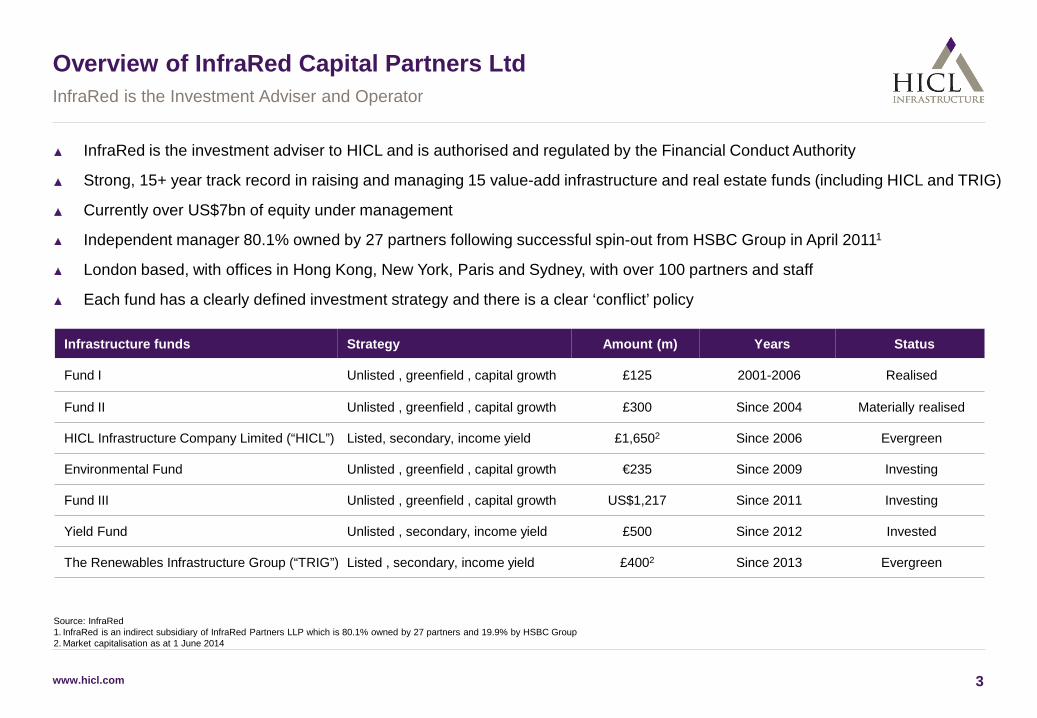
Overview of InfraRed Capital Partners Ltd InfraRed is the Investment Adviser and Operator
InfraRed is the investment adviser to HICL and is authorised and regulated by the Financial Conduct Authority
Strong, 15+ year track record in raising and managing 15 value-add infrastructure and real estate funds (including HICL and TRIG)
Currently over US$7bn of equity under management
Independent manager 80.1% owned by 27 partners following successful spin-out from HSBC Group in April 20111
London based, with offices in Hong Kong, New York, Paris and Sydney, with over 100 partners and staff
Each fund has a clearly defined investment strategy and there is a clear ‘conflict’ policy
Infrastructure funds Strategy Amount (m) Years Status
Fund I Unlisted , greenfield , capital growth £125 2001-2006 Realised
Fund II Unlisted , greenfield , capital growth £300 Since 2004 Materially realised
HICL Infrastructure Company Limited (“HICL”) Listed, secondary, income yield £1,6502 Since 2006 Evergreen
Environmental Fund Unlisted , greenfield , capital growth €235 Since 2009 Investing
Fund III Unlisted , greenfield , capital growth US$1,217 Since 2011 Investing
Yield Fund Unlisted , secondary, income yield £500 Since 2012 Invested
The Renewables Infrastructure Group (“TRIG”) Listed , secondary, income yield £4002 Since 2013 Evergreen
Source: InfraRed 1. InfraRed is an indirect subsidiary of InfraRed Partners LLP which is 80.1% owned by 27 partners and 19.9% by HSBC Group 2. Market capitalisation as at 1 June 2014

4 www.hicl.com
InfraRed – Team Skills and Experience
Experienced infrastructure professionals with proven track record
Well established and respected team
– Recent additions to portfolio management, asset management and finance
– Part of a wider infrastructure team of 50
Detailed, ‘tried and tested’ investment processes
Active asset management with regular asset reviews
Proactive value management
Wide range of skills, experience and knowledge of
– Assets in the portfolio
– Construction
– Facilities management
– Core target sectors
– Corporate finance and M&A
– Treasury management

5 www.hicl.com
The Infrastructure Asset Class
Risk class Availability Regulatory Demand based Market
Investment risks are incremental
Operating costs Delivery (e.g. service performance)
+ Regulatory risk + Volume risk (low)
+ Volume risk (high) + Known pricing risk
+ Competitive risks
Examples Hospitals, schools, government accommodation Availability transport
(e.g. road/rail)
Energy distribution, transmission, storage Water, waste water Renewable energy (off-take or feed-in)
Real toll roads, tunnels, bridges Light, heavy rail Airports Marine ports
Merchant power (no off-take) Ferries Service stations Waste
Low
Lowest risk segment (‘public assets’)
Largely resilient to economic cycle
Exposed to economic cycle
Private equity style exposure
High Revenue risk
Revenue risk is also heavily influenced by factors such as geographic jurisdiction and whether a project is operational or still under construction
For a full list of risk factors please refer to pages 17-29 of HICL’s New Ordinary Share Prospectus dated 26 February 2013
6 www.hicl.com
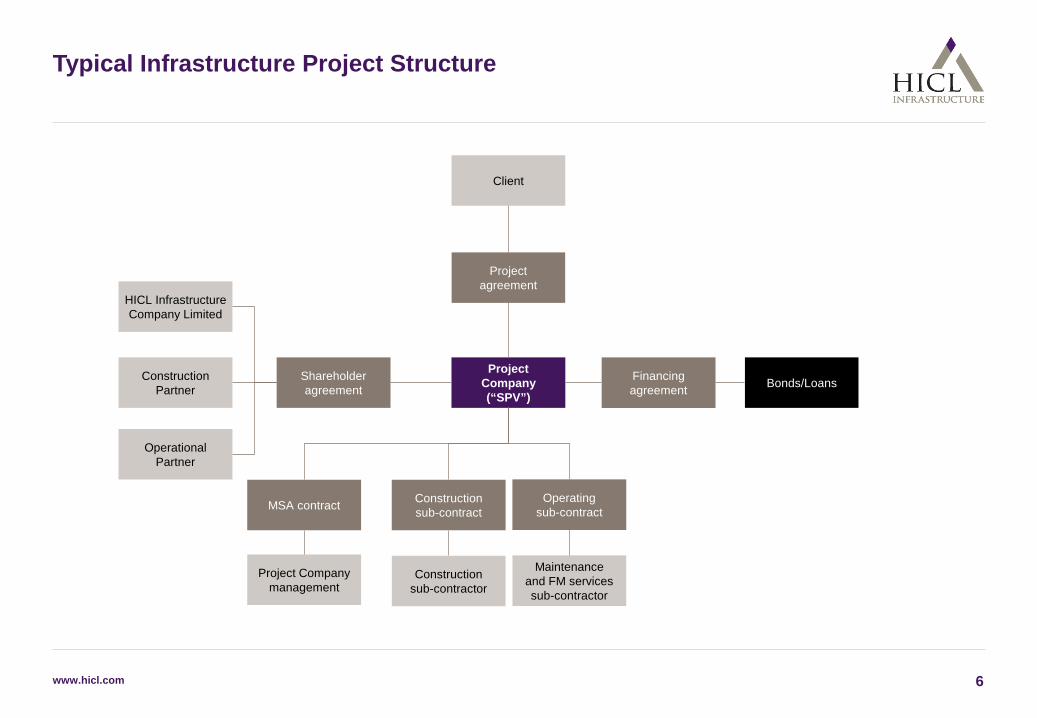
Typical Infrastructure Project Structure
HICL Infrastructure Company Limited
Construction sub-contract
Client
Operating sub-contract
Construction sub-contractor
Maintenance and FM services sub-contractor
Financing agreement
Project Company (“SPV”)
Shareholder agreement
Project agreement
Bonds/Loans Construction Partner
Operational Partner
Project Company management
MSA contract
www.hicl.com 7
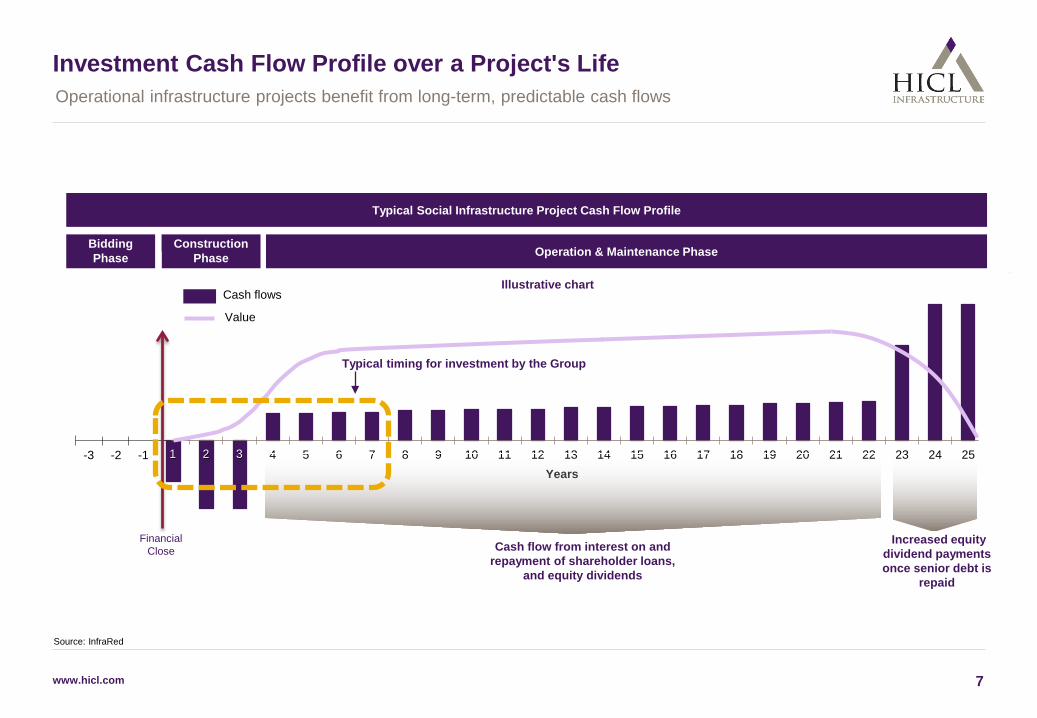
Investment Cash Flow Profile over a Project's Life
Source: InfraRed
Operational infrastructure projects benefit from long-term, predictable cash flows
0
0.2
0.4
0.6
0.8
1
1.2
-6
-4
-2
0
2
4
6
8
10
12
1 2 3 4 5 6 7 8 9 10 11 12 13 14 15 16 17 18 19 20 21 22 23 24 25
Cash flows
Value
Construction Phase
Years
Illustrative chart
Typical Social Infrastructure Project Cash Flow Profile
Typical timing for investment by the Group
Cash flow from interest on and repayment of shareholder loans,
and equity dividends
Increased equity dividend payments once senior debt is
repaid
Operation & Maintenance Phase Bidding Phase
-3 -2 -1 1 2 3
Financial Close

www.hicl.com 8
Valuation - Methodology Determining the net asset value of the portfolio and the Group (illustrative example)
£0m
£20m
£40m
£60m
£80m
£100mNet Inflows to Group Tax Senior Debt Life-cycle Operating Costs
£0m
£20m
£40m
£60m
£80m
£100m
£0m
£10m
£20m
£30m
£40m
£50mAnnual Net Inflow to Group NPV of Annual Net Inflow to Group Aggregate NPV over time (rhs)
£0m
£20m
£40m
£60m
£80m
£100mConcession Contract Revenue + Deposit Interest
Forecast Project Inflows
less
Net Inflow from
Project to HICL
Forecast Project
Outflows
equals
Key Variables/Assumptions
Long-term Inflation Rate Deposit Interest Rate Tax Rates Discount Rate FX
• Whole-of-life concession revenue linked to inflation
• Interest income from cash reserves at individual project level
• Whole-of-life operating contracts fixed or linked to inflation
• Whole-of-life debt is fixed or inflation-linked
• Net Inflows to HICL in form of dividends, shareholder loan service & directors fees
• Net cashflows discounted to derive investment valuation
• All project cashflows aggregated to give Directors’ portfolio valuation
• Adjust for other Group net assets/liabilities to get Group NAV
www.hicl.com 9
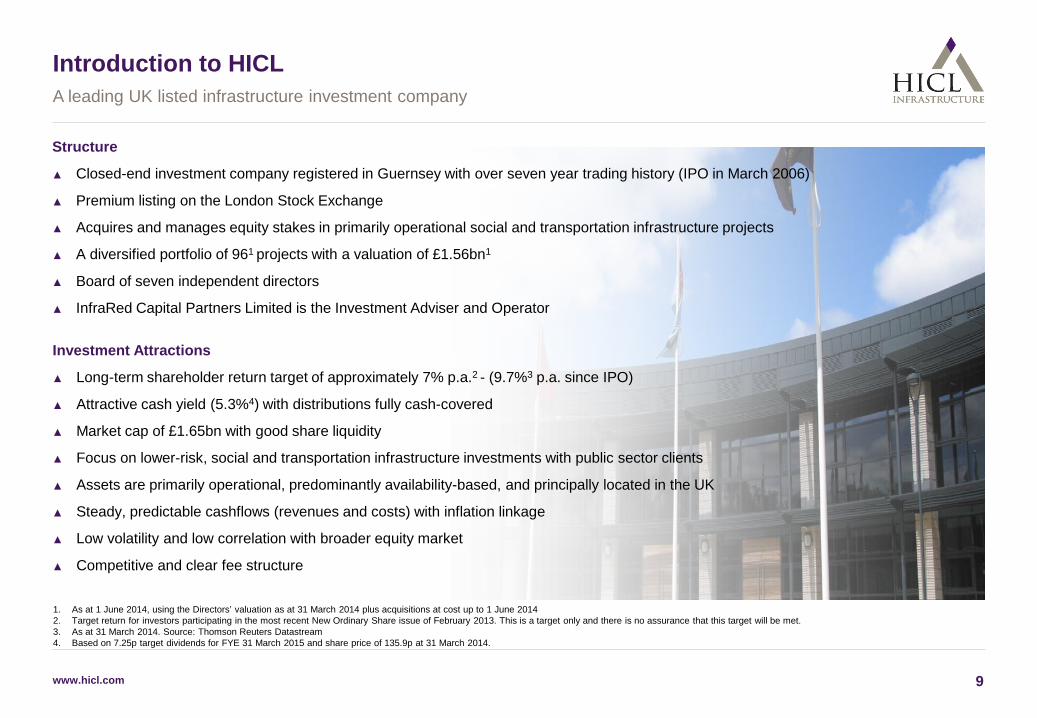
Introduction to HICL A leading UK listed infrastructure investment company
1. As at 1 June 2014, using the Directors’ valuation as at 31 March 2014 plus acquisitions at cost up to 1 June 2014 2. Target return for investors participating in the most recent New Ordinary Share issue of February 2013. This is a target only and there is no assurance that this target will be met. 3. As at 31 March 2014. Source: Thomson Reuters Datastream 4. Based on 7.25p target dividends for FYE 31 March 2015 and share price of 135.9p at 31 March 2014.
Investment Attractions
▲ Long-term shareholder return target of approximately 7% p.a.2 - (9.7%3 p.a. since IPO)
▲ Attractive cash yield (5.3%4) with distributions fully cash-covered
▲ Market cap of £1.65bn with good share liquidity
▲ Focus on lower-risk, social and transportation infrastructure investments with public sector clients
▲ Assets are primarily operational, predominantly availability-based, and principally located in the UK
▲ Steady, predictable cashflows (revenues and costs) with inflation linkage
▲ Low volatility and low correlation with broader equity market
▲ Competitive and clear fee structure
Structure
▲ Closed-end investment company registered in Guernsey with over seven year trading history (IPO in March 2006)
▲ Premium listing on the London Stock Exchange
▲ Acquires and manages equity stakes in primarily operational social and transportation infrastructure projects
▲ A diversified portfolio of 961 projects with a valuation of £1.56bn1
▲ Board of seven independent directors
▲ InfraRed Capital Partners Limited is the Investment Adviser and Operator

www.hicl.com 10
Governance
Independent board of seven non-executive Directors – Approves and monitors adherence to strategy
– Intends to act as AIFM under the European Commission’s Alternative Investment Fund Managers Directive
– Determines risk appetite through formal Risk Committee
– Monitors compliance with, and implementation of, regulation for HICL
– Sets Group’s policies
– Monitors performance against objectives
– Oversees capital raising (equity or debt) and deployment of cash proceeds
– Appoints service providers and auditors
Investment Adviser / Operator: InfraRed Capital Partners Limited, a subsidiary of InfraRed Partners LLP
– Day-to-day management of portfolio
– Utilisation of cash proceeds
– Full discretion within strategy determined by Board over acquisitions and disposals (through Investment Committee)
– Authorised and regulated by the Financial Conduct Authority
11 www.hicl.com
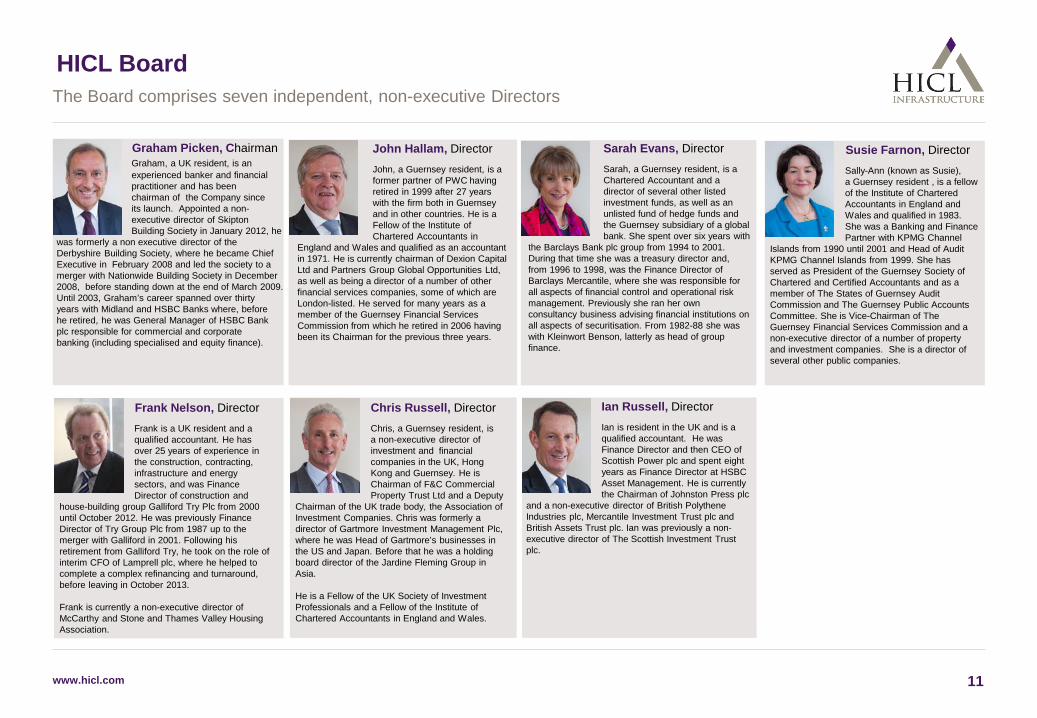
HICL Board
Sarah Evans, Director Sarah, a Guernsey resident, is a
Chartered Accountant and a director of several other listed investment funds, as well as an unlisted fund of hedge funds and the Guernsey subsidiary of a global bank. She spent over six years with the Barclays Bank plc group from 1994 to 2001. During that time she was a treasury director and, from 1996 to 1998, was the Finance Director of Barclays Mercantile, where she was responsible for all aspects of financial control and operational risk management. Previously she ran her own consultancy business advising financial institutions on all aspects of securitisation. From 1982-88 she was with Kleinwort Benson, latterly as head of group finance.
Chris Russell, Director Chris, a Guernsey resident, is
a non-executive director of investment and financial companies in the UK, Hong
Kong and Guernsey. He is Chairman of F&C Commercial Property Trust Ltd and a Deputy Chairman of the UK trade body, the Association of Investment Companies. Chris was formerly a director of Gartmore Investment Management Plc, where he was Head of Gartmore’s businesses in the US and Japan. Before that he was a holding board director of the Jardine Fleming Group in Asia.
He is a Fellow of the UK Society of Investment Professionals and a Fellow of the Institute of Chartered Accountants in England and Wales.
John Hallam, Director John, a Guernsey resident, is a
former partner of PWC having retired in 1999 after 27 years with the firm both in Guernsey and in other countries. He is a Fellow of the Institute of Chartered Accountants in England and Wales and qualified as an accountant in 1971. He is currently chairman of Dexion Capital Ltd and Partners Group Global Opportunities Ltd, as well as being a director of a number of other financial services companies, some of which are London-listed. He served for many years as a member of the Guernsey Financial Services Commission from which he retired in 2006 having been its Chairman for the previous three years.
Graham Picken, Chairman Graham, a UK resident, is an experienced banker and financial practitioner and has been chairman of the Company since its launch. Appointed a non- executive director of Skipton Building Society in January 2012, he was formerly a non executive director of the Derbyshire Building Society, where he became Chief Executive in February 2008 and led the society to a merger with Nationwide Building Society in December 2008, before standing down at the end of March 2009. Until 2003, Graham’s career spanned over thirty years with Midland and HSBC Banks where, before he retired, he was General Manager of HSBC Bank plc responsible for commercial and corporate banking (including specialised and equity finance).
The Board comprises seven independent, non-executive Directors
Susie Farnon, Director Sally-Ann (known as Susie),
a Guernsey resident , is a fellow of the Institute of Chartered Accountants in England and Wales and qualified in 1983. She was a Banking and Finance Partner with KPMG Channel Islands from 1990 until 2001 and Head of Audit KPMG Channel Islands from 1999. She has served as President of the Guernsey Society of Chartered and Certified Accountants and as a member of The States of Guernsey Audit Commission and The Guernsey Public Accounts Committee. She is Vice-Chairman of The Guernsey Financial Services Commission and a non-executive director of a number of property and investment companies. She is a director of several other public companies.
Ian Russell, Director Ian is resident in the UK and is a
qualified accountant. He was Finance Director and then CEO of Scottish Power plc and spent eight years as Finance Director at HSBC Asset Management. He is currently the Chairman of Johnston Press plc and a non-executive director of British Polythene Industries plc, Mercantile Investment Trust plc and British Assets Trust plc. Ian was previously a non-executive director of The Scottish Investment Trust plc.
Frank Nelson, Director Frank is a UK resident and a
qualified accountant. He has over 25 years of experience in the construction, contracting, infrastructure and energy sectors, and was Finance Director of construction and house-building group Galliford Try Plc from 2000 until October 2012. He was previously Finance Director of Try Group Plc from 1987 up to the merger with Galliford in 2001. Following his retirement from Galliford Try, he took on the role of interim CFO of Lamprell plc, where he helped to complete a complex refinancing and turnaround, before leaving in October 2013. Frank is currently a non-executive director of McCarthy and Stone and Thames Valley Housing Association.

12 www.hicl.com
Capital Raising Approach and History HICL’s innovative financing approach has several benefits for shareholders
1.Split into 100 new investments and 43 acquisitions of incremental stakes in existing investments as at 1 June 2014.
£1.35bn of Gross Equity Issuance since IPO to 1 June 2014 143 Acquisitions1 since IPO to 1 June 2014 totaling £1.44bn
250
104 48
47
76
273
109 0
80 110
250
£0m
£200m
£400m
£600m
£800m
£1,000m
£1,200m
£1,400m
£1,600m
FYEMar 07
FYEMar 08
FYEMar 09
FYEMar 10
FYEMar 11
FYEMar 12
FYEMar 13
FYEMar 14
FYEMar 15
C Shares Ordinary Shares
250 43 81
31 68 151
237
278
239 59
£0m
£200m
£400m
£600m
£800m
£1,000m
£1,200m
£1,400m
£1,600m
FYEMar 07
FYEMar 08
FYEMar 09
FYEMar 10
FYEMar 11
FYEMar 12
FYEMar 13
FYEMar 14
FYEMar 15
New Investments Investments at IPO
▲ HICL has raised c.£1.35bn of equity since launch in March 2006 - £250m at IPO and £1.1bn through subsequent share issues
▲ Acquisitions are normally debt-funded (using Group facility) initially to avoid cash drag and to give shareholders visibility over the new investments
▲ £150m committed revolving credit facility at Group level to finance acquisitions pending issuance of new equity
▲ Non-pre-emptive Ordinary Share “tap” issues (max. 10% of issued shared capital p.a.) are used to repay drawings for investments made
▲ Larger Ordinary Share or C Share issues to repay more significant drawings and, if appropriate, pre-fund pipeline investments
13 www.hicl.com
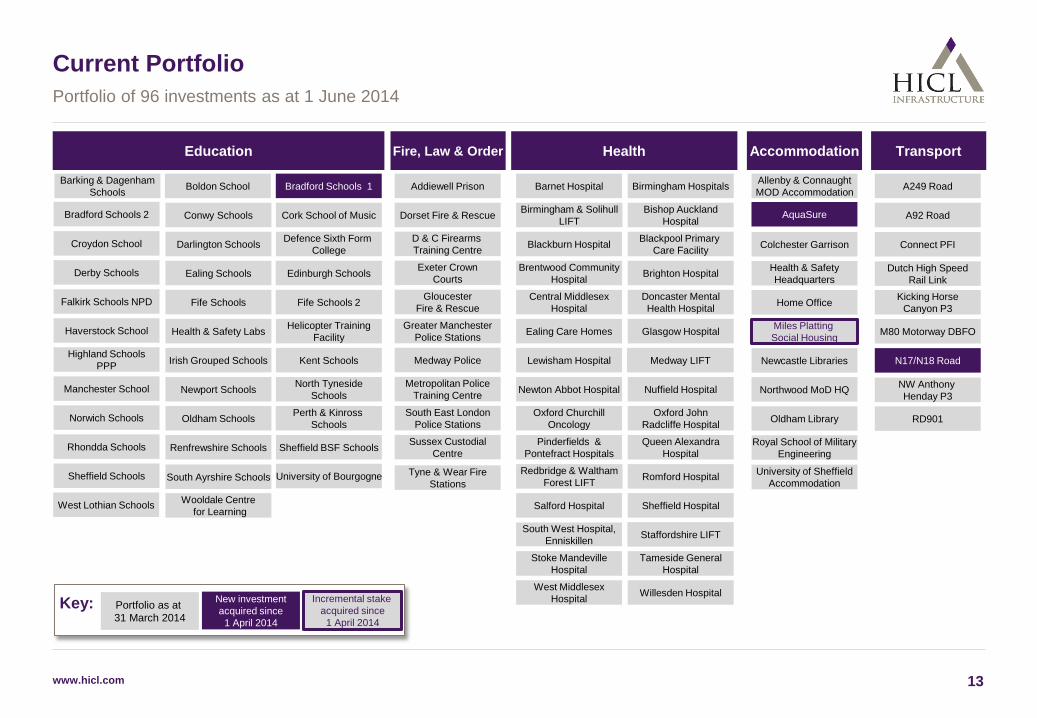
Current Portfolio Portfolio of 96 investments as at 1 June 2014
Education Fire, Law & Order Accommodation Transport Health
Willesden Hospital West Middlesex Hospital
Sheffield BSF Schools Renfrewshire Schools
South East London Police Stations
Pinderfields & Pontefract Hospitals
Queen Alexandra Hospital
North Tyneside Schools Newport Schools
Medway Police
Oldham Library
Newton Abbot Hospital Nuffield Hospital
Defence Sixth Form College Darlington Schools
Health & Safety Headquarters
Connect PFI Blackburn Hospital Blackpool Primary Care Facility
Conwy Schools Cork School of Music Dorset Fire & Rescue
Colchester Garrison
A92 Road Bishop Auckland Hospital
Birmingham & Solihull LIFT
Portfolio as at 31 March 2014
New investment acquired since
1 April 2014
Key:
Stoke Mandeville Hospital
Tameside General Hospital
Kent Schools Irish Grouped Schools
Greater Manchester Police Stations
Lewisham Hospital N17/N18 Road
Northwood MoD HQ
Medway LIFT
Wooldale Centre for Learning
Sussex Custodial Centre
Tyne & Wear Fire Stations
Romford Hospital Redbridge & Waltham Forest LIFT
Staffordshire LIFT South West Hospital, Enniskillen
Sheffield Hospital Salford Hospital
Oldham Schools
Metropolitan Police Training Centre
Oxford Churchill Oncology
Oxford John Radcliffe Hospital
Perth & Kinross Schools
Royal School of Military Engineering
Fife Schools
Exeter Crown Courts
Kicking Horse Canyon P3
Doncaster Mental Health Hospital
Central Middlesex Hospital Fife Schools 2
Miles Platting Social Housing
Bradford Schools 1 Boldon School Barking & Dagenham Schools A249 Road Barnet Hospital Birmingham Hospitals Addiewell Prison Allenby & Connaught
MOD Accommodation
Helicopter Training Facility Health & Safety Labs
Newcastle Libraries
M80 Motorway DBFO Glasgow Hospital Ealing Care Homes
Gloucester Fire & Rescue
Incremental stake acquired since
1 April 2014
Ealing Schools
D & C Firearms Training Centre
Home Office
Brighton Hospital Dutch High Speed Rail Link Edinburgh Schools
Sheffield Schools
Norwich Schools
Derby Schools
Croydon School
Manchester School
West Lothian Schools
Rhondda Schools
Haverstock School
Highland Schools PPP
Falkirk Schools NPD
Brentwood Community Hospital
NW Anthony Henday P3
AquaSure
University of Sheffield Accommodation
RD901
University of Bourgogne South Ayrshire Schools
Bradford Schools 2
14 www.hicl.com
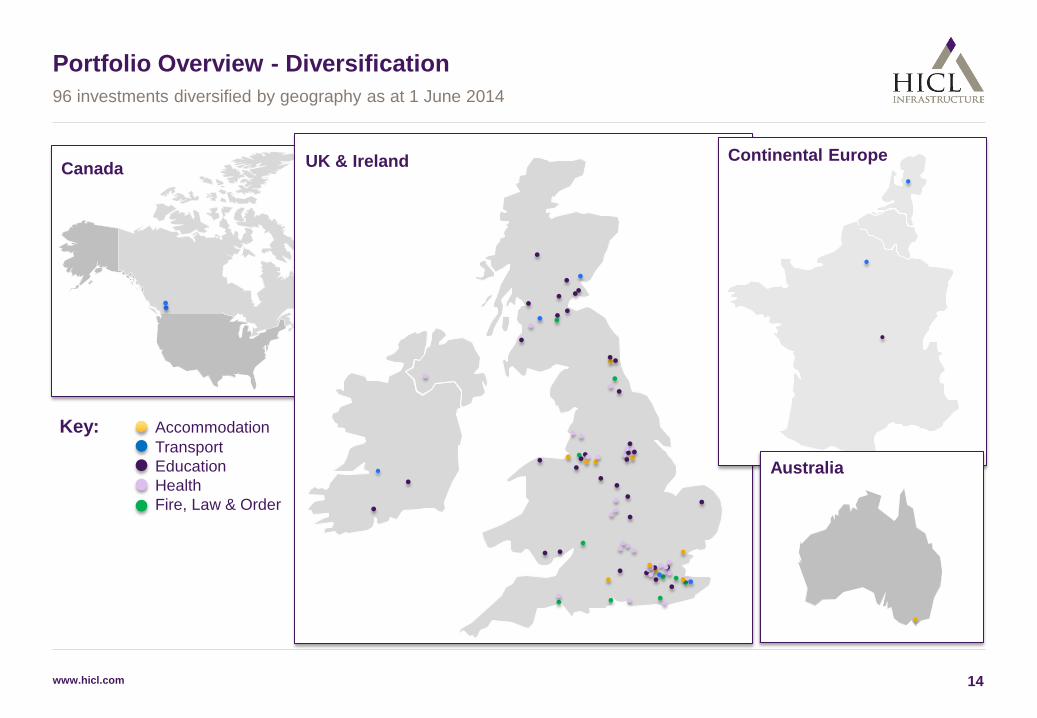
Portfolio Overview - Diversification 96 investments diversified by geography as at 1 June 2014
Canada UK & Ireland Continental Europe
Australia
Key: Accommodation Transport Education Health Fire, Law & Order

15 www.hicl.com
Health 34%
Accommodation 24%
Education 22%
Transport 14%
Fire, Law & Order 6%
Portfolio Overview - Diversification 96 investments diversified by size and sector as at 1 June 2014
Home Office 6% Allenby &
Connaught 5% Dutch High
Speed Rail Link 5%
Queen Alexandra Hospital
5% Connect
4% Colchester Garrison
4% Aquasure
3% Birmingham
Hospital 3% Highland
Schools 3% Edinburgh
Schools 2%
Remaining Investments
60%
Sector Breakdown Size Breakdown
By value, using Directors’ valuation as at 31 March 2014 plus acquisitions at cost to 1 June 2014
16 www.hicl.com
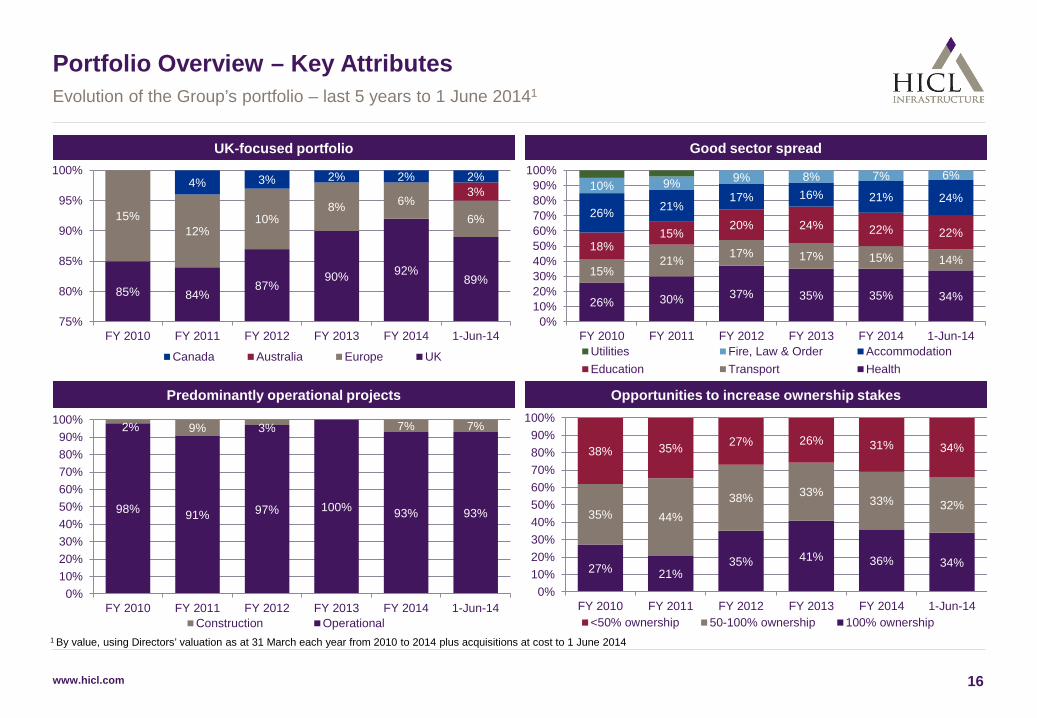
Portfolio Overview – Key Attributes Evolution of the Group’s portfolio – last 5 years to 1 June 20141
1 By value, using Directors’ valuation as at 31 March each year from 2010 to 2014 plus acquisitions at cost to 1 June 2014
UK-focused portfolio
Predominantly operational projects Opportunities to increase ownership stakes
85% 84% 87%
90% 92% 89%
15% 12%
10% 8% 6%
6%
3% 4% 3% 2% 2% 2%
75%
80%
85%
90%
95%
100%
FY 2010 FY 2011 FY 2012 FY 2013 FY 2014 1-Jun-14
Canada Australia Europe UK
27% 21% 35% 41% 36% 34%
35% 44% 38% 33%
33% 32%
38% 35% 27% 26% 31% 34%
0%10%20%30%40%50%60%70%80%90%
100%
FY 2010 FY 2011 FY 2012 FY 2013 FY 2014 1-Jun-14<50% ownership 50-100% ownership 100% ownership
98% 91% 97% 100% 93% 93%
2% 9% 3% 7% 7%
0%10%20%30%40%50%60%70%80%90%
100%
FY 2010 FY 2011 FY 2012 FY 2013 FY 2014 1-Jun-14Construction Operational
Good sector spread
26% 30% 37% 35% 35% 34%
15% 21% 17% 17% 15% 14%
18% 15%
20% 24% 22% 22% 26% 21%
17% 16% 21% 24% 10% 9% 9% 8% 7% 6%
0%10%20%30%40%50%60%70%80%90%
100%
FY 2010 FY 2011 FY 2012 FY 2013 FY 2014 1-Jun-14Utilities Fire, Law & Order AccommodationEducation Transport Health
www.hicl.com 17
-
£300m
£600m
£900m
£1,200m
£1,500m
£1,800m
-
£50m
£100m
£150m
£200m
£250m
£300m
Forecast aggregate annual portfolio cash receipts March 2014 (LHS) Portfolio valuation March 2014 (RHS)
HICL Year Ending 31 March
Ann
ual P
roje
ct d
istr
ibut
ions
Port
folio
val
ue
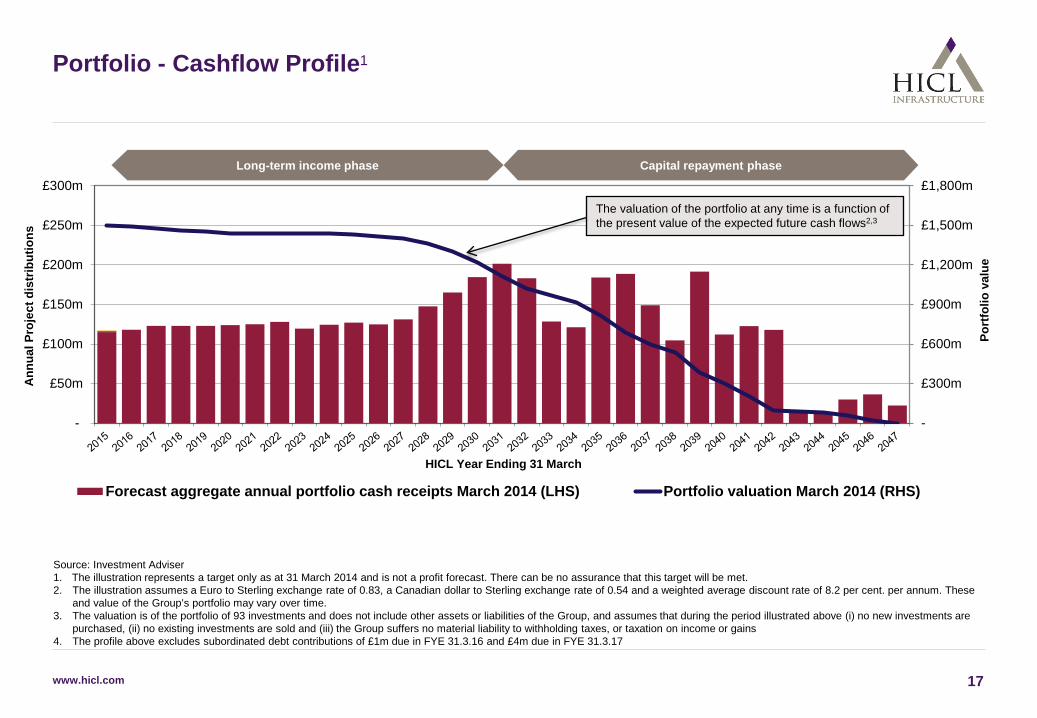
Portfolio - Cashflow Profile1
Long-term income phase Capital repayment phase
Source: Investment Adviser 1. The illustration represents a target only as at 31 March 2014 and is not a profit forecast. There can be no assurance that this target will be met. 2. The illustration assumes a Euro to Sterling exchange rate of 0.83, a Canadian dollar to Sterling exchange rate of 0.54 and a weighted average discount rate of 8.2 per cent. per annum. These
and value of the Group’s portfolio may vary over time. 3. The valuation is of the portfolio of 93 investments and does not include other assets or liabilities of the Group, and assumes that during the period illustrated above (i) no new investments are
purchased, (ii) no existing investments are sold and (iii) the Group suffers no material liability to withholding taxes, or taxation on income or gains 4. The profile above excludes subordinated debt contributions of £1m due in FYE 31.3.16 and £4m due in FYE 31.3.17
The valuation of the portfolio at any time is a function of the present value of the expected future cash flows2,3

www.hicl.com 18
Asset, Portfolio and Contract Management - Overview
Picture – construction underway at the Royal School of Military Engineering
Portfolio performing well with no material issues – number of small operational matters being worked through
Five projects are under construction: – Allenby and Connaught Ministry of Defence Accommodation:
construction completion expected summer 2014
– RD901 road in France : financial close January 2014 with construction in progress
– University of Bourgogne academic buildings : financial close July 2013 with construction in progress
– Royal School of Military Engineering : construction completion scheduled for 2015
– N17/N18 PPP road : financial close May 2014 with construction due to begin in June 2014
Investment Adviser has recruited further asset management resource
Active and regular engagement with all project stakeholders
Continue to work with clients and contractors to drive cost efficiencies and utilise portfolio lessons learnt
Continuing implementation and refinement of ESG principles within project companies

www.hicl.com 19
Portfolio Overview - Contractor Counterparty Exposure1
Counterparties continue to perform
Diversity of contractors ensures no over-reliance on any single entity
Quarterly reviews by Investment Adviser
Four providers have consolidated relevant businesses during the year (Balfour Beatty selling to GDF Suez, and John Laing to Carillion)
Diversified spread of quality supply chain providers
1 By value, as at 31 March 2014, using Directors’ valuation 2 Ten largest exposures shown 3 Where a project has more than one operations contractor in a joint and several contract, the better credit counterparty has been selected (based on analysis by the Investment Adviser) 4 Where a project has more than one operations contractor, not in a joint and several contract, the exposures is split equally among the contractors, so the sum of the pie segments equals the Directors’ valuation 5 There were four projects under construction as at 31 March 2014, Allenby & Connaught with Carillion and KBR as construction contractors on a joint and several basis, RSME with Carillion, and RD901 and University of
Bourgogne with subsidiaries of Bouygues.
Carillion 17%
Bouygues 12%
GDF Suez (Cofely)
12%
Sodexo 9% Mitie
8%
KBR 5%
Fluor 5%
Thales 4%
Vinci 4%
Mears 3%
Other Contractors
21%
www.hicl.com 20
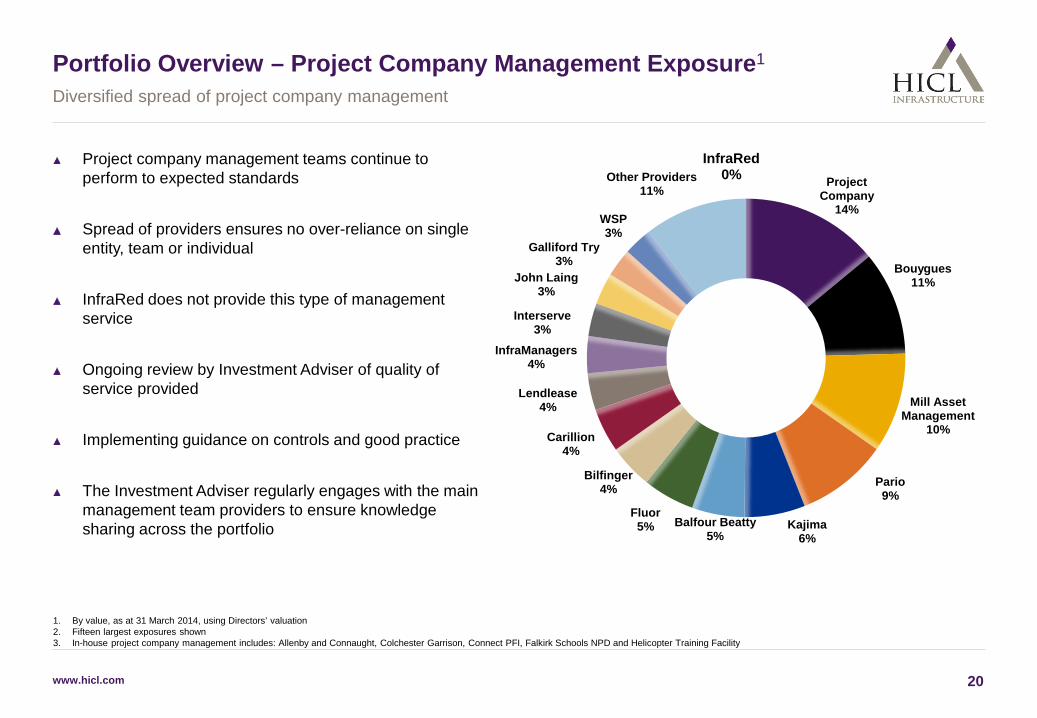
Project Company
14%
Bouygues 11%
Mill Asset Management
10%
Pario 9%
Kajima 6%
Balfour Beatty 5%
Fluor 5%
Bilfinger 4%
Carillion 4%
Lendlease 4%
InfraManagers 4%
Interserve 3%
John Laing 3%
Galliford Try 3%
WSP 3%
InfraRed 0% Other Providers
11%
Portfolio Overview – Project Company Management Exposure1
Project company management teams continue to perform to expected standards
Spread of providers ensures no over-reliance on single entity, team or individual
InfraRed does not provide this type of management service
Ongoing review by Investment Adviser of quality of service provided
Implementing guidance on controls and good practice
The Investment Adviser regularly engages with the main management team providers to ensure knowledge sharing across the portfolio
Diversified spread of project company management
1. By value, as at 31 March 2014, using Directors’ valuation 2. Fifteen largest exposures shown 3. In-house project company management includes: Allenby and Connaught, Colchester Garrison, Connect PFI, Falkirk Schools NPD and Helicopter Training Facility

21 www.hicl.com
Financial Review - Analysis of Change in Directors’ Valuation 2013-14 Return driven by portfolio performance and accretive acquisitions
239.2
(9.2)
(111.3 )
12.1 36.9
126.5
(6.7)
1,213.1
1,331.8
1,500.6
£1,000m
£1,050m
£1,100m
£1,150m
£1,200m
£1,250m
£1,300m
£1,350m
£1,400m
£1,450m
£1,500m
£1,550m
31 March 2013valuation
Investments Divestments Cashdistributions
RebasedValuation
Return Change indiscount rate
Economicassumptions
Forexmovement
31 March 2014valuation
+9.5% +2.8% +0.9% -0.5%
1
▲ Divestments includes £1.1m of profit on disposals ▲ “Return” comprises the unwinding of the discount rate; cost efficiencies in managing projects; value-accretive acquisitions; and variations ▲ Portfolio return for year to 31 March 2014 is 9.5% (being £126.5m return on rebased Valuation of £1,331.8m)
www.hicl.com 22
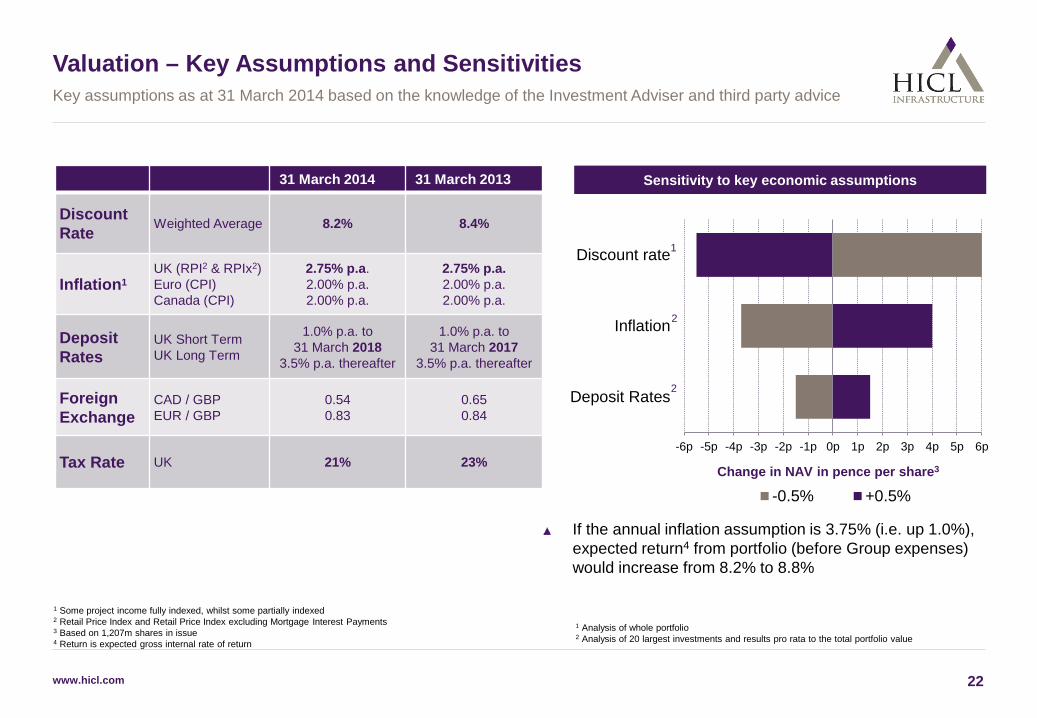
Valuation – Key Assumptions and Sensitivities Key assumptions as at 31 March 2014 based on the knowledge of the Investment Adviser and third party advice
1 Some project income fully indexed, whilst some partially indexed 2 Retail Price Index and Retail Price Index excluding Mortgage Interest Payments 3 Based on 1,207m shares in issue 4 Return is expected gross internal rate of return
-6p -5p -4p -3p -2p -1p 0p 1p 2p 3p 4p 5p 6p
Deposit Rates
Inflation
Discount rate
Change in NAV in pence per share3
-0.5% +0.5%
Sensitivity to key economic assumptions
If the annual inflation assumption is 3.75% (i.e. up 1.0%), expected return4 from portfolio (before Group expenses) would increase from 8.2% to 8.8%
31 March 2014 31 March 2013
Discount Rate Weighted Average 8.2% 8.4%
Inflation1 UK (RPI2 & RPIx2) Euro (CPI) Canada (CPI)
2.75% p.a. 2.00% p.a. 2.00% p.a.
2.75% p.a. 2.00% p.a. 2.00% p.a.
Deposit Rates
UK Short Term UK Long Term
1.0% p.a. to 31 March 2018
3.5% p.a. thereafter
1.0% p.a. to 31 March 2017
3.5% p.a. thereafter
Foreign Exchange
CAD / GBP EUR / GBP
0.54 0.83
0.65 0.84
Tax Rate UK 21% 23%
1 Analysis of whole portfolio 2 Analysis of 20 largest investments and results pro rata to the total portfolio value
2
2
1
www.hicl.com 23
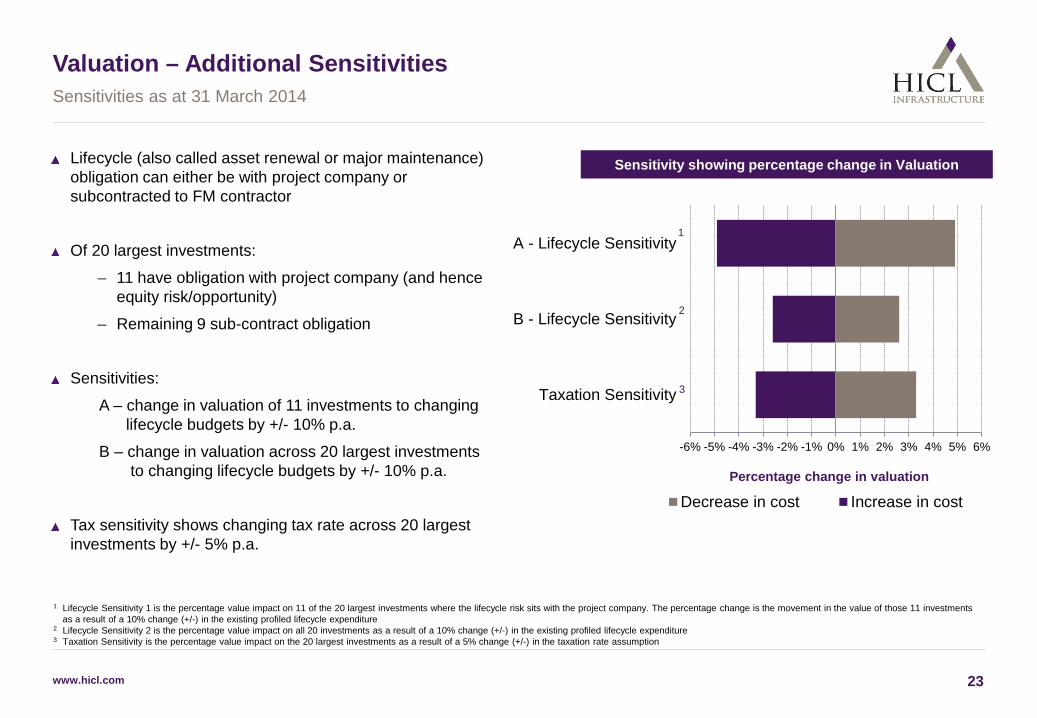
Valuation – Additional Sensitivities
-6% -5% -4% -3% -2% -1% 0% 1% 2% 3% 4% 5% 6%
Taxation Sensitivity
B - Lifecycle Sensitivity
A - Lifecycle Sensitivity
Percentage change in valuation
Decrease in cost Increase in cost
Sensitivity showing percentage change in Valuation
1 Lifecycle Sensitivity 1 is the percentage value impact on 11 of the 20 largest investments where the lifecycle risk sits with the project company. The percentage change is the movement in the value of those 11 investments as a result of a 10% change (+/-) in the existing profiled lifecycle expenditure
2 Lifecycle Sensitivity 2 is the percentage value impact on all 20 investments as a result of a 10% change (+/-) in the existing profiled lifecycle expenditure 3 Taxation Sensitivity is the percentage value impact on the 20 largest investments as a result of a 5% change (+/-) in the taxation rate assumption
1
2
3
Lifecycle (also called asset renewal or major maintenance) obligation can either be with project company or subcontracted to FM contractor
Of 20 largest investments:
– 11 have obligation with project company (and hence equity risk/opportunity)
– Remaining 9 sub-contract obligation
Sensitivities:
A – change in valuation of 11 investments to changing lifecycle budgets by +/- 10% p.a.
B – change in valuation across 20 largest investments to changing lifecycle budgets by +/- 10% p.a.
Tax sensitivity shows changing tax rate across 20 largest investments by +/- 5% p.a.
Sensitivities as at 31 March 2014
www.hicl.com 24
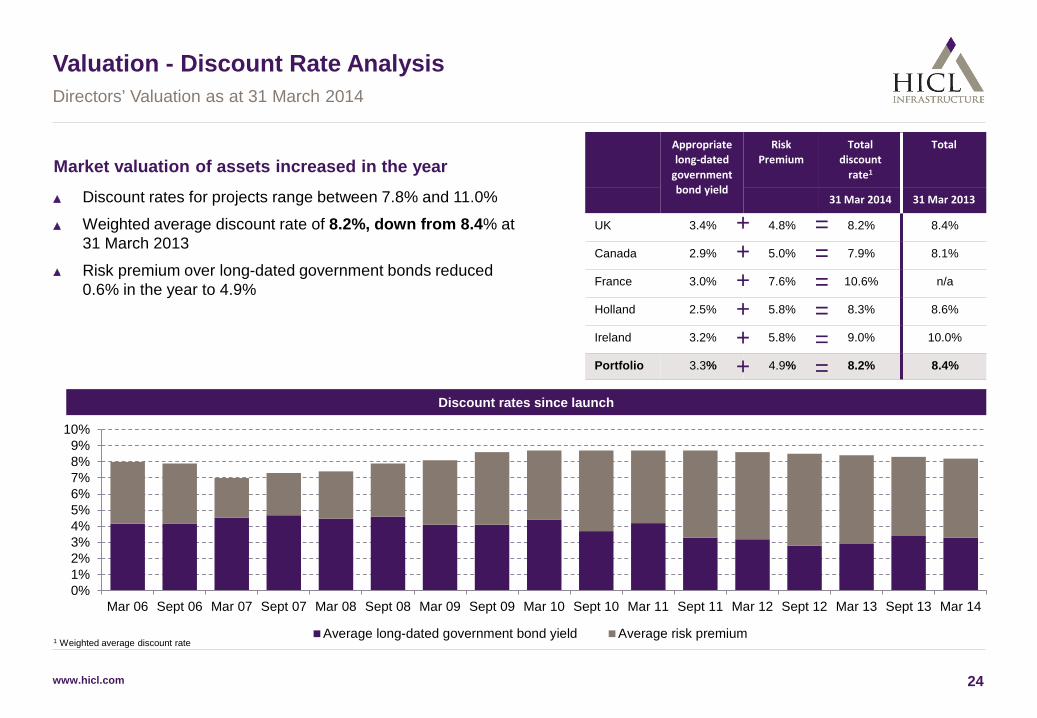
Valuation - Discount Rate Analysis
Discount rates for projects range between 7.8% and 11.0%
Weighted average discount rate of 8.2%, down from 8.4% at 31 March 2013
Risk premium over long-dated government bonds reduced 0.6% in the year to 4.9%
Directors’ Valuation as at 31 March 2014
Market valuation of assets increased in the year
Discount rates since launch
Appropriate long-dated
government bond yield
Risk Premium
Total discount
rate1
Total
31 Mar 2014 31 Mar 2013
UK 3.4% 4.8% 8.2% 8.4%
Canada 2.9% 5.0% 7.9% 8.1%
France 3.0% 7.6% 10.6% n/a
Holland 2.5% 5.8% 8.3% 8.6%
Ireland 3.2% 5.8% 9.0% 10.0%
Portfolio 3.3% 4.9% 8.2% 8.4%
+ + + + + +
= = = = = =
0%1%2%3%4%5%6%7%8%9%
10%
Mar 06 Sept 06 Mar 07 Sept 07 Mar 08 Sept 08 Mar 09 Sept 09 Mar 10 Sept 10 Mar 11 Sept 11 Mar 12 Sept 12 Mar 13 Sept 13 Mar 14
Average long-dated government bond yield Average risk premium1 Weighted average discount rate
www.hicl.com 25
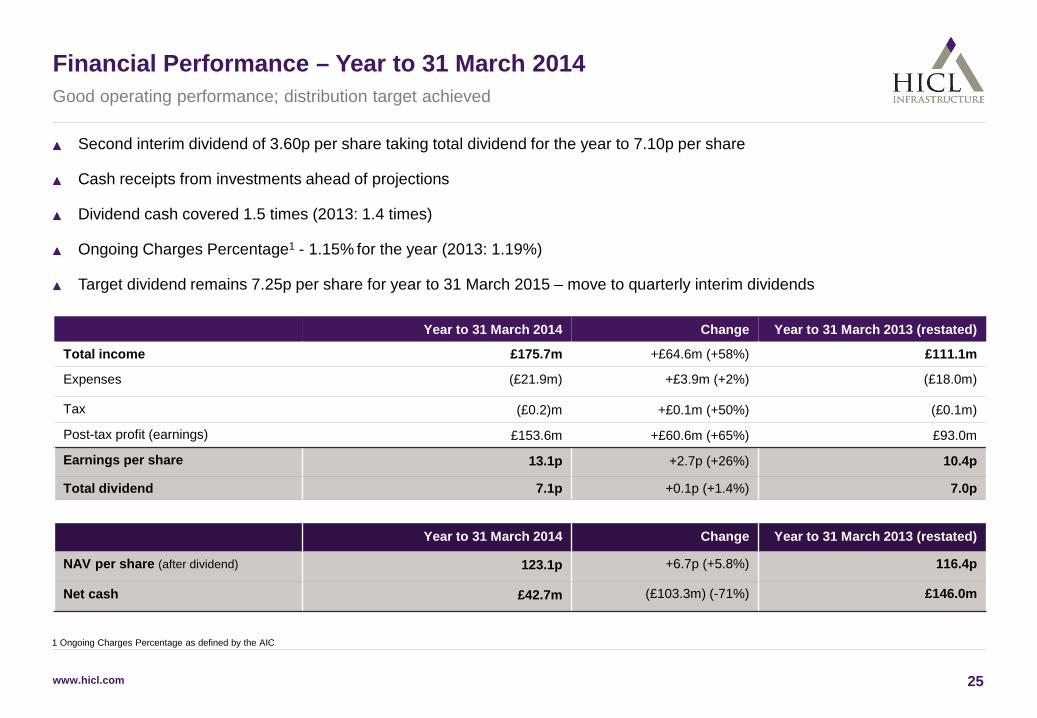
Financial Performance – Year to 31 March 2014
Second interim dividend of 3.60p per share taking total dividend for the year to 7.10p per share
Cash receipts from investments ahead of projections
Dividend cash covered 1.5 times (2013: 1.4 times)
Ongoing Charges Percentage1 - 1.15% for the year (2013: 1.19%)
Target dividend remains 7.25p per share for year to 31 March 2015 – move to quarterly interim dividends
Good operating performance; distribution target achieved
Year to 31 March 2014 Change Year to 31 March 2013 (restated)
Total income £175.7m +£64.6m (+58%) £111.1m
Expenses (£21.9m) +£3.9m (+2%) (£18.0m)
Tax (£0.2)m +£0.1m (+50%) (£0.1m)
Post-tax profit (earnings) £153.6m +£60.6m (+65%) £93.0m
Earnings per share 13.1p +2.7p (+26%) 10.4p
Total dividend 7.1p +0.1p (+1.4%) 7.0p
Year to 31 March 2014 Change Year to 31 March 2013 (restated)
NAV per share (after dividend) 123.1p +6.7p (+5.8%) 116.4p
Net cash £42.7m (£103.3m) (-71%) £146.0m
1 Ongoing Charges Percentage as defined by the AIC
www.hicl.com 26
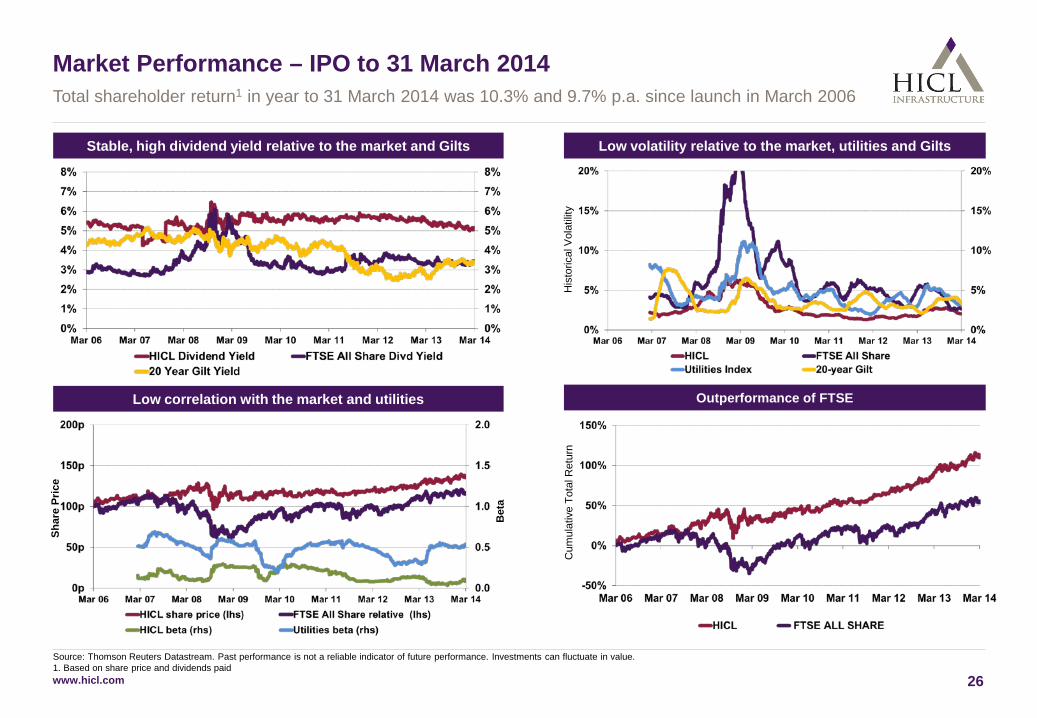
Market Performance – IPO to 31 March 2014 Total shareholder return1 in year to 31 March 2014 was 10.3% and 9.7% p.a. since launch in March 2006
Source: Thomson Reuters Datastream. Past performance is not a reliable indicator of future performance. Investments can fluctuate in value. 1. Based on share price and dividends paid
Stable, high dividend yield relative to the market and Gilts Low volatility relative to the market, utilities and Gilts
Cum
ulat
ive
Tota
l Ret
urn
Shar
e Pr
ice
Outperformance of FTSE Low correlation with the market and utilities
Bet
a
His
toric
al V
olat
ility
www.hicl.com 27
Market Update and Pipeline Reputation and relationships remain integral to success in a competitive market
Upward pricing pressure continuing and unlikely to abate in short term
Investor interest in real assets increasing
Infrastructure investments particularly in demand and interest is unlikely to dissipate even if rates rise in the medium term
More vendors undertaking formal auction processes
Supply more constrained in the near term, but positive medium term outlook
In the UK, PF2 and National Infrastructure Plan generating limited opportunities currently, but longer term looks promising
Continuing number of corporate disposals of secondary stakes as sellers wish to recycle capital and realise gains
The pool of secondary opportunities growing in Europe through new primary procurement
US procurement varies by State, but is gradually building momentum and could be a significant medium to long-term opportunity
Despite competitive landscape, Group still well-positioned to capitalise on its reputation and global network of relationships
Evaluated similar number of opportunities as previous year
Only completed acquisitions which met the investment criteria – avoided overpaying; minimised abortive bid costs
Outbid on a number of competitive bid processes – secured four investments in 18 auctions in which participated
In year, increased number of investments overseas and with construction risk

28 www.hicl.com
HICL Group Strategy
Manage existing portfolio: Add value through active management
Engage with public sector clients to generate cost savings
Source and evaluate investment opportunities which are:
Predominantly social and transportation infrastructure
PFI/PPP/P3 concession contracts with public sector clients Availability-based revenues with inflation-linkage
Of possible interest, if risk/return appropriate:
infrastructure debt, transmission lines, small utilities and toll roads with mitigated traffic risk
Maintain position by: Adherence to clear, stated strategy and delivering target returns
Focused investment strategy, with value accretive new investments
Maintain pricing discipline
Sourcing carefully, through relationships
Achieving continued portfolio delivery

www.hicl.com 29
Summary
Group performance
Quality, well-diversified portfolio
Assets performing and distributing ahead of expectations in year
Value growth through pro-active asset management, judicious acquisitions, and accretive equity issuance
Seek further investment opportunities where they can be accretive to existing portfolio
Distributions and Performance
Met target distribution of 7.1p per share for year to 31 March 2014
Total returns of 11.9% p.a. in year on NAV growth plus dividends
Deliver sustainable distributions – Board has reiterated target distribution for the year to 31 March 2015 of 7.25p per share
Move to quarterly dividends
Seek some further NAV growth from selective acquisitions and portfolio performance
0p20p40p60p80p
100p120p140p160p180p
IPO FYEMar 07
FYEMar 08
FYEMar 09
FYEMar 10
FYEMar 11
FYEMar 12
FYEMar 13
FYEMar 14
NAV per Share Cumulative Dividends
5.0p
5.5p
6.0p
6.5p
7.0p
7.5p
IPO FYEMar 07
FYEMar 08
FYEMar 09
FYEMar 10
FYEMar 11
FYEMar 12
FYEMar 13
FYEMar 14
NAV Growth and Cumulative Dividends since IPO
Annual Dividends since IPO
Penc
e pe
r Sha
re
Penc
e pe
r Sha
re
30 www.hicl.com
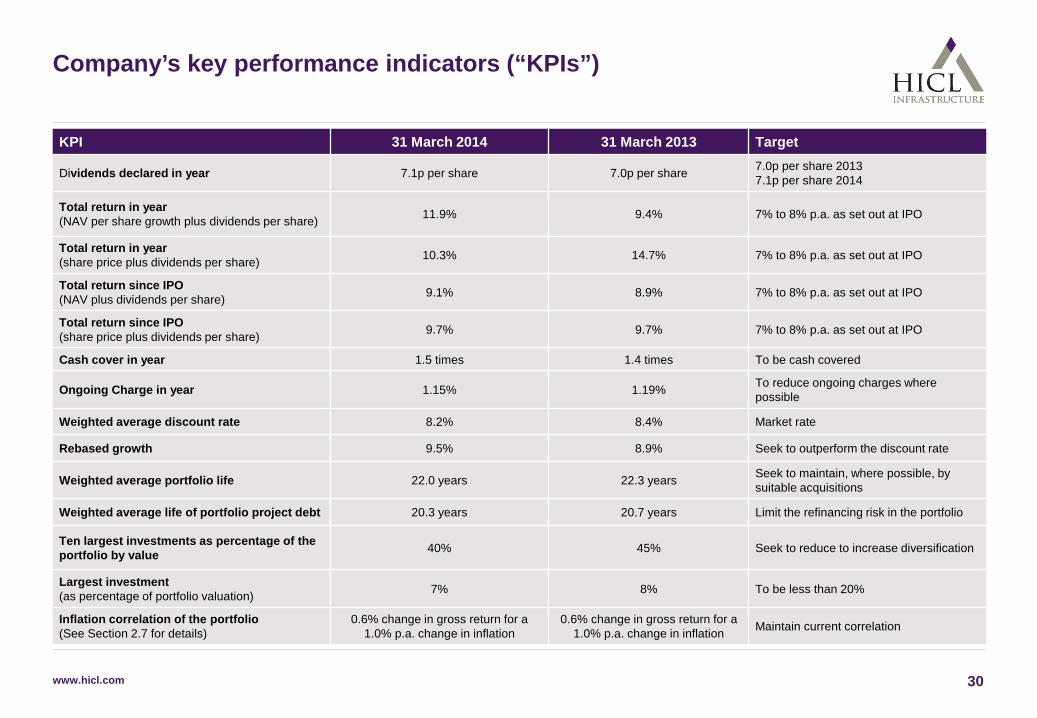
Company’s key performance indicators (“KPIs”)
KPI 31 March 2014 31 March 2013 Target
Dividends declared in year 7.1p per share 7.0p per share 7.0p per share 2013 7.1p per share 2014
Total return in year (NAV per share growth plus dividends per share) 11.9% 9.4% 7% to 8% p.a. as set out at IPO
Total return in year (share price plus dividends per share) 10.3% 14.7% 7% to 8% p.a. as set out at IPO
Total return since IPO (NAV plus dividends per share) 9.1% 8.9% 7% to 8% p.a. as set out at IPO
Total return since IPO (share price plus dividends per share) 9.7% 9.7% 7% to 8% p.a. as set out at IPO
Cash cover in year 1.5 times 1.4 times To be cash covered
Ongoing Charge in year 1.15% 1.19% To reduce ongoing charges where possible
Weighted average discount rate 8.2% 8.4% Market rate
Rebased growth 9.5% 8.9% Seek to outperform the discount rate
Weighted average portfolio life 22.0 years 22.3 years Seek to maintain, where possible, by suitable acquisitions
Weighted average life of portfolio project debt 20.3 years 20.7 years Limit the refinancing risk in the portfolio
Ten largest investments as percentage of the portfolio by value 40% 45% Seek to reduce to increase diversification
Largest investment (as percentage of portfolio valuation) 7% 8% To be less than 20%
Inflation correlation of the portfolio (See Section 2.7 for details)
0.6% change in gross return for a 1.0% p.a. change in inflation
0.6% change in gross return for a 1.0% p.a. change in inflation Maintain current correlation