Vintage Filings, LLC (A PR Newswire Company) US$98.0 million for Aquinox Pharmaceuticals, Inc. on...
49
SECOND QUARTER Fiscal 2016 Report to Shareholders Canaccord Genuity Group Inc. Reports Second Quarter Fiscal 2016 Results Excluding significant items, second quarter loss per common share of $0.01 (1) driven by a significant decline in global equity capital markets activity (All dollar amounts are stated in Canadian dollars unless otherwise indicated) TORONTO, November 4, 2015 - During the second quarter of fiscal 2016, the quarter ended September 30, 2015, Canaccord Genuity Group Inc. (Canaccord, the Company, TSX: CF, LSE: CF.) generated $190.6 million in revenue. Excluding significant items (1) , the Company recorded net income of $1.9 million or a net loss of $0.9 million attributable to common shareholders (2) (a loss per common share of $0.01). Including all expense items, on an IFRS basis, the Company recorded a net loss of $0.4 million or a net loss attributable to common shareholders (2) of $3.1 million (a loss per common share of $0.03). ‘‘The sharp decline in global capital markets activity during the period negatively impacted performance in many areas of our business’’,said Dan Daviau, President & CEO of Canaccord Genuity Group Inc. ‘‘We are using this period of market weakness productively,with a focus on improving alignment across our global operations to enhance operating efficiencies and drive significantly stronger outcomes for our shareholders and for our clients.’’ Second Quarter of Fiscal 2016 vs. Second Quarter of Fiscal 2015 • Revenue of $190.6 million, a decrease of 19% or $45.7 million from $236.3 million • Excluding significant items, expenses of $186.2 million, a decrease of 10% or $21.2 million from $207.4 million (1) • Expenses of $189.1 million, a decrease of 11% or $22.2 million from $211.3 million • Excluding significant items, loss per common share of $0.01 compared to diluted earnings per share (EPS) of $0.17 (1) • Excluding significant items, net income of $1.9 million compared to net income of $20.7 million (1) • Net loss of $0.4 million compared to net income of $17.6 million • Loss per common share of $0.03 compared to diluted EPS of $0.14 Second Quarter of Fiscal 2016 vs First Quarter of Fiscal 2016 • Revenue of $190.6 million, a decrease of 11% or $23.9 million from $214.5 million • Excluding significant items, expenses of $186.2 million, a decrease of 6% or $12.9 million from $199.1 million (1) • Expenses of $189.1 million, a decrease of 6% or $12.9 million from $202.0 million • Excluding significant items, loss per common share of $0.01 compared to diluted EPS of $0.10 (1) • Excluding significant items, net income of $1.9 million compared to net income of $13.3 million (1) • Net loss of $0.4 million compared to a net income of $11.0 million • Loss per common share of $0.03 compared to a diluted EPS of $0.08 Contents Canaccord Reports Second Quarter Results 1 Letter to Shareholders 5 Management’s Discussion and Analysis 7 Unaudited Interim Condensed Consolidated Statements of Financial Position 30 Unaudited Interim Condensed Consolidated Statements of Operations 31 Unaudited Interim Condensed Consolidated Statements of Comprehensive Income 32 Unaudited Interim Condensed Consolidated Statements of Changes in Equity 33 Unaudited Interim Condensed Consolidated Statements of Cash Flows 34 Notes to Unaudited Interim Condensed Consolidated Financial Statements 35 CANACCORD GENUITY GROUP INC. SECOND QUARTER FISCAL 2016 1
Transcript of Vintage Filings, LLC (A PR Newswire Company) US$98.0 million for Aquinox Pharmaceuticals, Inc. on...

SECONDQUARTERFiscal 2016 Report to Shareholders
Canaccord Genuity Group Inc. Reports Second Quarter Fiscal 2016 Results
Excluding significant items, second quarter loss per common share of $0.01(1) driven by a significantdecline in global equity capital markets activity
(All dollar amounts are stated in Canadian dollars unless otherwise indicated)
TORONTO, November 4, 2015 − During the second quarter of fiscal 2016, the quarter ended September 30, 2015, Canaccord Genuity Group Inc.(Canaccord, the Company, TSX: CF, LSE: CF.) generated $190.6 million in revenue. Excluding significant items(1), the Company recorded net income of$1.9 million or a net loss of $0.9 million attributable to common shareholders(2) (a loss per common share of $0.01). Including all expense items, onan IFRS basis, the Company recorded a net loss of $0.4 million or a net loss attributable to common shareholders(2) of $3.1 million (a loss percommon share of $0.03).
‘‘The sharp decline in global capital markets activity during the period negatively impacted performance in many areas of our business’’, said Dan Daviau,President & CEO of Canaccord Genuity Group Inc. ‘‘We are using this period of market weakness productively, with a focus on improving alignment acrossour global operations to enhance operating efficiencies and drive significantly stronger outcomes for our shareholders and for our clients.’’
Second Quarter of Fiscal 2016 vs. Second Quarter of Fiscal 2015• Revenue of $190.6 million, a decrease of 19% or $45.7 million from $236.3 million• Excluding significant items, expenses of $186.2 million, a decrease of 10% or $21.2 million from $207.4 million(1)
• Expenses of $189.1 million, a decrease of 11% or $22.2 million from $211.3 million• Excluding significant items, loss per common share of $0.01 compared to diluted earnings per share (EPS) of $0.17(1)
• Excluding significant items, net income of $1.9 million compared to net income of $20.7 million(1)
• Net loss of $0.4 million compared to net income of $17.6 million• Loss per common share of $0.03 compared to diluted EPS of $0.14
Second Quarter of Fiscal 2016 vs First Quarter of Fiscal 2016• Revenue of $190.6 million, a decrease of 11% or $23.9 million from $214.5 million• Excluding significant items, expenses of $186.2 million, a decrease of 6% or $12.9 million from $199.1 million(1)
• Expenses of $189.1 million, a decrease of 6% or $12.9 million from $202.0 million• Excluding significant items, loss per common share of $0.01 compared to diluted EPS of $0.10(1)
• Excluding significant items, net income of $1.9 million compared to net income of $13.3 million(1)
• Net loss of $0.4 million compared to a net income of $11.0 million• Loss per common share of $0.03 compared to a diluted EPS of $0.08
Contents
Canaccord Reports Second Quarter Results 1
Letter to Shareholders 5
Management’s Discussionand Analysis
7
Unaudited Interim Condensed ConsolidatedStatements of Financial Position
30
Unaudited Interim Condensed ConsolidatedStatements of Operations
31
Unaudited Interim Condensed ConsolidatedStatements of Comprehensive Income
32
Unaudited Interim Condensed ConsolidatedStatements of Changes in Equity
33
Unaudited Interim Condensed ConsolidatedStatements of Cash Flows
34
Notes to Unaudited Interim CondensedConsolidated Financial Statements
35
CANACCORD GENUITY GROUP INC. SECOND QUARTER FISCAL 2016 1
Year-to-Date Fiscal 2016 vs. Year-to-Date Fiscal 2015(Six Months Ended September 30, 2015 vs. Six Months Ended September 30, 2014)• Revenue of $405.1 million, a decrease of 16% or $76.7 million from $481.8 million• Excluding significant items, expenses of $385.4 million, a decrease of 9% or $37.9 million from $423.3 million(1)
• Expenses of $391.1 million, a decrease of 10% or $42.5 million from $433.6 million• Excluding significant items, diluted EPS of $0.09 compared to diluted EPS of $0.37(1)
• Excluding significant items, net income of $15.3 million compared to net income of $44.8 million(1)
• Net income of $10.5 million compared to net income of $36.5 million• Diluted EPS of $0.04 compared to diluted EPS of $0.29
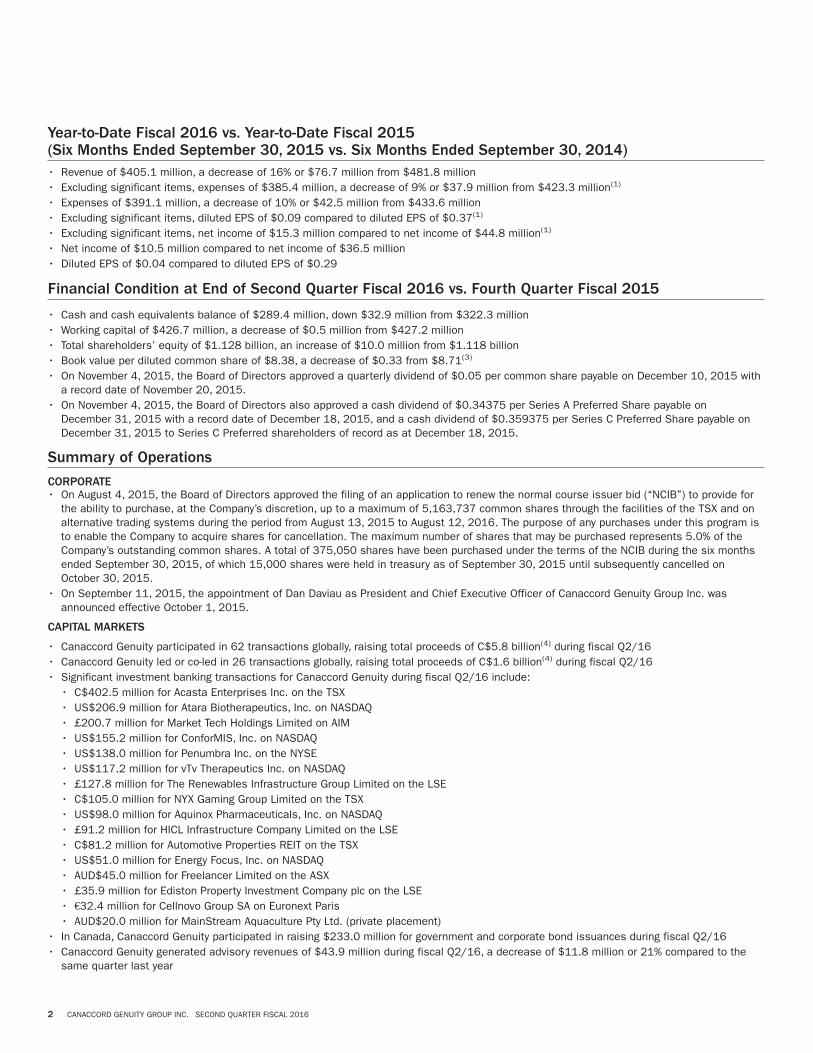
Financial Condition at End of Second Quarter Fiscal 2016 vs. Fourth Quarter Fiscal 2015
• Cash and cash equivalents balance of $289.4 million, down $32.9 million from $322.3 million• Working capital of $426.7 million, a decrease of $0.5 million from $427.2 million• Total shareholders’ equity of $1.128 billion, an increase of $10.0 million from $1.118 billion• Book value per diluted common share of $8.38, a decrease of $0.33 from $8.71(3)
• On November 4, 2015, the Board of Directors approved a quarterly dividend of $0.05 per common share payable on December 10, 2015 witha record date of November 20, 2015.
• On November 4, 2015, the Board of Directors also approved a cash dividend of $0.34375 per Series A Preferred Share payable onDecember 31, 2015 with a record date of December 18, 2015, and a cash dividend of $0.359375 per Series C Preferred Share payable onDecember 31, 2015 to Series C Preferred shareholders of record as at December 18, 2015.
Summary of Operations
CORPORATE• On August 4, 2015, the Board of Directors approved the filing of an application to renew the normal course issuer bid (‘‘NCIB’’) to provide for
the ability to purchase, at the Company’s discretion, up to a maximum of 5,163,737 common shares through the facilities of the TSX and onalternative trading systems during the period from August 13, 2015 to August 12, 2016. The purpose of any purchases under this program isto enable the Company to acquire shares for cancellation. The maximum number of shares that may be purchased represents 5.0% of theCompany’s outstanding common shares. A total of 375,050 shares have been purchased under the terms of the NCIB during the six monthsended September 30, 2015, of which 15,000 shares were held in treasury as of September 30, 2015 until subsequently cancelled onOctober 30, 2015.
• On September 11, 2015, the appointment of Dan Daviau as President and Chief Executive Officer of Canaccord Genuity Group Inc. wasannounced effective October 1, 2015.
CAPITAL MARKETS
• Canaccord Genuity participated in 62 transactions globally, raising total proceeds of C$5.8 billion(4) during fiscal Q2/16• Canaccord Genuity led or co-led in 26 transactions globally, raising total proceeds of C$1.6 billion(4) during fiscal Q2/16• Significant investment banking transactions for Canaccord Genuity during fiscal Q2/16 include:
• C$402.5 million for Acasta Enterprises Inc. on the TSX• US$206.9 million for Atara Biotherapeutics, Inc. on NASDAQ• £200.7 million for Market Tech Holdings Limited on AIM• US$155.2 million for ConforMIS, Inc. on NASDAQ• US$138.0 million for Penumbra Inc. on the NYSE• US$117.2 million for vTv Therapeutics Inc. on NASDAQ• £127.8 million for The Renewables Infrastructure Group Limited on the LSE• C$105.0 million for NYX Gaming Group Limited on the TSX• US$98.0 million for Aquinox Pharmaceuticals, Inc. on NASDAQ• £91.2 million for HICL Infrastructure Company Limited on the LSE• C$81.2 million for Automotive Properties REIT on the TSX• US$51.0 million for Energy Focus, Inc. on NASDAQ• AUD$45.0 million for Freelancer Limited on the ASX• £35.9 million for Ediston Property Investment Company plc on the LSE• €32.4 million for Cellnovo Group SA on Euronext Paris• AUD$20.0 million for MainStream Aquaculture Pty Ltd. (private placement)
• In Canada, Canaccord Genuity participated in raising $233.0 million for government and corporate bond issuances during fiscal Q2/16• Canaccord Genuity generated advisory revenues of $43.9 million during fiscal Q2/16, a decrease of $11.8 million or 21% compared to the
same quarter last year
2 CANACCORD GENUITY GROUP INC. SECOND QUARTER FISCAL 2016

• During fiscal Q2/16, significant M&A and advisory transactions included:• Distech Controls Inc. on its C$318 million sale to Acuity Brands Inc.• Data & Audio-Visual Enterprises Wireless Inc., operating as Mobilicity, on its sale to Rogers Communications• NYX Gaming Group Limited on its $150 million acquisition of Chartwell Technology Inc. and Cryptologic Limited• Charles Bank Capital Partners on its acquisition of Six Degrees Technology Group Limited• Bridgepoint Development Capital and shareholders of Siblu Holdings Limited on the sale of Siblu to Stirling Square Capital Partners• Altura Medical, Inc. on its sale to Lombard Medical, Inc.• Amino Technologies PLC on the acquisition of Entone, Inc.• Anite PLC on its sale to Keysight Technologies Inc.• Shoe Sensation, Inc. on its sale to J.W. Childs Associates, L.P.• Harvest International New Energy, Inc., a subsidiary of Sunshine Kaidi New Energy Group Co. of China, on the C$147.0 million acquisition
of Alter NRG Corporation• TFS Corporation Limited on its acquisition of ViroXis Corporation and Santalis Pharmaceuticals• United House Group Holdings on the disposal of Tegeneration Portfolio to Telford Homes plc
CANACCORD GENUITY WEALTH MANAGEMENT (GLOBAL)
• Globally, Canaccord Genuity Wealth Management generated $62.5 million in revenue in Q2/16• Assets under administration in Canada and assets under management in the UK & Europe and Australia were $33.2 billion at the end
of Q2/16(3)
CANACCORD GENUITY WEALTH MANAGEMENT (NORTH AMERICA)
• Canaccord Genuity Wealth Management (North America) generated $26.2 million in revenue and, after intersegment allocations and beforetaxes, recorded a net loss of $1.7 million in Q2/16
• Assets under administration in Canada were $9.5 billion as at September 30, 2015, a decrease of 11% from $10.6 billion at the end of theprevious quarter and a decrease of 12% from $10.8 billion at the end of fiscal Q2/15(3)
• Assets under management in Canada (discretionary) were $1.36 billion as at September 30, 2015, a decrease of 4% from $1.42 billion atthe end of the previous quarter and a decrease of 2% from $1.39 billion at the end of fiscal Q2/15(3)
• Canaccord Genuity Wealth Management had 141 Advisory Teams(5), a decrease of six Advisory Teams from June 30, 2015 and a decrease of21 from September 30, 2014
CANACCORD GENUITY WEALTH MANAGEMENT (UK & EUROPE)
• Wealth management operations in the UK & Europe generated $34.0 million in revenue and, after intersegment allocations, and excludingsignificant items, recorded net income of $6.0 million before taxes in Q2/16(1)
• Assets under management (discretionary and non-discretionary) were $22.9 billion (£11.4 billion) as at September 30, 2015, an increase of1% from $22.8 billion (£11.6 billion) at the end of the previous quarter and an increase of 12% from $20.4 billion (£11.3 billion) fromSeptember 30, 2014(3)
(1) Figures excluding significant items are non-IFRS measures. See Non-IFRS Measures on pages 4 and 8.(2) Net income (loss) attributable to common shareholders is calculated as the net income (loss) adjusted for non-controlling interests and preferred share dividends.(3) See Non-IFRS Measures on pages 4 and 8.(4) Source: Transactions over $1.5 million. Internally sourced information.(5) Advisory Teams are normally comprised of one or more Investment Advisors (IAs) and their assistants and associates, who together manage a shared set of client accounts. Advisory Teams that are led by, or only include, an IA who has been
licensed for less than three years are not included in our Advisory Team count, as it typically takes a new IA approximately three years to build an average-sized book of business.
CANACCORD GENUITY GROUP INC. SECOND QUARTER FISCAL 2016 3
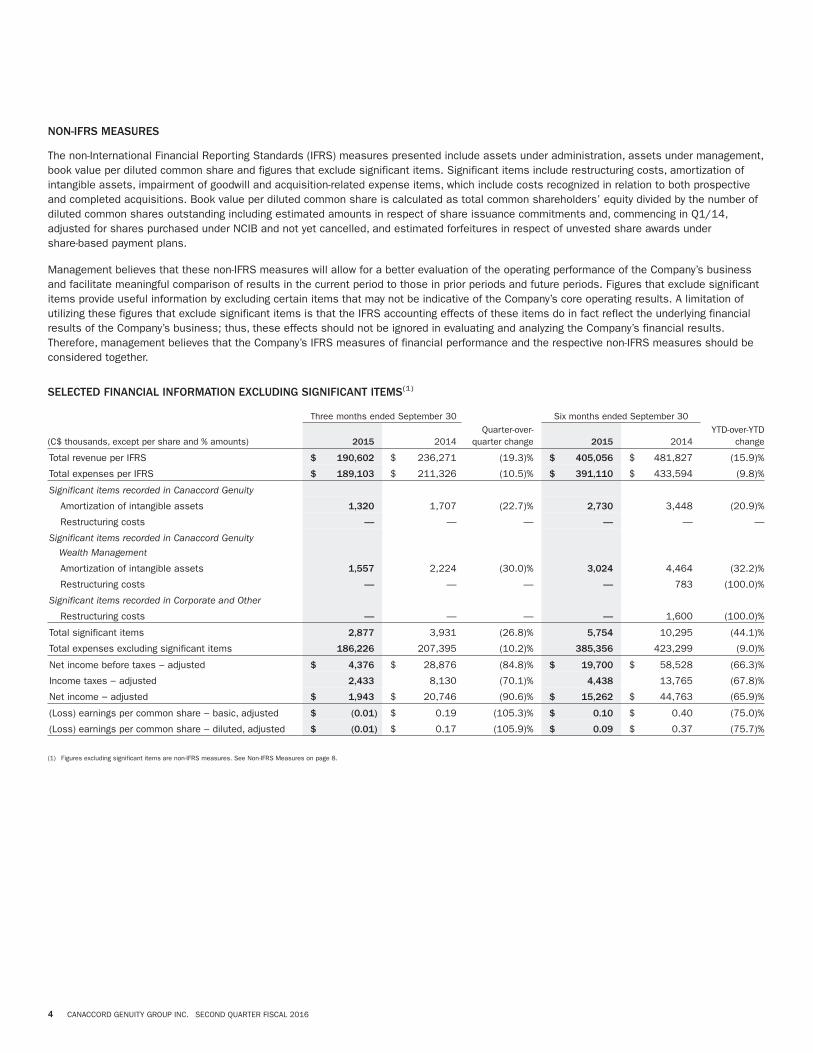
NON-IFRS MEASURES
The non-International Financial Reporting Standards (IFRS) measures presented include assets under administration, assets under management,book value per diluted common share and figures that exclude significant items. Significant items include restructuring costs, amortization ofintangible assets, impairment of goodwill and acquisition-related expense items, which include costs recognized in relation to both prospectiveand completed acquisitions. Book value per diluted common share is calculated as total common shareholders’ equity divided by the number ofdiluted common shares outstanding including estimated amounts in respect of share issuance commitments and, commencing in Q1/14,adjusted for shares purchased under NCIB and not yet cancelled, and estimated forfeitures in respect of unvested share awards undershare-based payment plans.
Management believes that these non-IFRS measures will allow for a better evaluation of the operating performance of the Company’s businessand facilitate meaningful comparison of results in the current period to those in prior periods and future periods. Figures that exclude significantitems provide useful information by excluding certain items that may not be indicative of the Company’s core operating results. A limitation ofutilizing these figures that exclude significant items is that the IFRS accounting effects of these items do in fact reflect the underlying financialresults of the Company’s business; thus, these effects should not be ignored in evaluating and analyzing the Company’s financial results.Therefore, management believes that the Company’s IFRS measures of financial performance and the respective non-IFRS measures should beconsidered together.
SELECTED FINANCIAL INFORMATION EXCLUDING SIGNIFICANT ITEMS(1)
Three months ended September 30 Six months ended September 30
(C$ thousands, except per share and % amounts) 2015 2014Quarter-over-
quarter change 2015 2014YTD-over-YTD
change
Total revenue per IFRS $ 190,602 $ 236,271 (19.3)% $ 405,056 $ 481,827 (15.9)%
Total expenses per IFRS $ 189,103 $ 211,326 (10.5)% $ 391,110 $ 433,594 (9.8)%
Significant items recorded in Canaccord Genuity
Amortization of intangible assets 1,320 1,707 (22.7)% 2,730 3,448 (20.9)%
Restructuring costs — — — — — —
Significant items recorded in Canaccord Genuity
Wealth Management
Amortization of intangible assets 1,557 2,224 (30.0)% 3,024 4,464 (32.2)%
Restructuring costs — — — — 783 (100.0)%
Significant items recorded in Corporate and Other
Restructuring costs — — — — 1,600 (100.0)%
Total significant items 2,877 3,931 (26.8)% 5,754 10,295 (44.1)%
Total expenses excluding significant items 186,226 207,395 (10.2)% 385,356 423,299 (9.0)%
Net income before taxes − adjusted $ 4,376 $ 28,876 (84.8)% $ 19,700 $ 58,528 (66.3)%
Income taxes − adjusted 2,433 8,130 (70.1)% 4,438 13,765 (67.8)%
Net income − adjusted $ 1,943 $ 20,746 (90.6)% $ 15,262 $ 44,763 (65.9)%
(Loss) earnings per common share − basic, adjusted $ (0.01) $ 0.19 (105.3)% $ 0.10 $ 0.40 (75.0)%
(Loss) earnings per common share − diluted, adjusted $ (0.01) $ 0.17 (105.9)% $ 0.09 $ 0.37 (75.7)%
(1) Figures excluding significant items are non-IFRS measures. See Non-IFRS Measures on page 8.
4 CANACCORD GENUITY GROUP INC. SECOND QUARTER FISCAL 2016
Fellow Shareholders:
Our second quarter was one of the more challenging periods for global capital markets in recent history. During the three-month period, the MSCIworld equity index fell 9.9%, the S&P/TSX lost 8.6% and the S&P 500 dropped 6.9%. This translated into significantly lower capital marketsactivity for our business when compared to the same period last year.
For the second fiscal quarter of 2016, Canaccord Genuity Group Inc. earned revenue of $190.6 million. Excluding significant items, net incomefor the period was $1.9 million, which translated into a loss per common share of $0.01. The overall decline in net income we experienced waslargely a result of reduced activity by corporate issuers, leading to a decrease in investment banking and advisory fees when compared to thesame period last year. Notwithstanding the difficult environment, we are pleased to report year-over-year revenue growth in our US capitalmarkets and UK & Europe wealth management businesses.
Committed to driving net income growth
As incoming CEO, I am intensely focused on addressing the challenges in our business. With the support of my global colleagues, I haveprioritized initiatives which centre on driving longer-term value creation and ultimately, improving our net income results. I firmly believe theprinciples driving these initiatives will become entrenched in our corporate culture, and better enhance alignment across our firm and with ourshareholders.
Specifically, we are using this period of market weakness to address and eliminate any barriers which have inhibited our regional businessesfrom maximizing opportunities globally. We have renewed our emphasis on key verticals to drive growth and we are working to enhance globalcoordination across our firm, as a more partnership-based organization. Through improved transparency and a stronger bottom line focus, ouremployees will become better aligned with shareholders. Most importantly, we are working to redefine our culture and strengthen our reputationas a leading global independent investment bank.
An important component of these initiatives is a commitment to improve global alignment and operating efficiencies across our business. SinceOctober 1st, we have made early progress in identifying areas where we can reduce fixed costs and strengthen alignment between our front andback office operations. While I am confident we can implement certain developments near-term, the benefits of larger projects may requiremultiple quarters to translate into our financial results. I look forward to updating you on our advancements, as we approach the release of ourthird quarter results in early February.
Capital markets
In the second fiscal quarter of 2016, Canaccord Genuity participated in 62 transactions and raised total proceeds of $5.8 billion for our clients.
During this three-month period, global equity capital markets volumes fell to their lowest levels since 2011. While the industry saw improvingdemand for new issues at the start of the quarter, significant volatility in August and September led to the withdrawal or postponement of anumber of transactions. With the exception of our US capital markets business, which generated revenues of $55.9 million, or 44.2% of globalcapital markets revenues, all other geographies had declining revenue for the period. Compared to the same quarter last year, revenue from ourglobal capital markets business declined by 26%, to $126.5 million.
In Canada, equity underwriting activity decreased by 52% compared to the same period last year. As a result, our Canadian capital marketsbusiness experienced the most significant decline in revenue, a 64% drop compared to the same period one year ago. The decrease wasmagnified by two substantial transactions that took place during second fiscal quarter of last year.
The strong start to the quarter allowed our UK & Europe business to increase year-over-year equity underwriting revenues by 7.9%, but loweractivity in advisory and principal trading impacted total revenues for this business, which declined by 22% to $38.3 million for the quarter.
While our Australian business has demonstrated its ability to outperform in recent quarters, a dramatic drop in capital raising activity across theAsia-Pacific region during the period was reflected in second quarter results, and revenue in this business fell 38%, to $7.5 million. During theperiod, we took steps to establish a single point of leadership for the Asia-Pacific region, an initiative which will promote better alignment acrossour investment banking and advisory practices, and one we expect will enhance earnings capability going forward.
The steps we are taking to improve global alignment will provide opportunities for incremental revenue improvement over the coming quarters.Additionally, with our differentiated service offering and proven global execution capabilities, each of our businesses continues to enjoy a strongpipeline. I am confident in our ability to deliver value on behalf of growth companies when market conditions are supportive.
While we remain cautious in our outlook for near-term global investment banking and advisory activity, we are focused on positioning ourbusiness to capitalize on the intermediate and longer-term opportunities in sectors we have targeted for growth.
CANACCORD GENUITY GROUP INC. SECOND QUARTER FISCAL 2016 5

Stronger fee-based business limits losses for wealth management operations
Our global wealth management operations generated revenue of $60.2 million for the quarter, a decrease of $1.2 million compared to thesecond quarter of last year. This result was mostly attributable to lower commission fees and revenues associated with the decline in investmentbanking activity in our North American operations.
When compared to previous periods of similar revenue generation, our Canadian Wealth Management business has been able to successfullylimit losses, highlighting the progress we have made in reducing fixed costs and shifting towards a stronger recurring revenue model. Importantly,expenses as a percentage of revenue in this business were 86.7% for the quarter, unchanged from the previous three-month period and adecrease of 3.5 percentage points when compared to the same period last year.
Our in-house asset management platform has been a significant contributor to improving the financial strength of this business. One year ago,we launched our proprietary asset management product, GPS Optimized Portfolios and brought management of our ETF portfolios in-house.Since then, total assets under management in these products have surpassed $200 million dollars.
Our UK Wealth Management operations generated revenue of $34.0 million, an increase of 14% compared to the second quarter of fiscal 2015.Since 70% of revenue in this business is attributable to fee-related activities, it is less sensitive to changes in market conditions. At the end ofthe quarter, assets under management in this business were $22.9 billion, an increase of 12% from the same period one year ago. Additionally,assets in funds managed by our in-house investment team surpassed $1 billion at the end of the quarter. While a percentage of total assetgrowth is attributable to the impact of foreign exchange rates, revenue growth for the period demonstrates our ability to attract and retain assetsin a challenging market environment.
Looking ahead, we will continue to pursue opportunities to increase fee-based revenues — and ultimately, shareholder value — across our globalwealth management operations. As we continue to strengthen our wealth management offering, we expect to achieve this growth both organicallyand through strategic business opportunities.
Commitment to our communities
In any market, our teams are committed to making positive contributions in the communities where we operate. During the quarter we hosted thethird annual Canaccord Genuity Great Camp Adventure Walk to benefit the Hospital for Sick Children. A grand total of $2.2 million was raised tosupport the goal of improving health and well-being for children around the world. From October 14 − 23, through commissions generated fromdesignated agency trades, our US capital markets team helped raise US$600 thousand dollars to benefit Youth INC during Trading Week forKids, bringing our four year contribution to more than US$3 million.
Positioning our business to excel as global growth visibility improves
Our success depends on the strength of many components.
While each of our geographies is in a different state of evolution, all are capable of growing market share, and producing stronger returns.Although we expect this challenging operating environment to persist through the balance of the fiscal year, I believe we have a number ofopportunities to strengthen our offering and continue to enhance the delivery of regional and global service levels for our clients. Looking ahead,we will continue to identify our greatest areas of opportunity and focus our efforts where we can be most successful.
I am committed to creating a robust culture of accountability and partnership, which empowers our employees to deliver the best work of theircareers. We have a highly capable and focused team in place, all of whom are energized and eager to advance our strategic goals and continueto deliver stronger outcomes for our clients, and our shareholders.
I am confident in the strength of our global franchise. As we navigate these difficult markets together, I encourage you to measure our successwith a longer term view of creating significant shareholder value.
Kind regards,
DAN DAVIAUPresident & CEOCanaccord Genuity Group Inc.
LETTER TO SHAREHOLDER
6 CANACCORD GENUITY GROUP INC. SECOND QUARTER FISCAL 2016
Management’s Discussion and Analysis
Second quarter fiscal 2016 for the three months and six months ended September 30, 2015 — this document is dated November 4, 2015
The following discussion of the financial condition and results of operations for Canaccord Genuity Group Inc. is provided to enable the readerto assess material changes in our financial condition and to assess results for the three- and six-month periods ended September 30, 2015compared to the corresponding period in the preceding fiscal year. The three-month period ended September 30, 2015 is also referred to assecond quarter 2016 and Q2/16. Unless otherwise indicated or the context otherwise requires, the ‘‘Company’’ refers to Canaccord GenuityGroup Inc. and ‘‘Canaccord Genuity Group’’ refers to the Company and its direct and indirect subsidiaries. ‘‘Canaccord Genuity’’ refers to theinvestment banking and capital markets segment of the Company. This discussion should be read in conjunction with: the unaudited interimcondensed consolidated financial statements for the three- and six-month periods ended September 30, 2015, beginning on page 30 of thisreport; our Annual Information Form (AIF) dated June 26, 2015; and the 2015 annual Management’s Discussion and Analysis (MD&A) includingthe audited consolidated financial statements for the fiscal year ended March 31, 2015 (Audited Annual Consolidated Financial Statements) inthe Company’s annual report dated June 2, 2015 (the 2015 Annual Report). There has been no material change to the information contained inthe annual MD&A for fiscal 2015 except as disclosed in this MD&A. The Company’s financial information is expressed in Canadian dollarsunless otherwise specified.
Cautionary Statement Regarding Forward-Looking Information
This document may contain ‘‘forward-looking statements’’ (as defined under applicable securities laws). These statements relate to futureevents or future performance and reflect management’s expectations, beliefs, plans, estimates, intentions and similar statements concerninganticipated future events, results, circumstances, performance or expectations that are not historical facts, including business and economicconditions and the Company’s growth, results of operations, performance and business prospects and opportunities. Such forward-lookingstatements reflect management’s current beliefs and are based on information currently available to management. In some cases,forward-looking statements can be identified by terminology such as ‘‘may’’, ‘‘will’’, ‘‘should’’, ‘‘expect’’, ‘‘plan’’, ‘‘anticipate’’, ‘‘believe’’, ‘‘estimate’’,‘‘predict’’, ‘‘potential’’, ‘‘continue’’, ‘‘target’’, ‘‘intend’’, ‘‘could’’ or the negative of these terms or other comparable terminology. By their verynature, forward-looking statements involve inherent risks and uncertainties, both general and specific, and a number of factors could causeactual events or results to differ materially from the results discussed in the forward-looking statements. In evaluating these statements, readersshould specifically consider various factors that may cause actual results to differ materially from any forward-looking statement. These factorsinclude, but are not limited to, market and general economic conditions, the nature of the financial services industry and the risks anduncertainties discussed from time to time in the Company’s interim condensed and annual consolidated financial statements and in its 2015Annual Report and AIF filed on www.sedar.com as well as the factors discussed in the section entitled ‘‘Risks’’ in this MD&A, which includemarket, liquidity, credit, operational, legal and regulatory risks. Material factors or assumptions that were used by the Company to develop theforward-looking information contained in this document include, but are not limited to, those set out in the Fiscal 2016 Outlook section in theannual MD&A and those discussed from time to time in the Company’s interim condensed and annual consolidated financial statements and inits 2015 Annual Report and AIF filed on www.sedar.com. The preceding list is not exhaustive of all possible risk factors that may influence actualresults. Readers are cautioned that the preceding list of material factors or assumptions is also not exhaustive.
Although the forward-looking information contained in this document is based upon what management believes are reasonable assumptions,there can be no assurance that actual results will be consistent with these forward-looking statements. The forward-looking statementscontained in this document are made as of the date of this document and should not be relied upon as representing the Company’s views as ofany date subsequent to the date of this document. Certain statements included in this document may be considered ‘‘financial outlook’’ forpurposes of applicable Canadian securities laws, and such financial outlook may not be appropriate for purposes other than this document.Except as may be required by applicable law, the Company does not undertake, and specifically disclaims, any obligation to update or revise anyforward-looking information, whether as a result of new information, further developments or otherwise.
Presentation of Financial Information and Non-IFRS Measures
This MD&A is based on the unaudited interim condensed consolidated financial statements for the three- and six-month periods endedSeptember 30, 2015 (Second Quarter 2016 Financial Statements) prepared in accordance with International Financial Reporting Standards(IFRS). The Second Quarter 2016 Financial Statements have been prepared in accordance with International Accounting Standard 34, ‘‘InterimFinancial Reporting’’ (IAS 34), and using accounting policies consistent with those applied in preparing the Company’s Audited AnnualConsolidated Financial Statements for the year ended March 31, 2015.
CANACCORD GENUITY GROUP INC. SECOND QUARTER FISCAL 2016 7
NON-IFRS MEASURES
Certain non-IFRS measures are utilized by the Company as measures of financial performance. Non-IFRS measures do not have any standardizedmeaning prescribed by IFRS and are therefore unlikely to be comparable to similar measures presented by other companies. Non-IFRS measurespresented include assets under administration, assets under management, book value per diluted common share, return on common equity andfigures that exclude significant items.
The Company’s capital is represented by common and preferred shareholders’ equity and, therefore, management uses return on common equity(ROE) as a performance measure. Also used by the Company as a performance measure is book value per diluted common share, which iscalculated as total common shareholders’ equity divided by the number of diluted common shares outstanding including estimated amounts inrespect of share issuance commitments and adjusted for shares purchased under the normal course issuer bid and not yet cancelled, andestimated forfeitures in respect of unvested share awards under share-based payment plans.
Assets under administration (AUA) and assets under management (AUM) are non-IFRS measures of client assets that are common to the wealthmanagement business. AUA — Canada, AUM — Australia and AUM — UK & Europe are the market value of client assets managed andadministered by the Company from which the Company earns commissions and fees. This measure includes funds held in client accounts aswell as the aggregate market value of long and short security positions. AUM — Canada includes all assets managed on a discretionary basisunder programs that are generally described as or known as the Complete Canaccord Investment Counselling Program and the CompleteCanaccord Private Investment Management Program. Services provided include the selection of investments and the provision of investmentadvice. The Company’s method of calculating AUA — Canada, AUM — Canada, AUM — Australia and AUM — UK & Europe may differ from themethods used by other companies and therefore may not be comparable to other companies. Management uses these measures to assessoperational performance of the Canaccord Genuity Wealth Management business segment. AUM — Canada is also administered by theCompany and is included in AUA — Canada.
Financial statement items that exclude significant items are non-IFRS measures. Significant items for these purposes include restructuringcosts, amortization of intangible assets, impairment of goodwill and acquisition-related expense items, which include costs recognized in relationto both prospective and completed acquisitions. See the Selected Financial Information Excluding Significant Items table on page 12.
Management believes that these non-IFRS measures allow for a better evaluation of the operating performance of the Company’s business andfacilitate meaningful comparison of results in the current period to those in prior periods and future periods. Figures that exclude significantitems provide useful information by excluding certain items that may not be indicative of the Company’s core operating results. A limitation ofutilizing these figures that exclude significant items is that the IFRS accounting effects of these items do in fact reflect the underlying financialresults of the Company’s business; thus, these effects should not be ignored in evaluating and analyzing the Company’s financial results.Therefore, management believes that the Company’s IFRS measures of financial performance and the respective non-IFRS measures should beconsidered together.
Business Overview
Through its principal subsidiaries, Canaccord Genuity Group Inc. is a leading independent, full-service financial services firm, with operations intwo principal segments of the securities industry: wealth management and capital markets. Since its establishment in 1950, the Company hasbeen driven by an unwavering commitment to building lasting client relationships. We achieve this by generating value for our individual,institutional and corporate clients through comprehensive investment solutions, brokerage services and investment banking services. CanaccordGenuity Group has offices in 10 countries worldwide, including wealth management offices located in Canada, Australia, the UK, Guernsey,Jersey, and the Isle of Man. Canaccord Genuity, the Company’s international capital markets division, has operations in Canada, the US, the UK,France, Ireland, Hong Kong, China, Singapore, Australia and Barbados.
Canaccord Genuity Group Inc. is publicly traded under the symbol CF on the TSX and the symbol CF. on the London Stock Exchange. CanaccordGenuity Series A Preferred Shares are listed on the TSX under the symbol CF.PR.A. Canaccord Genuity Series C Preferred Shares are listed onthe TSX under the symbol CF.PR.C.
Our business is affected by the overall condition of the worldwide equity and debt markets.
MANAGEMENT’S DISCUSSION AND ANALYSIS
8 CANACCORD GENUITY GROUP INC. SECOND QUARTER FISCAL 2016
BUSINESS ENVIRONMENT
During the second quarter of fiscal 2016, Greece finally struck a deal with its creditors, diminishing the likelihood of an exit from the euro zone.However, this welcome relief for global equity markets proved short-lived, as economic growth conditions in emerging markets (EM) anddeveloped markets (DM) weakened over the period, warning of a global economic slowdown. Fears were compounded by tumbling Chineseequities and the Chinese government’s decision to devalue the Renminbi in August. The Chinese economic slowdown weighed heavily on riskassets, notably commodity prices, which dampened performance of the S&P/TSX. Financial markets have also been impacted by the US FederalReserve, where expectations continue to converge toward an interest-rate hike this year. This ‘‘expectation’’ phase sent EM currencies sharplylower and the de-facto appreciation of the US dollar impacted export activity in the region. During the period, US manufacturers’ new ordersweakened markedly, which put S&P 500 earnings and sales under pressure. On the back of softening global economic growth, market volatility, astrengthening US dollar and low inflation, the US Federal Reserve ultimately decided against a rate hike in September. While Federal OpenMarket Committee (FOMC) members continue to expect higher interest rates going forward, investors were reassured that the interest ratenormalization process would likely prove to be gradual. In China, authorities proved successful in stopping the slide of Chinese equities, aided bythe People’s Bank of China cutting interest rates and lowering the reserve requirement ratio (RRR). The Reserve Bank of India (RBI) also providedstimulus in the region, cutting interest rates by a larger-than-expected 50bps in September. In response to lower commodity prices, the Canadianeconomy experienced a technical recession during the first half of calendar 2015, a result of weakened business investments. Recent datasuggests the Canadian economy has stabilized, due in part to interest rate cuts delivered by the Bank of Canada (BoC) earlier in the year and theimpact of a weaker Canadian dollar filtering through the economy.
In August, major equity markets experienced their first double-digit correction since 2011. Through the second quarter of fiscal 2016, the MSCIworld equity index fell 9.9%, the S&P/TSX lost 8.6% and the S&P 500 dropped 6.9%. Meanwhile, bonds posted a positive quarterly performance,as US and Canadian 10-year Treasury bond yields fell to 2.06% and 1.4%, respectively. The Canadian dollar depreciated by 6.2% versus theUS dollar. As for commodities, crude oil prices (WTI) were hit hard (-24%), ending the quarter near US$45/bbl. Higher oil rig counts, slower thanexpected decline in production and increased risk aversion all contributed to driving oil prices lower. In addition, prospects of a fall rate hike putpressure on other commodity prices during the quarter, such as lumber prices (-20%), grains (-13%), natural gas (-10%), copper (-10%), and gold(-4.7%). In all, Canadian equities and resource-sensitive stocks were most impacted by the decline in commodities, as the energy and materialsectors dropped by 9.7% and 16.7%, respectively.
We expect that the lagged impact of lower oil prices, rate cuts by EM central banks and weaker EM currencies will continue to filter through theglobal economy, while softening US economic statistics will delay the first Federal Reserve interest rate hike in 2016 and keep the US dollarunder pressure. The recent stabilization of EM currencies, along with the recovery in several commodity prices could be an early indication thatEM fundamentals are bottoming out. In China, economic challenges are now well understood and we expect that the improvement in monetaryconditions, along with bank lending activities will lead to improving economic conditions during the second half of the calendar year. Overall, withinflationary pressures receding quickly in EM economies, we expect that EM central banks will accelerate the pace of monetary reflation until realpolicy rates turn negative. A forceful approach to reflation and currency stability should continue to re-rate EM proxies such as the Canadiandollar, the S&P/TSX, and resource stocks. Looking ahead, we expect the Canadian economy to continue to moderately improve from its summerslump, which will support improving capital market activities (notably M&A) in the region. Further, a shift toward value-oriented stocks could alsoprovide some lift for late-cyclical stocks.
MARKET DATA
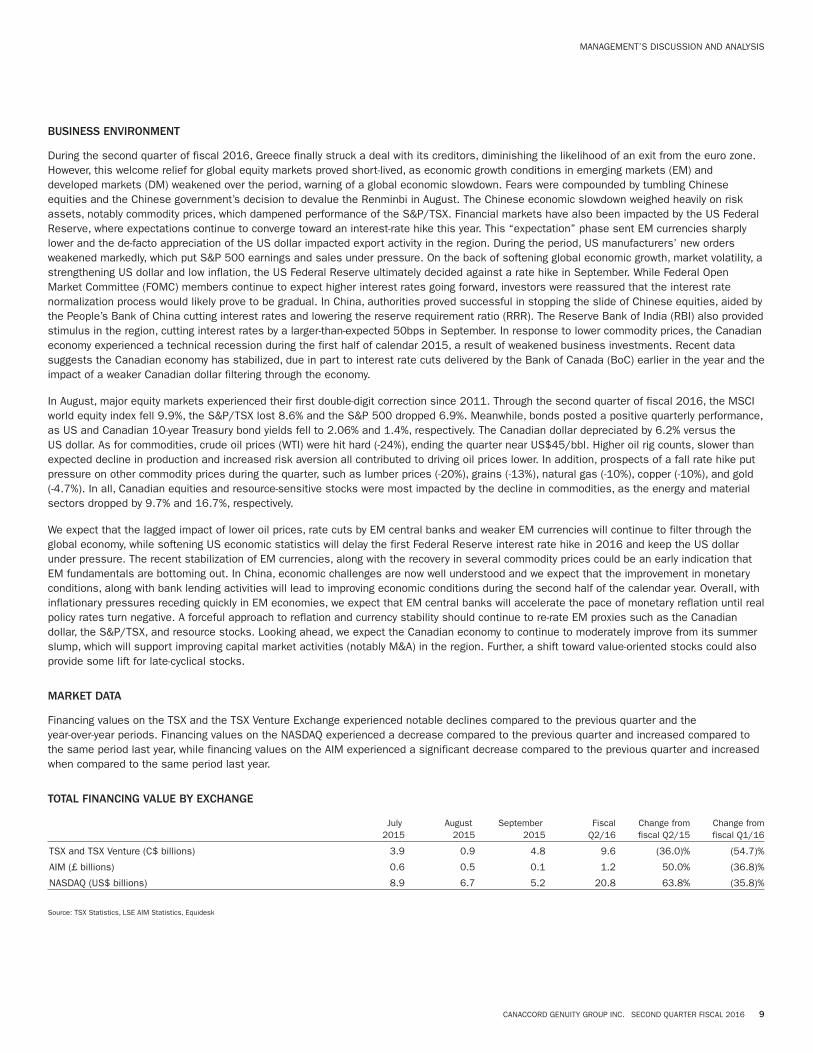
Financing values on the TSX and the TSX Venture Exchange experienced notable declines compared to the previous quarter and theyear-over-year periods. Financing values on the NASDAQ experienced a decrease compared to the previous quarter and increased compared tothe same period last year, while financing values on the AIM experienced a significant decrease compared to the previous quarter and increasedwhen compared to the same period last year.
TOTAL FINANCING VALUE BY EXCHANGE
July2015
August2015
September2015
FiscalQ2/16
Change fromfiscal Q2/15
Change fromfiscal Q1/16
TSX and TSX Venture (C$ billions) 3.9 0.9 4.8 9.6 (36.0)% (54.7)%
AIM (£ billions) 0.6 0.5 0.1 1.2 50.0% (36.8)%
NASDAQ (US$ billions) 8.9 6.7 5.2 20.8 63.8% (35.8)%
Source: TSX Statistics, LSE AIM Statistics, Equidesk
MANAGEMENT’S DISCUSSION AND ANALYSIS
CANACCORD GENUITY GROUP INC. SECOND QUARTER FISCAL 2016 9

ABOUT CANACCORD GENUITY GROUP INC.’S OPERATIONS
Canaccord Genuity Group Inc.’s operations are divided into two business segments: Canaccord Genuity (investment banking and capital marketsoperations) and Canaccord Genuity Wealth Management. Together, these operations offer a wide range of complementary investment bankingservices, investment products and brokerage services to the Company’s institutional, corporate and private clients. The Company’sadministrative segment is referred to as Corporate and Other.
Canaccord Genuity
Canaccord Genuity offers corporations and institutional investors around the world an integrated platform for equity research, sales and trading,and investment banking services that is built on extensive operations in Canada, the UK, Europe, the US, China, Hong Kong, Singapore, Australiaand Barbados.
Canaccord Genuity Wealth Management
Canaccord Genuity Wealth Management operations provide comprehensive wealth management solutions and brokerage services to individualinvestors, private clients, charities and intermediaries through a full suite of services tailored to the needs of clients in each of its markets. TheCompany’s wealth management division now has Investment Advisors (IAs) and professionals in Canada, Australia, the UK, the Channel Islandsand the Isle of Man.
Corporate and Other
Canaccord Genuity Group’s administrative segment, described as Corporate and Other, includes revenues and expenses associated withproviding correspondent brokerage services, bank and other interest, foreign exchange gains and losses, and activities not specifically allocableto either the Canaccord Genuity or Canaccord Genuity Wealth Management divisions. Also included in this segment are the Company’soperations and support services, which are responsible for front- and back-office information technology systems, compliance and riskmanagement, operations, legal, finance, and all administrative functions of Canaccord Genuity Group Inc.
Corporate structure
CanaccordGenuityLimited
(UK)
Canaccord GenuityGroup Inc.
CanaccordGenuity WealthManagement
(USA) Inc.
CanaccordGenuity Corp.
(Canada)
CanaccordGenuity
Wealth Limited(UK)
CanaccordGenuity Inc.
(US)
CanaccordGenuity Wealth(International)
Limited(Channel Islands)
USsub-group 50%
CanaccordGenuity Asia(China andHong Kong)
CanaccordGenuity
(Australia)Limited
CanaccordGenuity
(Barbados)Ltd.
CanaccordGenuity
SingaporePte Ltd.
CanaccordGenuity
(Dubai) Ltd.
The chart shows principal operating companies of the Canaccord Genuity group.
The Company owns 50% of the issued shares of Canaccord Financial Group (Australia) Pty Ltd and Canaccord Genuity (Australia) Limited, but for accounting purposes, as of September 30, 2015 the Company is considered to have a 60% interestbecause of the shares held in a trust controlled by Canaccord Financial Group (Australia) Pty Ltd [March 31, 2015 — 60%].
MANAGEMENT’S DISCUSSION AND ANALYSIS
10 CANACCORD GENUITY GROUP INC. SECOND QUARTER FISCAL 2016

Consolidated Operating Results
SECOND QUARTER AND FIRST HALF OF FISCAL 2016 SUMMARY DATA(1)(2)
Three months ended September 30 Six months ended September 30
(C$ thousands, except per share and% amounts, and number of employees) 2015 2014 2013
QTDQ2/16 vs.
Q2/15 2015 2014 2013
YTDFY 2016 vs.
FY 2015
Canaccord Genuity Group Inc. (CGGI)
Revenue
Commissions and fees $ 89,182 $ 86,240 $ 81,832 3.4% $ 183,888 $ 181,066 $ 171,867 1.6%
Investment banking 31,490 66,289 40,283 (52.5)% 96,903 153,661 72,116 (36.9)%
Advisory fees 43,912 55,741 29,894 (21.2)% 65,577 88,435 65,799 (25.8)%
Principal trading 17,592 17,708 18,883 (0.7)% 40,158 37,984 38,423 5.7%
Interest 4,334 5,902 6,132 (26.6)% 9,408 12,206 12,937 (22.9)%
Other 4,092 4,391 6,282 (6.8)% 9,122 8,475 9,395 7.6%
Total revenue 190,602 236,271 183,306 (19.3)% 405,056 481,827 370,537 (15.9)%
Expenses
Incentive compensation 92,681 119,389 87,511 (22.4)% 199,181 241,726 173,836 (17.6)%
Salaries and benefits 22,510 20,268 21,506 11.1% 45,074 42,801 44,616 5.3%
Other overhead expenses(3) 73,912 71,669 69,759 3.1% 146,855 146,684 138,442 0.1%
Restructuring costs(4) — — 5,486 — — 2,383 5,486 (100.0)%
Acquisition-related costs — — — — — — —
Total expenses 189,103 211,326 184,262 (10.5)% 391,110 433,594 362,380 (9.8)%
Income (loss) before income taxes 1,499 24,945 (956) (94.0)% 13,946 48,233 8,157 (71.1)%
Net (loss) income (431) 17,614 $ (80) (102.4)% 10,530 36,483 $ 7,803 (71.1)%
Net (loss) income attributable to:
CGGI shareholders $ (105) $ 17,109 $ (383) (100.6)% $ 10,309 $ 35,190 $ 8,358 (70.7)%
Non-controlling interests $ (326) $ 505 $ 303 (164.6)% $ 221 $ 1,293 $ (555) (82.9)%
(Loss) earnings per common share − diluted $ (0.03) $ 0.14 $ (0.03) (121.4)% $ 0.04 $ 0.29 $ 0.02 (86.2)%
Return on common equity (ROE) (1.3)% 6.1% (1.5)% (7.4) p.p. 1.0% 6.3% 0.6% (5.3) p.p.
Dividends per common share $ 0.05 $ 0.10 $ 0.05 (50.0)% $ 0.10 $ 0.15 $ 0.10 (33.3)%
Book value per diluted common share(5) $ 8.38 $ 8.90 $ 8.00 (5.8)%
Total assets $ 3,981,552 $ 4,719,202 $ 4,245,682 (15.6)%
Total liabilities $ 2,841,706 $ 3,562,261 $ 3,150,694 (20.2)%
Non-controlling interests $ 11,361 $ 15,130 $ 12,375 (24.9)%
Total shareholders’ equity $ 1,128,485 $ 1,141,811 $ 1,082,613 (1.2)%
Number of employees 1,887 2,018 2,012 (6.5)%
Excluding significant items(6)
Total expenses $ 186,226 $ 207,395 $ 175,367 (10.2)% $ 385,356 $ 423,299 $ 349,894 (9.0)%
Income before income taxes 4,376 28,876 7,939 (84.8)% 19,700 58,528 20,643 (66.3)%
Net income 1,943 20,746 6,734 (90.6)% 15,262 44,763 18,544 (65.9)%
Net income (loss) attributable to:
CGGI shareholders 2,076 19,986 6,192 (89.6)% 14,605 42,949 18,606 (66.0)%
Non-controlling interests (133) 760 542 (117.5)% 657 1,814 (62) (63.8)%
(Loss) earnings per common share − diluted (0.01) 0.17 0.03 (105.9)% 0.09 0.37 0.12 (75.7)%
(1) Data is in accordance with IFRS except for ROE, book value per diluted common share, figures excluding significant items and number of employees. See Non-IFRS Measures on page 8.(2) The operating results of the Australian operations have been fully consolidated and a 40% non-controlling interest has been recognized for the three and six months ended September 30, 2015 [three and six months
ended September 30, 2014 and September 30, 2013 — 50%.].(3) Consists of trading costs, premises and equipment, communication and technology, interest, general and administrative, amortization of tangible and intangible assets, and development costs.(4) Restructuring costs for the six months ended September 30, 2014 were incurred in connection with certain executive changes in our Corporate and Other segment and the closure of the Geneva office in our UK &
European wealth management operations. Restructuring costs for the six months ended September 30, 2013 include expenses mainly in connection with restructuring of our sales and trading operations in Canada andthe UK & Europe.
(5) Book value per diluted common share is calculated as total common shareholders’ equity divided by the number of diluted common shares outstanding including estimated amounts in respect of share issuancecommitments and adjusted for shares purchased under the normal course issuer bid and not yet cancelled, and estimated forfeitures in respect of unvested share awards under share-based payment plans.
(6) Net income (loss) and earnings (loss) per common share excluding significant items reflect tax-effected adjustments related to such items. See the Selected Financial Information Excluding Significant Items table on thenext page.
p.p.: percentage points
MANAGEMENT’S DISCUSSION AND ANALYSIS
CANACCORD GENUITY GROUP INC. SECOND QUARTER FISCAL 2016 11

SELECTED FINANCIAL INFORMATION EXCLUDING SIGNIFICANT ITEMS(1)
Three months ended September 30 Six months ended September 30
(C$ thousands, except per share and % amounts) 2015 2014Quarter-over-
quarter change 2015 2014YTD-over-YTD
change
Total revenue per IFRS $ 190,602 $ 236,271 (19.3)% $ 405,056 $ 481,827 (15.9)%
Total expenses per IFRS $ 189,103 $ 211,326 (10.5)% $ 391,110 $ 433,594 (9.8)%
Significant items recorded in Canaccord Genuity
Amortization of intangible assets 1,320 1,707 (22.7)% 2,730 3,448 (20.9)%
Restructuring costs — — — — — —
Significant items recorded in Canaccord Genuity Wealth
Management
Amortization of intangible assets 1,557 2,224 (30.0)% 3,024 4,464 (32.2)%
Restructuring costs — — — — 783 (100.0)%
Significant items recorded in Corporate and Other
Restructuring costs — — — — 1,600 (100.0)%
Total significant items 2,877 3,931 (26.8)% 5,754 10,295 (44.1)%
Total expenses excluding significant items 186,226 207,395 (10.2)% 385,356 423,299 (9.0)%
Net income before taxes − adjusted $ 4,376 $ 28,876 (84.8)% $ 19,700 $ 58,528 (66.3)%
Income taxes − adjusted 2,433 8,130 (70.1)% 4,438 13,765 (67.8)%
Net income − adjusted $ 1,943 $ 20,746 (90.6)% $ 15,262 $ 44,763 (65.9)%
(Loss) earnings per common share − basic, adjusted $ (0.01) $ 0.19 (105.3)% $ 0.10 $ 0.40 (75.0)%
(Loss) earnings per common share − diluted, adjusted $ (0.01) $ 0.17 (105.9)% $ 0.09 $ 0.37 (75.7)%
(1) Figures excluding significant items are non-IFRS measures. See Non-IFRS Measures on page 8.
Foreign exchange
Revenues and expenses from our foreign operations are initially recorded in their respective functional currencies and translated into Canadiandollars at exchange rates prevailing during the period. The pound sterling and the US dollar appreciated against the Canadian dollar byapproximately 12% and 20%, respectively, in Q2/16 when compared to Q2/15, and by approximately 8% and 17%, respectively, during thesix-month period ended September 30, 2015 when compared to the six-month period ended September 30, 2014. This appreciation contributedto certain increases in revenue and expense items in Canadian dollars when compared to the applicable prior periods and should be consideredwhen reviewing the following discussion in respect of our consolidated results as well as the discussion in respect of Canaccord Genuity andCanaccord Genuity Wealth Management UK & Europe.
Goodwill
During the quarter the Company performed an interim impairment test of goodwill and indefinite-lived intangible assets. In determining whetherto perform an impairment test, the Company considers factors such as its market capitalization, market conditions generally and overalleconomic conditions as well as market conditions in the key sectors in which the Company operates and the impact that such conditions areexpected to have on the Company’s operations.
Utilizing management’s preliminary estimates for revenue and operating performance, growth rates and other assumptions typically required inconnection with discounted cash flow models the Company determined that there was no impairment in the goodwill and indefinite-livedintangible assets associated with any of its business units. Notwithstanding this determination as of September 30, 2015, the continuinguncertainty in the economic environment may cause this determination to change. If the business climate remains uncertain and the Companyis unable to achieve its internal forecasts the Company may determine that there has been impairment and the Company may be required torecord a goodwill impairment charge in future periods. As further described in note 7 of the unaudited interim condensed consolidated financialstatements reasonably possible adverse changes in the key assumptions utilized for purposes of the interim impairment testing for CanaccordGenuity — Canada, UK & Europe, and the US and for Other Foreign Locations — Australia and Singapore may result in the estimated recoverableamount of some or all of these business units declining below the carrying value with the result that impairment charges may be required. Theamount of any impairment charge would affect some or all of the amounts recorded for goodwill and indefinite-lived tangible assets. Any suchimpairment charges would be determined after incorporating the effect or any changes in key assumptions including any consequential effects ofsuch changes on estimated operating income and on other factors.
MANAGEMENT’S DISCUSSION AND ANALYSIS
12 CANACCORD GENUITY GROUP INC. SECOND QUARTER FISCAL 2016
Revenue
Second quarter 2016 vs. second quarter 2015On a consolidated basis, revenue is generated through six activities: commissions and fees associated with agency trading and private clientwealth management activity, investment banking, advisory fees, principal trading, interest and other.
Revenue for the three months ended September 30, 2015 was $190.6 million, a decrease of 19% or $45.7 million compared to the sameperiod a year ago. The Canaccord Genuity segment experienced a decrease of $44.1 million in Q2/16 compared to the same quarter in the prioryear, mainly due to reduced investment banking and advisory activity. The Canaccord Genuity Wealth Management segment generated revenue of$60.2 million during the three months ended September 30, 2015, a decrease of $1.2 million over Q2/15, mostly due to lower commissionsand fees and investment banking revenue earned in our North American operations.
Commissions and fees revenue is primarily generated from private client trading activity and institutional sales and trading. Revenue generatedfrom commissions and fees increased by $2.9 million, to $89.2 million in Q2/16, compared to the same period a year ago. Commissions andfees revenue earned in connection with the Canaccord Genuity Wealth Management segment was $53.5 million, an increase of $1.4 million overQ2/15. The Canaccord Genuity segment experienced an increase of $1.6 million in commission and fees revenue compared to the same quarterin the prior year, mainly due to higher revenue earned in our US operations.
Investment banking revenue decreased by $34.8 million or 53% compared to the same period a year ago, to $31.5 million in Q2/16. The mostsignificant decline in investment banking revenue was in our Canadian capital markets operations, which decreased by $31.0 million comparedto Q2/15. In addition to reduced financing activity, completion of the Amaya Gaming transaction in Q2/15 was a significant contributor toinvestment banking revenue during that quarter and caused that quarter to be significantly higher relative to Q2/16. Our Other Foreign Locationsoperations also recorded a $3.3 million decrease in investment banking revenue compared to the same period last year as a result of loweractivity. The decline in investment banking revenue earned in Canada and Other Foreign Locations was offset by increases generated by our USand UK & Europe capital markets operations of $1.7 million and $0.7 million, respectively.
Advisory fees revenue was $43.9 million, a decrease of $11.8 million or 21% from the same quarter a year ago. The decline in advisory feeswas driven by decreases in both our Canadian and UK & Europe capital markets operations compared to the same period last year, mainly as aresult of decreased transaction volume as well as significant transactions completed during Q2/15, such as Amaya Gaming Group and B2GoldCorp., which caused that quarter to be higher relative to Q2/16. In our US capital markets operations, advisory fees revenue increased by$4.6 million compared to Q2/15 to $11.1 million in Q2/16 as a number of transactions were completed during the quarter compared to Q2/15.
Principal trading revenue was $17.6 million in Q2/16, representing a slight decrease of $0.1 million compared to Q2/15. The decrease waspredominantly in our UK & Europe capital markets operations, which experienced a decrease of $3.0 million compared to Q2/15, largely offsetby higher revenue earned in our US capital markets operations.
Interest revenue was $4.3 million for the three months ended September 30, 2015, representing a decrease of $1.6 million from Q2/15. Otherrevenue was $4.1 million for Q2/16, a slight decrease of $0.3 million compared to the same period a year ago.
Year-to-date fiscal 2016 vs. year-to-date fiscal 2015Revenue for the six months ended September 30, 2015 was $405.1 million, a decrease of 16% or $76.8 million compared to the same period ayear ago, mainly due to a $56.8 million decrease in investment banking revenue and a $22.9 million decrease in advisory fees revenue.
Commissions and fees revenue was $183.9 million, representing an increase of 2% compared to the six months ended September 30, 2014.
As a result of weakened market conditions, revenue generated from investment banking activities decreased by $56.8 million to $96.9 million,compared to $153.7 million in the same period a year ago. Investment banking revenue decreased across all geographies except for UK &Europe, which was relatively unchanged compared to the six months ended September 30, 2014.
Advisory fees revenue of $65.6 million represented a decrease of 26% or $22.9 million compared to the same period in the prior year. Thelargest decrease was in our Canadian capital markets operations, which experienced a decline of $21.6 million, mostly as a result of reducedcorporate activity and two substantial transactions completed during the six months ended September 30, 2014.
Revenue derived from principal trading was $40.2 million, an increase of $2.2 million compared to the same period last year, mainly due tohigher revenue earned by our international equities group in the US capital markets operations.
Interest revenue decreased by $2.8 million compared to the six months ended September 30, 2014. Other revenue increased by $0.6 million to$9.1 million during the six months ended September 30, 2015 as a result of higher foreign exchange gains recognized during the current period.
Expenses
Expenses for the three months ended September 30, 2015 were $189.1 million, a decrease of 11% or $22.2 million from Q2/15. For the sixmonths ended September 30, 2015, expenses were $391.1 million, a decrease of 10% or $42.5 million compared to the same period of theprior year.
MANAGEMENT’S DISCUSSION AND ANALYSIS
CANACCORD GENUITY GROUP INC. SECOND QUARTER FISCAL 2016 13

With the decrease in revenue during the quarter and the non-variable nature of certain infrastructure and overhead costs, total expenses asa percentage of revenue increased by 9.8 percentage points compared to Q2/15.
EXPENSES AS A PERCENTAGE OF REVENUE
Three months ended September 30 Six months ended September 30
2015 2014Quarter-over-
quarter change 2015 2014YTD-over-YTD
change
Incentive compensation 48.6% 50.5% (1.9) p.p. 49.2% 50.2% (1.0) p.p.
Salaries and benefits 11.8% 8.6% 3.2 p.p. 11.1% 8.9% 2.2 p.p.
Other overhead expenses(1) 38.8% 30.3% 8.5 p.p. 36.3% 30.4% 5.9 p.p.
Restructuring costs — — — — 0.5% (0.5) p.p.
Total 99.2% 89.4% 9.8 p.p. 96.6% 90.0% 6.6 p.p.
(1) Consists of trading costs, premises and equipment, communication and technology, interest, general and administrative, amortization and development costs.p.p.: percentage points
Compensation expense
Second quarter 2016 vs. second quarter 2015Incentive compensation expense was $92.7 million, a decrease of 22% compared to Q2/15 reflecting the 19% decrease in incentive-basedrevenue. Incentive compensation expense as a percentage of revenue was 48.6%, a decrease of 1.9 percentage points from the same periodlast year. Salaries and benefits expense increased by $2.2 million compared to Q2/15, to $22.5 million in Q2/16. The increase was largelyrelated to capitalized employment costs in Q2/15 incurred in connection with systems and software development prior to its implementation nowbeing treated as an operating expense in our UK & Europe wealth management operations. Total compensation expense (incentivecompensation plus salaries and benefits) as a percentage of consolidated revenue increased from 59.1% in Q2/15 to 60.4% in Q2/16.
Year-to-date fiscal 2016 vs. year-to-date fiscal 2015Incentive compensation expense was $199.2 million for the six months ended September 30, 2015, a decrease of 18% from the same period inthe prior year, reflecting the decrease of 16% in incentive-based revenue over that period. Incentive compensation as a percentage of totalrevenue was 49.2%, a decrease of 1.0 percentage point over the same period in the prior year, mostly due to lower profit levels and relatedprofit-based compensation.
Salaries and benefits expense of $45.1 million for the six months ended September 30, 2015 was $2.3 million or 5% higher than in the sameperiod a year ago, mainly as a result of capitalized employment costs in our UK & Europe wealth management operations, as discussed above.Total compensation expense (incentive compensation plus salaries and benefits) as a percentage of consolidated revenue was 60.3%, anincrease of 1.2 percentage points from 59.1% in the same period a year ago.
OTHER OVERHEAD EXPENSES
Three months ended September 30 Six months ended September 30
(C$ thousands, except % amounts) 2015 2014Quarter-over-
quarter change 2015 2014YTD-over-YTD
change
Trading costs $ 14,107 $ 12,775 10.4% $ 27,917 $ 25,409 9.9%
Premises and equipment 10,051 10,080 (0.3)% 19,937 20,113 (0.9)%
Communication and technology 14,267 12,901 10.6% 27,870 24,418 14.1%
Interest 2,292 2,977 (23.0)% 5,583 7,232 (22.8)%
General and administrative 22,794 21,836 4.4% 44,962 45,905 (2.1)%
Amortization(1) 6,453 7,475 (13.7)% 12,586 14,847 (15.2)%
Development costs 3,948 3,625 8.9% 8,000 8,760 (8.7)%
Total other overhead expenses $ 73,912 $ 71,669 3.1% $ 146,855 $ 146,684 0.1%
(1) Includes amortization of intangible assets. See the Selected Financial Information Excluding Significant Items table on page 12.
Second quarter 2016 vs. second quarter 2015Other overhead expenses were $73.9 million, or 3% higher in Q2/16 compared to Q2/15. As a percentage of revenue, other overhead expensesincreased by 8.5 percentage points compared to Q2/15 because of the decline in revenue and the non-variable nature of certain overheadexpense items. The overall increase in other overhead expenses was mainly driven by increases in general and administrative expense, tradingcosts and communication and technology expense, offset by decreases in interest and amortization expense.
General and administrative expense, which includes reserves, promotion and travel expense, office expense, professional fees and donations,was up $1.0 million, largely due to higher expenses associated with a regulatory settlement and promotion and travel expense in our US capitalmarkets operations, as well as costs associated with the start-up of our operations in Dubai.
Higher trading costs in our US capital markets operations was the primary reason for the $1.3 million increase in trading costs compared toQ2/15, largely due to higher costs related to the international equities group operations.
MANAGEMENT’S DISCUSSION AND ANALYSIS
14 CANACCORD GENUITY GROUP INC. SECOND QUARTER FISCAL 2016
Communication and technology expense increased by $1.4 million or 11% from Q2/15 to $14.3 million for the second quarter of fiscal 2016,primarily due to increases in our UK & Europe and US operations.
Amortization expense decreased by $1.0 million or 14% from Q2/15 mainly due to a decrease in amortization of intangible assets in our UK &Europe wealth management and Canadian capital markets operations. Interest expense decreased by $0.7 million, mostly as a result ofdecreases in our Canadian capital markets operations.
Year-to-date fiscal 2016 vs. year-to-date fiscal 2015Other overhead expenses for the six months ended September 30, 2015 increased slightly by $0.2 million, to $146.9 million, from the sameperiod a year ago. The increases in trading costs and communication and technology expense were offset by decreases in general andadministrative expense, amortization expense, interest expense and development costs.
Trading costs increased by $2.5 million or 10% compared to the same period in the prior year due to higher costs in our US capital marketoperations in connection with the international equities group trading activities.
Communication and technology expense increased by $3.5 million for the six months ended September 30, 2015, to $27.9 million, largely as aresult of an increase of $1.0 million in the US operations and an increase of $2.1 million in our UK and Europe capital markets and wealthmanagement operations.
General and administrative expense decreased by $0.9 million for the six months ended September 30, 2015 compared to the same period lastyear. As a result of reduced activity, general and administrative expense decreased by $3.1 million in our Canadian operating segments. Thisdecline was offset by an increase of $1.9 million in our US capital markets operations, mostly as a result of higher legal and promotion andtravel expense as well as increased regulatory settlement expenses.
Amortization expense decreased by $2.3 million or 15% from the prior year primarily due to a decrease in amortization of intangible assets in ourUK & European wealth management and Canadian capital markets operations.
Development costs decreased by $0.8 million during the period compared to the six months ended September 30, 2014, mostly as a result oflower hiring incentive costs in our US capital markets operations. Interest expense decreased by $1.6 million during the period, primarily as aresult of lower expenses in our US and Canadian capital markets operations.
During the six months ended September 30, 2014, restructuring costs of $2.4 million were incurred in our Canaccord Genuity WealthManagement UK & Europe and Corporate and Other segments in relation to the closure of our office in Geneva and certain executive changes inCanada. There were no restructuring costs incurred during the six months ended September 30, 2015.
Net (loss) income
Second quarter 2016 vs. second quarter 2015Net loss for Q2/16 was $0.4 million compared to net income of $17.6 million in the same period a year ago. Loss per common share was$0.03 in Q2/16 compared to EPS of $0.14 in Q2/15. The decline in net income was attributable to lower revenue leading to lower profitabilityand losses across all geographies except for our UK & Europe wealth management operations. The lower revenue was largely a result of reducedactivity by corporate issuers which led to a reduction in investment banking and advisory fees.
Excluding significant items(1), net income for Q2/16 was $1.9 million or a net loss attributable to common shareholders of $0.9 millioncompared to net income of $20.7 million or net income of $17.1 million attributable to common shareholders in Q2/15. Loss per commonshare, excluding significant items(1), was $0.01 in Q2/16 compared to diluted EPS, excluding significant items(1), of $0.17 in Q2/15.
The effective tax rate for Q2/16 was 128.9% compared to an effective tax rate of 29.4% in the same quarter last year. The increase in theeffective tax rate was mainly due to higher non-deductible items affecting the determination of taxable income and the non-recognition of certaindeferred tax assets in our foreign operations.
Year-to-date fiscal 2016 vs. year-to-date fiscal 2015Net income for the six months ended September 30, 2015 was $10.5 million compared to $36.5 million for the same period a year ago, adecrease of $26.0 million due to the reasons discussed above. Diluted EPS was $0.04 compared to $0.29 a year ago. Excluding significantitems(1), net income was $15.3 million and diluted EPS was $0.09, compared to diluted EPS of $0.37 in the same period a year ago.
Income taxes were $3.4 million for the six months ended September 30, 2015, reflecting a year-to-date effective tax rate of 24.5%, compared toincome taxes of $11.8 million and an effective tax rate of 24.4% for the same period last year.
(1) Figures excluding significant items are non-IFRS measures. See Non-IFRS Measures on page 8.
MANAGEMENT’S DISCUSSION AND ANALYSIS
CANACCORD GENUITY GROUP INC. SECOND QUARTER FISCAL 2016 15
Results of Operations by Business Segment
CANACCORD GENUITY(1)(2)
Three months ended September 30 Six months ended September 30
(C$ thousands, except number of employees and % amounts) 2015 2014Quarter-over-
quarter change 2015 2014YTD-over-YTD
change
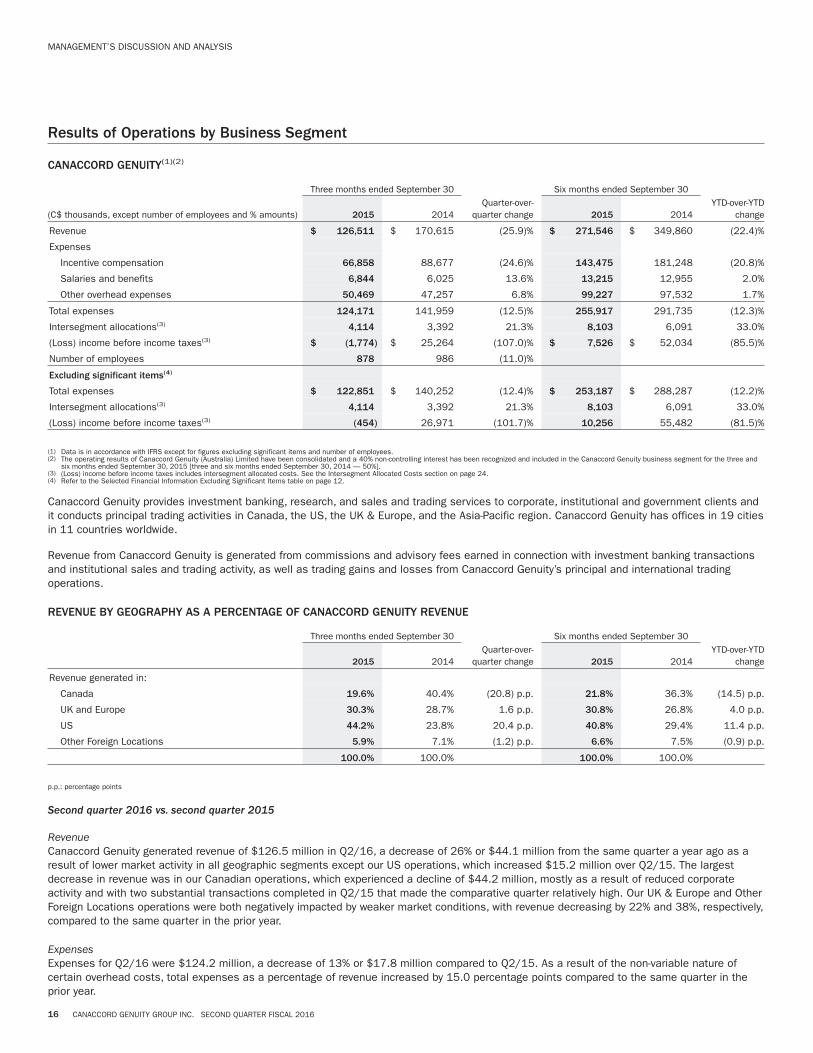
Revenue $ 126,511 $ 170,615 (25.9)% $ 271,546 $ 349,860 (22.4)%
Expenses
Incentive compensation 66,858 88,677 (24.6)% 143,475 181,248 (20.8)%
Salaries and benefits 6,844 6,025 13.6% 13,215 12,955 2.0%
Other overhead expenses 50,469 47,257 6.8% 99,227 97,532 1.7%
Total expenses 124,171 141,959 (12.5)% 255,917 291,735 (12.3)%
Intersegment allocations(3) 4,114 3,392 21.3% 8,103 6,091 33.0%
(Loss) income before income taxes(3) $ (1,774) $ 25,264 (107.0)% $ 7,526 $ 52,034 (85.5)%
Number of employees 878 986 (11.0)%
Excluding significant items(4)
Total expenses $ 122,851 $ 140,252 (12.4)% $ 253,187 $ 288,287 (12.2)%
Intersegment allocations(3) 4,114 3,392 21.3% 8,103 6,091 33.0%
(Loss) income before income taxes(3) (454) 26,971 (101.7)% 10,256 55,482 (81.5)%
(1) Data is in accordance with IFRS except for figures excluding significant items and number of employees.(2) The operating results of Canaccord Genuity (Australia) Limited have been consolidated and a 40% non-controlling interest has been recognized and included in the Canaccord Genuity business segment for the three and
six months ended September 30, 2015 [three and six months ended September 30, 2014 — 50%].(3) (Loss) income before income taxes includes intersegment allocated costs. See the Intersegment Allocated Costs section on page 24.(4) Refer to the Selected Financial Information Excluding Significant Items table on page 12.
Canaccord Genuity provides investment banking, research, and sales and trading services to corporate, institutional and government clients andit conducts principal trading activities in Canada, the US, the UK & Europe, and the Asia-Pacific region. Canaccord Genuity has offices in 19 citiesin 11 countries worldwide.
Revenue from Canaccord Genuity is generated from commissions and advisory fees earned in connection with investment banking transactionsand institutional sales and trading activity, as well as trading gains and losses from Canaccord Genuity’s principal and international tradingoperations.
REVENUE BY GEOGRAPHY AS A PERCENTAGE OF CANACCORD GENUITY REVENUE
Three months ended September 30 Six months ended September 30
2015 2014Quarter-over-
quarter change 2015 2014YTD-over-YTD
change
Revenue generated in:
Canada 19.6% 40.4% (20.8) p.p. 21.8% 36.3% (14.5) p.p.
UK and Europe 30.3% 28.7% 1.6 p.p. 30.8% 26.8% 4.0 p.p.
US 44.2% 23.8% 20.4 p.p. 40.8% 29.4% 11.4 p.p.
Other Foreign Locations 5.9% 7.1% (1.2) p.p. 6.6% 7.5% (0.9) p.p.
100.0% 100.0% 100.0% 100.0%
p.p.: percentage points
Second quarter 2016 vs. second quarter 2015
RevenueCanaccord Genuity generated revenue of $126.5 million in Q2/16, a decrease of 26% or $44.1 million from the same quarter a year ago as aresult of lower market activity in all geographic segments except our US operations, which increased $15.2 million over Q2/15. The largestdecrease in revenue was in our Canadian operations, which experienced a decline of $44.2 million, mostly as a result of reduced corporateactivity and with two substantial transactions completed in Q2/15 that made the comparative quarter relatively high. Our UK & Europe and OtherForeign Locations operations were both negatively impacted by weaker market conditions, with revenue decreasing by 22% and 38%, respectively,compared to the same quarter in the prior year.
ExpensesExpenses for Q2/16 were $124.2 million, a decrease of 13% or $17.8 million compared to Q2/15. As a result of the non-variable nature ofcertain overhead costs, total expenses as a percentage of revenue increased by 15.0 percentage points compared to the same quarter in theprior year.
MANAGEMENT’S DISCUSSION AND ANALYSIS
16 CANACCORD GENUITY GROUP INC. SECOND QUARTER FISCAL 2016

Incentive compensation and salaries and benefitsIncentive compensation expense for Q2/16 decreased by $21.8 million or 25% compared to Q2/15 as a result of the decline in incentive-basedrevenue. Incentive compensation expense as a percentage of revenue was 52.8%, an increase of 0.9 percentage points from Q2/15. Totalcompensation expense as a percentage of revenue was 58.3%, 2.8 percentage points higher than in Q2/15.
In Canada and the UK & Europe, total compensation as a percentage of revenue increased by 2.6 percentage points and 2.2 percentage pointscompared to Q2/15, respectively, mainly as a result of the amortization of stock awards made in prior periods which do not vary with currentperiod revenue. Our US operations experienced a decrease of 3.7 percentage points in its total compensation ratio as a result of an increase inrevenue as well as reduced fixed income compensation as a result of the restructuring of the fixed income group during fiscal 2015. Totalcompensation expense as a percentage of revenue in our Other Foreign Locations segment was 80.6%, which increased 17.0 percentage pointsfrom the same quarter last year. The increase was largely due to the reduced revenue in our Australian operations, as well as the start-up of ouroperations in Dubai.
CANACCORD GENUITY TOTAL COMPENSATION EXPENSE AS A PERCENTAGE OF REVENUE BY GEOGRAPHY
Three months ended September 30 Six months ended September 30
2015 2014Quarter-over-
quarter change 2015 2014YTD-over-YTD
change
Canada 51.7% 49.1% 2.6 p.p. 49.7% 50.6% (0.9) p.p.
UK and Europe 61.2% 59.0% 2.2 p.p. 63.4% 59.3% 4.1 p.p.
US 56.1% 59.8% (3.7) p.p. 55.2% 55.6% (0.4) p.p.
Other Foreign Locations 80.6% 63.6% 17.0 p.p. 72.8% 65.6% 7.2 p.p.
Canaccord Genuity (total) 58.3% 55.5% 2.8 p.p. 57.7% 55.5% 2.2 p.p.
p.p.: percentage points
Other overhead expensesTotal other overhead expenses excluding significant items(1) for Q2/16 were $49.1 million, an increase of 8% compared to Q2/15. The mostsignificant fluctuations in other overhead expenses included a $2.4 million increase in general and administrative expense, a $1.0 millionincrease in communication and technology expense, and a $0.5 million increase in trading costs, offset by a $0.6 million decrease in interestexpense and a $0.4 million decrease in amortization expense.
General and administrative expense in Q2/16 was $15.2 million, an increase of $2.4 million or 19% over Q2/15, primarily due to an increase inexpenses associated with a regulatory settlement and promotion and travel expense in our US capital market operations as a result of increasedactivity in the quarter.
Communication and technology expense increased by $1.0 million or 12% to $9.7 million in Q2/16, mostly as a result of higher costs in our USand UK & Europe operations.
Trading costs in our US operations increased by $1.7 million as a result of higher execution and settlement charges in connection with ourinternational equities group trading activities. Offsetting this increase was a reduction of $1.2 million in trading costs in our Canadianoperations, which resulted from a change in the allocation of certain trading, clearing and settlement charges from our Corporate and Othersegment.
Interest expense decreased by $0.6 million or 25% in Q2/16 to $1.9 million mainly due to a decrease in our Canadian capital marketsoperations.
Amortization expense decreased by $0.4 million compared to Q2/15, mainly as a result of lower amortization expense related to intangibleassets in our Canadian operations.
(Loss) Income before income taxesLoss before income taxes, including allocated overhead expenses, was $1.8 million in Q2/16 compared to net income of $25.3 million in thesame quarter a year ago. Excluding significant items(1), income before income taxes, including allocated overhead expenses, decreased from$27.0 million in Q2/15 to a loss of $0.5 million in Q2/16. The decrease in income before income taxes in Q2/16 was mainly attributable tolower revenue generated across most of our geographies.
(1) Figures excluding significant items are non-IFRS measures. See Non-IFRS Measures on page 8.
MANAGEMENT’S DISCUSSION AND ANALYSIS
CANACCORD GENUITY GROUP INC. SECOND QUARTER FISCAL 2016 17
Year-to-date fiscal 2016 vs. year-to-date fiscal 2015
RevenueRevenue for Canaccord Genuity in the six months ended September 30, 2015 was $271.5 million, a decrease of $78.3 million from the sameperiod last year. Revenue decreased across most geographies, most notably in Canada, where revenue decreased by 54% or $68.0 millioncompared to the same period last year. Revenue in our UK and Europe and Other Foreign Location operations also decreased by 11% and 31%,respectively, due to weakened market conditions and decreased corporate activity in our focus sectors in these geographies. Our US operationsgenerated revenue of $110.7 million, which represents an 8% increase from the same period in fiscal 2015.
ExpensesExpenses for the six months ended September 30, 2015 were $255.9 million, down 12% or $35.8 million from the same period last year. Totalexpenses as a percentage of revenue increased by 10.8 percentage points compared to the first six months of fiscal 2015.
Incentive compensation and salaries and benefitsIncentive compensation expense as a percentage of revenue increased by 1.0 percentage point to 52.8% for the six months endedSeptember 30, 2015. Total compensation as a percentage of revenue increased from 55.5% for the six months ended September 30, 2014 to57.7% in the current period, mainly due to the non-variable nature of certain fixed compensation costs such as salaries and stock-basedcompensation.
Other overhead expensesThe Company incurred lower amortization expense, interest expense and development costs compared to the six months ended September 30,2014, offset by increases in trading costs, communication and technology expense, and general and administrative expense.
Interest expense decreased by $1.5 million compared to the same period in the prior year as a result of a decrease in our Canadian andUS operations.
Amortization expense decreased by $1.0 million to $7.0 million in Q2/16 compared to the same period in the prior year due to a decrease inamortization of intangible assets in our Canadian operations.
Development costs decreased by $0.4 million from the prior year period due to a $1.2 million decrease in our US operations as a result of lowerhiring incentive costs, offset by a $0.7 million increase in our UK and Europe operations due to higher recruitment costs.
Communication and technology expense increased by $2.6 million or 16% compared to the same period of the prior year, most notably in ourUS and UK & Europe operations.
General and administrative expense increased by $1.0 million compared to the six months ended September 30, 2014, mainly due to higherregulatory settlement costs in the US. The main driver for the increase of $0.6 million in trading costs was the higher execution and settlementcharges in connection with the international equities group trading activities in our US operations, which was offset by a reduction in tradingcosts in our Canadian operations resulting from the change in allocation from our Corporate and Other segment as previously discussed.
Income before income taxesIncome before income taxes for the six months ended September 30, 2015 was $7.5 million, a decrease of $44.5 million from $52.0 million inthe same period a year ago. The decrease in income before income taxes was attributable to reduced market activity, which led to lower revenueacross all the geographic regions except for the US. Excluding significant items(1), income before income taxes for the six months endedSeptember 30, 2015 was $10.3 million, a decrease of $45.2 million from the same period a year ago.
CANACCORD GENUITY WEALTH MANAGEMENT
Revenue from Canaccord Genuity Wealth Management is generated through traditional commission-based brokerage services, the sale offee-related products and services, margin interest, and commissions and fees earned from investment banking and venture capital transactionsby private clients.
(1) Figures excluding significant items are non-IFRS measures. See Non-IFRS Measures on page 8.
MANAGEMENT’S DISCUSSION AND ANALYSIS
18 CANACCORD GENUITY GROUP INC. SECOND QUARTER FISCAL 2016

CANACCORD GENUITY WEALTH MANAGEMENT NORTH AMERICA(1)
Three months ended September 30 Six months ended September 30(C$ thousands, except AUM and AUA (in C$ millions),number of employees, Advisory Teams and % amounts) 2015 2014
Quarter-over-quarter change 2015 2014
YTD-over-YTDchange
Revenue $ 26,155 $ 31,637 (17.3)% $ 57,071 $ 63,993 (10.8)%
Expenses
Incentive compensation 12,327 15,709 (21.5)% 28,135 32,466 (13.3)%
Salaries and benefits 2,738 2,887 (5.2)% 5,660 6,150 (8.0)%
Other overhead expenses 7,621 9,936 (23.3)% 15,675 20,267 (22.7)%
Total expenses 22,686 28,532 (20.5)% 49,470 58,883 (16.0)%
Intersegment allocations(2) 5,137 4,870 5.5% 9,659 9,147 5.6%
Loss before income taxes(2) $ (1,668) $ (1,765) 5.5% $ (2,058) $ (4,037) 49.0%
AUM − Canada (discretionary)(3) 1,360 1,391 (2.2)%
AUA − Canada(4) 9,481 10,757 (11.9)%
Number of Advisory Teams − Canada 141 162 (13.0)%
Number of employees 379 412 (8.0)%
Excluding significant items(5)
Total expenses $ 22,686 $ 28,532 (20.5)% $ 49,470 $ 58,883 (16.0)%
Intersegment allocations(2) 5,137 4,870 5.5% 9,659 9,147 5.6%
Loss before income taxes(2) (1,668) (1,765) 5.5% (2,058) (4,037) 49.0%
(1) Data is in accordance with IFRS except for AUM, AUA, number of Advisory Teams and number of employees. See Non-IFRS Measures on page 8.(2) Loss before income taxes includes intersegment allocations. See the Intersegment Allocated Costs section on page 24.(3) AUM in Canada are assets managed on a discretionary basis under our programs generally described as or known as the Complete Canaccord Investment Counselling Program and the Complete Canaccord Private
Investment Management Program.(4) AUA in Canada is the market value of client assets administered by the Company, from which the Company earns commissions and fees and includes AUM.(5) Refer to the Selected Financial Information Excluding Significant Items table on page 12.
Second quarter 2016 vs. second quarter 2015Revenue from Canaccord Genuity Wealth Management North America was $26.2 million, a decrease of $5.5 million or 17% compared to thethree months ended September 30, 2014, as a result of weaker market conditions.
AUA in Canada decreased by 11.9% to $9.5 billion at September 30, 2015 compared to $10.8 billion at September 30, 2014, reflecting lowermarket values at the end of Q2/16. AUM in Canada also decreased by 2.2% compared to Q2/15. There were 141 Advisory Teams in Canada, adecrease of 21 from a year ago. Fee-related revenue in our North American operations as a percentage of total revenue increased by11.0 percentage points compared to Q2/15 and accounted for 45.3% of the wealth management revenue in Canada during the second quarterof fiscal 2016.
As a result of our cost reduction initiatives, expenses for Q2/16 decreased by 20.5% or $5.8 million from Q2/15, to $22.7 million excludingintersegment allocations. Total expenses as a percentage of revenue decreased by 3.5 percentage points compared to Q2/15.
Incentive compensation expense decreased by $3.4 million compared to Q2/15, consistent with the decline in incentive-based revenue. Totalcompensation expense as a percentage of revenue decreased by 1.2 percentage points compared to Q2/15 as a result of lower salaries andbenefits expense.
Non-compensation expense decreased by $2.3 million compared to Q2/15, mainly due to a $0.8 million decrease in general and administrativeexpense, a $0.4 million decrease in trading costs, a $0.4 million decrease in premises and equipment expense and a $0.4 million decrease inamortization expense. The reduction in general and administrative and premises and equipment expenses resulted from the continued focus oncost reductions by our Canadian operations. Trading costs decreased by $0.4 million as a result of a change in the allocation of certain trading,clearing and settlement charges from our Corporate and Other segment. In addition, development costs decreased by $0.2 million compared toQ2/15 as a result of a reduction in hiring incentive costs.
Despite a decrease in revenue of $5.5 million, loss before income taxes of $1.7 million decreased slightly from Q2/15 reflecting the positiveresults of continued cost reduction efforts undertaken by this operation.
Year-to-date fiscal 2016 vs. year-to-date fiscal 2015
Revenue from Canaccord Genuity Wealth Management North America was $57.1 million during the six months ended September 30, 2015, adecrease of $6.9 million from the same period in the prior year.
Expenses for the six months ended September 30, 2015 were $49.5 million, a decrease of $9.4 million or 16% from the same period in theprior year as a result of our cost reduction initiatives. Total expenses as a percentage of revenue decreased by 5.3 percentage points comparedto the same period last year.
MANAGEMENT’S DISCUSSION AND ANALYSIS
CANACCORD GENUITY GROUP INC. SECOND QUARTER FISCAL 2016 19

Incentive compensation expense decreased by $4.3 million compared to the first six months of fiscal 2015 as a result of lower incentive-basedrevenue. Total compensation as a percentage of revenue decreased by 1.1 percentage points compared to the same period last year due tolower salaries and benefits expense.
Non-compensation expense decreased by 22.7% compared to the same period in the prior year, mainly due to a $1.6 million decrease in generaland administrative expense, a $0.8 million decrease in premises and equipment expense, and a $0.5 million decrease in development costs. Asdiscussed above, the North American wealth management operations have continued to focus on cost reductions. Trading costs also decreasedby $1.0 million as a result of a change in the allocation of certain trading, clearing and settlement charges from our Corporate and Othersegment.
Loss before income taxes for the six months ended September 30, 2015 was $2.1 million, compared to a loss before income taxes of$4.0 million for the same period a year ago as a result of the operations’ efforts to continuously monitor costs and implement cost reductioninitiatives as previously discussed.
CANACCORD GENUITY WEALTH MANAGEMENT UK & EUROPE(1)
Three months ended September 30 Six months ended September 30
(C$ thousands, except AUM (in C$ millions), number of employees,investment professionals and fund managers, and % amounts) 2015 2014
Quarter-over-quarterchange 2015 2014
YTD-over-YTDchange
Revenue $ 34,039 $ 29,786 14.3% $ 68,406 $ 59,914 14.2%
Expenses
Incentive compensation 11,935 10,671 11.8% 24,301 21,486 13.1%
Salaries and benefits 6,023 4,567 31.9% 11,565 9,168 26.1%
Other overhead expenses 11,030 11,020 0.9% 21,949 21,767 0.8%
Restructuring costs — — — — 783 (100.0)%
Total expenses 28,988 26,258 10.4% 57,815 53,204 8.7%
Intersegment allocations(2) 634 1,105 (42.6)% 1,231 2,220 (44.5)%
Income before income taxes(2) $ 4,417 $ 2,423 82.3% $ 9,360 $ 4,490 108.5%
AUM − UK and Europe(3) 22,948 20,420 12.4%
Number of investment professionals and fund
managers − UK and Europe 114 113 0.9%
Number of employees 313 305 2.6%
Excluding significant items(4)
Total expenses $ 27,431 $ 24,034 14.1% $ 54,791 $ 47,957 14.3%
Intersegment allocations(2) 634 1,105 (42.6)% 1,231 2,220 (44.5)%
Income before income taxes(2) 5,974 4,647 28.6% 12,384 9,737 27.2%
(1) Data is in accordance with IFRS except for AUM, number of investment professionals and fund managers and number of employees. See Non-IFRS Measures on page 8.(2) Income before income taxes includes intersegment allocations. See the Intersegment Allocated Costs section on page 24.(3) AUM in the UK & Europe is the market value of client assets managed and administered by the Company, from which the Company earns commissions and fees. This measure includes both discretionary and
non-discretionary accounts.(4) Refer to the Selected Financial Information Excluding Significant Items table on page 12.
Second quarter 2016 vs. second quarter 2015Revenue generated by our Canaccord Genuity Wealth Management UK & Europe operations is largely produced through fee-related accounts andportfolio management activities and, as such, is less sensitive to changes in market conditions. Revenue for Q2/16 was $34.0 million, anincrease of 14.3% compared to Q2/15, largely as a result of higher fee-related revenue earned from an increase in the size and market value ofmanaged accounts. AUM in the UK & Europe as of September 30, 2015 was $22.9 billion, an increase of 12.4% compared to $20.4 billion as ofSeptember 30, 2014. The fee-related revenue in our UK & European wealth management operations accounted for 70.0% of total revenue in thisgeography in Q2/16. As discussed above, this business has a higher proportion of fee-related revenue and managed accounts compared to ourCanadian wealth management business.
Incentive compensation expense was $11.9 million, a $1.3 million increase from $10.7 million in Q2/15 as a result of an increase inincentive-based revenue. Salaries and benefits expense increased by $1.5 million compared to Q2/15 to $6.0 million in Q2/16. The increasewas mostly related to capitalized employment costs in Q2/15 incurred in connection with systems and software development prior to itsimplementation now being treated as an operating expense. Total compensation expense (incentive compensation plus salaries and benefits) asa percentage of revenue increased by 1.6 percentage points from 51.2% in Q2/15 to 52.8% in Q2/16.
Other overhead expenses for the three months ended September 30, 2015 remained relatively consistent with Q2/15.
MANAGEMENT’S DISCUSSION AND ANALYSIS
20 CANACCORD GENUITY GROUP INC. SECOND QUARTER FISCAL 2016

Income before income taxes was $4.4 million compared to $2.4 million in the same period a year ago as a result of higher revenue recognizedduring the current period. Excluding significant items(1), which include amortization of intangible assets, net income before income taxes was$6.0 million, an increase of $1.3 million compared to net income before income taxes of $4.6 million in Q2/15.
Year-to-date fiscal 2016 vs. year-to-date fiscal 2015Revenue from Canaccord Genuity Wealth Management UK and Europe was $68.4 million for the six months ended September 30, 2015, anincrease of $8.5 million or 14.2% from the same period in the prior year.
Expenses for the six months ended September 30, 2015 were $57.8 million, an increase of $4.6 million or 8.7% from the same period in theprior year.
Total compensation expense (incentive compensation plus salaries and benefits) as a percentage of revenue increased by 1.3 percentage pointsto 52.4% for the six months ended September 30, 2015. As discussed above, the increase in total compensation expense was mainly due tocapitalized employment costs in Q2/15 now treated as an operating expense in the current period.
Communication and technology expense increased by $0.8 million compared to the same period last year, mainly to support the growth in thisregion. Offsetting the increase in communication and technology expense were decreases in premises and equipment expense and general andadministrative expense.
During the six months ended September 30, 2014, the Company incurred restructuring costs of $0.8 million in connection with the closure ofour office in Geneva. No restructuring charges were incurred during the six months ended September 30, 2015.
Income before income taxes was $9.4 million compared to $4.5 million in the same period a year ago mainly as a result of an increase inrevenue during the current period. Excluding significant items(1), net income before income taxes was $12.4 million, an increase of $2.6 millioncompared to the same period of the prior year.
CORPORATE AND OTHER(1)
Three months ended September 30 Six months ended September 30
(C$ thousands, except number of employees and % amounts) 2015 2014Quarter-over-
quarter change 2015 2014YTD-over-YTD
change
Revenue $ 3,897 $ 4,233 (7.9)% $ 8,033 $ 8,060 (0.3)%
Expenses
Incentive compensation 1,561 4,332 (64.0)% 3,270 6,526 (49.9)%
Salaries and benefits 6,905 6,789 1.7% 14,634 14,528 0.7%
Other overhead expenses 4,792 3,456 38.7% 10,004 7,118 40.5%
Restructuring costs — — — — 1,600 (100.0)%
Total expenses 13,258 14,577 (9.0)% 27,908 29,772 (6.3)%
Intersegment allocations(2) (9,885) (9,367) (5.5)% (18,993) (17,458) (8.8)%
Income (loss) before income taxes(2) $ 524 $ (977) 153.6% $ (882) $ (4,254) 79.3%
Number of employees 317 315 0.6%
Excluding significant items(3)
Total expenses $ 13,258 $ 14,577 (9.0)% $ 27,908 $ 28,172 (0.9)%
Intersegment allocations(2) (9,885) (9,367) (5.5)% (18,993) (17,458) (8.8)%
Income (loss) before income taxes(2) 524 (977) 153.6% (882) (2,654) 66.8%
(1) Data is in accordance with IFRS except for figures excluding significant items and number of employees. See Non-IFRS Measures on page 8.(2) Income (loss) before income taxes includes intersegment allocations. See the Intersegment Allocated Costs section on page 24.(3) Refer to the Selected Financial Information Excluding Significant Items table on page 12.
This segment, described as Corporate and Other, includes revenues and expenses associated with providing correspondent brokerage services,bank and other interest, foreign exchange gains and losses, and expenses not specifically allocable to either the Canaccord Genuity orCanaccord Genuity Wealth Management divisions. Also included in this segment are the Company’s operations and support services, whichare responsible for front- and back-office information technology systems, compliance and risk management, operations, finance, and alladministrative functions.
(1) Figures excluding significant items are non-IFRS measures. See Non-IFRS Measures on page 8.
MANAGEMENT’S DISCUSSION AND ANALYSIS
CANACCORD GENUITY GROUP INC. SECOND QUARTER FISCAL 2016 21
Second quarter 2016 vs. second quarter 2015Revenue in the Corporate and Other segment for the three months ended September 30, 2015 was $3.9 million, a decrease of 8% or$0.3 million from the same quarter a year ago.
Expenses for Q2/16 decreased by $1.3 million or 9.0%, to $13.3 million compared to the three months ended September 30, 2014. Incentivecompensation expense decreased by $2.8 million compared to Q2/15 as a result of reduced group profitability. Trading costs increased by$1.0 million compared to Q2/15 due to a change in the allocation of certain trading, clearing and settlement charges to the Canaccord Genuityand Canaccord Genuity Wealth Management segments, thus resulting in a lower trading cost recovery in Corporate and Other.
Overall, income before income taxes was $0.5 million compared to a loss before income taxes of $1.0 million in the same period a year ago.
Year-to-date fiscal 2016 vs. year-to-date fiscal 2015Revenue was $8.0 million for the six months ended September 30, 2015, unchanged from the same period in the prior year.
Expenses for the six months ended September 30, 2015 were $27.9 million, a decrease of $1.9 million from the same period last year. Theoverall decrease in expenses was mainly attributable to a $3.3 million decrease in incentive compensation expense resulting from lower groupprofitability as well as lower share based incentive compensation expense. As discussed above, there was a change in the allocation of certaintrading, clearing and settlement charges to the Canaccord Genuity and Canaccord Genuity Wealth Management segments, resulting in anincrease of $2.4 million of trading costs compared to the six months ended September 30, 2014.
The Company recorded restructuring costs of $1.6 million in connection with certain executive changes in Canada during the six months endedSeptember 30, 2014. No restructuring charges were incurred during the six months ended September 30, 2015.
Overall, loss before income taxes, after intersegment allocations, was $0.9 million in the first half of fiscal 2016 compared to a loss beforeincome taxes of $4.3 million in the same period a year ago. Excluding significant items(1), loss before income taxes was $0.9 million in thesix months ended September 30, 2015 compared to a loss before income taxes of $2.7 million in the same period last year.
(1) Figures excluding significant items are non-IFRS measures. See Non-IFRS Measures on page 8.
MANAGEMENT’S DISCUSSION AND ANALYSIS
22 CANACCORD GENUITY GROUP INC. SECOND QUARTER FISCAL 2016
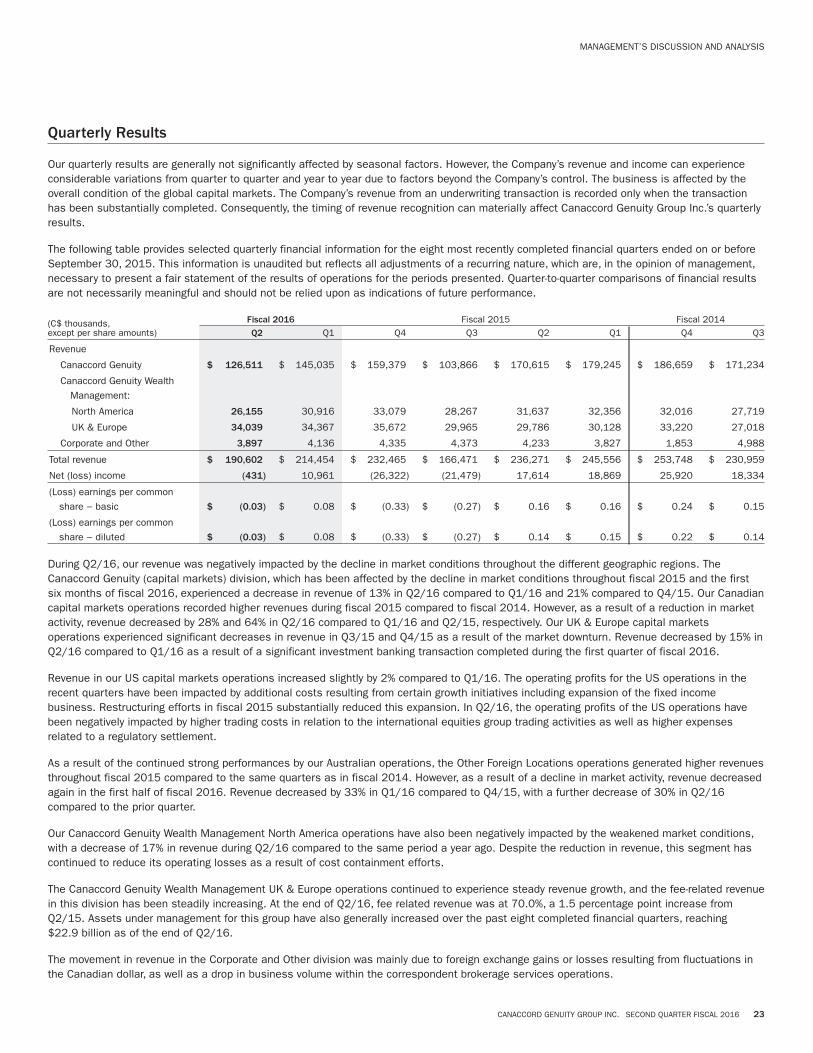
Quarterly Results
Our quarterly results are generally not significantly affected by seasonal factors. However, the Company’s revenue and income can experienceconsiderable variations from quarter to quarter and year to year due to factors beyond the Company’s control. The business is affected by theoverall condition of the global capital markets. The Company’s revenue from an underwriting transaction is recorded only when the transactionhas been substantially completed. Consequently, the timing of revenue recognition can materially affect Canaccord Genuity Group Inc.’s quarterlyresults.
The following table provides selected quarterly financial information for the eight most recently completed financial quarters ended on or beforeSeptember 30, 2015. This information is unaudited but reflects all adjustments of a recurring nature, which are, in the opinion of management,necessary to present a fair statement of the results of operations for the periods presented. Quarter-to-quarter comparisons of financial resultsare not necessarily meaningful and should not be relied upon as indications of future performance.
(C$ thousands,except per share amounts)
Fiscal 2016 Fiscal 2015 Fiscal 2014Q2 Q1 Q4 Q3 Q2 Q1 Q4 Q3
Revenue
Canaccord Genuity $ 126,511 $ 145,035 $ 159,379 $ 103,866 $ 170,615 $ 179,245 $ 186,659 $ 171,234
Canaccord Genuity Wealth
Management:
North America 26,155 30,916 33,079 28,267 31,637 32,356 32,016 27,719
UK & Europe 34,039 34,367 35,672 29,965 29,786 30,128 33,220 27,018
Corporate and Other 3,897 4,136 4,335 4,373 4,233 3,827 1,853 4,988
Total revenue $ 190,602 $ 214,454 $ 232,465 $ 166,471 $ 236,271 $ 245,556 $ 253,748 $ 230,959
Net (loss) income (431) 10,961 (26,322) (21,479) 17,614 18,869 25,920 18,334
(Loss) earnings per common
share − basic $ (0.03) $ 0.08 $ (0.33) $ (0.27) $ 0.16 $ 0.16 $ 0.24 $ 0.15
(Loss) earnings per common
share − diluted $ (0.03) $ 0.08 $ (0.33) $ (0.27) $ 0.14 $ 0.15 $ 0.22 $ 0.14
During Q2/16, our revenue was negatively impacted by the decline in market conditions throughout the different geographic regions. TheCanaccord Genuity (capital markets) division, which has been affected by the decline in market conditions throughout fiscal 2015 and the firstsix months of fiscal 2016, experienced a decrease in revenue of 13% in Q2/16 compared to Q1/16 and 21% compared to Q4/15. Our Canadiancapital markets operations recorded higher revenues during fiscal 2015 compared to fiscal 2014. However, as a result of a reduction in marketactivity, revenue decreased by 28% and 64% in Q2/16 compared to Q1/16 and Q2/15, respectively. Our UK & Europe capital marketsoperations experienced significant decreases in revenue in Q3/15 and Q4/15 as a result of the market downturn. Revenue decreased by 15% inQ2/16 compared to Q1/16 as a result of a significant investment banking transaction completed during the first quarter of fiscal 2016.
Revenue in our US capital markets operations increased slightly by 2% compared to Q1/16. The operating profits for the US operations in therecent quarters have been impacted by additional costs resulting from certain growth initiatives including expansion of the fixed incomebusiness. Restructuring efforts in fiscal 2015 substantially reduced this expansion. In Q2/16, the operating profits of the US operations havebeen negatively impacted by higher trading costs in relation to the international equities group trading activities as well as higher expensesrelated to a regulatory settlement.
As a result of the continued strong performances by our Australian operations, the Other Foreign Locations operations generated higher revenuesthroughout fiscal 2015 compared to the same quarters as in fiscal 2014. However, as a result of a decline in market activity, revenue decreasedagain in the first half of fiscal 2016. Revenue decreased by 33% in Q1/16 compared to Q4/15, with a further decrease of 30% in Q2/16compared to the prior quarter.
Our Canaccord Genuity Wealth Management North America operations have also been negatively impacted by the weakened market conditions,with a decrease of 17% in revenue during Q2/16 compared to the same period a year ago. Despite the reduction in revenue, this segment hascontinued to reduce its operating losses as a result of cost containment efforts.
The Canaccord Genuity Wealth Management UK & Europe operations continued to experience steady revenue growth, and the fee-related revenuein this division has been steadily increasing. At the end of Q2/16, fee related revenue was at 70.0%, a 1.5 percentage point increase fromQ2/15. Assets under management for this group have also generally increased over the past eight completed financial quarters, reaching$22.9 billion as of the end of Q2/16.
The movement in revenue in the Corporate and Other division was mainly due to foreign exchange gains or losses resulting from fluctuations inthe Canadian dollar, as well as a drop in business volume within the correspondent brokerage services operations.
MANAGEMENT’S DISCUSSION AND ANALYSIS
CANACCORD GENUITY GROUP INC. SECOND QUARTER FISCAL 2016 23

Intersegment Allocated Costs
Included in the Corporate and Other segment are certain support services, research and other expenses that have been incurred to support theactivities within the Canaccord Genuity and Canaccord Genuity Wealth Management segments in Canada. Certain trading, clearing andsettlement charges are included as a trading cost in the applicable business units and as a trading cost recovery in Corporate and Other. Inaddition, certain overhead costs are charged by Canaccord Genuity UK & Europe to Canaccord Genuity Wealth Management UK & Europe andincluded in intersegment allocated costs for these business units.
Financial Condition
Below are specific changes in selected items on the unaudited interim condensed consolidated statement of financial position as compared tothe Audited Annual Consolidated Financial Statements.
ASSETS
Cash and cash equivalents were $289.4 million on September 30, 2015 compared to $322.3 million on March 31, 2015. Refer to the Liquidityand Capital Resources section on page 25 for more details.
Securities owned were $817.0 million on September 30, 2015 compared to $848.1 million on March 31, 2015 due to a decrease in equitiesowned as of September 30, 2015.
Accounts receivable were $2.1 billion at September 30, 2015 compared to $2.5 billion at March 31, 2015, mainly due to a decrease inreceivables with brokers and investment dealers and clients.
Goodwill was $521.1 million and intangible assets were $135.7 million at September 30, 2015, representing the goodwill and intangible assetsacquired through the purchases of Genuity Capital Markets, CSHP, a 50% interest in Canaccord Genuity (Australia) Limited, and the wealthmanagement business of Eden Financial Ltd. At March 31, 2015, goodwill was $505.6 million and intangible assets were $134.9 million. Theincrease in intangible assets was primarily a result of an increase in capitalized costs relating to systems development, netted against theamortization of intangible assets. In addition, the strengthening of the pound sterling and US dollar against the Canadian dollar also contributedto the increase in goodwill and intangible assets at September 30, 2015.
Other assets, consisting of income taxes receivable, deferred tax assets, equipment and leasehold improvements, and investments, were$71.0 million at September 30, 2015 compared to $67.5 million at March 31, 2015, mainly due to an increase in income taxes receivable.
LIABILITIES
Bank overdrafts and call loan facilities utilized by the Company may vary significantly on a day-to-day basis and depend on securities tradingactivity. At September 30, 2015, the Company had available credit facilities with banks in Canada and the UK in the aggregate amount of$783.8 million [March 31, 2015 — $770.0 million]. These credit facilities, consisting of call loans, subordinated debt, letters of credit anddaylight overdraft facilities, are collateralized by either unpaid client securities and/or securities owned by the Company. On September 30,2015, there was $21.4 million in bank indebtedness, compared to $20.3 million on March 31, 2015.
Securities sold short were $618.9 million at September 30, 2015 compared to $654.6 million at March 31, 2015, mostly due to a decrease inshort positions in corporate and government debt.
Accounts payable and accrued liabilities, including provisions, were $2.2 billion at September 30, 2015, a decrease from $2.5 billion atMarch 31, 2015, mainly due to a decrease in payables to brokers and investment dealers, and clients.
Other liabilities, including subordinated debt, income taxes payable and deferred tax liabilities, were $25.2 million at September 30, 2015,unchanged from March 31, 2015.
Non-controlling interests were $11.4 million at September 30, 2015 compared to $10.3 million at March 31, 2015, which represents 40% of thenet assets of our operations in Australia.
Off-Balance Sheet Arrangements
As of September 30, 2015, a subsidiary of the Company had an irrevocable secured standby letter of credit from a financial institution totalling$1.9 million (US$1.5 million) [March 31, 2015 — $1.1 million (US$0.9 million)] as a rent guarantee for its leased premises in Boston andNew York.
MANAGEMENT’S DISCUSSION AND ANALYSIS
24 CANACCORD GENUITY GROUP INC. SECOND QUARTER FISCAL 2016

Liquidity and Capital Resources
The Company has a capital structure comprised of preferred shares, common shares, contributed surplus, retained earnings and accumulatedother comprehensive income. On September 30, 2015, cash and cash equivalents were $289.4 million, a decrease of $32.9 million from$322.3 million as of March 31, 2015. During the six months ended September 30, 2015, financing activities used cash in the amount of$56.4 million, mainly due to dividends paid and purchases of common shares for the long-term incentive plan (LTIP). Investing activities usedcash in the amount of $6.5 million mainly for the purchase of equipment and leasehold improvements and intangible assets. Operating activitiesgenerated cash in the amount of $25.1 million, which was largely due to changes in non-cash working capital. An increase in cash of$4.9 million was attributable to the effect of foreign exchange translation on cash balances.
Compared to the six months ended September 30, 2014, cash used in financing activities decreased by $12.8 million primarily due to lowercash spent on acquisition of common shares for the LTIP. Cash used in investing activities decreased by $2.3 million during the six monthsended September 30, 2015 compared to the same period last year, mainly due to lower additions of intangible assets during the current fiscalyear. Changes in working capital led to an increase in cash generated by operating activities of $21.5 million. In addition, due to the appreciationof pound sterling and the US dollar against the Canadian dollar, the effect of foreign exchange on cash balances increased by $4.4 million.Overall, cash and cash equivalents decreased by $1.0 million from $290.4 million at September 30, 2014 to $289.4 million at September 30,2015.
The Company’s business requires capital for operating and regulatory purposes. The majority of current assets reflected on the Company’sunaudited interim condensed consolidated statements of financial position are highly liquid. The majority of the positions held as securitiesowned are readily marketable, and all are recorded at their fair value. Securities sold short are highly liquid securities. The fair value of thesesecurities fluctuates daily as factors such as changes in market conditions, economic conditions and investor outlook affect market prices.Client receivables are secured by readily marketable securities and are reviewed daily for impairment in value and collectability. Receivables andpayables from brokers and dealers represent the following: current open transactions that generally settle within the normal three-day settlementcycle; collateralized securities borrowed and/or loaned in transactions that can be closed within a few days on demand; and balances on behalfof introducing brokers representing net balances in connection with their client accounts.
As discussed above, subsidiaries of the Company also have other credit facilities, such as call loans, letters of credit and overdraft facilities,with banks in Canada and the UK. The aggregate amount of other credit facilities available to the Company was $783.8 million as ofSeptember 30, 2015.
In the normal course of business, the Company enters into contracts that give rise to commitments of future minimum payments that affect itsliquidity.
The following table summarizes the Company’s long term contractual obligations on September 30, 2015:
Contractual obligations payments due by period
(C$ thousands) Total Fiscal 2017Fiscal 2018–Fiscal 2019
Fiscal 2020–Fiscal 2021 Thereafter
Premises and equipment operating leases $ 153,794 $31,390 $ 49,872 $ 33,469 $ 39,063
Outstanding Share Data
Outstanding shares as of September 30
2015 2014
Preferred shares
Series A − issued shares outstanding 4,540,000 4,540,000
Series C − issued shares outstanding 4,000,000 4,000,000
Common shares
Issued shares excluding unvested shares(1) 90,098,586 91,104,336
Issued shares outstanding(2) 102,978,795 102,163,377
Issued shares outstanding − diluted(3) 110,069,022 105,193,694
Average shares outstanding − basic 92,070,815 91,943,163
Average shares outstanding − diluted 97,232,059 100,990,686
(1) Excludes 1,992,497 outstanding unvested shares related to share purchase loans for recruitment and retention programs 10,872,712 unvested shares purchased by employee benefit trusts for the LTIP, and 15,000shares held in treasury purchased through the NCIB to be cancelled.
(2) Includes 1,992,497 outstanding unvested shares related to share purchase loans for recruitment and retention programs 10,872,712 unvested shares purchased by employee benefit trusts for the LTIP, and 15,000shares held in treasury purchased through the NCIB to be cancelled.
(3) Includes 7,105,227 share issuance commitments and excludes 15,000 shares held in treasury purchased through the NCIB to be cancelled.
MANAGEMENT’S DISCUSSION AND ANALYSIS
CANACCORD GENUITY GROUP INC. SECOND QUARTER FISCAL 2016 25

Under the NCIB which commenced on August 13, 2014, and ended on August 12, 2015, a total of 1,075,432 shares were purchased at aweighted average price of $7.9555. All these shares have been cancelled. On August 4, 2015, the Company filed a notice to renew thenormal-course issuer bid (NCIB) to provide the Company with the choice to purchase up to a maximum of 5,163,737 of its common sharesduring the period from August 13, 2015 to August 12, 2016 through the facilities of the TSX and on alternative trading systems in accordancewith the requirements of the TSX. The purpose of the purchase of common shares under the NCIB is to enable the Company to acquire sharesfor cancellation. The maximum number of shares that may be purchased under the current NCIB represents 5.0% of the Company’s outstandingcommon shares at the time of the notice. A total of 375,050 shares have been purchased under the terms of the NCIB, of which 15,000 shareswere held in treasury as of September 30, 2015 until subsequently cancelled on October 30, 2015. Shareholders may obtain a copy of thenotice, without charge, by contacting the Company.
The Company has entered into a predefined plan with a designated broker to allow for the repurchase of its common shares under this NCIB.The Company’s broker may repurchase the common shares under the plan on any trading day during the NCIB, including at any time during theCompany’s internal trading blackout periods. The plan has been reviewed by the TSX and will terminate on the earlier of the termination of theplan by the Company in accordance with its terms and the expiry of the NCIB.
Purchases under the current NCIB commenced on August 13, 2015, and will continue for one year (to August 12, 2016) at the discretion of theCompany. The maximum consideration will be the market price of the securities at the time of acquisition. In order to comply with the tradingrules of the TSX and the conditions for trading under the EU Buy-back and Stabilisation Regulation, the daily purchases are limited to 41,767common shares of the Company (which is the lesser of (a) 25% of the average daily trading volume of common shares of the Company on theTSX in the six calendar months from February 2015 to July 2015 and (b) 25% of the average daily trading volume of common shares of theCompany on the TSX in the month of July 2015). To fulfill its regulatory reporting requirements in Canada and in the UK, the Company will issuea press release no later than the end of the seventh daily market session following the date of execution of the purchases.
As of October 31, 2015, the Company has 103,074,647 common shares issued and outstanding.
Share-Based Payment Plans
There have been no updates to the share-based payment plans discussed in the 2015 Annual Report.
International Financial Centre
Canaccord Genuity Group is a member of the AdvantageBC International Business Centre Society (formerly known as the International FinancialCentre British Columbia Society) and the Montréal International Financial Centre, both of which provide certain tax and financial benefitspursuant to the International Business Activity Act of British Columbia and the Act Respecting International Financial Centres of Québec.Accordingly, the Company’s overall income tax rate is less than the rate that would otherwise be applicable.
Financial Instruments
FOREIGN EXCHANGE
The Company manages its foreign exchange risk by periodically hedging pending settlements in foreign currencies. Realized and unrealized gainsand losses related to these transactions are recognized in income during the period. On September 30, 2015, forward contracts outstanding tosell US dollars had a notional amount of US$12.5 million, a decrease of US$4.8 million compared to September 30, 2014. Forward contractsoutstanding to buy US dollars had a notional amount of US$7.5 million, an increase of US$3.2 million from September 30, 2014. The fair valueof these contracts was nominal. Some of the Company’s operations in the US, the UK & Europe, Australia, Singapore, Hong Kong and China areconducted in the local currency; however, any foreign exchange risk in respect of these transactions is generally limited as pending settlementson both sides of the transaction are typically in the local currency.
These contracts were entered into in an attempt to mitigate foreign exchange risk on pending security settlements in foreign currencies. The fairvalue of these contracts is nominal due to their short term to maturity.
The Company’s Canaccord Genuity Wealth Management segment in the UK & Europe trades foreign exchange forward contracts on behalf of itsclients, and establishes matching contracts with the counterparties. The Company has no significant net exposure, assuming no counterpartydefault.
FUTURES
The Company’s Canadian operations are involved in trading bond futures contracts, which are agreements to buy or sell a standardized amountof an underlying Government of Canada bond, at a predetermined future date and price, in accordance with terms specified by a regulatedfutures exchange, and are subject to daily cash margining. The Company’s Canadian operations trade in bond futures in an attempt to mitigateinterest rate risk, yield curve risk and liquidity risk. At September 30, 2015, the notional amount of the bond futures contracts outstanding waslong $4.7 million [March 31, 2015 — long $1.6 million].
MANAGEMENT’S DISCUSSION AND ANALYSIS
26 CANACCORD GENUITY GROUP INC. SECOND QUARTER FISCAL 2016

The Company’s Canadian operations are also involved in trading US Treasury futures in an attempt to mitigate interest rate risk, yield curve riskand liquidity risk. At September 30, 2015, the notional amount of US Treasury futures contracts outstanding held in a short position was$9.1 million (US$6.8 million) [March 31, 2015 — $nil]. The fair value of all of the above futures contracts is nominal due to their short term tomaturity. Realized and unrealized gains and losses related to these contracts are recognized in net income (loss) during the reporting period.
Related Party Transactions
The Company’s related parties include the following persons and/or entities: (a) entities that are controlled or significantly influenced by theCompany, and (b) key management personnel, who are comprised of the directors of the Company, as well as executives involved in strategicdecision-making for the Company. A list of the Company’s principal trading subsidiaries and principal intermediate holding companies isdisclosed in Note 20 of the March 31, 2015 Audited Annual Consolidated Financial Statements.
Security trades executed for employees, officers and directors of the Company are transacted in accordance with terms and conditionsapplicable to all clients. Commission income on such transactions in the aggregate is not material in relation to the overall operations of theCompany.
The Company offers various share-based payment plans to its key management personnel, including common share purchase loans, a long-termincentive plan, the CSH Inducement Plan and share options. Directors have also been granted share options and have the right to acquiredeferred share units (DSUs).
Accounts receivable and accounts payable and accrued liabilities include the following balances with key management personnel:
(C$ thousands)September 30,
2015March 31,
2015
Accounts Receivable $ 1,015 —
Accounts payable and accrued liabilities $ 679 $ 1,041
Critical Accounting Policies and Estimates
The unaudited interim condensed consolidated financial statements for the quarter ended September 30, 2015 have been prepared inaccordance with International Accounting Standard 34, ‘‘Interim Financial Reporting’’ (IAS 34), as issued by the International AccountingStandards Board (IASB).
The preparation of the unaudited interim condensed consolidated financial statements in conformity with IAS 34 requires management to makejudgments, estimates and assumptions that affect the reported amounts of revenues, expenses, assets and liabilities, accompanying notedisclosures, and the disclosure of contingent liabilities at the reporting date. Therefore, actual results may differ from those estimates andassumptions. The significant judgments, estimates and assumptions include consolidation, revenue recognition, share-based payments, incometaxes, valuation of deferred tax assets, impairment of goodwill, intangible assets and other long-lived assets, allowance for credit losses, fairvalue of financial instruments, capitalization of intangible assets related to software costs and provisions.
In particular, the assessment for impairment of goodwill and identifiable indefinite life intangible assets requires management’s best estimatesin order to determine fair values using discounted cash flow projections that employ the following key assumptions: future cash flows, growthprojections and discount rates. Due to continuing economic uncertainties, interim impairment tests were performed for goodwill and indefinitelife intangible assets for all applicable cash-generating units (CGUs) as of September 30, 2015.
In accordance with IAS 36, ‘‘Impairment of Assets’’ (IAS 36), the recoverable amounts of the CGUs’ net assets is determined using fair value lesscosts to sell (FVLCS) calculations, which are based on cash flow assumptions approved by senior management. There is a material degree ofuncertainty with respect to the estimates of the recoverable amounts of the CGUs’ net assets given that these estimates involve making keyassumptions about the future. In making such assumptions, management has used its best estimate of future economic and market conditionswithin the context of the Company’s capital markets and wealth management activities.
The FVLCS calculations are based on assumptions, made in connection with future cash flows, terminal growth rates and discount rates. In orderto estimate the FVLCS for each cash-generating unit, cash flows are forecast over a five-year period from the end of the current interim period, aterminal growth rate is applied and then such cash flows are discounted to their present value. The discount rate is based on the specificcircumstances of each CGU and is derived from the estimated weighted average cost of capital of the Company. The discount rate utilized foreach of the CGUs ranged from 12.5% to 14.0% [March 31, 2015 — 12.5% to 14.0%]. Cash flow estimates for each CGU are based onmanagement assumptions, and utilize compound five-year annual revenue growth rates which range from 5.0% to 10.0% [March 31,2015 — 5.0% to 10.0%] as well as estimates in respect of operating margins.
MANAGEMENT’S DISCUSSION AND ANALYSIS
CANACCORD GENUITY GROUP INC. SECOND QUARTER FISCAL 2016 27

Refer to Note 7 of the unaudited interim condensed consolidated financial statements for the six months ended September 30, 2015 for furtherinformation regarding the key assumptions used in connection with the September 30, 2015 interim impairment tests of goodwill and indefinitelife intangible assets.
Significant accounting policies used and policies requiring management’s judgment and estimates have not changed during the second quarterof fiscal 2016 and are discussed under ‘‘Critical Accounting Policies and Estimates’’ in our 2015 Annual Report.
Changes in Accounting Policies
There were no significant changes in the accounting policies discussed in Note 5 of the 2015 Audited Annual Consolidated FinancialStatements, during the six months ended September 30, 2015.
Future Changes in Accounting Policies and Estimates
There have been no updates to the ‘‘Future Changes in Accounting Policies and Estimates’’ disclosed in our 2015 Annual Report, during thesix months ended September 30, 2015, except as noted below.
During July 2015, due to significant feedback from stakeholders and to align with the US Financial Accounting Standards Board, the InternationalAccounting Standards Board decided to defer the effective date of IFRS 15 by one year. As a result, IFRS 15 will be effective for annual reportingperiods beginning on or after January 1, 2018, with early adoption permitted.
Disclosure Controls and Procedures and Internal Control over Financial Reporting
DISCLOSURE CONTROLS AND PROCEDURES
As of September 30, 2015, an evaluation was carried out, under the supervision of and with the participation of management, including thePresident & CEO and the Executive Vice President & CFO, of the effectiveness of our disclosure controls and procedures as defined underNational Instrument 52-109. Based on that evaluation, the President & CEO and the Executive Vice President & CFO concluded that ourdisclosure controls and procedures were effective as at September 30, 2015.
CHANGES IN INTERNAL CONTROL OVER FINANCIAL REPORTING
There were no changes made in our internal control over financial reporting that occurred during the quarter ended September 30, 2015, thathave materially affected, or are reasonably likely to materially affect, our internal control over financial reporting.
Dividend Policy
Although dividends are expected to be declared and paid quarterly, the Board of Directors, in its sole discretion, will determine the amount andtiming of any dividends. All dividend payments will depend on general business conditions, the Company’s financial condition, results ofoperations, capital requirements and such other factors as the Board determines to be relevant.
Dividend Declaration
On November 4, 2015, the Board of Directors approved the following cash dividends: a quarterly dividend of $0.05 per common share payableon December 10, 2015 to common shareholders with a record date of November 20, 2015; $0.34375 per Series A Preferred Share payable onDecember 31, 2015 with a record date of December 18, 2015; and $0.359375 per Series C Preferred Share payable on December 31, 2015with a record date of December 18, 2015.
MANAGEMENT’S DISCUSSION AND ANALYSIS
28 CANACCORD GENUITY GROUP INC. SECOND QUARTER FISCAL 2016

Risks
The Company’s ability to maintain and successfully execute its business strategy depends upon the personal reputation, judgment, businessgeneration capabilities and project execution skills of its senior professionals. Any management disruption could result in a loss of clients andcustomers, or revenues from clients and customers, and could significantly affect the Company’s business and results of operations.
The securities industry and the Company’s activities are by their very nature subject to a number of inherent risks. Economic conditions,competition and market factors such as volatility in the Canadian and international markets, interest rates, commodity prices, market prices,trading volumes and liquidity will have a significant impact on the Company’s profitability. An investment in the common or preferred shares ofthe Company involves a number of risks, including market, liquidity, credit, operational, legal and regulatory risks, which could be substantial andare inherent in the Company’s business. The Company is also directly exposed to market price risk, liquidity risk and volatility risk as a result ofits principal trading activities in equity securities and to interest rate risk and credit spread risk as a result of its principal trading in fixed incomesecurities. Canaccord Genuity Wealth Management revenue is dependent on both trading volumes and asset values and, as such, is dependenton the level of market activity, investor confidence and the level of market prices. Canaccord Genuity’s revenue is dependent on financing activityby corporate issuers, participation in advisory engagements, the success of its market making and principal trading, as well as the willingness ofinstitutional clients to actively trade and participate in capital markets transactions. There may also be a lag between market fluctuations,changes in business conditions and the level of the Company’s market activity and the impact that these factors have on the Company’soperating results and financial position.
The financial services business is subject to extensive regulation in Canada, the US, the UK & Europe, Singapore, Hong Kong, Australia andelsewhere. Compliance with many of the regulations applicable to the Company involves a number of risks, particularly in areas where applicableregulations may be subject to interpretation and change. Changing regulations and interpretations could have a significant impact on theCompany’s business and profitability. The Company has a capital management framework to maintain the level of capital that will meet theCompany’s regulated subsidiaries’ target ratios as set out by the respective regulators, to fund current and future operations, to ensure that thefirm is able to meet its financial obligations as they come due, and to support the creation of shareholder value. The regulatory bodies thatgovern the Company’s subsidiaries’ use of regulatory capital are listed in Note 22 of the Company’s 2015 Audited Annual Consolidated FinancialStatements.
Further discussion regarding risks can be found in our Annual Information Form.
Additional Information
A comprehensive discussion of the Company’s business, strategies, objectives and risks is available in our Annual Information Form and in theManagement’s Discussion and Analysis and Audited Annual Consolidated Financial Statements included in our 2015 Annual Report, which areavailable on our website at www.canaccordgenuitygroup.com/EN/IR/FinReports/Pages/default.aspx and on SEDAR at www.sedar.com.
MANAGEMENT’S DISCUSSION AND ANALYSIS
CANACCORD GENUITY GROUP INC. SECOND QUARTER FISCAL 2016 29

Unaudited Interim Condensed Consolidated Statements of Financial Position
As at (in thousands of Canadian dollars) NotesSeptember 30,
2015March 31,
2015
ASSETS
Current
Cash and cash equivalents $ 289,385 $ 322,324
Securities owned 4 816,967 848,128
Accounts receivable 6 2,147,327 2,491,488
Income taxes receivable 8,558 5,295
Total current assets 3,262,237 3,667,235
Deferred tax assets 10,190 10,148
Investments 9,482 8,693
Equipment and leasehold improvements 42,798 43,373
Intangible assets 7 135,721 134,877
Goodwill 7 521,124 505,579
$ 3,981,552 $ 4,369,905
LIABILITIES AND SHAREHOLDERS’ EQUITY
Current
Bank Indebtedness $ 21,360 $ 20,264
Securities sold short 4 618,872 654,639
Accounts payable and accrued liabilities 6, 13 2,165,804 2,527,636
Provisions 15 10,479 14,320
Income taxes payable 4,014 8,172
Subordinated debt 15,000 15,000
Total current liabilities 2,835,529 3,240,031
Deferred tax liabilities 6,177 2,057
2,841,706 3,242,088
Shareholders’ equity
Preferred shares 9 205,641 205,641
Common shares 10 618,559 620,858
Contributed surplus 64,984 85,597
Retained earnings 86,051 92,815
Accumulated other comprehensive income 153,250 112,631
Total shareholders’ equity 1,128,485 1,117,542
Non-controlling interests 11,361 10,275
Total equity 1,139,846 1,127,817
$ 3,981,552 $ 4,369,905
See accompanying notes
On behalf of the Board:
‘‘Daniel Daviau’’ ‘‘Terrence A. Lyons’’
DANIEL DAVIAU TERRENCE A. LYONSDirector Director
UNAUDITED INTERIM CONDENSED CONSOLIDATED FINANCIAL STATEMENTSUNAUDITED INTERIM CONDENSED CONSOLIDATED FINANCIAL STATEMENTS
30 CANACCORD GENUITY GROUP INC. SECOND QUARTER FISCAL 2016

Unaudited Interim Condensed Consolidated Statements of OperationsFor the three months ended For the six months ended
(in thousands of Canadian dollars, except per share amounts) NotesSeptember 30,
2015September 30,
2014September 30,
2015September 30,
2014
REVENUE
Commissions and fees $ 89,182 $ 86,240 $ 183,888 $ 181,066
Investment banking 31,490 66,289 96,903 153,661
Advisory fees 43,912 55,741 65,577 88,435
Principal trading 17,592 17,708 40,158 37,984
Interest 4,334 5,902 9,408 12,206
Other 4,092 4,391 9,122 8,475
190,602 236,271 405,056 481,827
EXPENSES
Incentive compensation 92,681 119,389 199,181 241,726
Salaries and benefits 22,510 20,268 45,074 42,801
Trading costs 14,107 12,775 27,917 25,409
Premises and equipment 10,051 10,080 19,937 20,113
Communication and technology 14,267 12,901 27,870 24,418
Interest 2,292 2,977 5,583 7,232
General and administrative 22,794 21,836 44,962 45,905
Amortization 6,453 7,475 12,586 14,847
Development costs 3,948 3,625 8,000 8,760
Restructuring costs — — — 2,383
$ 189,103 $ 211,326 $ 391,110 $ 433,594
Income before income taxes 1,499 24,945 13,946 48,233
Income taxes (recovery)
Current 2,076 10,250 (1,126) 12,651
Deferred (146) (2,919) 4,542 (901)
8 1,930 7,331 3,416 11,750
Net (loss) income for the period $ (431) $ 17,614 $ 10,530 $ 36,483
Net (loss) income attributable to:
CGGI shareholders $ (105) $ 17,109 $ 10,309 $ 35,190
Non-controlling interests $ (326) $ 505 $ 221 $ 1,293
Weighted average number of common shares outstanding (thousands)
Basic 91,465 91,070 92,071 91,943
Diluted n/a 101,059 97,232 100,991
Net (loss) income per common share
Basic 10iii $ (0.03) $ 0.16 $ 0.05 $ 0.32
Diluted 10iii $ (0.03) $ 0.14 $ 0.04 $ 0.29
Dividend per common share 11 $ 0.05 $ 0.10 $ 0.10 $ 0.15
Dividend per Series A Preferred Share 11 $ 0.34 $ 0.34 $ 0.69 $ 0.69
Dividend per Series C Preferred Share 11 $ 0.36 $ 0.36 $ 0.72 $ 0.72
See accompanying notes
UNAUDITED INTERIM CONDENSED CONSOLIDATED FINANCIAL STATEMENTSUNAUDITED INTERIM CONDENSED CONSOLIDATED FINANCIAL STATEMENTS
CANACCORD GENUITY GROUP INC. SECOND QUARTER FISCAL 2016 31
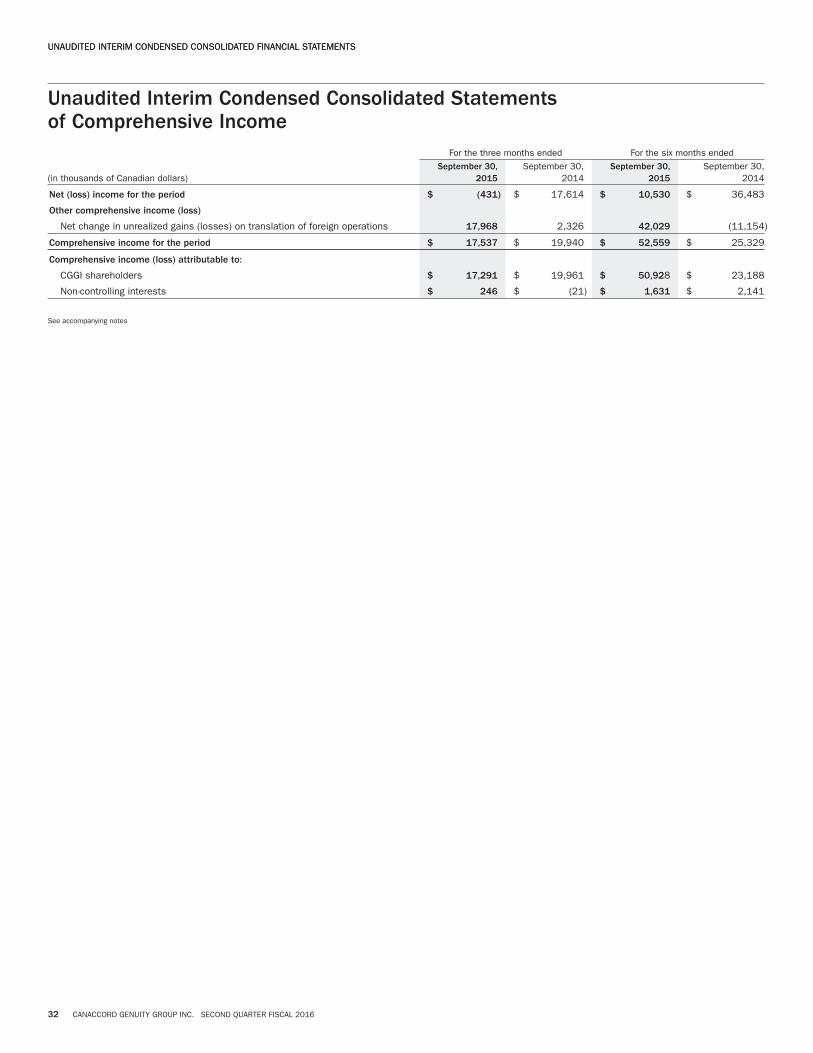
Unaudited Interim Condensed Consolidated Statementsof Comprehensive Income
For the three months ended For the six months ended
(in thousands of Canadian dollars)September 30,
2015September 30,
2014September 30,
2015September 30,
2014
Net (loss) income for the period $ (431) $ 17,614 $ 10,530 $ 36,483
Other comprehensive income (loss)
Net change in unrealized gains (losses) on translation of foreign operations 17,968 2,326 42,029 (11,154)
Comprehensive income for the period $ 17,537 $ 19,940 $ 52,559 $ 25,329
Comprehensive income (loss) attributable to:
CGGI shareholders $ 17,291 $ 19,961 $ 50,928 $ 23,188
Non-controlling interests $ 246 $ (21) $ 1,631 $ 2,141
See accompanying notes
UNAUDITED INTERIM CONDENSED CONSOLIDATED FINANCIAL STATEMENTSUNAUDITED INTERIM CONDENSED CONSOLIDATED FINANCIAL STATEMENTS
32 CANACCORD GENUITY GROUP INC. SECOND QUARTER FISCAL 2016

Unaudited Interim Condensed Consolidated Statements of Changes in Equity
For the six months ended (in thousands of Canadian dollars) NotesSeptember 30,
2015September 30,
2014
Preferred shares, opening and closing 9 $ 205,641 $ 205,641
Common shares, opening 620,858 653,189
Shares issued in connection with share-based payments 5,126 10,143
Acquisition of common shares for long-term incentive plan (LTIP) (38,342) (52,029)
Release of vested common shares from employee benefit trust 21,537 14,396
Shares cancelled (2,918) (3,852)
Shares repurchased not yet cancelled (106) —
Net unvested share purchase loans 12,404 (6,356)
Common shares, closing 10 618,559 615,491
Contributed surplus, opening 85,597 74,037
Share-based payments (11,113) (484)
Shares cancelled 827 1,581
Unvested share purchase loans (10,327) 3,156
Contributed surplus, closing 64,984 78,290
Retained earnings, opening 92,815 144,799
Net income attributable to CGGI shareholders 10,309 35,190
Preferred shares dividends 11 (5,996) (5,996)
Common shares dividends 11 (11,077) (10,616)
Retained earnings, closing 86,051 163,377
Accumulated other comprehensive income, opening 112,631 91,014
Other comprehensive income (loss) attributable to CGGI shareholders 40,619 (12,002)
Accumulated other comprehensive income, closing 153,250 79,012
Total shareholders’ equity 1,128,485 1,141,811
Non-controlling interests, opening 10,275 14,912
Foreign exchange on non-controlling interests (545) (200)
Comprehensive income attributable to non-controlling interests 1,631 2,141
Dividends paid to non-controlling interests — (1,723)
Non-controlling interests, closing 11,361 15,130
Total equity $ 1,139,846 $ 1,156,941
See accompanying notes
UNAUDITED INTERIM CONDENSED CONSOLIDATED FINANCIAL STATEMENTSUNAUDITED INTERIM CONDENSED CONSOLIDATED FINANCIAL STATEMENTS
CANACCORD GENUITY GROUP INC. SECOND QUARTER FISCAL 2016 33

Unaudited Interim Condensed Consolidated Statements of Cash Flows
For the six months ended (in thousands of Canadian dollars) NotesSeptember 30,
2015September 30,
2014
OPERATING ACTIVITIES
Net income for the period $ 10,530 $ 36,483
Items not affecting cash
Amortization 12,586 14,847
Deferred income tax (recovery) expense 4,542 (901)
Share-based compensation expense 12 20,158 25,923
Changes in non-cash working capital
Decrease in securities owned 42,305 98,685
Decrease in accounts receivable 395,218 79,282
(Increase) decrease in income taxes receivable (5,760) 3,179
Decrease in securities sold short (41,976) (136,838)
Decrease in accounts payable, accrued liabilities and provisions (412,519) (117,026)
Cash provided by operating activities 25,084 3,634
FINANCING ACTIVITIES
Bank indebtedness 1,096 —
Acquisition of common shares for long-term incentive plan (38,342) (52,029)
Purchase of shares for cancellation (2,091) (2,271)
Cash dividends paid on common shares (11,077) (10,199)
Cash dividends paid on preferred shares (5,996) (5,996)
Proceeds from exercise of share options — 1,263
Cash used in financing activities (56,410) (69,232)
INVESTING ACTIVITIES
Purchase of equipment and leasehold improvements (3,016) (1,223)
Purchase of intangible assets (3,484) (7,541)
Cash used in investing activities (6,500) (8,764)
Effect of foreign exchange on cash balances 4,887 469
Decrease in cash position (32,939) (73,893)
Cash position, beginning of period 322,324 364,296
Cash position, end of period 289,385 $ 290,403
Supplemental cash flow information
Interest received $ 6,344 $ 7,541
Interest paid $ 4,792 $ 6,585
Income taxes paid $ 8,286 $ 10,992
See accompanying notes
UNAUDITED INTERIM CONDENSED CONSOLIDATED FINANCIAL STATEMENTSUNAUDITED INTERIM CONDENSED CONSOLIDATED FINANCIAL STATEMENTS
34 CANACCORD GENUITY GROUP INC. SECOND QUARTER FISCAL 2016

Notes to Unaudited Interim Condensed Consolidated Financial Statements(in thousands of Canadian dollars, except per share amounts)
NOTE 01 Corporate Information
Through its principal subsidiaries, Canaccord Genuity Group Inc. (the Company) is a leading independent, full-service investment dealer withcapital markets operations in Canada, the United Kingdom (UK) & Europe, the United States of America (US), Australia, China, Singapore, Dubaiand Barbados. The Company also has wealth management operations in Canada, the UK & Europe, and Australia. The Company has operationsin each of the two principal segments of the securities industry: capital markets and wealth management. Together, these operations offer awide range of complementary investment products, brokerage services and investment banking services to the Company’s private, institutionaland corporate clients.
Canaccord Genuity Group Inc. was incorporated on February 14, 1997 by the filing of a memorandum and articles with the Registrar ofCompanies for British Columbia under the Company Act (British Columbia) and continues in existence under the Business Corporations Act(British Columbia). The Company’s head office is located at Suite 2200 − 609 Granville Street, Vancouver, British Columbia, V7Y 1H2. TheCompany’s registered office is located at Suite 1000 − 840 Howe Street, Vancouver, British Columbia, V6Z 2M1.
The Company’s common shares are publicly traded under the symbol CF on the TSX and the symbol CF. on the main market of the London StockExchange. The Company’s Series A Preferred Shares are listed on the TSX under the symbol CF.PR.A. The Company’s Series C Preferred Sharesare listed on the TSX under the symbol CF.PR.C.
The Company’s business experiences considerable variations in revenue and income from quarter to quarter and year to year due to factorsbeyond the Company’s control. The Company’s business is affected by the overall condition of the worldwide equity and debt markets.
NOTE 02 Basis of Preparation
STATEMENT OF COMPLIANCE
These unaudited interim condensed consolidated financial statements have been prepared in accordance with International AccountingStandard 34, ‘‘Interim Financial Reporting’’ (IAS 34), as issued by the International Accounting Standards Board (IASB).
These unaudited interim condensed consolidated financial statements do not include all the information and disclosures required in annualfinancial statements, and should be read in conjunction with the Company’s audited annual consolidated financial statements as at and for theyear ended March 31, 2015 (March 31, 2015 consolidated financial statements) filed on SEDAR on June 2, 2015. All defined terms used hereinare consistent with those terms defined in the March 31, 2015 consolidated financial statements.
The unaudited interim condensed consolidated financial statements have been prepared on a historical cost basis except for investments,securities owned and securities sold short, which have been measured at fair value as set out in the relevant accounting policies.
The unaudited interim condensed consolidated financial statements are presented in thousands of Canadian dollars, except when otherwiseindicated.
These unaudited interim condensed consolidated financial statements were authorized for issuance by the Company’s Board of Directors onNovember 4, 2015.
USE OF JUDGMENTS, ESTIMATES AND ASSUMPTIONS
The preparation of the unaudited interim condensed consolidated financial statements in conformity with IAS 34 requires management to makejudgments, estimates and assumptions that affect the reported amounts of revenues, expenses, assets and liabilities, accompanying notedisclosures, and the disclosure of contingent liabilities at the reporting date. Therefore, actual results may differ from those estimates andassumptions. The significant judgments, estimates and assumptions include consolidation, revenue recognition, share-based payments, incometaxes, valuation of deferred tax assets, impairment of goodwill, intangible assets and other long-lived assets, allowance for credit losses, fairvalue of financial instruments, capitalization of intangible assets related to software costs and provisions, which are more fully described inNote 2 of the March 31, 2015 consolidated financial statements.
CANACCORD GENUITY GROUP INC. SECOND QUARTER FISCAL 2016 35

FUTURE ACCOUNTING DEVELOPMENTS
There have been no further updates to the future accounting developments disclosed in Note 4 of the March 31, 2015 consolidated financialstatements, during the six months ended September 30, 2015, except as noted below.
IFRS 15 — ‘‘Revenue from Contracts with Customers’’During July 2015, due to significant feedback from stakeholders and to align with the US Financial Accounting Standards Board, the InternationalAccounting Standards Board decided to defer the effective date of IFRS 15 by one year. As a result, IFRS 15 will be effective for annual reportingperiods beginning on or after January 1, 2018, with early adoption permitted.
NOTE 03 Summary of Significant Accounting Policies
There were no significant changes in the accounting policies discussed in Note 5 of the March 31, 2015 consolidated financial statements,during the six months ended September 30, 2015.
NOTE 04 Securities Owned and Securities Sold Short
September 30, 2015 March 31, 2015Securities
ownedSecuritiessold short
Securitiesowned
Securitiessold short
Corporate and government debt $ 623,695 $ 537,361 $ 638,551 $ 555,792
Equities and convertible debentures 193,272 81,511 209,577 98,847
$ 816,967 $ 618,872 $ 848,128 $ 654,639
As at September 30, 2015, corporate and government debt maturities range from 2015 to 2097 [March 31, 2015 − 2015 to 2097] and bearinterest ranging from 0.0% to 15.0% [March 31, 2015 − 0.0% to 15.0%].
NOTE 05 Financial Instruments
The categories of financial instruments, other than cash and cash equivalents and bank indebtedness, held by the Company at September 30,2015 and March 31, 2015 are as follows:
Held for trading Available for sale Loans and receivables Loans and borrowings TotalSeptember 30,
2015March 31,
2015September 30,
2015March 31,
2015September 30,
2015March 31,
2015September 30,
2015March 31,
2015September 30,
2015March 31,
2015Financial assetsSecurities owned $ 816,967 $848,128 $ — $ — $ — $ — $ — $ — $ 816,967 $ 848,128Accounts receivable
from brokers andinvestment dealers — — — — 1,306,502 1,503,666 — — 1,306,502 1,503,666
Accounts receivablefrom clients — — — — 518,265 601,486 — — 518,265 601,486
RRSP cash balancesheld in trust — — — — 248,298 276,159 — — 248,298 276,159
Other accountsreceivable — — — — 74,262 110,177 — — 74,262 110,177
Investments — — 9,482 8,693 — — — — 9,482 8,693Total financial assets $ 816,967 $848,128 $ 9,482 $ 8,693 $ 2,147,327 $2,491,488 $ — $ — $ 2,973,776 $3,348,309
Financial liabilitiesSecurities sold short $ 618,872 $654,639 $ — $ — $ — $ — $ — $ — $ 618,872 $ 654,639Accounts payable to
brokers andinvestment dealers — — — — — — 1,079,201 1,172,198 1,079,201 1,172,198
Accounts payable toclients — — — — — — 943,565 1,130,893 943,565 1,130,893
Other accounts payableand accruedliabilities — — — — — — 143,038 224,545 143,038 224,545
Subordinated debt — — — — — — 15,000 15,000 15,000 15,000Total financial liabilities $ 618,872 $654,639 $ — $ — $ — $ — $ 2,180,804 $2,542,636 $ 2,799,676 $3,197,275
The Company has not designated any financial instruments as fair value through profit or loss upon initial recognition.
NOTES TO UNAUDITED INTERIM CONDENSED CONSOLIDATED FINANCIAL STATEMENTS
36 CANACCORD GENUITY GROUP INC. SECOND QUARTER FISCAL 2016

FAIR VALUE HIERARCHY
All financial instruments for which fair value is recognized or disclosed are categorized within a fair value hierarchy, described as follows, basedon the lowest level input that is significant to the fair value measurement as a whole:
Level 1 − Quoted market prices in an active market (that are unadjusted) for identical assets or liabilities
Level 2 − Valuation techniques (for which the lowest level input that is significant to the fair value measurement is directly or indirectlyobservable)
Level 3 − Valuation techniques (for which the lowest level input that is significant to the fair value measurement is unobservable)
For financial instruments that are recognized at fair value on a recurring basis, the Company determines whether transfers have occurredbetween levels in the hierarchy by re-assessing categorization (based on the lowest level input that is significant to the fair value measurementas a whole) at the end of each reporting period.
As at September 30, 2015, the Company held the following classes of financial instruments measured at fair value:
Estimated fair valueSeptember 30, 2015
September 30, 2015 Level 1 Level 2 Level 3
Securities owned
Corporate debt $ 29,010 $ — $ 29,010 $ —
Government debt 594,685 334,303 260,382 —
Corporate and government debt 623,695 334,303 289,392 —
Equities 192,479 157,102 35,202 175
Convertible debentures 793 — 6 787
Private investments — — — —
Equities and convertible debentures 193,272 157,102 35,208 962
816,967 491,405 324,600 962
Securities sold short
Corporate debt (12,542) — (12,542) —
Government debt (524,819) (323,011) (201,808) —
Corporate and government debt (537,361) (323,011) (214,350) —
Equities (81,511) (68,138) (13,373) —
(618,872) (391,149) (227,723) —
Available for sale investments 9,482 — 4,252 5,230
As at March 31, 2015, the Company held the following classes of financial instruments measured at fair value:
Estimated fair valueMarch 31, 2015
March 31, 2015 Level 1 Level 2 Level 3
Securities owned
Corporate debt $ 18,369 $ — $ 18,369 $ —
Government debt 620,182 128,049 492,133 —
Corporate and government debt 638,551 128,049 510,502 —
Equities 208,678 186,950 21,505 223
Convertible debentures 899 — 27 872
Equities and convertible debentures 209,577 186,950 21,532 1,095
848,128 314,999 532,034 1,095
Securities sold short
Corporate debt (18,032) — (18,032) —
Government debt (537,760) (137,924) (399,836) —
Corporate and government debt (555,792) (137,924) (417,868) —
Equities (98,847) (95,715) (3,132) —
(654,639) (233,639) (421,000) —
Available for sale investments 8,693 — 3,963 4,730
NOTES TO UNAUDITED INTERIM CONDENSED CONSOLIDATED FINANCIAL STATEMENTS
CANACCORD GENUITY GROUP INC. SECOND QUARTER FISCAL 2016 37

Movement in net Level 3 financial assets
March 31, 2015 $ 5,825
Purchase of Level 3 assets 500
Other (133)
September 30, 2015 $ 6,192
During the six months ended September 30, 2015, the Company made an additional investment of $0.5 million in debenture notes of CanadianFirst Financial Holdings Limited.
FAIR VALUE ESTIMATION
i. Level 2 financial instruments
Level 2 financial instruments include the Company’s investment in certain corporate and government debt, equities and convertible debt. The fairvalues of corporate and government debt, equities and convertible debt classified as Level 2 are determined using the quoted market prices ofidentical assets or liabilities in markets that do not have transactions which take place with sufficient frequency and volume to provide pricinginformation on an ongoing basis. The Company regularly reviews the transaction frequency and volume of trading in these instruments todetermine the accuracy of pricing information.
Level 2 financial instruments also include the Company’s investment in Euroclear, which has an estimated fair value of $4.3 million as atSeptember 30, 2015 [March 31, 2015 − $4.0 million]. The current fair value is determined using a market-based approach based on recentshare buyback transactions.
ii. Level 3 financial instruments
a. Available for sale investments
Available for sale investments also include the Company’s investment in Canadian First Financial Holdings Limited (Canadian First), which has anestimated fair value of $5.2 million as at September 30, 2015 [March 31, 2015 − $4.7 million]. During the six months ended September 30,2015, the Company made an additional investment of $0.5 million in debenture notes. The fair value for Canadian First is determined by theCompany using a market-based approach with information that the Company has determined to be reliable, and represents the best estimate offair value readily available.
An increase or decrease of 10% in the fair value of the Company’s investment in Canadian First held as at September 30, 2015 would cause anincrease or decrease of approximately $0.5 million in other comprehensive income.
b. Held for trading
The fair value of level 3 investments classified as held for trading is determined by the Company using a market-based approach with informationthat the Company has determined to be reliable, and represents the best estimate of fair value readily available. Prices for held for tradinginvestments are determined based on the last trade price or offer price, or, if these prices are considered stale, the Company obtains informationbased on certain inquiries, recent trades or pending new issues. The fair value of the level 3 investments classified as held for trading as atSeptember 30, 2015 was $1.0 million [March 31, 2015 − $1.1 million].
The fair value measurements determined as described above may not be indicative of net realizable value or reflective of future values.Furthermore, the Company believes its valuation methods are appropriate and consistent with those which would be utilized by a marketparticipant.
NOTES TO UNAUDITED INTERIM CONDENSED CONSOLIDATED FINANCIAL STATEMENTS
38 CANACCORD GENUITY GROUP INC. SECOND QUARTER FISCAL 2016

Foreign exchange forward contracts
The Company uses derivative financial instruments in an attempt to mitigate foreign exchange risk on pending security settlements in foreigncurrencies. The fair value of these contracts is nominal due to their short term to maturity. Realized and unrealized gains and losses related tothese contracts are recognized in net income during the reporting period.
Forward contracts outstanding at September 30, 2015:
Notional amount(millions) Average price Maturity Fair value
To sell US dollars USD$ 12.5 $1.34(CAD/USD) October 2, 2015 $ 45
To buy US dollars USD$ 7.5 $1.34(CAD/USD) October 1, 2015 $ (9)
Forward contracts outstanding at March 31, 2015:
Notional amount(millions) Average price Maturity Fair value
To sell US dollars USD$ 7.5 $1.27(CAD/USD) April 6, 2015 $ 11
To buy US dollars USD$ 12.0 $1.27(CAD/USD) April 6, 2015 $ (20)
To buy pounds sterling (GBP) GBP£ 2.5 $1.88(CAD/GBP) April 30, 2015 $ (6)
To buy euro (EUR) EUR€ 1.1 $1.38(CAD/EUR) July 31, 2015 $ (24)
The Company’s Canaccord Genuity Wealth Management segment in the UK & Europe trades foreign exchange forward contracts on behalf of itsclients, and establishes matching contracts with the counterparties. The Company has no significant net exposure, assuming no counterpartydefault. The principal currencies of the forward contracts are: the UK pound sterling, the US dollar, or the Euro. The weighted average term tomaturity is 88 days as at September 30, 2015 [March 31, 2015 − 103 days]. The table below shows the fair value of the forward contractassets and liabilities, and the notional value of these forward contracts as at September 30, 2015 and March 31, 2015, respectively. The fairvalue of the forward contract assets and liabilities is included in the accounts receivable and payable balances.
Septmeber 30, 2015 March 31, 2015Assets Liabilities Notional amount Assets Liabilities Notional amount
Foreign exchange forward contracts $ 5,170 $ (4,906) $ 351,454 $ 7,858 $ (7,635) $ 326,058
FuturesThe Company’s Canadian operations are involved in trading bond futures contracts, which are agreements to buy or sell a standardized amountof an underlying Government of Canada bond, at a predetermined future date and price, in accordance with terms specified by a regulatedfutures exchange, and are subject to daily cash margining. The Company’s Canadian operations trade in bond futures in an attempt to mitigateinterest rate risk, yield curve risk and liquidity risk. At September 30, 2015, the notional amount of the bond futures contracts outstanding wasshort $4.7 million [March 31, 2015 − long $1.6 million].
The Company’s Canadian operations are also involved in trading US Treasury futures in an attempt to mitigate interest rate risk, yield curve riskand liquidity risk. At September 30, 2015, the notional amount of US Treasury futures contracts outstanding held in a short position was$9.1 million (US$6.8 million) [March 31, 2015 − $nil].
The fair value of all of the above futures contracts is nominal due to their short term to maturity. Realized and unrealized gains and lossesrelated to these contracts are recognized in net income during the reporting period.
SECURITIES LENDING AND BORROWING
Cash SecuritiesLoaned or
delivered ascollateral
Borrowed orreceived as
collateral
Loaned ordelivered as
collateral
Borrowed orreceived as
collateral
September 30, 2015 $ 108,434 $ 28,934 $ 27,783 $ 154,620
March 31, 2015 155,031 43,393 42,734 172,615
Securities lending and borrowing are included in the accounts receivable and accounts payable and accrued liabilities balances on thestatements of financial position.
NOTES TO UNAUDITED INTERIM CONDENSED CONSOLIDATED FINANCIAL STATEMENTS
CANACCORD GENUITY GROUP INC. SECOND QUARTER FISCAL 2016 39
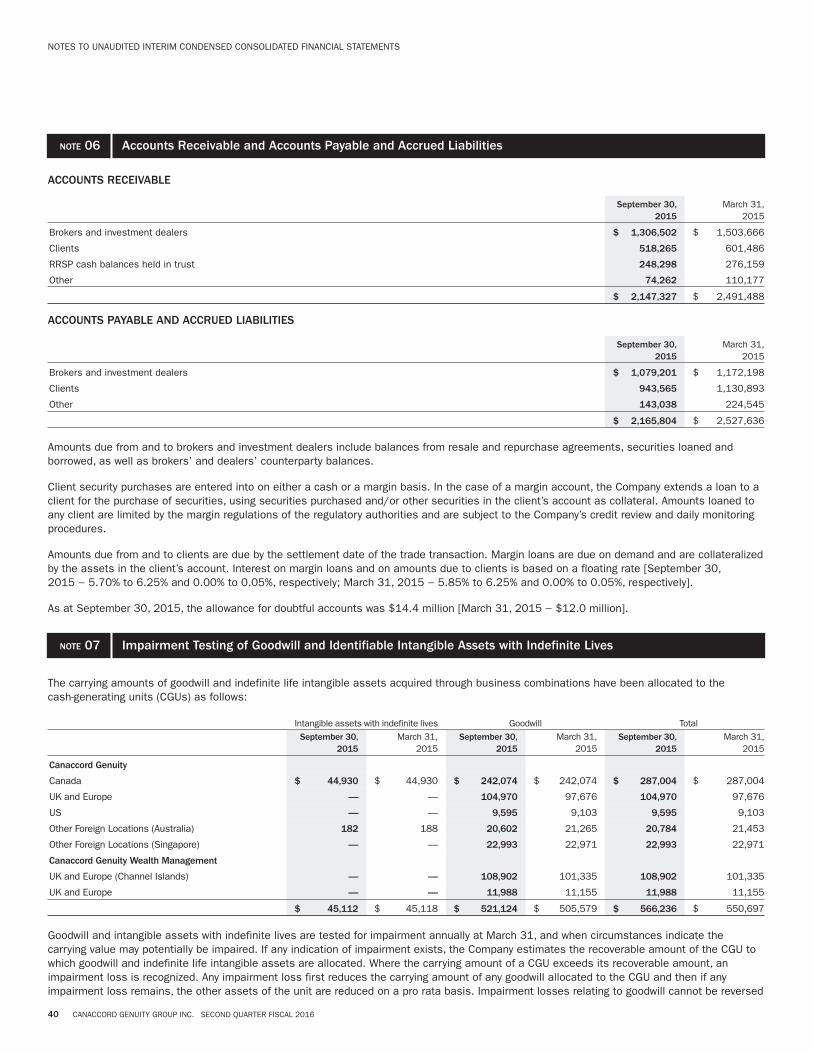
NOTE 06 Accounts Receivable and Accounts Payable and Accrued Liabilities
ACCOUNTS RECEIVABLE
September 30,2015
March 31,2015
Brokers and investment dealers $ 1,306,502 $ 1,503,666
Clients 518,265 601,486
RRSP cash balances held in trust 248,298 276,159
Other 74,262 110,177
$ 2,147,327 $ 2,491,488
ACCOUNTS PAYABLE AND ACCRUED LIABILITIES
September 30,2015
March 31,2015
Brokers and investment dealers $ 1,079,201 $ 1,172,198
Clients 943,565 1,130,893
Other 143,038 224,545
$ 2,165,804 $ 2,527,636
Amounts due from and to brokers and investment dealers include balances from resale and repurchase agreements, securities loaned andborrowed, as well as brokers’ and dealers’ counterparty balances.
Client security purchases are entered into on either a cash or a margin basis. In the case of a margin account, the Company extends a loan to aclient for the purchase of securities, using securities purchased and/or other securities in the client’s account as collateral. Amounts loaned toany client are limited by the margin regulations of the regulatory authorities and are subject to the Company’s credit review and daily monitoringprocedures.
Amounts due from and to clients are due by the settlement date of the trade transaction. Margin loans are due on demand and are collateralizedby the assets in the client’s account. Interest on margin loans and on amounts due to clients is based on a floating rate [September 30,2015 − 5.70% to 6.25% and 0.00% to 0.05%, respectively; March 31, 2015 − 5.85% to 6.25% and 0.00% to 0.05%, respectively].
As at September 30, 2015, the allowance for doubtful accounts was $14.4 million [March 31, 2015 − $12.0 million].
NOTE 07 Impairment Testing of Goodwill and Identifiable Intangible Assets with Indefinite Lives
The carrying amounts of goodwill and indefinite life intangible assets acquired through business combinations have been allocated to thecash-generating units (CGUs) as follows:
Intangible assets with indefinite lives Goodwill TotalSeptember 30,
2015March 31,
2015September 30,
2015March 31,
2015September 30,
2015March 31,
2015
Canaccord Genuity
Canada $ 44,930 $ 44,930 $ 242,074 $ 242,074 $ 287,004 $ 287,004
UK and Europe — — 104,970 97,676 104,970 97,676
US — — 9,595 9,103 9,595 9,103
Other Foreign Locations (Australia) 182 188 20,602 21,265 20,784 21,453
Other Foreign Locations (Singapore) — — 22,993 22,971 22,993 22,971
Canaccord Genuity Wealth Management
UK and Europe (Channel Islands) — — 108,902 101,335 108,902 101,335
UK and Europe — — 11,988 11,155 11,988 11,155
$ 45,112 $ 45,118 $ 521,124 $ 505,579 $ 566,236 $ 550,697
Goodwill and intangible assets with indefinite lives are tested for impairment annually at March 31, and when circumstances indicate thecarrying value may potentially be impaired. If any indication of impairment exists, the Company estimates the recoverable amount of the CGU towhich goodwill and indefinite life intangible assets are allocated. Where the carrying amount of a CGU exceeds its recoverable amount, animpairment loss is recognized. Any impairment loss first reduces the carrying amount of any goodwill allocated to the CGU and then if anyimpairment loss remains, the other assets of the unit are reduced on a pro rata basis. Impairment losses relating to goodwill cannot be reversed
NOTES TO UNAUDITED INTERIM CONDENSED CONSOLIDATED FINANCIAL STATEMENTS
40 CANACCORD GENUITY GROUP INC. SECOND QUARTER FISCAL 2016

in future periods. The Company considers the relationship between its market capitalization and the book value of its equity, among otherfactors, when reviewing for indicators of impairment. Consequently, interim goodwill impairment testing was carried out for all applicable CGUs atSeptember 30, 2015.
In accordance with IAS 36, ‘‘Impairment of Assets’’ (IAS 36), the recoverable amounts of the CGUs’ net assets have been determined using fairvalue less costs to sell (FVLCS) calculations, which are based on cash flow assumptions approved by senior management. There is a materialdegree of uncertainty with respect to the estimates of the recoverable amounts of the CGUs’ net assets given that these estimates involvemaking key assumptions about the future. In making such assumptions, management has used its best estimate of future economic and marketconditions within the context of the Company’s capital markets and wealth management activities. These valuations are categorized as Level 3 inthe fair value hierarchy.
The FVLCS calculations are based on assumptions, as described above, made in connection with future cash flows, terminal growth rates anddiscount rates. In order to estimate the FVLCS for each CGU, cash flows are forecast over a five-year period, a terminal growth rate is appliedand then such cash flows are discounted to their present value. The discount rate is based on the specific circumstances of each CGU and isderived from the estimated weighted average cost of capital of the Company. The discount rate utilized for each CGU for the purposes of thesecalculations was 12.5% in respect of Canada and the UK & Europe [March 31, 2015 − 12.5%], and 14.0% in respect of Australia, Singaporeand the US [March 31, 2015 − 14.0%]. Cash flow estimates for each CGU are based on management assumptions as described above andutilize five-year compound annual revenue growth rates ranging from 5.0% to 10.0% [March 31, 2015 − 5.0 to 10.0%] as well as estimates inrespect of operating margins. The compound annual revenue growth rates utilized were: (a) Canaccord Genuity (i) Canada − 10.0%, (ii) UK &Europe − 10.0%, (iii) US − 10.0%, (iv) Other Foreign Locations − 9.1% to 9.4%; and (b) Canaccord Genuity Wealth Management UK &Europe − 5.0%. The terminal growth rate used for CGUs located in Canada and the UK & Europe was 2.5% [March 31, 2015 − 2.5%] and forCGUs located in all other locations was 3.0% [March 31, 2015 − 3.0%].
Sensitivity testing was conducted as part of the September 30, 2015 interim impairment test of goodwill and indefinite life intangible assets.The sensitivity testing includes assessing the impact that reasonably possible declines in revenue estimates for the 12 month period ending onSeptember 30, 2016 and declines in growth rates after that period and increases in the discount rates would have on the recoverable amountsof the CGUs, with other assumptions being held constant.
The Company’s interim impairment testing has determined that any reasonably possible adverse change in the key assumptions in respect of theCGUs listed below may cause an impairment loss to be recognized. Reasonably possible declines in the growth rates utilized for the five yearperiod beginning on October 1, 2015, decreases in the revenue estimates for the 12 month period ending on September 30, 2016, decreases inthe annual improvement in operating margins, or increases in the discount rates would cause the estimated recoverable amount to be equal tothe carrying value and consequently an impairment loss to be recognized. The extent of any such impairment loss would be determined afterincorporating any consequential effects of that change on estimated operating income and on other factors.
Change in assumption required for carrying value to equalthe estimated recoverable amount
CGU
Excess of theestimated
recoverableamount over
carrying value
Increase indiscount rate
(p.p)
Decrease infive-year
CAGR(p.p)
Decrease inestimated revenue
for the 12 monthperiod ending on
September 30,2016
Decrease inannual
improvement inoperatingmargins
(p.p)
Canaccord Genuity − Canada $45,000 1.3 3.8 12,000 0.8
Canaccord Genuity − UK & Europe $ 9,000 0.4 1.0 2,500 0.2
Canaccord Genuity − US $ 5,000 0.5 2.4 3,000 0.1
Other Foreign Locations − Australia $ 7,000 1.3 3.1 2,500 0.6
Other Foreign Locations − Singapore $ 4,000 1.5 3.4 700 1.4
pp: percentage points
NOTES TO UNAUDITED INTERIM CONDENSED CONSOLIDATED FINANCIAL STATEMENTS
CANACCORD GENUITY GROUP INC. SECOND QUARTER FISCAL 2016 41
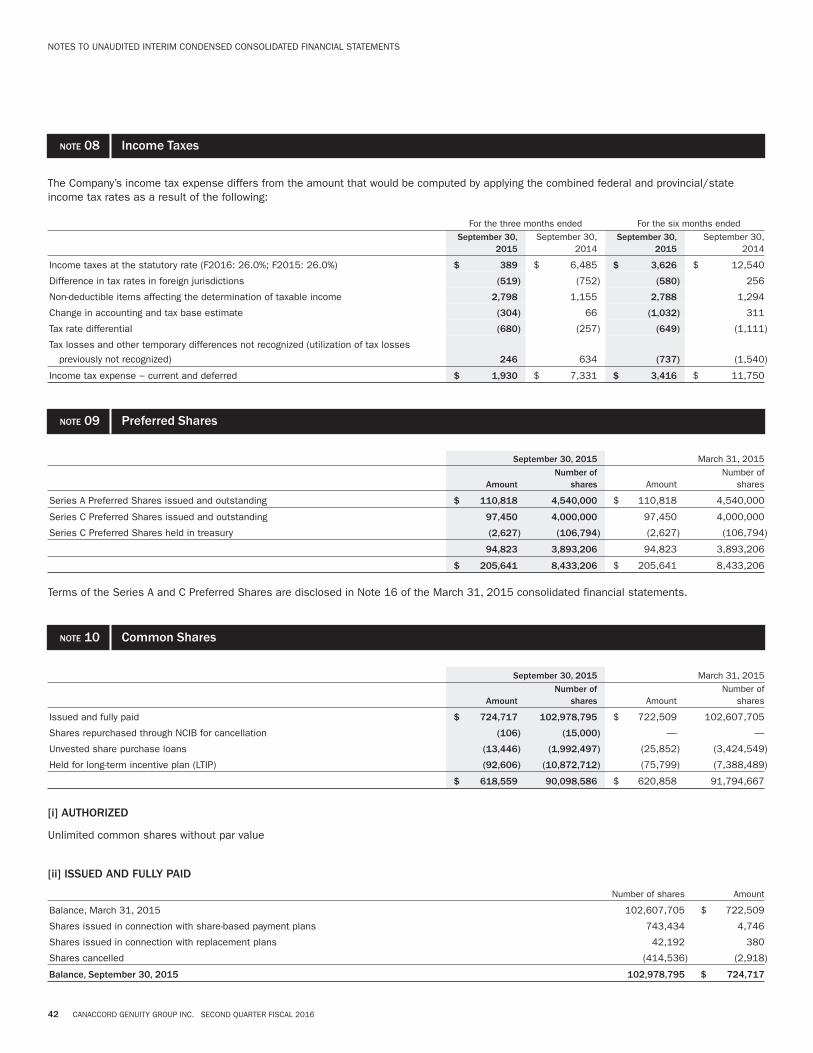
NOTE 08 Income Taxes
The Company’s income tax expense differs from the amount that would be computed by applying the combined federal and provincial/stateincome tax rates as a result of the following:
For the three months ended For the six months endedSeptember 30,
2015September 30,
2014September 30,
2015September 30,
2014
Income taxes at the statutory rate (F2016: 26.0%; F2015: 26.0%) $ 389 $ 6,485 $ 3,626 $ 12,540
Difference in tax rates in foreign jurisdictions (519) (752) (580) 256
Non-deductible items affecting the determination of taxable income 2,798 1,155 2,788 1,294
Change in accounting and tax base estimate (304) 66 (1,032) 311
Tax rate differential (680) (257) (649) (1,111)
Tax losses and other temporary differences not recognized (utilization of tax losses
previously not recognized) 246 634 (737) (1,540)
Income tax expense − current and deferred $ 1,930 $ 7,331 $ 3,416 $ 11,750
NOTE 09 Preferred Shares
September 30, 2015 March 31, 2015
AmountNumber of
shares AmountNumber of
shares
Series A Preferred Shares issued and outstanding $ 110,818 4,540,000 $ 110,818 4,540,000
Series C Preferred Shares issued and outstanding 97,450 4,000,000 97,450 4,000,000
Series C Preferred Shares held in treasury (2,627) (106,794) (2,627) (106,794)
94,823 3,893,206 94,823 3,893,206
$ 205,641 8,433,206 $ 205,641 8,433,206
Terms of the Series A and C Preferred Shares are disclosed in Note 16 of the March 31, 2015 consolidated financial statements.
NOTE 10 Common Shares
September 30, 2015 March 31, 2015
AmountNumber of
shares AmountNumber of
shares
Issued and fully paid $ 724,717 102,978,795 $ 722,509 102,607,705
Shares repurchased through NCIB for cancellation (106) (15,000) — —
Unvested share purchase loans (13,446) (1,992,497) (25,852) (3,424,549)
Held for long-term incentive plan (LTIP) (92,606) (10,872,712) (75,799) (7,388,489)
$ 618,559 90,098,586 $ 620,858 91,794,667
[i] AUTHORIZED
Unlimited common shares without par value
[ii] ISSUED AND FULLY PAID
Number of shares Amount
Balance, March 31, 2015 102,607,705 $ 722,509
Shares issued in connection with share-based payment plans 743,434 4,746
Shares issued in connection with replacement plans 42,192 380
Shares cancelled (414,536) (2,918)
Balance, September 30, 2015 102,978,795 $ 724,717
NOTES TO UNAUDITED INTERIM CONDENSED CONSOLIDATED FINANCIAL STATEMENTS
42 CANACCORD GENUITY GROUP INC. SECOND QUARTER FISCAL 2016

On August 4, 2015, the Company filed a notice to renew the normal course issuer bid (NCIB) to provide the Company with the choice to purchaseup to a maximum of 5,163,737 of its common shares during the period from August 13, 2015 to August 12, 2016 through the facilities of theTSX and on alternative trading systems in accordance with the requirements of the TSX. The purpose of the purchase of common shares underthe NCIB is to enable the Company to acquire shares for cancellation. The maximum number of shares that may be purchased under the currentNCIB represents 5.0% of the Company’s outstanding common shares at the time of the notice. A total of 375,050 shares have been purchasedthrough the NCIB between April 1, 2015 and September 30, 2015, of which 15,000 shares were held in treasury on September 30, 2015 untilsubsequently cancelled on October 30, 2015.
[iii] (LOSS) EARNINGS PER COMMON SHARE
For the three months ended For the six months endedSeptember 30,
2015September 30,
2014September 30,
2015September 30,
2014
Basic (loss) earnings per common share
Net (loss) income attributable to CGGI shareholders $ (105) $ 17,109 $ 10,309 $ 35,190
Preferred shares dividends (2,998) (2,921) (5,996) (5,919)
Net (loss) income available to common shareholders (3,103) 14,188 4,313 29,271
Weighted average number of common shares (number) 91,465,410 91,070,283 92,070,815 91,943,163
Basic (loss) earnings per share $ (0.03) $ 0.16 $ 0.05 $ 0.32
Diluted (loss) earnings per common share
Net (loss) income available to common shareholders (3,103) 14,188 4,313 29,271
Weighted average number of common shares (number) n/a 91,070,283 92,070,815 91,943,163
Dilutive effect in connection with LTIP (number) n/a 6,106,721 4,433,271 5,461,713
Dilutive effect in connection with other share-based payment plans (number) n/a 3,881,612 727,973 3,585,810
Adjusted weighted average number of common shares (number) n/a 101,058,616 97,232,059 100,990,686
Diluted (loss) earnings per common share $ (0.03) $ 0.14 $ 0.04 $ 0.29
NOTE 11 Dividends
COMMON SHARES DIVIDENDS
The Company declared the following common shares dividends during the six months ended September 30, 2015:
Record date Payment dateCash dividend per
common shareTotal common
dividend amount
August 28, 2015 September 10, 2015 $ 0.05 $ 5,165
June 19, 2015 July 2, 2015 $ 0.05 $ 5,163
On November 4, 2015, the Board of Directors approved a quarterly cash dividend of $0.05 per common share payable on December 10, 2015 tocommon shareholders of record as at November 20, 2015 [Note 15].
PREFERRED SHARES DIVIDENDS
The Company declared the following preferred shares dividends during the six months ended September 30, 2015:
Record date Payment date
Cash dividendper Series A
Preferred Share
Cash dividendper Series C
Preferred ShareTotal preferred
dividend amount
September 18, 2015 September 30, 2015 $ 0.34375 $ 0.359375 $ 2,998
June 19, 2015 June 30, 2015 $ 0.34375 $ 0.359375 $ 2,999
On November 4, 2015, the Board also approved a cash dividend of $0.34375 per Series A Preferred Share payable on December 31, 2015 toSeries A Preferred shareholders of record as at December 18, 2015 [Note 15].
On November 4, 2015, the Board also approved a cash dividend of $0.359375 per Series C Preferred Share payable on December 31, 2015 toSeries C Preferred shareholders of record as at December 18, 2015 [Note 15].
NOTES TO UNAUDITED INTERIM CONDENSED CONSOLIDATED FINANCIAL STATEMENTS
CANACCORD GENUITY GROUP INC. SECOND QUARTER FISCAL 2016 43

NOTE 12 Share-Based Payment Plans
a. LONG-TERM INCENTIVE PLAN
Under the long-term incentive plan (LTIP), eligible participants are awarded restricted share units (RSUs), which generally vest over three years.Employee benefit trusts (the Trusts) have also been established in Canada, the United States and the United Kingdom. The Company or certainof its subsidiaries, as the case may be, fund the Trusts with cash which is used by the trustees to purchase common shares on the open marketthat will be held in the Trusts until the RSUs vest. The Company also has the option to issue common shares from treasury to plan participantsfollowing vesting of the RSUs.
The fair value of the RSUs at the measurement date is based on the purchase price of the shares by the Trusts on the open market and isamortized on a graded basis over the vesting period of generally three years. The weighted average fair value of RSUs granted during the sixmonth period ended September 30, 2015 was $7.14 [September 30, 2014 − $11.76].
Number
Awards outstanding, March 31, 2015 10,746,218
Grants 4,909,224
Vested (3,031,882)
Forfeited (513,584)
Awards outstanding, September 30, 2015 12,109,976
Number
Common shares held by the Trusts, March 31, 2015 7,388,489
Acquired 5,757,712
Released on vesting (2,273,489)
Common shares held by the Trusts, September 30, 2015 10,872,712
b. SHARE-BASED COMPENSATION EXPENSE
For the three months ended For the six months endedSeptember 30,
2015September 30,
2014September 30,
2015September 30,
2014
Long-term incentive plan $ 5,271 $ 8,819 $ 15,554 $ 17,496
Forgivable common share purchase loans 1,488 2,911 3,009 5,312
CSH Inducement Plan 1,087 625 2,273 1,960
Deferred share units (cash-settled) (364) (155) (281) 382
Other (106) 333 (397) 773
Total share-based compensation expense $ 7,376 $ 12,533 $ 20,158 $ 25,923
Effective October 1, 2015, the Company appointed a new CEO. As part of the related total compensation arrangement, a total grant of 1.5 millionRSUs was made. These RSUs will vest in equal increments over five years. A similar grant of 425,000 RSUs was made in relation to theappointment of the new Senior Executive Vice President. The amortization of these RSUs will commence on October 1, 2015, being the effectivedate of the apointment of these two positions.
NOTE 13 Related Party Transactions
Security trades executed by the Company for officers and directors are transacted in accordance with the terms and conditions applicable to allclients. Commission income on such transactions in the aggregate is not material in relation to the overall operations of the Company.
Accounts receivable and accounts payable and accrued liabilities include the following balances with key management personnel:
September 30,2015
March 31,2015
Accounts receivable $ 1,015 $ —
Accounts payable and accrued liabilities $ 679 $ 1,041
NOTES TO UNAUDITED INTERIM CONDENSED CONSOLIDATED FINANCIAL STATEMENTS
44 CANACCORD GENUITY GROUP INC. SECOND QUARTER FISCAL 2016

NOTE 14 Segmented Information
The Company operates in two industry segments as follows:
Canaccord Genuity − includes investment banking, research and trading activities on behalf of corporate, institutional and government clientsas well as principal trading activities in Canada, the UK and Europe and the US. Operations located in Other Foreign Locations underCanaccord Genuity (Barbados) Ltd., Canaccord Genuity Asia and the 50% interest in Canaccord Genuity Australia are also included inCanaccord Genuity.
Canaccord Genuity Wealth Management − provides brokerage services and investment advice to retail or institutional clients in Canada, theUS, and the UK and Europe.
Corporate and Other includes correspondent brokerage services, interest and foreign exchange revenue and expenses not specifically allocableto Canaccord Genuity or Canaccord Genuity Wealth Management.
The Company’s industry segments are managed separately because each business offers different services and requires different personnel andmarketing strategies. The Company evaluates the performance of each business based on operating results, without regard to non-controllinginterests.
The Company does not allocate total assets, liabilities or equipment and leasehold improvements to the segments. Amortization of tangibleassets is allocated to the segments based on the square footage occupied. Amortization of identifiable intangible assets is allocated to theCanaccord Genuity segment, as it relates to the acquisitions of Genuity and the 50% interest in Canaccord Genuity Australia. Amortization of theidentifiable intangible assets acquired through the purchase of Collins Stewart Hawkpoint plc (CSHP) is allocated to Canaccord Genuity andCanaccord Genuity Wealth Management segments in the UK and Europe (Channel Islands). Amortization of identifiable intangible assetsacquired through the acquisition of Eden Financial Ltd. is allocated to Canaccord Genuity Wealth Management segments in the UK and Europe(Eden Financial Ltd.). There are no significant intersegment revenues. Income taxes are managed on a Company basis and are not allocated tooperating segments. All revenue and operating profit is derived from external customers. The Company also does not allocate cash flows byreportable segments.
For the three months endedSeptember 30, 2015 September 30, 2014
CanaccordGenuity
CanaccordGenuity Wealth
Management
Corporateand
Other TotalCanaccord
Genuity
CanaccordGenuity Wealth
Management
Corporateand
Other Total
Revenues, excluding interest revenue $ 125,807 $ 57,305 $ 3,156 $ 186,268 $ 168,809 $ 58,643 $ 2,917 $ 230,369
Interest revenue 704 2,889 741 4,334 1,806 2,780 1,316 5,902
Expenses, excluding undernoted 117,122 47,026 12,262 176,410 134,101 49,635 13,513 197,249
Amortization 3,579 2,597 277 6,453 3,995 3,036 444 7,475
Development costs 1,587 1,998 363 3,948 1,356 1,932 337 3,625
Interest expense 1,883 53 356 2,292 2,507 187 283 2,977
Restructuring costs — — — —
Income (loss) before intersegment
allocations and income taxes 2,340 8,520 (9,361) 1,499 28,656 6,633 (10,344) 24,945
Intersegment allocations 4,114 5,771 (9,885) — 3,392 5,975 (9,367) —
Income (loss) before income taxes $ (1,774) $ 2,749 $ 524 $ 1,499 $ 25,264 $ 658 $ (977) $ 24,945
NOTES TO UNAUDITED INTERIM CONDENSED CONSOLIDATED FINANCIAL STATEMENTS
CANACCORD GENUITY GROUP INC. SECOND QUARTER FISCAL 2016 45
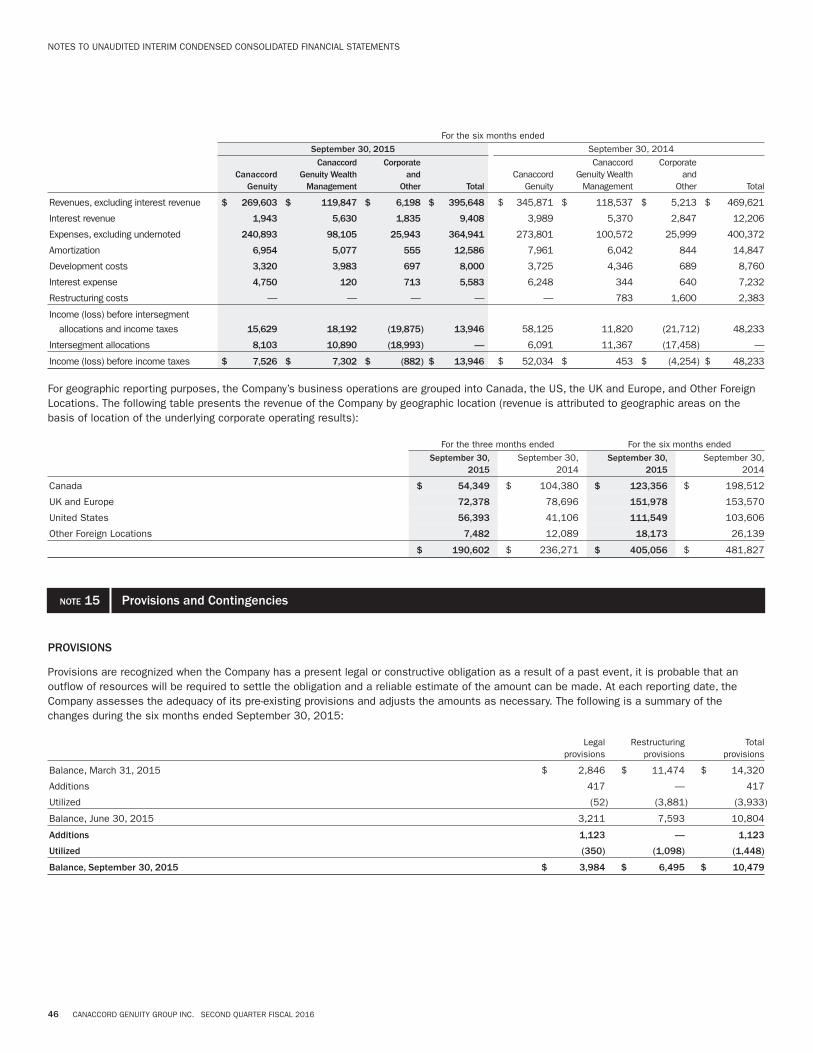
For the six months endedSeptember 30, 2015 September 30, 2014
CanaccordGenuity
CanaccordGenuity Wealth
Management
Corporateand
Other TotalCanaccord
Genuity
CanaccordGenuity Wealth
Management
Corporateand
Other Total
Revenues, excluding interest revenue $ 269,603 $ 119,847 $ 6,198 $ 395,648 $ 345,871 $ 118,537 $ 5,213 $ 469,621
Interest revenue 1,943 5,630 1,835 9,408 3,989 5,370 2,847 12,206
Expenses, excluding undernoted 240,893 98,105 25,943 364,941 273,801 100,572 25,999 400,372
Amortization 6,954 5,077 555 12,586 7,961 6,042 844 14,847
Development costs 3,320 3,983 697 8,000 3,725 4,346 689 8,760
Interest expense 4,750 120 713 5,583 6,248 344 640 7,232
Restructuring costs — — — — — 783 1,600 2,383
Income (loss) before intersegment
allocations and income taxes 15,629 18,192 (19,875) 13,946 58,125 11,820 (21,712) 48,233
Intersegment allocations 8,103 10,890 (18,993) — 6,091 11,367 (17,458) —
Income (loss) before income taxes $ 7,526 $ 7,302 $ (882) $ 13,946 $ 52,034 $ 453 $ (4,254) $ 48,233
For geographic reporting purposes, the Company’s business operations are grouped into Canada, the US, the UK and Europe, and Other ForeignLocations. The following table presents the revenue of the Company by geographic location (revenue is attributed to geographic areas on thebasis of location of the underlying corporate operating results):
For the three months ended For the six months endedSeptember 30,
2015September 30,
2014September 30,
2015September 30,
2014
Canada $ 54,349 $ 104,380 $ 123,356 $ 198,512
UK and Europe 72,378 78,696 151,978 153,570
United States 56,393 41,106 111,549 103,606
Other Foreign Locations 7,482 12,089 18,173 26,139
$ 190,602 $ 236,271 $ 405,056 $ 481,827
NOTE 15 Provisions and Contingencies
PROVISIONS
Provisions are recognized when the Company has a present legal or constructive obligation as a result of a past event, it is probable that anoutflow of resources will be required to settle the obligation and a reliable estimate of the amount can be made. At each reporting date, theCompany assesses the adequacy of its pre-existing provisions and adjusts the amounts as necessary. The following is a summary of thechanges during the six months ended September 30, 2015:
Legalprovisions
Restructuringprovisions
Totalprovisions
Balance, March 31, 2015 $ 2,846 $ 11,474 $ 14,320
Additions 417 — 417
Utilized (52) (3,881) (3,933)
Balance, June 30, 2015 3,211 7,593 10,804
Additions 1,123 — 1,123
Utilized (350) (1,098) (1,448)
Balance, September 30, 2015 $ 3,984 $ 6,495 $ 10,479
NOTES TO UNAUDITED INTERIM CONDENSED CONSOLIDATED FINANCIAL STATEMENTS
46 CANACCORD GENUITY GROUP INC. SECOND QUARTER FISCAL 2016
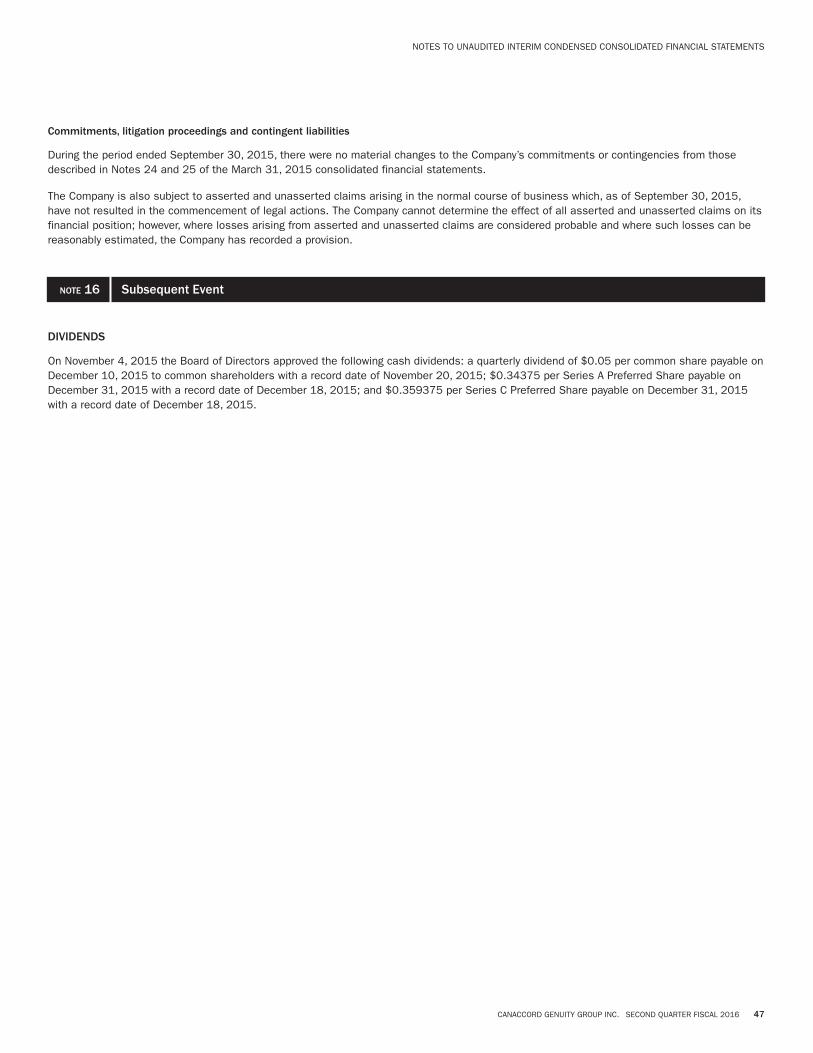
Commitments, litigation proceedings and contingent liabilities
During the period ended September 30, 2015, there were no material changes to the Company’s commitments or contingencies from thosedescribed in Notes 24 and 25 of the March 31, 2015 consolidated financial statements.
The Company is also subject to asserted and unasserted claims arising in the normal course of business which, as of September 30, 2015,have not resulted in the commencement of legal actions. The Company cannot determine the effect of all asserted and unasserted claims on itsfinancial position; however, where losses arising from asserted and unasserted claims are considered probable and where such losses can bereasonably estimated, the Company has recorded a provision.
NOTE 16 Subsequent Event
DIVIDENDS
On November 4, 2015 the Board of Directors approved the following cash dividends: a quarterly dividend of $0.05 per common share payable onDecember 10, 2015 to common shareholders with a record date of November 20, 2015; $0.34375 per Series A Preferred Share payable onDecember 31, 2015 with a record date of December 18, 2015; and $0.359375 per Series C Preferred Share payable on December 31, 2015with a record date of December 18, 2015.
NOTES TO UNAUDITED INTERIM CONDENSED CONSOLIDATED FINANCIAL STATEMENTS
CANACCORD GENUITY GROUP INC. SECOND QUARTER FISCAL 2016 47
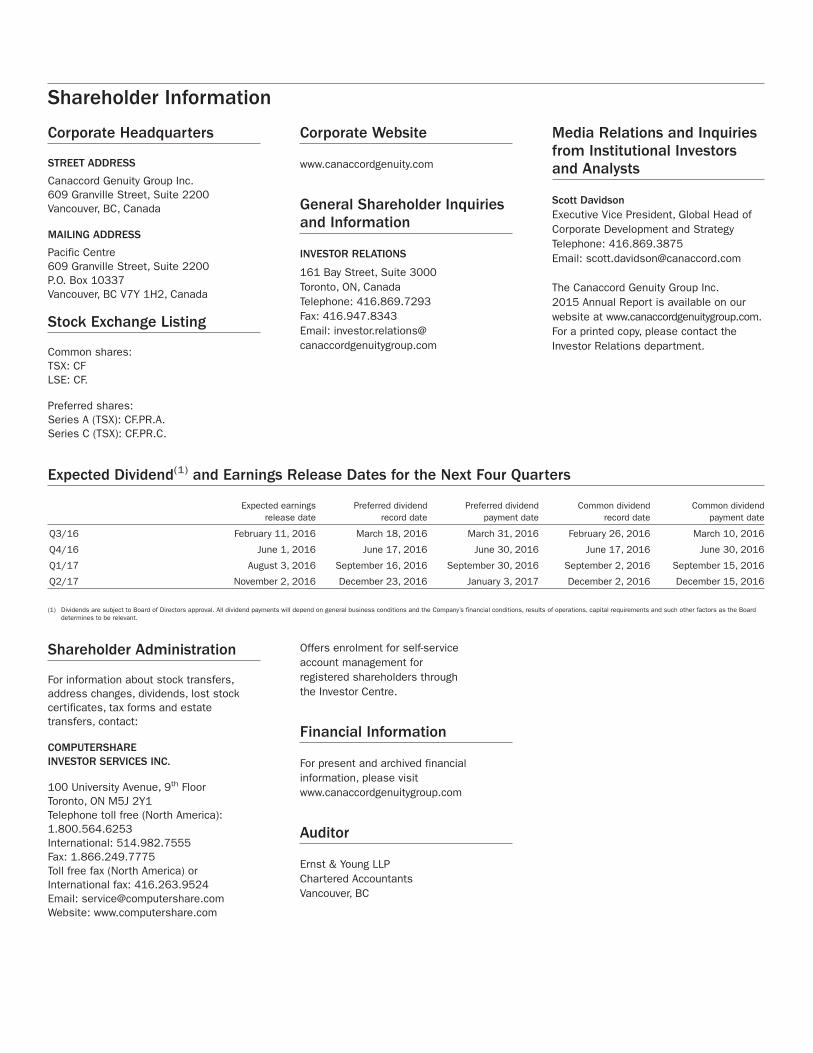
Shareholder Information
Corporate Headquarters
STREET ADDRESS
Canaccord Genuity Group Inc.609 Granville Street, Suite 2200Vancouver, BC, Canada
MAILING ADDRESS
Pacific Centre609 Granville Street, Suite 2200P.O. Box 10337Vancouver, BC V7Y 1H2, Canada
Stock Exchange Listing
Common shares:TSX: CFLSE: CF.
Preferred shares:Series A (TSX): CF.PR.A.Series C (TSX): CF.PR.C.
Corporate Website
www.canaccordgenuity.com
General Shareholder Inquiriesand Information
INVESTOR RELATIONS
161 Bay Street, Suite 3000Toronto, ON, CanadaTelephone: 416.869.7293Fax: 416.947.8343Email: [email protected]
Media Relations and Inquiriesfrom Institutional Investorsand Analysts
Scott DavidsonExecutive Vice President, Global Head ofCorporate Development and StrategyTelephone: 416.869.3875Email: [email protected]
The Canaccord Genuity Group Inc.2015 Annual Report is available on ourwebsite at www.canaccordgenuitygroup.com.For a printed copy, please contact theInvestor Relations department.
Expected Dividend(1) and Earnings Release Dates for the Next Four Quarters
Expected earningsrelease date
Preferred dividendrecord date
Preferred dividendpayment date
Common dividendrecord date
Common dividendpayment date
Q3/16 February 11, 2016 March 18, 2016 March 31, 2016 February 26, 2016 March 10, 2016
Q4/16 June 1, 2016 June 17, 2016 June 30, 2016 June 17, 2016 June 30, 2016
Q1/17 August 3, 2016 September 16, 2016 September 30, 2016 September 2, 2016 September 15, 2016
Q2/17 November 2, 2016 December 23, 2016 January 3, 2017 December 2, 2016 December 15, 2016
(1) Dividends are subject to Board of Directors approval. All dividend payments will depend on general business conditions and the Company’s financial conditions, results of operations, capital requirements and such other factors as the Boarddetermines to be relevant.
Shareholder Administration
For information about stock transfers,address changes, dividends, lost stockcertificates, tax forms and estatetransfers, contact:
COMPUTERSHAREINVESTOR SERVICES INC.
100 University Avenue, 9th FloorToronto, ON M5J 2Y1Telephone toll free (North America):1.800.564.6253International: 514.982.7555Fax: 1.866.249.7775Toll free fax (North America) orInternational fax: 416.263.9524Email: [email protected]: www.computershare.com
Offers enrolment for self-serviceaccount management forregistered shareholders throughthe Investor Centre.
Financial Information
For present and archived financialinformation, please visitwww.canaccordgenuitygroup.com
Auditor
Ernst & Young LLPChartered AccountantsVancouver, BC