HFpEF Meta-analysis Sup mat SZ Ver7
29
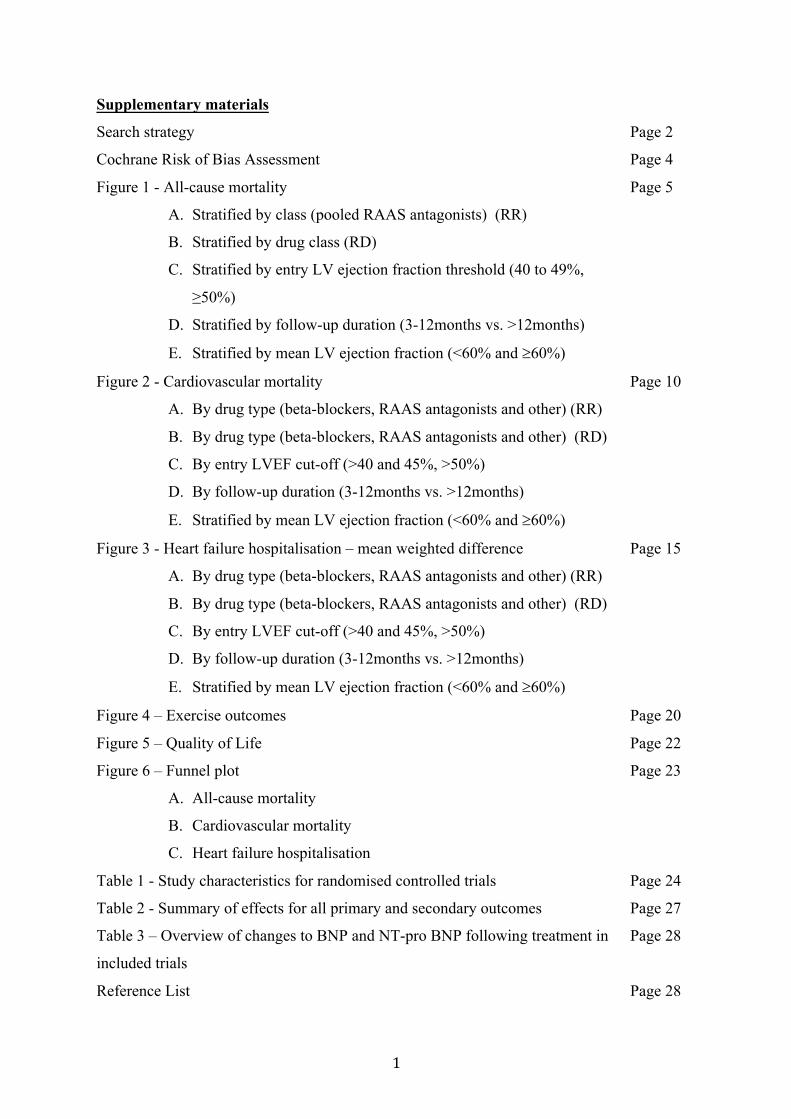
1 Supplementary materials Search strategy Cochrane Risk of Bias Assessment Page 2 Page 4 Figure 1 - All-cause mortality A. Stratified by class (pooled RAAS antagonists) (RR) B. Stratified by drug class (RD) C. Stratified by entry LV ejection fraction threshold (40 to 49%, ≥50%) D. Stratified by follow-up duration (3-12months vs. >12months) E. Stratified by mean LV ejection fraction (<60% and ³60%) Page 5 Figure 2 - Cardiovascular mortality A. By drug type (beta-blockers, RAAS antagonists and other) (RR) B. By drug type (beta-blockers, RAAS antagonists and other) (RD) C. By entry LVEF cut-off (>40 and 45%, >50%) D. By follow-up duration (3-12months vs. >12months) E. Stratified by mean LV ejection fraction (<60% and ³60%) Page 10 Figure 3 - Heart failure hospitalisation – mean weighted difference A. By drug type (beta-blockers, RAAS antagonists and other) (RR) B. By drug type (beta-blockers, RAAS antagonists and other) (RD) C. By entry LVEF cut-off (>40 and 45%, >50%) D. By follow-up duration (3-12months vs. >12months) E. Stratified by mean LV ejection fraction (<60% and ³60%) Page 15 Figure 4 – Exercise outcomes Figure 5 – Quality of Life Figure 6 – Funnel plot A. All-cause mortality B. Cardiovascular mortality C. Heart failure hospitalisation Page 20 Page 22 Page 23 Table 1 - Study characteristics for randomised controlled trials Page 24 Table 2 - Summary of effects for all primary and secondary outcomes Page 27 Table 3 – Overview of changes to BNP and NT-pro BNP following treatment in included trials Reference List Page 28 Page 28
Transcript of HFpEF Meta-analysis Sup mat SZ Ver7
1
Supplementary materials
Search strategy
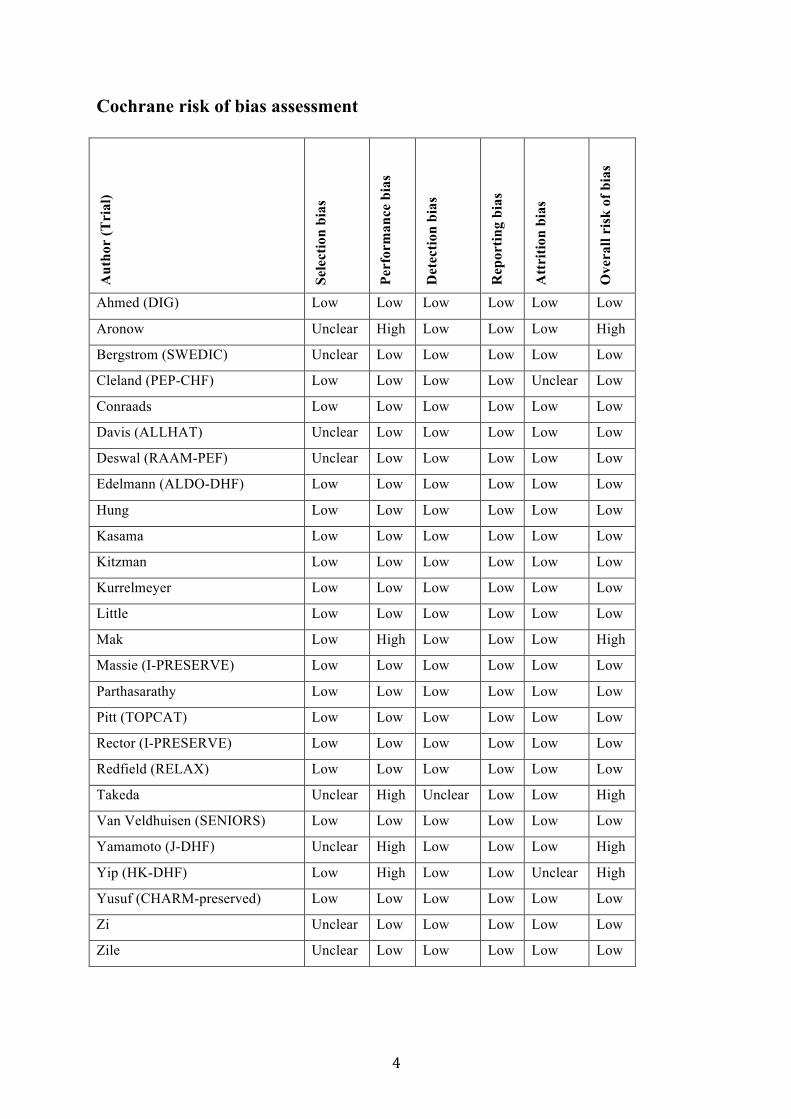
Cochrane Risk of Bias Assessment
Page 2
Page 4
Figure 1 - All-cause mortality
A. Stratified by class (pooled RAAS antagonists) (RR)
B. Stratified by drug class (RD)
C. Stratified by entry LV ejection fraction threshold (40 to 49%,
≥50%)
D. Stratified by follow-up duration (3-12months vs. >12months)
E. Stratified by mean LV ejection fraction (<60% and ³60%)
Page 5
Figure 2 - Cardiovascular mortality
A. By drug type (beta-blockers, RAAS antagonists and other) (RR)
B. By drug type (beta-blockers, RAAS antagonists and other) (RD)
C. By entry LVEF cut-off (>40 and 45%, >50%)
D. By follow-up duration (3-12months vs. >12months)
E. Stratified by mean LV ejection fraction (<60% and ³60%)
Page 10
Figure 3 - Heart failure hospitalisation – mean weighted difference
A. By drug type (beta-blockers, RAAS antagonists and other) (RR)
B. By drug type (beta-blockers, RAAS antagonists and other) (RD)
C. By entry LVEF cut-off (>40 and 45%, >50%)
D. By follow-up duration (3-12months vs. >12months)
E. Stratified by mean LV ejection fraction (<60% and ³60%)
Page 15
Figure 4 – Exercise outcomes
Figure 5 – Quality of Life
Figure 6 – Funnel plot
A. All-cause mortality
B. Cardiovascular mortality
C. Heart failure hospitalisation
Page 20
Page 22
Page 23
Table 1 - Study characteristics for randomised controlled trials Page 24
Table 2 - Summary of effects for all primary and secondary outcomes Page 27
Table 3 – Overview of changes to BNP and NT-pro BNP following treatment in
included trials
Reference List
Page 28
Page 28
2
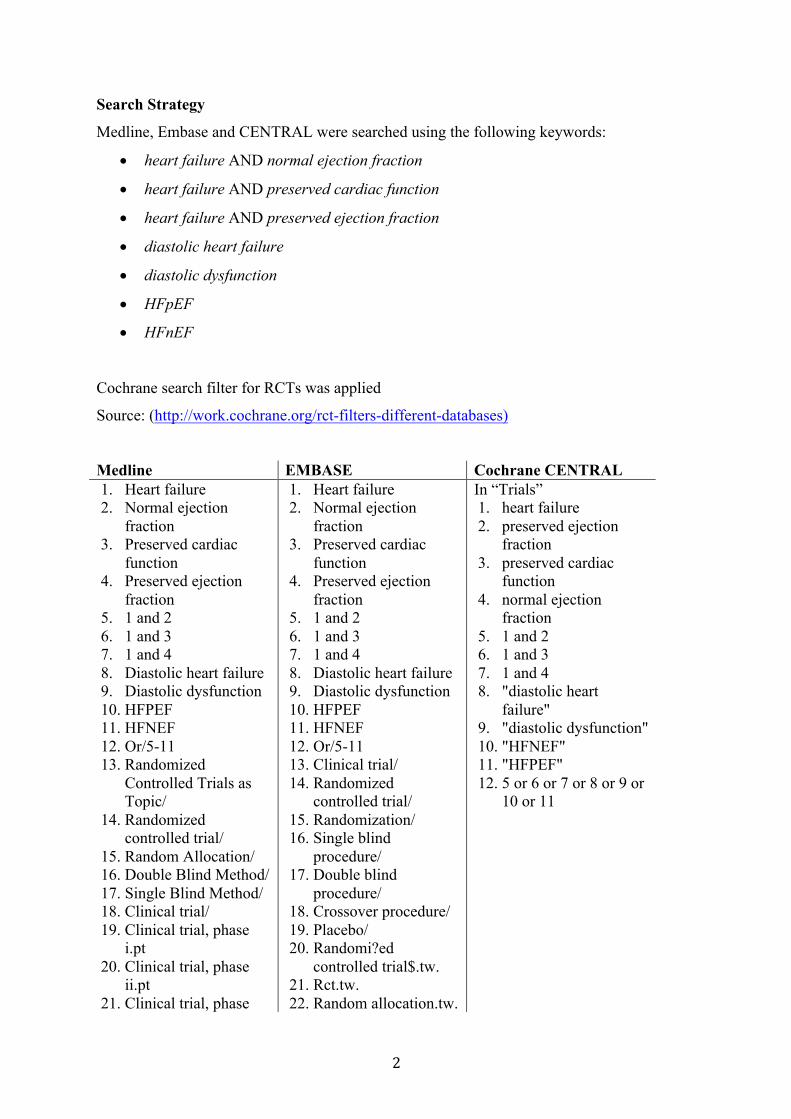
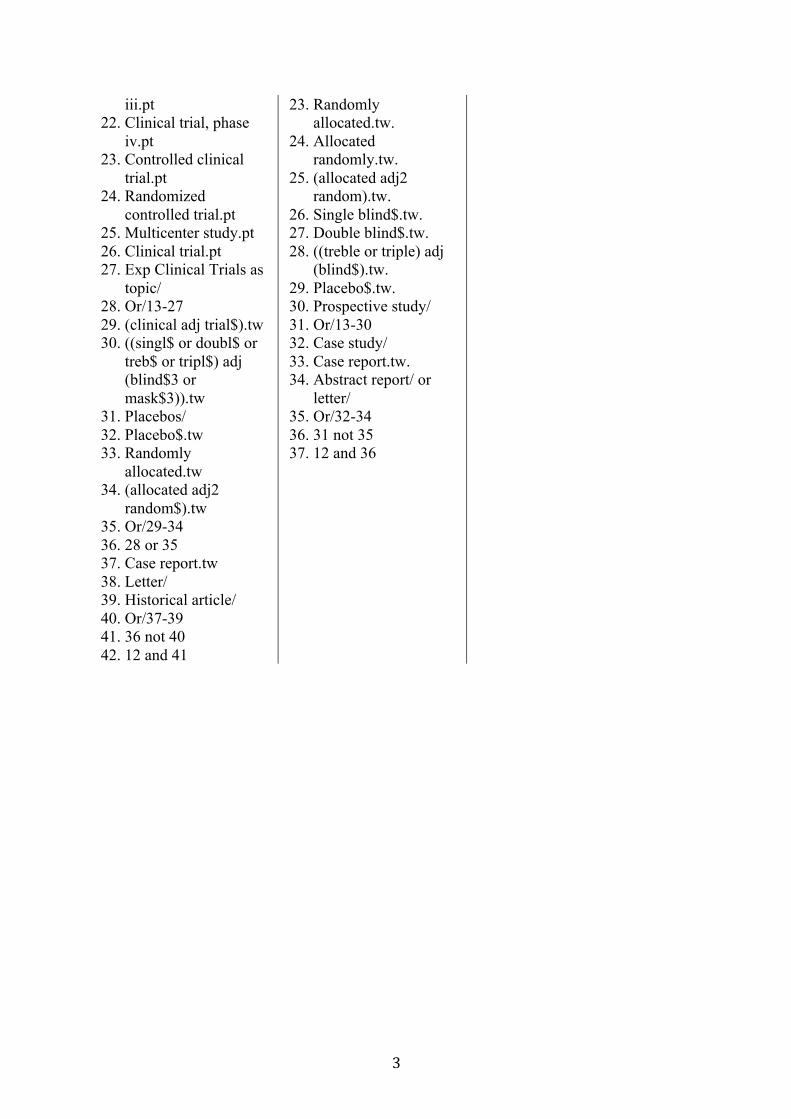
Search Strategy
Medline, Embase and CENTRAL were searched using the following keywords:
• heart failure AND normal ejection fraction
• heart failure AND preserved cardiac function
• heart failure AND preserved ejection fraction
• diastolic heart failure
• diastolic dysfunction
• HFpEF
• HFnEF
Cochrane search filter for RCTs was applied
Source: (http://work.cochrane.org/rct-filters-different-databases)
Medline EMBASE Cochrane CENTRAL 1. Heart failure 2. Normal ejection
fraction 3. Preserved cardiac
function 4. Preserved ejection
fraction 5. 1 and 2 6. 1 and 3 7. 1 and 4 8. Diastolic heart failure 9. Diastolic dysfunction 10. HFPEF 11. HFNEF 12. Or/5-11 13. Randomized
Controlled Trials as Topic/
14. Randomized controlled trial/
15. Random Allocation/ 16. Double Blind Method/ 17. Single Blind Method/ 18. Clinical trial/ 19. Clinical trial, phase
i.pt 20. Clinical trial, phase
ii.pt 21. Clinical trial, phase
1. Heart failure 2. Normal ejection
fraction 3. Preserved cardiac
function 4. Preserved ejection
fraction 5. 1 and 2 6. 1 and 3 7. 1 and 4 8. Diastolic heart failure 9. Diastolic dysfunction 10. HFPEF 11. HFNEF 12. Or/5-11 13. Clinical trial/ 14. Randomized
controlled trial/ 15. Randomization/ 16. Single blind
procedure/ 17. Double blind
procedure/ 18. Crossover procedure/ 19. Placebo/ 20. Randomi?ed
controlled trial$.tw. 21. Rct.tw. 22. Random allocation.tw.
In “Trials” 1. heart failure 2. preserved ejection
fraction 3. preserved cardiac
function 4. normal ejection
fraction 5. 1 and 2 6. 1 and 3 7. 1 and 4 8. "diastolic heart
failure" 9. "diastolic dysfunction" 10. "HFNEF" 11. "HFPEF" 12. 5 or 6 or 7 or 8 or 9 or
10 or 11
3
iii.pt 22. Clinical trial, phase
iv.pt 23. Controlled clinical
trial.pt 24. Randomized
controlled trial.pt 25. Multicenter study.pt 26. Clinical trial.pt 27. Exp Clinical Trials as
topic/ 28. Or/13-27 29. (clinical adj trial$).tw 30. ((singl$ or doubl$ or
treb$ or tripl$) adj (blind$3 or mask$3)).tw
31. Placebos/ 32. Placebo$.tw 33. Randomly
allocated.tw 34. (allocated adj2
random$).tw 35. Or/29-34 36. 28 or 35 37. Case report.tw 38. Letter/ 39. Historical article/ 40. Or/37-39 41. 36 not 40 42. 12 and 41
23. Randomly allocated.tw.
24. Allocated randomly.tw.
25. (allocated adj2 random).tw.
26. Single blind$.tw. 27. Double blind$.tw. 28. ((treble or triple) adj
(blind$).tw. 29. Placebo$.tw. 30. Prospective study/ 31. Or/13-30 32. Case study/ 33. Case report.tw. 34. Abstract report/ or
letter/ 35. Or/32-34 36. 31 not 35 37. 12 and 36
4
Cochrane risk of bias assessment A
utho
r (T
rial
)
Sele
ctio
n bi
as
Perf
orm
ance
bia
s
Det
ectio
n bi
as
Rep
ortin
g bi
as
Att
ritio
n bi
as
Ove
rall
risk
of b
ias
Ahmed (DIG) Low Low Low Low Low Low
Aronow Unclear High Low Low Low High
Bergstrom (SWEDIC) Unclear Low Low Low Low Low
Cleland (PEP-CHF) Low Low Low Low Unclear Low
Conraads Low Low Low Low Low Low
Davis (ALLHAT) Unclear Low Low Low Low Low
Deswal (RAAM-PEF) Unclear Low Low Low Low Low
Edelmann (ALDO-DHF) Low Low Low Low Low Low
Hung Low Low Low Low Low Low
Kasama Low Low Low Low Low Low
Kitzman Low Low Low Low Low Low
Kurrelmeyer Low Low Low Low Low Low
Little Low Low Low Low Low Low
Mak Low High Low Low Low High
Massie (I-PRESERVE) Low Low Low Low Low Low
Parthasarathy Low Low Low Low Low Low
Pitt (TOPCAT) Low Low Low Low Low Low
Rector (I-PRESERVE) Low Low Low Low Low Low
Redfield (RELAX) Low Low Low Low Low Low
Takeda Unclear High Unclear Low Low High
Van Veldhuisen (SENIORS) Low Low Low Low Low Low
Yamamoto (J-DHF) Unclear High Low Low Low High
Yip (HK-DHF) Low High Low Low Unclear High
Yusuf (CHARM-preserved) Low Low Low Low Low Low
Zi Unclear Low Low Low Low Low
Zile Unclear Low Low Low Low Low

5
Supplementary Figure 1A: Pooled and individual estimates of relative risk (RR) and 95%
confidence intervals (CI) of the primary outcome all cause-mortality for different drug
classes. Data is shown stratified by beta-blockers, renin-angiotensin-aldosterone antagonists
(RAAS) [which includes Angiotensin Converting Enzyme (ACE) inhibitors, Angiotensin
Receptor Blockers (ARB), and Mineralocorticoid Receptor Antagonists(MRA)], and other
drug classes. Random effects model used.

6
Supplementary Figure 1B: Pooled and individual estimates of risk difference (RD) and 95%
CI of the primary outcome all cause-mortality for different drug classes. Data is shown
stratified by beta-blockers, ACE inhibitors, ARB, and MRA, and other drug classes. Random
effects model used.

7
Supplementary Figure 1C: Pooled and individual estimates of relative risk (RR) and 95%
CI of the primary outcome all cause-mortality stratified by entry LV ejection fraction
threshold: 40 to 49% (trials which include patients with HFmrEF), and ≥50% (trials which
include only HFpEF). Random effects model used.
8
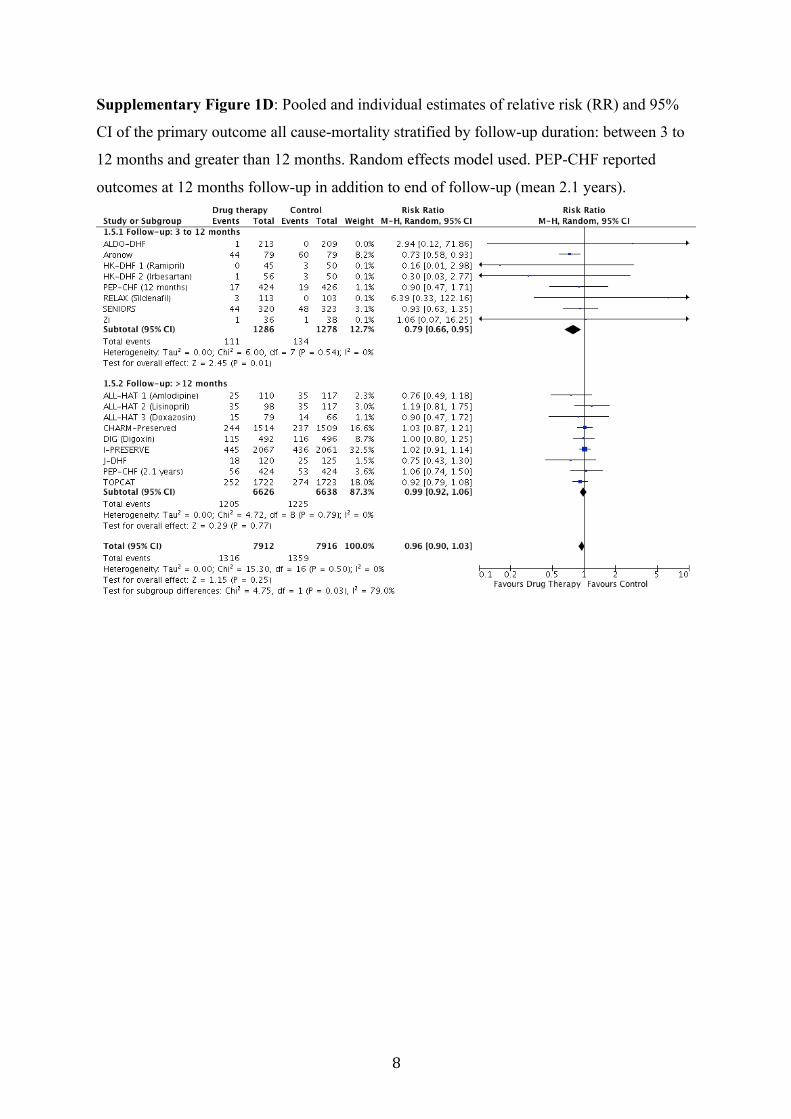
Supplementary Figure 1D: Pooled and individual estimates of relative risk (RR) and 95%
CI of the primary outcome all cause-mortality stratified by follow-up duration: between 3 to
12 months and greater than 12 months. Random effects model used. PEP-CHF reported
outcomes at 12 months follow-up in addition to end of follow-up (mean 2.1 years).
9
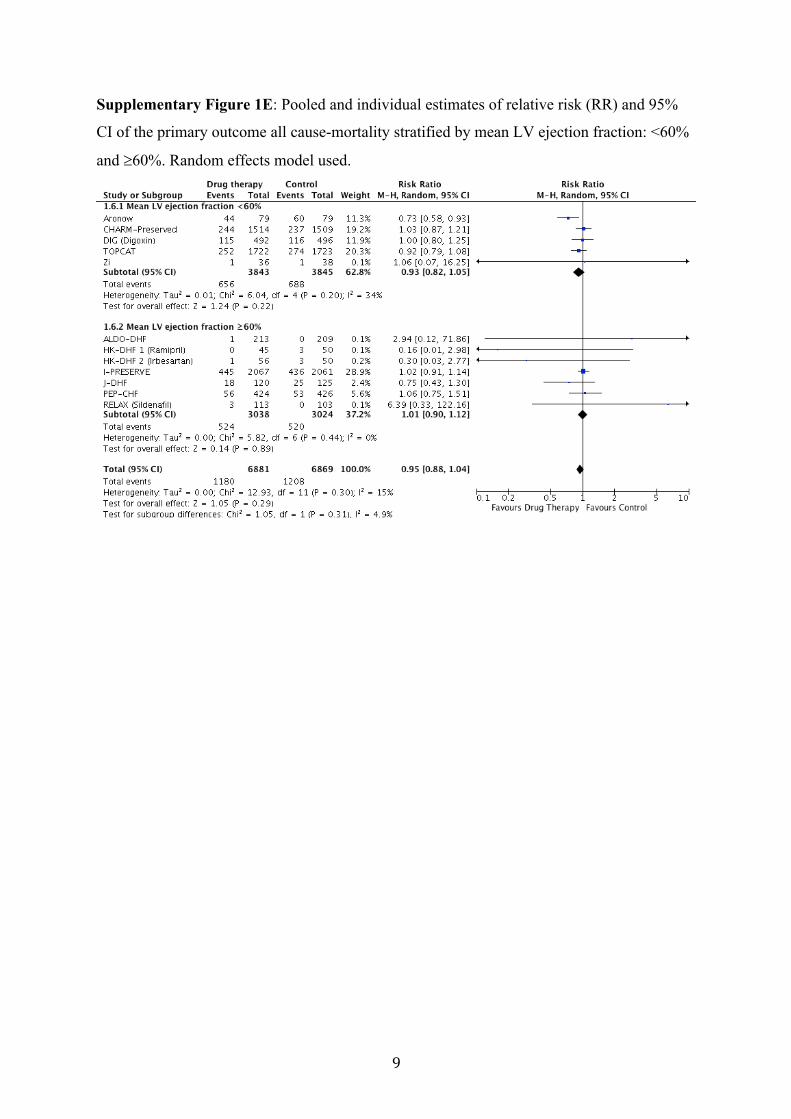
Supplementary Figure 1E: Pooled and individual estimates of relative risk (RR) and 95%
CI of the primary outcome all cause-mortality stratified by mean LV ejection fraction: <60%
and ³60%. Random effects model used.
10
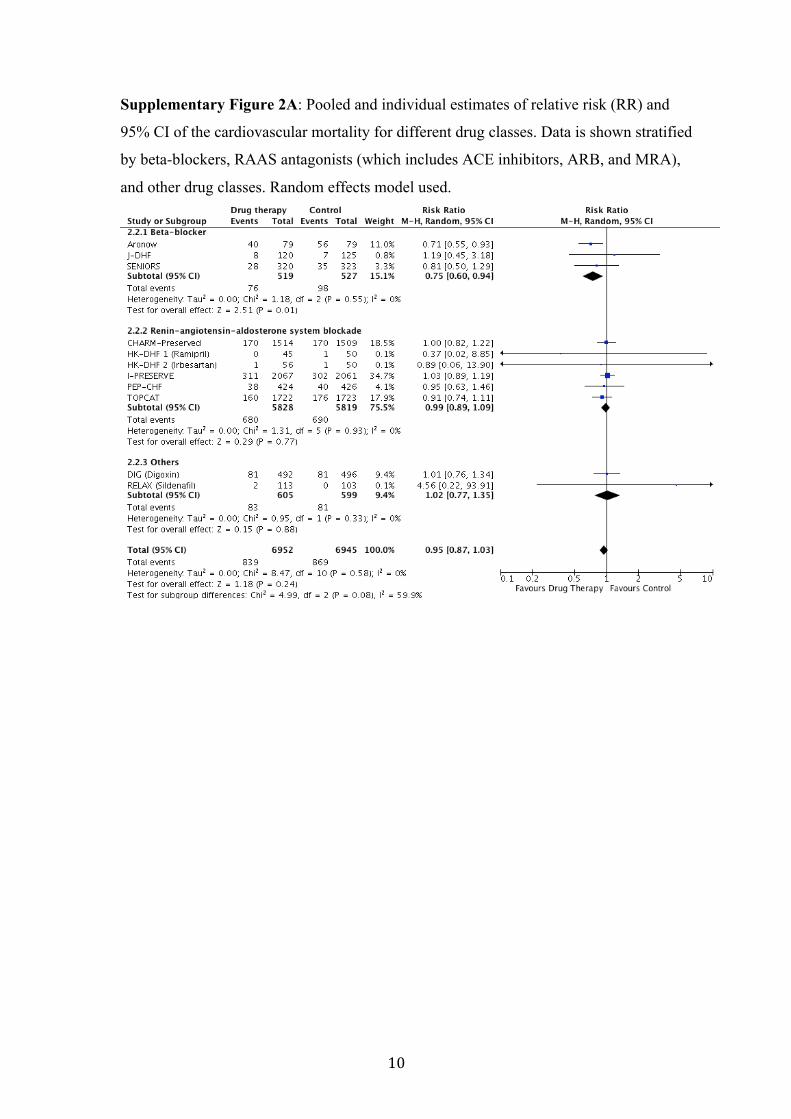
Supplementary Figure 2A: Pooled and individual estimates of relative risk (RR) and
95% CI of the cardiovascular mortality for different drug classes. Data is shown stratified
by beta-blockers, RAAS antagonists (which includes ACE inhibitors, ARB, and MRA),
and other drug classes. Random effects model used.
11
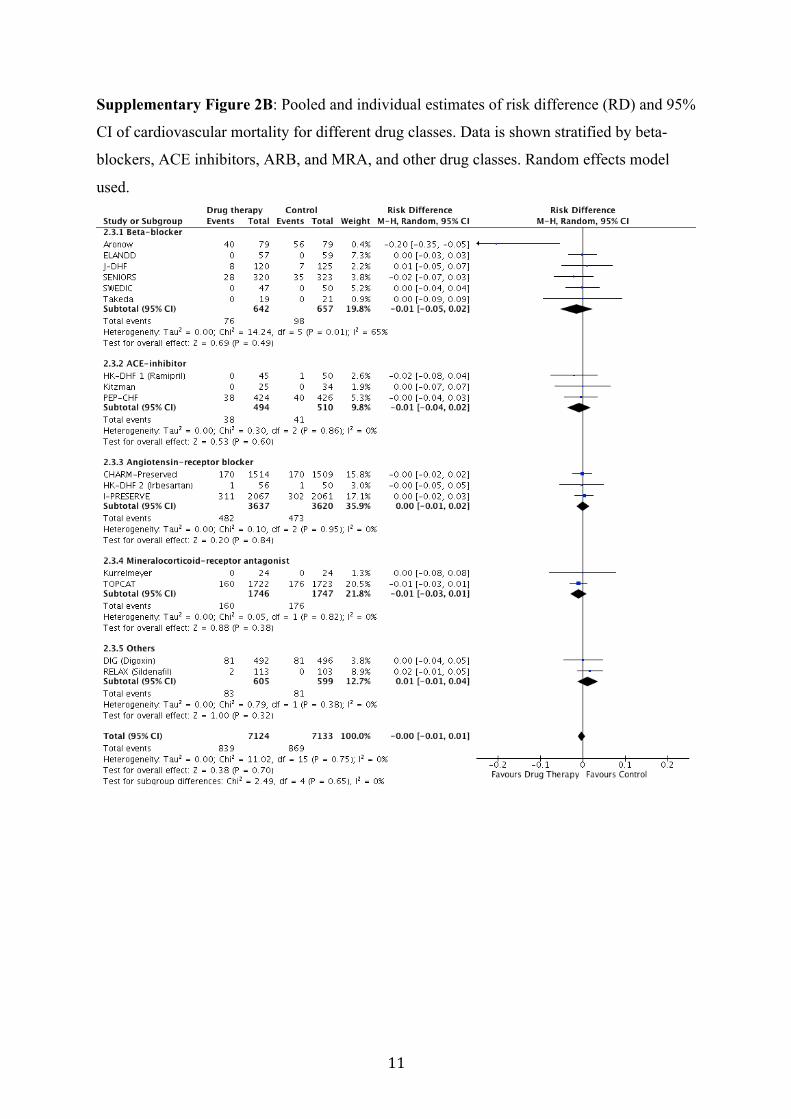
Supplementary Figure 2B: Pooled and individual estimates of risk difference (RD) and 95%
CI of cardiovascular mortality for different drug classes. Data is shown stratified by beta-
blockers, ACE inhibitors, ARB, and MRA, and other drug classes. Random effects model
used.

12
Supplementary Figure 2C: Pooled and individual estimates of relative risk (RR) and 95%
CI of cardiovascular mortality stratified by entry LV ejection fraction threshold: 40 to 49%
(trials which include patients with HFmrEF), and ≥50% (trials which include only HFpEF).
Random effects model used. Only one trial (RELAX) using an LV ejection fraction threshold
of 50% reported cardiovascular mortality.

13
Supplementary Figure 2D: Pooled and individual estimates of relative risk (RR) and 95%
CI of cardiovascular mortality stratified by follow-up duration: between 3 to 12 months and
greater than 12 months. Random effects model used. PEP-CHF reported outcomes at 12
months follow-up in addition to end of follow-up (mean 2.1 years).

14
Supplementary Figure 2E: Pooled and individual estimates of relative risk (RR) and 95%
CI of cardiovascular mortality stratified by mean LV ejection fraction: <60% and ³60%.
Random effects model used.
15
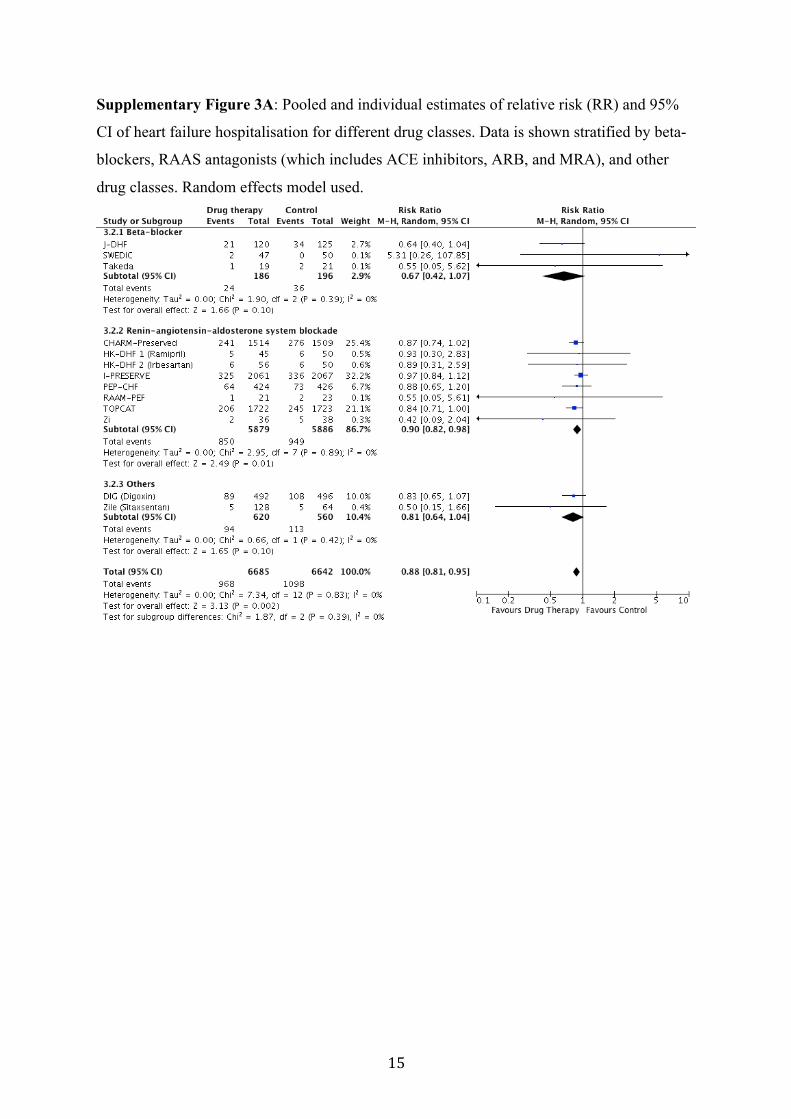
Supplementary Figure 3A: Pooled and individual estimates of relative risk (RR) and 95%
CI of heart failure hospitalisation for different drug classes. Data is shown stratified by beta-
blockers, RAAS antagonists (which includes ACE inhibitors, ARB, and MRA), and other
drug classes. Random effects model used.
16
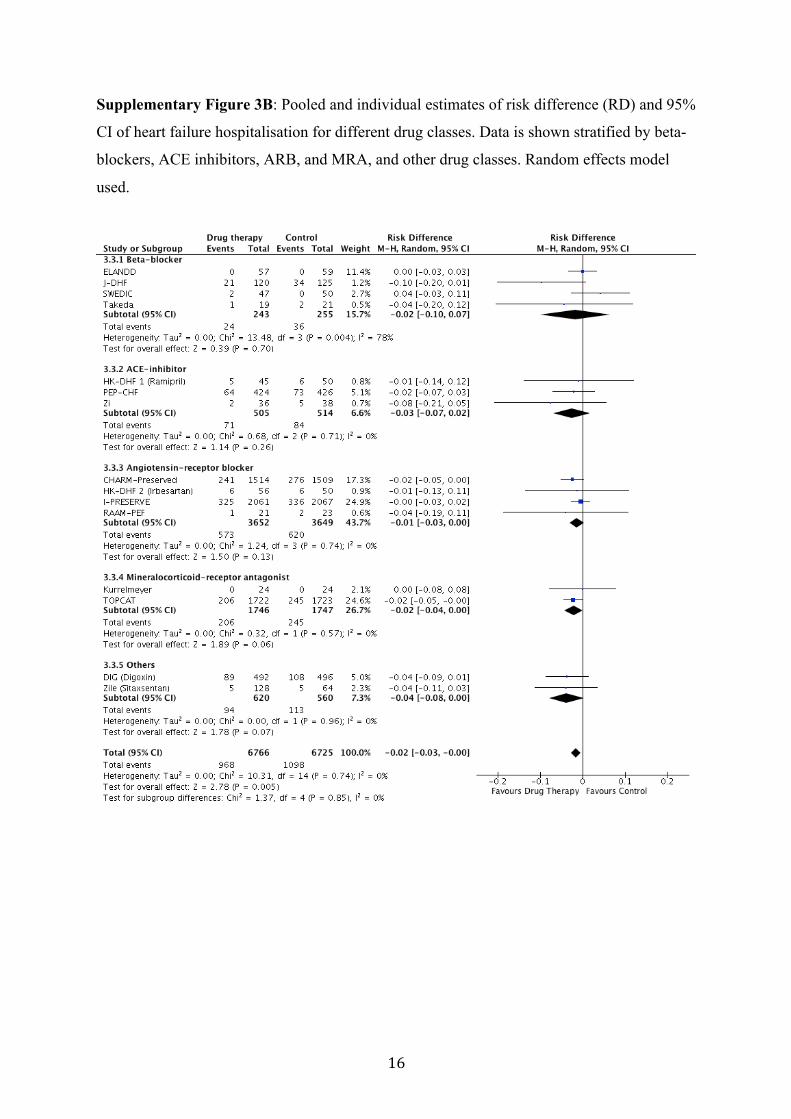
Supplementary Figure 3B: Pooled and individual estimates of risk difference (RD) and 95%
CI of heart failure hospitalisation for different drug classes. Data is shown stratified by beta-
blockers, ACE inhibitors, ARB, and MRA, and other drug classes. Random effects model
used.
17
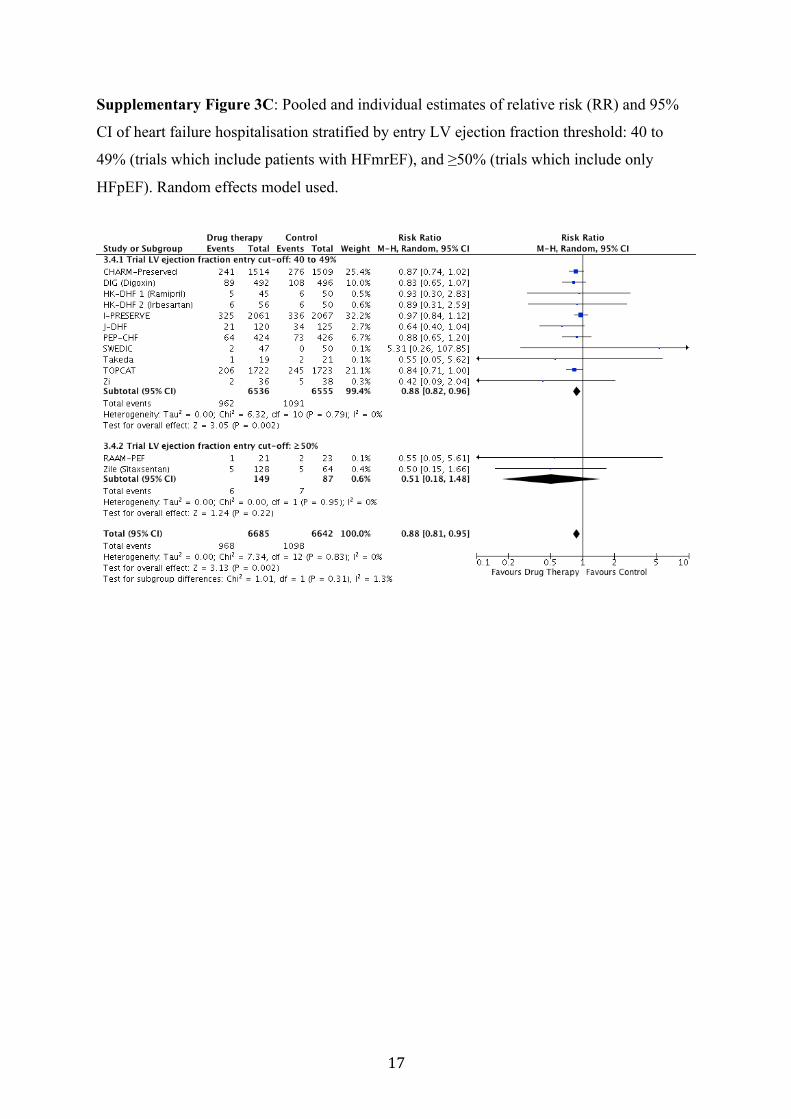
Supplementary Figure 3C: Pooled and individual estimates of relative risk (RR) and 95%
CI of heart failure hospitalisation stratified by entry LV ejection fraction threshold: 40 to
49% (trials which include patients with HFmrEF), and ≥50% (trials which include only
HFpEF). Random effects model used.

18
Supplementary Figure 3D: Pooled and individual estimates of relative risk (RR) and 95%
CI of heart failure hospitalisation stratified by follow-up duration: between 3 to 12 months
and greater than 12 months. Random effects model used. PEP-CHF reported outcomes at 12
months follow-up in addition to end of follow-up (mean 2.1 years).
19
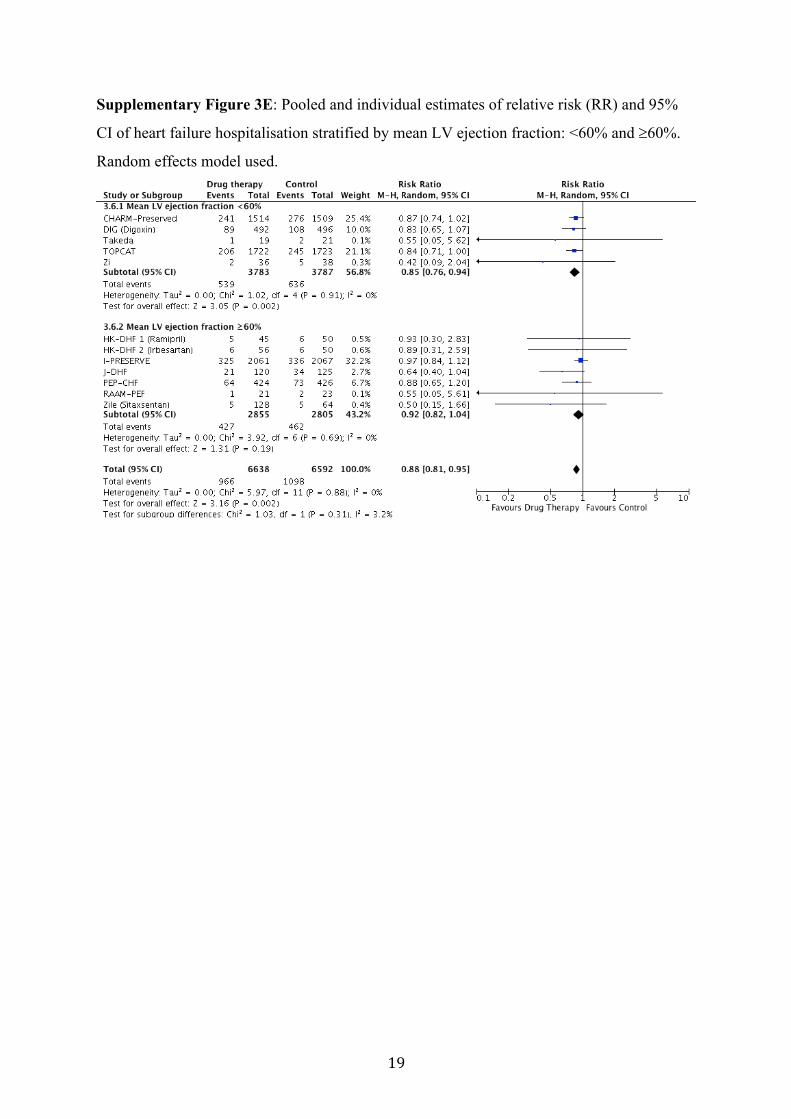
Supplementary Figure 3E: Pooled and individual estimates of relative risk (RR) and 95%
CI of heart failure hospitalisation stratified by mean LV ejection fraction: <60% and ³60%.
Random effects model used.

20
Supplementary Figure 4: Pooled and individual estimates of standardised mean difference
(MD) in exercise outcomes: (A) exercise capacity, (B) 6 minutes’ walk distance, and (C) VO2
max. Estimates and 95% CI based on a random effects model. Studies were stratified by
individual drug classes (beta-blockers, renin-angiotensin-aldosterone system antagonists and
other drug classes). Due to small number of studies, no classification was made by individual
drug class blockers. RAAS includes Angiotensin Converting Enzyme inhibitors, Angiotensin
Receptor Blockers and Mineralocorticoid Receptor Antagonist.
NOTE: Weights are from random effects analysis
.
.
.Overall (I-squared = 21.2%, p = 0.261)
RAAS (renin-angiotensin-aldosterone-antagonists)
ZileHung
ALDO-DHFSubtotal (I-squared = 0.0%, p = 0.856)
Others
Kitzman
Trial/Author
LittleParthasarathy
Subtotal (I-squared = 0.0%, p = 0.335)
Aronow
Subtotal (I-squared = 0.0%, p = 0.868)
Beta Blockers
ELANDD
Publication
20142003
20132010
year
20062009
19932012
19.92 (-1.30, 41.14)
34.80 (-185.00, 254.60)54.00 (1.39, 106.61)
3.00 (-22.66, 28.66)-0.69 (-23.59, 22.20)
-18.00 (-103.77, 67.77)
MD (95% CI)
25.80 (-114.82, 166.42)-23.40 (-93.68, 46.88)
39.91 (14.95, 64.87)
43.20 (17.36, 69.04)
52.96 (1.79, 104.13)
-6.00 (-102.52, 90.52)
100.00
%
0.9212.97
33.0448.80
5.59
Weight
2.207.98
37.32
32.82
13.89
4.49
0-200 200
Mean difference between control and treatment groups
(A) Exercise Capacity
NOTE: Weights are from random effects analysis
.
.
.
Overall (I-squared = 75.9%, p = 0.000)
Others
RAAM-PEF
Subtotal (I-squared = .%, p = .)
ALDO-DHF
HK-DHF 1
ELANDD
Kitzman
HK-DHF 2
Subtotal (I-squared = .%, p = .)
Kurrelmeyer
RAAS (renin-angiotensin-aldosterone-antagonists)
/ Author
Zi
RELAX
Subtotal (I-squared = 73.2%, p = 0.001)
Beta Blockers
Trial
20112013
2008
2012
2010
2008
2014
year
2006
2013
Publication
-1.94 (-8.65, 4.77)
2.00 (-26.02, 30.02)
-10.00 (-20.86, 0.86)
-17.00 (-34.99, 0.99)
8.90 (5.21, 12.59)
-26.00 (-56.97, 4.97)
0.90 (-31.78, 33.58)
6.10 (2.62, 9.58)
-26.00 (-56.97, 4.97)
-6.00 (-12.41, 0.41)
MD (95% CI)
-10.90 (-53.75, 31.95)
-10.00 (-20.86, 0.86)
1.11 (-5.45, 7.67)
100.00
4.59
14.42
8.69
21.66
3.90
3.56
21.82
3.90
19.14
Weight
2.22
14.42
81.68
%
-10 100-200 200
Mean difference between treatment and control groups
(B) 6 Minutes Walk Distance
NOTE: Weights are from random effects analysis
.
.
.Overall (I-squared = 0.0%, p = 0.409)
Subtotal (I-squared = 0.0%, p = 0.479)
Kitzman
ELANDD
/ Author
Beta Blockers
Subtotal (I-squared = .%, p = .)
RAAS (renin-angiotensin-aldosterone-antagonists)
RELAX
Parthasarathy
Trial
Subtotal (I-squared = .%, p = .)
Others
ALDO-DHF2010
2012
year
2013
2009
Publication
2013
-0.16 (-0.55, 0.24)
-0.27 (-0.95, 0.41)
-0.60 (-2.30, 1.10)
-1.50 (-3.36, 0.36)
MD (95% CI)
0.00 (-0.50, 0.50)0.00 (-0.50, 0.50)
-1.11 (-2.83, 0.61)
-1.50 (-3.36, 0.36)
0.00 (-0.83, 0.83)
100.00
33.18
5.36
4.49
Weight
62.3462.34
5.24
%
4.49
22.58
-0.16 (-0.55, 0.24)
-0.27 (-0.95, 0.41)
-0.60 (-2.30, 1.10)
-1.50 (-3.36, 0.36)
MD (95% CI)
0.00 (-0.50, 0.50)0.00 (-0.50, 0.50)
-1.11 (-2.83, 0.61)
-1.50 (-3.36, 0.36)
0.00 (-0.83, 0.83)
100.00
33.18
5.36
4.49
Weight
62.3462.34
5.24
%
4.49
22.58
0-100 100
Mean difference between control and treatment groups
(C) VO2 MAX

21
Supplementary Figure 5: Pooled and individual estimates of the standardised mean
difference (MD) in quality of life, assessed by Minnesota Living with Heart Failure
Questionnaire (MLHFQ). Lower MLHFQ scores associated with reduced symptoms,
therefore; negative difference indicates improvement. Data is shown stratified by individual
drug classes (beta-blockers, ACE inhibitors, angiotensin receptor blockers, mineralocorticoid
receptor antagonists, and other drug classes). Estimates and 95% CI were based on a random
effects model.
NOTE: Weights are from random effects analysis
.
.
.
.
.
Overall (I-squared = 0.0%, p = 0.971)
Beta BlockersELANDD
Kitzman
Zile
Subtotal (I-squared = .%, p = .)
Subtotal (I-squared = 0.0%, p = 0.612)
Others
Subtotal (I-squared = 0.0%, p = 0.570)
Subtotal (I-squared = 0.0%, p = 0.580)
Mineralocorticoid Receptor Antagonists
Subtotal (I-squared = 0.0%, p = 0.796)
Mak
Rector
ACE inhibitorsHK-DHF 1
ParthasarathyHK-DHF 2
/ Author
ALDO-DHF
RELAX
Angiotensin Receptor Blockers
Trial
2012
2010
2014
2009
2012
2008
20092008
year
2013
2013
Publication
-1.63 (-2.94, -0.31)
1.00 (-5.85, 7.85)
-4.00 (-14.32, 6.32)
-1.90 (-7.35, 3.55)
1.00 (-5.85, 7.85)
-0.85 (-4.49, 2.80)
-1.39 (-4.85, 2.08)
-1.84 (-3.55, -0.14)
-2.77 (-7.15, 1.61)
-4.00 (-13.66, 5.66)
-2.30 (-4.22, -0.38)
-2.50 (-7.34, 2.34)
0.50 (-5.73, 6.73)-0.50 (-5.10, 4.10)
MD (95% CI)
-1.00 (-4.71, 2.71)
0.00 (-4.90, 4.90)
100.00
3.70
1.63
5.84
3.70
13.06
14.44
59.75
9.05
1.86
47.08
7.42
4.488.19
Weight
12.58
7.23
%
0-100 100
Mean difference between treatment and control groups
Quality of Life MLHF Questionnaire
22
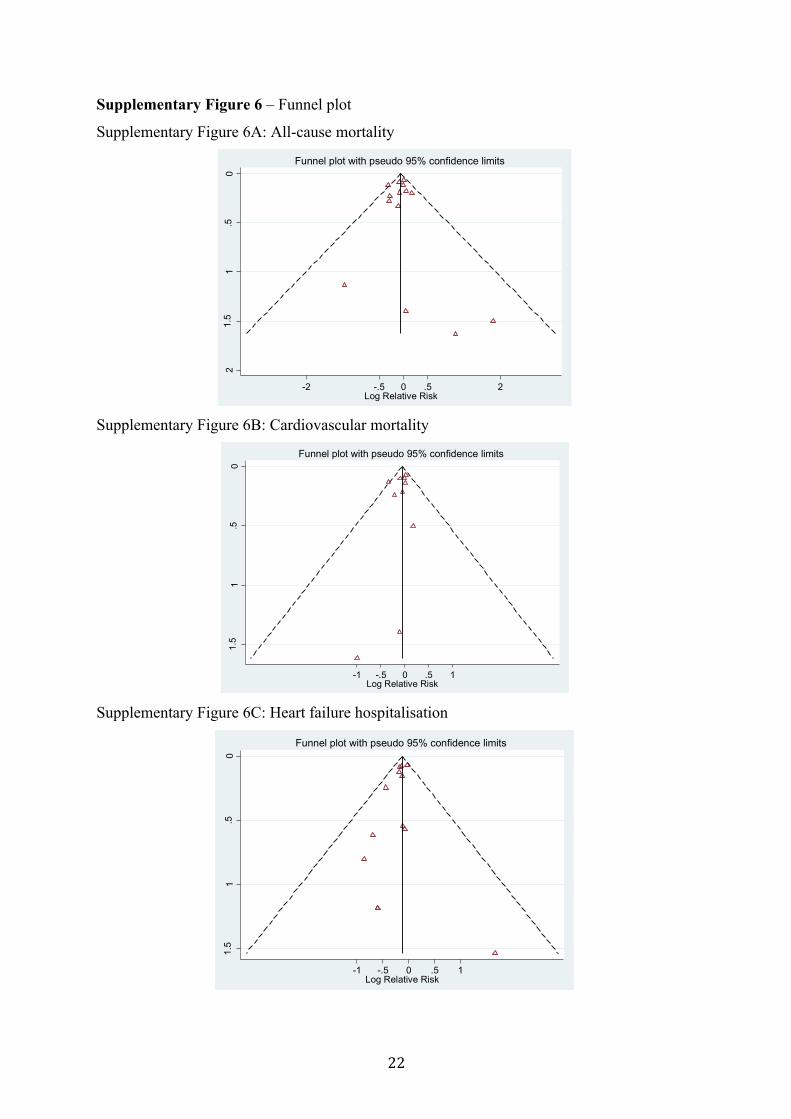
Supplementary Figure 6 – Funnel plot
Supplementary Figure 6A: All-cause mortality
Supplementary Figure 6B: Cardiovascular mortality
Supplementary Figure 6C: Heart failure hospitalisation
0.5
11.
52
Stan
dard
erro
r of l
og R
R
-2 -.5 0 .5 2Log Relative Risk
Funnel plot with pseudo 95% confidence limits
0.5
11.
5
Stan
dard
erro
r of l
og R
R
-1 -.5 0 .5 1Log Relative Risk
Funnel plot with pseudo 95% confidence limits
0.5
11.
5
Stan
dard
erro
r of l
og R
R
-1 -.5 0 .5 1Log Relative Risk
Funnel plot with pseudo 95% confidence limits
23
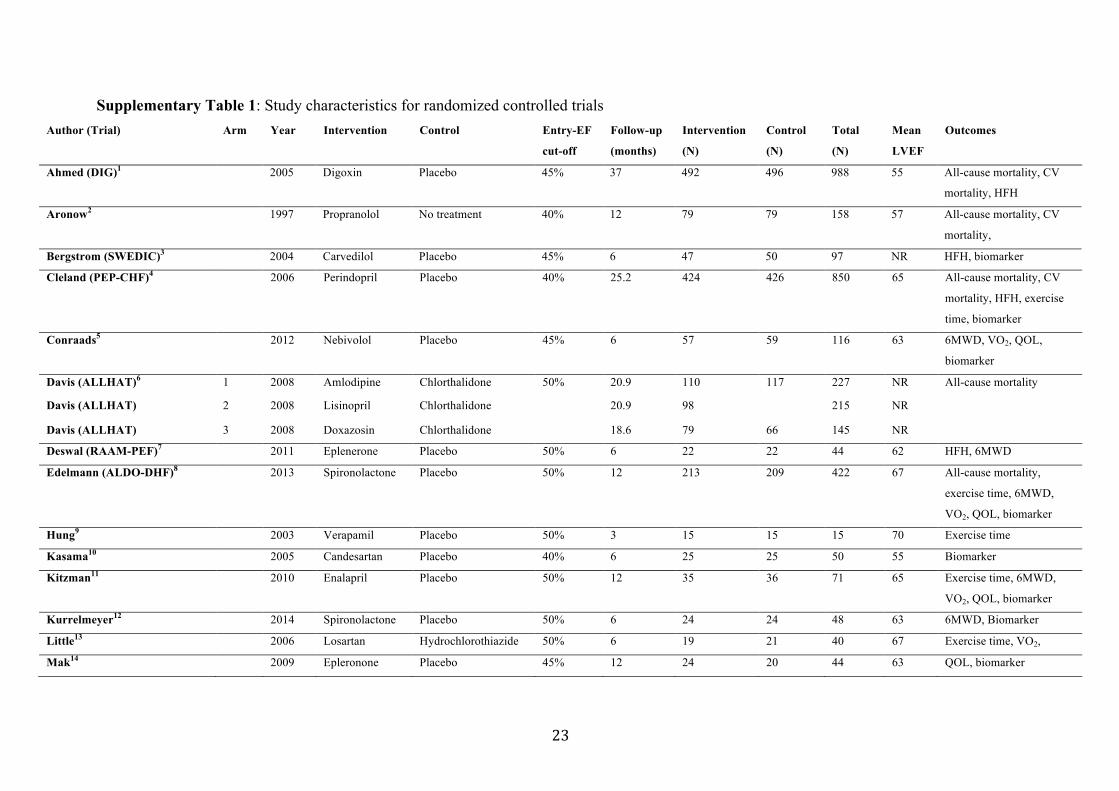
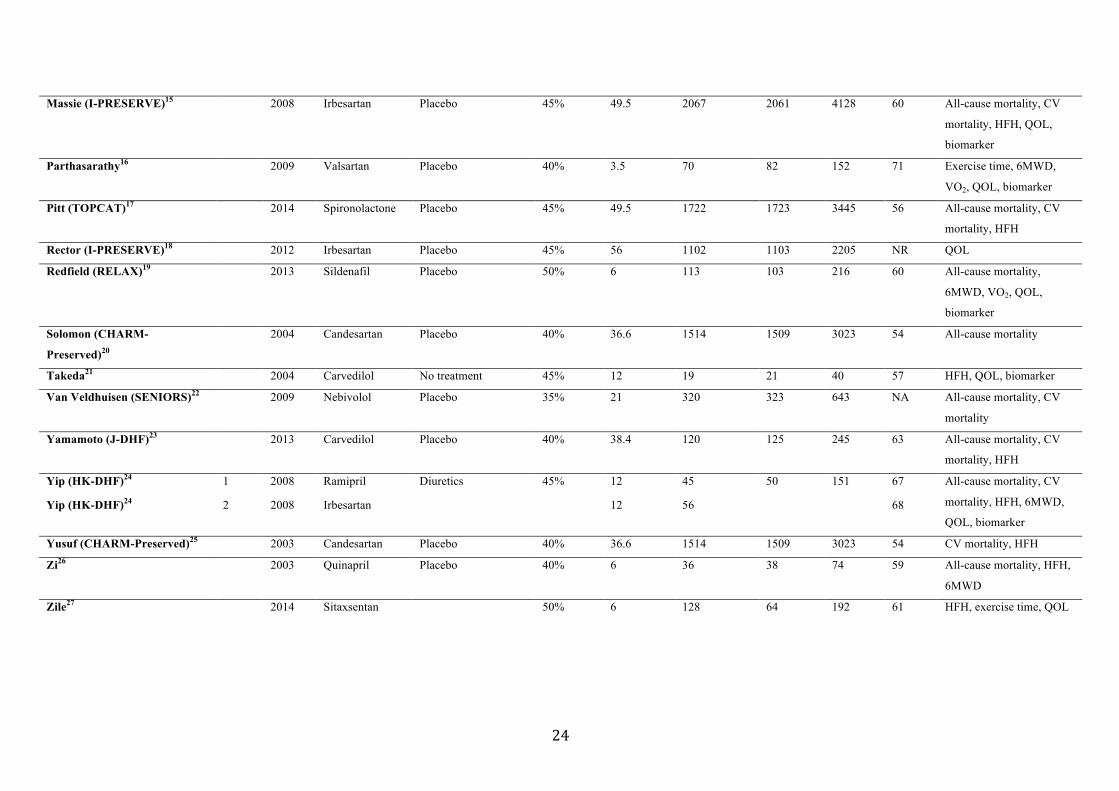
Supplementary Table 1: Study characteristics for randomized controlled trials Author (Trial) Arm Year Intervention Control Entry-EF
cut-off
Follow-up
(months)
Intervention
(N)
Control
(N)
Total
(N)
Mean
LVEF
Outcomes
Ahmed (DIG)1 2005 Digoxin Placebo 45% 37 492 496 988 55 All-cause mortality, CV
mortality, HFH
Aronow2 1997 Propranolol No treatment 40% 12 79 79 158 57 All-cause mortality, CV
mortality,
Bergstrom (SWEDIC)3 2004 Carvedilol Placebo 45% 6 47 50 97 NR HFH, biomarker
Cleland (PEP-CHF)4 2006 Perindopril Placebo 40% 25.2 424 426 850 65 All-cause mortality, CV
mortality, HFH, exercise
time, biomarker
Conraads5 2012 Nebivolol Placebo 45% 6 57 59 116 63 6MWD, VO2, QOL,
biomarker
Davis (ALLHAT)6 1 2008 Amlodipine Chlorthalidone 50% 20.9 110 117 227 NR All-cause mortality
Davis (ALLHAT) 2 2008 Lisinopril Chlorthalidone 20.9 98 215 NR
Davis (ALLHAT) 3 2008 Doxazosin Chlorthalidone 18.6 79 66 145 NR
Deswal (RAAM-PEF)7 2011 Eplenerone Placebo 50% 6 22 22 44 62 HFH, 6MWD
Edelmann (ALDO-DHF)8 2013 Spironolactone Placebo 50% 12 213 209 422 67 All-cause mortality,
exercise time, 6MWD,
VO2, QOL, biomarker
Hung9 2003 Verapamil Placebo 50% 3 15 15 15 70 Exercise time
Kasama10 2005 Candesartan Placebo 40% 6 25 25 50 55 Biomarker
Kitzman11 2010 Enalapril Placebo 50% 12 35 36 71 65 Exercise time, 6MWD,
VO2, QOL, biomarker
Kurrelmeyer12 2014 Spironolactone Placebo 50% 6 24 24 48 63 6MWD, Biomarker
Little13 2006 Losartan Hydrochlorothiazide 50% 6 19 21 40 67 Exercise time, VO2,
Mak14 2009 Epleronone Placebo 45% 12 24 20 44 63 QOL, biomarker
24
Massie (I-PRESERVE)15 2008 Irbesartan Placebo 45% 49.5 2067 2061 4128 60 All-cause mortality, CV
mortality, HFH, QOL,
biomarker
Parthasarathy16 2009 Valsartan Placebo 40% 3.5 70 82 152 71 Exercise time, 6MWD,
VO2, QOL, biomarker
Pitt (TOPCAT)17 2014 Spironolactone Placebo 45% 49.5 1722 1723 3445 56 All-cause mortality, CV
mortality, HFH
Rector (I-PRESERVE)18 2012 Irbesartan Placebo 45% 56 1102 1103 2205 NR QOL
Redfield (RELAX)19 2013 Sildenafil Placebo 50% 6 113 103 216 60 All-cause mortality,
6MWD, VO2, QOL,
biomarker
Solomon (CHARM-
Preserved)20
2004 Candesartan Placebo 40% 36.6 1514 1509 3023 54 All-cause mortality
Takeda21 2004 Carvedilol No treatment 45% 12 19 21 40 57 HFH, QOL, biomarker
Van Veldhuisen (SENIORS)22 2009 Nebivolol Placebo 35% 21 320 323 643 NA All-cause mortality, CV
mortality
Yamamoto (J-DHF)23 2013 Carvedilol Placebo 40% 38.4 120 125 245 63 All-cause mortality, CV
mortality, HFH
Yip (HK-DHF)24 1 2008 Ramipril Diuretics 45% 12 45 50 151 67 All-cause mortality, CV
mortality, HFH, 6MWD,
QOL, biomarker Yip (HK-DHF)24 2 2008 Irbesartan 12 56 68
Yusuf (CHARM-Preserved)25 2003 Candesartan Placebo 40% 36.6 1514 1509 3023 54 CV mortality, HFH
Zi26 2003 Quinapril Placebo 40% 6 36 38 74 59 All-cause mortality, HFH,
6MWD
Zile27 2014 Sitaxsentan 50% 6 128 64 192 61 HFH, exercise time, QOL
25
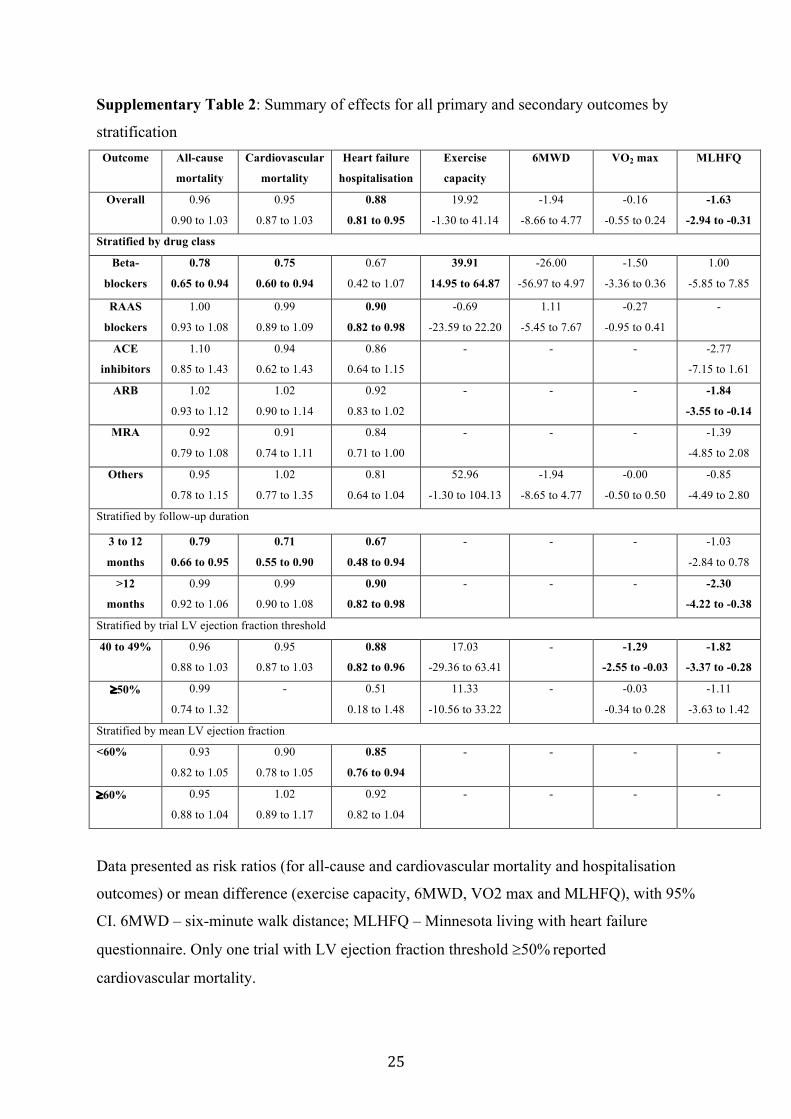
Supplementary Table 2: Summary of effects for all primary and secondary outcomes by
stratification Outcome All-cause
mortality
Cardiovascular
mortality
Heart failure
hospitalisation
Exercise
capacity
6MWD VO2 max MLHFQ
Overall 0.96
0.90 to 1.03
0.95
0.87 to 1.03
0.88
0.81 to 0.95
19.92
-1.30 to 41.14
-1.94
-8.66 to 4.77
-0.16
-0.55 to 0.24
-1.63
-2.94 to -0.31
Stratified by drug class
Beta-
blockers
0.78
0.65 to 0.94
0.75
0.60 to 0.94
0.67
0.42 to 1.07
39.91
14.95 to 64.87
-26.00
-56.97 to 4.97
-1.50
-3.36 to 0.36
1.00
-5.85 to 7.85
RAAS
blockers
1.00
0.93 to 1.08
0.99
0.89 to 1.09
0.90
0.82 to 0.98
-0.69
-23.59 to 22.20
1.11
-5.45 to 7.67
-0.27
-0.95 to 0.41
-
ACE
inhibitors
1.10
0.85 to 1.43
0.94
0.62 to 1.43
0.86
0.64 to 1.15
- - - -2.77
-7.15 to 1.61
ARB 1.02
0.93 to 1.12
1.02
0.90 to 1.14
0.92
0.83 to 1.02
- - - -1.84
-3.55 to -0.14
MRA 0.92
0.79 to 1.08
0.91
0.74 to 1.11
0.84
0.71 to 1.00
- - - -1.39
-4.85 to 2.08
Others 0.95
0.78 to 1.15
1.02
0.77 to 1.35
0.81
0.64 to 1.04
52.96
-1.30 to 104.13
-1.94
-8.65 to 4.77
-0.00
-0.50 to 0.50
-0.85
-4.49 to 2.80
Stratified by follow-up duration
3 to 12
months
0.79
0.66 to 0.95
0.71
0.55 to 0.90
0.67
0.48 to 0.94
- - - -1.03
-2.84 to 0.78
>12
months
0.99
0.92 to 1.06
0.99
0.90 to 1.08
0.90
0.82 to 0.98
- - - -2.30
-4.22 to -0.38
Stratified by trial LV ejection fraction threshold
40 to 49% 0.96
0.88 to 1.03
0.95
0.87 to 1.03
0.88
0.82 to 0.96
17.03
-29.36 to 63.41
- -1.29
-2.55 to -0.03
-1.82
-3.37 to -0.28
³50% 0.99
0.74 to 1.32
- 0.51
0.18 to 1.48
11.33
-10.56 to 33.22
- -0.03
-0.34 to 0.28
-1.11
-3.63 to 1.42
Stratified by mean LV ejection fraction
<60% 0.93
0.82 to 1.05
0.90
0.78 to 1.05
0.85
0.76 to 0.94
- - - -
³60% 0.95
0.88 to 1.04
1.02
0.89 to 1.17
0.92
0.82 to 1.04
- - - -
Data presented as risk ratios (for all-cause and cardiovascular mortality and hospitalisation
outcomes) or mean difference (exercise capacity, 6MWD, VO2 max and MLHFQ), with 95%
CI. 6MWD – six-minute walk distance; MLHFQ – Minnesota living with heart failure
questionnaire. Only one trial with LV ejection fraction threshold ³50% reported
cardiovascular mortality.

26
Supplementary Table 3: Overview of changes to BNP and NT-pro BNP following treatment in included trials Author, Trial Year Drug Follow-up Study
drug N
Study drug
baseline
Study drug
follow-up
Control
N
Control
baseline
Control
follow-up
Mean change
difference
BNP
Bergstrom, SWEDIC 2004 Carvedilol 6 months 47 28 28 50 28 42
Kasama 2005 Candesartan 6 months 25 202 134 25 204 193
Kitzman 2010 Enalapril 12 months 35 78 84 36 64 67
Kurrelmeyer 2014 Spironolactone 6 months 24 139 119 24 215 167
Mak 2009 Eplenerone 12 months 24 219 158 20 192 123
Parthasarathy 2009 Valsartan 14 weeks 61 93 94 74 120 110
Takeda 2004 Carvedilol 12 months 19 172 75 21 150 174
NT-proBNP
Cleland, PEP-CHF 2006 Perindopril 2.1 years 191 335 184 453 -149
Conraads, ELANDD 2012 Nebivolol 6 months 57 147 162 59 126 99
Edelman, ALDO-DHF 2013 Spironolactone 12 months 204 179 152 196 148 165
Massie, I-PRESERVE 2008 Irbesartan 6 months 2067 360 2061 320 -11
Redfield, RELAX 2013 Sildenafil 24 weeks 95 757 94 648 38
Yip-1, HK-DHF 2008 Ramipril 12 months 45 488 314 50 566 334
Yip-2, HK-DHF 2008 Irbesartan 12 months 56 568 443 50 566 334

27
1. Ahmed A, Rich MW, Love TE, et al. Digoxin and reduction in mortality and hospitalization in heart failure: a comprehensive post hoc analysis of the DIG trial. European heart journal 2006; 27(2). http://onlinelibrary.wiley.com/o/cochrane/clcentral/articles/684/CN-00561684/frame.html
http://eurheartj.oxfordjournals.org/content/ehj/27/2/178.full.pdf. 2. Aronow WS, Ahn C, Kronzon I. Effect of propranolol versus no propranolol on total
mortality plus nonfatal myocardial infarction in older patients with prior myocardial infarction, congestive heart failure, and left ventricular ejection fraction > or = 40% treated with diuretics plus angiotensin-converting enzyme inhibitors. The American journal of cardiology 1997;80(2):207-9. [published Online First: 1997/07/15]
3. Bergström A, Andersson B, Edner M, et al. Effect of carvedilol on diastolic function in patients with diastolic heart failure and preserved systolic function. Results of the Swedish Doppler-echocardiographic study (SWEDIC). European journal of heart failure 2004; 6(4). http://onlinelibrary.wiley.com/o/cochrane/clcentral/articles/721/CN-00489721/frame.html
http://onlinelibrary.wiley.com/store/10.1016/j.ejheart.2004.02.003/asset/ejhf2004-02-003.pdf?v=1&t=ieha38dx&s=afd318d8893c536f26b63147556956748ee85224
http://onlinelibrary.wiley.com/store/10.1016/j.ejheart.2004.02.003/asset/ejhf2004-02-003.pdf?v=1&t=iepjl3iu&s=18b120c69a4246bb506edb4dbd69846fccb359d3.
4. Cleland JG, Tendera M, Adamus J, et al. The perindopril in elderly people with chronic heart failure (PEP-CHF) study. European heart journal 2006; 27(19). http://onlinelibrary.wiley.com/o/cochrane/clcentral/articles/489/CN-00576489/frame.html
http://eurheartj.oxfordjournals.org/content/ehj/27/19/2338.full.pdf. 5. Conraads VM, Metra M, Kamp O, et al. Effects of the long-term administration of
nebivolol on the clinical symptoms, exercise capacity, and left ventricular function of patients with diastolic dysfunction: Results of the ELANDD study. European Journal of Heart Failure 2012;14(2):219-25. doi: http://dx.doi.org/10.1093/eurjhf/hfr161
6. Davis BR, Kostis JB, Simpson LM, et al. Heart failure with preserved and reduced left ventricular ejection fraction in the antihypertensive and lipid-lowering treatment to prevent heart attack trial. Circulation 2008;118(22):2259-67. doi: 10.1161/circulationaha.107.762229 [published Online First: 2008/11/13]
7. Deswal A, Richardson P, Bozkurt B, et al. Results of the Randomized Aldosterone Antagonism in heart failure with Preserved Ejection Fraction trial (RAAM-PEF). Journal of Cardiac Failure 2011;17(8):634-42. doi: http://dx.doi.org/10.1016/j.cardfail.2011.04.007
8. Edelmann F, Wachter R, Schmidt AG, et al. Effect of spironolactone on diastolic function and exercise capacity in patients with heart failure with preserved ejection fraction: The Aldo-DHF randomized controlled trial. JAMA - Journal of the American Medical Association 2013;309(8):781-91. doi: http://dx.doi.org/10.1001/jama.2013.905
9. Hung MJ, Cherng WJ, Kuo LT, et al. Effect of verapamil in elderly patients with left ventricular diastolic dysfunction as a cause of congestive heart failure. International journal of clinical practice 2002; 56(1). http://onlinelibrary.wiley.com/o/cochrane/clcentral/articles/681/CN-00377681/frame.html.
10. Kasama S, Toyama T, Kumakura H, et al. Effects of candesartan on cardiac sympathetic nerve activity in patients with congestive heart failure and preserved left ventricular

28
ejection fraction. Journal of the American College of Cardiology 2005;45(5):661-7. doi: 10.1016/j.jacc.2004.11.038 [published Online First: 2005/03/01]
11. Kitzman DW, Hundley WG, Brubaker PH, et al. A randomized double-blind trial of enalapril in older patients with heart failure and preserved ejection fraction: effects on exercise tolerance and arterial distensibility. Circulation Heart failure 2010; 3(4). http://onlinelibrary.wiley.com/o/cochrane/clcentral/articles/761/CN-00752761/frame.html
http://circheartfailure.ahajournals.org/content/3/4/477.full.pdf. 12. Kurrelmeyer KM, Ashton Y, Xu J, et al. Effects of spironolactone treatment in elderly
women with heart failure and preserved left ventricular ejection fraction. Journal of cardiac failure 2014; 20(8). http://onlinelibrary.wiley.com/o/cochrane/clcentral/articles/406/CN-00998406/frame.html
http://www.onlinejcf.com/article/S1071-9164(14)00215-2/abstract. 13. Little WC, Zile MR, Klein A, et al. Effect of losartan and hydrochlorothiazide on exercise
tolerance in exertional hypertension and left ventricular diastolic dysfunction. The American journal of cardiology 2006;98(3):383-5. doi: 10.1016/j.amjcard.2006.01.106 [published Online First: 2006/07/25]
14. Mak GJ, Ledwidge MT, Watson CJ, et al. Natural History of Markers of Collagen Turnover in Patients With Early Diastolic Dysfunction and Impact of Eplerenone. Journal of the American College of Cardiology 2009;54(18):1674-82. doi: http://dx.doi.org/10.1016/j.jacc.2009.08.021
15. Massie BM, Carson PE, McMurray JJ, et al. Irbesartan in patients with heart failure and preserved ejection fraction. N Engl J Med 2008;359(23):2456-67. doi: http://dx.doi.org/10.1056/NEJMoa0805450
16. Parthasarathy HK, Pieske B, Weisskopf M, et al. A randomized, double-blind, placebo-controlled study to determine the effects of valsartan on exercise time in patients with symptomatic heart failure with preserved ejection fraction. European journal of heart failure 2009; 11(10). http://onlinelibrary.wiley.com/o/cochrane/clcentral/articles/071/CN-00728071/frame.html
http://www.ncbi.nlm.nih.gov/pmc/articles/PMC2754503/pdf/hfp120.pdf. 17. Pitt B, Pfeffer MA, Assmann SF, et al. Spironolactone for heart failure with preserved
ejection fraction. The New England journal of medicine 2014; 370(15). http://onlinelibrary.wiley.com/o/cochrane/clcentral/articles/299/CN-00989299/frame.html.
18. Rector TS, Carson PE, Anand IS, et al. Assessment of long-term effects of irbesartan on heart failure with preserved ejection fraction as measured by the minnesota living with heart failure questionnaire in the irbesartan in heart failure with preserved systolic function (I-PRESERVE) trial. Circ 2012;5(2):217-25. doi: http://dx.doi.org/10.1161/CIRCHEARTFAILURE.111.964221
19. Redfield MM, Chen HH, Borlaug BA, et al. Effect of phosphodiesterase-5 inhibition on exercise capacity and clinical status in heart failure with preserved ejection fraction: A randomized clinical trial. JAMA - Journal of the American Medical Association 2013;309(12):1268-77. doi: http://dx.doi.org/10.1001/jama.2013.2024
20. Solomon SD, Wang D, Finn P, et al. Effect of candesartan on cause-specific mortality in heart failure patients: the Candesartan in Heart failure Assessment of Reduction in Mortality and morbidity (CHARM) program. Circulation 2004;110(15):2180-3. doi: 10.1161/01.cir.0000144474.65922.aa [published Online First: 2004/10/07]
29
21. Takeda Y, Fukutomi T, Suzuki S, et al. Effects of carvedilol on plasma B-type natriuretic peptide concentration and symptoms in patients with heart failure and preserved ejection fraction. American journal of cardiology 2004; 94(4). http://onlinelibrary.wiley.com/o/cochrane/clcentral/articles/248/CN-00481248/frame.html
http://www.ajconline.org/article/S0002-9149(04)00707-6/abstract. 22. van Veldhuisen DJ, Cohen-Solal A, Bohm M, et al. Beta-Blockade With Nebivolol in
Elderly Heart Failure Patients With Impaired and Preserved Left Ventricular Ejection Fraction. Data From SENIORS (Study of Effects of Nebivolol Intervention on Outcomes and Rehospitalization in Seniors With Heart Failure). Journal of the American College of Cardiology 2009;53(23):2150-58. doi: http://dx.doi.org/10.1016/j.jacc.2009.02.046
23. Yamamoto K, Origasa H, Hori M. Effects of carvedilol on heart failure with preserved ejection fraction: the Japanese Diastolic Heart Failure Study (J-DHF). European journal of heart failure 2013; 15(1). http://onlinelibrary.wiley.com/o/cochrane/clcentral/articles/537/CN-00859537/frame.html
http://onlinelibrary.wiley.com/store/10.1093/eurjhf/hfs141/asset/ejhfhfs141.pdf?v=1&t=iefjj60q&s=05fb43d282267b248efddc37e10927936f94060d.
24. Yip GW, Wang M, Wang T, et al. The Hong Kong diastolic heart failure study: a randomised controlled trial of diuretics, irbesartan and ramipril on quality of life, exercise capacity, left ventricular global and regional function in heart failure with a normal ejection fraction. Heart (British Cardiac Society) 2008; 94(5). http://onlinelibrary.wiley.com/o/cochrane/clcentral/articles/478/CN-00629478/frame.html
http://heart.bmj.com/content/94/5/573.full.pdf. 25. Yusuf S, Pfeffer MA, Swedberg K, et al. Effects of candesartan in patients with chronic
heart failure and preserved left-ventricular ejection fraction: the CHARM-Preserved Trial. Lancet (London, England) 2003; 362(9386). http://onlinelibrary.wiley.com/o/cochrane/clcentral/articles/464/CN-00440464/frame.html
http://www.thelancet.com/journals/lancet/article/PIIS0140-6736(03)14285-7/abstract. 26. Zi M, Carmichael N, Lye M. The effect of quinapril on functional status of elderly
patients with diastolic heart failure. Cardiovascular drugs and therapy / sponsored by the International Society of Cardiovascular Pharmacotherapy 2003; 17(2). http://onlinelibrary.wiley.com/o/cochrane/clcentral/articles/791/CN-00457791/frame.html.
27. Zile MR, Bourge RC, Redfield MM, et al. Randomized, double-blind, placebo-controlled study of sitaxsentan to improve impaired exercise tolerance in patients with heart failure and a preserved ejection fraction. Jacc 2014;Heart failure. 2(2):123-30. doi: http://dx.doi.org/10.1016/j.jchf.2013.12.002