
Hepatic Lipid Metabolism in High-Fat Diet and Inflammation
16
cells Article Kupffer Cells Sense Free Fatty Acids and Regulate Hepatic Lipid Metabolism in High-Fat Diet and Inflammation Kira L. Diehl, Julia Vorac, Kristina Hofmann, Philippa Meiser, Iris Unterweger, Lars Kuerschner , Heike Weighardt, Irmgard Förster and Christoph Thiele * Life and Medical Science Institute (LIMES), University of Bonn, Carl-Troll-Straße 31, 53115 Bonn, Germany; [email protected] (K.L.D.); [email protected] (J.V.); [email protected] (K.H.); [email protected] (P.M.); [email protected] (I.U.); [email protected] (L.K.); [email protected] (H.W.); [email protected] (I.F.) * Correspondence: [email protected]; Tel.: +49-02-2873-62817 Received: 11 September 2020; Accepted: 6 October 2020; Published: 8 October 2020 Abstract: A high fat Western-style diet leads to hepatic steatosis that can progress to steatohepatitis and ultimately cirrhosis or liver cancer. The mechanism that leads to the development of steatosis upon nutritional overload is complex and only partially understood. Using click chemistry-based metabolic tracing and microscopy, we study the interaction between Kupffer cells and hepatocytes ex vivo. In the early phase of steatosis, hepatocytes alone do not display significant deviations in fatty acid metabolism. However, in co-cultures or supernatant transfer experiments, we show that tumor necrosis factor (TNF) secretion by Kupffer cells is necessary and sufficient to induce steatosis in hepatocytes, independent of the challenge of hepatocytes with elevated fatty acid levels. We further show that free fatty acid (FFA) or lipopolysaccharide are both able to trigger release of TNF from Kupffer cells. We conclude that Kupffer cells act as the primary sensor for both FFA overload and bacterial lipopolysaccharide, integrate these signals and transmit the information to the hepatocyte via TNF secretion. Hepatocytes react by alteration in lipid metabolism prominently leading to the accumulation of triacylglycerols (TAGs) in lipid droplets, a hallmark of steatosis. Keywords: non-alcoholic fatty liver disease; nutrition/lipids; metabolic disease; lipids/chemistry 1. Introduction Non-alcoholic fatty liver disease (NAFLD) is the most common liver disease in industrialized countries [1–3] presenting with a wide range of pathologies. This includes steatosis, which manifests in an excessive accumulation of lipid droplets (LDs) in hepatocytes, steatohepatitis, which is a combination of steatosis and liver inflammation, and liver cirrhosis, i.e., excessive fibrosis with loss of hepatocytes and liver function. The “two-hit model“ was postulated many years ago to describe NAFLD pathogenesis [4]. The “first hit” is characterized by a reversible steatosis, thought to originate from excess amounts of free fatty acid (FFA), which are esterified to triacylglycerol (TAG). This links NAFLD to obesity, in which FFA are strongly elevated [5,6]. In the “second hit”, steatosis can progress into non-alcoholic steatohepatitis, which additionally includes inflammation, scar formation, oxidative stress and hepatic injury, ultimately leading to cirrhosis and liver cancer [4,7,8]. The “second hit” involves the activation of immune cells, in particular liver macrophages, which consist of blood-derived monocytes and liver-resident Kupffer cells [9,10]. The latter respond to extrahepatic inflammation or metabolic stress by coordinating a local immune response via the secretion of various soluble factors, most notably tumor necrosis factor (TNF) [11]. Contradicting the two-hit model, it was recently shown that interleukin(IL)-6 Cells 2020, 9, 2258; doi:10.3390/cells9102258 www.mdpi.com/journal/cells
Transcript of Hepatic Lipid Metabolism in High-Fat Diet and Inflammation
cells
Article
Kupffer Cells Sense Free Fatty Acids and RegulateHepatic Lipid Metabolism in High-Fat Dietand Inflammation
Kira L. Diehl, Julia Vorac, Kristina Hofmann, Philippa Meiser, Iris Unterweger,Lars Kuerschner , Heike Weighardt, Irmgard Förster and Christoph Thiele *
Life and Medical Science Institute (LIMES), University of Bonn, Carl-Troll-Straße 31, 53115 Bonn, Germany;[email protected] (K.L.D.); [email protected] (J.V.); [email protected] (K.H.);[email protected] (P.M.); [email protected] (I.U.); [email protected] (L.K.);[email protected] (H.W.); [email protected] (I.F.)* Correspondence: [email protected]; Tel.: +49-02-2873-62817
Received: 11 September 2020; Accepted: 6 October 2020; Published: 8 October 2020�����������������
Abstract: A high fat Western-style diet leads to hepatic steatosis that can progress to steatohepatitisand ultimately cirrhosis or liver cancer. The mechanism that leads to the development of steatosisupon nutritional overload is complex and only partially understood. Using click chemistry-basedmetabolic tracing and microscopy, we study the interaction between Kupffer cells and hepatocytesex vivo. In the early phase of steatosis, hepatocytes alone do not display significant deviations infatty acid metabolism. However, in co-cultures or supernatant transfer experiments, we show thattumor necrosis factor (TNF) secretion by Kupffer cells is necessary and sufficient to induce steatosis inhepatocytes, independent of the challenge of hepatocytes with elevated fatty acid levels. We furthershow that free fatty acid (FFA) or lipopolysaccharide are both able to trigger release of TNF fromKupffer cells. We conclude that Kupffer cells act as the primary sensor for both FFA overload andbacterial lipopolysaccharide, integrate these signals and transmit the information to the hepatocytevia TNF secretion. Hepatocytes react by alteration in lipid metabolism prominently leading to theaccumulation of triacylglycerols (TAGs) in lipid droplets, a hallmark of steatosis.
Keywords: non-alcoholic fatty liver disease; nutrition/lipids; metabolic disease; lipids/chemistry
1. Introduction
Non-alcoholic fatty liver disease (NAFLD) is the most common liver disease in industrializedcountries [1–3] presenting with a wide range of pathologies. This includes steatosis, which manifests inan excessive accumulation of lipid droplets (LDs) in hepatocytes, steatohepatitis, which is a combinationof steatosis and liver inflammation, and liver cirrhosis, i.e., excessive fibrosis with loss of hepatocytesand liver function.
The “two-hit model“ was postulated many years ago to describe NAFLD pathogenesis [4].The “first hit” is characterized by a reversible steatosis, thought to originate from excess amountsof free fatty acid (FFA), which are esterified to triacylglycerol (TAG). This links NAFLD to obesity,in which FFA are strongly elevated [5,6]. In the “second hit”, steatosis can progress into non-alcoholicsteatohepatitis, which additionally includes inflammation, scar formation, oxidative stress and hepaticinjury, ultimately leading to cirrhosis and liver cancer [4,7,8]. The “second hit” involves the activationof immune cells, in particular liver macrophages, which consist of blood-derived monocytes andliver-resident Kupffer cells [9,10]. The latter respond to extrahepatic inflammation or metabolic stress bycoordinating a local immune response via the secretion of various soluble factors, most notably tumornecrosis factor (TNF) [11]. Contradicting the two-hit model, it was recently shown that interleukin(IL)-6
Cells 2020, 9, 2258; doi:10.3390/cells9102258 www.mdpi.com/journal/cells
Cells 2020, 9, 2258 2 of 16
or TNF, originating from adipose tissue, can trigger liver inflammation in parallel with or even beforehepatic steatosis [12].
A potent inducer of inflammation is lipopolysaccharide (LPS)—a main component of the outermembrane of Gram-negative bacteria [13,14]. Excess consumption of fat and sugars leads to increasedlevels of gut-derived LPS in the circulation of obese and NAFLD patients [15].
There are three known causes for elevated serum LPS levels originating from the gut microbiota:Firstly, a Western style diet stimulates bacterial overgrowth and alters the microbiome in the gut.Secondly, sugars such as fructose trigger a disruption of the tight junctions in the gut, which leadsto an increased intestinal permeability (“leaky gut”). Thirdly, LPS is absorbed during fat digestionalongside chylomicrons, subsequently reaches the bloodstream [16], enters the liver and activatesToll-like receptor 4 (TLR4) signaling in Kupffer cells [10,17]. In turn, this activation results in thegeneration of cytotoxic factors such as reactive oxygen species, various inflammatory cytokines andchemokines that induce acute inflammation in the liver [18,19].
Recent studies reported that a selective depletion of Kupffer cells reduces the incidence ofsteatosis, liver injury, monocyte infiltration and even insulin resistance [11,20,21]. In particular,Tosello-Trampont et al. observed an important role for TNF in generating steatohepatitis in miceon a methionine/choline-deficient diet [11]. Furthermore, Jia et al. were able to show that micedeficient in hepatocyte TLR4 are protected from high-fat diet (HFD)-induced inflammation and insulinresistance [22].
In this paper, we aim to elucidate the individual contributions and the cellular interactionsbetween hepatocytes and Kupffer cells driving the early steatotic phenotype. For this purpose, we usetwo different but related strategies. The first strategy is a mild chronic steatosis developed in miceafter 10 weeks of HFD, the second one is the acute steatosis after in vivo LPS injection. In order todiscriminate between the contributions of the individual cell types, we use freshly isolated hepatocytesor Kupffer cells, or co-cultures of both cell types, and supernatant transfer experiments between Kupffercells and hepatocytes.
The data demonstrate that Kupffer cell activation by excess free fatty acids or LPS is necessaryand sufficient to induce hepatocellular steatosis by TNF signaling.
2. Materials and Methods
2.1. Mouse Experiments In Vivo
Male wild-type C57BL/6NCrl mice were purchased from Jackson Laboratory (Charles River,Erkrath, Germany), maintained under pathogen-free conditions in the animal facility of the LIMESInstitute and fed with a breeding and maintenance diet (LASQCdiet® Rod16, LASvendi, Soest,Germany) ad libitum. Animals were used for experiments at the age of 8 weeks. For feedingexperiments, 6-week-old mice were fed a controlled normal diet (C1090-10, 10 kcal% fat, ND) for2 weeks and either a ND or high-fat diet (C1090-60, 60 kcal% fat, HFD, both Altromin, Lage, Germany)for the subsequent 10 weeks ad libitum. Food intake was measured by determining the weight ofthe remaining food pellets after one week of feeding and kcal were calculated using the respectivevalues of energy density. Animal experiments were performed in conformity with PHS policy and inaccordance with the national laws. All protocols were approved by the Institutional Animal Care andUse Committee (Permission LANUV NRW, 84-02.04.2015.A381. The date of approval is 17 March 2016.).
2.1.1. Glucose Tolerance Tests
For glucose tolerance tests, ND and HFD mice were fasted overnight for 12 h. Mice were injectedintraperitoneally with 2 mg glucose per g body weight. Tail blood was collected and glucose levelsmeasured using a glucometer (Roche Diagnostics, Mannheim, Germany).
Cells 2020, 9, 2258 3 of 16
2.1.2. LPS and TNF In Vivo
Mice were injected intraperitoneally with 15 mg/kg Escherichia coli LPS serotype 011-B4(Sigma-Aldrich, St. Louis, USA) 1.5 h before liver perfusion.
2.1.3. Isolation and Culture of Hepatocytes and Kupffer Cells
Hepatocytes and Kupffer cells were isolated by a two-step collagenase liver perfusion asdescribed [23,24] with minor modifications. Briefly, after injecting heparin-sodium (30 Units/gbody weight, Ratiopharm, Ulm, Germany), mice were anesthetized with ketamin/xylazin. A butterflycannula (0.3 mm × 13 mm) was pricked into the portal vein and perfusion was started by pumpingHank’s balanced salt solution with 5 mM EGTA, pH 7.4 and 1 µL/mL heparin-sodium for 5 min at4 mL/min using a peristaltic pump, followed by perfusion with collagenase buffer (William’s MediumE, 0.125 mM CaCl2, 0.5 mg/mL collagenase NB46, Serva Electrophoresis, Heidelberg, Germany, cat no.17465) for 10 min. Afterwards, cells were released into 50 mL suspension medium (William’s MediumE supplemented with 10% (v/v) fetal calf serum, 2 mM L-Glutamine, 100 Units/mL penicillin, 100 µg/mLstreptomycin). The cell suspension was centrifuged at 14× g for 5 min. The pellet, containing thehepatocytes, was re-suspended in fresh suspension buffer and the suspension was filtered througha 100-µm Nylon cell strainer (Becton Dickinson, New Jersey, USA). The supernatant of the firstcentrifugation, containing the Kupffer cells, was re-centrifuged at 600× g for 10 min. The resultingpellet was re-suspended in Tris-buffered ammonium chloride lysis buffer (17 mM Tris, 160 mM NH4Cl,pH 7.2, for erythrocyte lysis) and incubated at room temperature for 5 min prior to the addition of10 mL PBS and subsequent centrifugation at 600× g for 10 min. CD11b MicroBeads (Miltenyi Biotech,Bergisch Gladbach, Germany, order no.: 130-049601) were added to the pellet and Kupffer cells werepurified according to the manufacturer’s protocol. Viability of hepatocytes and Kupffer cells wasaround 80–90% as assessed by trypan blue dye exclusion. Kupffer cells and hepatocytes were platedon collagen-coated dishes, maintained in suspension medium and kept at 37 ◦C and 5% (v/v) CO2.Two hours after plating, media of both cell types were renewed to discard non-adherent cells. Purity ofhepatocytes and Kupffer cells was checked by flow cytometry (Supplementary Figure S1A,B) (FACSCanto II, Becton Dickinson, New Jersey, USA).
2.1.4. Serum Parameters
After intraperitoneal injection of heparin-sodium, mouse blood was collected by cardiac punctureunder anesthesia as previously described [25]. Serum cholesterol, alanine aminotransferase andaspartate aminotransferase levels were measured using the Reflotron® Plus System (Roche Diagnostics,Rotkreuz, Switzerland). Measurement of serum FFA was performed using the FFA quantitation kit(Sigma-Aldrich, St. Louis, USA).
2.1.5. Determination of Total Hepatic Lipid Content
Livers were immediately homogenized in 4 mL methanol/chloroform (5:1, v/v) and phase separationwas induced by addition of 3.2 mL water and 0.8 mL chloroform. The chloroform phase was collectedand dried in a vacuum centrifuge. The weight of the resulting lipid pellet was determined.
2.2. In Vitro Experiments
2.2.1. LPS and TNF In Vitro
Primary hepatocytes and/or Kupffer cells were incubated in the presence or absence of 100 ng/mLLPS, or 10–50 ng/mL recombinant murine TNF (ImmunoTools, Friesoythe, Germany) and/or 100 ng/mLrecombinant rabbit anti-murine TNF antibody (Cat.#500-P64, PeproTech, Hamburg, Germany) at 37 ◦Cfor 16 h.
Cells 2020, 9, 2258 4 of 16
2.2.2. Hepatocyte/Kupffer Cell Co-Culture and Supernatant Transfer Experiments
For co-culture, 2.5 × 10⁵ hepatocytes were cultured with 7 × 10⁴ Kupffer cells in 6-well plates asdescribed [26,27] with minor modifications. For supernatant transfer experiments, a different ratio ofcell numbers was used, as described previously [28]. A total of 1 × 10⁶ Kupffer cells per well werecultured in 6-well plates for 16 h. The Kupffer cell supernatant was harvested and, after pelletingremnant cells at 600× g for 5 min, transferred to hepatocytes (2.5 × 10⁵) in 6-well plates and incubatedat 37 ◦C for 16 h.
2.2.3. Flow Cytometry
Hepatocytes were seeded in 6-cm dishes at a density of 3.5 × 10⁵ cells/well. After incubation at37 ◦C for 12 h, the cells were detached by scraping and pelleted by centrifugation at 11× g for 5 min.Kupffer cells were seeded in 12-well plates at a density of 3.5 × 10⁵ cells/well. After incubation at 37 ◦Cfor 12 h, the cells were detached by scraping and pelleted by centrifugation at 600× g for 10 min. Cellswere re-suspended in 200 µL PBS. Anti-mouse CD45RB-PE (BD Biosciences, Franklin Lakes, USA)and CD95-APC antibodies or CD11b-PE and F4/80-APC (Ebioscience, San Diego, USA) were addedaccording to the manufacturer’s instructions. After incubation at 4 ◦C for 20 min, cell fluorescence wasevaluated by flow cytometry using FACS Canto II (BD Biosciences, Franklin Lakes, USA).
2.2.4. Pulse-Chase Experiments with Alkyne Lipids
Hepatocytes (3.5 × 10⁵) were cultured in 6-cm dishes for 2 h and pulse-labeled for 2 min using66 µM alkyne-oleate and 33 µM alkyne-palmitate [29] in William’s Medium E containing 2 mML-Glutamine, 100 Units/mL penicillin, 100 µg/mL streptomycin and 1% delipidated BSA. Pulse mediawere removed, cells were washed with PBS + 1% delipidated BSA and chased in chase medium(66 µM oleate, 33 µM palmitate in William’s Medium E containing 2 mM L-Glutamine, 100 Units/mLpenicillin, 100 µg/mL streptomycin, 1% fatty acid-free BSA) for different periods as indicated. Chasemedia were removed and cells were washed twice with PBS. Lipids were extracted, subjected tofluorogenic click reaction according to the standard procedure [29]. Briefly, the dry lipid pellet wasredissolved in 7 µL chloroform, followed by addition of 30 µL click reaction mixture (5 µL of 44.5 mM3-azido-7-hydroxycoumarin, 500 µL of 10 mM [acetonitrile]4CuBF4 in acetonitrile, 2 mL ethanol).The tube was incubated at 42 ◦C for 3 h and the reaction mix applied onto a 20 × 20 cm silica thin layerchromatography (TLC) plate (no UV-indicator, Merck No. 1.05721.0001). The plate was developedin CHCl3/MeOH/water/acetic acid 65/25/4/1 for 10 cm, dried for 2 min in a warm stream of air, anddeveloped again for 18 cm in hexane/ethyl acetate 1/1. The plate was briefly dried in a stream ofwarm air and soaked for 5 sec in 4% (v/v) N,N-diisopropylethylamine in hexane. The plate wasplaced in a hood for 1 min to evaporate excess solvent, followed by fluorescent imaging (exc. 420 nm,em. 482–502 nm. Bands were identified by co-migrating synthetic standards. VLDL secretion wasdetermined by analyzing 120 min chase media for alkyne-labeled TG. For determination of fatty aciduptake, pulse times were extended to 10 min.
2.2.5. ELISA
In vivo (1.5 h) or in vitro (16 h) LPS-treated Kupffer cells (7 × 10⁴) were cultured in 96-well platesfor 16 h and the supernatants examined for cytokine secretion using commercial enzyme immunoassaykits (R&D Systems, Minneapolis, USA).
2.2.6. Fluorescence Microscopy
Hepatocytes (2.5 × 10⁵ per well of a 6-well dish) were plated with or without 7 × 10⁴ Kupffer cells,on collagen-coated glass coverslips. Cells were fixed in 4% PFA in PBS for 1 h, followed by stainingwith 0.1 µg/mL LD540 [30] and 1 µg/mL 4′,6-diamidino-2-phenylindole (DAPI). Coverslips were rinsedin water and mounted in fluorescent mounting medium (Dako, Hamburg, Germany). Epifluorescence
Cells 2020, 9, 2258 5 of 16
images were acquired on an Axio Observer Z1 (Zeiss, Oberkochen, Germany) in Apotome mode witha 63×, NA 1.4 Plan-Apochromat objective and a Hamamatsu Orca flash 2.0 camera. Quantification oflipid droplet size, number and total LD540 fluorescent area was performed using Fiji [31]. If indicated,data were normalized to total number of cells using equal threshold settings for all images in one figure.
2.3. Statistical Analysis
Statistical analysis was performed using GraphPad Prism software (version 5.0) (GraphPad,La Jolla, USA). All data are presented as mean values with SEM. Significance was analyzed with atwo-tailed Student’s t-test. Statistical significance is indicated as follows: ns, not significant, * p < 0.05,** p < 0.01, *** p < 0.001.
3. Results
3.1. High-Fat Diet (HFD) Mice Show Mild Steatotic Characteristics
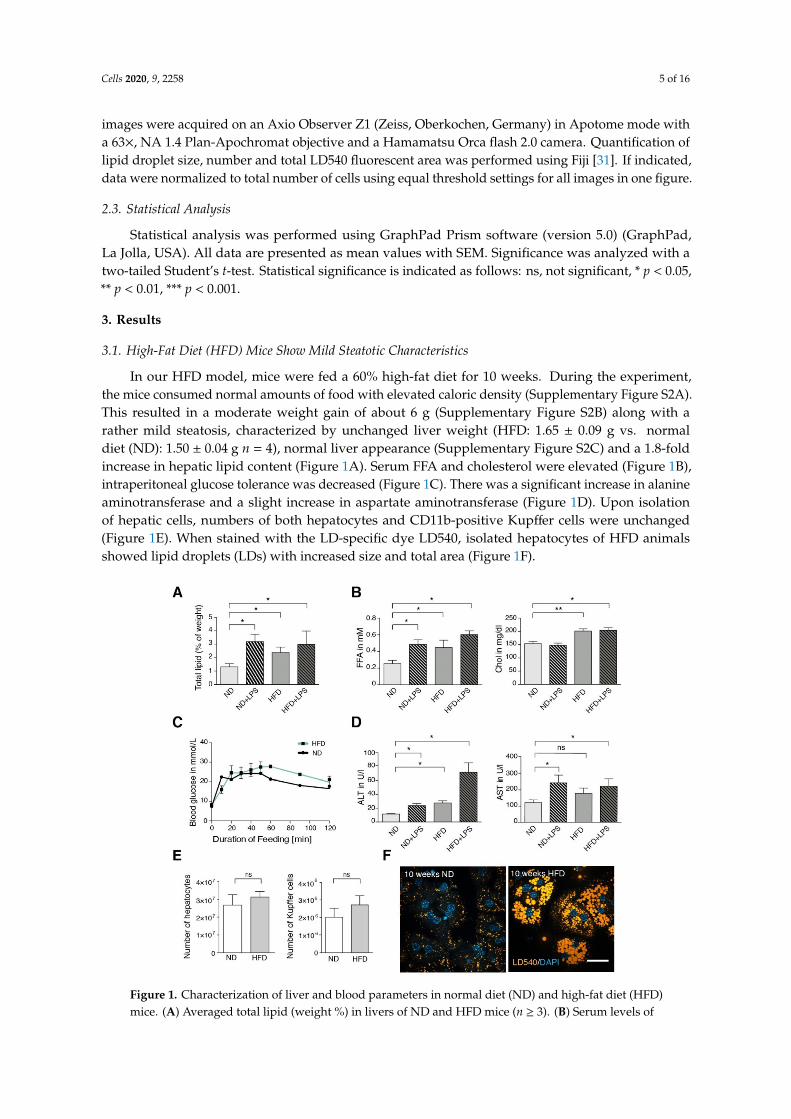
In our HFD model, mice were fed a 60% high-fat diet for 10 weeks. During the experiment,the mice consumed normal amounts of food with elevated caloric density (Supplementary Figure S2A).This resulted in a moderate weight gain of about 6 g (Supplementary Figure S2B) along with arather mild steatosis, characterized by unchanged liver weight (HFD: 1.65 ± 0.09 g vs. normaldiet (ND): 1.50 ± 0.04 g n = 4), normal liver appearance (Supplementary Figure S2C) and a 1.8-foldincrease in hepatic lipid content (Figure 1A). Serum FFA and cholesterol were elevated (Figure 1B),intraperitoneal glucose tolerance was decreased (Figure 1C). There was a significant increase in alanineaminotransferase and a slight increase in aspartate aminotransferase (Figure 1D). Upon isolationof hepatic cells, numbers of both hepatocytes and CD11b-positive Kupffer cells were unchanged(Figure 1E). When stained with the LD-specific dye LD540, isolated hepatocytes of HFD animalsshowed lipid droplets (LDs) with increased size and total area (Figure 1F).
Cells 2020, 9, x FOR PEER REVIEW 5 of 18
using Fiji [31]. If indicated, data were normalized to total number of cells using equal threshold settings for all images in one figure.
2.3. Statistical Analysis
Statistical analysis was performed using GraphPad Prism software (version 5.0) (GraphPad, La Jolla, USA). All data are presented as mean values with SEM. Significance was analyzed with a two-tailed Student’s t-test. Statistical significance is indicated as follows: ns, not significant, * p < 0.05, ** p < 0.01, *** p < 0.001.
3. Results
3.1. High-Fat Diet (HFD) Mice Show Mild Steatotic Characteristics
In our HFD model, mice were fed a 60% high-fat diet for 10 weeks. During the experiment, the mice consumed normal amounts of food with elevated caloric density (Supplementary Figure 2A). This resulted in a moderate weight gain of about 6 g (Supplementary Figure 2B) along with a rather mild steatosis, characterized by unchanged liver weight (HFD: 1.65 ± 0.09 g vs. normal diet (ND): 1.50 ± 0.04 g n = 4), normal liver appearance (Supplementary Figure 2C) and a 1.8-fold increase in hepatic lipid content (Figure 1A). Serum FFA and cholesterol were elevated (Figure 1B), intraperitoneal glucose tolerance was decreased (Fig. 1C). There was a significant increase in alanine aminotransferase and a slight increase in aspartate aminotransferase (Figure 1D). Upon isolation of hepatic cells, numbers of both hepatocytes and CD11b-positive Kupffer cells were unchanged (Figure 1E). When stained with the LD-specific dye LD540, isolated hepatocytes of HFD animals showed lipid droplets (LDs) with increased size and total area (Figure 1F).
Figure 1. Characterization of liver and blood parameters in normal diet (ND) and high-fat diet (HFD) mice. (A) Averaged total lipid (weight %) in livers of ND and HFD mice (n ≥ 3). (B) Serum levels of
Figure 1. Characterization of liver and blood parameters in normal diet (ND) and high-fat diet (HFD)mice. (A) Averaged total lipid (weight %) in livers of ND and HFD mice (n ≥ 3). (B) Serum levels of
Cells 2020, 9, 2258 6 of 16
free fatty acid (FFA) and cholesterol (Chol) of ND and HFD mice (n ≥ 3). (C) Intraperitoneal glucosetolerance test for ND and HFD mice (n = 3). (D) Serum levels of alanine aminotransferase (ALT)and aspartate aminotransferase (AST) in ND and HFD mice (n ≥ 3). (E) Total number of hepatocytesand Kupffer cells isolated per liver (n ≥ 3). (F) Lipid droplet staining (LD540) in hepatocytes after10 weeks of feeding. If indicated (+lipopolysaccharide (+LPS)), mice were injected intraperitoneallywith 15 mg/kg weight of E. coli LPS 1.5 h before liver perfusion. Scale bar: 50 µm. Data are representedas mean with SEM of at least three independent experiments as indicated. Significance was analyzedwith a two-tailed Student’s t-test. Statistical significance is indicated as follows: ns, not significant,* p < 0.05, ** p < 0.01.
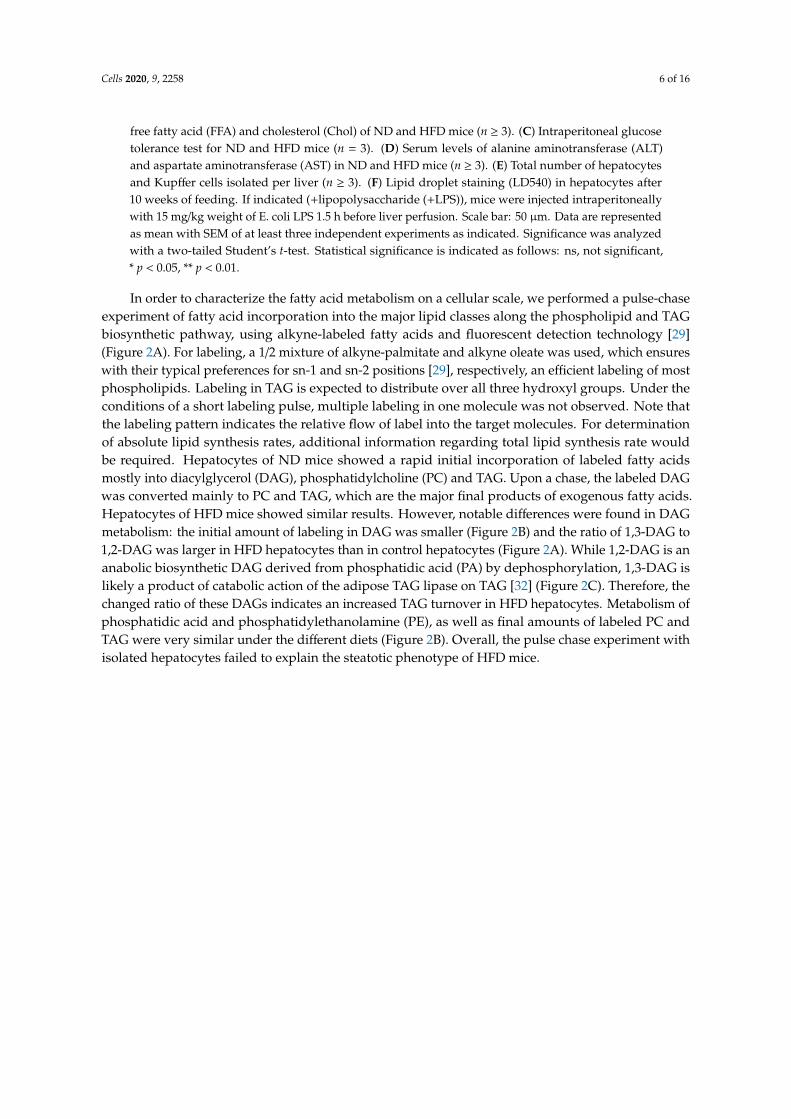
In order to characterize the fatty acid metabolism on a cellular scale, we performed a pulse-chaseexperiment of fatty acid incorporation into the major lipid classes along the phospholipid and TAGbiosynthetic pathway, using alkyne-labeled fatty acids and fluorescent detection technology [29](Figure 2A). For labeling, a 1/2 mixture of alkyne-palmitate and alkyne oleate was used, which ensureswith their typical preferences for sn-1 and sn-2 positions [29], respectively, an efficient labeling of mostphospholipids. Labeling in TAG is expected to distribute over all three hydroxyl groups. Under theconditions of a short labeling pulse, multiple labeling in one molecule was not observed. Note thatthe labeling pattern indicates the relative flow of label into the target molecules. For determinationof absolute lipid synthesis rates, additional information regarding total lipid synthesis rate wouldbe required. Hepatocytes of ND mice showed a rapid initial incorporation of labeled fatty acidsmostly into diacylglycerol (DAG), phosphatidylcholine (PC) and TAG. Upon a chase, the labeled DAGwas converted mainly to PC and TAG, which are the major final products of exogenous fatty acids.Hepatocytes of HFD mice showed similar results. However, notable differences were found in DAGmetabolism: the initial amount of labeling in DAG was smaller (Figure 2B) and the ratio of 1,3-DAG to1,2-DAG was larger in HFD hepatocytes than in control hepatocytes (Figure 2A). While 1,2-DAG is ananabolic biosynthetic DAG derived from phosphatidic acid (PA) by dephosphorylation, 1,3-DAG islikely a product of catabolic action of the adipose TAG lipase on TAG [32] (Figure 2C). Therefore, thechanged ratio of these DAGs indicates an increased TAG turnover in HFD hepatocytes. Metabolism ofphosphatidic acid and phosphatidylethanolamine (PE), as well as final amounts of labeled PC andTAG were very similar under the different diets (Figure 2B). Overall, the pulse chase experiment withisolated hepatocytes failed to explain the steatotic phenotype of HFD mice.
Cells 2020, 9, 2258 7 of 16Cells 2020, 9, x FOR PEER REVIEW 7 of 18
Figure 2. Lipid metabolism in isolated hepatocytes of ND and HFD mice. (A) Hepatocytes from ND or HFD mice were cultured for 2 h prior to pulse-chase experiments. After pulse incubation (2 min) with alkyne fatty acids, hepatocytes were washed and subsequently incubated with chase medium for the indicated time. Lipids were extracted and the extracts click-reacted with the dye azidocoumarin. Lipids were separated on a thin layer chromatography (TLC) plate and metabolites of alkyne fatty acids were detected by fluorescence imaging. Metabolites were identified by co-migrating standards. (B) Quantification of the TLC plates shown in panel A. Numbers indicate the percentage of the respective lipid class relative to total labeled lipid per lane (n ≥ 3). (C) Metabolic flow of fatty acids in the liver starting with the incorporation of acyl-CoA into glycerol-3-phosphate (G3P), lysophosphatidic acid (LPA), phosphatidic acid (PA) and ending with either the incorporation into triacylglycerol (TAG) or into the phospholipids phosphatidylcholine (PC) or phosphatidylethanolamine (PE). Lipolytic action of the enzyme ATGL (adipose TAG lipase) leads to the formation of diacylglycerol (DAG) from TAG. Mean values with SEM of triplicate determinations are shown. BG: background.
3.2. TNF Is a Major Player in Generating a Steatotic Phenotype in ND Hepatocytes
A possible explanation for this failure is a major contribution of other cell types in the liver, notably Kupffer cells, which communicate with hepatocytes via secreted factors. Therefore, we cultivated ex vivo Kupffer cells from ND and HFD mice and analyzed factors secreted into the culture medium. There were no differences in the secretion of IL-6, IL-10 and IL-1β, but an elevated secretion
Figure 2. Lipid metabolism in isolated hepatocytes of ND and HFD mice. (A) Hepatocytes fromND or HFD mice were cultured for 2 h prior to pulse-chase experiments. After pulse incubation(2 min) with alkyne fatty acids, hepatocytes were washed and subsequently incubated with chasemedium for the indicated time. Lipids were extracted and the extracts click-reacted with the dyeazidocoumarin. Lipids were separated on a thin layer chromatography (TLC) plate and metabolites ofalkyne fatty acids were detected by fluorescence imaging. Metabolites were identified by co-migratingstandards. (B) Quantification of the TLC plates shown in panel A. Numbers indicate the percentage ofthe respective lipid class relative to total labeled lipid per lane (n≥ 3). (C) Metabolic flow of fatty acids inthe liver starting with the incorporation of acyl-CoA into glycerol-3-phosphate (G3P), lysophosphatidicacid (LPA), phosphatidic acid (PA) and ending with either the incorporation into triacylglycerol (TAG)or into the phospholipids phosphatidylcholine (PC) or phosphatidylethanolamine (PE). Lipolytic actionof the enzyme ATGL (adipose TAG lipase) leads to the formation of diacylglycerol (DAG) from TAG.Mean values with SEM of triplicate determinations are shown. BG: background.
3.2. TNF Is a Major Player in Generating a Steatotic Phenotype in ND Hepatocytes
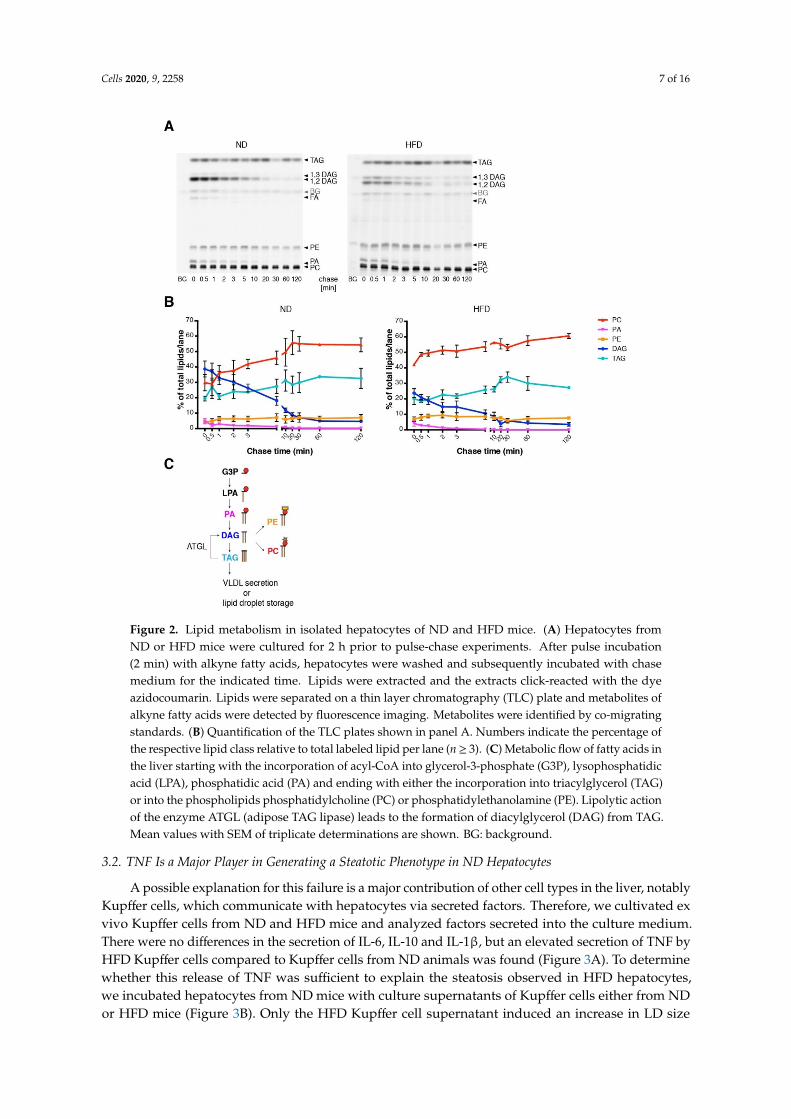
A possible explanation for this failure is a major contribution of other cell types in the liver, notablyKupffer cells, which communicate with hepatocytes via secreted factors. Therefore, we cultivated exvivo Kupffer cells from ND and HFD mice and analyzed factors secreted into the culture medium.There were no differences in the secretion of IL-6, IL-10 and IL-1β, but an elevated secretion of TNF byHFD Kupffer cells compared to Kupffer cells from ND animals was found (Figure 3A). To determinewhether this release of TNF was sufficient to explain the steatosis observed in HFD hepatocytes,we incubated hepatocytes from ND mice with culture supernatants of Kupffer cells either from NDor HFD mice (Figure 3B). Only the HFD Kupffer cell supernatant induced an increase in LD size
Cells 2020, 9, 2258 8 of 16
and total area per cell (Figure 3B, frame 3), which was reverted upon co-addition of a neutralizinganti-TNF antibody (frame 4). Image quantification confirmed these observations regarding total LDarea, LD diameter and LD number (Figure 3C). We conclude that Kupffer cell-derived TNF is necessaryto mediate steatosis in hepatocytes that have not been challenged with a HFD.
Cells 2020, 9, x FOR PEER REVIEW 8 of 18
of TNF by HFD Kupffer cells compared to Kupffer cells from ND animals was found (Figure 3A). To determine whether this release of TNF was sufficient to explain the steatosis observed in HFD hepatocytes, we incubated hepatocytes from ND mice with culture supernatants of Kupffer cells either from ND or HFD mice (Figure 3B). Only the HFD Kupffer cell supernatant induced an increase in LD size and total area per cell (Figure 3B, frame 3), which was reverted upon co-addition of a neutralizing anti-TNF antibody (frame 4). Image quantification confirmed these observations regarding total LD area, LD diameter and LD number (Figure 3C). We conclude that Kupffer cell-derived TNF is necessary to mediate steatosis in hepatocytes that have not been challenged with a HFD.
Figure 3. Kupffer cell supernatant from HFD mice stimulates steatosis in ND hepatocytes via tumor necrosis factor (TNF). (A) Cytokine secretion by Kupffer cells from untreated and LPS-treated ND and HFD mice. Mice were treated as indicated, Kupffer cells were isolated and cultured for 16 h. Secreted cytokines were measured by ELISA (TNF n ≥ 3, IL-1β n ≥ 3, IL-6 n ≥ 4, IL-10 n ≥ 2). (B) Freshly isolated hepatocytes (H) from ND mice were cultured in the absence (frame 1) or presence of 16 h pre-conditioned supernatant of Kupffer cells (KC sup) from ND (frame 2) or HFD mice (frame 3 and 4) as
Figure 3. Kupffer cell supernatant from HFD mice stimulates steatosis in ND hepatocytes via tumornecrosis factor (TNF). (A) Cytokine secretion by Kupffer cells from untreated and LPS-treated ND andHFD mice. Mice were treated as indicated, Kupffer cells were isolated and cultured for 16 h. Secretedcytokines were measured by ELISA (TNF n ≥ 3, IL-1β n ≥ 3, IL-6 n ≥ 4, IL-10 n ≥ 2). (B) Freshlyisolated hepatocytes (H) from ND mice were cultured in the absence (frame 1) or presence of 16 hpre-conditioned supernatant of Kupffer cells (KC sup) from ND (frame 2) or HFD mice (frame 3 and 4)as indicated. In frame 4, a neutralizing TNF antibody was added. Microscopy images of cells that werestained for lipid droplets (LD540) and nuclei (DAPI) are shown. Scale bar: 50 µm. (C) Quantificationof the total fluorescent LD area/cell, average LD diameter in µm and LD number/cell of the variousconditions (n ≥ 3). Mean values with SEM of at least three independent experiments are shown.H: hepatocytes, KC: Kupffer cells, ND: controlled normal diet, HFD: high-fat diet, sup: supernatant.Significance was analyzed with a two-tailed Student’s t-test. Statistical significance is indicated asfollows: ns, not significant, * p < 0.05, ** p < 0.01, *** p < 0.001.
Cells 2020, 9, 2258 9 of 16
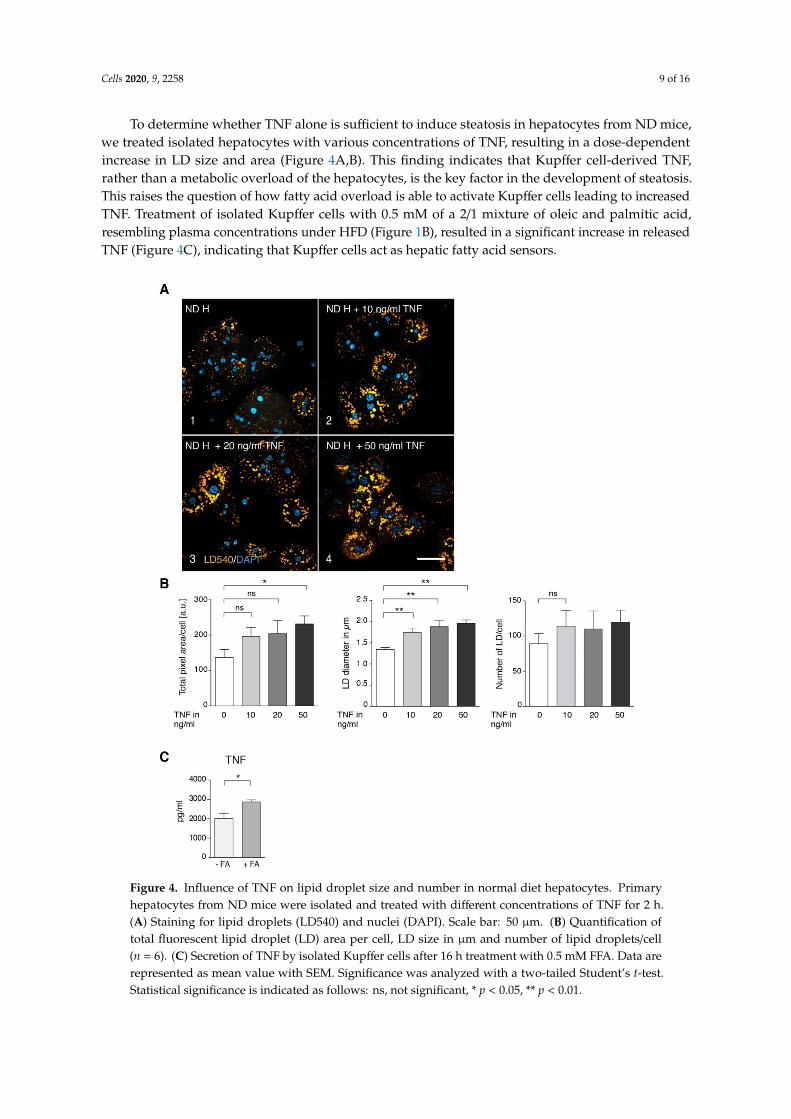
To determine whether TNF alone is sufficient to induce steatosis in hepatocytes from ND mice,we treated isolated hepatocytes with various concentrations of TNF, resulting in a dose-dependentincrease in LD size and area (Figure 4A,B). This finding indicates that Kupffer cell-derived TNF,rather than a metabolic overload of the hepatocytes, is the key factor in the development of steatosis.This raises the question of how fatty acid overload is able to activate Kupffer cells leading to increasedTNF. Treatment of isolated Kupffer cells with 0.5 mM of a 2/1 mixture of oleic and palmitic acid,resembling plasma concentrations under HFD (Figure 1B), resulted in a significant increase in releasedTNF (Figure 4C), indicating that Kupffer cells act as hepatic fatty acid sensors.Cells 2020, 9, x FOR PEER REVIEW 10 of 18
Figure 4. Influence of TNF on lipid droplet size and number in normal diet hepatocytes. Primary hepatocytes from ND mice were isolated and treated with different concentrations of TNF for 2 h. (A) Staining for lipid droplets (LD540) and nuclei (DAPI). Scale bar: 50 µm. (B) Quantification of total fluorescent lipid droplet (LD) area per cell, LD size in µm and number of lipid droplets/cell (n = 6). (C) Secretion of TNF by isolated Kupffer cells after 16 h treatment with 0.5 mM FFA. Data are represented as mean value with SEM. Significance was analyzed with a two-tailed Student’s t-test. Statistical significance is indicated as follows: ns, not significant, * p < 0.05, ** p < 0.01.
3.3. Short Term LPS Stimulation In Vivo Alters the Hepatic Lipid Metabolism
Besides HFD, also inflammatory stimuli including bacterial surface antigens such as LPS can lead to TNF secretion in the liver. LPS release into the portal vein blood is frequently discussed as a factor contributing to steatohepatitis caused by metabolic overload [33,34]. Therefore, we injected ND and HFD mice with 15 mg/kg LPS and analyzed total hepatic lipid weight and serum parameters (Fig. 1A, B, D). Both ND and HFD animals showed an increase in liver total lipids and serum FFA,
Figure 4. Influence of TNF on lipid droplet size and number in normal diet hepatocytes. Primaryhepatocytes from ND mice were isolated and treated with different concentrations of TNF for 2 h.(A) Staining for lipid droplets (LD540) and nuclei (DAPI). Scale bar: 50 µm. (B) Quantification oftotal fluorescent lipid droplet (LD) area per cell, LD size in µm and number of lipid droplets/cell(n = 6). (C) Secretion of TNF by isolated Kupffer cells after 16 h treatment with 0.5 mM FFA. Data arerepresented as mean value with SEM. Significance was analyzed with a two-tailed Student’s t-test.Statistical significance is indicated as follows: ns, not significant, * p < 0.05, ** p < 0.01.
Cells 2020, 9, 2258 10 of 16
3.3. Short Term LPS Stimulation In Vivo Alters the Hepatic Lipid Metabolism
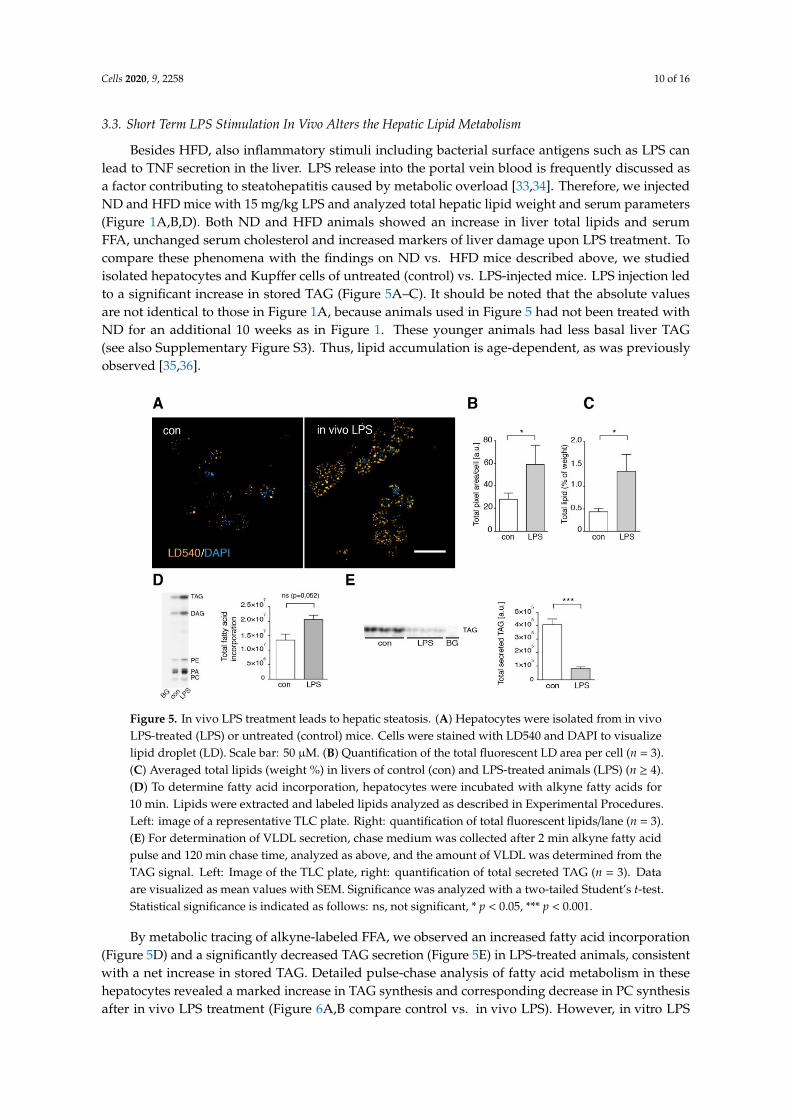
Besides HFD, also inflammatory stimuli including bacterial surface antigens such as LPS canlead to TNF secretion in the liver. LPS release into the portal vein blood is frequently discussed asa factor contributing to steatohepatitis caused by metabolic overload [33,34]. Therefore, we injectedND and HFD mice with 15 mg/kg LPS and analyzed total hepatic lipid weight and serum parameters(Figure 1A,B,D). Both ND and HFD animals showed an increase in liver total lipids and serumFFA, unchanged serum cholesterol and increased markers of liver damage upon LPS treatment. Tocompare these phenomena with the findings on ND vs. HFD mice described above, we studiedisolated hepatocytes and Kupffer cells of untreated (control) vs. LPS-injected mice. LPS injection ledto a significant increase in stored TAG (Figure 5A–C). It should be noted that the absolute valuesare not identical to those in Figure 1A, because animals used in Figure 5 had not been treated withND for an additional 10 weeks as in Figure 1. These younger animals had less basal liver TAG(see also Supplementary Figure S3). Thus, lipid accumulation is age-dependent, as was previouslyobserved [35,36].
Cells 2020, 9, x FOR PEER REVIEW 11 of 18
unchanged serum cholesterol and increased markers of liver damage upon LPS treatment. To compare these phenomena with the findings on ND vs. HFD mice described above, we studied isolated hepatocytes and Kupffer cells of untreated (control) vs. LPS-injected mice. LPS injection led to a significant increase in stored TAG (Figure 5A–C). It should be noted that the absolute values are not identical to those in Figure 1A, because animals used in Figure 5 had not been treated with ND for an additional 10 weeks as in Figure 1. These younger animals had less basal liver TAG (see also Supplementary Figure 3). Thus, lipid accumulation is age-dependent, as was previously observed [35,36].
Figure 5. In vivo LPS treatment leads to hepatic steatosis. (A) Hepatocytes were isolated from in vivo LPS-treated (LPS) or untreated (control) mice. Cells were stained with LD540 and DAPI to visualize lipid droplet (LD). Scale bar: 50 µM. (B) Quantification of the total fluorescent LD area per cell (n = 3). (C) Averaged total lipids (weight %) in livers of control (con) and LPS-treated animals (LPS) (n ≥ 4). (D) To determine fatty acid incorporation, hepatocytes were incubated with alkyne fatty acids for 10 min. Lipids were extracted and labeled lipids analyzed as described in Experimental Procedures. Left: image of a representative TLC plate. Right: quantification of total fluorescent lipids/lane (n = 3). (E) For determination of VLDL secretion, chase medium was collected after 2 min alkyne fatty acid pulse and 120 min chase time, analyzed as above, and the amount of VLDL was determined from the TAG signal. Left: Image of the TLC plate, right: quantification of total secreted TAG (n = 3). Data are visualized as mean values with SEM. Significance was analyzed with a two-tailed Student’s t-test. Statistical significance is indicated as follows: ns, not significant, * p < 0.05, *** p < 0.001.
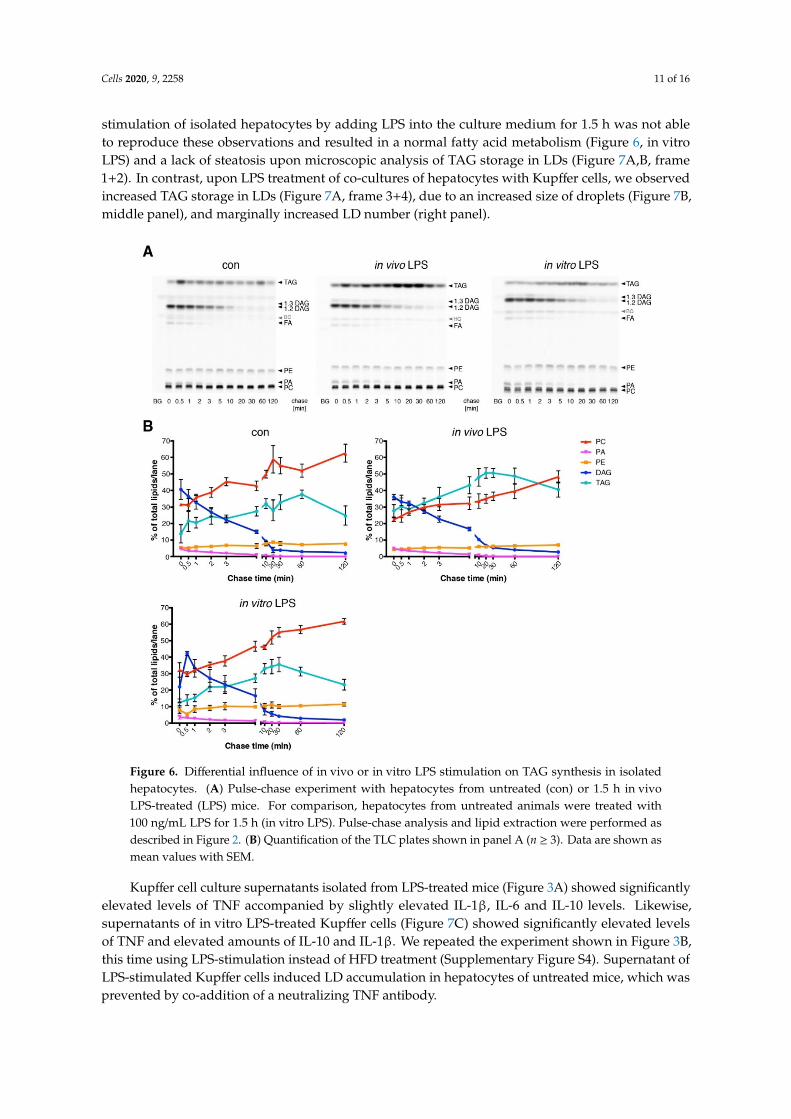
By metabolic tracing of alkyne-labeled FFA, we observed an increased fatty acid incorporation (Figure 5D) and a significantly decreased TAG secretion (Figure 5E) in LPS-treated animals, consistent with a net increase in stored TAG. Detailed pulse-chase analysis of fatty acid metabolism in these hepatocytes revealed a marked increase in TAG synthesis and corresponding decrease in PC synthesis after in vivo LPS treatment (Figure 6A,B compare control vs. in vivo LPS). However, in vitro LPS stimulation of isolated hepatocytes by adding LPS into the culture medium for 1.5 h was not able to reproduce these observations and resulted in a normal fatty acid metabolism (Figure 6, in vitro LPS) and a lack of steatosis upon microscopic analysis of TAG storage in LDs (Figure 7A,B, frame 1+2). In contrast, upon LPS treatment of co-cultures of hepatocytes with Kupffer cells, we observed increased TAG storage in LDs (Figure 7A, frame 3+4), due to an increased size of droplets (Figure 7B, middle panel), and marginally increased LD number (right panel).
Figure 5. In vivo LPS treatment leads to hepatic steatosis. (A) Hepatocytes were isolated from in vivoLPS-treated (LPS) or untreated (control) mice. Cells were stained with LD540 and DAPI to visualizelipid droplet (LD). Scale bar: 50 µM. (B) Quantification of the total fluorescent LD area per cell (n = 3).(C) Averaged total lipids (weight %) in livers of control (con) and LPS-treated animals (LPS) (n ≥ 4).(D) To determine fatty acid incorporation, hepatocytes were incubated with alkyne fatty acids for10 min. Lipids were extracted and labeled lipids analyzed as described in Experimental Procedures.Left: image of a representative TLC plate. Right: quantification of total fluorescent lipids/lane (n = 3).(E) For determination of VLDL secretion, chase medium was collected after 2 min alkyne fatty acidpulse and 120 min chase time, analyzed as above, and the amount of VLDL was determined from theTAG signal. Left: Image of the TLC plate, right: quantification of total secreted TAG (n = 3). Dataare visualized as mean values with SEM. Significance was analyzed with a two-tailed Student’s t-test.Statistical significance is indicated as follows: ns, not significant, * p < 0.05, *** p < 0.001.
By metabolic tracing of alkyne-labeled FFA, we observed an increased fatty acid incorporation(Figure 5D) and a significantly decreased TAG secretion (Figure 5E) in LPS-treated animals, consistentwith a net increase in stored TAG. Detailed pulse-chase analysis of fatty acid metabolism in thesehepatocytes revealed a marked increase in TAG synthesis and corresponding decrease in PC synthesisafter in vivo LPS treatment (Figure 6A,B compare control vs. in vivo LPS). However, in vitro LPS
Cells 2020, 9, 2258 11 of 16
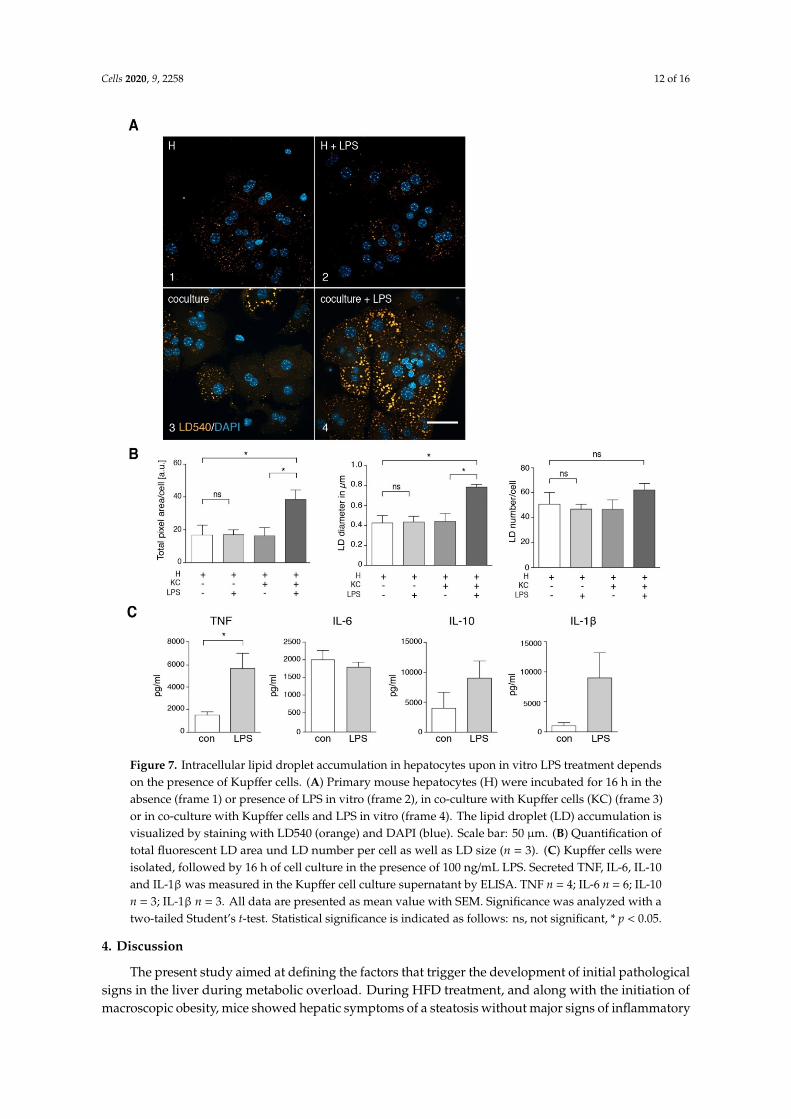
stimulation of isolated hepatocytes by adding LPS into the culture medium for 1.5 h was not ableto reproduce these observations and resulted in a normal fatty acid metabolism (Figure 6, in vitroLPS) and a lack of steatosis upon microscopic analysis of TAG storage in LDs (Figure 7A,B, frame1+2). In contrast, upon LPS treatment of co-cultures of hepatocytes with Kupffer cells, we observedincreased TAG storage in LDs (Figure 7A, frame 3+4), due to an increased size of droplets (Figure 7B,middle panel), and marginally increased LD number (right panel).Cells 2020, 9, x FOR PEER REVIEW 12 of 18
Figure 6. Differential influence of in vivo or in vitro LPS stimulation on TAG synthesis in isolated hepatocytes. (A) Pulse-chase experiment with hepatocytes from untreated (con) or 1.5 h in vivo LPS-treated (LPS) mice. For comparison, hepatocytes from untreated animals were treated with 100 ng/mL LPS for 1.5 h (in vitro LPS). Pulse-chase analysis and lipid extraction were performed as described in Figure 2. (B) Quantification of the TLC plates shown in panel A (n ≥ 3). Data are shown as mean values with SEM.
Kupffer cell culture supernatants isolated from LPS-treated mice (Figure 3A) showed significantly elevated levels of TNF accompanied by slightly elevated IL-1β, IL-6 and IL-10 levels. Likewise, supernatants of in vitro LPS-treated Kupffer cells (Figure 7C) showed significantly elevated levels of TNF and elevated amounts of IL-10 and IL-1β. We repeated the experiment shown in Figure 3B, this time using LPS-stimulation instead of HFD treatment (Supplementary Figure 4). Supernatant of LPS-stimulated Kupffer cells induced LD accumulation in hepatocytes of untreated mice, which was prevented by co-addition of a neutralizing TNF antibody.
Figure 6. Differential influence of in vivo or in vitro LPS stimulation on TAG synthesis in isolatedhepatocytes. (A) Pulse-chase experiment with hepatocytes from untreated (con) or 1.5 h in vivoLPS-treated (LPS) mice. For comparison, hepatocytes from untreated animals were treated with100 ng/mL LPS for 1.5 h (in vitro LPS). Pulse-chase analysis and lipid extraction were performed asdescribed in Figure 2. (B) Quantification of the TLC plates shown in panel A (n ≥ 3). Data are shown asmean values with SEM.
Kupffer cell culture supernatants isolated from LPS-treated mice (Figure 3A) showed significantlyelevated levels of TNF accompanied by slightly elevated IL-1β, IL-6 and IL-10 levels. Likewise,supernatants of in vitro LPS-treated Kupffer cells (Figure 7C) showed significantly elevated levelsof TNF and elevated amounts of IL-10 and IL-1β. We repeated the experiment shown in Figure 3B,this time using LPS-stimulation instead of HFD treatment (Supplementary Figure S4). Supernatant ofLPS-stimulated Kupffer cells induced LD accumulation in hepatocytes of untreated mice, which wasprevented by co-addition of a neutralizing TNF antibody.
Cells 2020, 9, 2258 12 of 16Cells 2020, 9, x FOR PEER REVIEW 13 of 18
Figure 7. Intracellular lipid droplet accumulation in hepatocytes upon in vitro LPS treatment depends on the presence of Kupffer cells. (A) Primary mouse hepatocytes (H) were incubated for 16 h in the absence (frame 1) or presence of LPS in vitro (frame 2), in co-culture with Kupffer cells (KC) (frame 3) or in co-culture with Kupffer cells and LPS in vitro (frame 4). The lipid droplet (LD) accumulation is visualized by staining with LD540 (orange) and DAPI (blue). Scale bar: 50 µm. (B) Quantification of total fluorescent LD area und LD number per cell as well as LD size (n = 3). (C) Kupffer cells were isolated, followed by 16 h of cell culture in the presence of 100 ng/mL LPS. Secreted TNF, IL-6, IL-10 and IL-1β was measured in the Kupffer cell culture supernatant by ELISA. TNF n = 4; IL-6 n = 6; IL-10 n = 3; IL-1β n = 3. All data are presented as mean value with SEM. Significance was analyzed with a two-tailed Student’s t-test. Statistical significance is indicated as follows: ns, not significant, * p < 0.05.
4. Discussion
The present study aimed at defining the factors that trigger the development of initial pathological signs in the liver during metabolic overload. During HFD treatment, and along with the initiation of macroscopic obesity, mice showed hepatic symptoms of a steatosis without major signs of inflammatory steatohepatitis. We observed marginally elevated serum transaminases,
Figure 7. Intracellular lipid droplet accumulation in hepatocytes upon in vitro LPS treatment dependson the presence of Kupffer cells. (A) Primary mouse hepatocytes (H) were incubated for 16 h in theabsence (frame 1) or presence of LPS in vitro (frame 2), in co-culture with Kupffer cells (KC) (frame 3)or in co-culture with Kupffer cells and LPS in vitro (frame 4). The lipid droplet (LD) accumulation isvisualized by staining with LD540 (orange) and DAPI (blue). Scale bar: 50 µm. (B) Quantification oftotal fluorescent LD area und LD number per cell as well as LD size (n = 3). (C) Kupffer cells wereisolated, followed by 16 h of cell culture in the presence of 100 ng/mL LPS. Secreted TNF, IL-6, IL-10and IL-1β was measured in the Kupffer cell culture supernatant by ELISA. TNF n = 4; IL-6 n = 6; IL-10n = 3; IL-1β n = 3. All data are presented as mean value with SEM. Significance was analyzed with atwo-tailed Student’s t-test. Statistical significance is indicated as follows: ns, not significant, * p < 0.05.
4. Discussion
The present study aimed at defining the factors that trigger the development of initial pathologicalsigns in the liver during metabolic overload. During HFD treatment, and along with the initiation ofmacroscopic obesity, mice showed hepatic symptoms of a steatosis without major signs of inflammatory
Cells 2020, 9, 2258 13 of 16
steatohepatitis. We observed marginally elevated serum transaminases, macroscopically normalsize and appearance of the organ, combined with slightly increased total liver lipids and with aclearly elevated number of cytoplasmic LDs in hepatocytes. In contrast to our expectations, detailedbiochemical experiments in hepatocytes of these organs showed a quantitatively and qualitativelynormal fatty acid metabolism. Increased secretion of TNF by Kupffer cells was the only marker thatpointed to an inflammatory component of the pathology at this early stage. Strikingly, Kupffer cellculture supernatant was sufficient to mirror the HFD phenotype in healthy hepatocytes and TNF wasidentified as the crucial component to mediate this effect.
A major advantage of cultivated primary cells is to discriminate between hepatocellular metabolicoverload stress and Kupffer cell-derived signals as causative agents for hepatocyte steatosis. The resultsclearly indicate that at least in this early phase of obesity, the contribution of Kupffer cells is moreimportant than the hepatocyte overload stress. Our data do not exclude steatotic contributions ofcells outside the liver, in particular factors released from adipose tissue, however, it appears verylikely that Kupffer cells are the major origin of signals that promote hepatic steatosis upon a high-fatdiet, consistent with in vivo studies on development of steatohepatitis upon choline/methionine-freediet [11].
In vivo LPS treatment leads to hepatic steatosis that is phenotypically similar to the one observedafter 10 weeks of HFD. Kupffer cells are essential for the development of steatosis, since LPS did notlead to steatosis when applied to pure hepatocytes. However, the profile of cytokines released byKupffer cells shows a broader activation of the inflammatory response, and serum transaminases aremore strongly elevated than upon HFD treatment. On the biochemical level, the LPS-induced steatosisis reflected by an altered fatty acid pulse-chase profile, which was not observed in HFD hepatocytes.Despite these differences, our data indicate that the LPS-induced steatosis also depends on Kupffercell-derived TNF. The comparison between HFD and LPS treatment suggests that TNF, regardless ofthe cause of its release, is the major mediator of hepatic steatosis.
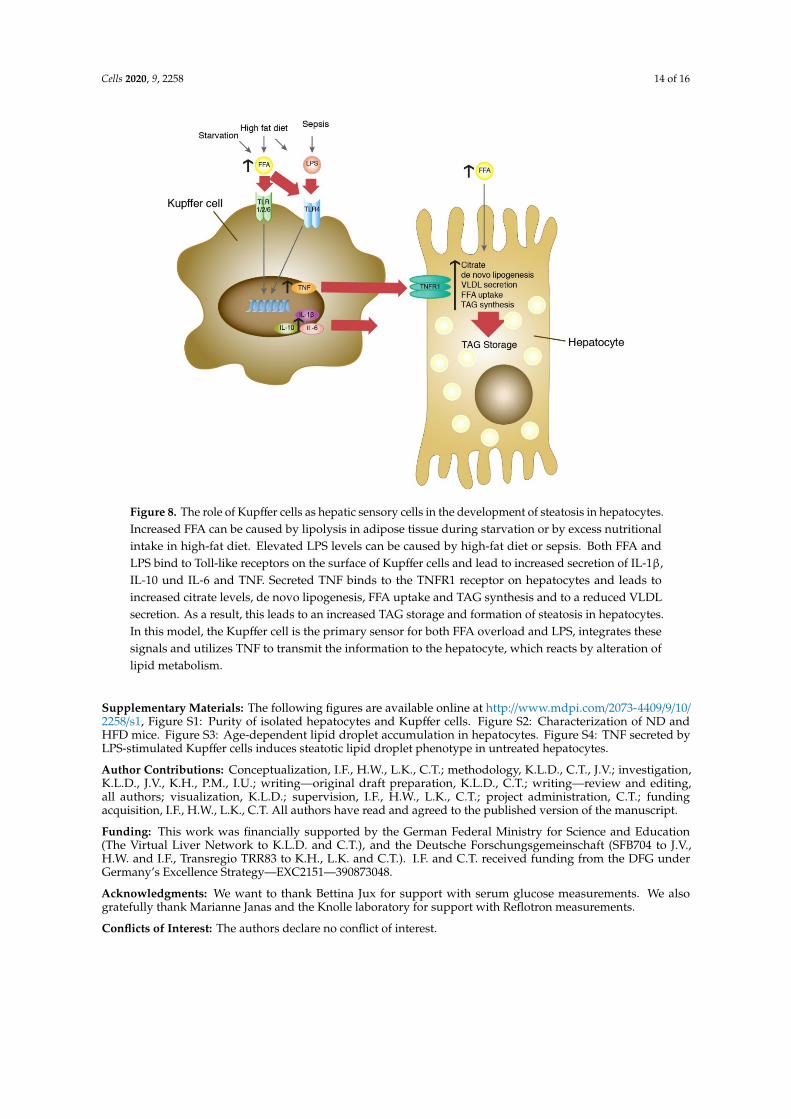
In this context, it is intriguing that fasting mice develop an intermittent steatosis with increasedFFA [37] and have strongly elevated serum TNF concentrations [38]. As shown in Figure 4C, treatmentof isolated Kupffer cells with 0.5 mM FFA, a concentration found in serum upon challenge with HFDor LPS or both (Figure 1B), or in starving mice [37] resulted in increased secretion of TNF. This isconsistent with previous experiments on induction of TNF mRNA expression in Kupffer cells byFFA [39]. Furthermore, FFAs were shown to induce TLR4 signaling in RAW264.7 cells [40] andthe expression of TLR4 in Kupffer cells [39]. In addition, HFD-fed mice are more susceptible to asustained low-dose LPS-induced increase in TNF [41], which appears to be mediated by leptin-inducedexpression of CD14, a co-receptor of TLR4. Conclusively, elevated FFA, originating from nutritionaloverload or released from adipose tissue during fasting, would be the primary cause of TNF releasefrom Kupffer cells that leads to hepatocyte steatosis. TLR4 is a likely candidate as an FFA receptoron Kupffer cells to sense fatty acid abundance and overload in the liver. As illustrated in Figure 8,Kupffer cells appear to act as hepatic FFA sensory cells that monitor the fatty acid load and triggerhepatocyte response.
Cells 2020, 9, 2258 14 of 16Cells 2020, 9, x FOR PEER REVIEW 15 of 18
Figure 8. The role of Kupffer cells as hepatic sensory cells in the development of steatosis in hepatocytes. Increased FFA can be caused by lipolysis in adipose tissue during starvation or by excess nutritional intake in high-fat diet. Elevated LPS levels can be caused by high-fat diet or sepsis. Both FFA and LPS bind to Toll-like receptors on the surface of Kupffer cells and lead to increased secretion of IL-1β, IL-10 und IL-6 and TNF. Secreted TNF binds to the TNFR1 receptor on hepatocytes and leads to increased citrate levels, de novo lipogenesis, FFA uptake and TAG synthesis and to a reduced VLDL secretion. As a result, this leads to an increased TAG storage and formation of steatosis in hepatocytes. In this model, the Kupffer cell is the primary sensor for both FFA overload and LPS, integrates these signals and utilizes TNF to transmit the information to the hepatocyte, which reacts by alteration of lipid metabolism.
Supplementary Materials: The following figures are available online at www.mdpi.com/xxx/s1, Figure S1: Purity of isolated hepatocytes and Kupffer cells., Figure S2: Characterization of ND and HFD mice., Figure S3: Age-dependent lipid droplet accumulation in hepatocytes., Figure S4: TNF secreted by LPS-stimulated Kupffer cells induces steatotic lipid droplet phenotype in untreated hepatocytes.
Author Contributions: Conceptualization, I.F., H.W., L.K., C.T.; methodology, K.L.D., C.T., J.V.; investigation, K.L.D., J.V., K.H., P.M., I.U., ; writing—original draft preparation, K.L.D., C.T.; writing—review and editing, all authors; visualization, K.L.D.; supervision, I.F., H.W., L.K., C.T.; project administration, C.T.; funding acquisition, I.F., H.W., L.K., C.T. All authors have read and agreed to the published version of the manuscript.
Funding: This work was financially supported by the German Federal Ministry for Science and Education (The Virtual Liver Network to K.L.D. and C.T.), and the Deutsche Forschungsgemeinschaft (SFB704 to J.V., H.W. and I.F., Transregio TRR83 to K.H., L.K. and C.T.). I.F. and C.T. received funding from the DFG under Germany’s Excellence Strategy – EXC2151 – 390873048.
Acknowledgments: We want to thank Bettina Jux for support with serum glucose measurements. We also gratefully thank Marianne Janas and the Knolle laboratory for support with Reflotron measurements.
Conflicts of Interest: The authors declare no conflict of interest.
References:
Figure 8. The role of Kupffer cells as hepatic sensory cells in the development of steatosis in hepatocytes.Increased FFA can be caused by lipolysis in adipose tissue during starvation or by excess nutritionalintake in high-fat diet. Elevated LPS levels can be caused by high-fat diet or sepsis. Both FFA andLPS bind to Toll-like receptors on the surface of Kupffer cells and lead to increased secretion of IL-1β,IL-10 und IL-6 and TNF. Secreted TNF binds to the TNFR1 receptor on hepatocytes and leads toincreased citrate levels, de novo lipogenesis, FFA uptake and TAG synthesis and to a reduced VLDLsecretion. As a result, this leads to an increased TAG storage and formation of steatosis in hepatocytes.In this model, the Kupffer cell is the primary sensor for both FFA overload and LPS, integrates thesesignals and utilizes TNF to transmit the information to the hepatocyte, which reacts by alteration oflipid metabolism.
Supplementary Materials: The following figures are available online at http://www.mdpi.com/2073-4409/9/10/2258/s1, Figure S1: Purity of isolated hepatocytes and Kupffer cells. Figure S2: Characterization of ND andHFD mice. Figure S3: Age-dependent lipid droplet accumulation in hepatocytes. Figure S4: TNF secreted byLPS-stimulated Kupffer cells induces steatotic lipid droplet phenotype in untreated hepatocytes.
Author Contributions: Conceptualization, I.F., H.W., L.K., C.T.; methodology, K.L.D., C.T., J.V.; investigation,K.L.D., J.V., K.H., P.M., I.U.; writing—original draft preparation, K.L.D., C.T.; writing—review and editing,all authors; visualization, K.L.D.; supervision, I.F., H.W., L.K., C.T.; project administration, C.T.; fundingacquisition, I.F., H.W., L.K., C.T. All authors have read and agreed to the published version of the manuscript.
Funding: This work was financially supported by the German Federal Ministry for Science and Education(The Virtual Liver Network to K.L.D. and C.T.), and the Deutsche Forschungsgemeinschaft (SFB704 to J.V.,H.W. and I.F., Transregio TRR83 to K.H., L.K. and C.T.). I.F. and C.T. received funding from the DFG underGermany’s Excellence Strategy—EXC2151—390873048.
Acknowledgments: We want to thank Bettina Jux for support with serum glucose measurements. We alsogratefully thank Marianne Janas and the Knolle laboratory for support with Reflotron measurements.
Conflicts of Interest: The authors declare no conflict of interest.
Cells 2020, 9, 2258 15 of 16
References
1. Marchesini, G.; Brizi, M.; Bianchi, G.; Tomassetti, S.; Bugianesi, E.; Lenzi, M.; McCullough, A.J.; Natale, S.;Forlani, G.; Melchionda, N. Nonalcoholic fatty liver disease: A feature of the metabolic syndrome. Diabetes2001, 50, 1844–1850. [CrossRef] [PubMed]
2. Clark, J.M.; Brancati, F.L.; Diehl, A.M. Nonalcoholic fatty liver disease. Gastroenterology 2002, 122, 1649–1657.[CrossRef] [PubMed]
3. Meli, R.; Mattace Raso, G.; Calignano, A. Role of innate immune response in non-alcoholic Fatty liver disease:Metabolic complications and therapeutic tools. Front. Immunol. 2014, 5, 177. [CrossRef] [PubMed]
4. Day, C.P.; James, O.F. Steatohepatitis: A tale of two “hits”? Gastroenterology 1998, 114, 842–845. [CrossRef]5. Arner, P. Insulin resistance in type 2 diabetes: Role of fatty acids. Diabetes. Metab. Res. Rev. 2002, 18 (Suppl. 2),
S5–S9. [CrossRef] [PubMed]6. Boden, G. Obesity and free fatty acids. Endocrinol. Metab. Clin. North Am. 2008, 37, 635–646. [CrossRef]7. Jansen, P.L.M. Non-alcoholic steatohepatitis. Eur. J. Gastroenterol. Hepatol. 2004, 16, 1079–1085. [CrossRef]8. Cohen, J.C.; Horton, J.D.; Hobbs, H.H. Human fatty liver disease: Old questions and new insights. Science
2011, 332, 1519–1523. [CrossRef]9. Baffy, G. Kupffer cells in non-alcoholic fatty liver disease: The emerging view. J. Hepatol. 2009, 51, 212–223.
[CrossRef]10. Zhan, Y.-T.; An, W. Roles of liver innate immune cells in nonalcoholic fatty liver disease. World J. Gastroenterol.
2010, 16, 4652–4660. [CrossRef]11. Tosello-Trampont, A.-C.; Landes, S.G.; Nguyen, V.; Novobrantseva, T.I.; Hahn, Y.S. Kuppfer cells trigger
nonalcoholic steatohepatitis development in diet-induced mouse model through tumor necrosis factor-αproduction. J. Biol. Chem. 2012, 287, 40161–40172. [CrossRef] [PubMed]
12. Tilg, H.; Moschen, A.R. Evolution of inflammation in nonalcoholic fatty liver disease: The multiple parallelhits hypothesis. Hepatology 2010, 52, 1836–1846. [CrossRef] [PubMed]
13. Jack, R.S.; Fan, X.; Bernheiden, M.; Rune, G.; Ehlers, M.; Weber, A.; Kirsch, G.; Mentel, R.; Fürll, B.;Freudenberg, M.; et al. Lipopolysaccharide-binding protein is required to combat a murine gram-negativebacterial infection. Nature 1997, 389, 742–745. [CrossRef] [PubMed]
14. Heumann, D.; Roger, T. Initial responses to endotoxins and Gram-negative bacteria. Clin. Chim. Acta 2002,323, 59–72. [CrossRef]
15. Harte, A.L.; da Silva, N.F.; Creely, S.J.; McGee, K.C.; Billyard, T.; Youssef-Elabd, E.M.; Tripathi, G.; Ashour, E.;Abdalla, M.S.; Sharada, H.M.; et al. Elevated endotoxin levels in non-alcoholic fatty liver disease. J. Inflamm.(Lond) 2010, 7, 15. [CrossRef] [PubMed]
16. Harris, K.; Kassis, A.; Major, G.; Chou, C.J. Is the gut microbiota a new factor contributing to obesity and itsmetabolic disorders? J. Obes. 2012, 2012, 879151. [CrossRef]
17. Soares, J.-B.; Pimentel-Nunes, P.; Roncon-Albuquerque, R.; Leite-Moreira, A. The role oflipopolysaccharide/toll-like receptor 4 signaling in chronic liver diseases. Hepatol. Int. 2010, 4, 659–672.[CrossRef]
18. Kolios, G.; Valatas, V.; Kouroumalis, E. Role of Kupffer cells in the pathogenesis of liver disease. World J.Gastroenterol. 2006, 12, 7413–7420. [CrossRef]
19. Duarte, N.; Coelho, I.C.; Patarrão, R.S.; Almeida, J.I.; Penha-Gonçalves, C.; Macedo, M.P. How InflammationImpinges on NAFLD: A Role for Kupffer Cells. BioMed Res. Int. 2015, 2015, 984578. [CrossRef]
20. Stienstra, R.; Saudale, F.; Duval, C.; Keshtkar, S.; Groener, J.E.M.; van Rooijen, N.; Staels, B.; Kersten, S.;Müller, M. Kupffer cells promote hepatic steatosis via interleukin-1beta-dependent suppression of peroxisomeproliferator-activated receptor alpha activity. Hepatology 2010, 51, 511–522. [CrossRef]
21. Huang, W.; Metlakunta, A.; Dedousis, N.; Zhang, P.; Sipula, I.; Dube, J.J.; Scott, D.K.; O’Doherty, R.M.Depletion of liver Kupffer cells prevents the development of diet-induced hepatic steatosis and insulinresistance. Diabetes 2010, 59, 347–357. [CrossRef] [PubMed]
22. Jia, L.; Vianna, C.R.; Fukuda, M.; Berglund, E.D.; Liu, C.; Tao, C.; Sun, K.; Liu, T.; Harper, M.J.; Lee, C.E.; et al.Hepatocyte Toll-like receptor 4 regulates obesity-induced inflammation and insulin resistance. Nat. Commun.2014, 5, 3878. [CrossRef] [PubMed]
Cells 2020, 9, 2258 16 of 16
23. Severgnini, M.; Sherman, J.; Sehgal, A.; Jayaprakash, N.K.; Aubin, J.; Wang, G.; Zhang, L.; Peng, C.G.;Yucius, K.; Butler, J.; et al. A rapid two-step method for isolation of functional primary mouse hepatocytes:Cell characterization and asialoglycoprotein receptor based assay development. Cytotechnology 2012, 64,187–195. [CrossRef] [PubMed]
24. Li, P.-z.; Li, J.-z.; Li, M.; Gong, J.-p.; He, K. An efficient method to isolate and culture mouse Kupffer cells.Immunol. Lett. 2014, 158, 52–56. [CrossRef] [PubMed]
25. Parasuraman, S.; Raveendran, R.; Kesavan, R. Blood sample collection in small laboratory animals.J. Pharmacol. Pharmacother. 2010, 1, 87–93. [CrossRef]
26. Lopez, B.G.; Tsai, M.S.; Baratta, J.L.; Longmuir, K.J.; Robertson, R.T. Characterization of Kupffer cells in liversof developing mice. Comp. Hepatol. 2011, 10, 2. [CrossRef]
27. Sunman, J.A.; Hawke, R.L.; LeCluyse, E.L.; Kashuba, A.D.M. Kupffer cell-mediated IL-2 suppression ofCYP3A activity in human hepatocytes. Drug Metab. Dispos. 2004, 32, 359–363. [CrossRef]
28. Yerkovich, S.T.; Rigby, P.J.; Fournier, P.A.; Olynyk, J.K.; Yeoh, G.C.T. Kupffer cell cytokines interleukin-1betaand interleukin-10 combine to inhibit phosphoenolpyruvate carboxykinase and gluconeogenesis in culturedhepatocytes. Int. J. Biochem. Cell Biol. 2004, 36, 1462–1472. [CrossRef]
29. Thiele, C.; Papan, C.; Hoelper, D.; Kusserow, K.; Gaebler, A.; Schoene, M.; Piotrowitz, K.; Lohmann, D.;Spandl, J.; Stevanovic, A.; et al. Tracing fatty acid metabolism by click chemistry. ACS Chem. Biol. 2012, 7,2004–2011. [CrossRef]
30. Spandl, J.; White, D.J.; Peychl, J.; Thiele, C. Live cell multicolor imaging of lipid droplets with a new dye,LD540. Traffic 2009, 10, 1579–1584. [CrossRef]
31. Schindelin, J.; Arganda-Carreras, I.; Frise, E.; Kaynig, V.; Longair, M.; Pietzsch, T.; Preibisch, S.; Rueden, C.;Saalfeld, S.; Schmid, B.; et al. Fiji: An open-source platform for biological-image analysis. Nat. Methods 2012,9, 676–682. [CrossRef] [PubMed]
32. Eichmann, T.O.; Kumari, M.; Haas, J.T.; Farese, R.V.; Zimmermann, R.; Lass, A.; Zechner, R. Studieson the substrate and stereo/regioselectivity of adipose triglyceride lipase, hormone-sensitive lipase,and diacylglycerol-O-acyltransferases. J. Biol. Chem. 2012, 287, 41446–41457. [CrossRef] [PubMed]
33. Wigg, A.J.; Roberts-Thomson, I.C.; Dymock, R.B.; McCarthy, P.J.; Grose, R.H.; Cummins, A.G. The role ofsmall intestinal bacterial overgrowth, intestinal permeability, endotoxaemia, and tumour necrosis factoralpha in the pathogenesis of non-alcoholic steatohepatitis. Gut 2001, 48, 206–211. [CrossRef] [PubMed]
34. Roh, Y.S.; Seki, E. Toll-like receptors in alcoholic liver disease, non-alcoholic steatohepatitis and carcinogenesis.J. Gastroenterol. Hepatol. 2013, 28 (Suppl. 1), 38–42. [CrossRef]
35. Petersen, K.F.; Befroy, D.; Dufour, S.; Dziura, J.; Ariyan, C.; Rothman, D.L.; DiPietro, L.; Cline, G.W.;Shulman, G.I. Mitochondrial dysfunction in the elderly: Possible role in insulin resistance. Science 2003, 300,1140–1142. [CrossRef]
36. Ibdah, J.A.; Perlegas, P.; Zhao, Y.; Angdisen, J.; Borgerink, H.; Shadoan, M.K.; Wagner, J.D.; Matern, D.;Rinaldo, P.; Cline, J.M. Mice heterozygous for a defect in mitochondrial trifunctional protein develop hepaticsteatosis and insulin resistance. Gastroenterology 2005, 128, 1381–1390. [CrossRef]
37. Baker, N.; Hill, V.; Ookhtens, M. Regulation of plasma-free fatty acid mobilization by dietary glucose inEhrlich ascites tumor-bearing mice. Cancer Res. 1978, 38, 2372–2377.
38. Faggioni, R.; Moser, A.; Feingold, K.R.; Grunfeld, C. Reduced leptin levels in starvation increase susceptibilityto endotoxic shock. Am. J. Pathol. 2000, 156, 1781–1787. [CrossRef]
39. Tang, T.; Sui, Y.; Lian, M.; Li, Z.; Hua, J. Pro-inflammatory activated Kupffer cells by lipids induce hepaticNKT cells deficiency through activation-induced cell death. PLoS ONE 2013, 8, e81949. [CrossRef]
40. Shi, H.; Kokoeva, M.V.; Inouye, K.; Tzameli, I.; Yin, H.; Flier, J.S. TLR4 links innate immunity and fattyacid-induced insulin resistance. J. Clin. Investig. 2006, 116, 3015–3025. [CrossRef]
41. Imajo, K.; Fujita, K.; Yoneda, M.; Nozaki, Y.; Ogawa, Y.; Shinohara, Y.; Kato, S.; Mawatari, H.; Shibata, W.;Kitani, H.; et al. Hyperresponsivity to low-dose endotoxin during progression to nonalcoholic steatohepatitisis regulated by leptin-mediated signaling. Cell Metab. 2012, 16, 44–54. [CrossRef] [PubMed]
© 2020 by the authors. Licensee MDPI, Basel, Switzerland. This article is an open accessarticle distributed under the terms and conditions of the Creative Commons Attribution(CC BY) license (http://creativecommons.org/licenses/by/4.0/).


![Review Article OATP Transporters: Potential Targets …...CoA reductase inhibitor lipid-lowering medications [37,38]. Not surprisingly, reduced activity of these hepatic OATPs have](https://static.fdocuments.us/doc/165x107/5f5677478cf3330b12632d4c/review-article-oatp-transporters-potential-targets-coa-reductase-inhibitor.jpg)


