Healthy San Mateo
6
Healthy San Mateo Where we live, learn, work, and play profoundly shape our ability to be healthy. Place impacts health by shaping the choices made available to us – and whether the healthy choice is the easy choice – through social, economic, and environmental factors known as social determinants of health. These determinants of health are responsible for health inequities, or preventable differences in health outcomes among populations. By building healthy, equitable communities that address these disparities, we can ensure that everyone has equitable opportunities to live a long and healthy life. The Healthy Cities SMC profile is a snapshot of indicators for San Mateo County residents and the places they live, work and play. These measures help us understand the types of opportunities a city has to support health and why some places are healthier than others. Understanding why people in some cities live longer and have more opportunities to be healthy helps us identify what is working and what can be improved. Indicators are organized by key priority areas identified through the 2015 strategic planning process for how to create healthy, equitable communities in San Mateo County: Healthy Housing, Healthy Neighborhoods, Healthy Schools, and Healthy Economy. Demographic data is also provided in each profile. Health data is available through the San Mateo County Health System. To see how San Mateo compares to other cities in San Mateo County, visit Healthy Cities SMC. About Get Healthy San Mateo County Get Healthy San Mateo County (GHSMC) is a community collaborative of community-based organizations, County agencies, cities, schools, hospitals, and leaders working together to advance healthy, equitable communities in San Mateo County. GHSMC uses policy change to prevent diseases and ensure everyone has equitable opportunities to live a long and healthy life. The collaborative is facilitated by the San Mateo County Health System. GHSMC supports the advancement of the 10 essential public health services as defined by the Centers for Disease Control and Prevention. Learn more at www.GetHealthySMC.org.
Transcript of Healthy San Mateo
Healthy San Mateo
Where we live, learn, work, and play
profoundly shape our ability to be healthy.
Place impacts health by shaping the choices
made available to us – and whether the
healthy choice is the easy choice – through
social, economic, and environmental factors
known as social determinants of health.
These determinants of health are responsible
for health inequities, or preventable
differences in health outcomes among
populations. By building healthy, equitable
communities that address these disparities,
we can ensure that everyone has equitable
opportunities to live a long and healthy life.
The Healthy Cities SMC profile is a
snapshot of indicators for San Mateo
County residents and the places they live,
work and play. These measures help us
understand the types of opportunities a city
has to support health and why some places
are healthier than others. Understanding why
people in some cities live longer and have
more opportunities to be healthy helps us
identify what is working and what can be
improved.
Indicators are organized by key priority areas
identified through the 2015 strategic planning
process for how to create healthy, equitable
communities in San Mateo County: Healthy
Housing, Healthy Neighborhoods, Healthy
Schools, and Healthy Economy. Demographic
data is also provided in each profile. Health
data is available through the San Mateo
County Health System.
To see how San Mateo compares to other
cities in San Mateo County, visit Healthy
Cities SMC.
About Get Healthy San Mateo County
Get Healthy San Mateo County (GHSMC) is a
community collaborative of community-based
organizations, County agencies, cities,
schools, hospitals, and leaders working
together to advance healthy, equitable
communities in San Mateo County. GHSMC
uses policy change to prevent diseases and
ensure everyone has equitable opportunities
to live a long and healthy life. The
collaborative is facilitated by the San Mateo
County Health System.
GHSMC supports the advancement of the 10
essential public health services as defined by
the Centers for Disease Control and
Prevention. Learn more at
www.GetHealthySMC.org.
Healthy Cities SMC, San Mateo Building Healthy, Equitable Communities (May 2018) 2
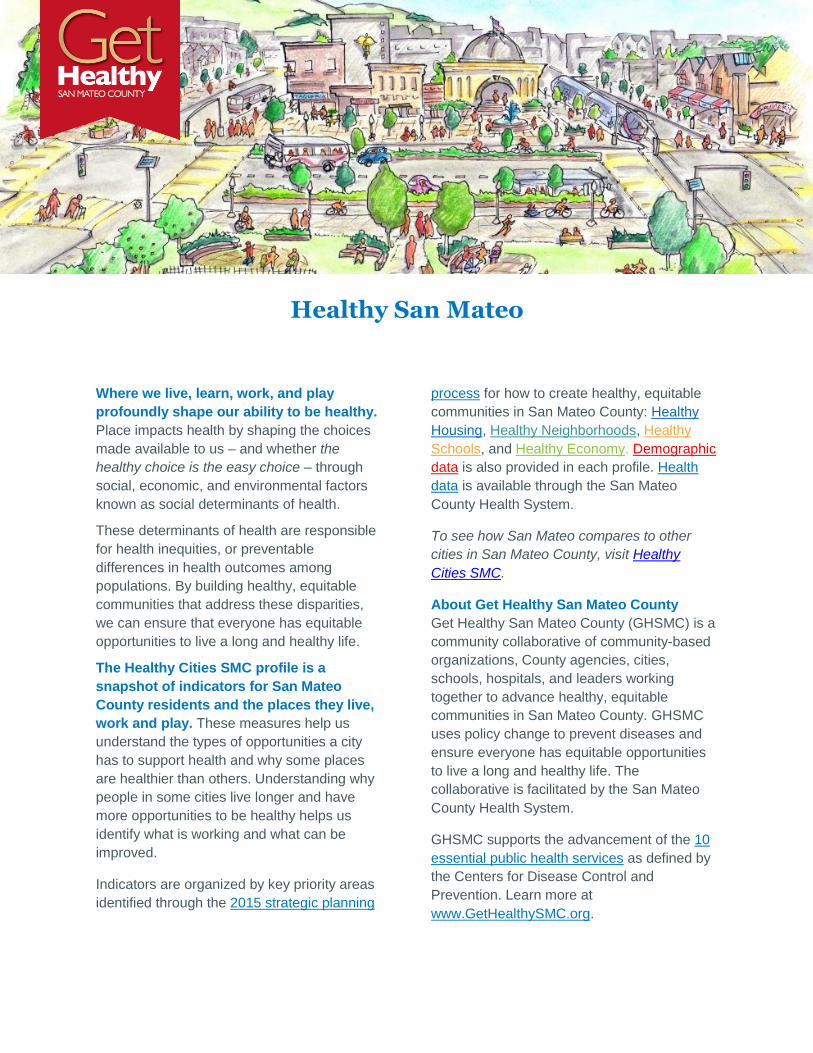
It is important to know who lives in our community to
understand how to best meet the diverse health, social,
and economic needs of all residents.
Demographic Indicators San Mateo San Mateo County
Total Population1 102,224 754,748
Age1
0-17 years 21% 22%
18-64 years 64% 64%
65+ years 15% 15%
Median age 39 years 40 years
Race/Ethnicity1
American Indian/Alaska Native Less than 1% Less than 1%
Asian 21% 27%
Black 2% 2%
Latino 27% 25%
Pacific Islander 2% 1%
White 44% 40%
Other Less than 1% Less than 1%
Two or More Races 4% 4%
Limited English-Speaking Households1 11% 9%
1Source: U.S. Census Bureau, 2012-2016 American Community Survey 5-year Estimates
Demographics
Healthy Cities SMC, San Mateo Building Healthy, Equitable Communities (May 2018) 3
Healthy Housing
Stable and affordable housing protects health and provides
the ability to engage in healthy opportunities. People who
live in healthy, affordable places live longer, healthier lives.
Healthy Housing Indicators San Mateo San Mateo County
Median Rent1 $1,871 $1,830
Percent of Households Who Are Rent Burdened
1,2
51% 52%
Percent of Households Occupied by Homeowner
1
53% 59%
Percent of Households Who Are Overcrowded1 7% 8%
Percent of Regional Housing Needs Allocation for Very Low Income Households
3
23% 20%
Number of Low-wage Jobs for Every One Affordable Housing Unit
4
6 6
Percent of Employees that Don’t Live Where They Work
5
88% 63%
1Source: U.S. Census Bureau, 2012-2016 American Community Survey 5-year Estimates
2Note: Rent burden refers to households that spend 30% or more of their income on rent and other housing costs.
3Note: The Regional Housing Needs Allocation (RHNA) is a state-required process to determine the number of housing units
needed by income level in each city. Source: Association of Bay Area Governments, 2007-2014 Regional Housing Need Allocation 4Source: UC Davis Center for Regional Change, 2013 Regional Opportunity Index
5Note: Percent of employees that don’t live where they work refers to employees that do not live in the same city/county they work
in. Source: U.S. Census Bureau, 2015 Longitudinal Employer-Household Dynamics
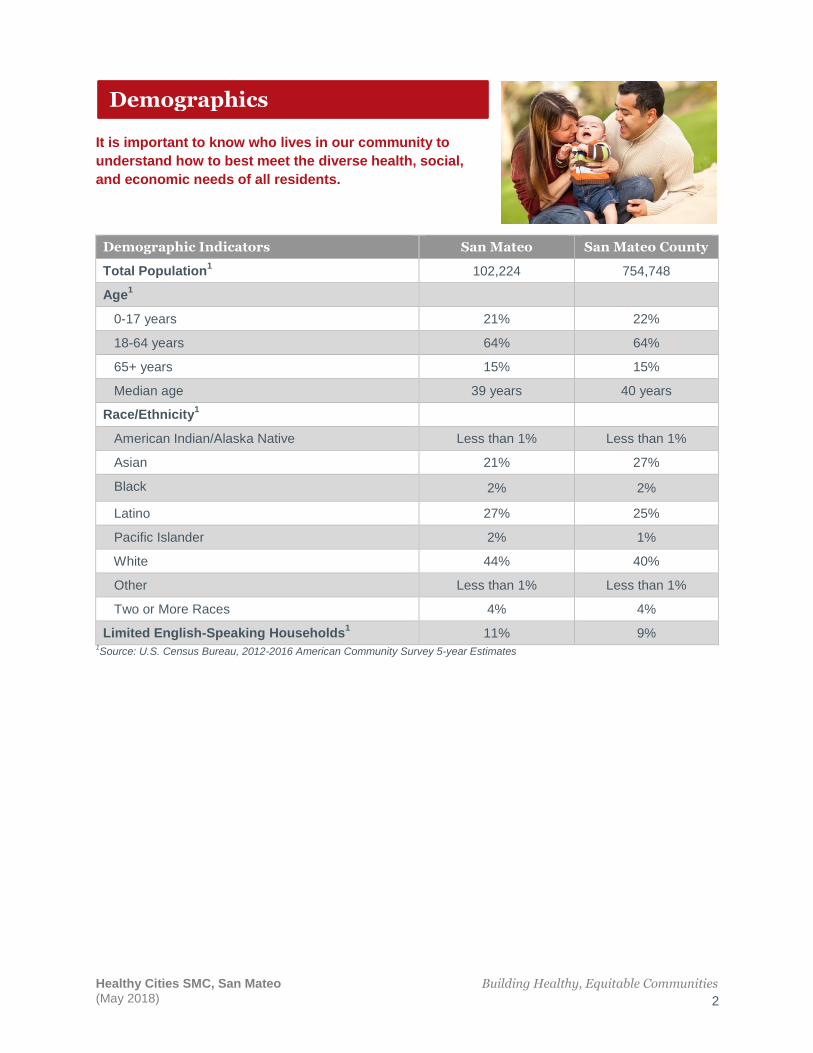
Percent of Households with Rent Burden in San Mateo by Census Tract
Rent burden refers to households that spend 30% or more of their income on rent and other housing costs. Paying unaffordable housing costs diverts wages away from other important needs, such as health care and healthy food, making it more difficult to be healthy. Source: U.S. Census Bureau, 2012-2016 American Community Survey 5-year Estimates
Healthy Cities SMC, San Mateo Building Healthy, Equitable Communities (May 2018) 4
Healthy Neighborhoods
Complete neighborhoods make it easy for residents to be
healthy every day in their communities by making the
healthy choice, the easy choice. Living near where you work
and send your kids to school enables many opportunities for
health. Creating vibrant complete neighborhoods allows people
to safely walk and bike, purchase daily goods and services such
as healthy foods, and easily access affordable public transportation, parks and open space.
Healthy Neighborhoods Indicators San Mateo San Mateo County
Percent of Income for Average Transportation Costs for Block Groups Within ½ Mile of Transit
1
17% 17%
Percent of Residents Who Take Active Transportation to Work
2,3
14% 14%
Number of Daily Vehicle Miles Traveled Per Capita
4
7 26
Number of Bicycle and Pedestrian Collisions Per 100,000 People
5
59 53
Number of Severe or Fatal Bicycle and Pedestrian Collisions Per 100,000 People
5
1 45
Percent of Households Enrolled in Food Stamps
2
5% 4%
Number of Park Acres Per 1,000 People6 6 1
1Source: Center for Neighborhood Technology, 2018 AllTransit
2Source: U.S. Census Bureau, 2012-2016 American Community Survey 5-year Estimates
3S Note: Active transportation includes walking, biking, and taking public transit.
4Sources: Caltrans Highway Performance Monitoring System, 2015 California Public Road Data; U.S. Census Bureau, 2012-2016
American Community Survey 5-year Estimates 5Sources: UC Berkeley Transportation Injury Mapping System, 2016 Statewide Integrated Traffic Records System; U.S. Census
Bureau, 2012-2016 American Community Survey 5-year Estimates 6Sources: San Mateo County GIS, 2018 Parks and Beaches; U.S. Census Bureau, 2012-2016 American Community Survey 5-year
Estimates
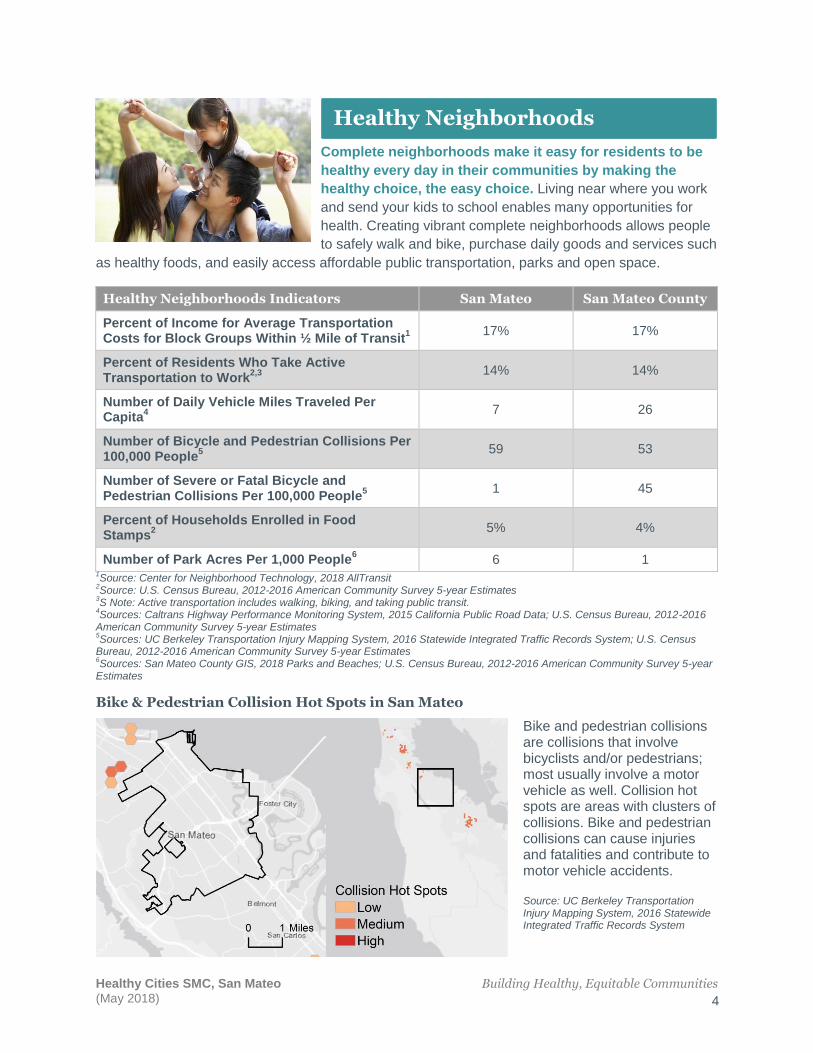
Bike & Pedestrian Collision Hot Spots in San Mateo
Bike and pedestrian collisions are collisions that involve bicyclists and/or pedestrians; most usually involve a motor vehicle as well. Collision hot spots are areas with clusters of collisions. Bike and pedestrian collisions can cause injuries and fatalities and contribute to motor vehicle accidents. Source: UC Berkeley Transportation Injury Mapping System, 2016 Statewide Integrated Traffic Records System
Healthy Cities SMC, San Mateo Building Healthy, Equitable Communities (May 2018) 5
Healthy Schools
High-quality education creates pathways to better health. Education is one of the top determinants of health outcomes, and can set the stage for a child’s future opportunities to access health promoting prospects such as jobs and stable housing.
Healthy Schools Indicators San Mateo San Mateo County
Youth Need Index1 37 24
Percent of Adults with a High School Degree or Less
2
27% 27%
Percent of Adults with a Bachelor’s Degree or Higher
2
48% 47%
1Note: Score is out of 100 points possible where higher score indicates higher need. Source: San Mateo County Health System,
Office of Epidemiology and Evaluation, 2017 2Source: U.S. Census Bureau, 2012-2016 American Community Survey 5-year Estimates
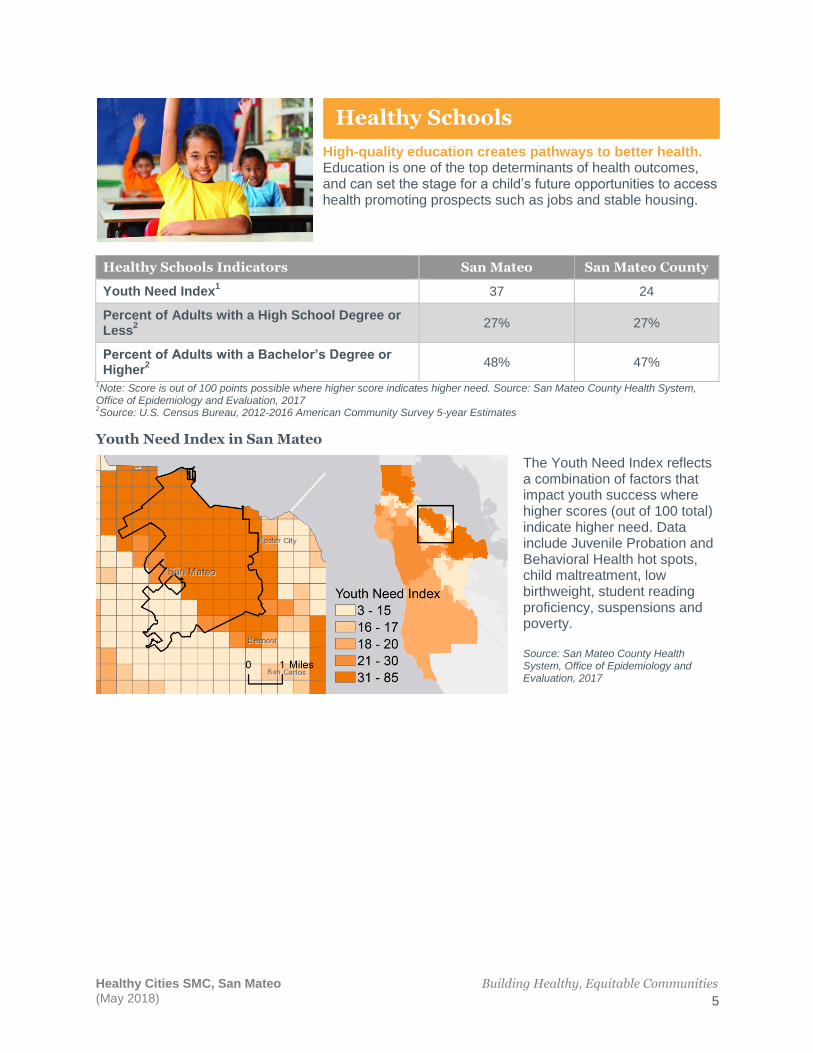
Youth Need Index in San Mateo
The Youth Need Index reflects a combination of factors that impact youth success where higher scores (out of 100 total) indicate higher need. Data include Juvenile Probation and Behavioral Health hot spots, child maltreatment, low birthweight, student reading proficiency, suspensions and poverty. Source: San Mateo County Health System, Office of Epidemiology and Evaluation, 2017
Healthy Cities SMC, San Mateo Building Healthy, Equitable Communities (May 2018) 6
Healthy Economy
A strong local economy builds household financial security for all and promotes everyone’s health. Access to income and wealth is one of the most important predictors of a person’s health. The less money a person makes, the less opportunity they have to be healthy. Financial insecurity makes it difficult to afford and meet basic needs, leading to higher rates of
depression and stress, and subsequently more health problems.
Healthy Economy Indicators San Mateo San Mateo County
Median Household Income1 $95,667 $98,546
Per Capita Income1 $49,227 $50,262
Income Inequality1,2
0.45 0.49
Unemployment Rate1 5% 6%
Percent of Residents Living below Federal Poverty Level
1
8% 8%
Percent of Residents Living below 200% of the Federal Poverty Level
1
22% 20%
1Source: U.S. Census Bureau, 2012-2016 American Community Survey 5-year Estimates
2Note: Income inequality is represented by the Gini Index, where a score of 0 represents complete equality and a score of 1
represents complete inequality.
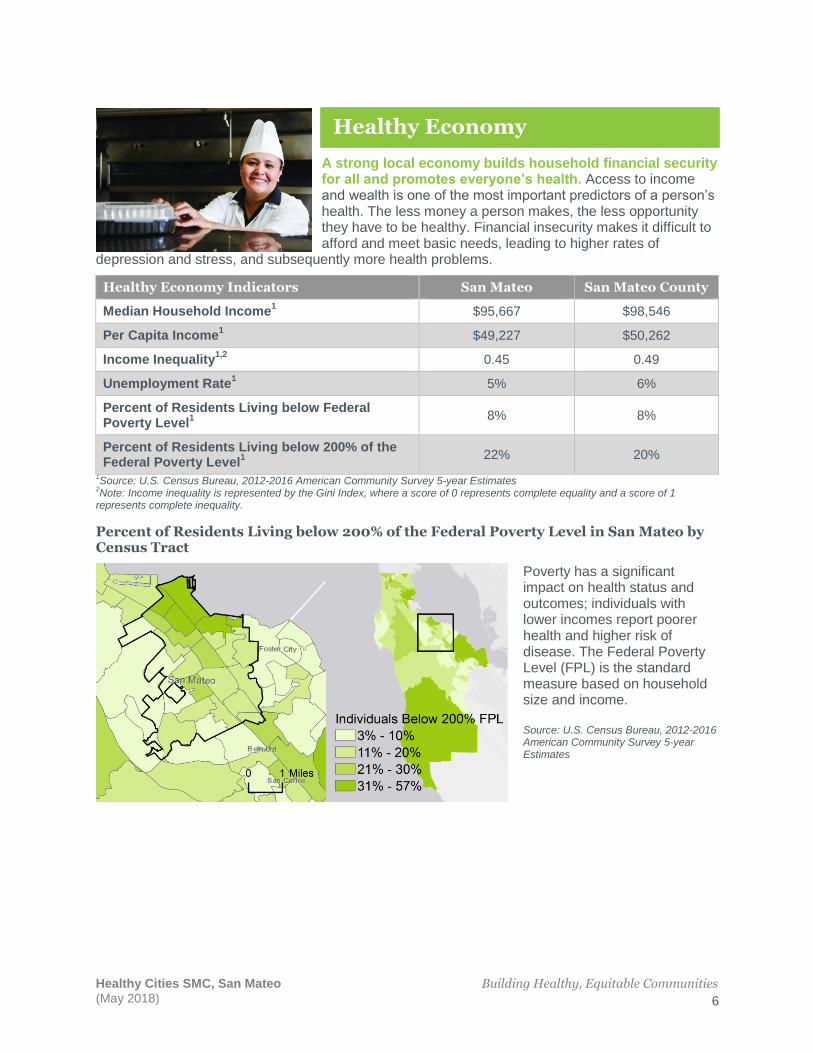
Percent of Residents Living below 200% of the Federal Poverty Level in San Mateo by Census Tract
Poverty has a significant impact on health status and outcomes; individuals with lower incomes report poorer health and higher risk of disease. The Federal Poverty Level (FPL) is the standard measure based on household size and income. Source: U.S. Census Bureau, 2012-2016 American Community Survey 5-year Estimates