Professor of Economics Thomas R. Brown Professor in Economics Education.
Upload
professeur-falloulCategory
view
73download
1


1
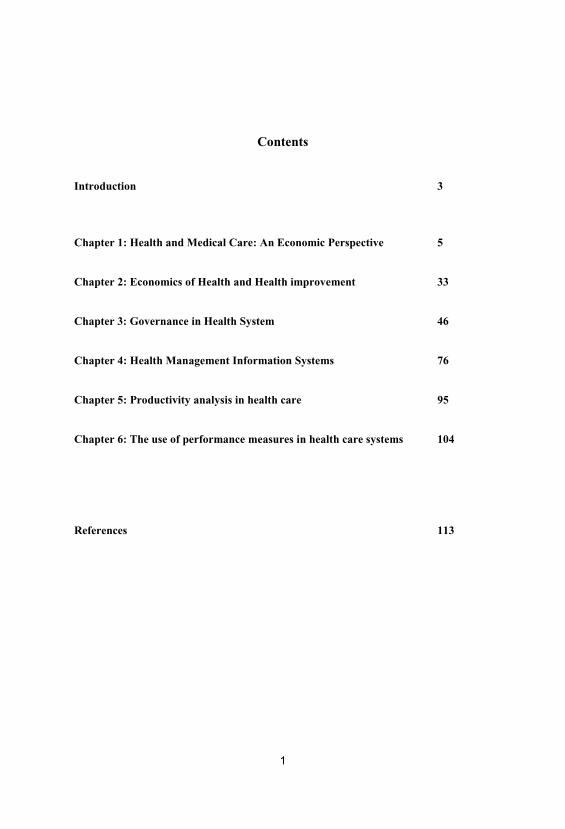
Contents
Introduction 3
Chapter 1: Health and Medical Care: An Economic Perspective 5
Chapter 2: Economics of Health and Health improvement 33
Chapter 3: Governance in Health System 46
Chapter 4: Health Management Information Systems 76
Chapter 5: Productivity analysis in health care 95
Chapter 6: The use of performance measures in health care systems 104
References 113

2

3
Introduction
Health economics is the application of economic science in the field of health. This science is unknown despite a strong increase in its use in recent decades.
In the medical field, its application is more and more widespread thanks to the economic project analysis techniques. Economists are divided over the scientific validity of project analyses.
The macro economy of the health of the economy's health is often the first presented either analysis of consumption of care, general production in different countries, the health of populations and equity in health care.
On the other hand, health economists will generally focus primarily on the health economics micro aspects. This aspect of this science is more pointed, and more scientific and sophisticated.
The microeconomics of health studied the behaviour of economic agents or medical doctors, pharmacists, nurses, patients, managers, institutions of health, public and private insurers, non-profit companies, private clinics, pharmaceutical and generic companies. The study of the pharmaceutical sector and these different economic agents is often called the pharmaceutical economy.
As mentioned previously, health economics is primarily known for the analysis of projects. On the other hand, the fact that this type of analysis is applied in all areas involving economists is often misunderstood. Applied health project analysis techniques developed to better reflect the reality of this sector of activity. Epistemology and Biostatistics also contributed strongly to the developments of applied to health project analysis techniques. Different types of analysis of project are the analysis cost-benefit, cost-efficiencies, cost-effectiveness, cost-consequence, cost-minimization, marginal analysis, etc.
How can the health economics help better manage resources in the health system?
· Helps in the decision for the heads of institutions, managers of companies and Ministers and other decision makers public.
· To quantify in monetary terms the effect of interventions of the State and public policies in the health system.
· To evaluate in comparative or monetary terms the different treatment options for a same diagnosis to assess the treatment the more cost efficient, i.e. one that costs the least expensive compared to its therapeutic effects. Maybe applied to medicines, new technologies and also all interventions of a professional of health on a patient.
4
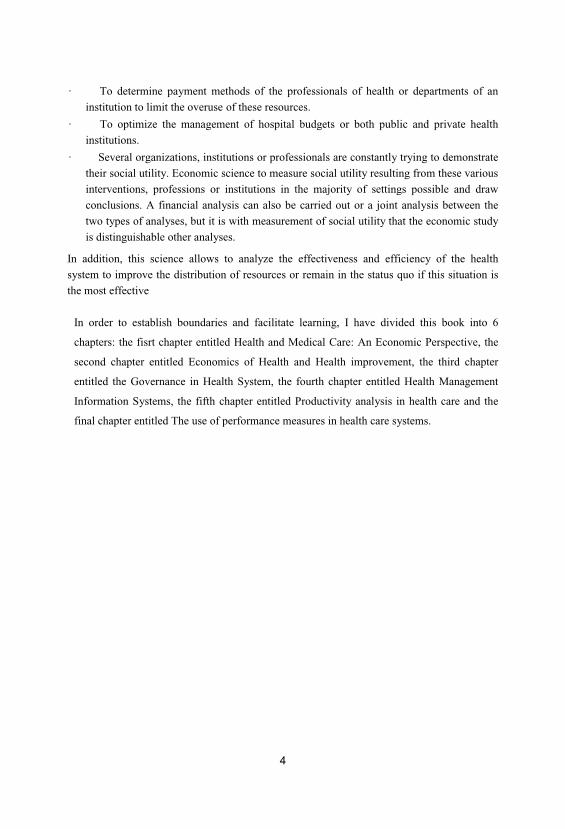
· To determine payment methods of the professionals of health or departments of an institution to limit the overuse of these resources.
· To optimize the management of hospital budgets or both public and private health institutions.
· Several organizations, institutions or professionals are constantly trying to demonstrate their social utility. Economic science to measure social utility resulting from these various interventions, professions or institutions in the majority of settings possible and draw conclusions. A financial analysis can also be carried out or a joint analysis between the two types of analyses, but it is with measurement of social utility that the economic study is distinguishable other analyses.
In addition, this science allows to analyze the effectiveness and efficiency of the health system to improve the distribution of resources or remain in the status quo if this situation is the most effective
In order to establish boundaries and facilitate learning, I have divided this book into 6
chapters: the fisrt chapter entitled Health and Medical Care: An Economic Perspective, the
second chapter entitled Economics of Health and Health improvement, the third chapter
entitled the Governance in Health System, the fourth chapter entitled Health Management
Information Systems, the fifth chapter entitled Productivity analysis in health care and the
final chapter entitled The use of performance measures in health care systems.

5
Chapter 1: Health and Medical Care: An Economic Perspective
Many studies illustrate the important roles that medical care, lifestyle, socioeconomic
conditions, and the environment play in the overall healthof the people in a country. This
chapter explores these relationships by establishing the theoretical and empirical
connection between health and various factors such as medical care. In particular, this
chapter:
• discusses the concepts of health and medical care
• introduces utility analysis to explain why people desire health
• utilizes production theory to explain the making of health
• reviews the empirical results concerning the factors that infl uence health
• discusses the historical impact of public health on health outcomes.
What Is Health?
The Mosby Medical Encyclopedia (1992, p. 360) defines health as “a state of
physical, mental, and social well-being and the absence of disease or other abnormal
condition.” Economists take a radically different approach. They view health as a durable
good, or type of capital, that provides services. The fl ow of services produced from the
stock of health “capital” is consumed continuously over an individual’s lifetime (see
Grossman, 1972a, 1972b). Each person is assumed to be endowed with a given stock of
health at the beginning of a period, such as a year. Over the period, the stock of health
depreciates with age and may be augmented by investments in medical services. Death
occurs when an individual’s stock of health falls below a critical minimum level.
Naturally, the initial stock of health, along with the rate of depreciation, varies from
individual to individual and depends on many factors, some of which are uncontrollable.
For example, a person has no control over the initial stock of health allocated at birth, and
a child with a congenital heart problem begins life with a below-average stock of health.
However, we learn later that medical services may compensate for many defi ciencies, at
least to some degree. The rate at which health depreciates also depends on many factors,
such as the individual’s age, physical makeup, lifestyle, environmental factors, and the
amount of medical care consumed. For example, the rate at which health depreciates in a

6
person diagnosed with high blood pressure is likely to depend on the amount of medical
care consumed (is this person under a doctor’s care?), environmental factors (does he or
she have a stressful occupation?), and lifestyle (does the person smoke or have a weight
problem?). All these factors interact to determine the person’s stock of health at any point
in time, along with the pace at which it depreciates.
Regardless of how you defi ne it, health is a nebulous concept that defi es precise
measurement. In terms of measurement, health depends as much on the quantity of life
(that is, number of life-years remaining) as it does on the quality of life. Quality of life has
become an increasingly important issue in recent years due to the life-sustaining
capabilities of today’s medical technology. The issue gained national prominence in 1976
when, in a landmark court decision, the parents of Karen Ann Quinlan were given the right
to remove their daughter, who was in a persistent vegetative state, from a ventilator.
Because the quality of life is a relative concept that is open to wide interpretation,
researchers have wrestled with developing an instrument that accurately measures health.
In Chapter 3, we will discuss some of these measures.
Why Good Health? Utility Analysis.
As mentioned earlier, health, like any other durable good, generates a fl ow of
services. These services yield satisfaction, or what economists call utility. Your television
set is another example of a durable good that generates a fl ow of services. It is the many
hours of programming, or viewing services, your television provides that yield utility, not
the set itself. As a good, health is desired for consumption and investment purposes. From
a consumption perspective, an individual desires to remain healthy because she or he
receives utility from an overall improvement in quality of life. In simple terms, a healthy
person feels great and thus is in a better position to enjoy life. The investment element
concerns the relation between health and time. If you are in a positive state of health, you
allocate less time to sickness and therefore have more healthy days available in the future
to work and enhance your income or to pursue other activities, such as leisure. Economists
look at education from the same perspective. Much as a person invests in education to
enhance the potential to command a higher wage, a person invests in health to increase the
likelihood of having more healthy days to work and generate income.

7
The investment element of health can be used to explain some of the lifestyle choices
people make. A person who puts a high value on future events is more inclined to pursue a
healthy lifestyle to increase the likelihood of enjoying more healthy days than a person
who puts a low value on future events. A preference for the future explains why a
middleaged adult with high cholesterol orders a salad with dressing on the side instead of a
steak served with a baked potato smothered in sour cream. In this situation, the utility
generated by increasing the likelihood of having more healthy days in the future outweighs
the utility received from consuming the steak dinner. In contrast, a person who puts a
muchlower value on future events and prefers immediate gratifi cation may elect to order
the steak dinner and ignore the potential ill effects of high cholesterol and fatty foods.
Naturally, each individual chooses to consume that combination of goods and services,
including the services produced from the stock of health, which provides the most utility.
The isolated relation between an individual’s stock of health and utility is captured in
Figure 1,
Figure 1: The Total Utility Curve for Health
8
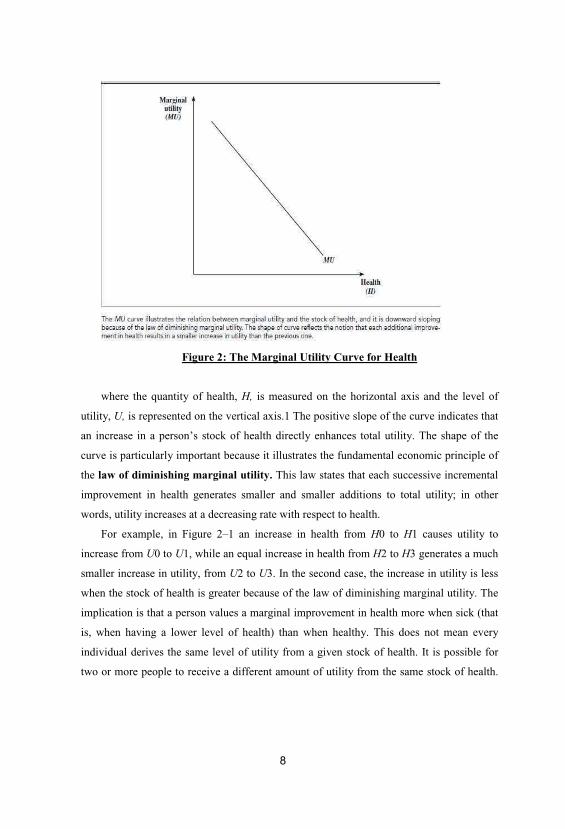
Figure 2: The Marginal Utility Curve for Health
where the quantity of health, H, is measured on the horizontal axis and the level of
utility, U, is represented on the vertical axis.1 The positive slope of the curve indicates that
an increase in a person’s stock of health directly enhances total utility. The shape of the
curve is particularly important because it illustrates the fundamental economic principle of
the law of diminishing marginal utility. This law states that each successive incremental
improvement in health generates smaller and smaller additions to total utility; in other
words, utility increases at a decreasing rate with respect to health.
For example, in Figure 2–1 an increase in health from H0 to H1 causes utility to
increase from U0 to U1, while an equal increase in health from H2 to H3 generates a much
smaller increase in utility, from U2 to U3. In the second case, the increase in utility is less
when the stock of health is greater because of the law of diminishing marginal utility. The
implication is that a person values a marginal improvement in health more when sick (that
is, when having a lower level of health) than when healthy. This does not mean every
individual derives the same level of utility from a given stock of health. It is possible for
two or more people to receive a different amount of utility from the same stock of health.
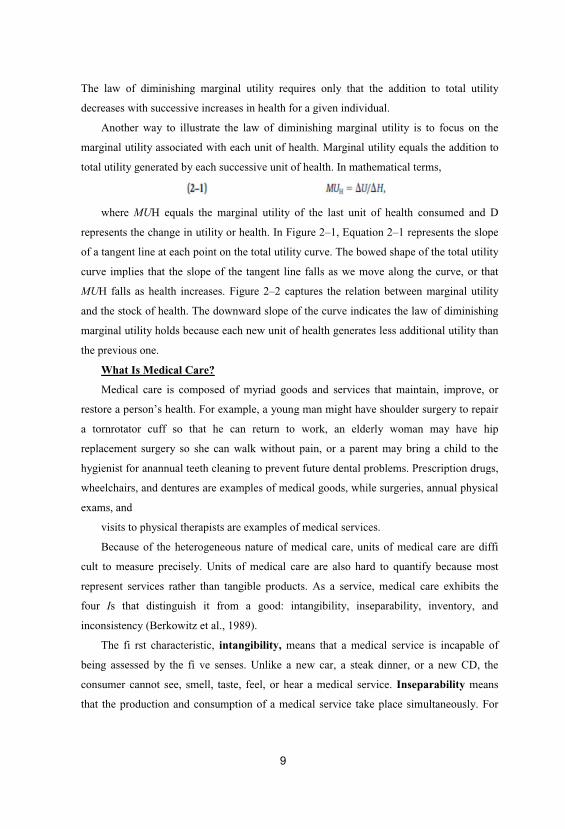
The law of diminishing marginal utility requires only that the addition to total utility
decreases with successive increases in health for a given individual.
Another way to illustrate the law of diminishing marginal utility is to focus on the
marginal utility associated with each unit of health. Marginal utility equals the addition to
total utility generated by each successive unit of health. In mathematical terms,
where MUH equals the marginal utility of the last unit of health consumed and D
represents the change in utility or health. In Figure 2–1, Equation 2–1 represents the slope
of a tangent line at each point on the total utility curve. The bowed shape of the total utility
curve implies that the slope of the tangent line falls as we move along the curve, or that
MUH falls as health increases. Figure 2–2 captures the relation between marginal utility
and the stock of health. The downward slope of the curve indicates the law of diminishing
marginal utility holds because each new unit of health generates less additional utility than
the previous one.
What Is Medical Care?
Medical care is composed of myriad goods and services that maintain, improve, or
restore a person’s health. For example, a young man might have shoulder surgery to repair
a tornrotator cuff so that he can return to work, an elderly woman may have hip
replacement surgery so she can walk without pain, or a parent may bring a child to the
hygienist for anannual teeth cleaning to prevent future dental problems. Prescription drugs,
wheelchairs, and dentures are examples of medical goods, while surgeries, annual physical
exams, and
visits to physical therapists are examples of medical services.
Because of the heterogeneous nature of medical care, units of medical care are diffi
cult to measure precisely. Units of medical care are also hard to quantify because most
represent services rather than tangible products. As a service, medical care exhibits the
four Is that distinguish it from a good: intangibility, inseparability, inventory, and
inconsistency (Berkowitz et al., 1989).
The fi rst characteristic, intangibility, means that a medical service is incapable of
being assessed by the fi ve senses. Unlike a new car, a steak dinner, or a new CD, the
consumer cannot see, smell, taste, feel, or hear a medical service. Inseparability means
that the production and consumption of a medical service take place simultaneously. For
10
example, when you visit your dentist for a checkup, you are consuming dental services at
the exact time the dentist is producing them. In addition, a patient often acts as both
producer and consumer. Without the patient’s active participation, the medical product is
likely to be poorly produced. Inventory is directly related to inseparability. Because the
production and consumption of a medical service occur simultaneously, health care
providers are unable to stockpile or maintain an inventory of medical services. For
example, a dentist cannot maintain an inventory of dental checkups to meet demand during
peak periods.
Finally, inconsistency means that the composition and quality of medical services
consumed vary widely across medical events. Although everyone visits a physician at
some time or another, not every visit to a physician is for the same reason. One person may
go for a routine physical, while another may go because he needs heart bypass surgery.
The composition of medical care provided or the intensity at which it is consumed can
differ greatly among individuals and at different points in time.
The quality of medical care is also diffi cult to measure. Quality differences are refl
ected in the structure, process, and/or outcome of a medical care provider (Donabedian,
1980, 1988). Structural quality is refl ected in the physical and human resources of the
medical care provider, such as the facilities (level of amenities), medical equipment (type
and age), personnel (training and experience), and administration (organization structure).
Process quality refl ects the specifi c actions health care providers take on behalf of
patients in delivering and following through with care. Process quality might include
access (waiting time), data collection (background history and testing), communication
with the patient, and diagnosis and treatment (type and appropriateness). Outcome quality
refers to the impact of care on the patient’s health and welfare as measured by patient
satisfaction, work time lost to disability, or postcare mortality rate. Because it is extremely
diffi cult to keep all three aspects of quality constant for every medical event, the quality of
medical services, unlike that of physical goods, is likely to be inconsistent. As you can see,
medical care services are extremely diffi cult to quantify. In most instances, researchers
measure medical care in terms of either availability or use. If medical care is measured on
an availability basis, such measures include the number of physicians or hospital beds
available per 1,000 people. If medical care is measured in terms of use, the analyst
employs data indicating how often a medical service is actually delivered. For example, the

11
quantity of offi ce visits or surgeries per capita is often used to represent the amount of
physician services rendered, whereas the number of inpatient days is frequently used to
measure the amount of hospital or nursing home services consumed.
The Production of Good Health
Health economists take the view that the creation and maintenance of health involves
a production process. Much as a fi rm uses various inputs, such as capital and labor, to
manufacture a product, an individual uses medical inputs and other factors, such as a
healthy lifestyle, to produce health. The relation between medical inputs and output can be
captured in what economists call a production function. A health production function
indicates the maximum amount of health that an individual can generate from a specifi cset
of inputs in a given period of time. In mathematical terms it shows how the level of output
(in this case, health) depends on the quantities of various inputs, such as medical care. A
generalized short-run health production function for an individual takes the following
form: (2–2)
Health = 5 H (medical care, technology, profile, lifestyle, socieconomic status,
environment)
where health reflects the level of health at a point in time; medical care equals the
quantity of medical care consumed; technology refers to the state of medical technology at
a given point in time; profi le captures the individual’s mental and physical profi le as of a
point.

12
Figure 3: The Total Product Curve for Medical Care
in time; lifestyle represents a set of lifestyle variables, such as diet and exercise;
socioecononomic status refl ects the joint effect of social and economic factors, such as
education, income and poverty; and environment stands for a variety of environmental
factors, including air and water quality.
To focus on the relation between health and medical care, we assume initially that all
other factors in the health production function remain constant. Figure 2–3 depicts this
relation, where q is a hypothetical measure of medical care, holding technology constant,
and H represents the level of health. The intercept term represents the individual’s level of
health when zero medical care is consumed. As drawn, the total product curve implies
that an individual’s level of health is positively related to the amount of medical care
consumed.3 The shape of the curve is very similar to that in Figure 2–1 and refl ects the
law of diminishing marginal productivity. This law implies that health increases at a
decreasing rate with respect to additional amounts of medical care, holding other inputs
constant. For example, suppose an

Figure 4: The Marginal Product Curve for Medical Care
individual makes an initial visit and several follow-up visits to a physician’s offi ce for
a pecifi c illness or treatment over a given period of time. It is very likely that the fi rst few
visits have a more benefi cial impact on the individual’s stock of health than the later
visits. Thus, each successive visit generates a smaller improvement in health than the
previous one.
The relation between health and medical care can also be viewed from a marginal
perspective, where the marginal product of medical care represents the incremental
improvement in health brought about by each successive unit of medical care consumed, or
where MPq equals the marginal product of the last unit of medical care services
consumed.
The law of diminishing marginal productivity holds that the marginal product of
medical care diminishes as the individual acquires more medical care. A graph of this
relationship appears as a negatively sloped curve in Figure 2–4.
The other variables in the health production function can also be incorporated into the
analysis. In general terms, a change in any one of the other variables in the production
14
function alters the position of the total product curve. The total product curve may shift in
some instances and/or rotate in others. In the latter case, the curve rotates because the
marginal roductivity of medical care has changed in response to the change in the other
factors.
New medical technologies have profoundly affected all aspects of the production of
medical care. In the broadest of terms, examples of new technologies include the
development of sophisticated medical devices, the introduction of new drugs, the
application of innovative medical and surgical procedures, and most recently, the use of
computersupported information systems, just to name a few. According to Cutler and
Huckman (2003) and Cutler and McClellan (2001), technological change can result in
treatment expansion, treatment substitution, or some elements of both. Treatment
expansion occurs when more patients are treated by a new medical intervention, perhaps
because of a higher success rate or lower risks to health. Treatment substitution occurs
when the new technology substitutes for or replaces an older one.
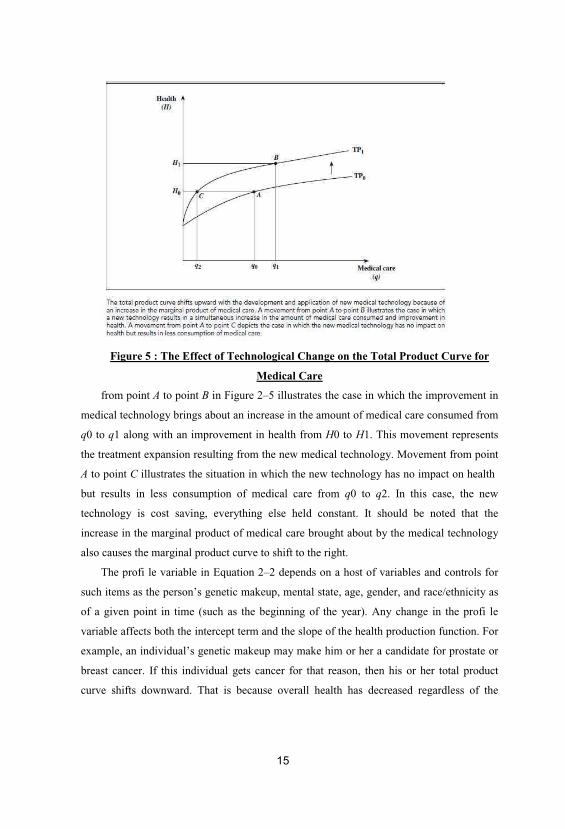
In the context of our health production model, the development and application of a
new medical technology causes the total product curve to pivot and rotate upward because
the marginal productivity of each unit of medical care consumed increases, as illustrated in
Figure 2–5. Notice that the total product curve rotates upward from TP0 to TP1 and
eachunit of medical care consumed now generates a greater amount of health. The
movement
15
Figure 5 : The Effect of Technological Change on the Total Product Curve for
Medical Care
from point A to point B in Figure 2–5 illustrates the case in which the improvement in
medical technology brings about an increase in the amount of medical care consumed from
q0 to q1 along with an improvement in health from H0 to H1. This movement represents
the treatment expansion resulting from the new medical technology. Movement from point
A to point C illustrates the situation in which the new technology has no impact on health
but results in less consumption of medical care from q0 to q2. In this case, the new
technology is cost saving, everything else held constant. It should be noted that the
increase in the marginal product of medical care brought about by the medical technology
also causes the marginal product curve to shift to the right.
The profi le variable in Equation 2–2 depends on a host of variables and controls for
such items as the person’s genetic makeup, mental state, age, gender, and race/ethnicity as
of a given point in time (such as the beginning of the year). Any change in the profi le
variable affects both the intercept term and the slope of the health production function. For
example, an individual’s genetic makeup may make him or her a candidate for prostate or
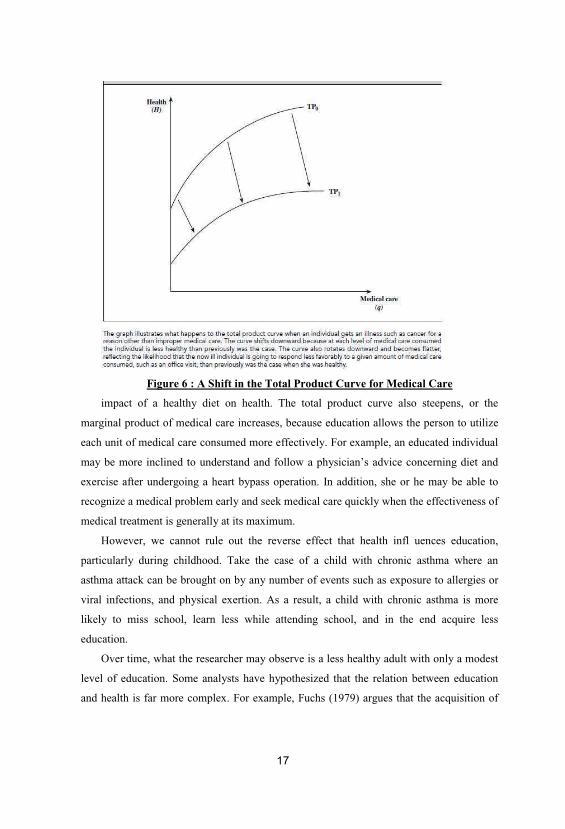
breast cancer. If this individual gets cancer for that reason, then his or her total product
curve shifts downward. That is because overall health has decreased regardless of the
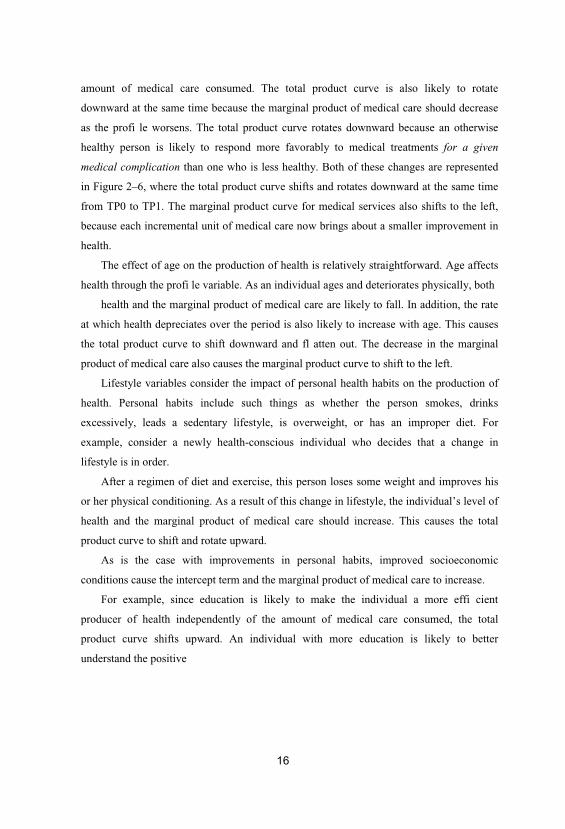
16
amount of medical care consumed. The total product curve is also likely to rotate
downward at the same time because the marginal product of medical care should decrease
as the profi le worsens. The total product curve rotates downward because an otherwise
healthy person is likely to respond more favorably to medical treatments for a given
medical complication than one who is less healthy. Both of these changes are represented
in Figure 2–6, where the total product curve shifts and rotates downward at the same time
from TP0 to TP1. The marginal product curve for medical services also shifts to the left,
because each incremental unit of medical care now brings about a smaller improvement in
health.
The effect of age on the production of health is relatively straightforward. Age affects
health through the profi le variable. As an individual ages and deteriorates physically, both
health and the marginal product of medical care are likely to fall. In addition, the rate
at which health depreciates over the period is also likely to increase with age. This causes
the total product curve to shift downward and fl atten out. The decrease in the marginal
product of medical care also causes the marginal product curve to shift to the left.
Lifestyle variables consider the impact of personal health habits on the production of
health. Personal habits include such things as whether the person smokes, drinks
excessively, leads a sedentary lifestyle, is overweight, or has an improper diet. For
example, consider a newly health-conscious individual who decides that a change in
lifestyle is in order.
After a regimen of diet and exercise, this person loses some weight and improves his
or her physical conditioning. As a result of this change in lifestyle, the individual’s level of
health and the marginal product of medical care should increase. This causes the total
product curve to shift and rotate upward.
As is the case with improvements in personal habits, improved socioeconomic
conditions cause the intercept term and the marginal product of medical care to increase.
For example, since education is likely to make the individual a more effi cient
producer of health independently of the amount of medical care consumed, the total
product curve shifts upward. An individual with more education is likely to better
understand the positive
17
Figure 6 : A Shift in the Total Product Curve for Medical Care
impact of a healthy diet on health. The total product curve also steepens, or the
marginal product of medical care increases, because education allows the person to utilize
each unit of medical care consumed more effectively. For example, an educated individual
may be more inclined to understand and follow a physician’s advice concerning diet and
exercise after undergoing a heart bypass operation. In addition, she or he may be able to
recognize a medical problem early and seek medical care quickly when the effectiveness of
medical treatment is generally at its maximum.
However, we cannot rule out the reverse effect that health infl uences education,
particularly during childhood. Take the case of a child with chronic asthma where an
asthma attack can be brought on by any number of events such as exposure to allergies or
viral infections, and physical exertion. As a result, a child with chronic asthma is more
likely to miss school, learn less while attending school, and in the end acquire less
education.
Over time, what the researcher may observe is a less healthy adult with only a modest
level of education. Some analysts have hypothesized that the relation between education
and health is far more complex. For example, Fuchs (1979) argues that the acquisition of
18
education and health depends on the value people place on future events, or the rate at
which they discount future events. Individuals who place a high value on future benefi ts
and are willing to postpone gratifi cation are inclined to acquire more education and pursue
a healthier lifestyle when they are young. This is because they want to reap the rewards of
a higher income and a longer life that more education and a healthier lifestyle can bring.
On the other hand, individuals who place a low value on future events and desire
immediate gratifi cation are not likely to acquire signifi cant amounts of education or to
follow a healthy lifestyle because they have adopted a “live for today” attitude. Thus,
according to Fuchs, higher levels of education may be associated with better health not
because there is a direct link between the two variables but because both variables are
directly correlated with a third factor, the degree to which future events are valued.
The impact of income on health is also complex and is referred to as the “income
gradient” in the literature “to emphasize the gradual relationship between the two: health
improves with income throughout the income distribution” (Deaton, 2002, p. 14). Income
is likely to indirectly impact health through a number of pathways. An increase in income
provides the individual the means to consume more medical care. In addition, a more affl
uent individual is likely to be more educated, pursue a healthier lifestyle, and live in a safer
environment, all of which contribute to improved health. For example, a more affl uent
individual may live in a suburban community where the crime rate is low, access to drugs
and alcohol is limited, and quality medical care is available just around the corner. Income
may also have a direct impact on health, although the net effect is far from clear. On the
one hand, a wealthier individual may be employed in a safer work environment where the
risk of a work-related accident or illness is slim. On the other hand, a wealthier individual
may be employed in a more stressful occupation, which can adversely impact health.
In recent years an extensive body of literature has developed that examines whether
the distribution of income impacts health, and the income-health hypothesis has taken on a
variety of forms. According to the literature (Lynch et al., 2004; Wagstaff and van
oorslaer, 2000), the various hypotheses that have been offered over time can be classifi ed
into four broad categories: the absolute income hypothesis, the relative income or
deprivation hypothesis, the relative position hypothesis, and the income inequality
hypotheses.
19
The absolute income hypothesis simply states that an individual’s absolute income is
positively related to health for the reasons discussed previously. The relative income or
deprivation hypothesis posits that an individual’s income relative to some social group
average impacts overall health. Put in more defi nable terms, it is a person’s income
relative to some critical level such as the poverty line in the United States that matters. The
presumption is that anyone with an income below the poverty line lacks the ability to
acquire the basic necessities, such as health care.
The relative position hypothesis emphasizes that one’s social position in the income
distribution also impacts health. For example, those at the bottom of the income scale in
the United States may become frustrated and feel left behind by the “American dream”
despite the fact that they have enough income to live in reasonable housing and receive
adequate health care. Out of a sense of discouragement, these people may tend to give up
and pursue a lifestyle detrimental to their health that could involve increased alcohol
consumption, smoking, and obesity.
Finally, the income inequality hypothesis states that the distribution of income itself
directly impacts health. For example, greater income inequality may create an incentive for
government to limit spending on social programs that have a direct bearing on health in an
attempt to lower taxes. Greater income inequality may also lead to an erosion of social
capital, defi ned as “those features of social organizations—such as the extent of
interpersonal trust between citizens, norms of reciprocity, and vibrancy of civic
organizations—that facilitate cooperation for mutual benefi t” (Kawachi and Kennedy,
1999, p. 221). As a result, the poor may fi nd their public health needs largely ignored by
society at large.
An adjustment in a person’s physical environment is also likely to affect the total
product curve. For example, an individual with an asthmatic condition might move from
Los Angeles, where smog is intense, to a community on the far outskirts of the city. Or the
person’s spouse may give up smoking to decrease the level of secondhand smoke in the
home. As a result, the probability that this person will succumb to a respiratory ailment
diminishes. Both of these changes cause the total product curve to shift and rotate upward.
In short, health production theory suggests that a variety of factors, such as the
individual’s profi le, medical care, state of medical technology, lifestyle, socioeconomic
status, and environment, interact to determine health. The theory also suggests that health
20
increases at a diminishing rate with respect to greater amounts of medical care consumed,
provided all other inputs remain constant. If any other inputs in the production process
change, the impact of medical care on health is also likely to change. The effect of any one
nonmedical input on health is also likely to exhibit diminishing returns—all other inputs
held constant. For example, running two miles a day may reduce someone’s weight by 15
pounds over a six-month period. It is doubtful, however, that an additional two miles per
day of running could produce additional 15 pounds of weight loss during the next six-
month period.
Before we conclude this section, you should be aware that recently Jacobson (2000),
Bolin et al. (2002), and others have extended the Grossman model and developed a number
of sophisticated mathematical models that focus on the family rather than the individual as
the main producer of health. While these models are beyond the scope of this book, they
represent a valuable addition to the literature. The common theme is that individual
decisions to invest in health are made within the context of a family and that any decision
on the part of one family member regarding investments in health impacts the health
investment decisions of others in the family. For example, a learning-disabled child may
provide an incentive to a mother to invest more in her own health to ensure that she will
have the time to aid her child. These theoretical developments provide a number of
challenges to researchers as they strive to understand the complex relationships between
family members and individual health-related decisions.
Empirical Evidence on the Production of Health in the United States
Health economists have long been trying to understand the complex nature in which
medical care and other factors interact to improve, maintain, and restore health. That quest
has led researchers to develop a variety of sophisticated estimation models that 50 PART 1
Basic Health Care Economic Tools and Institutions fi nd their theoretical underpinnings in
Equation 2–2 to empirically examine the production of health. Using the literature as our
guide, we review the empirical evidence concerning the characteristics associated with the
production of health for adults and infants.

21
The Determinants of Health among Nonelderly Adults
Medical Care and Health To no one’s surprise, the literature has found the
consumption of medical care has a positive impact on the production of adult health.
However, the results also indicate that quantitatively, the impact is relatively small. For
example, Hadley (1982) fi nds that a 10 percent increase in per capita medical care
expenditures results in only a 1.5 percent decrease in the adult mortality rate. His result
confi rms those of an earlier study conducted by Auster et al. (1969), who estimate that a
10 percent increase in medical services leads to a 1 percent drop in the age-adjusted
mortality rate. Sickles and Yazbeck (1998) fi nd that a 10 percent increase in health-related
consumption leads to about a 0.3 percent improvement in health as measured by a
comprehensive health index that considers a number of quality-of-life variables. Finally,
based upon a random assignment of households to different health plans, Newhouse et al.
(1993) fi nd that households in low coinsurance plans received more medical care yet
possessed virtually the same level of health as those households in high coinsurance plans,
ceteris paribus.
Enthoven (1980) has referred to the small marginal impact of medical care services on
the health status of adults as “fl at-of-the-curve” medicine. In the context of Figure 2–3,
this means the typical adult consumes medical services at the point where the slope of the
total product curve or marginal product of medicine is near zero.
If, as the empirical evidence indicates, the overall contribution of medical care to
health is rather modest at the margin, what determines marginal improvements in health?
The answer lies in the other factors associated with the production of health, with
education, income, lifestyle, and the environment being the major contributing factors.
Education and Health The positive relation between education and health is well
documented in the literature. For example, Elo and Preston (1996) fi nd that education had
a signifi cant impact on mortality for both men and women in the United States during the
early 1980s, with the impact of education greater for men and those of working age than
for women and the elderly. Lleras-Muney (2001) fi nds a signifi cant relation between
education levels and health. In particular, she fi nds that one more year of schooling
decreases the probability of dying within 10 years by 3.6 percent. More recently, Cutler
22
and Lleras-Muney (2006) estimate that an additional year of education increases life
expectancy by between 0.18 and 0.6 years.
Income and Health Empirical studies have also documented a positive connection
between income and health. Ettner (1996) fi nds that increases in income enhance both
mental and physical health, while Lantz et al. (2001) fi nd that income and education are
both associated with improved health. More specifi cally, they fi nd that people with less
than a high school education and incomes below $10,000 are between two and three times
more likely to have functional limitations and poorer self-rated health than their more
advantaged counterparts.
While the positive relation between income and health is well established in the
literature, a question remains concerning how temporary changes in the macroeconomy
impact health. In other terms, what is the relationship between cyclical changes in the
macroeconomy and overall health? Your fi rst inclination is to assume that a procyclical
relationship holds between the state of the economy and health. In other words, as an
economy emerges from a recession and the unemployment rate begins to fall, overall
health should improve. You might argue that higher per capita incomes should translate
into improved health as people have more discretionary income to spend on medical care.
In addition, as more people acquire jobs with employer-fi nanced health insurance, the out-
of-pocket price of medical care should drop, causing people to consume more health care.
An improved economy may also be associated with healthier lifestyles because as
unemployed workers fi nd employment, stress levels are likely to fall along with alcohol
consumption and smoking.
Ruhm (2000, 2003) argues that just the opposite may occur: an improved economy
may be linked to poorer health. He cites three reasons why health may decline during a
cyclical economic expansion. First, the opportunity cost of time is likely to increase with
an improved economy. As workers find employment, the amount of leisure time they have
to perform what Ruhm refers to as health-producing activities (such as exercise and eating
right) diminishes. Second, the act of work may adversely impact the production of health.
As the economy improves and more workers find employment, the number of work-related
accidents and work-related stress cases increases. Third, an economic expansion may cause
an increase in other causes of mortality such as traffi c fatalities, homicide, and suicides.
23
To test the relationship between cyclical conditions and health, Ruhm estimates the
impact that various economic indicators such as unemployment and personal income have
on a number of health indicators. The author utilizes a state-based data set for the years
1972 through 1991 and estimates a number of equations utilizing a variety of health
measures. Among the measures of health included in the analysis were overall mortality
rates, age-based mortality rates, and deaths due to specifi c causes such as cardiovascular
diseases, chronic liver disease and cirrhosis of the liver, motor vehicle accidents, and
suicide.
The results are illuminating and suggest an inverse relationship between the strength
of the economy and health in the short run. Overall, Ruhm fi nds that a 1 percent drop in
the unemployment rate, relative to the state historical average, results in an increase in the
total mortality rate of between 0.5 and 0.6 percent. In addition, Ruhm fi nds that the impact
of changes in the unemployment rate on mortality rates appears to concentrate among the
relatively young, between ages 20 and 44. This makes intuitive sense given they are the
ones likely to be hit hardest by temporary changes in economic conditions.
The author also fi nds fl uctuations in state unemployment rates to be inversely related
to a number of specifi c causes of death. For example, Ruhm fi nds decreases in state
unemployment rates to be associated with increased fatalities from auto accidents, other
types of accidents, homicides, cardiovascular disease, and infl uenza. Ruhm (2003) also fi
nds that a one- percentage-point decrease in the unemployment rate is associated with
acute morbidity and ischemic heart disease increases of 1.5 and 4.3 percent, respectively.
Ruhm’s empirical results are compelling because they suggest that cyclical, or temporary,
changes in economic activity inversely impact health.
Income Inequality and Health Lynch et al. (2004) and Wagstaff and van Doorslaer
(2000) provide two excellent reviews of the literature regarding the relation between
income inequality and health. Both papers agree that there is signifi cant support in the
literature for the absolute income hypothesis. The same cannot be said for the other
alternative hypotheses, however. According to Wagstaff and van Doorslaer, there is “no
support for the relative-income hypotheses and little or no support for the incomeinequality
hypothesis” (p. 543). They conclude that there is no empirical support for the relative
position hypothesis. These results were largely reaffi rmed by Lynch et al. (2004) and
Lorgelly and Lindley (2008). However, Lynch et al., (2004) fi nd some support for the

24
hypothesis that greater income inequality worsens health outcomes at the state level in the
United States.
Lifestyle and Health The literature abounds with studies that illustrate the important
role lifestyle plays in determining health. Among the risky lifestyle behaviors found to
negatively impact health are smoking, excessive alcohol consumption, lack of physical
activity, and poor diet. For example, Leigh and Fries (1992) estimate that the typical one-
pack-a-day smoker experiences 10.9 more sick days every six months than comparable
nonsmokers, while a person who consumes two or more drinks a day has 4.6 more sick
days than a comparable light drinker (one or fewer drinks a day). Strum (2002) analyzes
the impact of obesity, being overweight, smoking, and problem drinking on health and the
consumption of health care for a sample of adults between ages 18 and 65 in 1997–1998.
He fi nds that all four risk behaviors impact health to some degree, with obesity having the
greatest impact.
In fact, Strum estimates that obesity has the same impact on health as 20 years of
aging when health status is measured by the number of seventeen common chronic
conditions present. Finally, Balia and Jones (2008) fi nd that lifestyle, particularly smoking
and sleep patterns, play a signifi cant role in predicting mortality. Using some rather
sophisticated modeling and econometric techniques that focus on the distribution of health
inequality, they estimate that predicted mortality rates may be much more sensitive to
lifestyle factors, and less sensitive to socioeconomic factors and aging, than previously
thought.
In the context of Figure 2–6, these results collectively suggest that adverse lifestyles
cause the total product curve for medical care to shift downward and possibly fl atten out.
To compensate for the loss in health, a person may opt to slide up the total product
curve by consuming more medical care. For example, Strum (2002) fi nds that obesity is
related to an average increase in expenditures on inpatient and ambulatory care of $395 per
year.
Environment and Health The relation between environmental factors and health is
mixed and, as a result, it is diffi cult to draw overall conclusions from the literature. Auster
et al. (1969) included two variables in the regression equation to capture the impact of
environmental factors on health: an index of industrialization and a variable that measured
the extent of urbanization. Both measures were hypothesized to be positively associated
25
with such factors as air and water pollution, and therefore negatively related to health. The
index of industrialization was found to cause higher mortality, but the level of urbanization
had no infl uence.
Hadley (1982) undertook one of the more comprehensive assessments of the impact of
environmental factors on health. Included in the regression analysis were variables
representing water quality, air quality, climate, and occupational hazards. The results are
inconclusive, which Hadley attributes mainly to “the lack of good quality data” (p. 73).
Other Determinants and Health: Other variables found to contribute to health are
age and marital status. The impact of marital status on health is interesting and merits a
brief discussion. Married adults appear to experience better health than their single
counterparts, everything else held constant. Most likely, this is because a spouse augments
the production of health within the home. Marriage may also have a positive effect on
health by altering preferences for risky behavior. Manor et al. (2000) fi nd the mortality
rate of married women to be lower than unmarried women for a sample of Israeli adult
women, while more recently Kravdal (2001) fi nds that married people have a higher
chance of survival of twelve common forms of cancer in Norway than their unmarried
counterparts.
The Determinants of Health among Children Numerous studies have investigated the
factors that infl uence health among children. This body of literature is important because
it illustrates the lasting impact of childhood health into adulthood. For example, Case et al.
(2005) fi nd that childhood health has a long-term impact on adult health, education, and
social status. Such information is valuable when crafting public policies aimed at
improving overall health.
Employing county-level data, Corman and Grossman (1985) regress the neonatal
mortality rates for blacks and whites on a host of factors including education of the mother,
the prevalence of poverty (a measure of income), and the availability of public programs.8
Some of the public programs included in the analysis are the existence of neonatal
intensive care facilities, the availability of abortion services, organized family planning,
and Medicaid. Overall, the results are robust and enlightening. Lack of schooling and the
existence of poverty are found to raise the neonatal mortality rate for both white and black
infants. Together, they account for an increase in neonatal mortality rates by 0.950 and
0.786 per 1,000 live births for whites and blacks, respectively. Access to health care also
26
plays a role, as the presence of neonatal intensive care has caused the neonatal mortality
rate to fall by 0.631 and 0.426 per 1,000 live births for white and black infants,
respectively. Moreover, the results indicate that various government programs are
associated with a reduced mortality rate for black as well as white infants. For example,
Medicaid accounts for a decrease in the mortality rate by 0.632 per 1,000 live births for
white children and 0.359 per 1,000 live births for black children.
Two recent articles point to the signifi cance of environmental factors on infant health.
Chay and Greenstone (2003) use county data from 1981–1982 to estimate the impact
of total suspended particulates (TSPs) on infant mortality. TSPs are minute pieces of dust,
soot, dirt, ash, smoke, liquid vapor, or other matter in the atmosphere that can cause lung
and heart disease. The authors find that a 1 percent reduction in TPS causes the infant
mortality rate to fall by 0.35 percent at the county level. Currie and Neidell (2005) find that
reductions in carbon monoxide also impact infant mortality. In particular, they find that
reductions in carbon monoxide in California throughout the 1990s saved approximately
1000 infant lives. These studies are part of a growing body of literature that illustrates the
importance of environmental factors in determining health.
Case et al. (2002) focus on the impact of socioeconomic status on children’s health. To
no one’s surprise, the authors fi nd a strong positive relation between the education of the
parents and the health of their children. For example, the health of children is positively
related to the education of mothers for children living with a mother. Education, in this
case, is measured by whether the mother did not complete high school, had a high
diploma,or had more than a high school education. The education of fathers is also found
to positively contribute to improved health among children, implying that parental
education positively impacts the production of a child’s health at all age levels.
The study also finds that household income is a strong predictor of children’s health.
More specifi cally, the authors fi nd that when household income doubles, the
probability that a child 3 years old or younger is in excellent or very good health increases
by 4 percent. Comparable improvements for children between ages 4 and 8, 9 and 12, and
13 and 17 are 4.9 percent, 5.9 percent, and 7.2 percent, respectively. Just as interesting, the
authors find that permanent income is a strong determiner of children’s health. In
particular, they find that family income before a child is born is positively related to the
child’s health for all ages.
27
Finally, the authors find that healthier parents tend to have healthier children. Why
that is the case, however, remains to be determined. However, the authors do estimate a
series of equations for children with adoptive and biological parents and fi nd that the
impact of income on health is not signifi cantly different across the two populations. While
this evidence is not defi nitive, it does suggest that genetics may explain only part of the
reason why healthier parents have healthier children. Could it be that the production of
health takes place at the household level and that healthier parents are simply more effi
cient producers of health for all members of the household? Clearly, more research needs
to be done before we fully understand how parental behavior coupled with socioeconomic
factors impacts children’s health.
The literature concerning uninsured versus insured status and health outcomes offers
additional insights into the effect of medical care on infant health as well as on other
groups. However, we couch the discussion in terms of the relation between medical care
and health because the only plausible pathway from insurance to health outcomes is
through medical care (Levy and Meltzer, 2001). In a series of articles, Currie and Gruber
(1996a, 1996b, and 1997), using a quasi-experimental design, examine the expansion of
Medicaid eligibility by Congress on birth-related health outcomes. The authors exploit the
fact some states expanded Medicaid eligibility more than others did and at different times.
By correlating the magnitude and timing of eligibility expansions with the magnitude
and timing of changes in health outcomes, it is possible to determine if a causal effect of
insurance on health holds. Currie and Gruber conclude that a significant increase in health
inputs and a corresponding reduction in low infant birth weight and child mortality relative
to a baseline results from an expansion in Medicaid eligibility. They also find that the
magnitude of the Medicaid expansion’s impact on infant mortality depends upon the
proximity of high-tech hospitals.
As another example, Hanratty (1996) examines the impact of Canada’s national health
insurance program on infant health outcomes. Her identifi cation strategy involves the fact
that Canadian provinces adopted national health insurance at different times between 1962
and 1972. She observed changes in the mortality and birth weights of infants across
Canadian counties at different introduction dates for the national health insurance program
while controlling for other nonmedical determinants of infant health. Her results suggest a
signifi cant reduction in the infant mortality rate and a smaller reduction in the low birth
28
weight rate after the introduction of national health insurance in the various provinces of
Canada.
The Determinants of Health among the Elderly
Several studies have examined the medical care utilization and health of individuals
who suddenly become Medicare-eligible at age 65 but previously uninsured to otherwise
comparable individuals who were continuously insured. Lichtenberg (2002) analyzes the
effect of Medicare on the health of elderly individuals by looking for sudden
discontinuities in medical care utilization and health outcomes at age 65, when people
typically become eligible for the federal program. Notice that chronological age is an
external factor that cannot be altered by the nonmedical determinants of health or infl
uenced by health status.
He fi nds evidence that the utilization of ambulatory and inpatient care increases
sharply at age 65. Lichtenberg also fi nds evidence that people spend less time in bed and
face a reduced probability of dying compared to what would have occurred in the absence
of Medicare. His results suggest a relatively large marginal productivity of medical care on
he health of elderly individuals.
These results are reaffi rmed by Card et al. (2007). Using data between 1992 and 2002,
they examine the mortality rates of 400,000 elderly patients who were discharged from
California hospitals before and after their 65th birthday when they become eligible for
Medicare. To control for the possibility that some of the elderly may postpone medical
care until they become eligible for Medicare, the authors compare Medicare-eligible
people to uninsured individuals who were admitted to the emergency room for medical
conditions that require immediate attention. Card et al. find that Medicare eligibility is
associated with more medical spending and procedures and a reduction in the mortality
rate of elderly individuals.
Using a nationally representative data set, McWilliams et al. (2007) provide a
quasiexperimental analysis of longitudinal data for 5,006 adults who were continuously
insured and 2,227 adults who were persistently or intermittently uninsured. Individuals
ranged from 55 to 64 years of age. The authors find that acquisition of Medicare coverage
is associated with improved trends in self-reported health for previously uninsured adults,
particularly for those with cardiovascular disease or diabetes.

29
The Role of Public Health: An Historical Approach
Thus far our discussion has revolved around the production of good health at the
micro, r individual, level. Recall that the health production function, as specified in
equation 2–2, is taken from the perspective of the individual in terms of the various inputs
needed to produce health. We cannot ignore, however, the tremendous impact
improvements in public health have had on health over time through an impact on the
environmental and technology factors in equation 2–2. Public health places the emphasis
on improving health at the community level and looks to such things as improving health
education, controlling communicable diseases, improving sanitation, and monitoring and
controlling nvironmental hazards. The fact that almost every municipality, county, and
state in the country has a department of public health attests to the importance of public
health on our everyday lives.
To illustrate the importance of public health, we discuss two very important public
health interventions in the United States. The fi rst health intervention deals with the
development of clear water in the United States during the fi rst half of the twentieth
century. It coincides in our history with a number of improvements in nutrition and public
health that caused infectious-disease mortality rates to decrease signifi cantly. The second
intervention deals with the development of a polio vaccine, which corresponds with the
growth in modern medicine in United States starting in the 1930s with the development of
sulfa drugs, or antibiotics. (Cutler, 2006)
During the fi rst part of the twentieth century the United States witnessed an almost
unprecedented advancement in health as measured by a drop in the overall mortality rate.
Cutler and Miller (2005) provide a compelling case that a majority of this decrease in
the mortality rate can be attributed to improvements in water quality brought about by
public investments in clean water technologies. Their study uses historical data for thirteen
cities where dates were available for four clean water interventions: water fi ltration, water
chlorination, sewage treatment, and sewage chlorination. The dependent variables in the
study include alternative measures of mortality. The empirical results suggest that
improvements in water quality could explain 43 percent of the reduction in mortality rates
from 1900 through 1936 across the cities in the sample. Even more convincing, cleaner

30
water explained 62 percent of the drop in infant mortality and 74 percent of the decline in
child mortality over the same time period.
Poliomyelitis, or polio, was one of the most dreaded epidemics to hit the United States
in the mid-twentieth century. It is a highly infectious virus that generally affl icts children
and can lead to paralysis or death. The most celebrated case occurred in 1921 when
Franklin Delano Roosevelt, then a relatively unknown politician from New York,
contracted polio
while vacationing with his family. The disease left his legs paralyzed and he was
largely wheelchair bound for the remainder of his life. While his disability was not hidden
from the public, reporters were discouraged from taking pictures of him in his wheelchair
while he was the governor of New York and later the president of the United States.
While polio had been around for many years, the number of new polio cases began to
accelerate in the United States in the 1940s and early 1950s, reaching epidemic proportions
in 1952 with 21,000 new cases. In 1955 the American public received news that Jonas Salk
had developed a polio vaccine. The news was received nationally with much fanfare and
Salk became a national hero overnight. With the support from the federal government and
the March of Dimes, a plan was developed to distribute the vaccination across the country
with priority given to young children. Within two years the number of reported polio cases
fell by approximately 90 percent (Oshinsky, 2005).
This public health intervention is rather extraordinary because for the fi rst time in our
history a private philanthropic organization played a vital role in eradicating a major health
problem. Much of the medical research and distribution of the vaccine was funded by the
National Foundation for Infantile Paralysis, or the March of Dimes, which was started in
1938. Support for the foundation in terms of volunteers and funds was unprecedented and
in 1954 alone the foundation raised an excess of $66 million. The polio vaccine has
improved over the years. Today states require students in licensed day care or kindergarten
to be immunized for polio, with few exceptions. In many communities, local public health
departments, or school clinics, provide vaccinations free of charge for those families who
cannot afford to be vaccinated by a private health care provider.
These two examples illustrate the signifi cant impact public health has had on reducing
infectious diseases in the United States in the twentieth century. In the context of the total
product curve, both public health initiatives caused the curve to shift and rotate upward as

31
illustrated in Figure 2–5. Enhanced water sanitation improved the physical environment,
while the polio vaccination is an example of a new medical technology.
Needless to say, public health can impact the production of health in a variety of ways.
Other examples may include a state-wide anti-smoking campaign aimed at improving
lifestyle or a teenage pregnancy prevention program in the local high schools directed at
enhancing sex education.
The Ten Major Causes of Death in the United States in 2005
As mentioned previously, individual choices, socioeconomic status, and
environmental factors play a signifi cant role in the production of health. If so, one might
suspect that national disease-specifi c mortality rates would refl ect the importance of these
variables.
That is, mortality rates should be high for diseases that are more sensitive to adverse
lifestyles, low socioeconomic status, or unhealthy environments. With this in mind, Table1
lists the top ten causes of death in the United States for 2005. Over the course of the year,
more than 2.4 million individuals died in the United States. Of this number, approximately
77 percent succumbed to the ten most common causes of death listed in the table. By far
Table 1. The ten leading causes in the United States
death is diseases of the heart, accounting for almost 27 percent of all deaths in the
United States in 2005. Although researchers are still unclear as to what determines an
individual’s risk for heart disease, they are certain that the blood level of cholesterol,

32
smoking, level of physical activity, stress, and obesity play a major role in determining the
risk of heart disease. Each of these factors is infl uenced by lifestyle choices,
socioeconomic status, and environmental settings.
The second leading cause of death is malignant neoplasms, or cancers. Lifestyle
choices often have an impact on this type of illness as well. For example, Edlin and
Golanty (1988) point out that approximately 80 percent of all lung cancer deaths, the most
common form of cancer, can be attributed to smoking. Socioeconomic status and
environmental factors also come into play in determining the likelihood of contracting lung
cancer through exposure to such items as asbestos and radon. The third leading cause of
death is stroke and the medical community is in agreement that lifestyle, such as whether a
person follows a proper diet and exercises, impacts the chances of having a stroke.
The fourth leading cause of death is chronic lower respiratory diseases, which includes
chronic obstructive pulmonary disease, emphysema, and chronic bronchitis. Air pollution
plays a critical role in the progression of these diseases. The next leading cause of death is
unintentional injuries, which deals with deaths directly related to individual behavior such
as automobile and industrial accidents rather than natural causes.
Finally, the list is interesting for what it does not include. In 1995 the human
immunodefi ciency virus (HIV) was the eighth leading cause of death and accounted for
32,655 deaths. By 2005 that number had dropped to 12,543. This dramatic decrease in the
number of deaths can be attributed to a series of factors including improved therapies and
changes in lifestyle brought about by great public awareness of the disease.
This rather simple exercise underscores the importance that lifestyle choices,
socioeconomic status, and environmental factors play in determining deaths in the United
States. It is worth noting that the information in Table 1 can also be used to illustrate the
importance that an individual’s mental and physical profi le play in the making of health.
For example, age is a critical factor in determining the onset of Alzheimer’s disease, while
the environment, genetics, and age contribute to development of diabetes.

33
Chapter 2: Economics of Health and Health improvement
THE ECONOMICS OF HEALTH
Economics is a discipline whose well-developed tools can be, and have been, applied to a
wide range of topics. Exactly what ‘topic’ health economics addresses, or more precisely
how narrowly the topic should be defined, are still a contentious issue. At one extreme,
Kielhorn and Graf von der Shulenburg (2000) have stated that health economics is a
discipline that analyses the economic aspects of the healthcare industry, using methods and
theories from economics: (p. 79, emphasis added). At the other extreme, Culyer (1981) has
defined health economics as the application of the discipline and tools of economics to the
subject matter of health. Several leading health economists have attempted to
conceptualize the area diagrammatically. Williams (1987) produced a schematic structure
of health economics under eight headings (Figure 12.1) and this has been widely used to
encapsulate health economics. Only two of these categories are specifically about health
and these encompass the literature on health determinants and the measurement and
valuation of health. However, there seems to be no intrinsic reason why health should not
feature within the remaining categories, other than that they reflect the preoccupations of
the time. Health economics has from its outset been predominantly concerned with health
care economics and the literature on health has been modest by comparison. A
bibliography of ‘health economics’ publications in the English language up to 1974 yields
just 21 references that fall outwith the area of health care (Culyer et al. 1977). More
recently, Maynard and Kanavos (2000) reviewed publications in the two main health
economics journals (Health Economics and the Journal of Health Economics) up to 1999
and found less than 20% of articles to be in the two categories relating primarily to health.
Evans and Stoddart (1990) identified the gap between the developing research on the wider
determinants of health and the focus of health policy primarily on issues related to the
provision of health care. They argued that this was, at least in part, due to an absence of
appropriate models to conceptualize the problems and they set out a comprehensive
framework of the determinants of health (see Figure 12.2). Health care is shown to be one
of many determinants that include social and physical environment, genetic endowment
and individual behaviour. While health care is arguably a suitable, if narrow, topic for the
34
application of economic methods and theories, it is evident from the Evans and Stoddart
schema that it is by no means the sole producer of its principal output. Health economics
ought therefore to address the complete range of determinants that produce (or reduce) that
output.
A further point raised by Evans (1984) and by Evans and Stoddart (1990) is the need for a
clear definition of the ‘health’ part of health economics, arguing that if health is
synonymous with well-being or utility, then health economics becomes the economics of
everything. There is a clear sense in which health is not synonymous with well-being.
Trade-offs between health and other goods, services or activities can be observed on a
daily basis. However, relatively little attention has been paid to the relationship between
health (however perceived) and utility, and the resulting implications for individual
behaviour. This is a key issue if health is to be the focus of interest.
There is a large and growing literature on the measurement and valuation of health,
dominated by functional definitions and negative, disease-based models appropriate to
decision-making within the health care sector (for a review see Dolan 2000). Some utility-
based approaches are adopted, but broader measures of outcomes may be required to
include other dimensions of health.
In addition, many of the actions taken, both by individuals to improve their own health and
by the state through a range of policies that affect the health of the population, also yield
benefits over and above those directly from health improvements. The value of these
actions must be based on the full range of benefits accrued. Difficulties in assessing the
trade-offs (assuming they exist) between the utility from health and the utility from all
other sources mean that it may not be possible to avoid ‘the economics of everything’ in
this context.
This is one of the important challenges to developing economic analysis.
MARKETS AND HEALTH
It has been argued that economists’ focus on health care can at least in part be explained by
the fact that health has no value in exchange; it is not traded and a market for health does
not exist (McGuire et al. 1988). However, realism has

35
Figure 7. Determinants of health
Source : reprinted from Evans and Stoddar 1990, with permission from Elsevier
Science.
never been a barrier to the economic paradigm and the absence of a market does not
entirely explain the failure to analyse behaviour more often ‘as if’ a market did exist.
Trade-offs involving risks were the basis of some of the early literature on value of life,
providing at least some basis for a value in exchange. Observed labour market behaviour
provides a basis for valuing certain health. Methods can be further developed to value
attributes that are indirectly traded.
THEMARKET FOR HEALTH-AFFECTING GOODS AND SERVICES
The behaviour of consumers and producers in the market for health can be approached in
two basic ways. The first uses standard economic market theories applied to goods known
to have an effect on health and for which markets exist. (The second approach, based on
household production functions and demand for health, is considered in the next
subsection).
36
Interestingly, most of the work by health economists in this area has focused on goods that
are detrimental to health such as tobacco, alcohol and illicit drugs. The research on
smoking, alcohol and illicit drugs has recently been reviewed (Chaloupka & Warner 2000;
Cook & Moore 2000; SBU 2001).
The literature on health-affecting goods includes policy-relevant analysis, such as the price
elasticity of demand for cigarettes (e.g. Fujii 1980) and alcohol (e.g. Walsh 1982) and the
consequences of price changes in terms of both consumption and revenue (e.g. Hu et al.
1995). Individual consumption behaviour has also been modelled, with attempts to account
for features of health-affecting goods (mainly addiction) which make consumer behavior
different from ‘normal’ market goods (Becker & Murphy 1988; Jones 1999; Suranovic et
al. 1999).
Little of this research has addressed the underlying demand for health that may influence
individual behaviour. In particular, studies of individual commodities fail to take account
of the consequences of changes in demand for other health-affecting commodities. Studies
that have considered this issue have found both substitution effects and complementarity
between such goods.
For example, Dee (1999) found that higher cigarette taxes reduced both teenage smoking
and the prevalence of teenage drinking and Farrelly et al. (2001) found similar effects for
marijuana use. However, increasing the minimum age for legal drinking slightly reduced
the prevalence of alcohol consumption and slightly increased the prevalence of marijuana
consumption (DiNardo & Lemieux 2001). This suggests that there are different attributes
relating to the consumption of different health-affecting goods.
DEMAND FOR THE FUNDAMENTAL COMMODITY ‘HEALTH’
While all of the above relate to the market for health-affecting goods and services, none
focus on the real commodity of interest – health. However, concentrating on the attributes
of health and health-affecting goods may be a useful avenue to pursue. The origins of this
approach lie with Becker (1964) who first proposed the concept of households being
producers as well as consumers. Grossman (1972) applied this approach to health with a
model in which individuals or households were both producers of health and consumers

37
of health care. The Grossman model has been influential in conceptualizing the demand
for health but it involves a number of assumptions about the relationship between utility
and health.
Grossman argued that an individual’s stock of health can yield two distinct types of utility;
that from consumption (consuming yields more utility when healthy than when ill) and that
from production (more health means more healthy time which means greater income and
hence more consumption).
This implies a contingency relationship in which health may be different from other
arguments in the utility function. The Grossman model makes no reference to other stocks
(e.g. wealth or education), implying that the utility from greater health is independent of
the individual’s levels of these other stocks. Muurinen (1982) developed a Grossman-type
model which included other stocks, and in which the rate at which individuals draw on
their stock of health through consumption of hazardous goods depends on the relative size
of the health stock compared with the others. In other words the utility from a change in
health is not independent of other characteristics of the individual and individuals can trade
health utility against other sources of utility.
The Grossman model also assumed that the utility from any increase in health stock is
independent of its source. Ippolito (1981) showed that the demand for goods which
increase risk is not independent of the nature of the hazard; in her case whether the hazard
is constant (fixed probability of death per unit consumed) or cumulative. The importance
of the nature of the hazard is also evident in the literature on risk (e.g. Mole 1976) that
consistently shows that individuals will ‘accept’ higher risks that are under their own
control (e.g. my decision to go hang gliding) than when imposed (e.g. environmental
hazards). In these cases the utility from a change in health will not be independent of how
it was brought about, suggesting that health improvements that arise from individual
behaviour change may have a different role in the utility function from health
improvements from external events such as improved housing or cleaner air. The degree of
success in changing individual behaviour also appears to vary with the type of change
being promoted (e.g. smoking compared with alcohol or dietary change). This suggests
that more consideration needs to be given to the attributes of health that may vary in
different settings, rather than treating it as a single entity.
38
While Grossman’s landmark contribution has been influential in shaping the literature in
this area, its focus was on the derived demand for health care.
Grossman and Rand (1974) explored the relationship between prevention and cure in an
extension to the demand for health model, and although explicitly recognizing that the
consumption of goods other than health care affects the stock of health, they ruled out all
types of joint production for the purposes of the model.
Subsequent literature has produced a number of developments and improvements,
including further empirical estimates (Grossman 2000), but health care has tended to
remain central to the analysis. As such, the ‘market’ analysis is only partial. Some factors
that influence the efficiency of the household production function, such as education and
income, have been included but this particular approach cannot encompass all the health-
affecting activities in which individuals engage (Muurinen 1982). What remains less
explored is the extent to which the demand for other health-affecting goods, particularly
those whose consumption reduces the risk of illness or injury, can be explained by demand
for health models.
CONCEPTUALMODELS OF HEALTH-AFFECTING BEHAVIOUR
Health-affecting behaviour can be considered in terms of the demand for health-affecting
(both positive and negative) goods. A major difficulty of conceptualizing health-affecting
behaviour within a demand for health framework is that health-affecting goods run along a
continuum from those demanded solely for their effects on health (vitamin supplements) to
those which may have only incidental effects on health and may be demanded for reasons
unrelated to health (exercise).
Cohen and Mooney (1984) developed a taxonomy of health-affecting goods and services
which led to a conceptual model of preventive behaviour (Cohen 1984) based on the
demand for prevention goods and hazard goods. The essence of the ‘utility model of
preventive behaviour’ was that much of the demand for prevention goods, defined as goods
whose consumption reduces the risk of future ill-health, could be perceived as being
derived from the demand for health. On the other hand, the demand for hazard goods,
defined as goods whose consumption increases the risk of future ill-health, would have to
be viewed differently. On the assumption that better health is preferred to worse health,

39
hazard goods will only be demanded if they yield positive utility from other attributes of
the good.
Both prevention goods and hazard goods were thus seen as potentially yielding utility from
two sources: the use value of the good (utility-in-use) and the knowledge that consuming
the good alters risk (utility-in-anticipation). In the case of prevention goods, utility-in-use
could be negative, as would be the case in all health care, or positive. For hazard goods,
utility-in-use would have to be positive. Utility-in-anticipation would be positive for
prevention goods from the knowledge that risk is reduced and negative for hazard goods
from the knowledge that risk is increased. The demand for any prevention or hazard good
is thus dependent on the relationship between the sum of the two types of utility and its
price. Examination of the factors which influence utility-inanticipation, which inter alia
include the individual’s own time preference rate and degree of risk aversion, leads to
policy implications which suggest a move away from traditional health education as a
means of altering preventive behaviour.
Other expected utility models have been developed in the context of insurance. Ehrlich and
Becker (1972) proposed that, in response to uncertainty, self-protection and self-insurance
activities were alternatives to market-based insurance offering monetary compensation.
Self-protection is consistent with primary prevention and self-insurance with secondary
prevention. Interactions between preventive and curative services have also been explored
(Nordquist & Wu 1976; Phelps 1978; Kenkel 1994).
While health can be regarded as a fundamental commodity produced by consumers it is
clear that any individual’s level of health stock and its rate of depreciation are affected by
numerous factors outside of the individual’s control (see Figure 12.2). The health
determinants model can be seen as the basis for considering the production of health from
a societal perspective.
While some factors may have to be taken as given (e.g. health endowment at birth, genetic
disposition) others can be influenced by government policies which are not solely aimed at
health issues but which may nevertheless have major impacts on health. The extent to
which such health effects are yielded only ‘incidentally’ will vary greatly between these
non-health care policies.
At one extreme are the broad policies to manage the macro-economy. Although these are
clearly pursued for reasons that are not health-related they may nonetheless have
40
significant health impacts. For example, some research findings suggest a relationship
between unemployment and health (Brenner 1973, Moser et al. 1984), although other
research has cast some doubts on whether the evidence supports this (Gravelle & Simpson
1981; McAvinchey 1982; Wagstaff, 1985). If true, then any government measure aimed at
reducing unemployment can at the same time be regarded as health policy. Other policies
may be explicitly addressing issues related to the wider determinants of health but little is
known about their effects on health. For example, there are consistent findings of a strong
association between inequalities in health and inequalities in income (van Doorslaer et al.
1997; Benzeval & Judge 2001), with some studies addressing the issue of causality (Ettner
1996). However, specific research on the impact of poverty reduction measures is lacking.
Evidence reviewed for the Acheson Report identified only one trial relating to income
support, and the health outcome employed – effect on low birth-weight – was relatively
short-term (Kehrer & Wolin 1979; Department of Health 1998).
Other, more specific government measures may have an even stronger but still incidental
effect on health. For example, while housing policy is primarily concerned with improving
living conditions per se, such improvement can also have significant impacts on health; for
example where damp conditions lead to respiratory diseases or hazards in the home have
high risks of accidents. Again, whilst there is an established link between poor housing and
poor health, there is only limited evidence of the impact of specific interventions
(Thomson et al. 2002). Other policies such as environmental protection may have a more
explicit health-producing aim, while others such as occupational health and safety will be
specifically aimed at health.
Overall, evidence of the potential health improvement to be derived from tackling the
wider determinants of health remains only potential. The marginal productivity of these
measures as compared to the marginal productivity of health care is largely unknown
(Cochrane & Campbell Collaboration 2000).
Some evaluations of specific interventions have been undertaken and these are reviewed
briefly in the next section, but these reveal rather patchy progress in measuring the
productivity of policy measures.

41
INTERVENTIONS
Standard economic evaluation methods have been applied in the healthaffecting area to a
broad range of lifestyle interventions either directly (e.g. Godfrey 1994) or as risk factors
for specific diseases (e.g. Baxter et al. 1997). It is beyond the scope of the present chapter
to provide a comprehensive review and indeed the number of economic appraisals in this
area is becoming so large that an overall review is becoming increasingly difficult.
It should be noted, though, that economic evaluations of health-affecting behaviour have
been biased towards evaluations which come close to a treatment model, particularly in the
case of smoking cessation (e.g. Nielsen & Fiore 2000). With respect to treating alcohol and
drug abuse, a recent review identified only 24 economic evaluations (of 1200 studies
which included discussion of costs) and judged half of these to be of low scientific quality
(SBU 2001). There are fewer studies in other lifestyle areas such as dietary interventions
(Pritchard et al. 1999) or exercise (Sevick et al. 2000). The relative lack of economic
evaluations in some areas may be related to the lack of good quality evaluations on which
to base such analysis. Economic evaluations of broader health promotion programmes are
less common. Mass media advertising campaigns for quitting or prevention of smoking
have been evaluated (Ratcliffe et al. 1997). Health education approaches or health
promotion interventions have been used to reduce cardiovascular risk factors, either on
their own (Salkeld et al. 1997) or in association with risk factors for other diseases (Fries &
McShane 1998).
Some of the economic studies on specific policies, such as tobacco and alcohol taxation,
have been referred to earlier. An additional area of antismoking legislation that has been
assessed is the impact of advertising bans or controls. Few economic studies have been
carried out relating to other aspects of government legislation and these tend to be
evaluations of enforcement issues such as drink-driving.
In recent years there has also been a growing recognition of the need to evaluate the health
effects of non-health policies. Guidance on how government departments and other public
sector agencies should appraise health impacts of broader public policy was first set out in
1995. Further guidance on Health Impact Assessment (HIA) has since been published
(Cabinet Office 1999) which recommends rigorous economic appraisal and is largely
consistent with Treasury guidance on appraisal and evaluation (the ‘Green Book’), as well
42
as guidance published by different government departments. Guidance on how to perform
such rigorous economic appraisals is now widely available.
However, outwith government departments the main practitioners of HIA have largely
eschewed this approach. In particular, the emphasis placed on considering the objectives
that are being addressed, and the alternative policy options that are available to achieve
them, has been largely ignored. Widely followed guidelines for HIA have been developed
that concentrate on the health impacts of single projects, and how these might be
ameliorated (if negative) or enhanced (if positive) (Scott-Samuel et al. 1998). Partly
because of the rejection of the overtly quantitative approach of economic appraisal and
evaluation, many HIA studies fail to consider the evidence of effectiveness and cost-
effectiveness.
Similar to the way in which economic evaluations of lifestyle issues have focused on
behaviours which increase risk, HIA has also focused on policy factors which have a
detrimental effect on health. Less is known about the comparative effectiveness of policies
that improve health and/or reduce inequalities in health. Such evidence is undoubtedly
difficult to assemble and liable to be incomplete. A recent compilation of the evidence
from systematic reviews of research relevant to the ‘wider public health’ agenda reveals
the extent of the gaps in current knowledge (Cochrane & Campbell Collaboration 2000). In
respect of interventions to reduce health inequalities, the Acheson Report (Department of
Health 1998) and the work of its associated evaluation group (Macintyre et al. 2001) have
highlighted the paucity of the evidence base.
There are also issues in evaluation which arise from the nature of some of the programmes
being evaluated. A recent consultation document (Department of Health 2001) identifies
both eradication of child poverty and improving educational opportunities as part of a
wide-ranging strategy for improving the health of children in low-income families. These
provide examples of the type of policy initiative that pose particular challenges in carrying
out evaluation to provide robust evidence of cost-effectiveness for policy-making.
These interventions have potential macroeconomic implications, whereas economic
evaluation is essentially a microeconomic tool. Some of the impacts will be very long term
and the nature of the interventions is such that direct comparisons between interventions
and the status quo are not feasible. This is not to say that evaluation cannot or should not
be carried out, but rather that the standard methods of economic evaluation need to be
43
adapted and developed. This will be necessary in order to measure and compare the impac
of such policies with interventions that have more direct effects and shorter. time scales.
The problems of conducting economic evaluation in the broader health field are shared
with other social welfare programmes (Sefton et al. 2002).
FUTURE CHALLENGES AND AN AGENDA FOR RESEARCH
The focus of health economics has been predominantly on health care and there is
considerable scope for a shift of research effort towards health, particularly in the light of
increasing policy interest in the wider determinants of health. More research on health
implies more research addressing some of the conceptual challenges of such a shift in
paradigm, as well as more evaluation research on the cost-effectiveness of health
improvement interventions.
The main conceptual themes that emerge relate to the definition, measurement and
valuation of health, the relationship between health and other sources of utility and the
demand for and production of health. In all these areas, it seems important to accept that
health may not be a single entity and that consideration of attributes of health may provide
more promising opportunities for research. One of the potential uses of discrete choice
experiments may be to establish willingness to pay values for programmes (Ryan 1999) or
to provide trade-off values for different attributes. In the context of evaluations, these
methods may avoid the need to explore definitions of health and utility in any depth.
However, such explorations could forward an understanding of individual behaviour and
motivation in respect of demand for health and health-affecting goods, where the
contribution of economics to date has been minimal.
In empirical work, there has been a bias towards exploiting existing data; hence the
emphasis on issues such as tobacco and alcohol, where market data are available. In posing
broader questions, researchers will have to consider other sources of secondary data as well
as the possibility of generating primary data from questionnaires and choice experiments.
Economic evaluation studies have clearly been circumscribed by the availability of
effectiveness evidence but, again, it is possible that evidence does not need to be limited to
experimental interventions but other sources of longitudinal or cross-sectional data can be
44
exploited. The use of routinely collected data sets is increasingly being seen as a way of
reducing current reliance on randomized controlled trials (Raftery et al. 2002).
Recently, Edwards (2001) reviewed four ‘visions of the future of health economics’ by
established leaders in the field: Williams (1993), Phelps (1995), Maynard and Kanavos
(2000) and Fuchs (2000). She concluded that all four visions, and their associated research
agendas, are almost exclusively focused on health care rather than health (with Fuchs to a
lesser extent).
Edwards (2001) presents an alternative paradigm which builds on Williams’ schematic
presentation of the main element in health economics (Williams 1987). In particular
Williams’ two core elements ‘demand for health care’ and ‘supply of health care’ are
replaced with ‘health of society’ and ‘health of the individual’ to emphasize that health
rather than health care ought to be seen as the relevant social want. She also adds an
element ‘macroeconomic evaluation of public policy and health’ to allow cross-sectoral
programme budgeting and marginal analysis of prevention to be considered within the
paradigm. If health economics is to include everything relevant to the supply and demand
for health, then Edwards’ view possibly represents a more appropriate framework.
This approach raises some interesting challenges for the direction of future research. For
example, within the conventional health care paradigm, advances in the area of measuring
and valuing health states (a single element of the Williams schema) has mainly been driven
by the need for an outcome measure to assess the cost-effectiveness of different health care
interventions. Thus the debate about quality adjusted life years (QALYs) has to address the
issue of whose values ought to be used. The Edwards’ paradigm on the other hand, with its
separation of ‘health of society’ from ‘health of the citizen’, provides an opportunity for a
focus on individuals’ decisions about health-enhancing and health-harming behaviour
which is based solely on individuals’ valuations.
Similarly, the addition of the element ‘macroeconomic evaluation of public policy and
health’ emphasizes the importance of non-health policies on the health of individuals and
society.
The future research agenda should encompass theoretical developments in understanding
the ‘market’ for health, particularly the demand for health and the way in which health
enters the individual’s utility function, as well as research in policy appraisal and economic

45
evaluation. Discrete choice experiment methods offer opportunities to explore the trade-
offs between health and other attributes of health-affecting goods and may provide insights
into the value attached to health. Better methods of evaluation need to bedeveloped and
applied. These should include exploring the use of secondary data sets to assess the impact
of policies on health and not simply to establish statistical associations between health and
life circumstances. In particular, longitudinal data sets could be used in the framework of
before and after studies. More generally, however, a change in focus towards health
economics rather than health care economics is required.

46
Chapter 3: Governance in Health System
The Constitution of India envisages the establishment of a new social model based on
equality, freedom, justice and dignity of the individual. It aims for elimination of poverty and
of ignorance towards health and thereby seeks to raise the level of nutrition and the standard
of living of its citizens. It emphasises that better public health is every state’s primary
objective, placing priority on the health and strength of its people, especially on ensuring the
growth of children in a healthy environment. The approaches of previous planning documents
may have generally served the needs of some, but there is still a need to develop a
comprehensive approach towards the progress of medical education, research and health
services in order to serve the actual health needs and priorities of all people.
In spite of some progress, the demographic and health pictures of India are still cause for
serious concern. The high and distressing rate of population growth, maternal and child
mortality, severity of malnutrition, the emerging challenge of noncommunicable diseases,
lack of basic sanitation, etc., mandate that it is time to reformulate the vision and mission of
our health care system. Without community involvement, the ultimate goal of a satisfactory
health status cannot be achieved. Thus, it is necessary to identify a community’s health needs
and priorities for the management of various health related programmes.
This chapter emphasises the involvement of the private sector in meeting the demands of the
health care sector in the state of Gujarat in order to reach the masses better. Ensuring health
service at an affordable cost is another issue of concern. However, the real challenge is to
expand the corollaries of the ‘multiplier effect’ by extending services to the rural areas. The
government has been quite successful in acknowledging the model of ‘multiplier effect’ and
has subsequently developed a ‘three tier system’ of management. Medicine has been one of
the most progressive sectors in India, but the reach of health care has lagged behind. Many
issues of concern in Western countries, such as availability of counsellors in schools or
hospitals, have not received any recognition in our country.
The LaLonde Model: The LaLonde model was first proposed by LaLonde in 1974, with a
focus on health promotion. Later, in the year 2003, it was expanded to include 12
determinants. The determinants of health mentioned in the model are: (i) income and social
status; (ii) social support networks; (iii) education and literacy; (iv) employment and working
conditions; (v) social environments; (vi) physical environments; (vii) personal health practise
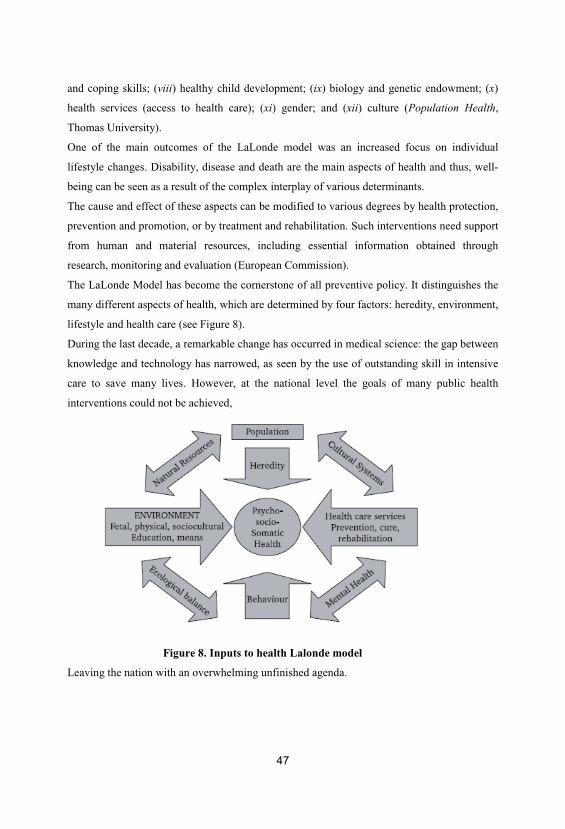
47
and coping skills; (viii) healthy child development; (ix) biology and genetic endowment; (x)
health services (access to health care); (xi) gender; and (xii) culture (Population Health,
Thomas University).
One of the main outcomes of the LaLonde model was an increased focus on individual
lifestyle changes. Disability, disease and death are the main aspects of health and thus, well-
being can be seen as a result of the complex interplay of various determinants.
The cause and effect of these aspects can be modified to various degrees by health protection,
prevention and promotion, or by treatment and rehabilitation. Such interventions need support
from human and material resources, including essential information obtained through
research, monitoring and evaluation (European Commission).
The LaLonde Model has become the cornerstone of all preventive policy. It distinguishes the
many different aspects of health, which are determined by four factors: heredity, environment,
lifestyle and health care (see Figure 8).
During the last decade, a remarkable change has occurred in medical science: the gap between
knowledge and technology has narrowed, as seen by the use of outstanding skill in intensive
care to save many lives. However, at the national level the goals of many public health
interventions could not be achieved,
Figure 8. Inputs to health Lalonde model
Leaving the nation with an overwhelming unfinished agenda.
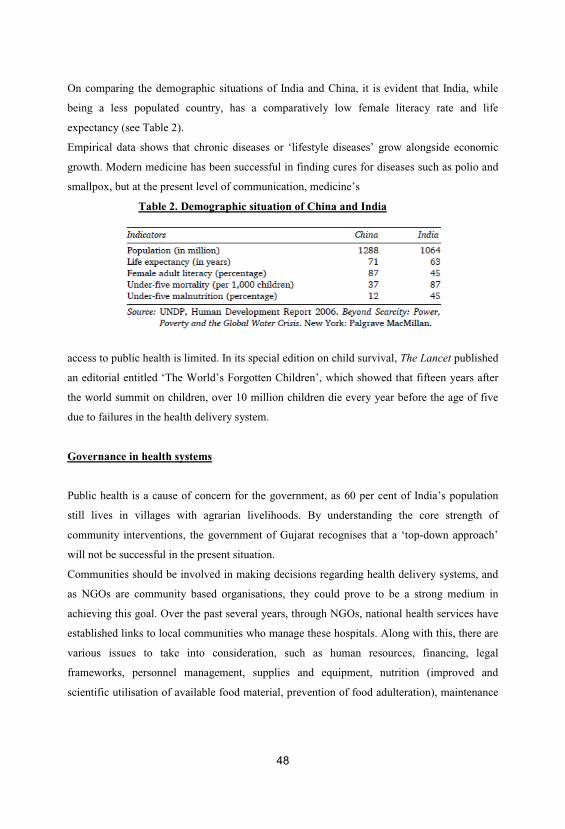
48
On comparing the demographic situations of India and China, it is evident that India, while
being a less populated country, has a comparatively low female literacy rate and life
expectancy (see Table 2).
Empirical data shows that chronic diseases or ‘lifestyle diseases’ grow alongside economic
growth. Modern medicine has been successful in finding cures for diseases such as polio and
smallpox, but at the present level of communication, medicine’s
Table 2. Demographic situation of China and India
access to public health is limited. In its special edition on child survival, The Lancet published
an editorial entitled ‘The World’s Forgotten Children’, which showed that fifteen years after
the world summit on children, over 10 million children die every year before the age of five
due to failures in the health delivery system.
Governance in health systems
Public health is a cause of concern for the government, as 60 per cent of India’s population
still lives in villages with agrarian livelihoods. By understanding the core strength of
community interventions, the government of Gujarat recognises that a ‘top-down approach’
will not be successful in the present situation.
Communities should be involved in making decisions regarding health delivery systems, and
as NGOs are community based organisations, they could prove to be a strong medium in
achieving this goal. Over the past several years, through NGOs, national health services have
established links to local communities who manage these hospitals. Along with this, there are
various issues to take into consideration, such as human resources, financing, legal
frameworks, personnel management, supplies and equipment, nutrition (improved and
scientific utilisation of available food material, prevention of food adulteration), maintenance

49
of drug quality, water supply and sanitation, environmental protection, school health and
occupational health services.
There are 38,000 health personnel, 6,500 qualified doctors and 3,000 trainers in the Indian
system of medicine. Similarly, there are close to 10,000 other staff and field workers in the
health sector.
The government has 122 different types of designations, some in use since the British time,
including the post of thermometer washer (whose only duty was to wash thermometers),
which was discontinued only recently. As compared to the other states of India, the
Government of Gujarat’s expenditure on health care is quite high. Even though there are an
adequate number of machines in the hospitals (district hospitals have four x-ray machines),
including standbys, machine maintenance is mainly neglected.
The government’s strength has to be used by hospital boards to ensure transparency,
accountability and performance improvement.
This is done by taking proper steps, which involve strategic planning, monitoring of
organisational performance, clinical quality assurance, patient safety, annual budgeting,
creation of a positive employee culture, medical staff relations, policy lobbying of
government and finally, reporting performance to public.
Public-private partnership
Due to moral vulnerabilities of the medical staff, private practice is not allowed in the
government sector. However, in tribal and border areas where medical facilities are not
available, collaboration with the private sector is encouraged. After analysing the situation in
slums over several years, it was observed that people living in slum areas spend much more
on water and hospitals as compared to the middle class. People must stand in a queue when
they visit the public hospital, and as hospital visits are often time away from work, people
lose wages while waiting. As a result, they prefer to opt for private services and pay out of
pocket. Concerns regarding housing, water and health include quality and accessibility. In the
current situation, if the government assures service, people will pay for them, as they do not
need subsidised health care services.
Public-private partnership should incorporate District Rural Health Missions, District Health
Societies and the emergency medical services scheme. Primary Health Centres (PHCs) and

50
Community Health Centres (CHCs) should be handed over to Trust Managed
Organisations/Voluntary Organisations (NGOs) for optimal productivity. Consideration
should also be given to large district hospitals for establishment of tertiary cardiac care
centres. Zilla Rogi Kalyan Samitis must be established for patient welfare activities.
There is a need to provide primary health care, placing special emphasis on the preventive,
promotional and rehabilitative aspects. Approaches for restructuring health services should
provide a well-dispersed network of primary health services while integrating non-
governmental organisations and private institutions within a time-bound programme and by
also training health volunteers in simple skills and technologies. Other approaches of reform
are well-furnished referral systems and packages of services to overcome poor health
conditions. Establishing low-cost curative centres with all modern equipment and offering
organised logistical, financial and technical support to voluntary health agencies will also be
helpful. This, in turn, can encourage individual self-reliance and community participation
with the support of secondary and tertiary levels of health care services. The organisation of
programmes for sectors of mental health and for the medical care and rehabilitation of
mentally retarded, deaf, dumb, blind, physically disabled, infirm and elderly populations are
other issues that need to be addressed.
Under the concept of re-orientation, a dynamic process of change and innovation should be
used for the whole approach of promoting the concept of ‘Health Team’ that is, the vast
untapped resources of AYUSH practioners should be integrated and health education
programmes should be nationally supported by appropriate communication strategies. Even
after extensive progress in Gujarat, only 10 million school children are covered by the
network of government and voluntary private doctors.
An effective health information system is required for planning, decision-making, forecasting,
reviewing and monitoring of the programmes. Along with this, there is a need for innovation
of sound technological and manufacturing capability in the fields of drugs, vaccines,
biomedical equipment etc., especially for emerging challenges like HIV. Health insurance is
necessary for mobilising additional resources and for ensuring that the community shares the
cost of services. Health and human development must ultimately constitute an integral
component of the overall socioeconomic development process in the country.

51
Medical audits and evaluation of the quality of the medical care provided by physicians
should be undertaken to detect deficiencies and ensure collective accountability for quality
care.
In a couple of districts in Gujarat, tele-medicine and Management Information Systems (MIS)
for the health sector, which can be used as early detection systems for epidemics, are under
trial.
These systems have also been extended to other departments and commercial auditing is
being conducted by professional Chartered Accountants (CAs). It is clear that there are ample
resources, but there is a need to overcome coordination deficits and to concurrently strengthen
the traditional Indian system of medicine. Every year, there are new problems and therefore
new, creative solutions must be developed for these problems.
Finally, it can be said that We may have missed in achieving ‘Health For All by 2000 AD’ but
let us strive to make ‘Vision 2020’ a reality. We have most likely failed due to poverty-of-
vision and not as a result of poverty-of-funds. No matter how bleak the situation is, there are
always alternatives (Polish Proverb).
Good Governance in Health Services
Good governance is one of the most important factors in improving health services. Merely
adding new technological packages is not enough and they may improve the outcome
marginally.
Through good governance we can achieve a quantum jump in health outcomes.
Transparency International (TI) has been bringing out a Corruption Perception Index (CPI)
every year. Transparency International-India did an empirical survey with the help of Org-
Marg Private Ltd in 2004. The study clearly shows the health sector as the most corrupt,
following the police. A similar study during 2005 also shows that government hospitals are
the most corrupt amongst the five public sectors which provide basic needs—schools, water
supply, PDS, electricity and government hospitals.
The report of the Task Force on Health and Family Welfare, Government of Karnataka, under
the chairmanship of Dr H. Sudarshan, has also put Corruption in health services at the top of
the list of ‘Major issues of Concern’. The Karnataka Lokayuktha, an ombudsman organisation
at the state level, has also data to show that health sector is one of the most corrupt sectors.
52
The corruption in public health services has become an epidemic. We need to study and
understand the pathogenesis, the aetiological factors, diagnosis and management of this
epidemic. The eradication or elimination of corruption may be a distant dream. But we can
certainly control it.
Effective management and supervision, e-governance for transparency and accountability,
training in Health Management 8 for doctors, hospital committees, citizen’s charter, report
card system, strengthening the consumer forum, and awareness about Right to Information
Act and Transparency Act are some of the measures which can bring good governance in
health services.
Introduction
New technological innovations are not enough to improve health outcomes—good
governance is also necessary for progress in health services. Through good governance, a
quantum jump in health care outcomes can be achieved. Corruption is rampant in India. Every
year, TI comes out with the CPI, ranking various countries around the world. More than two-
thirds of the 158 nations surveyed under the 2005 TI-CPI scored less than five out of an
optimal clean score of 10, indicating serious levels of corruption in their system. The CPI for
India was 2.9, with a worldwide rank of 88. Iceland had the lowest level of corruption; while
Bangladesh and Chad were found to be the most corrupt countries (see Table 3).
Transparency International-Corruption Perception Index projected corruption levels among
Indian states during 2005 through an empirical survey with ORG-Marg Private Ltd. Bihar was
determined to be the most corrupt state in India, whereas Kerala was the least corrupt (see
Table 4).
This study covered 10 sectors, which included the police, health, education, Public
Distribution System (PDS), land administration, judiciary, taxation, railways and telecom
departments.
Among need-based services, the police department was the most corrupt in the Indian
government whereas the telecom department was the least (see Table 5). However, in basic
services, the government hospitals were the most corrupt. Regional distribution of the Indian
CPI shows that the health department attained the highest score in eastern India, whereas in
the north,

53
Table 3. Transparency International Corruption Perceptions Index
Table 4. Corruption Study of India by Transparency International India, 2005
south and west, the police department was the most corrupt.
This data also indicates that the health and power sectors are those with the most impact on
society, making them highly corruptible departments.
Table 5. Corruption index and ranking of services

54
The epidemic of corruption in health services at the national level
The basic services are government monopolies. It is clear that the health sector, specifically
government hospitals, is perceived to be the most corrupt sector in basic service while also
having the highest public interaction (8 per cent) and greatest societal impact, affecting a
population of 81 crore people. Health comprises nearly the highest portion of the bribe
amount paid, at 40 per cent (Rs 75.7 billion) of the total (Rs 267 billion) (Transparency
International India 2005). Bribe payment is typically done through hospital staff, and demand
for money is more common in southern India (38 per cent) than northern (25 per cent).
Even amongst the medical staff, it was widely felt that doctors demanded more than the other
staff.
Task force on department of health and family welfare, Government of Karnataka
Corruption in public health services has become an epidemic.
It is now necessary to study and understand the etiology and pathogenesis of this epidemic so
as to develop a diagnosis and for proper management of this ‘disease’. Although it may not be
possible to ‘eradicate’ corruption like small pox, it can indeed be ‘controlled’, like
tuberculosis. The Government of Karnataka constituted a Task Force on Health and Family
Welfare under my chairmanship (vide Government Order No. HFW 545 CGM 99) on 14
December 1999. The mission of the Task Force was to make recommendations for
improvements in public health and on major issues like population stabilisation, departmental
management and administration, educational system reform covering both clinical and public

55
health sectors, and developing a plan for monitoring the implementation of these
recommendations.
The final report of the Task Force highlighted 12 major issues concerning health care and
placed corruption right on the top.
The other 11 issues were neglect of public health, distortions in primary health care, lack of
focus on equity, gaps in implementation, neglect of ethics and law, neglect of human resource
development, cultural gap and medical pluralism, from exclusivism to partnership, ignoring
the political economy of health, neglect of research, and countering the growing apathy in the
system. The Task Force concluded that corruption in health services is the major issue of
concern, even in Karnataka.
History of Karnataka Lokayukta
The present Karnataka Lokayukta had its beginnings in the Mysore State Vigilance
Commission established in 1965. In 1984, the Karnataka Lokayukta Act came into existence
and the Karnataka Lokayukta Rules were set the following year. In September of 1986, the
Karnataka Lokayukta Act was amended and suo moto prosecution powers against officials
with a basic salary above Rs 10,600 per month was withdrawn, thus removing all the senior
officers, bureaucrats and ministers from the purview of the Lokayukta. However, there is still
a provision of proceeding against any government servant on the basis of a complaint with an
affidavit. The Act authorises investigation of any government servant, encompassing the chief
minister; ministers and all members of the state legislature; any officer of the state
government; the chair, vice-chair, and any person employed by local authorities and
corporations; any registered society or co-operative society; and any university established by
or under any law of the legislature. The cause of the Lokayukta was further strengthened with
the inclusion of the Prevention of Corruption Act in 1988.
The Karnataka Lokayukta has four wings: the police wing to execute traps and raids, the
judiciary wing to manage complaints and reports, technical wing for investigation and
gathering of proof, and the administrative wing for registration of complaints and logistics.
Field visits and inspection
56
Previously, there were no field visits, but now there are regular visits with prior notice given
to district and block offices.
Karnataka Lokayukta visited all the 176 talukas in 27 districts of Karnataka, including visits
to district/taluka hospitals, SC/ST hostels, Anganwadis, remand homes, municipalities,
treasury offices and other taluka and district offices. During the visits every day, 100–180
cases of complaints were received and their grievances addressed through public hearings.
During inspection, the Lokayukta looks at land and buildings, water and electricity,
cleanliness, property encroachment and equipment maintenance. Within human resources,
punctuality, vacancies, absenteeism, alcoholism, performance, for example, non-operating
surgeons and obstetricians and gynecologists, are examined. Additional qualitative inspection
is done on non-clinical services, nursing skills such as bed-making, rational drug use, waste
disposal and mortuary and ambulance services. When corrupt practises are noted, the staff
member concerned is made to return the bribe amount in full and an oral warning is given.
He/she is then monitored by the Administrative Medical Officer, who issues written warnings,
if necessary. In case of repetition of offences, the official is charge sheeted and legal
proceedings are launched against him/her.
Follow up—inspection notes and compliance
As very little systemic supervision and monitoring exist within the present health care system,
empowerment of Administrative
Medical Officers, District Health Officers and other senior staff through capacity building is
done. Skill-building in problemsolving, decision-making, facilitation and capacity building
and the institution of a citizen’s charter are the general measures used for combating
corruption.
In one case, an orthopedician at the Kundapura Taluka Hospital had taken bribes for treatment
and he was made to return the money. In another notable case, a professor of Community
Medicine at a medical college in Bellary took a bribe of Rs 2,500 from 64 students for favours
in an examination. The doctor was made to return the bribe amount to the students after
subsequent investigation. Corruption is also illustrated by the stocking of unlicensed,
imitation drugs throughout Government Medical Stores and in Zilla Panchayats (ZPs) under
the Drugs Procurement and Drugs Control Department. The corruption in the procurement of
57
drugs by ZPs is supposedly much more serious in nature. Is decentralised corruption better
than centralised corruption?
Corruption in drugs control department
Nearly 50 per cent of pharmacies are without a qualified pharmacist.
However, there have been only 14 prosecutions. There was also an incident of HIV positive
blood supply from blood bank which did not lead to any prosecution/action due to corruption.
The absence of quality standards, including those for falsely licensed or manufactured drugs,
is evident, but action is not taken against any of these matters. Many concerns exist regarding
sanctioning of illegal loan licenses and product permissions. Due to a violation of Drug Price
Control Order (DPCO), the people of Karnataka paid nearly 1 billion in excess and various
complaints issued by both the public and by institutions were ignored.
Corruption in procurement of drugs and equipments
Eighteen per cent of the drug procurement budget for Karnataka in 2003 was spent in
procuring the drug Nimesulide, a painkiller which is banned in USA and in many countries in
Europe. Due to this imbalanced and irrational expenditure, Primary Health Centres (PHCs)
were under-stocked or entirely without many essential drugs (such as Paracetamol or Aspirin)
while hospitals were stocked with adequate supply of Nimesulide. It is also a well known fact
that ministers start their own private drug companies and sell drugs at twice the price to the
government itself. A scam involving procurement of IV fluids was executed by bypassing the
public-owned company (Hindustan Antibiotics Limited) and buying from a private company
instead. Decentralised corruption in ZPs was detected in the procurement of forged,
substandard drugs from unlicensed manufacturers at very high prices. Similarly, in the Sigma
scam, forged documents of rate contracts fixed by the Directorate General of Supplies and
Disposal (DGS&D) were produced.
The Director of Medical Education spent Rs 1.1 million on a dialysis machine worth Rs
500,000, while the Karnataka Institute of Medical Science, Hubli bought the same value
machine for Rs 1.2 million. The most notable case was the purchase of equipment for
removing cholesterol which was bought for 6 million with consumables worth 75,000 for
58
each cycle. The equipment was bought for the Bowring Hospital and was used only once.
Often, the interest shown in procurement does not go even till the installation and
procurements are not taken to a logical end. In the case of the Gulbarga ZP X-ray machines
were paid for and bought in 1992, but the purchased machines were not installed till 2004,
reflecting that purchases are not truly need-based but are simply kickbacks.
Epidemic of corruption in health services Corruption has roots in many areas—from
recruitment to transfers to promotions—and is found at all hierarchical levels, from peons to
investigation officers. A typical case of corruption in health services is that of doctors with
their own private practise, pharmacies and blood banks and these same doctors usually refer
patients to their private nursing homes. All these have led to the doubling of market cost for
various health care services, that is, diagnostic or surgical emergency services.
Health sector corruption can be divided in the following ways:
1. Corruption in service delivery by the following: Ayaas ward boys, contract workers,
technicians, administrative staff, nurses, pharmacists, doctors and specialists.
2. Corruption in service delivery for the following services:
admission, issuing medical certificates, laboratory investigations, X-ray, scanning,
transporting patients and referrals, medical and surgical emergencies, emergency services,
elective surgeries, deliveries, blood transfusion and postmortem. Interestingly, corruption
insinuates itself into the natural cycle of life and ironically, the lifecycle approach to
corruption is what is seen in our country today:
it is present at birth, when a relative must pay Rs 200 extra to see the newborn and it is also
present at death, when a bribe must be paid for the postmortem.
3. Various forms of corruption by doctors and paramedical staff: Private practise, nursing
homes (owned by spouses, relatives and business partners), referrals to private hospitals,
owning pharmacies, blood banks, excess of assets over income.
4. Corruption in civil works: Found in construction and repair of PHCs, Community Health
Centres (CHCs), Taluka and district hospitals.
5. Corruption in administration: Found in offices at the level of District Health, Directorate
and Secretariat for reasons related to recruitment and posting in cities/hometowns, promotion
and transfer, leave sanctions, medical reimbursement, monitoring of external private practise,
absenteeism, suspension and reinstatement.
59
6. Corruption in medical education: In sanctioning of new medical, nursing and Indian System
of Medicine and Homeopathy (ISM&H) Colleges, in seat increases for nursing colleges, in
admissions, in examinations, via bribes for undergraduate and post-graduate examiners, and
in recruitment of teaching staff and registration.
Corruption in private sector
In this regard, private hospitals are not very different from the public sector. Many
multinational companies have started giving bribes as a means of acquisition of contracts.
Commissions are given to doctors for prescription of specific tests/drugs. It is also a standard
practice to give ‘cuts’ for prescription of expensive diagnostic investigations like CT scans
and MRIs. In some cases, laboratories run only a few tests and fill in normal values for the
rest based on a code with the prescribing doctor, and collect charges for all the tests.
Extensive organ trading has occurred earlier in Bangalore and more than 1,000 unrelated
kidney transplants bought from the poor people were reported in 1999–2002. Sex selective
abortion is also a serious problem in a few districts of Karnataka.
Reforms in health services after a review of the situation, a few health sector reforms were
developed to reduce corruption. Reforms by the Drug Logistic Society led to improvements in
obtaining essential drugs that made such drugs available in all PHCs and hospitals. Significant
improvements were observed in the number of health staff staying in headquarters through
efficient District Health Officers with leadership qualities. Corruption was reduced in
equipment purchases due to enhanced vigilance.
More reform for good governance of health services has been initiated in a variety of ways,
with a pro-active Lokayukta visiting all the 176 Talukas and institutionalising the reforms.
Vigilance cells within the health department have been developed, while e-governance
initiatives (such as computerisation and web display of transfers, recruitment, policy-based
promotion and purchasing) play a significant role in preventing corruption through
transparency and accountability. In all, I visited over 1,200 PHCs and all the Community
Health Centres (CHCs), Taluka and District Hospitals in Karnataka and not a single medical
officer could tell the budget of his/her institution. Capacity-building in health and hospital
management, leadership, decision-making,

60
and problem solving are very important in improving the systems within our health care
institutions. In addition, initiatives for staff welfare, improved community participation and
monitoring through hospital and health committees, citizen’s charter, report card system and
public grievance redressal are other measures to counter corruption at the grassroots level.
People’s movement for prevention of corruption
The prevention of corruption is however a bottoms-up process, beginning with peoples
movement against corruption. It is common knowledge that corrupt people have better
networks than people with integrity. There is thus a dire need for networking of people with
integrity. In addition, stress on value-based education, awareness of the Right to Information
Bill, Transparency Act and Consumer forums needs to be strengthened. Simultaneously, there
is a need for electoral reforms so that the gains in the grassroots are not lost at the policy
makers level.

61
Chapter 4: Health Management Information Systems
I. Introduction
More generally, this text aims to provide the students with a state-of-the-art managerial
perspective of health information technological systems in the coming years so that they are
well prepared to face the many challenges of acquiring and applying new forms of HCIT for
healthcare services management purposes in this century and beyond. In this first chapter, we
briefly cover the HMIS evolution, its underlying architecture, and its basic functions. We then
close the chapter with a brief survey of the role HMIS technology plays in driving today’s
healthcare and healthcarerelated businesses.
II. Evolution of HMIS
In its broadest sense, HMIS encompasses diverse concepts, methods, and applications from
many related fields. Its genesis may be traced to multiple roots, including general systems
thinking, information economics, management science, information systems development
methodologies, software engineering, computer science and communication theory, medical
computing, health organization behavior, health management, policy, and health services
research.
From a practical viewpoint, the evolution of HMIS over the past several decades has been
largely driven by strategic, tactical, and operational applications of various information
technology (IT) and advanced systems concepts for healthcare services delivery within an
individual, group, and, more appropriately, an organizational perspective. The regional or
even national health coalitions are also on the horizon, enabled by the establishment of
electronic health information exchange infrastructures.
In a world where growing competition for healthcare services delivery is defined by rapidly
changing technology and maturing organizational arrangements, it is critical to understand
how evolving HMIS technologies operate and how HMIS interact within all key aspects of an
organization. In other words, it is important to know how HMIS are developed or procured;
how they are managed and maintained; how their functions are executed to support daily
62
operations and more advanced activities, such as continuous quality improvement programs
and medical research; and finally, how to evaluate their performance and cost-effectiveness.
More importantly, with globalization and the emergence of large-scale computing systems
such as electronic health records (EHR) and innovative business-driven applications such as
enterprise. Enterprise Resource planning (ERP), customer relationship management (CRM),
supply chain management (SCM) systems, and patient-centric applications such as personal
health records (PHR), the resulting landscape for future-oriented HMIS is bound to change
quickly. New advances in HMIS are vital to our society because these technologies guide our
everyday lives; without them, life would be rather difficult. Imagine, for example, while
visiting with your doctor today, you find him or her searching busily through a mountain of
incoherent, unorganized, and piecemeal data about you for all of the different visits that you
may have made to the different clinics that may now be part of a merged health maintenance
organization (HMO), or, what if your doctor has to spend most of his or her time making
clarification phone calls to laboratories and pharmacies to gather information rather than
focusing on diagnosing and treating your illnesses? Imagine also that these data were recorded
using various data-coding schemes by different clinicians with different recording media
(such as paper records, tapes, and film images) and stored in multiple locations. How different
would it be for your doctor to manage you and your information if these data had been
“digitally” captured in standardized formats on nano-chips and could now be easily
recombined, reorganized, and made securely accessible and available to him or her quickly
even before meeting with you?
Indeed, past technologies such as file folders, paper-and-pencil entries, tape recordings, and
X-ray films are both physically limited and very restrictive in terms of keeping secure,
accessible, portable, and available records about you and capturing progressive changes to
your health and wellness status each time you visit with one of your care providers, who may
be practicing in different hospitals and clinics associated with your HMO. These traditional
recording methods are limited because the captured data and information can only be kept
largely in a “physical” form and not easily accessible, transportable, or available “virtually” or
“digitally” to other expert clinicians or even to you, who may decide to travel to another
country seeking a second opinion, or who may have been placed in emergencies outside the
state of your residence. New forms and modes of HMIS technology such as wearable devices
and embedded chips promise to give you the ability to access such recorded information that
63
has been accumulated over the years both conveniently and securely at any time, anywhere. In
the foreseeable future, you will also be able to control and access your own personal health
records stored online and contributed by all of your care providers. As amazing as new
technologies can be, it is important to first understand the type(s) and basic functions of
HMIS technologies that currently exist and how these technologies will likely evolve due to
increased globalization, continuous healthcare reforms, the corporatization of medicine, and
other major trends such as the formation of new alliances and consolidations among
healthcare provider organizations.
Apparently, the emergence of satellite-based, wireless, user-friendly portables; the
proliferation of cellular networks; new computing privacy and security technologies; and new
implementation of various powerful network-based systems such as sensor networks and
Internet-based data warehouses are now in the order of multimillion-dollar projects to serve
large populations with massive capabilities of automated collection, manipulation, and
analysis of multidimensional data sets. These emerging trends are now pressuring senior
healthcare executives and managers to become seriously interested in understanding and
endorsing cost-beneficial, integrative, and innovative HMIS solutions.
III. HMIS Components and Basic Functions
Publicly, as health consumers become more aware, more informed, and better trained in
accessing electronic and social media and as they become more intelligent in evaluating
alternative healthcare services (such as using Leapfrog’s hospital ratings), engaging in online
forums for health information sharing, and participating in physician/hospital referrals among
patients and/or virtual marketing using social network sites, consumers are exerting greater
pressures for a revolution in HMIS technological applications. With the expansion of the
aging baby boomer generation and the accelerating growth in U.S. healthcare expenditures,
we can confidently expect the continuing growth of HMIS applications during the coming
decades to have a significant impact on primary healthcare, pharmaceutical, rehabilitative,
palliative, and home healthcare services. Therefore, management should not and cannot afford
to leave the job of designing, developing, and implementing network-based, integrated HMIS
in the hands of IT experts or commercial vendors alone. Instead, they must now take a
personal interest in paving the way for new generations of HMIS technology—technology
64
that satisfies both organizational requirements and patient needs. As such, the importance of
using an adaptive managerial
perspective in HMIS design and development within an organizational context for the coming
decades cannot be overly emphasized. Let us now turn to an overview of the basic HMIS
components and functions.
HMIS Components
An understanding of the adaptive but integrated HMIS begins with differentiating among its
five major components and their interrelationships:
1. Data/information/knowledge component.
2. Hardware/software/network component.
3. Process/task/system component.
4. Integration/interoperability component.
5. User/administration/management component.
The data/information/knowledge component forms the central core, the content, of all HMIS.
It encompasses the specification of, organization on, and interrelationship among data,
information, and knowledge elements required of integrated HMIS.
Raw data form the basic building blocks for generating useful information that is to be stored
in any HMIS; processed data are transformed into information that serves as useful output for
HMIS end-users to make informed and intelligent decisions. Some pieces of data about your
child may be that of his or her demographics or the medication that he or she is allergic to
(e.g., penicillin). Another example would be his or her childhood vaccination records. Here,
the data would be immunization dates and type. Putting all these data together to form a view
of a child’s immunization schedule derives information. Determining whether the child is due
for a vaccine requires knowledge, specifically, the captured experience and knowledge of the
attending physician, which could further be stored and recorded into existing HMIS and
passed on to another care provider for future care delivery.
The combination of effective data, information, and knowledge resource management
involves designing the critical databases and instituting various intelligent data-mining
algorithms, rule engines, and online analytical processing (OLAP) tools to manage the
increasingly complex and information-intensive care decision situations physicians are facing

65
in this day and age. In other words, organized information and captured experience will, in
turn, yield the essential knowledge and business intelligence for guiding healthcare services
for the individual care provider, a group of care providers managing related health problems,
or an entire health provider organization trying to deliver healthcare services. Figure 9 shows
the conceptual flow of the data/information/knowledge paradigm within the HMIS
organizational and healthcare provider decision-making context.
Ultimately, the HMIS used to support key decision-making functions of healthcare providers
and administrators within the organization must be reformed to achieve greater integration of
data, information, and knowledge across organizational stakeholders. ICA’s newly proposed
A3Align Solution, discussed in the chapter-opening scenario, is an example of how
innovative HMIS applications can better integrate enterprise databases (such as EHR) and
other uncoordinated data systems [such as computerized physician order entry (CPOE) and
clinical decision support systems (CDSS)] and to support integrated healthcare delivery at a
regional level. In an integrated and well-designed HMIS, the goal is to distribute these
informationrelated elements efficiently, effectively, and appropriately throughout the
organization for enriching learning among organizational users and for enhancing the delivery
of healthcare services among care providers.
The next critical component within “information systems,” aside from the “information”
core, is the “technology” layer. Here, the hardware/software/network component features
prominently as it entails the choice deployment of various information and computing-related
technologies to support HMIS applications and use. Briefly, this component involves
configuring various hardware, software, user interface, and communication-enabling
infrastructures, associated devices, and applications in such a way as to best achieve efficient
and effective information services integration throughout while connecting individuals,
groups, and organizations.

66
FIGURE 9. A Data/Information/Knowledge Decision System.
ICA’s A3Align Solution, for example, is an exchange platform created for integrating data
and information from both enterprise and HIT systems. It would be important to ensure that
all connected devices can access the HMIS applications seamlessly; better yet, these devises
can access an adapted version of an application customized to a device platform. In this sense,
for any healthcare organization, the technology layer must be supportive of the people
(internal users), aiding the performance of tasks to be accomplished by these users and
helping them to thrive in the resulting technology-driven environment. Furthermore, new and
emerging HMIS technologies and methods play an increasingly significant role in enhancing
healthcare organizational delivery of patient care–related services. This brings us to the third
basic HMIS component.
The process/task/system component exemplifies the routine and internalized driving engine
for HMIS. Here, our focus should be on the cohesion to be achieved within established
“local” processes, tasks, and applications. In other words, existing administrative-based
HMIS, such as financial information systems, human resources information systems, facility
utilization and scheduling systems, materials management systems, facilities management
systems, and office automation systems, as well as clinical-based HMIS applications such as
EHR, CPOE, and CDSS, must be designed to collect relevant data and accumulate useful
information for organizational task-processing and decision-making activities. It is possible,
too, that over time organizational structural and procedural changes and/or regulatory changes
may require certain different routine processes that have been instituted previously to be
changed or completely deleted, yielding room to new processes, tasks, and applications.
67
Therefore, a systems perspective is critical in order to achieve optimal functionality among
the different task processes and applications.
Surely, the integration/interoperability component is a key determinant of HMIS success from
an enterprise view. Often, the key to positioning today’s healthcare services organizations for
future success is the interoperability of systems used in managing existing and ongoing
healthcare information services vis-à-vis its competitive marketplace environment. The
“interoperability” for much of the computerized information processing within the
organizational framework must be upheld both internally and externally to achieve efficient,
effective, and excellent delivery of healthcare services. This requires not only an elaborate
understanding of evolving technological innovations and changing needs in organizational
task processes, but also knowledge of the market structure and changing characteristics of the
healthcare services industry and how the different current systems should be designed to fit
well with every other HMIS application to achieve an integrated, enterprisewide HMIS.
In fact, as early as 1980, Lincoln and Korpman recognized the difficulties with computer
applications in healthcare services delivery. In their classic paper, “Computers, Healthcare,
and Medical Information Science,” they argued that the goals for medical information
science, although easy to state, are difficult to achieve for several reasons. First, adapting
well-tested information processing procedures and methods from other fields into medicine is
difficult because of the uncertainty and sophistication surrounding the medical context; the
wide spectrum of medical data; and the vagueness, disparity, and variation of organizational
healthcare objectives. Second, this difficulty is further exacerbated by the apparent dissonance
between the often-embedded
HMIS Basic Functions
It is critical that beginning HMIS students achieve a good grasp of the basic functions of an
information system. Historically, all information systems, including HMIS, are built upon the
conceptualization of three fundamental but iterative information-processing phases: data
input, data management, and data output. The data input phase includes data acquisition and
data verification. The data management or processing phase includes data storage, data
classification, data update, and data computation. Finally, the data output phase includes data
retrieval and data presentation. Altogether, these eight elements and three phases define a

68
typical information system as represented schematically in Figure 10. Data acquisition
involves both the generation and the collection of accurate, timely, and relevant data. Data are
the raw materials needing verification, organization, and transformation before they can be
useful information. The process of data generation in HMIS is normally achieved through the
input of standard coded formats (e.g., the use of bar codes), thereby allowing rapid
mechanical reading and capturing of data. The process of data collection differs from that of
data generation in that data can be entered directly at the source (e.g., the use of a point-of-
care bar code scanner), thereby enhancing data timeliness, validity, and integrity. Data
verification involves the authentication and validation of gathered data. It is generally known
that the quality of collected data depends largely on the authority, validity, and reliability of
the data sources. The garbage in garbage out (GIGO) principle is an important factor to
consider in this process; that is, data containing inaccuracies and inconsistencies should be
detected as
FIGURE 10 Basic Functions of a Hcalth Management Information System.
early as possible in the system to allow immediate correction and minimize the eventual costs
of system output errors.
The preserving and archiving of data may be regarded as part of the data storage function.

69
Memory (i.e., a physical storage system) and indexing (i.e., the selection of key words to
determine major subject areas) are primary means of amassing data. When accumulated data
are no longer actively used in the system, a method to archive the data for a certain period is
usually advisable and may sometimes be mandatory, as when it is required by legislation. A
closely related element to data storage is data classification (or data organization). It is a
critical function for increasing the efficiency of the system when the need arises to conduct a
data search.
Moreover, imposing a taxonomy on the data that have been collected and stored provides
greater understanding of how the data can be reused. Most data classification schemes are
based on the use of certain key parameters. For example, data referring to a patient population
may be classified and sorted according to various diagnostic classification schemes, such as
the widely accepted ICD-9-CM, a clinical modification of the original ICD-10 system
developed by the National Center for Health Statistics (NCHS). More recently, the ICD-10-
PCS (the International Classification of Diseases, 10th Procedure Coding System) has
replaced volume 3 of ICD-9-CM.3,4 While ICD-10-PCS is yet to be implemented, awaiting
propagation from the World Health Organization (WHO), such an organized patient data
system is useful for conducting a case-mix analysis because it comprises a set of diagnostic
codes of thousands of patient classifications. Each code has seven alphanumeric characters,
including section, body system, root operation, body part, approach, device, and qualifier.
Indeed, the particular taxonomy employed will have a powerful influence on the way the data
can be subsequently used.
This is because a high degree of semantics is implied in any particular data classification.
Crowe and Avison noted that if the wrong classification is chosen, a great deal of potentially
useful information could be lost.5 This, however, is not a problem that can be easily resolved
due to the lack of standardization among competing taxonomies. System integration and data
interoperability have, therefore, been an enduring challenge for HMIS researchers and
practitioners.
New and changing information is accounted for through the element of data update. The
dynamic nature of such data modification calls for constant monitoring. For HMIS to
maintain current data, mechanisms must be put in place for updating changes in the face of
any ongoing manual or automated transactions. The concept of processing a transaction (i.e.,
70
whenever an event alters the current state of the system) is critical for ensuring data
timeliness.
Such updates can be either online (real-time) or batch processed sequentially. Due to legal and
ethical considerations, archiving and tracking each data update can be a critical requirement in
designing and implementing HMIS. Data computation involves various forms of data
manipulation and data transformation, such as the use of mathematical models, statistical and
probabilistic approaches, linear and nonlinear transformation, and other data analytic
processes.
Computational tasks allow for further data analysis, synthesis, and evaluation so that data can
be used for strategic decision-making purposes other than tactical and/or operational use.
Data retrieval is concerned with the processes of data transfer and data distribution. The data
transfer process is constrained by the time it takes to transmit the required data from the
source to the appropriate end-user. A key problem in data transmission is the existence of
noise (i.e., distortion) that could be both internal and external to HMIS. The data distribution
process ensures that data will be accessible when and where needed. There must also be ways
to ensure that unauthorized users are denied access to sensitive data in the system. This is
normally achieved through the institution of data security and access control mechanisms,
such as the use of firewalls, passwords, user authentication, and other forms of user
identification. One significant criterion to be considered in the data retrieval function is the
economics of producing the needed information. Many early systems (particularly stand-alone
hospital information systems). were far too costly to operate, and the costs were simply not
justified relative to the value of information that was finally produced. This situation has
largely changed with advancing HMIS techniques and technologies available at decreasing
costs.
Finally, data presentation has to do with how users interpret the information produced by
the system. In situations where only operational or even tactical managerial decision making
is expected, summary tables and statistical reports may suffice. However, certain managerial
decision making involves strategic thinking and active collaboration. The use of presentation
graphics for higher-level managerial decision analysis is particularly encouraged because
these appear to provide a better intuitive feel of data trend. Tan and Benbasat6 and Tan7 have
presented a theory to explain and predict the human processing of graphical information,
which is valuable to guide HMIS designers in the matching of presentation graphics to tasks.
71
To illustrate these various HMIS data phases, we can use the case of a computerized patient
health records system for inpatients, which is usually supported with bedside terminals. In this
system, data acquisition comprises the generation and gathering of daily notes on symptoms,
treatments, diagnoses, progress notes, discharge summaries, registration of orders for
laboratory tests, operations, anesthesia, and other sources of information such as patient
demographics and physicians’ findings. The data may also come from other interconnected
HMIS through live or batched data feeds. The data to be coded and automated are usually
formatted into specific and normalized elements, fields, and records.
Figure 11 illustrates an abstract of a patient health record that could be implemented as a
Web-based system for monitoring patient medical conditions and treatments in a healthcare
services organization. As for data verification, the system relies on the ease with which the
coded data may be mechanically processed and properly decoded. In many cases, standard
forms and standard terms are used in recording patient data to ensure data integrity and
consistency.
Most computerized patient record systems have built-in capabilities to reject invalid data
inputs through the use of range checks (e.g., specifying a patient’s age to fall within a
verifiable

72
FIGURE 11 A Sample Abstract for a computerized Patient Medical record System.
range of classification) and other means (e.g., using batched totals). After data input, the data
are kept securely (data storage) in a database, a central data repository. This is to ensure that
the data are accessible to the healthcare services providers on any subsequent visits by the
same patient.
A unique patient identifier and a master patient index (MPI) are used to identify the exact
locations of all related records of a specific patient. This type of data organization also allows
for easy processing and regular updating by care provider organizations.

73
Updating and maintenance of the data (data update) to ensure timeliness and integrity can be
carried out either on a daily basis (i.e., routinely) or interactively (real-time). For example,
some hospitals collate their daily census through batch processing around midnight.
Additional data-processing functions include data analysis and synthesis to transform and
combine various elements of the input data into useful and meaningful information (data
computation). The data retrieval function ensures that the appropriate end-users (e.g.,
physicians, nurses, quality improvement managers, and medical researchers) have access to
accurate, timely, and relevant information from the system. The distribution of information to
end-users typically occurs through Web-based services, where appropriate users can be
authenticated whenever they want to abstract certain views of the stored data or perform
queries. Ultimately, data presentation in the context of the preceding example is concerned
with generating reports that are easy to read and interpret for use in informed patient care or
related decision making.
IV. HMIS Cultures
Why do HMIS cultures matter? A health information system exists as part of a larger system
to support one or more of a combination of administrative, financial, clinical, research, or
managerial activities occurring within a health organization. Yet, it is the culture of the health
services organization that largely determines the appropriate product mix, roll out, and use of
HMIS solutions within the organization. More likely than not, existing and traditional HMIS
applications often tend to be disintegrated so that critical information embedded in the
different parts of the organization is not going to be transparent among employees of the
organization.
In terms of HMIS cultures, based on what we now know about successful and effective
IS/IT (information systems/information technology) leadership, a healthcare services
organization may intentionally or unintentionally adopt and nurture one of four types of
cultures: an information-functional culture, an information-sharing culture, an information-
inquiring culture, and an information-discovery culture.8 Understanding the different
characteristics of each of these cultures is important to guide managers, administrators, and
systems analysts in generating appropriate HMIS solutions for the organization.
An information-functional culture essentially takes the traditional view that information is
74
power and that giving up information means giving up the power of controlling others. It also
follows that as most organizations are structured functionally, information-functional culture
therefore limits the flow of information within a functional area such as human resources,
accounting and finance, sales and marketing, and IT. For example, nurses in an emergency
department of a healthcare services organization adopting an information-functional culture
will attempt to safeguard their own use of patient-gathered information as well as limit the
sharing of patient records as a way of exerting power over nurses in other departments. Thus,
whenever nurses from the acute care units or other departments need to schedule a care
routine of a discharged patient from the emergency department, they would have to involve
the emergency department nurses.
In contrast, an information-sharing culture promotes trust among employees of different
departments within the same organization. While needing to be sensitive as to the privacy,
confidentiality, and security of particular information under his or her safeguard, it is
important that nurses, physicians, and others be able to share certain types of information with
fellow employees for the benefit of the entire organization. For example, the chief medical
officer (CMO) of a hospital who wants to see that his or her direct reports work
collaboratively to benefit the efficient and effective running of the entire hospital must not
only encourage sharing of information among individual physicians, but he or she should also
focus on making information— especially on procedural problems and patient care process
failures—transparent among the individual physicians in the hospital.
An information-inquiring culture essentially makes transparent the core values, beliefs, and
purpose of the organization and ensures that critical information about the due processes,
procedures, and functioning of the organization is easily accessible for all employees
throughout the organization. Employees are also encouraged and trained to actively monitor
such information and to align their daily actions and behaviors with the trends and new
leadership directions of the organization. For instance, all nurses and doctors of a healthcare
provider organization could be asked to greet and politely interact with incoming and
discharged patients to promote its reputation as an organization focused on patient care and
customer satisfaction. All employees are also clear about how conflicts should and can be
resolved quickly and the due procedures for attending to patient complaints.
Finally, an information-discovery culture entails that the organization is able to share insights
freely and encourages its employees to collaborate in offering new products and/or services
75
that meet the needs of existing and new clients. Employees throughout the organization are
also provided with a comprehensive view of how the organization functions and how it will
support them in their attempt to deal with crises and radical changes and/or finding ways to
achieve competitive advantages against its competitors. For healthcare organizations, it is
difficult to imagine the adoption of an information-discovery culture, especially among the
physicians, because of these organizations’ strong traditional roots in which physicians are
accustomed to make their decisions independently about the patients under their care, even
though they are affiliated with the organizations in which they practice.
Understanding HMIS applications begins with having an appreciation of how health
organizations function and how IT is used in these organizations. The complexity of
healthcare organizations and the intricacy of its myriad processes often is the root cause of IT
failures in health care. Many health executives thought that slapping a complex HMIS on top
of the problems encountered in a healthcare organization would resolve its woes when, in
many cases, it not only worsens it, but adds unnecessary expenses when the root causes of
these problems are not well understood. It is far more important to map out the processes,
simplify the complexity, consolidate the needs, and identify the core IT requirements. From
here, management has to nurture, cultivate, and respect the working of the HMIS culture and
implement appropriate, HMIS solutions accordingly.
76
Chapter 4: Hospital Services and Efficiency
1 Introduction
In debates about the economic problems of health care, the hospital plays a key role.
This is due to the quantitative importance of the hospital industry. In many industrialized
countries, hospital services account for the largest single block of health care expenditure. In
2005, most OECD countries spend more than a third of health care expenditure on hospital
services.
Not the amount of health care expenditure is of primary interest to economists but the rules
that determine the allocation of resources.
Here, one feature of the hospital sector deserves particular attention: to a large extent hospitals
are non-profit institutions. Therefore, hospitals may not be interested in operating in a cost-
efficient manner. From the point of view of a regulatory agency whose objective is to control
hospital efficiency, this creates the need to gather and evaluate information on the production
process of hospitals. Since the production function of a hospital is not known, the standard
approach is to compare hospitals in a benchmarking study. Several methods have been
proposed to conduct such studies. With the estimation of a hospital cost function and Data
Envelopment Analysis (DEA), we present both a parametric and a nonparametric method for
comparing the efficiency of hospitals.
To determine the efficiency of a hospital, the inputs and outputs need to be defined and
measured. Inputs comprise the use of productive resources such as human labor, energy and
raw materials – inputs that are usually straightforward to define and measure. The definition
of hospital output, though, is far from self-evident. In particular, it is difficult to state what
exactly a hospital is supposed to produce. And once output has been defined, the problem of
measurement is not trivial.
77
2 The Hospital as a Productive Unit
2.1 Hospital Output: Health as a Latent Variable
In order to measure hospital output, it is not enough to describe the tasks that are carried out
(surgery, radiotherapy, medication, wound dressing, and accommodation, to name a few) or
bundles of tasks such as medical, nursing or hotel services. All of these tasks are only a means
to an end. One gets closer to true output by asking the question of what the patients (or
referring physicians acting on their behalf) want, what they expect from hospitalization, and
what taxpayers expect to obtain in return for their contribution to the financing of the hospital.
In the majority of cases, expectations are in terms of a positive contribution to the patient’s
state of health, that is, the curing of disease (or control of its development) and the alleviation
of pain. Even though there is little disagreement with regard to these objectives, the degree of
their realization nevertheless may hardly serve as a basis for the payment of hospital services.
The difficulties lie with the measurement as well as the imputation of outputs to services
performed.
In order to measure the extent of recovery of patients, their state of health would have to be
evaluated not only at the beginning and at the end of hospital treatment but frequently years
after the stay, using objective criteria. This is – except for obvious indicators such as survival
and complication rates – a fairly hopeless undertaking because health is not only multi-
dimensional but also contains a considerable subjective component. Even if this difficulty is
surmounted, one should not simply tie payment for hospital services to the measured change
in the state of health achieved during the period of hospitalization. For the relevant benchmark
for assessing hospital performance is not the patient’s actual state before admission, but the
(hypothetical) state that would have been realized without hospital treatment at the end of the
observation period. The importance of this distinction becomes very clear in cases where
hospital treatment can only slow down the progressive course of an incurable disease.
However, the extent of ‘deterioration averted’ usually defies measurement.
Patients hold expectations not only with regard to the final state of their health after hospital
treatment but also with regard to their physical and mental well-being during hospitalization
(to the extent that the disease will permit), as life goes on in the hospital. This aspect takes on
special significance if the disease itself can no longer be fought and only suffering can be
alleviated, that is, when dealing with incurable and terminally ill patients. Objective and
78
reliable measurement of subjective wellbeing during hospitalization, however, is just as
difficult as measuring the influence of hospitalization on the patient’s health status.
Finally, the customers of a hospital not just cover people that will actually be treated as
patients, but the whole population of its catchment area. The mere existence of a hospital
provides people with the security that in case of accident or serious illness inpatient treatment
will be available. This so called ‘option demand’ is satisfied by hospital beds held on reserve,
along with the necessary staff and equipment.
2.2 The Multi-Stage Character of Production in the Hospital
As the final outcome of hospital activity (particularly the improvement of a patient’s health
status) can only be measured imperfectly, observable quantities suitable to serve as output
indicators have to be identified for obtaining an operational definition of the term, ‘efficient
use of resources’. In the present context, it seems appropriate to list various indicators of
hospital activity and to classify them according to the stage of production, using a scheme that
may help to describe hospital activity from an economic perspective.
The indicators most commonly used are:
• Quantities of factors of production (hours worked by physicians, by the nursing staff and by
other employees, drugs and dressings, electricity, fuel etc.);
• Quantities of individual medical and nursing services performed (examinations, operations,
medications, injections, physical therapies, temperature measurements, meals etc.);
• The number of patients or cases treated, possibly differentiated according to various types of
diseases; • The number of patient days, possibly differentiated according to intensity of care.
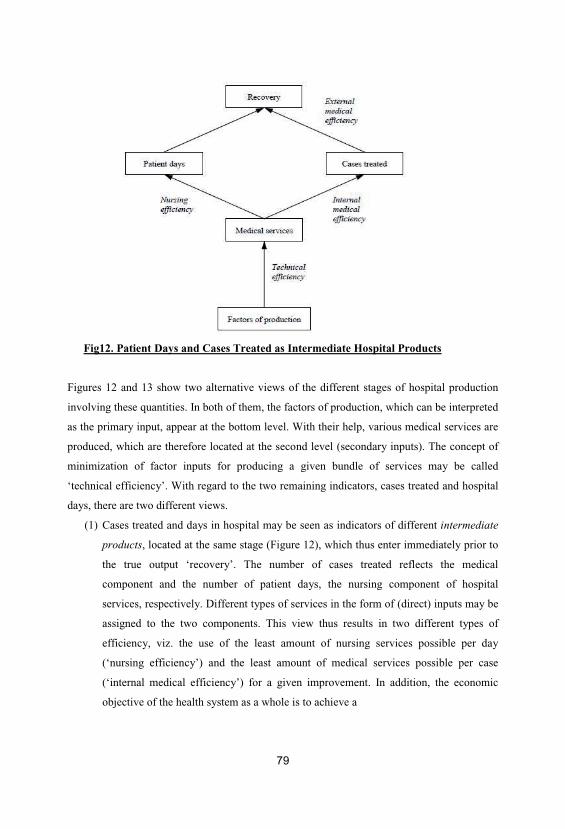
79
Fig12. Patient Days and Cases Treated as Intermediate Hospital Products
Figures 12 and 13 show two alternative views of the different stages of hospital production
involving these quantities. In both of them, the factors of production, which can be interpreted
as the primary input, appear at the bottom level. With their help, various medical services are
produced, which are therefore located at the second level (secondary inputs). The concept of
minimization of factor inputs for producing a given bundle of services may be called
‘technical efficiency’. With regard to the two remaining indicators, cases treated and hospital
days, there are two different views.
(1) Cases treated and days in hospital may be seen as indicators of different intermediate
products, located at the same stage (Figure 12), which thus enter immediately prior to
the true output ‘recovery’. The number of cases treated reflects the medical
component and the number of patient days, the nursing component of hospital
services, respectively. Different types of services in the form of (direct) inputs may be
assigned to the two components. This view thus results in two different types of
efficiency, viz. the use of the least amount of nursing services possible per day
(‘nursing efficiency’) and the least amount of medical services possible per case
(‘internal medical efficiency’) for a given improvement. In addition, the economic
objective of the health system as a whole is to achieve a
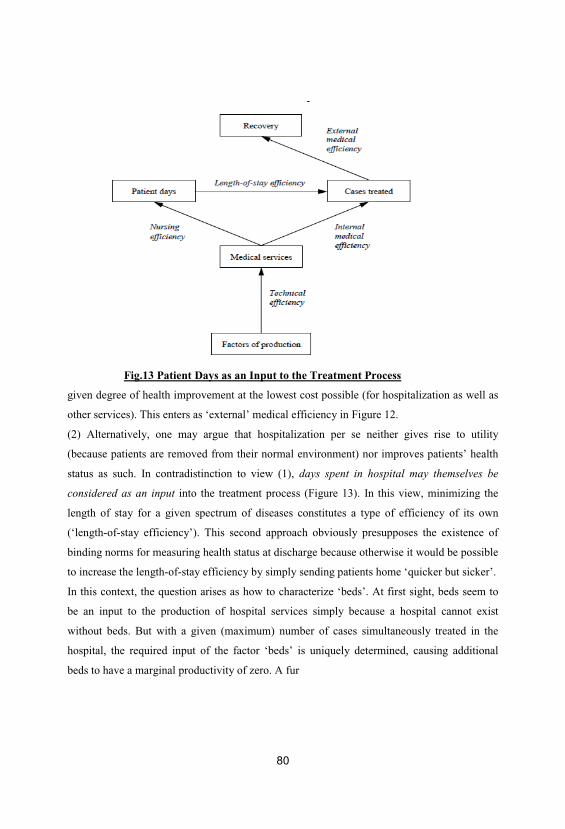
80
Fig.13 Patient Days as an Input to the Treatment Process
given degree of health improvement at the lowest cost possible (for hospitalization as well as
other services). This enters as ‘external’ medical efficiency in Figure 12.
(2) Alternatively, one may argue that hospitalization per se neither gives rise to utility
(because patients are removed from their normal environment) nor improves patients’ health
status as such. In contradistinction to view (1), days spent in hospital may themselves be
considered as an input into the treatment process (Figure 13). In this view, minimizing the
length of stay for a given spectrum of diseases constitutes a type of efficiency of its own
(‘length-of-stay efficiency’). This second approach obviously presupposes the existence of
binding norms for measuring health status at discharge because otherwise it would be possible
to increase the length-of-stay efficiency by simply sending patients home ‘quicker but sicker’.
In this context, the question arises as how to characterize ‘beds’. At first sight, beds seem to
be an input to the production of hospital services simply because a hospital cannot exist
without beds. But with a given (maximum) number of cases simultaneously treated in the
hospital, the required input of the factor ‘beds’ is uniquely determined, causing additional
beds to have a marginal productivity of zero. A fur
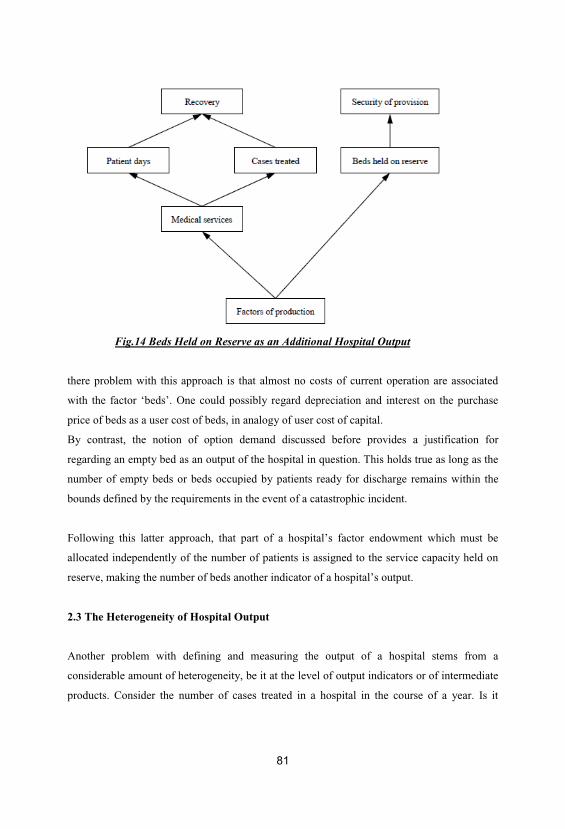
81
Fig.14 Beds Held on Reserve as an Additional Hospital Output
there problem with this approach is that almost no costs of current operation are associated
with the factor ‘beds’. One could possibly regard depreciation and interest on the purchase
price of beds as a user cost of beds, in analogy of user cost of capital.
By contrast, the notion of option demand discussed before provides a justification for
regarding an empty bed as an output of the hospital in question. This holds true as long as the
number of empty beds or beds occupied by patients ready for discharge remains within the
bounds defined by the requirements in the event of a catastrophic incident.
Following this latter approach, that part of a hospital’s factor endowment which must be
allocated independently of the number of patients is assigned to the service capacity held on
reserve, making the number of beds another indicator of a hospital’s output.
2.3 The Heterogeneity of Hospital Output
Another problem with defining and measuring the output of a hospital stems from a
considerable amount of heterogeneity, be it at the level of output indicators or of intermediate
products. Consider the number of cases treated in a hospital in the course of a year. Is it

82
possible to describe adequately a hospital’s output simply by counting the number of cases? Is
it appropriate to say that a hospital that treats 1,000 cases achieves more than the one that
treats 995? Obviously, the 1,000 cases of the first hospital might consist of 500 minor
fractures and 500 uncomplicated tonsillectomies whereas the second hospital might be a heart
unit specializing in transplantations.
One must therefore take into consideration that the ‘case treated’ does not constitute a
homogeneous quantity but a mental construct that needs to be specified through its
characteristics. This means that a treatment case must be differentiated along various
dimensions, for example:
• The type of illness that has called for hospital treatment (principal diagnosis);
• The severity of the illness and complications arising during treatment;
• The stage of the disease (e.g., in the case of cancer);
• Concomitant diseases (secondary diagnosis);
• Patient characteristics reflecting her or his contribution to the ‘production of recovery’,
such as age and possibly sex.
In view of these distinctions, to which still more could be added, a purist must come to the
conclusion that heterogeneity of case mix can only adequately be taken into account by
considering each patient as an output category of her or his own.
Following this principle, however, one would forego the possibility of comparing the output
vectors of two or more hospitals. This would put an end to the economic analysis of the
hospital in the quest of, for example, measuring the degree of efficiency or determining a
performance-based payment system.
A reasonable compromise between the rigorous approach just outlined and the total
abandonment of case differentiation may be achieved by dividing patients into a manageable
number of groups, using the distinguishing characteristics mentioned above. This division is
known as patient classification and purports to form a manageable number of patient groups
that are as homogeneous as possible. Moreover, assignment to a group should be unique and
reproducible using objective criteria.
Obviously, there is a conflict between the criteria ‘manageable number’ and ‘greatest possible
homogeneity within each group’ which can only be resolved by weighing the relative
disadvantages caused by their violation.
9 Hospital Services and Efficiency The three most common patient classification systems are:
83
(1) The International Classification of Diseases (ICD), originally developed as a basis for
mortality statistics and thus solely referring to (principal) diagnoses. In its three-digit version,
the ICD consists of more than 900 groups, while aggregation to the level of 110 main groups
is already very coarse. For instance, all benign neoplasm’s form one single group in this
categorization.
(2) Diagnosis Related Groups (DRGs), developed at Yale University in the 1970s with the
explicit objective to create relatively cost-homogeneous groups. Besides the principal
diagnosis, DRGs take into account the existence of concomitant disease and complications,
the age of the patient, and the type of treatment (surgical or conservative), getting by with
approximately 500 groups [see FETTER ET AL. (1980) and HEALTH CARE FINANCING
ADMINISTRATION (1983)].
(3) Patient Management Categories (PMCs), also developed in the United States (Pittsburgh)
and consisting of a total of 840 groups. Compared to DRGs, PMCs put greater emphasis on
concomitant diseases as well as the treatment strategies chosen by the hospital [see, e.g.,
YOUNG (1991)].
3 Comparing Hospital Efficiency
3.1 Regulation and Asymmetric Information
In a competitive market, there is no reason to measure the efficiency of firms. Only efficient
firms make sufficient profits to cover their costs. The market for hospital services is different.
Even though competition has been introduced in the hospital sector in a number of countries
(e.g., the United States, Germany, the Netherlands, and Switzerland), hospitals continue to be
subsidized by tax-payers undermining the incentives for efficiency. In addition, market entry
is difficult because of public regulation (such as participation in the supply emergency
services and capacity limitation schemes) and political opposition of public hospitals, who
want to avoid competition.
Conversely, market exit is frequently a highly unpopular political decision, in particular for
public hospitals. For the majority of hospitals, their economic environment therefore cannot
be expected to create incentives for efficiency.

84
An alternative approach to ensure the efficiency of hospitals is regulation. A regulatory
agency that is fully informed about a hospital’s technology and efforts to control costs could
easily achieve this objective. But providers typically have an information advantage.
Asymmetric information can exist both with respect to efforts to control cost (‘hidden action’)
and with respect to the technology used (‘hidden information’). The ‘new economics of
regulation’ which applies the principal-agent methodology to the contractual relationship
between regulators and regulated firms [see LAFFONT AND TIROLE (1993)] has shown
how the presence of asymmetric information prevents regulators from implementing an
efficient (‘first-best’) solution since efficient providers have both incentives and possibilities
to imitate inefficient providers in order to get a favorable deal, allowing them to gain an
information rent.
Faced with this problem, regulators have two options.
(1) They can design contracts to obtain a second-best solution, striking a compromise between
the reduction of the information rent and incentives for providers to control costs. We present
this approach in Section 10.2.3.
(2) The regulatory agency can try to alleviate the information asymmetry which would limit
the hospitals’ possibilities to obtain information rents. In particular, information about the
efficiency of a hospital can be gained by comparing it to other hospitals. Economists have
developed two basic methods to conduct such a comparison. In Section 9.3.2 we present the
parametric approach, which is based on the estimation of a hospital cost function. Section
9.3.3 is devoted to the most popular nonparametric approach called ‘Data Envelopment
Analysis’ (DEA).
3.2 Hospital Cost Functions
Considering the hospital as a productive unit suggests the application of elementary concepts
of production theory to hospitals. One of the core concepts of production theory, which has
great empirical relevance, is the cost function. It assigns minimal costs of production to each
output bundle and contains the same information as the production function. The quantities on
the right-hand side of the cost function are factor prices and output quantities. These variables
– and in the case of a short-term cost function, the amount of fixed factors – may be
85
considered exogenous, provided perfect competition prevails in the factor markets. This
makes the cost function more easily amenable to econometric estimation than the production
function which depends on input quantities. As these are chosen by the firm, they cannot be
considered as exogenous.
The empirical estimation of cost functions is helpful for answering a number of important
economic questions:
(1) From the shape of the cost function, one may recognize economies or diseconomies of
scale, which are important for determining the optimal size of the unit. Optimal size is of
relevance to policy because in some countries the hospital industry is subject to public
regulation which prevents hospitals from freely choosing their number of beds.
(2) Differentiation of the cost function with respect to the number of patients of a given
category yields the marginal costs of treatment of this patient type. This information is useful
for calculating prices in the context of performance-based payment.
(3) Residuals of an estimated cost function are the difference between a hospital’s actual and
estimated cost. From their size, one may hope to derive statements about their relative
efficiency. This may facilitate the monitoring of hospital performance under cost-based
payment. These possibilities will be further explored below.
Following BAUMOL ET AL. (1982), a cost function should satisfy the following
requirements:
• As predicted by microeconomic theory, the cost function should be continuous, linear-
homogeneous, non-decreasing, and concave in prices [see VARIAN (1992, p. 72)].
• In the multi-output case, the cost function should allow for zero values for some outputs lest
all hospitals failing to produce all outputs must be dropped from the sample. This may lead to
a sample selection problem. In addition, it would not be possible to derive results about
economies of scope.
• The cost function should be sufficiently flexible. For example, it should allow for different
degrees of economies of scale and scope. Such a flexible cost function is the translog cost
function [CHRISTENSEN ET AL. (1973)] which is a second order Taylor-approximation of
an arbitrary cost function.
Most importantly, the estimation of a microeconomic cost function proceeds on the
assumption that the hospitals included in the sample all aim to minimize costs and that
deviations from this target have the same property as an error term. This assumption is hardly

86
sustainable for hospitals due to the predominance of government and community ownership,
since the absence of the profit motive serves to diminish the pressure to minimize costs.
To deal with the problem of non-cost-minimizing firms, stochastic frontier estimation has
been developed. This approach specifies the estimation equation for total hospital cost as
( , ) ,i i i i iC C Y W V U= + + (9.1)
where Ci denotes total cost of hospital i, Yi a vector of output quantities, Wi a vector of input
prices, Vi a normally distributed error term which measures statistical noise such as
measurement error in the cost variable, and Ui a positive term which measures ‘errors’ in
decision making which result in inefficiency and thus higher than minimum costs. To estimate
equation (9.1), an assumption must be made concerning the distribution of the positive error
term (such as half-normal, truncated normal or exponential) so that the equation can be
estimated using maximum likelihood methods.
In a second step, the inefficiency measures retrieved from this estimation can be regressed
against various characteristics of the hospital and its market such as ownership type, teaching
status, and the number of competing hospitals within its catchment area, to explore sources of
hospital inefficiency.
In estimating a cost function such as (9.1), a number of econometric issues have to be
addressed:
(1) Choosing total cost as the dependent variable leads to heteroske causticity, if the error
term is positively correlated with the output variable. Furthermore, the regression can suffer
from multicollinearity among the output variables if these vary directly with hospital size. To
avoid these problems, both sides of the equation can be divided by an appropriate output
measure, making average cost the dependent variable. But this makes the output variable
appear on both sides of the equation so that the estimation may be biased. Also, when
hospitals are considered as multi-product firms, it is unclear which output category should be
used.
(2) An appropriate functional form must be chosen for the function (·). Candidates are the
translog or the homothetic form, which are both flexible functional forms.
A disadvantage of the translog function is that it does not allow for zero output and thus can
only be used with broad output categories.

87
(3) Hospitals aremulti-product firms with several hundreds of different outputs even if
patients are only classified by diagnosis-related groups. Especially with flexible functional
forms the number of repressors (which is on the order of n2 when there are n outputs) can
easily exceed the number of observations. Thus in past applications, the available output
information was usually condensed into a small number of output categories such as the
number of cases in the various hospital departments or just the number of inpatient and
outpatient cases. In the latter case, often a scalar case-mix index (such as the average DRG
weight) is added to control for output severity.
(4) A further problem is the availability of information on factor prices which ideally should
be used in the estimation of a cost function. In the health care sector, this information is
frequently difficult to obtain.
HOLLINGSWORTH (2003) provides a comprehensive overview of stochastic frontier studies
which attempted to measure efficiency in hospitals or other health services. Estimated mean
inefficiency scores differ widely from 13 percent in some studies to 28 percent and more in
others. These results cast doubt on whether estimated positive error terms can really be
interpreted as measures of ‘inefficiency’. In particular, as very few studies have good
measures for output quality (case severity within a diagnostic group), there is the danger of
interpreting cost differences due to higher quality as inefficiencies. The same qualification
applies to the cost of holding spare capacity (empty hospital beds). These can be interpreted
as sheer waste unless the spare capacity is provided to meet stochastic demand in cases of
emergency. Therefore, NEWHOUSE (1994) explicitly warns against basing hospital payment
on average cost estimates from stochastic frontier studies. However, HADLEY AND
ZUCKERMANN (1994) argue that the studies may at least be used to identify the 10 to 25
percent least efficient hospitals in order to exclude their cost values from the calculation of
payment rates.
3.3 Data Envelopment Analysis
3.1 Introduction
An alternative approach to measure the efficiency of a production process is nonparametric,
with Data Envelopment Analysis (DEA) constituting the most widely used approach (Free
Disposable Hull Analysis is one of the alternatives). The DEA method was developed by
CHARNES ET AL. (1978) and neither assumes cost minimizing behavior nor knowledge
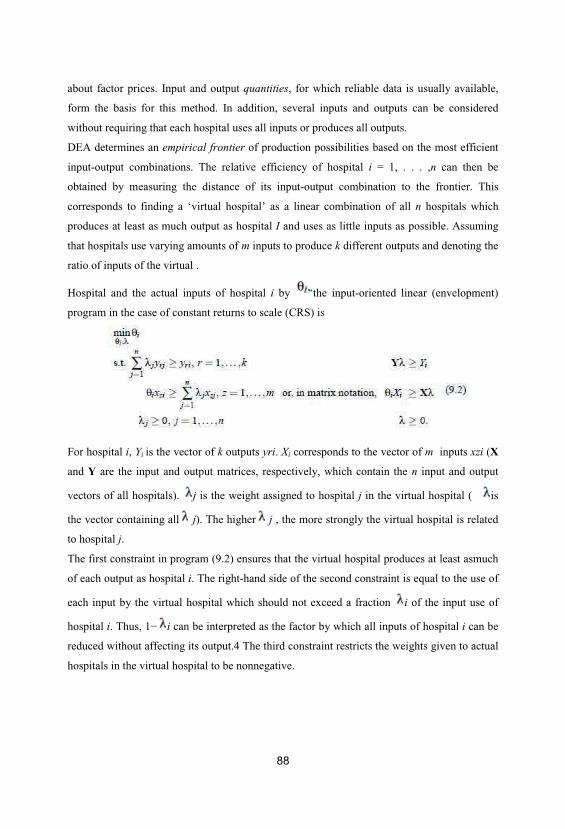
about factor prices. Input and output quantities, for which reliable data is usually available,
form the basis for this method. In addition, several inputs and outputs can be considered
without requiring that each hospital uses all inputs or produces all outputs.
DEA determines an empirical frontier of production possibilities based on the most efficient
input-output combinations. The relative efficiency of hospital i = 1, . . . ,n can then be
obtained by measuring the distance of its input-output combination to the frontier. This
corresponds to finding a ‘virtual hospital’ as a linear combination of all n hospitals which
produces at least as much output as hospital I and uses as little inputs as possible. Assuming
that hospitals use varying amounts of m inputs to produce k different outputs and denoting the
ratio of inputs of the virtual .
Hospital and the actual inputs of hospital i by the input-oriented linear (envelopment)
program in the case of constant returns to scale (CRS) is
For hospital i, Yi is the vector of k outputs yri. Xi corresponds to the vector of m inputs xzi (X
and Y are the input and output matrices, respectively, which contain the n input and output
vectors of all hospitals). j is the weight assigned to hospital j in the virtual hospital (� is
the vector containing all j). The higher j , the more strongly the virtual hospital is related
to hospital j.
The first constraint in program (9.2) ensures that the virtual hospital produces at least asmuch
of each output as hospital i. The right-hand side of the second constraint is equal to the use of
each input by the virtual hospital which should not exceed a fraction i of the input use of
hospital i. Thus, 1− i can be interpreted as the factor by which all inputs of hospital i can be
reduced without affecting its output.4 The third constraint restricts the weights given to actual
hospitals in the virtual hospital to be nonnegative.

Problem (9.2) requires that i and all j are chosen such that the virtual hospital uses the
smallest fraction �i possible of the inputs of hospital i. If hospital i is efficient, the solution is
* *1, 0i j iλ λ ≠= = and * 1iθ = since it is not possible to use less inputs for a given output.
For an inefficient hospital, owever, we obtain. * 1iθ In this case, it is possible to construct
a virtual hospital which only uses *i iX iθ inputs to produce the same output as hospital i.
Figure 15 illustrates the DEA approach. Five hospitals are shown which produce the same
output with two inputs. The efficient frontier is defined by observations 1 to 4. The optimal
solution of program (9.2) is therefore * 1, 1, ..., 4 .i iθ = = the shaded area shows the
technology set, i.e., the set of all permissible input-output combinations. Observation 5 is
obviously inefficient since it is possible to produce the same output with lessinputs.
DEA yields * *2 31.3, 0.7λ λ= = and *
5 0.5, . .,i eθ = a linear combination of hospitals 3 (30
percent) and hospital 5 (70 percent) leads to the same output using only 50 percent of inputs.
The efficient combination of inputs is given by point 5’. DEA can also take into account
variable returns to scale (VRS) if one imposes the additional constraint 1.i iλ = [see
BANKER ET AL. (1984)]. This permits to test for scale efficiency. Figure 16 illustrates the
procedure for the case of one input and one .
Fig.15 The DEA Approach
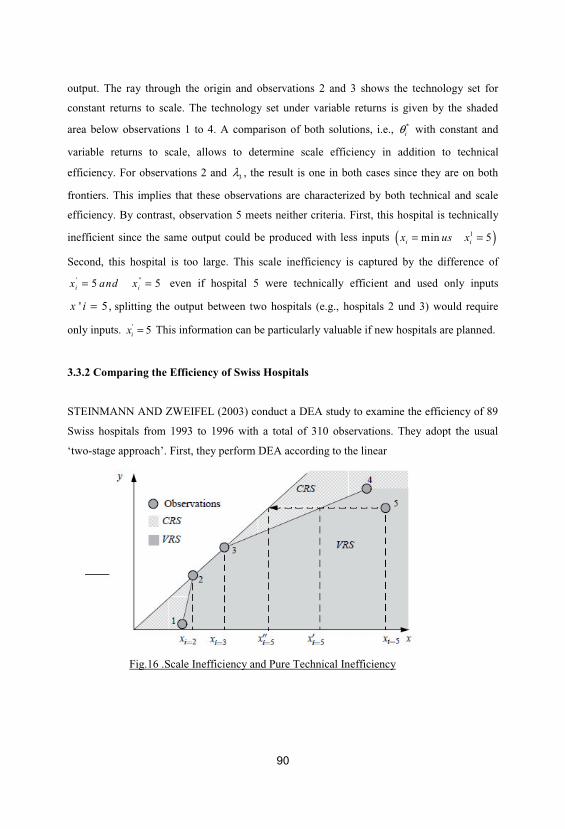
90
output. The ray through the origin and observations 2 and 3 shows the technology set for
constant returns to scale. The technology set under variable returns is given by the shaded
area below observations 1 to 4. A comparison of both solutions, i.e., *iθ with constant and
variable returns to scale, allows to determine scale efficiency in addition to technical
efficiency. For observations 2 and 3λ , the result is one in both cases since they are on both
frontiers. This implies that these observations are characterized by both technical and scale
efficiency. By contrast, observation 5 meets neither criteria. First, this hospital is technically
inefficient since the same output could be produced with less inputs ( )1min 5i ix us x= =
Second, this hospital is too large. This scale inefficiency is captured by the difference of
' "5 5i ix and x= = even if hospital 5 were technically efficient and used only inputs
' 5 ,x i = splitting the output between two hospitals (e.g., hospitals 2 und 3) would require
only inputs. ' 5ix = This information can be particularly valuable if new hospitals are planned.
3.3.2 Comparing the Efficiency of Swiss Hospitals
STEINMANN AND ZWEIFEL (2003) conduct a DEA study to examine the efficiency of 89
Swiss hospitals from 1993 to 1996 with a total of 310 observations. They adopt the usual
‘two-stage approach’. First, they perform DEA according to the linear
Fig.16 .Scale Inefficiency and Pure Technical Inefficiency

91
program (9.2). Second, they analyze the determinants of efficiency with a random effects
regression.
The study distinguishes three different categories of labor as inputs (medical, nursing, and
administrative staff). Furthermore, non-labor expenses (at prices of 1990) and patient days are
classified as inputs (see Section 9.2.2). On the output side, only in-patient services were
considered even though hospitals in cities also provide some out-patient services. Five
categories were used to capture the outputs of hospitals: medical, pediatric, surgical,
gynecological, and intensive care discharges.
DEA implicitly assigns shadow prices to inputs and outputs (in Figure 15 the slope of the
isoquant correspond to the shadow price ratio). Although the exact prices for inputs and
outputs in the Swiss hospital sector are not known, it makes sense to restrict the ratio of
shadow prices to reasonable values. This implies that only observations which operate under
realistic shadow price ratios turn out to be efficient whereas observations with unrealistic
shadow price ratios appear inefficient. The study therefore restricted all marginal rates of
substitution and transformation. Marginal
Productivities, however, were not restricted. Furthermore, the analysis allowed for variable
returns to scale.
DEA classifies 34 out of 310 observations as efficient. These 34 efficient observations are
from 11 hospitals. Table 6 shows the distribution according to the type of hospital. Overall,
efficient units occur among the largest and smallest hospitals in terms of beds. On the other
hand, the category 249–499 beds does not contain a single efficient observation. This suggests
constant returns to scale over a wide range, at least for the five specified outputs. Globally,
increasing returns to scale are possible.
Compared to parametric methods, DEA does not directly consider the different conditions
under which hospitals operate. A hospital classified as efficient (inefficient)
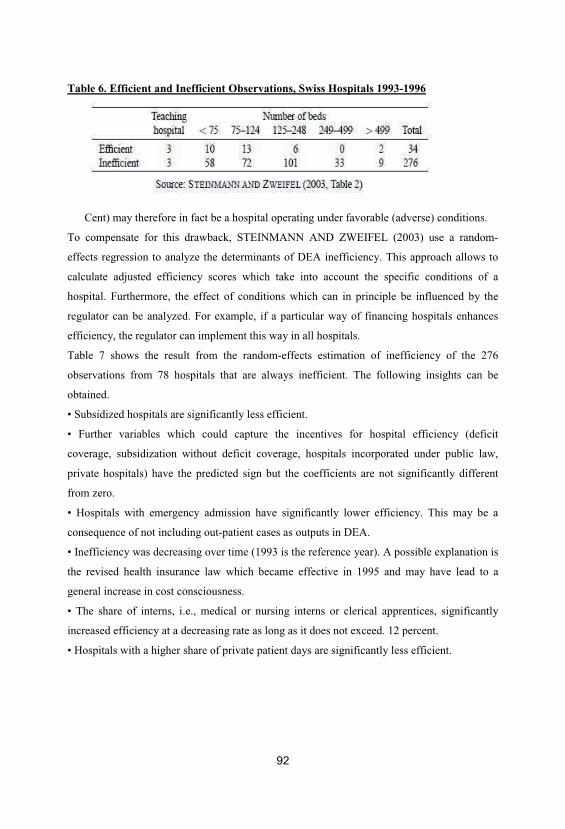
92
Table 6. Efficient and Inefficient Observations, Swiss Hospitals 1993-1996
Cent) may therefore in fact be a hospital operating under favorable (adverse) conditions.
To compensate for this drawback, STEINMANN AND ZWEIFEL (2003) use a random-
effects regression to analyze the determinants of DEA inefficiency. This approach allows to
calculate adjusted efficiency scores which take into account the specific conditions of a
hospital. Furthermore, the effect of conditions which can in principle be influenced by the
regulator can be analyzed. For example, if a particular way of financing hospitals enhances
efficiency, the regulator can implement this way in all hospitals.
Table 7 shows the result from the random-effects estimation of inefficiency of the 276
observations from 78 hospitals that are always inefficient. The following insights can be
obtained.
• Subsidized hospitals are significantly less efficient.
• Further variables which could capture the incentives for hospital efficiency (deficit
coverage, subsidization without deficit coverage, hospitals incorporated under public law,
private hospitals) have the predicted sign but the coefficients are not significantly different
from zero.
• Hospitals with emergency admission have significantly lower efficiency. This may be a
consequence of not including out-patient cases as outputs in DEA.
• Inefficiency was decreasing over time (1993 is the reference year). A possible explanation is
the revised health insurance law which became effective in 1995 and may have lead to a
general increase in cost consciousness.
• The share of interns, i.e., medical or nursing interns or clerical apprentices, significantly
increased efficiency at a decreasing rate as long as it does not exceed. 12 percent.
• Hospitals with a higher share of private patient days are significantly less efficient.
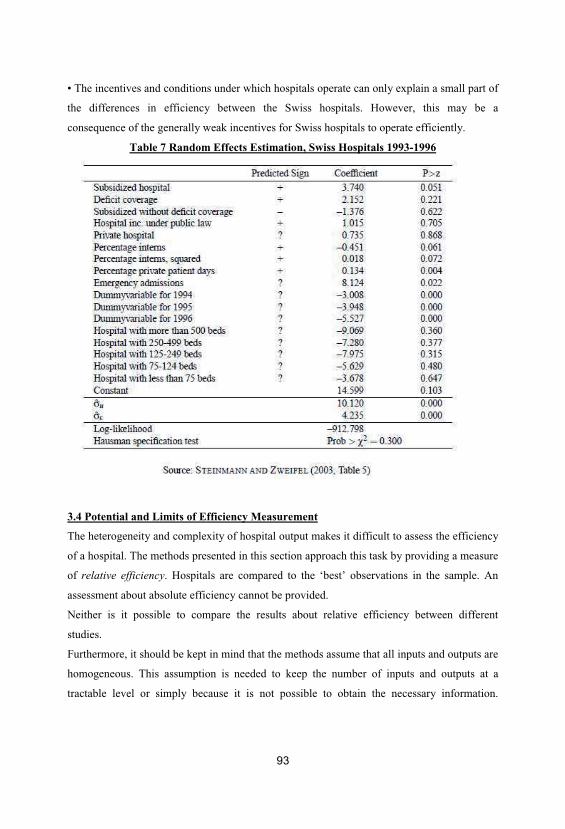
93
• The incentives and conditions under which hospitals operate can only explain a small part of
the differences in efficiency between the Swiss hospitals. However, this may be a
consequence of the generally weak incentives for Swiss hospitals to operate efficiently.
Table 7 Random Effects Estimation, Swiss Hospitals 1993-1996
3.4 Potential and Limits of Efficiency Measurement
The heterogeneity and complexity of hospital output makes it difficult to assess the efficiency
of a hospital. The methods presented in this section approach this task by providing a measure
of relative efficiency. Hospitals are compared to the ‘best’ observations in the sample. An
assessment about absolute efficiency cannot be provided.
Neither is it possible to compare the results about relative efficiency between different
studies.
Furthermore, it should be kept in mind that the methods assume that all inputs and outputs are
homogeneous. This assumption is needed to keep the number of inputs and outputs at a
tractable level or simply because it is not possible to obtain the necessary information.

94
Finally, it should be noted that the results about relative efficiency pertain to a specific period
of time. For a regulatory agency it is also of interest how efficiency changes over time. For
instance, innovations may bring about an increase in inefficiency in the short run but enhance
efficiency in the long run.
Nevertheless, it needs to be emphasized that the methods presented here provide valuable
information about the efficiency of hospitals. In any case, for a hospital which is classified as
inefficient it should be checked in detail whether any of the aforementioned limitations
applies or if it produces its output inefficiently as predicted by the study.
95
Chapter 5: Productivity analysis in health care
1. Introduction
Productivity analysis of health care systems, services and providers increasingly is being
conducted and applied by economists and other researchers around the world. Yet
application of these results by governments, health plans and individual provider groups has
been patchy and inconsistent. Much of the reason for this has been the growth of technical
methods from the management science and econometrics literature that has not always paid
attention to the needs and context of decision-makers.
A number of critical factors have created this difficulty. But most importantly, the
fundamental nature of health care services as multi-product goods, even to the extreme
conception of the treatment of each patient as a unique individual product, creates analytical
complications that have been dealt with inconsistently in the literature.
Nevertheless, this inconsistency could be seen as desirable for policy application, applied
correctly and intelligently, since the context of the decision-maker needs to be accounted for
in choosing methods and levels of aggregation of heterogeneous products and their inputs.
The desirable result would be that methods chosen optimally to match research questions
would differ from one-size-fits-all solutions. The potential for severe aggregation bias and
other measurement error problems also exists in all types of health productivity studies.
The analytical foundations of production economics, applied to health, are the focus of this
chapter, as opposed to the more general performance measures discussed in the chapters by
Smith and Street (30) and Propper and Wilson (31) in this Companion.
Production technology for outputs y producing inputs x is represented by input set

96
as in Lovell (1993). This structure can best be described in terms of distance functions, the
multidimensional distance from any productive activity to the boundary of production
possibilities. Then the tools of duality theory can be used to generate production, cost,
revenue and profit frontiers which can be estimated in applications (Kumbhakar and Lovell,
2000).
Productivity analysis in health care builds up from specialized conceptual definitions of
allocative, economic and technical efficiency from economic theory. In particular, allocative
efficiency in health care tends to be assessed most often on a micro-level via economic
evaluations of health care interventions and programmes that are considered in the final part
of this Companion. Technical efficiency in health care at the level of country performance
has been defined as catching up to what can be done under current technology while
technological change or shifts in the attainable technology encompass both process
innovation and product innovation (Färe et al., 1997). That same conceptualization
frequently is applied at other levels of health services production. Economic efficiency
depends on the value or cost of inputs once technical efficiency is attained. Such analysis is
complicated by the frequent lack of competitively determined input prices in health to
determine local differences in economic efficiency, and thus easily generalizable results of
economic evaluation and other productivity analysis are elusive. Finally, technical efficiency
and economic efficiency are necessary but not sufficient conditions for allocative efficiency,
which requires (a) the correct mix of outputs, given output prices, (b) the correct mix of
inputs, given input prices, and (c) the correct scale, given input and output prices (Lovell
and Schmidt, 1988).
The goal of this chapter is to lay out methods of general productivity analysis that have been
employed or suggested for use in health care applications, to give a sense of what the most
productive applications are, and to provide some suggestions of context in application based
on a review of selected studies. The best studies of productivity analysis in health care get
beyond a view of productivity in generating health services alone as the goal. Instead they
develop some sense of the importance of generating health improvement, health
maintenance, or quality of delivered health care as the key outcomes rather than the
intermediate products of health services.

97
2. Efficiency based methods of productivity analysis
The literature usefully separates out into methods that primarily assume that technical
efficiency is attained and are based on neoclassical cost function and production function
analysis, and methods that do not. This section addresses models assuming technical
efficiency, yet special aspects of the health production process have created difficulties in
applying these techniques in standard ways. For cost functions in health, hybrid flexible
functional forms have evolved that regress total costs on output quantities, input prices, as
well as other explanatory variables (Grannemann et al., 1986; Vita, 1990). Major areas of
research interest include measures of economies of scale and scope as well as methods for
accounting for quality and unobserved heterogeneity. For production functions in health,
standard methods using aggregated output quantities have encountered difficulties
estimating complementarities between inputs and characterizing diverse production
environments such as teaching and non-teaching providers. Some of these difficulties can be
addressed using simultaneous equation methods representing the production technology as a
labour requirements system (Burgess and Lehner, 1997 and Lehner and Burgess, 1995).
Labour requirements methods use the labour inputs, which usually are the variables
measured with the most accuracy, as dependent variables in a simultaneous equation
production function system. Studies focused on nursing home and hospital productivity are
separated from studies focused on physician productivity.
Use in health organizations
Most of the methodological advances have come from studying hospitals, though a
substantial literature studying nursing homes also exists. The focus of this section on health
organization productivity will be to highlight these methodological advances rather than
formal study of each area of health organization application.
Distinguishing quality of care differences from case-mix differences and from unobserved
heterogeneity is particularly vexing. Gertler and Waldman (1992) show that accounting for
unobserved and endogenous quality results in an empirical nursing home model with
parameter estimates that differ significantly from those in which quality is simply an
unobserved factor subsumed in the error term. Carey (1997) also employs an indirect
approach using panel data where individual hospital effects capture cost variation from
quality or other unobservables. Carey and Burgess (1999) attempt more direct measurement

98
of quality variables using lags of those values as instruments in a cross-sectional cost
function with panel data. They conclude that perhaps an even greater problem in cost
function estimation is the unmeasured case-mix or severity of illness variation in the
outputs, which may well be correlated with imperfect measures of quality. Thus, attempts
to measure quality could improve cost function estimation, but not measure cost/quality
trade-offs.
Success in measuring economies of scale and scope using cost functions tends to depend
heavily on the estimation methods employed. The hybrid flexible functional forms (for
example Vita, 1990) appear to be more successful at estimating scale and scope economies
since they have the ability to represent many diverse production technologies at any chosen
approximation point (Schuffham et al., 1996). Carey (1997) also emphasizes the impact of
estimation method differences in characterizing ray scale economies, where preferred panel
data estimates indicate significant scale economies while crosssectional models on the same
data illustrate diseconomies. Panel data models using nonparametric estimation (Wilson and
Carey, 2004) are even more flexible and can track changes over time and across indicator
variables using a discrete kernel function.
Use for physicians and physician practices
Physician productivity has been a frequently researched focus since physicians play a central
actor role in health services delivery and in many countries operate independently of other
health organizations. Measurement of the medical and non-medical labour inputs working
with physicians is difficult because these auxiliary staff can be difficult to measure and
exhibit a wide variety of complementarity and substitutability with physicians.
Output specifications also vary widely as measures of physician output used have included
simple measures such as billings and visits or more complex measures such as Relative
Value Units (RVUs) and patient panel sizes or numbers of patients.
Walker (2000) documents that RVUs have grown increasingly common as a measure since
they can relate physician effort to workload, and create equity across specialties without
discriminating for payer mix. Lasker and Marquis (1999) support the RVU conceptual
framework with their study of almost 20 000 visits to 339 urologist, rheumatologist, and
99
general internist physicians, which concludes that face-to-face encounter time and a limited
set of additional characteristics would reflect total work accurately.
Measuring productivity on a per patient or capitated basis through primary care panel size
directly has been slow to evolve; however, researchers have considered that capitation
incentives may lead primary care physicians to reduce the number and length of visits with
each patient in their panel. Yet Mechanic et al. (2001) found from 1989 to 1998 that the
length of out-patient visits actually increased slightly, while the difference between prepaid
and non-prepaid care diminished.
This chapter will not address physician compensation incentives in detail, nevertheless,
physician productivity analysis also could benefit from more careful economic modelling.
Within this limited literature, Gaynor and Gertler (1995) have studied group practices and
found that physicians differ in their individual preferences regarding work effort and
insulation from economic risk. Physicians were found to be more productive when
individuallevel financial incentives are in place. Thornton and Eakin (1997) estimate a
model for solo physician practices that relates physician input, output, and labour/leisure
choices with an endogenous virtual wage for the physician’s own time in the practice. Their
results suggest that patient-visit price increases induce small income effect reductions in
physician time, but in the aggregate provide more medical care services since more support
staff and medical supplies are employed to compensate.
More recently, Thurston and Libby (2002) advocate using Diewert’s (1971) generalized
linear production function that allows zero values for inputs and estimates of more
appropriate Hicks (1970) or q-complementarity for physicians relative to other inputs.
Unlike the results from other methods used in the physician productivity literature, Thurston
and Libby illustrate remarkable stability in the technical relationships for patient care over
the period 1965 to 1988 and find that nursing, clinical, and non-clinical support staff all are
q-complements to physicians in production.
3. Inefficiency measurement based methods of productivity analysis
In trying to measure inefficiency in hospitals and other health care organizations, the
heterogeneity of health care outputs remains the most vexing of the issues raised by
Newhouse (1994) concerning frontier estimation techniques. Yet attempting to measure and

100
understand the level of waste or inefficiency by particular health care providers in the health
care system remains a tempting focus for policy-makers looking for easy savings in
burgeoning health budgets. Unfortunately, these two perspectives remain tantalizingly
isolated from each other as researchers pursue more complex technical solutions to data and
modelling difficulties without carefully considering the perspectives of decisionmakers.
The problems raised by Newhouse (1994) apply to one degree or another in all the research
methods discussed in this chapter, specifically, unmeasured inputs, need for better case-mix
controls, strong and non-testable assumptions in the estimation methodologies, omitted or
improper outputs, and the fundamental problem of aggregation. This last problem is akin to
a Heisenberg uncertainty principle of productivity analysis brought about by the health
services process and the realities of cost accounting. If we define disaggregated health care
outputs very precisely, even down to the individual patient level, then we will be uncertain
about the costs and inputs required for that work.
Conversely, if we define disaggregated costs or individual inputs very precisely, then we
will be uncertain about the health care generated from those inputs.
Methods of measuring inefficiency
Considering the measurement of inefficiency in health is difficult in the context of a
dizzying array of specialized methods that frequently have been undertaken with a weak
understanding or even disregard for the underlying economic theory. The fact that
Newhouse (1994) notes that many of the assumptions in some methods are untestable just
adds to the shaky foundation. A crucial starting point for a journey into the literature is
Hollingsworth’s (2003) excellent review that provides far more detail and references than
can be provided here. This discussion will be separated into a study of parametric methods,
non-parametric methods, and some newer integrated methods.
Parametric frontier methods Stochastic frontier methods have the greatest similarity to
efficiency-based methods, since the form of the models is the same except for a one-sided
error term (Kumbhakar and Lovell, 2000). These methods have been applied to physician
practices (Gaynor and Pauly (1990) do an especially good job of building up their model
from economic theory and DeFelice and Bradford (1997) also illustrate how organizational
structure has a relatively small influence on the estimated inefficiency) as well as larger

101
health care organizations. More promisingly, other studies have used stochastic frontier
methods successfully on smaller units of observation (Dismuke and Sena, 1999; Bradford et
al., 2001) that can increase sample sizes and focus inefficiency results on more relevant
dimensions that can be addressed by decision-makers. In employing these methods on cost
functions, sensitivity to multicollinearity can be high, disturbing efforts to account properly
for inputs, outputs and quality dimensions with a flexible functional form. Kumbhakar
(1996) notes that the usual efficiency-based solution of estimating the cost function and
input share equations simultaneously complicates the distributional assumptions of error
terms across equations. Another complication can be the choice of distribution for the one-
sided inefficiency error term. Half normal, truncated normal, and exponential distributions
are commonly used, but inefficiency rankings are seldom sensitive to this choice
(Kumbhakar and Lovell, 2000). Greene (2002) provides comprehensive software to estimate
most specifications of these models.
Non-parametric frontier methods Non-parametric methods using Data Envelopment
Analysis (DEA), Free Disposal Hull (FDH) and other dominance measures have been
commonly used and misused in health care applications since the early 1990s. Most
importantly, careful attention to the Newhouse (1994) critique in a systematic way is lacking
in many studies. But the heterogeneity of observations in particular samples
and the need for observed better performing units to measure inefficiency, especially when
trying to compare results across studies, makes comparison of average inefficiency scores
generally unwise. Instead, more effective non-parametric frontier models need to hone more
carefully to well-constructed research questions and conceptual frameworks to solve
particular problems. As with the other methods, one important innovation is attempting to
look inside health care institutions to study inefficiency, to the extent disaggregated data
permit. Two noteworthy examples of this trend are Ozcan et al.
(1998), who show the effect of physician experience on the treatment of stroke, and Harper
et al. (2001) who identify a very small number of poorly performing general surgery units.
More use of FDH measures and careful notation of dominated health care units that would
provide specific advice for peers and improvements for individual units would either expose
weaknesses in methodology or move these non-parametric methods over into a more useful
frame of reference. Careful attention to slacks in DEA that are obtained from the linear

102
programming methods also offers little used opportunities for identifying sparse data or
recommending directional improvements.
For conducting this work, Hollingsworth (2004) reviews DEA inefficiency measurement
packages, including those that also estimate productivity changes using Malmquist index
methods.
Integrated frontier methods Many studies have tried to achieve a consensus of results by
applying a variety of inefficiency measurement methods to the same data. This has not been
especially effective in adding clarity to the implications and conclusions from results.
A better method might be to define research questions clearly and connect methods to
objectives directly. There have also been numerous attempts to expand and generalize
inefficiency estimation methodologies. For example, Olesen and Petersen (2002) apply
probabilistic assurance regions to a DRG disaggregated level hospital cost analysis which
allows incorporation of output heterogeneity and new measures of inefficiency stability.
Färe and Grosskopf (2004) present the directional distance function, a more general
presentation of Data Envelopment Analysis that provides more flexibility in valuing outputs.
And Simar and Wilson (2000) develop statistical inference methods in non-parametric
inefficiency measurement, building from first principles of a data generating process for
inefficiency. As each of these methodological techniques gains a foothold, though, this does
not absolve the productivity analyst from careful assessment of the appropriateness of
methods, formulation and specification. One of the areas of special misunderstandings
follows as the last example.
Explaining inefficiency and recommending process improvement
The best advice for taking inefficiency scores and attempting to explain them by other
variables and then using those second stage regressions to recommend process
improvements is not to do it. The technical problems are difficult to overcome despite a
seemingly obvious applicability. One approach commonly used that clearly is wrong is to
address the mass of data with zero inefficiency (or efficiency of 1) and to consider it as
censored data to be estimated with Tobit regression. It can be argued that the estimates are
truncated,

103
but it has not been argued that they are censored successfully. Andersen and Petersen (1993)
and Burgess and Wilson (1998) have avoided boundary problems in the second stage
regression with a ‘leave one out’ estimator, but even this estimator does not have a clear
statistical interpretation and so this approach is also no longer recommended. Simar and
Wilson (2003) and others have noted that the even deeper problem is that the inefficiency
estimates, no matter how they are obtained, depend on each other and thus are serially
correlated. Simar and Wilson (2003) have proposed a new comprehensive, but relatively
tortured, bootstrapping approach to solving these problems; however, it remains to be seen
how well their methods will be able to be applied in practice. Fried et al. (2002) have gone
even further to propose a three-stage analysis that they apply to a sample of US nursing
homes.
104
Chapter 6: The use of performance measures in health care systems
1. Introduction
Performance measurement is becoming increasingly prevalent in many health care systems.
The United States has the most experience of publication of data on health care performance
(Marshall et al., 2000). Information is available on the comparative performance of health
insurance plans, hospitals and individual doctors. Perhaps the best known reporting system
is the Health Plan Employer Data Information Set (HEDIS). Other high profile systems have
focused on a single aspect of care. The New York Cardiac Surgery Reporting system, for
example, publishes data on hospital- and surgeon-specific risk adjusted coronary artery
bypass surgery mortality. There is less release of information about quality of care in the UK
(Marshall et al., 2000), but in Scotland, data that compares outcomes across both hospitals
and health areas was made public from the early 1990s and since 1999 there has been a large
increase in the amount of publicly released data on the performance of English health care
providers.
2. The special features of health care systems
The health care sector shares many features of public sector organizations. This is not
surprising, given the large role of not-for-profit organizations in health care. Dixit (2002)
stresses two important features of the public sector. The first is that agents often serve
several masters: these may include the users of the service, payers for the service, politicians
at different levels of government, professional organizations. The second, a consequence of
the first, is that the organization and so the agents who work in it often have several ends to
achieve. For example, they are often expected to increase both efficiency and equity in the
delivery of health care. These features are termed multiple principals and multiple tasks:
they mean that the goals of a health care organization may be in conflict. Consequently the
performance measures used to evaluate, often complex, health care sector performance may
also be in conflict. The multiple and sometimes vague goals of health care organizations
mean that performance relative to these goals is difficult to measure.
A third feature of health care organizations is that their workers may exhibit ‘intrinsic’
motivation, which may cause them to respond in particular ways to the incentives embodied

105
in a performance measurement system. Intrinsic motivation has been defined as occurring
when an individual is ‘motivated to perform an activity when [he/she] receives no apparent
reward except the activity itself’ (Deci 1971, p. 105, cited in Jones and Cullis 2003).
Crewson (1997) distinguishes intrinsic rewards from extrinsic rewards (such as a pay rises
or promotion). The distinction matters since it may affect the impact of rewards on
behaviour. Extrinsic rewards may not work: they may ‘crowd out’ workers’ intrinsic 326
motivation and so have a negative impact on health care organization performance (Frey,
2000).
These features mean that any performance measure (PM) will at best be imperfect. A PM
will at best be able to provide a partial picture of a complex process, in which there are
several stakeholders, including users, who may have conflicting aims. A further
consideration is that agents will respond to PMs in ways that maximize their own utility or
benefit. This is not necessarily consistent with PMs improving welfare, nor is it necessarily
in ways that are expected by those who design a system of performance monitoring.
There are many examples of both distorted measures and altered behaviour to improve the
PM at the expense of unmeasured actions (see Propper and Wilson (2003) for examples
outside the health care system). All these factors mean that achieving a causal link between
measurement of and improvement in health care organization performance will crucially
depend on the objectives and design of the PM system.
3. Rationale for and forms of performance measure in health care
Performance measurement may be undertaken at various levels, from system-wide to the
organizational level. Its purpose may differ depending on the level at which it is
implemented. For example, it can be used to improve the performance of individual units
(such as particular hospitals). This may or may not be linked to ‘best practice’ exercises, in
which the best performing units provide an example for others to follow. It can be used as
part of an attempt to improve the performance of the overall organization. In this case the
focus of the exercise is to improve the performance of the parent organization as a whole, as
well as possibly providing some developmental information for a single unit. It may be used
as part of an attempt to generate pseudo-competition, for example, where purchasers in

106
health care buy care from providers on the basis of measures of performance. It may also be
used to improve the accountability of organizations in the health care sector.
Finally, it can be used as part of a resource allocation system, for example, to enable central
government to allocate funds to service providers. In the use made of performance
measurement in the health care sector we can see elements of all these aims, but they are
often not clearly separately identified, and the same tools may be used for different
purposes.
Performance measures come in a variety of forms (Propper and Wilson, 2003). Barnow
(1992) makes a distinction between gross outcomes and net outputs as performance
measures.
Gross outcomes are measures of the outcomes of the programme at some designated date.
Health programme gross outcomes include the number of patients who do not die after
emergency admission for heart attacks, or the number of individuals given hip replacements.
The advantages of such measures are that they are easy to understand and easy to collect.
But they do not necessarily measure the actual output of the programme itself: patients may
have recovered from heart attacks without medical intervention.
However, if gross outcomes are measured relative to some standard, which is set to take
account of what would have happened without the programme, then the gross outcomes may
be useful in assessing the impact of the programme. Gross outcomes also do not take into
account the difficulty of treating a particular individual, but they can be adjusted for
observed characteristics of the individual and this can partially overcome this problem. In
fact, in many situations, heterogeneity across programme users means that such adjustments
will be necessary. For example, performance measures for medical outcomes are frequently
risk adjusted (essentially adjusted for the health of the individuals treated).
Net outputs are measures of the value added of the programme. As Barnow (1992) notes,
barriers to developing net output measures may be high, primarily because the output of the
programme may be multi-dimensional: for example, public organizations in health care may
be required to meet both efficiency and equity targets. One way of overcoming this is to
calculate the value of net outputs – the health gain from treatment – so there is a common
metric across outcomes, but again this is not a simple matter. More generally, measuring
value added is fraught with methodological problems, a key one being the difficulty of
constructing a counterfactual of what would have happened in the absence of the
107
programme. This means that net output calculations often require evaluations that are
expensive and cannot be done on a regular basis (see also section 4 below). In addition,
collecting such data takes time, so net measures do not give those who run the programme
information when they need it, typically at the end of the year.
We can also distinguish measures of outcome from measures of process. Smith (2002)
argues that outcome measures are likely to be favoured when the nature of the outcome is
relatively uncontested; when outcomes can relatively easily be captured in operational
performance measures; when an indicator of the outcome can be secured reasonably soon
after the intervention; when the outcome is readily attributable to clinical performance rather
than external factors; and when there is a need for considerable clinical judgement as to the
most appropriate intervention to offer. Outcome measures are of use in indicating good
performance when the outcomes that are desired occur in the short term, when risk
adjustments can be made, and when there are not too many dimensions to the output.
Process and outcome measures also might have different functions. Outcomes are often the
result of factors outside the control of the health system. Measuring poor outcomes (for
example, in-patient mortality) does not necessarily give guidance on what to change in order
to improve. Such outcomes occur infrequently in comparison to the processes that prevent
them (for example, the use of beta blockers in the treatment of patients with AMI). On the
other hand, changing a process that is known to improve outcomes should lead to
improvements. So measuring processes may be useful when performance measures are used
internally to improve production, whereas outcome measures may be more useful when
seeking to reward good outcomes (Romano and Mutter, 2004). Marshall et al.
(2000) argue that there is an increasing body of evidence that process measures are more
sensitive and feasible measures of quality of care than outcome measures. More generally, a
theme that emerges in the discussion of performance measures in health care is the
importance of the use of a range of measures.
There is also discussion of the purpose of public disclosure of information. Marshall et al.
(2000) identify three models. The first is a public accountability model in which disclosure
is a public responsibility, independent of the consequences. Proponents argue that the
release of data, in conjunction with appropriate education and debate, will clarify important
social issues. However, this model may have little impact on the quality of care, though it
may (for exactly the same reasons) be perceived as least threatening by professionals.

108
The second is a market-orientated model, in which comparative information allows
informed consumers to drive quality improvements through choice. To be useful, such data
need to be standardized for differences in case-mix. This model is possibly more important
in health care systems in which consumers can make choices, but even in the US, the
evidence suggests that individual consumers make relatively little use of performance data.3
The third model, a professional orientated model, assumes a desire on the part of
professionals to improve their practice, given the appropriate environment. Providing data
aids this. In this case, standardization is not the highest priority, as providers may be
comparing their own performance over time using the data as an aid, rather than a measure
that is linked directly to financial rewards.
4. Evidence on the use and impact of PMs in health care
Difficulties in constructing measures
Landon et al. (2003) review the current state of physician clinical performance assessment
(PCPA). PCPA is the quantitative assessment of performance based on the rates at which
patients experience certain outcomes of care and/or the rates at which physicians adhere to
evidence-based processes of care during their actual practice of medicine. It can be used to
ensure competency of individual physicians, to support health care choices by patients or
purchasers and in quality improvement within organizations or by physicians. While Landon
et al. Focus on the requirements for competency assessment as this is the most stringent,
they note that PCPA is rarely used for this purpose.Landon et al. (2003) argue that measures
used in PCPA must be feasible to collect; be evidence-based (non-controversial, from
randomized control trials (RCTs) or overwhelming physician consensus); apply to a large
enough population of patients to allow assessment of individual physicians; adjust for
patient-level characteristics that may confound the measure (case-mix, severity of illness,
co-morbidity, factors that affect adherence to treatments (for example, socio-economic
status)); attribute care to the individual physician; be reasonably reflective of the work
performed by physicians in the field.
The obstacles to wider use include the lack of evidence in many specialties; problems in
defining thresholds for acceptable care; sample size and other statistical considerations; 5

109
the issue of confounding in both process and outcome measures (risk adjustment based on
administrative datasets may not be precise enough to determine physician competence,
though it may be suitable for quality improvement) and finally, the fact that evidence
concerning optimal processes only exists for a small faction of the routine work of most
specialties. They conclude that, at present, important technical barriers fall in the way of
using PCPA for evaluating the competency of individual physicians.
Lilford et al. (2004) argue that comparative outcomes data (league tables on mortality and
other outcomes) should not be used by external agents to make judgements about quality of
hospital care. Although they may provide a reasonable measure of quality in some high-risk
surgical situations, they have little validity in acute medical settings. They are useful for
monitoring trends within organizations and research purposes, but argue that sanctions and
rewards should not be applied to the ‘worst’ 5 per cent of providers on outcomes, because
these will not be the 5 per cent with the worst quality.6 They suggest instead that central
agencies should ask that organizations show that they have in place mechanisms with which
to monitor trends in outcomes (deaths, changes in infection rates), clinical processes (for
example, speed of treatment of fractured hips) and throughput (waiting times). Romano and
Mutter (2004) further warn against focusing on just one dimension of care. Quality of care
has multiple dimensions, and organizations that perform well on one dimension may not
perform well on others. Focusing on a single measure, or on multiple measures of a single
dimension, may lead to the wrong conclusion regarding overall quality.
Potential for gaming
The potential for gaming arises from the fact that the agent has different aim(s) from the
principal(s). As the principal tries to get higher effort (and so better quality health care) by
implementing performance measurement, the responsemay be better services but alsomay be
other less desiredbehaviour.Gamingcan takemany forms. Smith (1995) lists unintended
consequences of publishing PMs in the public sector, including tunnel vision; myopia;
measure fixation; sub-optimization; gaming; misrepresentation and misinterpretation.7
Examples in health care abound (Lilford et al., 2004). Green and Wintfeld (1995) argue that
41 per cent of New York state’s reduction in risk-adjusted mortality could be accounted for
by data gaming. Burack et al. (1999) surveyed 104 cardiac surgeons in New York and found

110
that high risk coronary artery bypass grafting (CABG) patients were more likely to be
denied treatment compared to similar high risk patients with aortic dissection, because the
latter procedure was not subject to performance monitoring. There is also evidence from the
UK of dysfunctional behaviour in response to measures of throughput (Edhouse and
Wardrope, 1996). Lilford et al. (2004 p. 1151) state, ‘in the UK we have seen clinical
services interrupted, figures distorted, and managers falling on their swords in response to
spurious process data or “bean counting” ’.
Impact of information on behaviour
Marshall et al. (2000) identify possible responses to public disclosure from consumers,
physicians, hospitals and provider organizations, and purchasers. One view is that while
consumers claim to want such information they do not make great use of the data (Schneider
and Epstein, 1998; Edgman-Levitan and Cleary, 1996; Marshall et al., 2002; Mason and
Street, 2005). Farley et al. (2002) study the impact of report card information on plan choice
amongst Medicaid enrollees and find that only 50 per cent of survey respondents reported
receiving and using the report, and that the report card had little impact on aggregate
enrolment. Evidence from focus groups suggests that most employees do not use the
information when it is provided (Meyer et al., 1998).
There is some evidence that suggests the use of certain kinds of information by consumers.
Scalon et al. (2002) examine the effect of health plan ratings on employee health plan choice
and show that individuals do not respond to individual attributes of quality.
However, they show that employees avoid plans with many below-average ratings, while
they are not strongly attracted to plans with many superior ratings. Studies in laboratories
and focus groups have also shown that individuals are more likely to avoid low rated plans
than select high rated ones (Hibbard et al., 2000).Wedig and Tai-Seale (2002) investigate the
impact of information from health insurance report cards that seek to translate complex data
about plan benefits and treatments into a small number of dimensions. They conclude that
‘consumers can apparently get a complete picture of most subjective dimensions of quality
by focusing on just a few report card measures (two in our case)’ (p. 1046) 330 The Elgar
companion to health economics and also note that consumers find process measures of
consumer satisfaction to be the most useful, largely because they can infer the meaning of
111
measures such as overall satisfaction, time spent with the physician and so on. Measures of
health outcomes (for example, mortality rates) are assigned less value by consumers.
The evidence suggests that physicians are more aware of report cards than consumers but
make little use of them (Marshall et al., 2003). There are examples from the US of
physicians responding by demanding that their managers’ performance also be judged using
report cards (Kaplan et al., 2000). In the UK some professional networks (for example,
cardiothoracic surgeons) are showing some support for benchmarking on the basis of
published data (Marshall et al., 2003).
Provider organizations and hospitals are the most responsive agents to these data.
Marshall et al. (2000) indicate some positive responses, in that report cards induced better
processes or outcomes, particularly in competitive markets (see also Marshall et al., 2003
and references therein). Other responses were less positive and included criticisms of the
data, particularly among those hospitals identified as poor quality (Mason and Street, 2005).
Purchasers, in contrast, are more interested in costs or gross indicators of quality (Marshall
et al., 2003). A survey of the impact of HEDIS data on employer choice of
health care plans suggests limited use by buyers of health care (Hibbard et al., 1997).
Impact of information on outcomes Despite a decade or more of experience with public
disclosure of performance data in the US there has been little rigorous evaluation of its
impact on outcomes. Marshall et al.
(2000) identify several reasons for this. Some are due to the particular nature of the sector,
for example, the ‘political incorrectness’ of challenging a tool of informed consumerism or
the power of vested business interests. However, they also note that evaluation of
performance data requires a clear theoretical framework to identify the purpose of
publication and an understanding of the strengths and weaknesses of the data that are being
made public. The kind of academic rigour that has been applied to evaluation of
performance
Management in the training field (Propper and Wilson, 2003) has not yet occurred in health.
In part, this is due to the fact that the measurement of health care outcomes is more complex
than the measurement of labour market outcomes.
The most reliable evidence comes from studies of the New York Cardiac Surgery Reporting
System (Marshall et al., 2000). Hannan et al. (1994) found that mortality declined
significantly following publication of data on mortality rates. Potential explanations include
112
responses of doctors, an exodus of low volume and high mortality surgeons from the state, a
marked improvement in the performance of non-low volume surgeons and improvement of
surgeons new to the system. Critics of the release of data argued that its publication could
have reduced access to CABG surgery by forcing sicker patients to get surgery out of the
state or by surgeons refusing to operate on high-risk patients (potential ‘cream-skimming’
strategies). However, this behaviour was not supported by the evidence.
Dranove et al. (2003) use the same data to examine the impact of report cards on appropriate
matching of patients to hospitals, on the quality and incidence of intensive cardiac
treatments and on the resource use and health outcomes that determine the net consequences
of report cards on social welfare. They found that report cards led to substantial selection by
providers of patients, increased sorting of patients to providers on the basis of severity of
their illness, and significant declines in the use of intensive cardiac procedures for sicker
patients. Treated patients in the two states (New York and Pennsylvania) which had report
cards were less ill than those treated in states without report cards.
Patients within a hospital were more similar in terms of severity and those who were sicker
were more likely to go to teaching hospitals. Report cards also altered the treatments given,
such that both healthier and sicker patients received more treatment. However, while this
improved outcomes for healthier patients, it worsened outcomes for sicker ones, because
hospitals avoided performing intensive surgical therapies that were monitored for sicker
patients and instead used less effective medical therapies. Overall, the authors concluded
that these cards reduced patient welfare, though they concluded that the longerterm impacts
might be more positive.8 Finally, Marshall et al. (2003) discuss some observational studies
on the effect of performance measurement on processes related to health outcomes, such as
vaccination and mammography. Bost (2001), for example, shows that US health plans which
publicly reported their data showed greater relative improvement on some HEDIS measures
over a three-year period compared to those plans which measured but did not publish
performance data. Longo et al. (1997) find improvements in obstetrics care processes for
hospitals identified as being low quality, and that this effect was stronger in more
competitive markets. Improvements in processes related to patient experience (as well as
reductions in within-hospital waiting times) were identified as one result of a benchmarking
exercise across emergency care departments in 12 Swiss hospitals (Schwappach et al.,
2003).

113
References
Rob Flyn, Structures of control in health management, international laboratory of
sociology, Routledge, 1992, London
Barbara McPake and Charles Normand, Health economics, an international
perspective, Second edition, 2008 New York
Anthony Scott, Alan Maynard, Robert Elliot, Advances in health economics, Jhon
Wiley and Sons, 2003 England
Andrew M Jhones, The Elgar Companion to health economics, Edward Elgar
Publishing, Inc. 2006.
K.V.Ramani, Dileep Mvalankar, Dipti Govil, Strategic issues and challenges in Health
management, Centre for Management of Health Services (CMHS), Indian institute of
management, Ahmedabad, SAGE Publications India Pvt Ltd 2008.
Joseph Tan and Fay Cobb Payton, Adaptive Health Management Information
Systems, Conceptsn cases and practical applications, Jones and Bartlett Publishers,
LLC, 2010