Health Risk Assessments Land Use - BAAQMD
76
Health Risk Health Risk Assessments Assessments & & Land Use Land Use May 3, 2010 May 3, 2010
Transcript of Health Risk Assessments Land Use - BAAQMD
Health Risk Health Risk Assessments Assessments
&&Land UseLand Use
May 3, 2010May 3, 2010

CAPCOA developed this guidance document to assist lead agencies insure compliance with CEQA.
“Health Risk Assessments for Proposed Land Use Projects”
CAPCOA Guidance Document
http://www.capcoa.org/rokdownloads/HRA/CAPCOA_HRA_LU_Guidelines_8-6-09.pdf

An explanation of how the Document evolved.
A description of the 2 main parts of the Document:
• CEQA risk assessment policy issues.
• Modeling and risk assessment procedures.
A discussion of the implications of the Document.
Presentation Overview
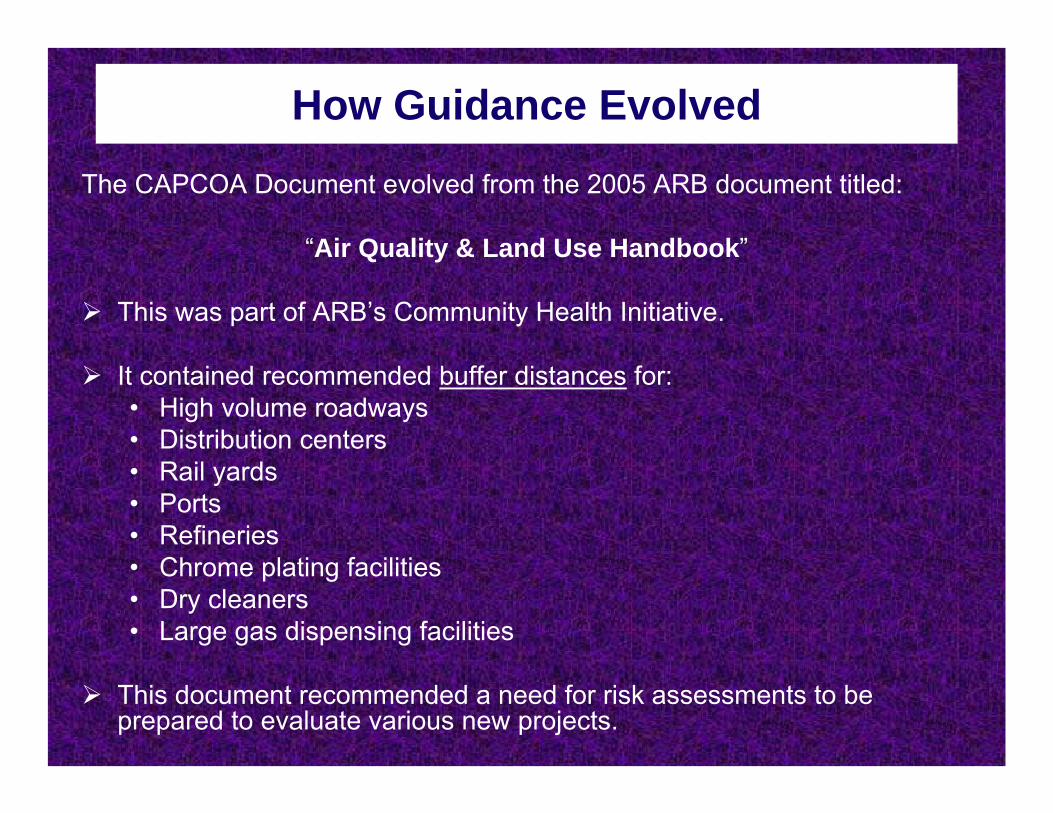
The CAPCOA Document evolved from the 2005 ARB document titled:
“Air Quality & Land Use Handbook”
This was part of ARB’s Community Health Initiative.
It contained recommended buffer distances for:• High volume roadways• Distribution centers• Rail yards• Ports• Refineries• Chrome plating facilities• Dry cleaners• Large gas dispensing facilities
This document recommended a need for risk assessments to be prepared to evaluate various new projects.
How Guidance Evolved

Districts began discussing how and when risk assessments should be prepared for CEQA.
In 2005, CAPCOA began discussing the need for consistency in assessing proposed development projects throughout California.
In 2006, CAPCOA formed a Subcommittee consisting of planning managers, and staff skilled in evaluating health risks for other programs, to discuss when and how risk assessments should be prepared.
How CAPCOA Responded

Reason For Guidance
Prepare guidance document which describes a statewide uniform protocol for determining:
When risk assessments should be prepared.
How risk assessments should be prepared.
What to do with the results.
Goal of Subcommittee
Chapters in Guidance DocumentLegal justification.
When should a risk assessment be prepared.
How a risk assessment should be prepared.
What to do with results.
Mitigation measures.
Public participation guidance.
Components of the Guidance Document

Legal justification
Section 15126.2(a) requires environmental impacts to be identified for two types of projects:
Projects that can cause an adverse health impact on the people already living or working nearby (Type A).
Projects, such as new residential developments, that will be located in an area that can cause adverse health impacts to those residents (Type B).

Proposed House or Business
Proposed SourceExisting House or Business
Existing Source
Types of projects addressed by CEQA
Type B
Type A
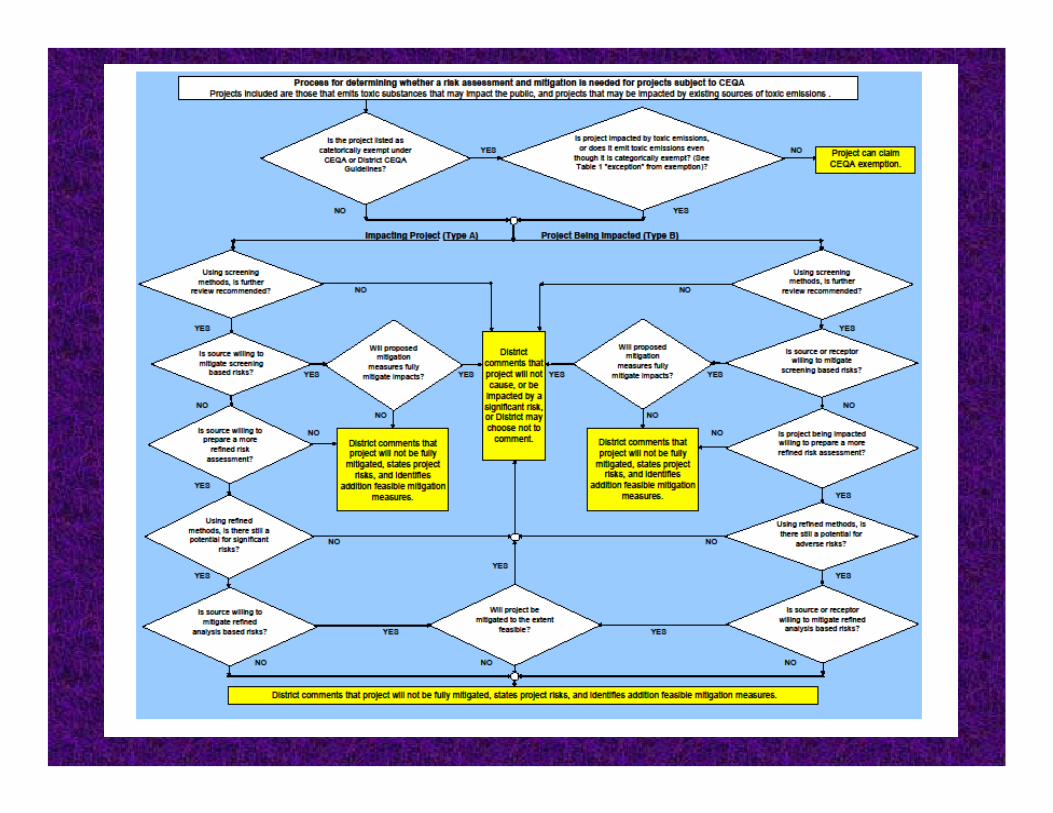

When should a risk assessment be prepared?
First step - Determine if project is subject to CEQA.
Second step - Determine if toxic substances will be emitted, or impacted project.
Third step – Screening Assessment.
Fourth step – Refined Assessment.

First Step – Exempt ProjectsProjects can be subject to CEQA unless they are:
Statutorily exempt, for example:• Ministerial projects, such as issuance of building permits,
or approval of final subdivision maps.• Issuance, modification, amendment, or renewal of Title V
air quality permits.
Categorically exempt, for example:• Actions by regulatory agencies for protection of the
environment.• Cogeneration projects at existing facilities.
(See Section 4.0, Table 1 of the CAPCOA Guidelines)

Second Step – Toxics Emitted?Nearly all combustion processes, & mobile sources.
Processes that use toxic substances.
Many EPA, CARB, and district resources are available to indicate whether toxic substances will be released from a project.
Contact District for guidance

Third Step - Screening Tools
Various tools can be used to determine if a significant risk may result from project:
• Prioritization or other spreadsheet calculations.
• SCREEN3 modeling.
• ARB’s 2005 AQ & LU Handbook.
• Other tools are under development.
Contact District for guidance

Fourth Step - Refined AssessmentSometimes refined modeling can be done nearly as easily as other screening procedures.
Stationary sources.AERMODISCST3
Road vehicles emissions.CAL3QHCRAERMODISCST3
(These procedures will be discuss later in the presentation.)Contact District for guidance

What to do with results?
Suggested levels of significance:Type A (new source)
>10 per million cancer risk>1 Hazard Index
Type B (new receptor)
Varies by districtContact District for specific guidance.

Mitigation MeasuresCEQA Guidelines Section 15364, requires all “Feasible” Measures must be applied within a reasonable period of time accounting for:
Economic,
Environmental,
Legal,
Social, and
Technological Factors.

Mitigation MeasuresAir Toxic Control Measures (ATCMs)
Emission reductions created by accelerating the implementation of ATCMs, or by expanding the applicability of ATCMs can be considered mitigation measures, if they are enforceable.
Contact District for guidance

Mitigation Measures -Project Placement
Project Placement is an effective way to mitigate risks:
Type A (new source)
Emission sources may be located further from receptors.
Type B (new receptor)
Receptors may be located further from emission sources

Mitigation MeasuresQuantifiable & Unquantifiable
Mitigations measures can be quantifiable or Unquantifiable:
Quantifiable measures:Example:
Verified diesel particulate filters.
Unquantifiable measures*:Example:
Trees and hedges along roadways.*Unquantifiable measures - are measures based on limited data / studies indicating emissions may be reduced, but information is insufficient to quantify the reductions at this time.

The Lead agency may need to require mitigation monitoring for the life of project.
(CEQA Public Resources Code 21081.6)
Examples:Vegetation barrier maintenance.Diesel particulate filters maintenance.Indoor air filtration systems maintenance.
Mitigation Monitoring

Public Participation Guidance
Public participation can be critical.
Early community discussions can reduce the potential for disagreements or challenges that can delay or stop projects, even when a project can meet risk thresholds.
ARB’s 2005 AQ & LU Handbook provides some guidance.
Other public participation guidance documents.

Misc. Policy IssuesThe CAPCOA Guidelines also includes discussion on these issues:
Smart Growth.Less than Lifetime Cancer Risk Exposures.Mitigating Roadway Toxics.Existing Background Risks.Inappropriate Discounting of Risks.Misleading Comparison of Cancer Risks.Experts Disagree.

Sometimes infill (smart growth) results in residences being located in areas near existing sources of toxic emissions.
Example:Residential units placed next to freeways or industrial sources.
Potential Conflict – “Smart Growth”

Potential conflicts can occur when existing zoning allows houses adjacent to freeways regardless of risks.
Potential Conflict - Mitigating Roadway Toxics
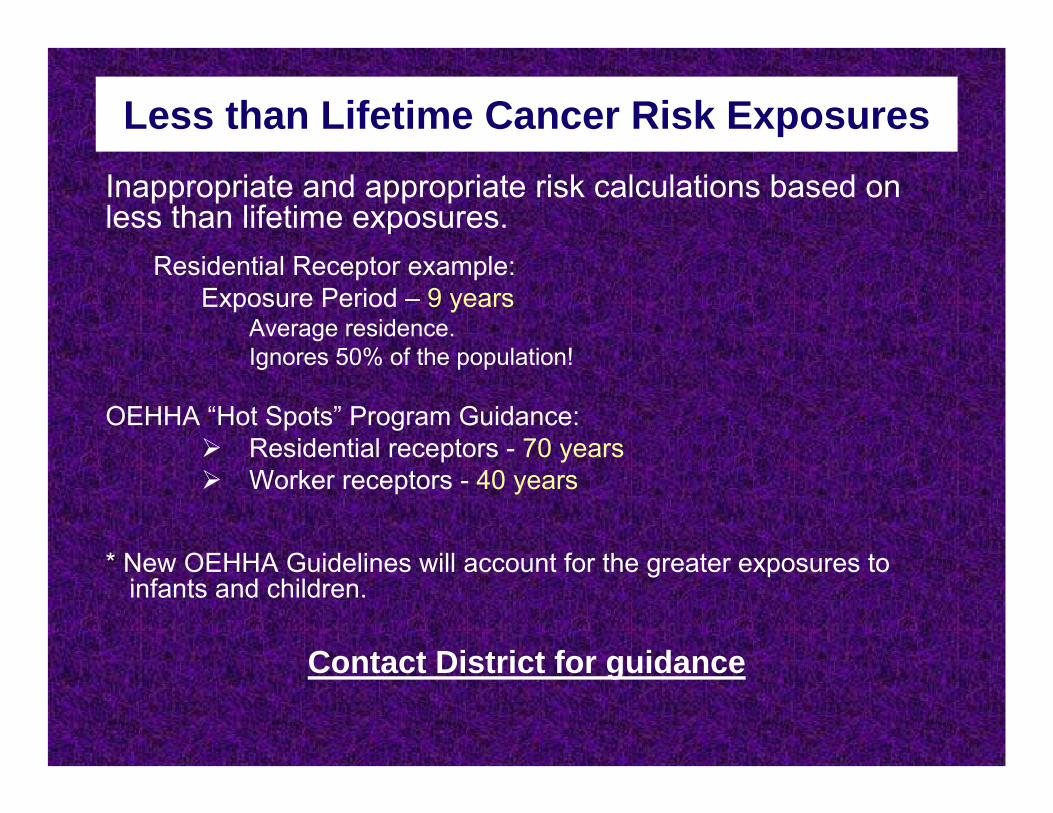
Inappropriate and appropriate risk calculations based on less than lifetime exposures.
Residential Receptor example:Exposure Period – 9 years
Average residence.Ignores 50% of the population!
OEHHA “Hot Spots” Program Guidance:Residential receptors - 70 yearsWorker receptors - 40 years
* New OEHHA Guidelines will account for the greater exposures toinfants and children.
Contact District for guidance
Less than Lifetime Cancer Risk Exposures

The CAPCOA Guidelines were meant to minimize inappropriate risk assessment methodologies designed to downplay health impacts.
Inappropriate Discounting of Risks
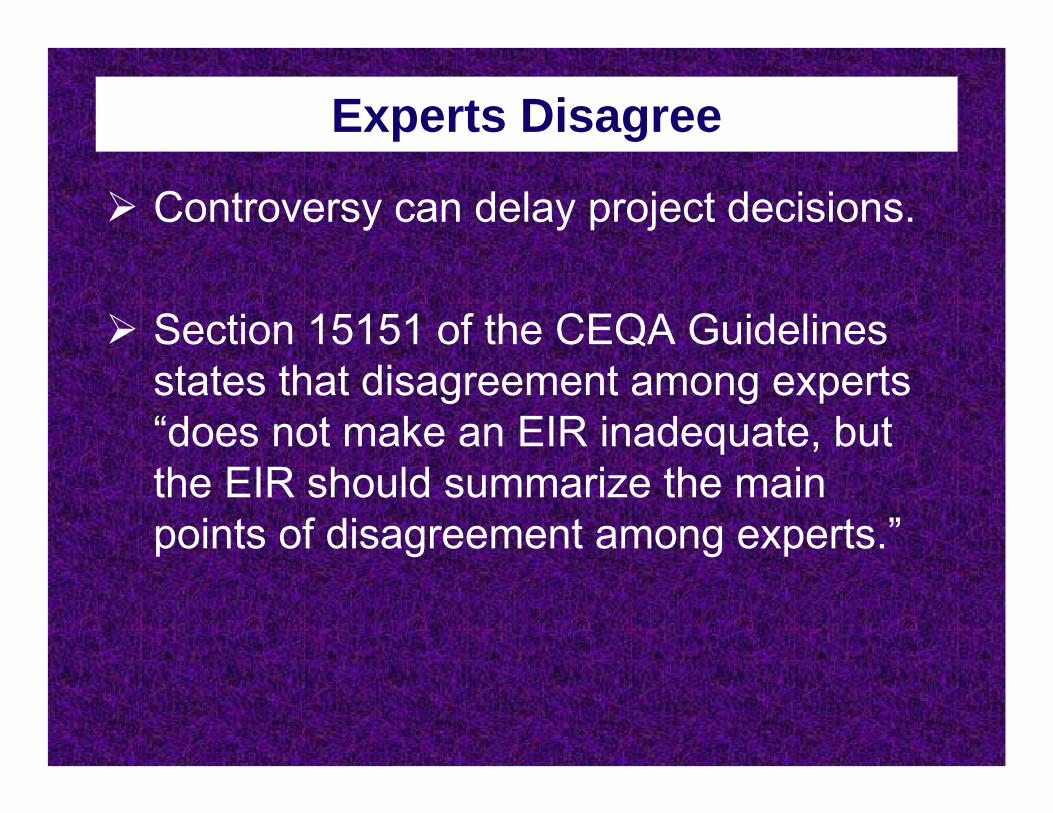
Experts Disagree
Controversy can delay project decisions.
Section 15151 of the CEQA Guidelines states that disagreement among experts “does not make an EIR inadequate, but the EIR should summarize the main points of disagreement among experts.”

Discussion

Modeling and Risk Assessment Preparation
Guidance Section(Technical Section)

This section describes basicprocedures used to calculate risk*
Cancer Risks – probability per million, 70 years
Chronic Hazard Index – 1 year aver. conc.
Acute Hazard Index – 1 & 8 hour max. conc.
* More detailed descriptions can be found in OEHHA’s risk assessment and modeling guidance documents.

Cancer Risk Calculation

Acute and Chronic Hazard Index
HIacute = ∑ HQi = Conci / RELi, a
(Only substances that affect the same body parts or organs are summed)
Ammonia – eye & respiratoryToluene – eye, respiratory, developmental, nervous, reproductive
Methyl chloroform – nervous system
_______________________________________________
HIchronic = ∑ HQi = Conci / RELi, ch
(Only substances that affect the same body parts or organs are summed)
Formaldehyde – respiratoryAcrolein – respiratory
Isopropyl Alcohol – kidney, developmental

Steps to prepare a Risk Assessment
1. Determine emissions.
2. Model emissions (Main Focus of Guidelines).
3. Determine exposures (dose).
4. Calculate risks.
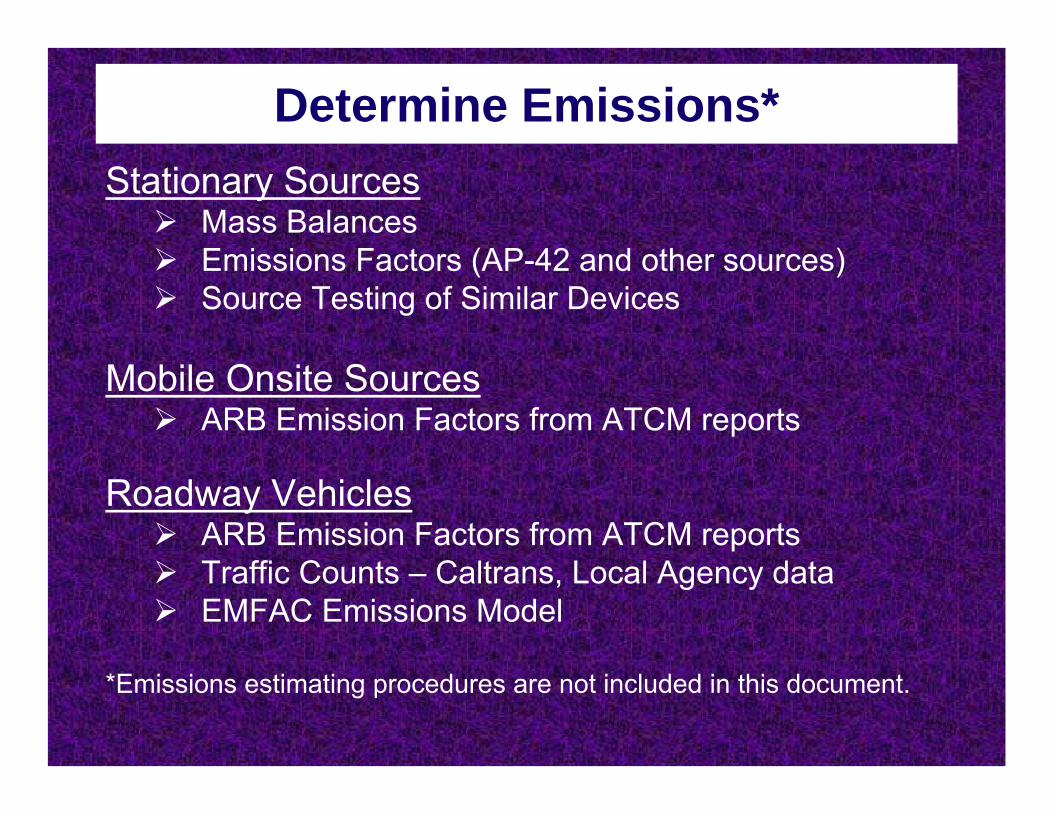
Determine Emissions*Stationary Sources
Mass BalancesEmissions Factors (AP-42 and other sources)Source Testing of Similar Devices
Mobile Onsite SourcesARB Emission Factors from ATCM reports
Roadway VehiclesARB Emission Factors from ATCM reportsTraffic Counts – Caltrans, Local Agency dataEMFAC Emissions Model
*Emissions estimating procedures are not included in this document.

Modeling - Source types covered by the Guidance
Point sources:• Traditional stacks
Area sources:• Truck Stops (alternatively, volume source)• Construction projects• Quarries• Evaporation ponds
Volume sources:• Roads and Railways• Gas stations• Dry cleaners• Various building configurations

Dispersion Modeling - Main Focus of Guidelines

Modeling Emissions
Modeling is often an iterative process working with air district staff.
Simple screening methods → refined methods.
As complexity increases,risk levels tend to drop, butpreparation & review costs tend to increase.

Modeling Emissions
Modeling is concluded once the proponent and their consultant have, to their best ability, included all sources of toxic emissions that are reasonably expected to be present in modeled runs.
To streamline the modeling process, some local air districts allow for modeling protocols to be submitted for review before commencement of actual modeling runs.
contact air district for guidance.

Exposures AssessmentsExposure Assessments calculate the dose from various pathways. CAPCOA Guidelines defer to OEHHA procedures.

Exposure AssessmentDose can be determined for each Exposure Pathway• Inhalation*
• Dermal (skin) absorption*
• Ingestion:*Water
Soil*
Food: Plants* (home grown gardens)Fish and AnimalsMother’s Milk*
*Minimum Pathway required by OEHHA in a health risk assessment
Calculate Risk
For substances involving only the inhalation pathway, risks can be calculated using the formulae in Chapter 8.
For substances involving multiple pathways, risks can only be calculated using ARB’s HARP program.

Health Risk Disclosure & Mitigation
All health risk must be disclosed.
All possible mitigation measures must be identified.
Degree of proposed mitigation implementation must be identified.

Mitigation Measures
The CAPCOA Guidelines include:
General and specific mitigation measures.
Project location / site design guidance.
Unquantifiable mitigation measures.Unquantifiable measures - are measures where there are limited data / studies that indicate that emissions may be reduced, but information is insufficient to quantify the reductions at this time.
Mitigation monitoring measures.

Living Document
As science of risks improves, modification to the Guidance will be needed.
Potential improvements:
Exposure Assessment Methods,
Modeling Procedures,
Screening Methodologies.

Discussion

District Roadway Modeling

Road ModelingUsing AERMOD

AERMOD
User friendly commercial product examples:
Lakes Environmental Inc. - AERMOD ViewTrinity Consultants – Breeze AERMODORIS Solutions – Beest
EPA developed.Fortran language based model.
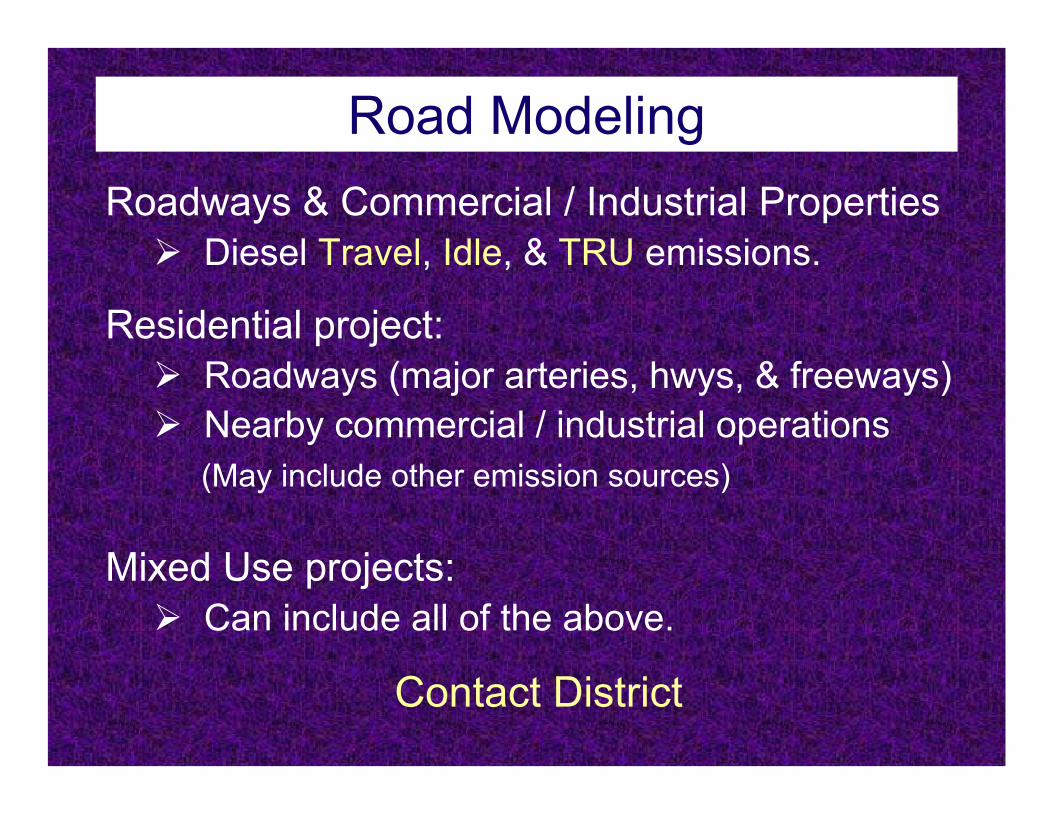
Road ModelingRoadways & Commercial / Industrial Properties
Diesel Travel, Idle, & TRU emissions.
Residential project:Roadways (major arteries, hwys, & freeways)Nearby commercial / industrial operations(May include other emission sources)
Mixed Use projects:Can include all of the above.
Contact District

Diesel Truck Emissions
Truck Travel
Truck Idling
Diesel engines powering trailer refrigeration units (TRUs)

Guidance Documents"Health Risk Assessment Guidance for Analyzing Cancer Risks from Mobile Source Diesel Idling Emissions for CEQA Air Quality Analysis“http://www.aqmd.gov/ceqa/handbook/mobile_toxic/mobile_toxic.html
AERMOD User's Guidehttp://www.epa.gov/scram001/dispersion_prefrec.htm
OEHHA "Air Toxics Hot Spots Program Risk Assessment Guidelines Part IV Technical Support Document for Exposure Assessment and Stochastic Analysis"http://www.oehha.ca.gov/air/hot_spots/pdf/Stoch4f.pdf

Series of Volume SourcesTruck Traveling
Modeled as a Series of Volume Sources following the path of travel

Example Volume ParametersHeight = Truck Height (assume ~15 ft)Initial Vertical Dimension = Height / 4.3
Width (W) = Truck Width (assume ~12 ft)Initial Lateral Dimension = 2W / 2.15
Release height = based on truck configuration.
Traveling Emission Factors = from EMFAC.
Site specific data should be used, if known.
See AERMOD Users Guide.

Truck Idling
Can be modeled as a:
Point, Area, or Volume Source
depending on the circumstance,contact the District for guidance.

Diesel Idling - Example Modeling Parameters
Vertical Exhaust Stack Parameters:
Height = 3.84 metersDiameter = 0.1 metersVelocity = 51.71 m/s Temperature = 366 K
Emission Factors derived from EMFAC run
Project specific data should be used when available, contact the District for guidance.

High Horizontal Exhaust Parameters:
Height = 3.84 metersDiameter = 0.1 metersVelocity = 0.001 m/s Temperature = 366 K
Emission Factor derived from EMFAC run
Project specific data should be used when available, contact the District for guidance.
Diesel Idling - Example Modeling Parameters

Low Horizontal Exhaust Parameters:
Height = 0.183 metersDiameter = 0.1 metersVelocity = 0.001 m/s Temperature = 366 K
Emission Factor derived from EMFAC run
Project specific data should be used when available, contact the District for guidance.
Under Truck
Diesel Idling - Example Modeling Parameters

TRU Emissions
Can be modeled as a:
Point, Area, or Volume Source
depending on the circumstance,contact the District for guidance.

AERMODHeight = 3.96 metersDiameter = 0.04445 metersVelocity = 49 m/s Temperature = 501 K
Emission Factor = 0.76 g/BHP-hr
Unit specific data should be used, if known.
Trailer
TRU Example Stack Parameters
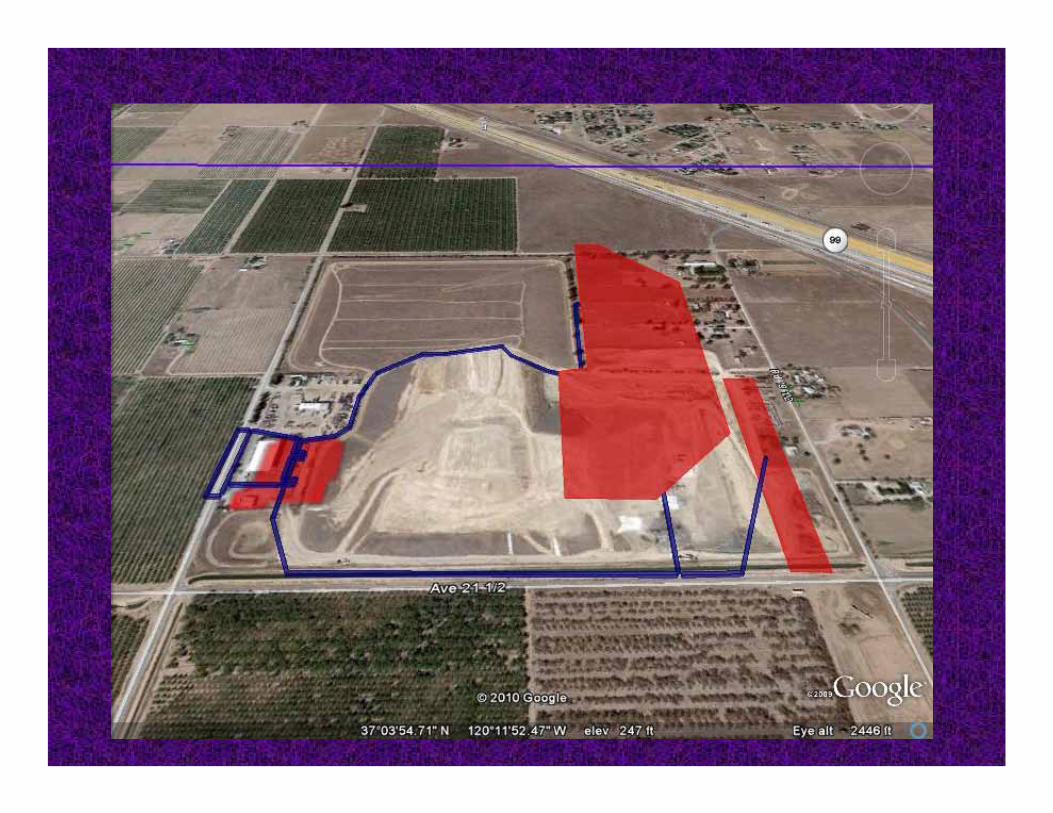
Example Project

Example Project
Landfill Sources:CompostingExpansion of Existing LandfillWaste Recycling / SeparationTruck UnloadingScale AreaTruck TravelTruck Idling


Discussion

Roadway Modelingusing CAL3QHCR
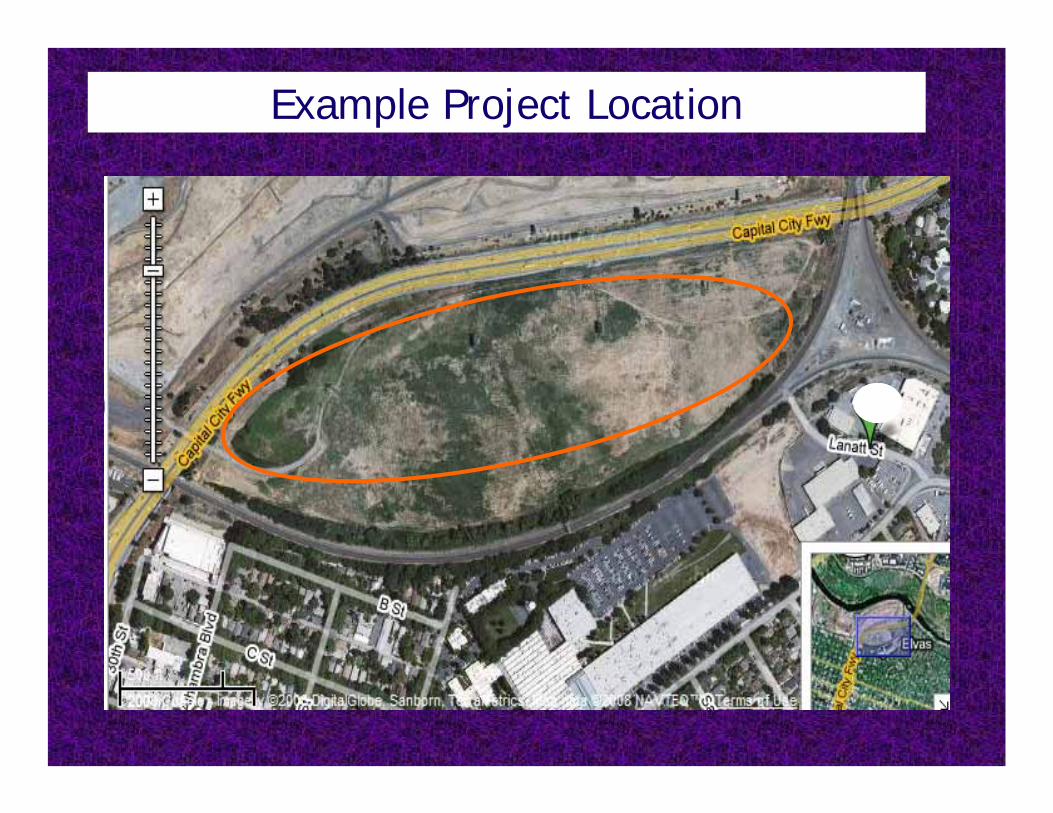
Example Project Location

Line source model
Inhalation pathway only
Inputs:Roadway link information – above/below grade, UTM coordinates, etc…
Emission factors – derived From EMFAC.
ISCST3 met files are compatible with CAL3QHCR.
Traffic data – from CALTRANS.
Receptor locations.
CAL3QHCR Model
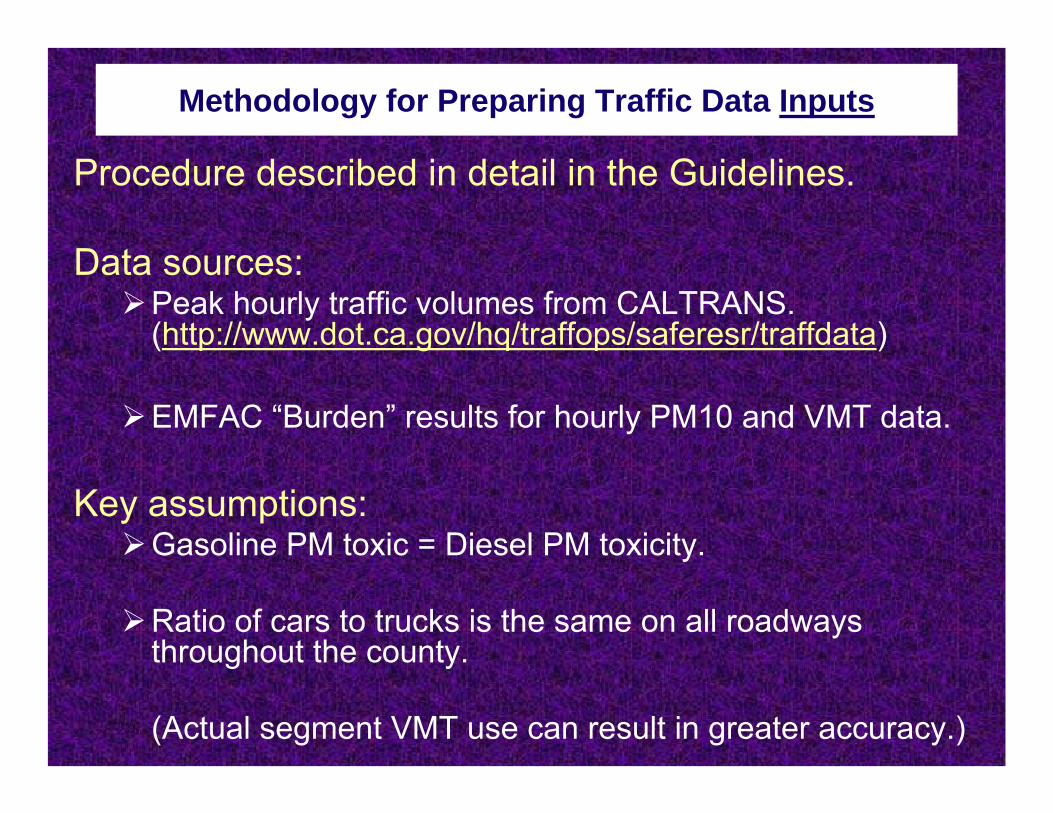
Procedure described in detail in the Guidelines.
Data sources:Peak hourly traffic volumes from CALTRANS. (http://www.dot.ca.gov/hq/traffops/saferesr/traffdata)
EMFAC “Burden” results for hourly PM10 and VMT data.
Key assumptions:Gasoline PM toxic = Diesel PM toxicity.
Ratio of cars to trucks is the same on all roadways throughout the county.
(Actual segment VMT use can result in greater accuracy.)
Methodology for Preparing Traffic Data Inputs

Standard Inputs

Cancer Risk Calculation(Inhalation pathway - Diesel PM)
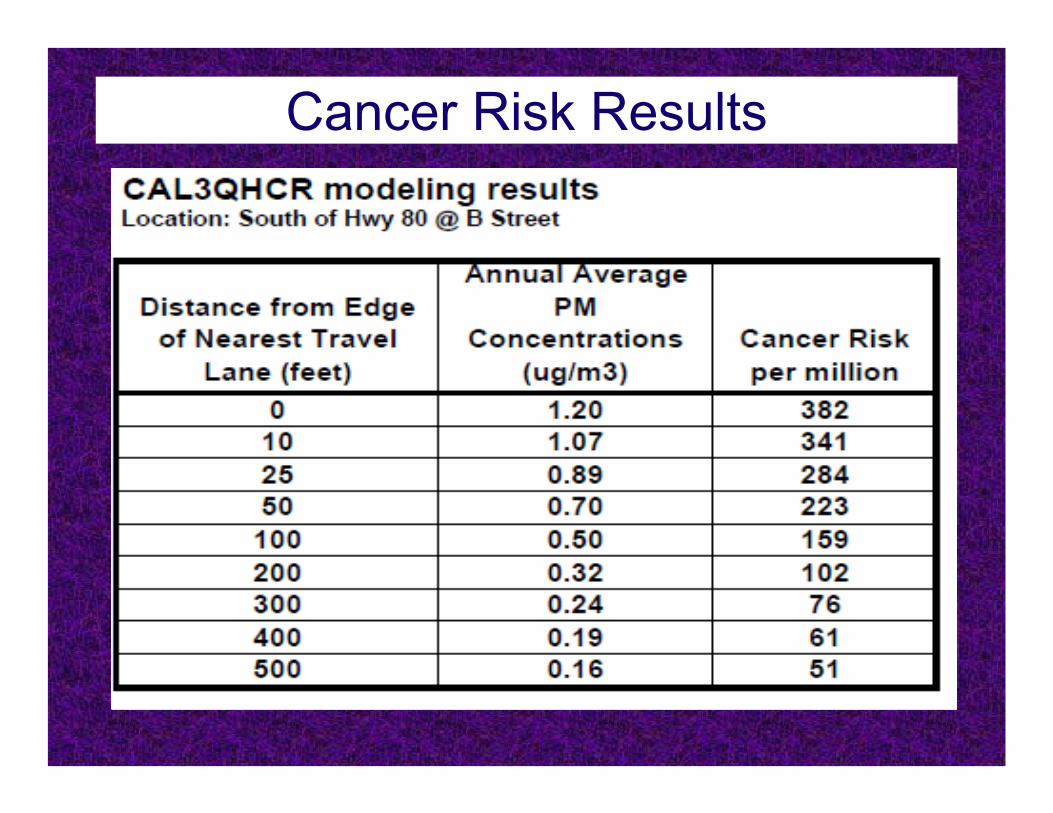
Cancer Risk Results

CAL3QHCR can only be used for modeling roadway segments.
When adding CAL3QHCR Road results to AERMOD Stationary Source results, a separate calculation is needed to determine total risks.
This step is not needed when using AERMOD for Road and Stationary Source results.
Other CAL3QHCR Features

AERMODEPA preferred.More current than ISCST3.Met data not always available.
ISCST3Commonly used.Many met data sets available.
CAL3QHCRCan use ISCST3 met data.Fewer people have experience using model.
Model Comparisons

Roadway modeling scenarios were applied to the AERMOD, ISCST3, & CAL3QHCR model.
The modeling results showed relatively insignificant differences.
Contact district for their model preference.
Comparison of Modeling Results

Discussion