
Health Effects of Air Pollution Associated with Energy Use · Health Effects of Air Pollution...
29
Health Effects of Air Pollution Associated with Energy Use Health Effects of Air Pollution Associated with Energy Use Commission on Sustainable Development United Nations May 2, 2007 Susan Lyon Stone US EPA Office of Air Quality Planning and Standards [email protected] Commission on Sustainable Development United Nations May 2, 2007 Susan Lyon Stone US EPA Office of Air Quality Planning and Standards [email protected]
Transcript of Health Effects of Air Pollution Associated with Energy Use · Health Effects of Air Pollution...

Health Effects of Air Pollution Associated with Energy Use
Health Effects of Air Pollution Associated with Energy Use
Commission on Sustainable DevelopmentUnited Nations May 2, 2007
Susan Lyon StoneUS EPA Office of Air Quality Planning and Standards
Commission on Sustainable DevelopmentUnited Nations May 2, 2007
Susan Lyon StoneUS EPA Office of Air Quality Planning and Standards

Pollutants Associated with Energy Use
• Group of pollutants that are common in the air –many countries set ambient standards for these pollutants
• Ozone and particulate matter, also known as particle pollution, are the two of most concern in the US; these come from many sources
• Carbon monoxide and nitrogen dioxide are common pollutants related to traffic
• Sulfur dioxide comes from burning fuel high in sulfur; can be high around facilities such as electric generating plants or smelters

““Pyramid of EffectsPyramid of Effects””
Proportion of Population AffectedProportion of Population Affected
• Consistent and coherent effects seen across a wide range of health outcomes
• Sensitive groups include:– People with heart or
lung disease– Children and older adults– People who are active
outdoors, such as outdoor workers
Adversity of E
ffects

Human LungHuman Lung
• Air conducting– Trachea– Bronchi– Bronchioles
• Gas exchange– Respiratory
bronchioles– Alveoli
• Air conducting– Trachea– Bronchi– Bronchioles
• Gas exchange– Respiratory
bronchioles– Alveoli

Ozone Irritates AirwaysOzone Irritates AirwaysOzone Irritates Airways
• Symptoms– Cough– Sore or scratchy throat– Pain with deep breath– Fatigue
• Rapid onset• Similar symptoms - people with and
without asthma
• Symptoms– Cough– Sore or scratchy throat– Pain with deep breath– Fatigue
• Rapid onset• Similar symptoms - people with and
without asthma

Ozone Reduces Lung FunctionOzone Reduces Lung FunctionOzone Reduces Lung Function
BASELINEBASELINE 2HR2HR 4HR4HR
FE
V1,
% C
HA
NG
EF
EV
1, %
CH
AN
GE
-60-60
-40-40
-20-20
00
M-10

M-1c

Ozone Causes InflammationOzone Causes InflammationOzone Causes Inflammation
• Ozone reacts completely in surface layer -forms reactive oxygen molecules
• Influx of white blood cells • Damages cells that line the airways• Effect is greater 24 hours after exposure• Increases airway reactivity• Concern about repeated exposures
• Ozone reacts completely in surface layer -forms reactive oxygen molecules
• Influx of white blood cells • Damages cells that line the airways• Effect is greater 24 hours after exposure• Increases airway reactivity• Concern about repeated exposures

Respiratory Hospital Admissions by Daily Maximum Ozone Level, Lagged One Day
Respiratory Hospital Admissions by Respiratory Hospital Admissions by Daily MaximumDaily Maximum Ozone Level, Lagged One Day
114112110108106104102
114112110108106104102
Ozone concentration (ppm)Ozone concentration (ppm)
Res
pira
tory
Adm
issi
ons
Res
pira
tory
Adm
issi
ons
.01 .02 .03 .04 .05 .06 .07 .08 .09 .1.01 .02 .03 .04 .05 .06 .07 .08 .09 .1
D-8a
(Burnett et al, 1994)(Burnett et al, 1994)

California ChildrenCalifornia Children’’s Health Studys Health Study

CHS: Pollutant Correlations (R) CHS: Pollutant Correlations (R) Across CommunitiesAcross Communities
R ~ 0.0, little or no correlation
R > 0.0, positive correlation (max is 1.0)
R < 0.0, negative correlation (min is -1.0)
R ~ 0.0, little or no correlation
R > 0.0, positive correlation (max is 1.0)
R < 0.0, negative correlation (min is -1.0)

Ozone Effects in ChildrenOzone Effects in Children• CHS: 20 ppb increase in O3 associated with an 83%
increase in school absences for acute respiratory disease (Gilliland et al., 2001)
• Mortimer et al. 2002: NCICAS – lung function and symptoms in > 800 children, 8 urban areas– Incidence of ≥ 10% decrements in morning PEF associated with 30
ppb increase in 8-hr average O3
– Morning symptoms (chest tightness, wheeze, shortness of breath)
associated with 30 ppb increase in 8-hr average O3
• Gent et al. 2003: diary study of symptoms in > 250 asthmatic children in New England– 50 ppb increase in 1-hr ozone level increased likelihood of
wheeze (by 35%) and chest tightness (by 47%)
• CHS: 20 ppb increase in O3 associated with an 83% increase in school absences for acute respiratory disease (Gilliland et al., 2001)
• Mortimer et al. 2002: NCICAS – lung function and symptoms in > 800 children, 8 urban areas– Incidence of ≥ 10% decrements in morning PEF associated with 30
ppb increase in 8-hr average O3
– Morning symptoms (chest tightness, wheeze, shortness of breath)
associated with 30 ppb increase in 8-hr average O3
• Gent et al. 2003: diary study of symptoms in > 250 asthmatic children in New England– 50 ppb increase in 1-hr ozone level increased likelihood of
wheeze (by 35%) and chest tightness (by 47%)

CHS: Ozone and NewCHS: Ozone and New--onset Asthmaonset Asthma
McConnell et al., 2002McConnell et al., 2002

Air Pollution DisastersAir Pollution Disasters
London buses are escorted by lantern at 10:30 in the morning.London buses are escorted by lantern at 10:30 in the morning.
Donora, PA at noon on Oct. 29, 1948Donora, PA at noon on Oct. 29, 1948
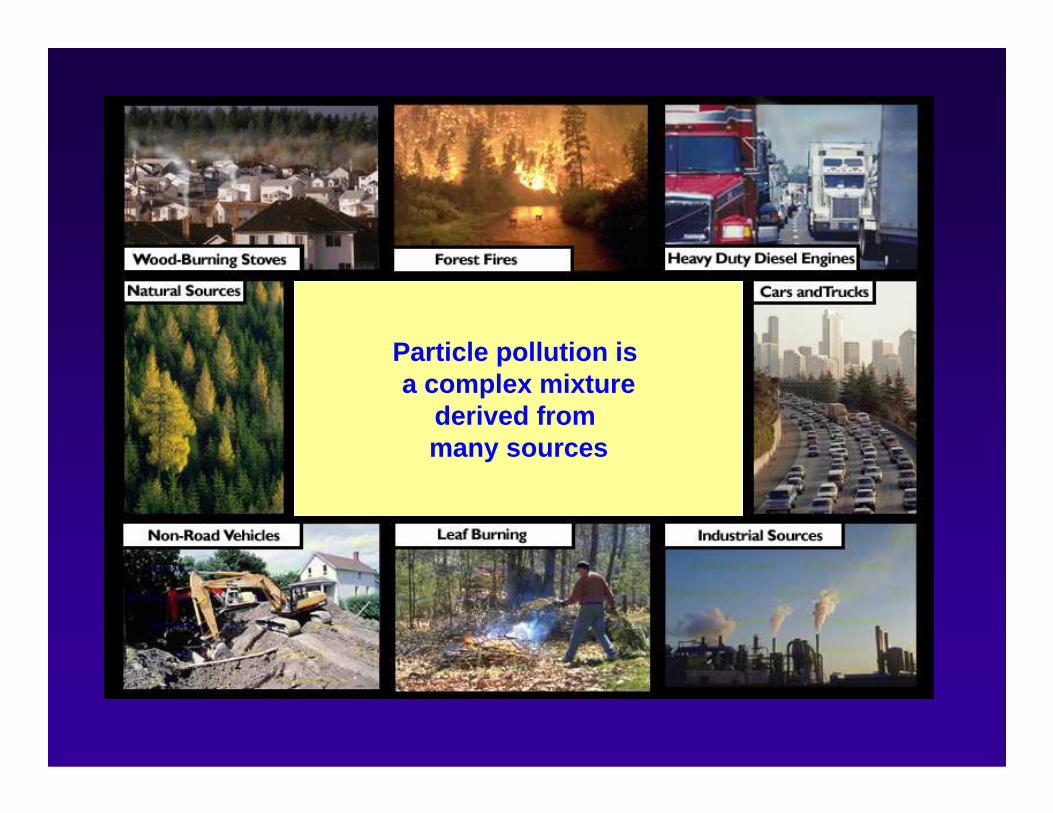
Particle pollution is a complex mixture
derived from many sources
Particle pollution is a complex mixture
derived from many sources

Particle DepositionParticle Deposition
• Larger particles (> PM10) deposit in the upper respiratory tract
• Inhalable particles (< PM10) penetrate into lungs
• Larger particles (> PM10) deposit in the upper respiratory tract
• Inhalable particles (< PM10) penetrate into lungs
• Some particles (e.g., less than 0.1 um) may enter bloodstream
• Particles may react, accumulate, be cleared or absorbed
• Some particles (e.g., less than 0.1 um) may enter bloodstream
• Particles may react, accumulate, be cleared or absorbed
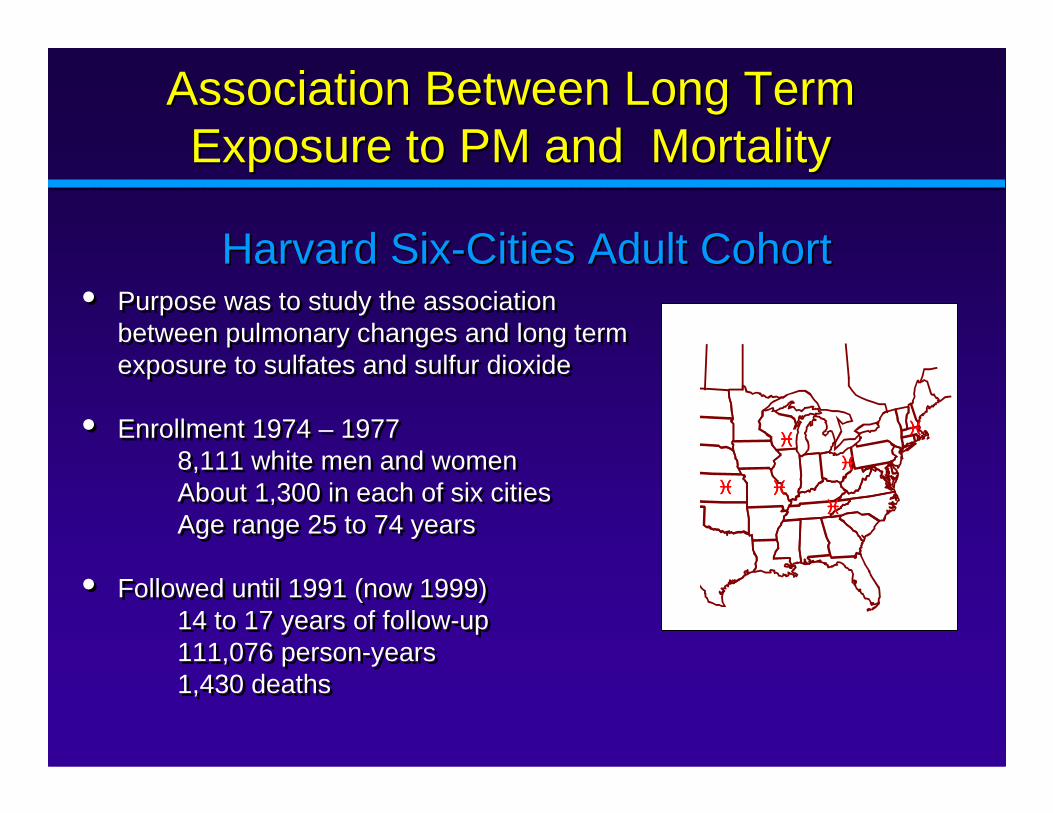
Association Between Long Term Association Between Long Term Exposure to PM and MortalityExposure to PM and Mortality
Harvard SixHarvard Six--Cities Adult CohortCities Adult Cohort
����
��������
����
����
����
• Purpose was to study the association between pulmonary changes and long term exposure to sulfates and sulfur dioxide
• Enrollment 1974 – 19778,111 white men and women About 1,300 in each of six citiesAge range 25 to 74 years
• Followed until 1991 (now 1999)14 to 17 years of follow-up111,076 person-years1,430 deaths
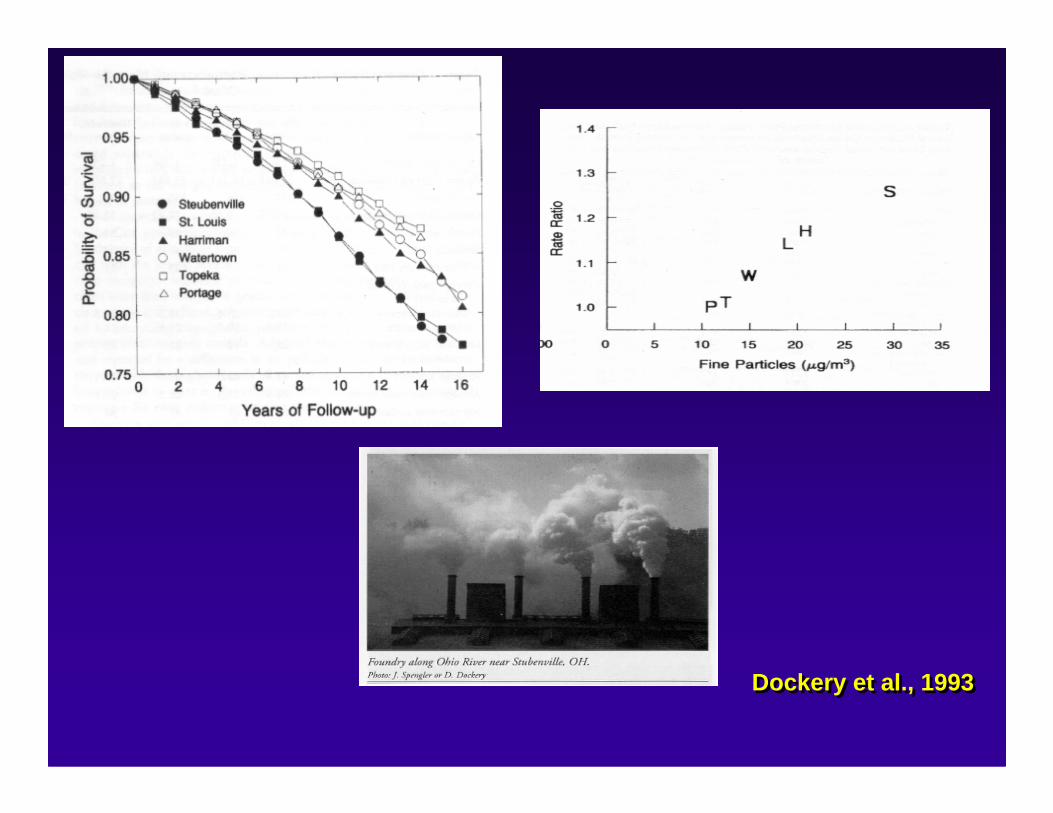
Dockery et al., 1993Dockery et al., 1993

Particle Pollution Affects the LungsParticle Pollution Affects the Lungs
You are exposed to particle pollution simply by breathing polluted air.
Exposure increases when you exercise, because you breathe more vigorously and deeply than usual.
Respiratory effects include:
• Airway irritation• Cough• Phlegm• Decreased lung function• Airway inflammation• Asthma attacks• Bronchitis• Chronic bronchitis

And ParticleAnd Particle Pollution Affects the HeartPollution Affects the Heart
Particle pollution has been linked to changes that indicate your heart isn’t as healthy as it should be. Those include:
• Arrhythmias and changes in heart rate.
• Changes in the variability of your heart rate.
• Blood component changes
•C-reactive protein
•Fibrinogen
•Plasma viscosity
•Some studies indicate that particle exposure may cause heart attacks . And particles are linked with death from heart disease.
Particle exposure has been linked to heart attacks.

ItIt’’s a Public Health Concerns a Public Health Concern
• When particles aggravate heart and lung diseases that means increases in:
� Hospital admissions � Doctor and emergency room visits � Medication use� Absences from work or school
• Particulate matter is linked to significant public health risks – including premature death from heart and lung disease.
• Sensitive groups include: people with heart or lung disease, older adults, children

PM Can Cause Effects in Healthy PeoplePM Can Cause Effects in Healthy People
*
*
SDNN PNN50 LF HF Total Ratio0
1
2
3
4Air
CAPS
Rat
io C
AP
S /
Pre
**
*
2.9 47.2 107.8 206.70
50
100
150
PM
Ns
(x10
,000
)
Average CAPS Concentration ( µµµµ/m3)
Devlin et al., 2003Devlin et al., 2003Ghio et al., 2003Ghio et al., 2003
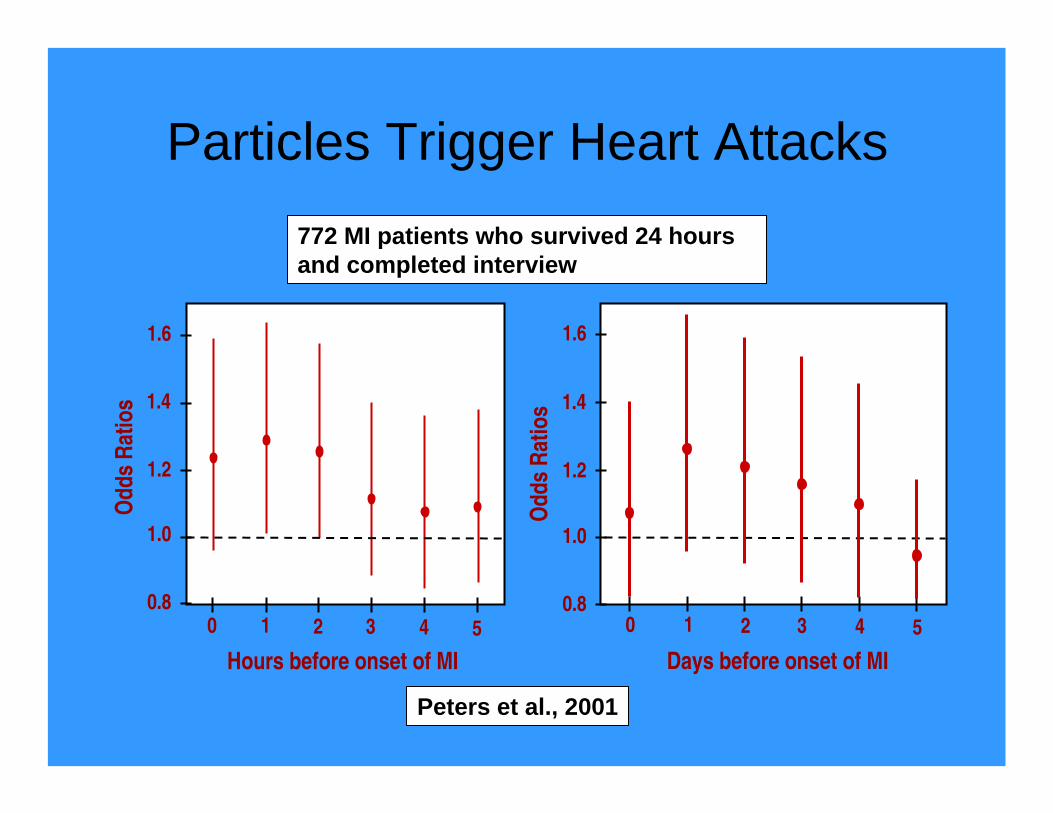
Particles Trigger Heart AttacksO
dd
s R
atio
s
Hours before onset of MI
0 1 2 3 4 5
1.6
1.4
1.2
1.0
0.8
Days before onset of MI
0 1 2 3 4 5
1.6
1.4
1.2
1.0
0.8
Od
ds
Rat
ios
Peters et al., 2001
772 MI patients who survived 24 hours and completed interview

CHS: Low FEVCHS: Low FEV11 at Age 18 vs. at Age 18 vs. PollutionPollution
GaudermanGauderman et al., 2004et al., 2004

CHS: Lung Function Growth in CHS: Lung Function Growth in MoversMovers
Avol et al., 2001Avol et al., 2001

CHS: PMCHS: PM1010 and Bronchitis in and Bronchitis in Asthmatic ChildrenAsthmatic Children
McConnell et al., 1999McConnell et al., 1999
Traffic ExposuresTraffic Exposures
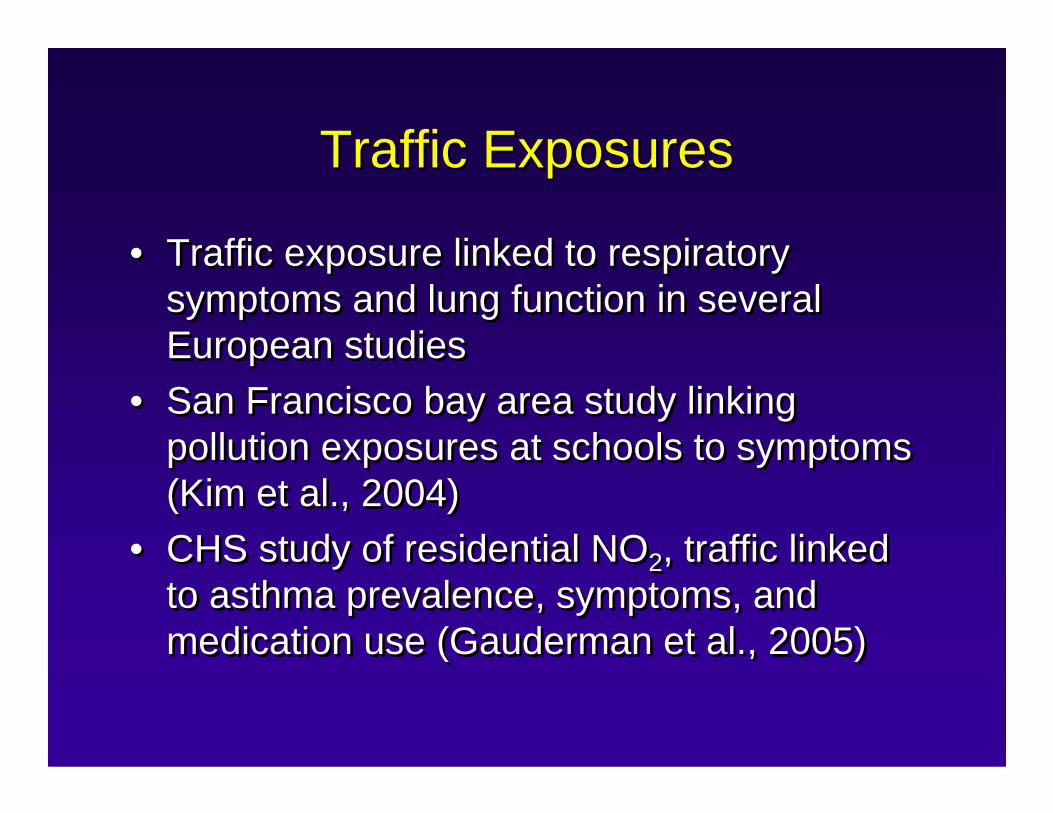
• Traffic exposure linked to respiratory symptoms and lung function in several European studies
• San Francisco bay area study linking pollution exposures at schools to symptoms (Kim et al., 2004)
• CHS study of residential NO2, traffic linked to asthma prevalence, symptoms, and medication use (Gauderman et al., 2005)
SO2 EffectsSO2 Effects
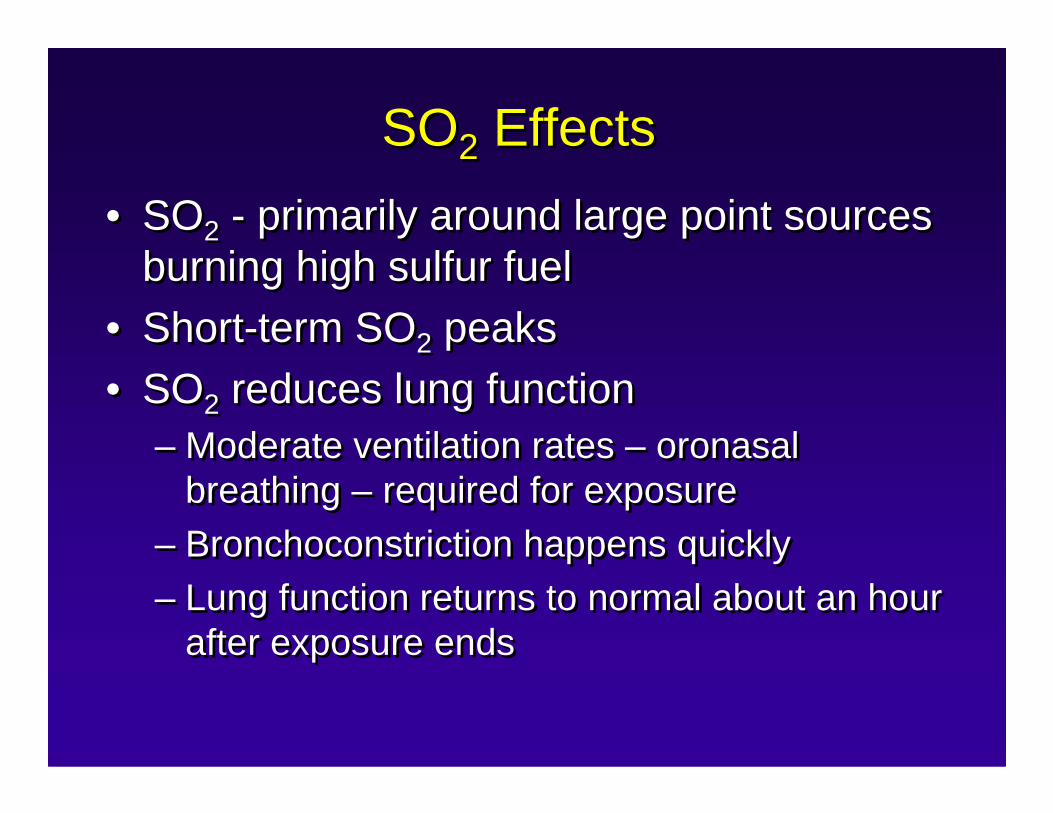
• SO2 - primarily around large point sources burning high sulfur fuel
• Short-term SO2 peaks • SO2 reduces lung function
– Moderate ventilation rates – oronasalbreathing – required for exposure
– Bronchoconstriction happens quickly– Lung function returns to normal about an hour
after exposure ends
• SO2 - primarily around large point sources burning high sulfur fuel
• Short-term SO2 peaks • SO2 reduces lung function
– Moderate ventilation rates – oronasalbreathing – required for exposure
– Bronchoconstriction happens quickly– Lung function returns to normal about an hour
after exposure ends
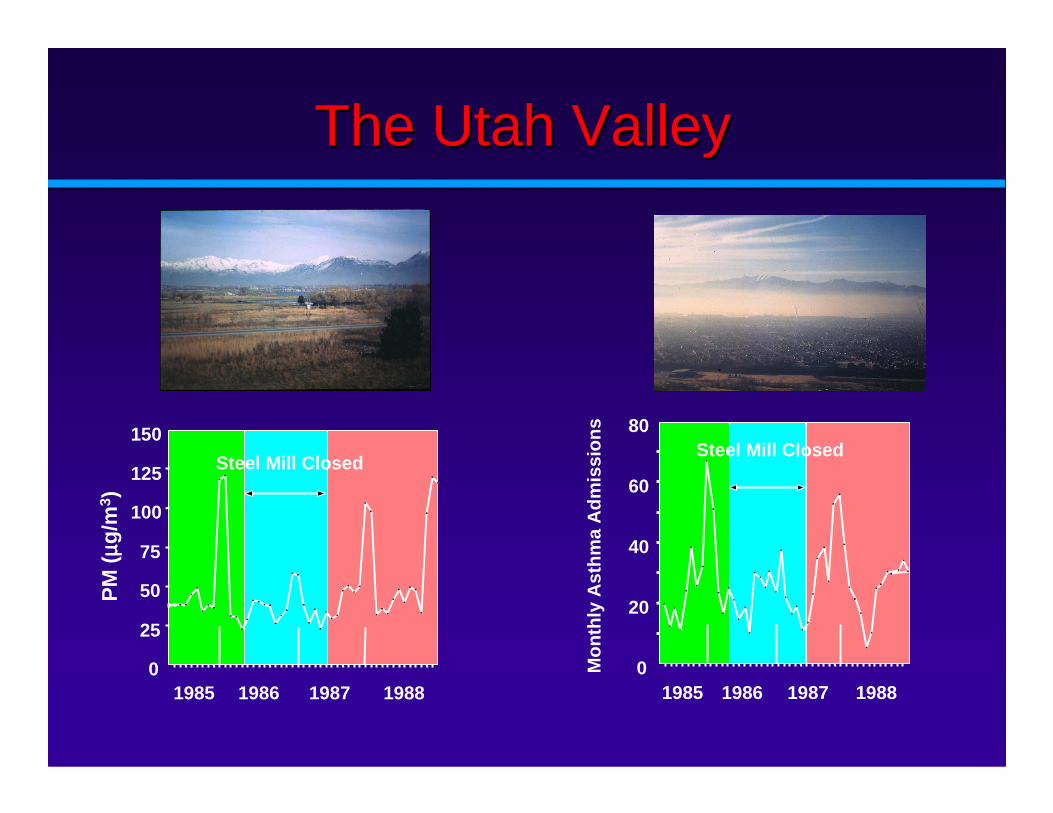
The Utah ValleyThe Utah Valley
0
25
50
75
100
125
150
1985 1986 1987 1988
Steel Mill Closed
PM
(µµ µµg
/m3 )
0
20
40
60
80
1985 1986 1987 1988
Steel Mill Closed
Mon
thly
Ast
hma
Adm
issi
ons


![Exposure to air pollution and self-reported effects on ......the effects of air pollution [14, 15]. Higher temperatures and air pollution are also associated with low mood and potency](https://static.fdocuments.us/doc/165x107/5f67a6c90977792cf3121a80/exposure-to-air-pollution-and-self-reported-effects-on-the-effects-of-air.jpg)


