HBA Statewide Policy Positions
15
1 STATEWIDE POLICY POSITIONS HOME BUILDERS ASSOCIATION OF NORTHERN KENTUCKY 1) Positions at a Glance ………………………………….. p. 2 2) The Kentucky Economy………………………….......... pp. 3-7 a) Jobs……………………………………………… p. 3 b) Education……………………………………….. p. 5 c) Population and Households…………………….. p. 6 d) Household Income………………………………. p. 7 e) Government Actions…………………………….. p. 7-8 2) Government Accountability……….…………………… p. 9 3) Land Ownership and Private Property Rights….……… p. 10 4) Workforce Development……………………………….. p. 11 5) Stormwater and Sanitary Sewer Regulations…………… p. 12 6) Construction Finance……………………………………. p. 13 7) Transportation Projects………………………………….. p. 14 8) The Cost of Doing Business in Northern Kentucky…….. p. 14 9) Limited Liability Entity Tax..…………………………… p. 15 10) Worker’s Compensation…………………………………. p. 15 11) Roofer Licensure………………………………………… p.15 12) Funding KYNECT………………………………………… p.15 Compiled by Home Builders Association of Northern Kentucky State & Local Government Committee
-
Upload
home-builders-association-of-northern-kentucky -
Category
Documents
-
view
226 -
download
0
description
The Home Builders Association of Northern Kentucky drafted a policy position statement as approved by their Board of Directors for the 2014 Kentucky General Assembly.
Transcript of HBA Statewide Policy Positions

1
STATEWIDE POLICY POSITIONS
HOME BUILDERS ASSOCIATION OF
NORTHERN KENTUCKY
1) Positions at a Glance ………………………………….. p. 2
2) The Kentucky Economy………………………….......... pp. 3-7
a) Jobs……………………………………………… p. 3
b) Education……………………………………….. p. 5
c) Population and Households…………………….. p. 6
d) Household Income………………………………. p. 7
e) Government Actions…………………………….. p. 7-8
2) Government Accountability……….…………………… p. 9
3) Land Ownership and Private Property Rights….……… p. 10
4) Workforce Development……………………………….. p. 11
5) Stormwater and Sanitary Sewer Regulations…………… p. 12
6) Construction Finance……………………………………. p. 13
7) Transportation Projects………………………………….. p. 14
8) The Cost of Doing Business in Northern Kentucky…….. p. 14
9) Limited Liability Entity Tax..…………………………… p. 15
10) Worker’s Compensation…………………………………. p. 15
11) Roofer Licensure………………………………………… p.15
12) Funding KYNECT………………………………………… p.15
Compiled by Home Builders Association of Northern Kentucky
State & Local Government Committee
2
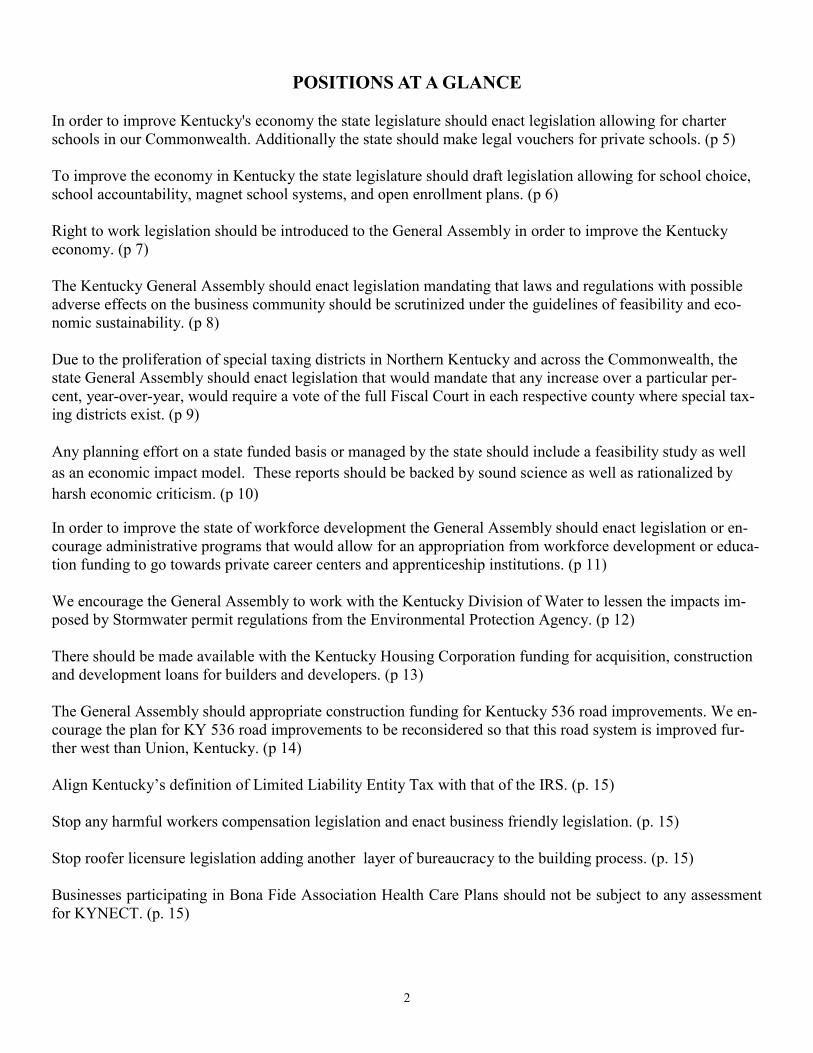
POSITIONS AT A GLANCE
In order to improve Kentucky's economy the state legislature should enact legislation allowing for charter
schools in our Commonwealth. Additionally the state should make legal vouchers for private schools. (p 5)
To improve the economy in Kentucky the state legislature should draft legislation allowing for school choice,
school accountability, magnet school systems, and open enrollment plans. (p 6)
Right to work legislation should be introduced to the General Assembly in order to improve the Kentucky
economy. (p 7)
The Kentucky General Assembly should enact legislation mandating that laws and regulations with possible
adverse effects on the business community should be scrutinized under the guidelines of feasibility and eco-
nomic sustainability. (p 8)
Due to the proliferation of special taxing districts in Northern Kentucky and across the Commonwealth, the
state General Assembly should enact legislation that would mandate that any increase over a particular per-
cent, year-over-year, would require a vote of the full Fiscal Court in each respective county where special tax-
ing districts exist. (p 9)
Any planning effort on a state funded basis or managed by the state should include a feasibility study as well
as an economic impact model. These reports should be backed by sound science as well as rationalized by
harsh economic criticism. (p 10)
In order to improve the state of workforce development the General Assembly should enact legislation or en-
courage administrative programs that would allow for an appropriation from workforce development or educa-
tion funding to go towards private career centers and apprenticeship institutions. (p 11)
We encourage the General Assembly to work with the Kentucky Division of Water to lessen the impacts im-
posed by Stormwater permit regulations from the Environmental Protection Agency. (p 12)
There should be made available with the Kentucky Housing Corporation funding for acquisition, construction
and development loans for builders and developers. (p 13)
The General Assembly should appropriate construction funding for Kentucky 536 road improvements. We en-
courage the plan for KY 536 road improvements to be reconsidered so that this road system is improved fur-
ther west than Union, Kentucky. (p 14)
Align Kentucky’s definition of Limited Liability Entity Tax with that of the IRS. (p. 15)
Stop any harmful workers compensation legislation and enact business friendly legislation. (p. 15)
Stop roofer licensure legislation adding another layer of bureaucracy to the building process. (p. 15)
Businesses participating in Bona Fide Association Health Care Plans should not be subject to any assessment
for KYNECT. (p. 15)
3
The Kentucky Economy
The market for homebuilding and remodeling depends on healthy economic components such as:
1. Employment
2. Quality educational opportunities.
3. Population and household growth.
4. Income growth.
5. Government actions that affect the ability of people to afford new homes and remodeling.
This study of Kentucky’s economy compares the above market components to the nation and selected neighboring states.
.
JOBS
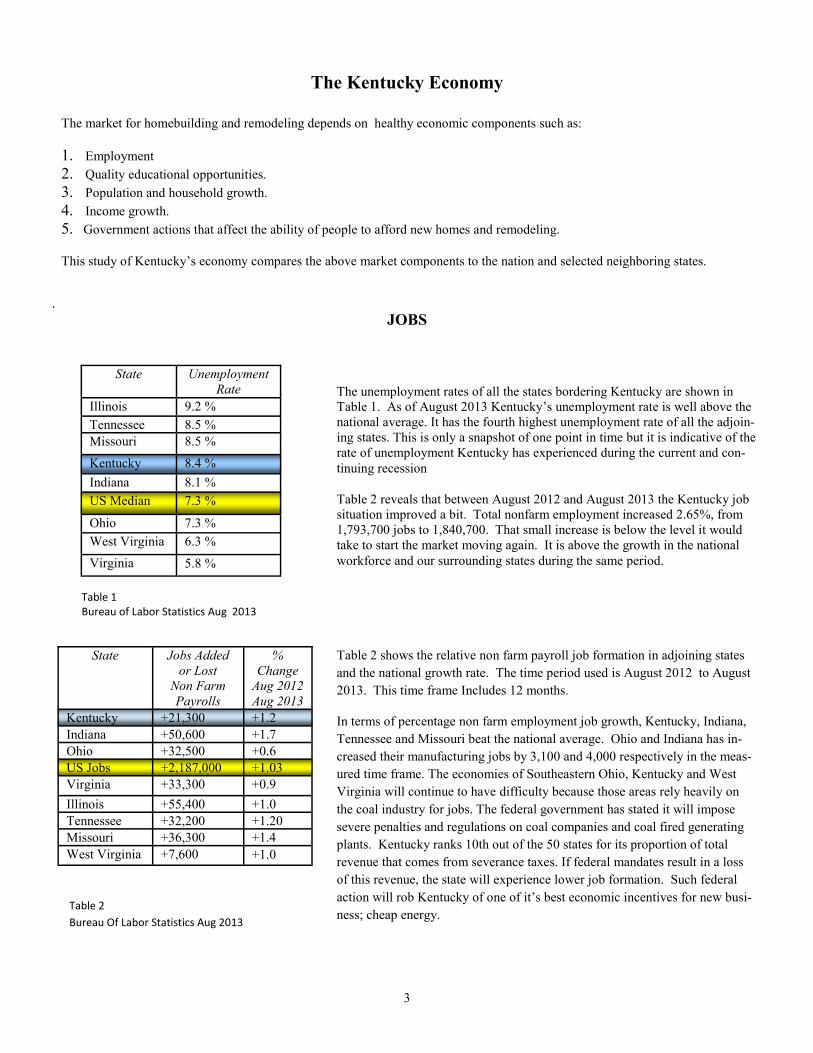
The unemployment rates of all the states bordering Kentucky are shown in
Table 1. As of August 2013 Kentucky’s unemployment rate is well above the
national average. It has the fourth highest unemployment rate of all the adjoin-
ing states. This is only a snapshot of one point in time but it is indicative of the
rate of unemployment Kentucky has experienced during the current and con-
tinuing recession
Table 2 reveals that between August 2012 and August 2013 the Kentucky job
situation improved a bit. Total nonfarm employment increased 2.65%, from
1,793,700 jobs to 1,840,700. That small increase is below the level it would
take to start the market moving again. It is above the growth in the national
workforce and our surrounding states during the same period.
State Unemployment
Rate
Illinois 9.2 %
Tennessee 8.5 %
Missouri 8.5 %
Kentucky 8.4 %
Indiana 8.1 %
US Median 7.3 %
Ohio 7.3 %
West Virginia 6.3 %
Virginia 5.8 %
Table 1 Bureau of Labor Statistics Aug 2013
Table 2 shows the relative non farm payroll job formation in adjoining states
and the national growth rate. The time period used is August 2012 to August
2013. This time frame Includes 12 months.
In terms of percentage non farm employment job growth, Kentucky, Indiana,
Tennessee and Missouri beat the national average. Ohio and Indiana has in-
creased their manufacturing jobs by 3,100 and 4,000 respectively in the meas-
ured time frame. The economies of Southeastern Ohio, Kentucky and West
Virginia will continue to have difficulty because those areas rely heavily on
the coal industry for jobs. The federal government has stated it will impose
severe penalties and regulations on coal companies and coal fired generating
plants. Kentucky ranks 10th out of the 50 states for its proportion of total
revenue that comes from severance taxes. If federal mandates result in a loss
of this revenue, the state will experience lower job formation. Such federal
action will rob Kentucky of one of it’s best economic incentives for new busi-
ness; cheap energy.
State Jobs Added
or Lost
Non Farm
Payrolls
%
Change
Aug 2012
Aug 2013
Kentucky +21,300 +1.2
Indiana +50,600 +1.7
Ohio +32,500 +0.6
US Jobs +2,187,000 +1.03
Virginia +33,300 +0.9
Illinois +55,400 +1.0
Tennessee +32,200 +1.20
Missouri +36,300 +1.4
West Virginia +7,600 +1.0
Table 2
Bureau Of Labor Statistics Aug 2013

4
A comparison of Kentucky, Ohio and Indiana is
worthwhile because these three states compose an
economic area that both competes and cooperates.
Northern Kentucky is a part of the Cincinnati and
Southeast Indiana market place. What happens in
one of those areas effects the others. Table 3 dis-
plays the jobs change by job sector for the 12
months from August 2012 to August 2013.
Before comparing OH, KY and IN, the disparity in
population needs to be addressed. Note that Ken-
tucky’s population is about 40% of Ohio’s and 70%
of Indiana’s. Table 4 presents a better comparison
of growth because it measures the job changes per
1,000,000 people.
JOBS (Continued)
Employment Change by Job Sector August 2012-August 2013
Population 4.38
million
11.54
million
6.537
million
Job Sector Kentucky Ohio Indiana
Professional and Business Services 4,700 9,900 6,400
Trade, Transportation and Utilities 8,000 12,200 27,000
Leisure and Hospitality 12,600 7,400 9.300
Manufacturing -1,300 3,100 4,000
Education and Health Services 2,000 13,100 7,800
Government -1,200 -7,300 8,400
Financial Activities 1,800 400 3,300
Construction 1,500 -6,100 -10,100
Table 3 Bureau Of Labor Statistics
The chart points out the strengths and weaknesses of
each state’s economy. Notably, Kentucky has the
only improving construction environment of the
three, gaining 1,500 jobs during the year while Indi-
ana and Ohio have lost jobs in this sector. Ken-
tucky’s Professional and Business service sector
grew the fastest, Trade Transportation and Utilities
was second while Leisure and Hospitality came in
first. This shows the difference between Kentucky
versus Ohio and Indiana. Ohio’s top three sectors
are Education and Health Services, Trade Trans-
portation and Government. Indiana’s top three are
Trade transportation and Utilities, Education and
Health Services followed by Professional and Busi-
ness Services
Employment Change by Job Sector August 2012-August 2013
Per 1,000,000 population
Population 4.38
million
11.54
million
6.537
million
Job Sector Kentucky Ohio Indiana
Professional and Business Services 1,076 868 982
Trade, Transportation and Utilities 1,831 1,070 4,141
Leisure and Hospitality 2,883 649 1
Manufacturing -297 272 613
Education and Health Services 458 1,149 1,196
Government -275 -640 1,288
Financial Activities 412 35 506
Construction 343 -535 -1,549
Table 4 Bureau Of Labor Statistics
Employment Summary
According to the U.S. Department of Labor, the bottom of Kentucky’s employment happened in 2009. It mirrored the national drop
in employment. When national employment started to improve in 2010, Kentucky’s job growth continued to mirror the national
growth rate, with some monthly variations. Kentucky’s 2011-2013 job growth rate exceeded the national average. It is expected to
continue the trend through 2015. It will be the first time Kentucky’s employment growth out performed the national average since
the years between 1991 to 1995. Kentucky’s job growth rate should outperform Ohio’s and Indiana’s.
5
EDUCATION
Position: In order to improve Kentucky's economy the state legislature should enact legislation allowing
for charter schools in our Commonwealth. Additionally the state should make legal vouchers for private
schools.
In order for a state to have a good economy it needs to train its students in the skills needed to gain a job and advance. That is the
job of the state’s education establishment. Many jobs require a high level of technical expertise. Students need to learn math, sci-
ence, reading comprehension, technical vocational subjects, and advanced courses tailored to the individual student’s capabilities.
The modern job market requires a high level of education in order to succeed. When companies are looking to relocate or start new
businesses one of the main things they require is a pool of educated individuals from which to select their new employees. A state
with an effective school system will attract those new businesses.
The U.S. Department of Education does not rank the states on educational achievement. There are organizations that do rank the
states in terms of results. Those organizations are usually ones that focus on education issues and are not dependent on the educa-
tional establishment.
One of the best ranking systems is the annual American Legislative Exchange Council’s (ALEC) annual “Report Card on American
Education”. The report is free to download at www.alec.org. The report has extensive data ranking all states on K-12 education. It
ranks all states in educational progress, performance and reform. ALEC is a conservative organization. As such, it is interested in
results not in effort. ALEC was established as a resource for state legislators and employees interested in change for the better
within their state. It is a “think tank” of ideas that are purported to work. Their annual report uses information from the U.S. Depart-
ment of Education’s “National Assessment of Educational Progress” report. ALEC combs through all the data in the National As-
sessment of Educational Progress - National Center for national assessment report and puts the information together in a simple,
understandable format. That is the information that was used for this report section. This section will deal with only rankings of
Kentucky, Ohio and Indiana.
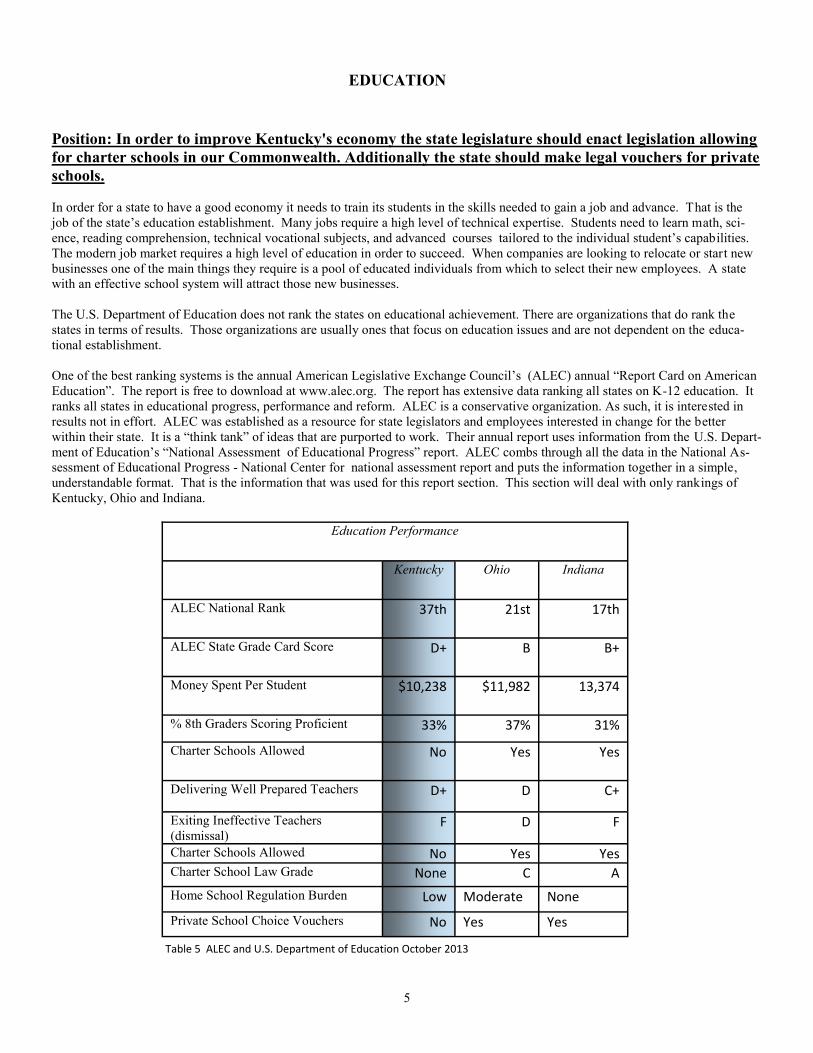
Education Performance
Kentucky Ohio Indiana
ALEC National Rank 37th 21st 17th
ALEC State Grade Card Score D+ B B+
Money Spent Per Student $10,238 $11,982 13,374
% 8th Graders Scoring Proficient 33% 37% 31%
Charter Schools Allowed No Yes Yes
Delivering Well Prepared Teachers D+ D C+
Exiting Ineffective Teachers
(dismissal) F D F
Charter Schools Allowed No Yes Yes Charter School Law Grade None C A
Home School Regulation Burden Low Moderate None
Private School Choice Vouchers No Yes Yes
Table 5 ALEC and U.S. Department of Education October 2013

6
EDUCATION (Continued)
Position: To improve the economy in Kentucky the state legislature should draft legislation allowing for
school choice, school accountability, magnet school systems, and open enrollment plans.
Education Summary
In 2012, the governor’s office issued a press release announcing that Kentucky had jumped 20 spots in national rankings from 34th
to 14th in just one year as measured by “Education Week”. The truth is Kentucky education is a mixed bag. There have been some
improvements but they are minor. As Table 5 clearly shows, Kentucky is ranked lowest of the three states on education performance.
According to ALEC, it has lowered the state academic standards. There is some evidence that achievement tests are not accurate.
Despite what the education community claims, there is little evidence of improvement in academic standards and performance in
Kentucky. Kentucky’s approach to education leaves little room for competition. Home schooling is legal but charter schools are
not. The state offers no vouchers for private schools. Education is in the hands of the teachers union and bureaucrats. There is a
reluctance for change. When asked why Kentucky has no charter schools, the former state Education Commissioner, lifelong
teacher, state legislator and school administrator answered “Because charter schools are unfair to regular schools.” No mention was
made about the children who would benefit from charter schools. His only concern was for the schools not the students. That state-
ment about sums up the state of education in Kentucky.
While Kentucky follows the status quo, Indiana and Ohio are reforming their systems. In addition to charter schools, they have im-
plemented public school choice, new standards and accountability, magnet schools, open enrollment plans that allow low-income
city kids to attend suburban public schools and participate in various curriculum-based experiments and private school vouchers.
This puts Kentucky at a competitive disadvantage for attracting new businesses.
POPULATION AND HOUSEHOLDS
Population
Kentucky Ohio Indiana
2013 Population Estimate 4.38 million 11.54 million 6.537 mil-
lion
2012 Population Estimate 4,380,415 11,544,225 6,537,334
2000 Actual Population 4,041,769 11,353,140 6,080,485
Change 338,646 191,085 456,849
% Change 8.38% 1.68% 7.51%
Table 6 U.S. Census
During the years between 2000 and 2013,
Kentucky had the highest growth rate while
Indiana had the highest actual growth. The
actual national growth rate for that same pe-
riod was 9.7 percent. Kentucky, Ohio and
Indiana had a lower population growth than
the national average.
Throughout the last decade, Kentucky gained
households at a higher rate than did Ohio and
even with Indiana. While they added more
households than Kentucky, Ohio’s rate of
growth was lower. The number and rate of
household growth, by definition, mirrors the
growth of housing. Those states that have a
high rate of household growth have a faster
rate of housing stock growth.
Households
Kentucky Ohio Indiana
2011 Actual Households 1,681,085 4,554,007 2,472,870
2010 Actual Households 1,719,965 4,603,435 2,502,154
2000 Actual Households 1,590,647 4,445,773 2,336,306
Change 90,438 108,234 136,564
% Change 2000-2011 6% 2% 6%
Table 7 U.S. Census
7
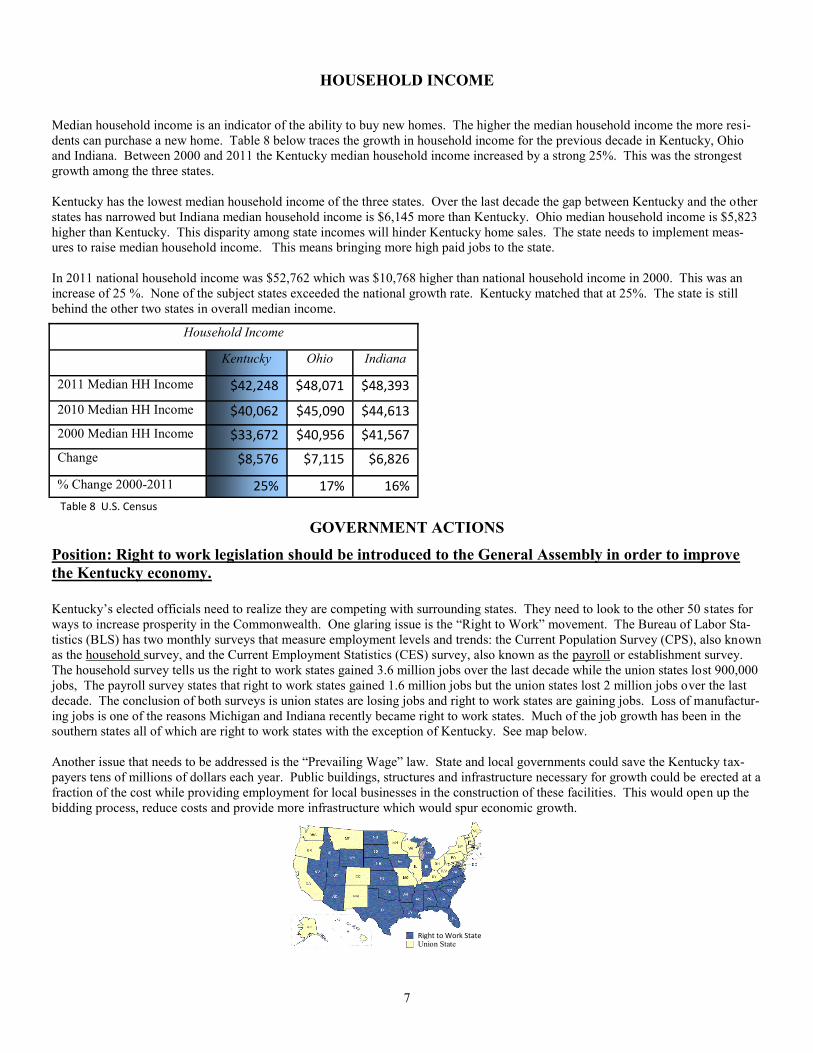
HOUSEHOLD INCOME
Median household income is an indicator of the ability to buy new homes. The higher the median household income the more resi-
dents can purchase a new home. Table 8 below traces the growth in household income for the previous decade in Kentucky, Ohio
and Indiana. Between 2000 and 2011 the Kentucky median household income increased by a strong 25%. This was the strongest
growth among the three states.
Kentucky has the lowest median household income of the three states. Over the last decade the gap between Kentucky and the other
states has narrowed but Indiana median household income is $6,145 more than Kentucky. Ohio median household income is $5,823
higher than Kentucky. This disparity among state incomes will hinder Kentucky home sales. The state needs to implement meas-
ures to raise median household income. This means bringing more high paid jobs to the state.
In 2011 national household income was $52,762 which was $10,768 higher than national household income in 2000. This was an
increase of 25 %. None of the subject states exceeded the national growth rate. Kentucky matched that at 25%. The state is still
behind the other two states in overall median income.
Household Income
Kentucky Ohio Indiana
2011 Median HH Income $42,248 $48,071 $48,393
2010 Median HH Income $40,062 $45,090 $44,613
2000 Median HH Income $33,672 $40,956 $41,567
Change $8,576 $7,115 $6,826
% Change 2000-2011 25% 17% 16%
Table 8 U.S. Census
GOVERNMENT ACTIONS
Position: Right to work legislation should be introduced to the General Assembly in order to improve
the Kentucky economy.
Kentucky’s elected officials need to realize they are competing with surrounding states. They need to look to the other 50 states for
ways to increase prosperity in the Commonwealth. One glaring issue is the “Right to Work” movement. The Bureau of Labor Sta-
tistics (BLS) has two monthly surveys that measure employment levels and trends: the Current Population Survey (CPS), also known
as the household survey, and the Current Employment Statistics (CES) survey, also known as the payroll or establishment survey.
The household survey tells us the right to work states gained 3.6 million jobs over the last decade while the union states lost 900,000
jobs, The payroll survey states that right to work states gained 1.6 million jobs but the union states lost 2 million jobs over the last
decade. The conclusion of both surveys is union states are losing jobs and right to work states are gaining jobs. Loss of manufactur-
ing jobs is one of the reasons Michigan and Indiana recently became right to work states. Much of the job growth has been in the
southern states all of which are right to work states with the exception of Kentucky. See map below.
Another issue that needs to be addressed is the “Prevailing Wage” law. State and local governments could save the Kentucky tax-
payers tens of millions of dollars each year. Public buildings, structures and infrastructure necessary for growth could be erected at a
fraction of the cost while providing employment for local businesses in the construction of these facilities. This would open up the
bidding process, reduce costs and provide more infrastructure which would spur economic growth.
Right to Work State Union State

8
Position: The Kentucky General Assembly should enact legislation mandating that laws and regulations
with possible adverse effects on the business community should be scrutinized under the guidelines of
feasibility and economic sustainability.
Education in Kentucky needs serious reform. Other states are implementing reforms that are lowering the cost of education and im-
proving the results. States are now grading schools on the A thru F report card system. Some are hiring private companies for
schools with a five-year or longer record of academic failures. Charter schools are improving academic performance for students.
Some allow parents to create charter schools for poorly performing district schools. Some reformers are implementing digital learn-
ing and eliminating the cap on the number of students that can attend. School vouchers would empower poor families to send their
kids to private schools if their students are trapped in bad public schools. All of this creates competition between private and public
schools which raises academic achievement in all schools. These are just some of the ways states are fighting the educational bu-
reaucracies across the nation. Kentucky has implemented none of these reforms.
Kentucky’s tax system is very inefficient and counter productive. It is modeled after the federal tax system. Many states have sim-
plified their tax system so taxes can be paid on a one or two page return. Kentucky has a very regressive tax system.
Each year a number of bills are introduced and passed in the legislature. Many of those bills have adverse effects on business and
job creation. The legislature should devise a procedure to consider the costs and benefits to business for any new legislation that has
some effect on business and jobs.
GOVERNMENT ACTIONS (Continued)

9
GOVERNMENT ACCOUNTABILITY
Position: Due to the proliferation of special taxing districts in Northern Kentucky and across the Com-
monwealth, the state General Assembly should enact legislation that would mandate that any increase
over a particular percent, year-over-year, would require a vote of the full Fiscal Court in each respec-
tive county where special taxing districts exist.
Each and every government agency should be accountable to the public which it was established to serve. This includes not wast-
ing tax funds paid by the citizens, and not introducing unreasonable and overbearing regulations. It includes all of the special dis-
tricts which have been established. Some of the independent taxing authorities need to be eliminated or reformed. According to the
State Auditor’s office there are over 1,200 special taxing districts in Kentucky. They account for $2.6 billion in taxes annually. This
is a layer of government taxation that has very little taxpayer control. The controlling boards are not elected by the people to serve
on those boards. They have the power to raise taxes without the vote of the people as long as the tax increase does not exceed 4% per
year. If a district imposes a 4% tax per year that represents about a 50% tax hike over 10 years. A list of these authorities follows.
Sometimes the taxes are higher than the government agency which established the district. However the voting process or appoint-
ment process for board members to these districts is political, secretive, confusing, and sometimes all of the above. If any special
district is created, have the board or trustee members be selected by voters rather than the current process. The budgets for each of
these special districts should be made readily available to the public including on their website, and should be subject to regular audit
by the City, County, or State. All taxes and special fees enacted by these special districts should be included in the computation
for the 4% annual cap. Laws should be passed which restrict every government agency and district from encumbering taxpayers
and their descendants with unreasonable taxes, unaffordable projects, outrageous pension and retirement benefits, etc. Governments
need to be restructured and reorganized to reduce inefficiencies and waste. The number of government employees needs to be re-
duced since there is a tremendous amount of waste as it now exists. There is no reason for fire stations, libraries, courthouses, city
buildings, and other government buildings from being overbuilt for the purposes intended. There are hundreds of examples of this in
Northern Kentucky and thousands in the State. The legislature should consider introducing legislation that mirrors the Wastewater
legislation championed by Senator Damon Thayer. This legislation should create a system that any increases in taxes by special tax-
ing districts should require a vote of the County Fiscal Courts that are in the districts’ service area.
Agricultural Extension Drainage and Levee Mental Health
Air Board Fire Protection Public Health
Air Pollution Control Flood Control Rescue Squad
Ambulance Hospital River Port Authority
Area Development Housing Authority Road District
Area Planning Commission Industrial Development Authority Sanitation District
Community Action Corporation Library Sewer District
Community Improvement Mass Transit Authority Soil and Water Conservation
10
LAND OWNERSHIP AND PRIVATE PROPERTY RIGHTS
Position: Any planning effort on a state funded basis or managed by the state should include a feasibility
study as well as an economic impact model. These reports should be backed by sound science as well as
rationalized by harsh economic criticism.
Land is a finite resource and its availability, unencumbered use and re-use of, and ability to transfer title to, is the necessary “a pri-
ori” resource for housing and the built environment. Any legislation, regulation, restriction, tax, fee or lien placed upon real property
should be approached with the utmost caution. These “shadows” could ultimately weaken the private property rights that we all as-
pire to hold and enjoy.
Since our country’s founding this unique experiment of capitalism and private property rights has produced, privacy, sanctuary,
pride, care, husbandry and a source of wealth and security for millions of our citizens. These rights are the bedrock upon which the
foundation of our government and way of life are anchored.
Conservation easements, which are created to hold land in perpetuity from one generation to the next and beyond, can place unneces-
sary burdens and denial of ownership and loss of tax revenue on future generations. In light of national, state and local set asides,
thoughtful consideration as to the right to define forever for land that is available for private ownership should involve a long na-
tional and statewide debate.
Property owners must be justly compensated for reductions in value of their property caused by actions of any level of government,
taxing district, or quasi-governmental agencies. Citizens should have faster, easier and lower cost access to federal court review on
takings issues. Local and state government planning efforts should take into consideration and publish that determination, on any
adverse impact that proposed land and transportation planning decisions may have on private property ownership.
Examples: The new Mt. Zion Road interchange design will deny the opportunity for adjacent landowners’ potential use of this land
for commercial enterprises. The North Bend Road redesign has caused undo hardship on property owners to the west of North Bend
Road as access to potential and existing commercial operations has been reduced as a result of the road design. The exit design for
the potential new bridge to span the Ohio River may cause an economic difficulty for the city of Covington.
11
WORKFORCE DEVELOPMENT
Position: In order to improve the state of workforce development the General Assembly should enact
legislation or encourage administrative programs that would allow for an appropriation from workforce
development or education funding to go towards private career centers and apprenticeship institutions.
Studies show that in Greater Cincinnati alone 200 new skilled construction trades people are needed per month to fill the
job openings in the construction market [1]. 30% of that number is needed in residential construction. Over the past few
years and during the housing depression many secondary educational intuitions and public high schools dropped their
traditional construction trades education curriculum.
The Bureau of Labor Statistics (BLS) report that the construction sector of the U.S. economy declined by 1.26 million
workers during the housing depression. Their projections for workforce growth in the construction sector are 7.37 mil-
lion are needed in the next ten years. That is equivalent to a 2.9% annual increase between 2010 and 2020. A National
Association of Home Builders microeconomic study of Northern Kentucky shows that in 2010 only 2,021 skilled trades
people were employed in Northern Kentucky in the construction of single family residences. Projections by NAHB
backed up with data from the BLS show that 2,125 new skilled trades people will be necessary to meet housing demand
in Northern Kentucky in the next ten years.
The Home Builders Association of Northern Kentucky has operated the Enzweiler Apprenticeship Training Program
since the late 1960’s. Today, the program boasts its largest enrollment in history. This is due, in part, to the fact that
there is a lack of traditional trades training opportunities in public education and a lack of sufficient trades training in
secondary education institutions. The program is at a sufficient level to graduate 1,088 skilled trades people over the
next ten years. That leaves a gap of over 1,000 skilled trades jobs left unfilled or not properly trained. The HBA needs
help in capital expansion funding to grow its programs to meet the needs of the industry in the coming years.
Since many public high schools have either dropped their traditional trades training curriculum altogether or only offer a
curriculum that disinterests students, there is a serious concern that a career pathway from youth to apprenticeship to
work in the construction industry even exists. The HBA is currently engaged in speaking to other local HBA's in the
state of Kentucky about their need for traditional trades training opportunities. In the near future it could be expected that
other centers like the Enzweiler Apprenticeship Training Program are born around the state. At the same time a vacuum
exists in career pathways from high school to apprenticeship to full-time work. Due to this fact there needs to be oppor-
tunities around the state of Kentucky that offer high school students (both juniors and seniors) access to traditional trades
training. The HBA has been working with Northern Kentucky legislators, the Kentucky Office of Career and Technical
Education, and the Chamber of Commerce in order to access revenues from private benefactors for traditional trades
training and to locate state funding to setup a pilot project in Northern Kentucky. In order to fill the construction career
gap there needs to be sufficient funding from workforce development, education and private benefactors to allow stu-
dents to pursue trades in our industry. There are other apprenticeship programs around the state that would also be able
to provide traditional trades training to high school juniors and seniors. However with the lack of adequate school fund-
ing coming from the state it makes it difficult to be able to fully fund these programs and support a career pathway from
high school to full-time employment.
As a result of this broken pathway, and for other factors we are currently experiencing, high labor costs are affecting
housing affordability. This affects housing for all in Kentucky. If the cost of new homes rises there is a priced out affect
where people leave the market to pursue used homes. If demand in used homes increases there is an additional priced out
affect that pushes people out of that market towards a rental situation. As the demand for rental units rises so does the
price that landlords are able to assess their tenants. In short any increases in the price of new homes has an effect upon
housing affordability for all.

12
Position: We encourage the General Assembly to work with the Kentucky Division of Water to lessen
the impacts imposed by Stormwater permit regulations from the Environmental Protection Agency.
In order to comply with the Clean Water Act and EPA regulations related to the act local sanitation districts and other
such governmental agencies have become the de facto regulators of federal regulations. Historically the Kentucky Divi-
sion of Water has done an adequate job in exercising its primacy with regard to EPA storm water regulations. However
the crux of the concern for the HBA is how permits and regulations administered by the state’s division of water are in-
terpreted and exercised locally. Historically the permits have been designed to allow for flexibility in application within
a local market. Sanitation District 1 for example has had a recent history of bowing to pressures from the EPA and gold-
plating their regulations. The cost of such practices has had a tremendous effect upon the price of housing.
For example, due to a state audit, Sanitation District 1 turned away from previous procurement practices that ultimately
saved the taxpayers and the home buying community a considerable sum of money and encouraged growth. Also state-
wide permits for stormwater allow for Sanitation District 1 to exercise flexibility in the maintenance, monitoring, repair,
and replacement of storm water quality features. Due to Sanitation District 1's financial situation the de facto regulator
has however decided upon a course that would tax the landowner and homeowners associations with the maintenance,
monitoring, repair, and replacement of such systems. Sanitation District 1 knows not the cost of such practices or the
cost to local landowners and homeowners associations.
Sanitation District 1 entered into a consent decree in the mid 2000’s regarding sewer overflows in their separate and
combined sewer systems. Prior to entering into the decree Sanitation District 1 did not do any calculations regarding the
cost of such an agreement. Additionally, Sanitation District 1 has recently taken over the stormwater systems for many
counties and cities in Northern Kentucky. As is evident by past practices Sanitation District 1 did not know the cost of
taking over these systems. The district has put itself into a situation where debt service, poor financial planning, high
costs for maintenance, adherence to the consent decree, and adherence to gold-plated regulations has resulted in a dimin-
ished amount of room for growth. In fact their current budget has no capital improvement projects for growth of the sys-
tem beyond the consent decree. Moreover, due to the fact that Sanitation District 1 has implemented high rate increases
in recent history the taste of the community has turned sour with regard to rate increases. Due to that fact, recommenda-
tions from Sanitation District 1 staff, and the high debt service there is no money in the Sanitation District budget for any
growth.
As a result the Hebron area is basically closed for business. There is no capacity at their pump stations and no money
budgeted to allow for the Hebron area north of interstate 275 to grow. This area is a historically fast growing area in
Boone County. Other areas of Northern Kentucky will shortly see the same result. Sanitation District 1 staff has indi-
cated that areas of Southern Kenton County and Southern Boone County around the Richwood exit on I -71/75 will soon
experience the same inability to grow. This area incorporates industrial uses and commercial uses that could supply job
growth for Northern Kentucky. In the future we expect more conversations about areas in Campbell County near the
Double A Highway and Route 27 that are just like the ones we are seeing in Boone and Kenton. This situation is unac-
ceptable for the economy of Northern Kentucky.
We encourage the Northern Kentucky Caucus to work with the Home Builders Association in demanding the Sanitation
District identify areas in its budget that are unnecessary or nonessential in order to provide cuts to facilitate growth. Ad-
ditionally, the Sanitation District should accelerate its talks with the EPA in order to renegotiate the consent decree. This
could cut the need for rate increases by more than half. Procurement should be immediately addressed in order to allow
for a more efficient and economical plan to facilitate growth now and in the future. Most importantly the Sanitation Dis-
trict should take over the maintenance, monitoring, repair, and replacement of storm water quality features.
STORMWATER AND SANITARY SEWER REGULATIONS
13
Position: There should be made available with the Kentucky Housing Corporation funding for acquisi-
tion, construction and development loans for builders and developers.
With the increased demand for new housing across the state smaller companies are unable to acquire construction loans.
Many financial institutions will only lend to builders who have contracted sales and not lend to builders building on a
speculative basis. National studies show that in many areas the majority of homes that are purchased in new construction
are purchased while that home is being constructed. As a result, the market share for large builders is the highest in re-
cent memory. In the year 2005 and 2006 the top four producing builders in Northern Kentucky enjoyed a market share of
52% and 55% respectively of the overall new home market. In 2013 that market share jumped to 78% as those larger
builders are able to either self finance or secure financing due to their high level of assets. This situation leaves smaller
builders and smaller developers out of the market. Combine in increased regulations and the days of the small developer
may be at an end. The Home Builders Association encourages the state legislature to investigate new and innovative
means to finance housing construction. This would allow smaller companies to reenter the market, employ more workers
and further improve the housing recovery across the state.
Housing affordability across the state of Kentucky and the United States is suffering from several factors. First, materials
used to construct homes are rising considerably. Lumber, drywall, brick, siding, and most other components used to con-
struct a home are increasing at a rapid pace. The causes of this increase are many fold. Producers of housing compo-
nents, during the housing depression, delayed passing on price increases of their cost of production. Many material pro-
ducers shut down operations and only brought on plants to fill orders on an as needed basis. This is an inefficient way to
conduct business. Due to the lack of building materials these component providers are able to fetch a higher dollar value
for the materials they supply. This is compounded by the fact that many skilled trades people have left the industry. Due
to the overall labor shortage needed to create these materials the cost of the labor component of these materials has also
risen. Second, the overall lack of skilled trades people needed to actively construct homes has had an effect upon hous-
ing affordability. There is a real lack of skilled trades people across all trades essential to construct homes. With the lack
of supply of skilled trades people the compensation rate for the existing skilled trades people is much higher than in re-
cent history. Third, with a low supply of new homes available for purchase and increased demand the asking price has
additionally increased for new home purchases. While this allows some builders to pass through increased costs it does
not keep up with the pace of housing materials production prices. As a result, many people across the nation and in Ken-
tucky are priced out of the new home market. Due to these factors the time value of money is more costly as the build
process schedule has become elongated. It is important here to note that the new home market produces on average 3.3
jobs per home.
CONSTRUCTION FINANCE
HOUSING AFFORDABILITY

14
Position: The General Assembly should appropriate construction funding for Kentucky Route 536 road
improvements. We encourage the designed plan for KY 536 road improvements to be reconsidered so
that this road system is improved further west than Union, Kentucky.
Route 536 is a road that needs funding for the construction of the widening project. Without construction funding for this
project housing will continue to decline in southern Kenton County. It is imperative that the General Assembly fund con-
struction for this road project. Also, the design of the project ends in Union. This project should be extended past Union
to the West.
While the Home Builders Association has not taken an official stance on the Brent Spence Bridge project, we do have
concerns that such a project would be funded through tolling. Northern Kentucky has long benefited from the more af-
fordable cost of living in comparison to areas in Southern Ohio. This benefit is quickly receding as increased costs for
sanitation, storm water regulation compliance, taxation, and lack of jobs has impacted Northern Kentucky. We ask the
Northern Kentucky Caucus to reassess the need to move traffic from both I -71 and I -75 through downtown. The largest
period of economic growth in the United States and across Kentucky was experienced during the interstate traffic high-
way system expansion. It would only make sense to separate interstate 71 and interstate 75 and move interstate 71 across
a cross-county highway to connect east of Cincinnati. This would create new interstate interchanges and allow for eco-
nomic expansion around interchanges for both industrial and commercial uses, thus expanding the potential workforce in
Northern Kentucky.
Due to increasing regulation of storm water, sanitary sewers, taxation, and increased construction costs Northern Ken-
tucky is losing its advantage to surrounding areas looking to expand their workforce. Dearborn County, Indiana eco-
nomic development is actively engaged in pulling Northern Kentucky businesses over state lines. Due to casino revenues
to local government, and aggressive state taxation policy for new businesses and industry, cheap land, and the lack of
regulation through agencies such as the Sanitation District 1, Dearborn County, Indiana is at an advantage over Northern
Kentucky. If this situation continues we will see a loss of jobs, industry, taxes paid to local governments, and people's
personal income. As a result, Northern Kentucky will no longer benefit from a lower cost-of-living than surrounding ar-
eas. They have the infrastructure, the right taxation, lower regulations, and a more business friendly environment to
make things work while Northern Kentucky stands at a disadvantage. Additionally, areas north of Cincinnati are at the
same advantage. They do not have to contend with burdensome regulations from a Sanitation District, high state taxa-
tion, or a business unfriendly environment. Without changes to this situation Kentucky stands to lose.
We ask the Northern Kentucky Caucus to pursue legislation that would create a more business friendly environment in
the state of Kentucky. Additionally, we ask the Caucus to work with the Sanitation District and the Kentucky Division of
Water to look at the statewide permit that the de facto regulator operates under to create a situation that is far more flexi-
ble, physically feasible, and affordable for citizens, companies and industries in Northern Kentucky.
TRANSPORTATION PROJECTS
THE COST OF DOING BUSINESS IN KENTUCKY
15
Position: Align Kentucky’s definition of Cost of Goods Sold deductions with that of the IRS.
The Kentucky Department of Revenue (DOR) has been conducting desk audits and disallowing various deductions in the
Cost of Goods Sold (COGS) calculation, resulting in large assessments for some businesses. The DOR is auditing these
businesses for up to four years and then assessing interest and post-amnesty penalties, which in some instances amount
to half of the tax allegedly owed.
Because the statute is ambiguous, DOR is able to interpret it in an aggressive manner that favors additional revenue. The
solution we are proposing is to amend the statute and clarify the definition of COGS.
LIMITED LIABILITY ENTITY TAX
Position: We ask the General Assembly to stop any legislation that would harm small business and to
enact business friendly legislation in the 2014 session.
Workers compensation legislation, has appeared in every recent legislative session, which would harm small business.
Workers compensation legislation should be pursued that would protect homebuilders in the Commonwealth.
This legislative session promises the same. Due to the large number of issues within workers’ compensation, such as,
employee misclassification, subrogation, making Kentucky a “Drug-Free Workplace” state, adoption of evidence based
medical treatment guidelines, adoption of a pharmaceutical schedule fee, establishment of a fee schedule for durable
medical equipment, and establishing a limit on the use of Special Fund Assessments. Understanding legislation concern-
ing Workers’ Compensation and the plethora of issues it demands, are vital to the health of the construction industry and
this organization.
WORKER’S COMPENSATION
Position: Stop legislation adding another layer of bureaucracy to the homebuilding process.
This bill came up last session and failed. Advocates of this legislation desire to license yet another part of residential
construction, with consumer protection as their reason. Adding this license to the already licensed requirements of home-
building adds further cost and more bureaucracy with the establishment of an entire board within the Department of
Housing, Building & Construction.
ROOFER LICENSURE
Position: Businesses participating in Bona Fide Association Health Care Plans should not be subject to
any assessment for KYNECT.
Currently, an assessment is levied on employers for the funding of Kentucky Access; Kentucky’s high risk pool. The
Commissioner of Insurance has the option to levy a full 1% (currently levies ½% which produces $13 million in reve-
nue). Hypothetically, the leverage of a full 1% would produce $26million in revenue. To fund KYNECT, Kentucky’s
statewide healthcare exchange, will require an estimated $39 million in 2015. To allow this would require a change in
the statute because Kentucky Access effectively dissolves with the creation of the statewide health insurance exchange.
FUNDING KYNECT