Hawaii State Correctional Facility and Custody Status...
52
Hawaii State Correctional Facility and Custody Status Analysis (Final) FY 2011 Inmate Population Department of Public Safety Interagency Council on Intermediate Sanctions By: Timothy Wong, ICIS Research Analyst, Department of the Attorney General Maria Sadaya, Research Aide, State of Hawaii Judiciary September 1, 2011
Transcript of Hawaii State Correctional Facility and Custody Status...

Hawaii State Correctional Facility and Custody Status Analysis
(Final)
FY 2011 Inmate Population Department of Public Safety
Interagency Council on Intermediate Sanctions
By:
Timothy Wong, ICIS Research Analyst, Department of the Attorney General
Maria Sadaya, Research Aide, State of Hawaii Judiciary
September 1, 2011

Methodology� The data comes from 5,921 incarcerated offenders currently in custody at nine correctional facilities,
including two mainland-based corrections centers.
� Five custody statuses reported in this study.
� 3,931 (66.4%) LSI-R and ASUS compiled from the July, 2010 CYZAP download.
� Initial LSI-R and ASUS assessments used in this analysis.
� Separate tables compiled by correctional facilities and custody status.� Data analyzed by sociodemographics, and cross-tabulated by ASUS scales, LSI-R Subdomains, and Officer
Rater Evaluations.
� Correctional facilities and custody status analyzed by risk rankings in the following statistically significant areas:
� ASUS scales
� LSI-R subdomains
� ASUS officer rater evaluations
Business Rules� Used only statistically significant data.
� Used only High and Surveillance to report LSI-R Risk Categories.
� Eliminated “Out of State” (OOS) data from any Correctional Facility analysis.
� Eliminated “Offender Held” data from any Custody Status analysis.
� Used only Residential Treatment, Therapeutic Community, and Assess for Psychopathy to report Recommended Treatment Level Risk rankings.

Summary of Findings -
Listing of Highest Ranked Indicators of Risk from the Initial LSI-R and
ASUS Assessments, by Correctional Facility� Women’s Community Correctional Facility
� 26.5 LSI-R Total Score - classification: high risk (LSI-R) � 63rd percentile with Financial need (LSI-R)� 59th percentile with Criminal History (LSI-R)� 48th percentile with Family or Marital need (LSI-R)� 43rd percentile with Accommodation need (LSI-R)� 58th percentile with Alcohol or Drug Disruption (ASUS)� 59th percentile with Alcohol or Drug Related Mood disorder (ASUS)� 16.6% of inmates had Prior Mental Health Treatment - two or more times (ASUS) � 12.0% had prior Alcohol or Drug Education classes - two or more times (ASUS)
� Waiawa Correctional Center� 92.2% of inmates are Sentenced Felons (PSD)� 58th percentile with Pro Criminal Companions (LSI-R)� 49th percentile with Alcohol or Drug need (LSI-R)� 49th percentile with Emotional/Personal need (LSI-R)� 60th percentile with Alcohol or Drug Involvement (ASUS) � 40.2% of inmates had Alcohol or Drug Related Arrests - two or more times (ASUS)
� Kauai Community Correctional Center� 57th percentile with Alcohol or Drug Involvement over Pass Six Months (ASUS)� 24.7% of inmates had Very High rated Alcohol or Drug Involvement - Officer Evaluation (ASUS)� 24.7% of inmates had Very High rated Alcohol or Drug Disruption - Officer Evaluation (ASUS)� 12.3% of inmates had Prior Outpatient Treatment - two or more times (ASUS)� 36.1% of inmates are under 30 years old (LSI-R)
� Arizona Red Rock Correctional Center� 78th percentile with Leisure/Recreation need (LSI-R)� 62nd percentile with Educational/Employment need (LSI-R)� 30th percentile with Anti Social Attitudes/Orientation (LSI-R)� 76.2% of inmates were unemployed - 3+months (ASUS)� 26.9% of inmates need at least residential substance use services or greater, based on the Recommended Treatment Level (LSI-R/ASUS)
� Arizona Saguaro Correctional Center� 28.9% of inmates convicted for Felony Violent offense (LSI-R)� 72.2% of inmates are at least single, divorced, or separated (LSI-R)
Note: Source of data is in parenthesis.

Summary of Findings (cont.) -
Listing of Highest Ranked Indicators of Risk from Initial LSI-R and ASUS
Assessments, by Custody Status
� Probation Violation� 24.7 LSI-R Total Score – Classified: medium risk (LSI-R)� 75th percentile with Leisure/Recreation need (LSI-R)� 52nd percentile (tie) with Financial need (LSI-R)� 47th percentile with Alcohol or Drug need (LSI-R)� 27th percentile with Anti Social Attitudes/Orientation (LSI-R)� 67.2% of inmates were unemployed - 3+months (ASUS)� 51st percentile with Alcohol or Drug Related Mood disorder (ASUS)� 38.0% of inmates are under 30 years old (LSI-R)
� Pre Trial/Pre Sentence� 57th percentile with Educational/Employment need (LSI-R)� 52nd percentile (tie) with Financial need (LSI-R)� 41st percentile in Family or Marital need (LSI-R)
� Parole Violation� 32.3% of inmates incarcerated for felony violent offenses (LSI-R)� 59th percentile in Criminal History (LSI-R)� 57th percentile with pro criminal Companions (LSI-R)
� Sentenced Felon� 37th percentile with Accommodation need (LSI-R)
� Sentenced Petty Misdemeanants and Misdemeanants� 29th percentile with Emotional/Personal need (LSI-R)
Note: Source of data is in parenthesis.

Hawaii Community
Correctional Center,
534, 9.0%Halawa Correctional
Facility, 983, 16.6%
Arizona Saguaro
Correctional Center,
1,699, 28.7%
Arizona Red Rock
Correctional Center, 58,
1.0%
Waiawa Correctional
Facility, 295, 5.0%
Women's Community
Correctional Center,
308, 5.2%
Maui Community
Correctional Center,
370, 6.3%
Kauai Community
Correctional Center,
161, 2.7%
Oahu Community
Correctional Center,
1,512, 25.5%
Chart 1: Proportion of
Inmates Incarcerated, by
Correctional Facilities
Sentenced Felon, 3,896,
65.8%
Probation Violation, 267,
4.5%
Pretrial/Resentenced,
893, 15.1%
Offender Held, 13, 0.2%
Sentenced
Petty/Misdemeanants,
238, 4.0%
Parole Violation, 614,
10.4%
Chart 2: Proportion of Inmates Incarcerated, by Custody Status
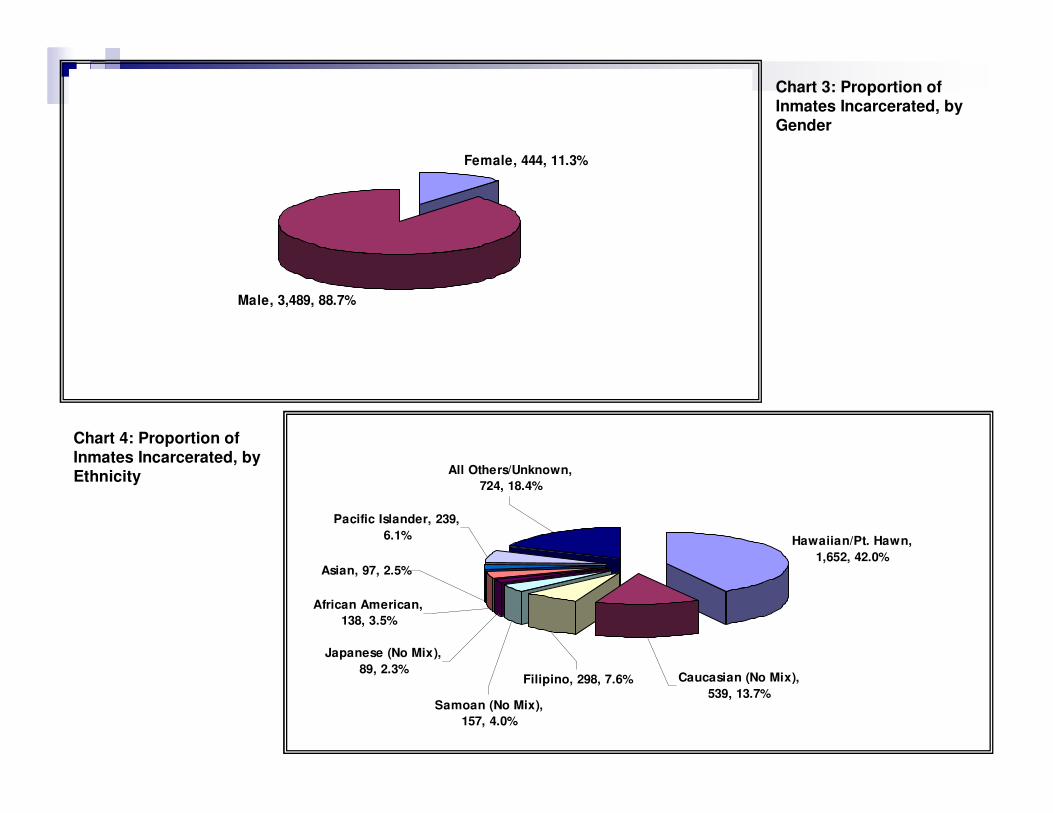
Chart 3: Proportion of
Inmates Incarcerated, by
Gender
Female, 444, 11.3%
Male, 3,489, 88.7%
All Others/Unknown,
724, 18.4%
Pacific Islander, 239,
6.1%
Filipino, 298, 7.6%
Japanese (No Mix),
89, 2.3%
Samoan (No Mix),
157, 4.0%
Asian, 97, 2.5%
African American,
138, 3.5%
Caucasian (No Mix),
539, 13.7%
Hawaiian/Pt. Hawn,
1,652, 42.0%
Chart 4: Proportion of Inmates Incarcerated, by Ethnicity

Divorced, 521, 13.2%
Married, 438, 11.1%
Separated, 185, 4.7%
Single- Never
Married, 2,757, 70.1%
Widowed, 32, 0.8%
Chart 5: Proportion of
Inmates Incarcerated, by
Marital Status
20-29 yrs old, 954,
26.7%
30-39 yrs old, 1,157,
32.3%
40-49 yrs old, 945,
26.4%
50-59 yrs old, 404,
11.3%
70+ yrs old, 8, 0.2%60-69 yrs old, 57, 1.6%
<20 yrs old, 54, 1.5%
Chart 6: Proportion of Inmates Incarcerated, by Age Range

Less than High
School, 1,529, 45.3%
High School
Graduate, 1,578,
46.7%
Post High School,
271, 8.0%
Chart 7: Proportion of
Inmates Incarcerated, by
Educational Level
Employed, 980, 29.4%
Unemployed 1-3
months, 325, 9.8%
Student, 20, 0.6%
Unemployed 3+
months, 2,006, 60.2%
Chart 8: Proportion of Inmates Incarcerated, by
Unemployed Status

Felony Violent,
797, 21.8%
Felony Sex, 313,
8.6%
Felony Property,
1,030, 28.1%
Felony Drug, 935,
25.6%
Felony Other, 309,
8.4%
Misdemeanor/
Other, 275, 7.5%
Chart 9: Proportion of
Inmates Incarcerated, by
Type of Offense
Oahu, 2,770, 70.4%
Hawaii, 471, 12.0%Maui, 515, 13.1%
Kauai, 176, 4.5%
Chart 10: Proportion of Assessments Conducted, by County

Correctional Facility
Analysis
Cross-tabulated by…
•Demographics
•ASUS Scale
• LSI-R
• ASUS Rater Evaluation

Demographics by
Correctional Facility

Correctional Facilities Initial Assessment Risk Rankings, by Selected
At-Risk Indicators
The table above represents facility risk rankings from 1 thru 9, based on the highest to lowest proportion of offenders for each of the specified “at risk” indicators. The Highest Average Rank is the correctional facility with the highest average risk-rankings across the five indicators.
Correctional facilities that have the same risk-rank scores receive the same Average Rank (prefaced by a “tied” remark).
997386
Maui Community
Correctional Center
839928
Women's Community
Correctional Center
766494
Hawaii Community
Correctional Center
653757
Halawa Correctional
Facility
578163
Kauai Community
Correctional Center
415845
Waiawa Correctional
Facility
1 (tied)84232
Oahu Community
Correctional Center
1 (tied)41671
Arizona Saguaro
Correctional Center
1 (tied)22519
Arizona Red Rock
Correctional Center
Highest Average
Rank
Sentenced Felon
Felony Violent Convictions
<30 yrs old
Unemployment (>3 months)
Marital Status-Single Never
Married
Correctional Facility

Chi-Sq (3,933) = 47.61, p < .05
Percent Marital
Status (State Average)
Chart 11: Percent Marital
Status (Single Never
Married), by Correctional Facilities
63.0%
66.4%
67.0%
68.1%
69.1%
70.2%
70.6%
71.8%
72.2%
0.0% 20.0% 40.0% 60.0% 80.0% 100.0%
Arizona Red Rock Correctional Center
Women's Community Correctional Center
Halawa Correctional Facility
Maui Community Correctional Center
Waiawa Correctional Facility
Hawaii Community Correctional Center
Kauai Community Correctional Center
Oahu Community Correctional Center
Arizona Saguaro Correctional Center
51.6%
52.4%
58.1%
59.5%
60.2%
63.3%
64.1%
67.5%
76.2%
0.0% 20.0% 40.0% 60.0% 80.0% 100.0%
Hawaii Community Correctional Center
Maui Community Correctional Center
Arizona Saguaro Correctional Center
Kauai Community Correctional Center
Halawa Correctional Facility
Waiawa Correctional Facility
Oahu Community Correctional Center
Women's Community Correctional Center
Arizona Red Rock Correctional CenterChart 12: Percent Unemployment
(Unemployed 3+ months), by Correctional Facilities
Chi-Sq (3,331) = 42.75, p < .05
Percent
Employment (State Average)

Chi-Sq (3,5791) = 94.40, p < .001
Percent Age Range
(State Average)
Chart 13: Percent Age
Range (Inmates <30 years
old), by Correctional Facilities
22.7%
22.9%
24.5%
27.1%
28.6%
29.8%
31.4%
33.4%
35.1%
0.0% 20.0% 40.0% 60.0% 80.0% 100.0%
Women's Community Correctional Center
Waiawa Correctional Facility
Halawa Correctional Facility
Arizona Saguaro Correctional Center
Arizona Red Rock Correctional Center
Hawaii Community Correctional Center
Maui Community Correctional Center
Oahu Community Correctional Center
Kauai Community Correctional Center
Chart 14: Percent Type of Offense (Felony Violent), by Correctional
Facilities
Chi-Sq (3,659) = 4.12E, p < .001
Percent Type of
Offense (State Average)
12.1%
12.3%
13.2%
16.0%
17.2%
17.3%
25.3%
28.0%
28.9%
0.0% 20.0% 40.0% 60.0% 80.0% 100.0%
Women's Community Correctional Center
Kauai Community Correctional Center
Maui Community Correctional Center
Hawaii Community Correctional Center
Waiawa Correctional Facility
Oahu Community Correctional Center
Halawa Correctional Facility
Arizona Red Rock Correctional Center
Arizona Saguaro Correctional Center

Chart 15: Percent Offenders Whose Custody Status
are Sentenced Felons, by Correctional Facilities
Chi-Sq (5,921) = 2.75E, p < .001Percent Sentenced Felons (State Average)
30.3%
43.3%
48.8%
53.7%
76.9%
83.5%
86.0%
89.7%
92.2%
0.0% 20.0% 40.0% 60.0% 80.0% 100.0%
Maui Community Correctional Center
Oahu Community Correctional Center
Kauai Community Correctional Center
Hawaii Community Correctional Center
Halawa Correctional Facility
Arizona Saguaro Correctional Center
Women's Community Correctional Center
Arizona Red Rock Correctional Center
Waiawa Correctional Facility
Note: Although all incarcerated offenders are presumed Sentenced felons, the custody status of some offenders do vary from pre-trial felons to sentenced misdemeanants.

ASUS Scale by
Correctional Facility

Correctional Facilities Risk Rankings, by Initial ASUS
Assessment Percentile Scales
*Recommended Treatment Level combines the proportion of offenders in Residential Treatment, Therapeutic Community, and Assessment for Psychopathy levels.
987788
Halawa Correctional
Facility
818999
Arizona Red Rock
Correctional Center
774677
Oahu Community
Correctional Center
666556
Arizona Saguaro
Correctional Center
525865
Maui Community
Correctional Center
439344
Hawaii Community
Correctional Center
391223
Kauai Community
Correctional Center
243431
Waiawa Correctional
Facility
152112
Women's Community
Correctional Center
Highest Average
Rank
Recommended Treatment
Level*
% Six Months
% Mood% Disruption% InvolvementCorrectional Facility
Note: The table above represents facility risk rankings from 1 thru 9, based on the highest to lowest percentiles of offenders for each of the specified “at risk” indicators. The Highest Average Rank is the correctional facility with the highest average risk-rankings across five ASUS scales. Computed Risk Rankings are from statistically significant ASUS scales only.
Differences in correctional facilities for Social, Global, Defensive, and Motivation scales are not statistically significant, and subsequently not reported.
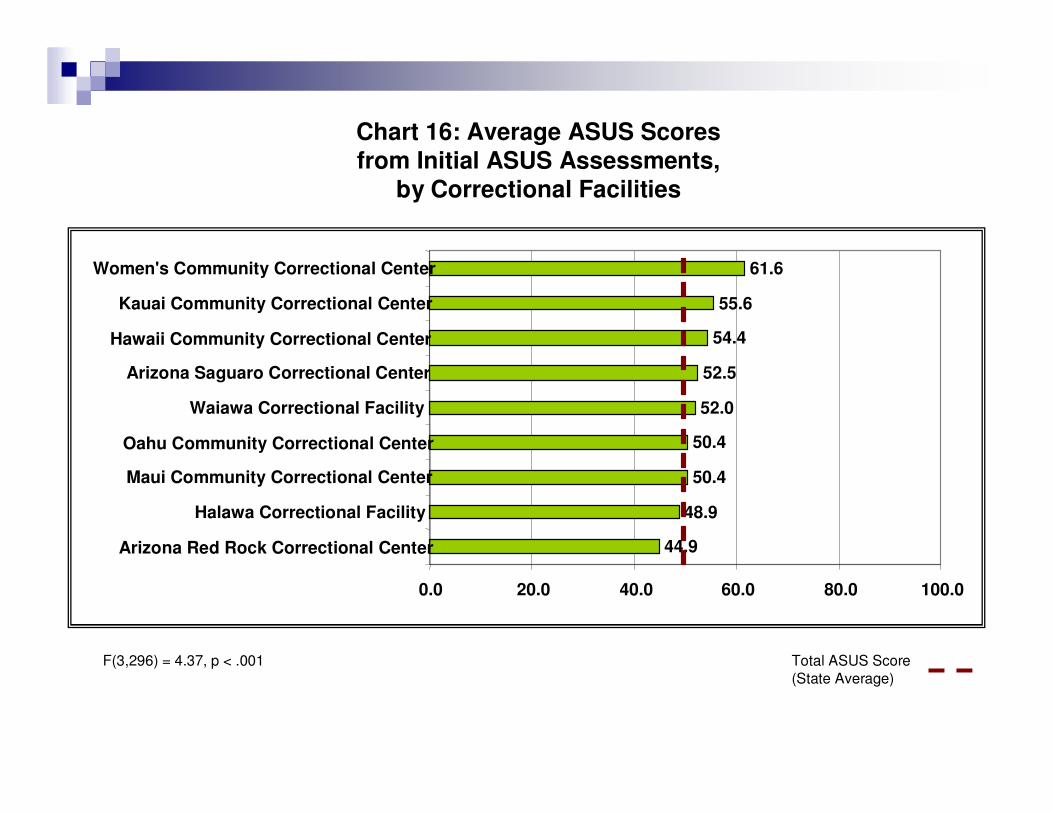
F(3,296) = 4.37, p < .001 Total ASUS Score
(State Average)
Chart 16: Average ASUS Scores
from Initial ASUS Assessments,
by Correctional Facilities
44.9
48.9
50.4
50.4
52.0
52.5
54.4
55.6
61.6
0.0 20.0 40.0 60.0 80.0 100.0
Arizona Red Rock Correctional Center
Halawa Correctional Facility
Maui Community Correctional Center
Oahu Community Correctional Center
Waiawa Correctional Facility
Arizona Saguaro Correctional Center
Hawaii Community Correctional Center
Kauai Community Correctional Center
Women's Community Correctional Center

45.8%
48.9%
51.5%
52.9%
53.4%
55.6%
57.1%
57.7%
59.9%
0.0% 20.0% 40.0% 60.0% 80.0% 100.0%
Arizona Red Rock Correctional Center
Halawa Correctional Facility
Oahu Community Correctional Center
Arizona Saguaro Correctional Center
Maui Community Correctional Center
Hawaii Community Correctional Center
Kauai Community Correctional Center
Women's Community Correctional Center
Waiawa Correctional FacilityChart 17: Average
Involvement
Percentiles from Initial ASUS Assessments, by Correctional Facilities
F(3,852) = 5.49, p < .001
Percent
Involvement (State Average)
43.2%
47.8%
48.7%
49.5%
50.8%
52.1%
53.2%
53.4%
57.8%
0.0% 20.0% 40.0% 60.0% 80.0% 100.0%
Arizona Red Rock Correctional Center
Halawa Correctional Facility
Oahu Community Correctional Center
Maui Community Correctional Center
Arizona Saguaro Correctional Center
Hawaii Community Correctional Center
Waiawa Correctional Facility
Kauai Community Correctional Center
Women's Community Correctional CenterChart 18: Average Disruption Percentiles from Initial ASUS
Assessments, by Correctional Facilities
F(3,854) = 4.09, p < .001
Percent Disruption
(State Average)

F(3,854) = 4.21, p < .001
Percent Mood
(State Average)
Chart 19: Average Mood
Percentiles from Initial
ASUS Assessments, by Correctional Facilities
47.1%
48.2%
48.3%
49.5%
49.9%
50.2%
52.9%
57.1%
58.8%
0.0% 20.0% 40.0% 60.0% 80.0% 100.0%
Arizona Red Rock Correctional Center
Maui Community Correctional Center
Halawa Correctional Facility
Oahu Community Correctional Center
Arizona Saguaro Correctional Center
Waiawa Correctional Facility
Hawaii Community Correctional Center
Kauai Community Correctional Center
Women's Community Correctional Center
25.1%
39.1%
45.0%
47.1%
50.6%
51.5%
52.1%
53.3%
56.7%
0.0% 20.0% 40.0% 60.0% 80.0% 100.0%
Hawaii Community Correctional Center
Arizona Red Rock Correctional Center
Halawa Correctional Facility
Arizona Saguaro Correctional Center
Maui Community Correctional Center
Oahu Community Correctional Center
Waiawa Correctional Facility
Women's Community Correctional Center
Kauai Community Correctional CenterChart 20: Average Six Months Involvement Percentiles from Initial
ASUS Assessments, by Correctional Facilities
F(3,852) = 6.94, p < .001
Percent Six Month
(State Average)

Chart 21: Percent Recommended Treatment Levels from
Initial ASUS Assessments, by Correctional Facilities
Chi-Sq (3,855) = 1.08E, p < .001Percent Residential Treatment (State Average)
Percent Therapeutic Community (State Average)
Percent Assess for Psychopathy (State Average)
9.4%
11.8%
12.0%
12.9%
14.2%
14.5%
15.2%
15.4%
25.9%
7.1%
4.7%
4.8%
5.4%
10.4%
4.8%
7.8%
4.7%
0.0%
2.4%
1.1%
1.3%
1.8%
4.7%
1.1%
0.4%
0.4%
0.0%
0.0% 10.0% 20.0% 30.0% 40.0% 50.0%
Kauai Community Correctional Center
Halawa Correctional Facility
Oahu Community Correctional Center
Arizona Saguaro Correctional Center
Women's Community Correctional Center
Waiawa Correctional Facility
Hawaii Community Correctional Center
Maui Community Correctional Center
Arizona Red Rock Correctional Center
Residential Treatment Therapeutic Community Assess for Psychopathy

LSI-R by
Correctional Facility

� Criminal History (CH)
� Education/Employment (E/E)
� Financial (FIN)
� Family/Marital (F/M)
� Accommodations (ACC)
� Leisure/Recreation (L/R)
� Companions (COM)
� Alcohol/Drugs (AOD)
� Emotion/Personal (E/P)
� Attitudes/Orientation (A/O)
� LSI-R Risk Categories High and Surveillance only (LSI-R)
KEY:
999888998895Hawaii Community Correctional Center
887559753279Kauai Community Correctional Center
762775467766Halawa Correctional Facility
676446685348Oahu Community Correctional Center
548332874687Maui Community Correctional Center
433663546934Arizona Saguaro Correctional Center
321997122412Arizona Red Rock Correctional Center
254111239553Waiawa Correctional Facility
115224311121Women's Community Correctional Center
Highest Average
Rank
LSI-R Total Score
A/OE/PAODCOML/RACCF/MFINE/ECHCorrectional Facility
Correctional Facilities Risk Rankings, by Initial LSI-R Assessment Sub Domains
Note: The table above represents facility risk rankings from 1 thru 9, based on the highest to lowest percentiles of offenders for each of the specified “at risk” indicators. The Highest Average Rank is the correctional facility with the highest average risk-rankings across ten LSI-R subdomains and Total Score. Computed Risk Rankings are from statistically significant LSI-R subdomains and Total Score only.

F(3,931) = 4.81, p < .001 Total LSI Score
(State Average)
Chart 22: Average Total LSI-R Scores from Initial
LSI-R Assessments, by Correctional Facilities
22.5
23.5
23.9
24.2
24.2
24.7
24.9
25.6
26.5
0.0 20.0 40.0 60.0 80.0 100.0
Hawaii Community Correctional Center
Kauai Community Correctional Center
Oahu Community Correctional Center
Maui Community Correctional Center
Halawa Correctional Facility
Arizona Saguaro Correctional Center
Waiawa Correctional Facility
Arizona Red Rock Correctional Center
Women's Community Correctional CenterHigh Risk based on LSI-R Risk Levels
Medium Risk based on LSI-R Risk Levels

F(3,931) = 6.08, p < .001
Percent Criminal
History (State Average)
Chart 23: Average
Criminal History
Percentiles from LSI-R Initial Assessments, by Correctional Facilities
46.7%
48.1%
51.1%
52.6%
52.9%
54.3%
54.4%
55.2%
59.0%
0.0% 20.0% 40.0% 60.0% 80.0% 100.0%
Kauai Community Correctional Center
Oahu Community Correctional Center
Maui Community Correctional Center
Halawa Correctional Facility
Hawaii Community Correctional Center
Arizona Saguaro Correctional Center
Waiawa Correctional Facility
Arizona Red Rock Correctional Center
Women's Community Correctional Center
48.9%
50.5%
53.5%
53.8%
54.4%
55.8%
58.0%
59.0%
62.2%
0.0% 20.0% 40.0% 60.0% 80.0% 100.0%
Hawaii Community Correctional Center
Maui Community Correctional Center
Kauai Community Correctional Center
Halawa Correctional Facility
Waiawa Correctional Facility
Oahu Community Correctional Center
Arizona Saguaro Correctional Center
Women's Community Correctional Center
Arizona Red Rock Correctional CenterChart 24: Average Educational/Employ-ment Percentiles from
LSI-R Initial Assessments, by Correctional Facilities
F(3,931) = 5.53, p < .001
Total LSI Score
(State Average)

F(3,931) = 12.08, p < .001
Percent Financial
(State Average)
Chart 25: Average
Financial Percentiles
from Initial LSI-R Assessments, by Correctional Facilities
38.0%
42.0%
42.0%
43.0%
43.0%
44.0%
47.0%
51.0%
63.0%
0.0% 20.0% 40.0% 60.0% 80.0% 100.0%
Arizona Saguaro Correctional Center
Hawaii Community Correctional Center
Halawa Correctional Facility
Maui Community Correctional Center
Waiawa Correctional Facility
Arizona Red Rock Correctional Center
Oahu Community Correctional Center
Kauai Community Correctional Center
Women's Community Correctional Center
32.8%
36.9%
36.9%
38.0%
38.5%
38.7%
43.8%
45.4%
47.6%
0.0% 20.0% 40.0% 60.0% 80.0% 100.0%
Waiawa Correctional Facility
Hawaii Community Correctional Center
Halawa Correctional Facility
Arizona Saguaro Correctional Center
Oahu Community Correctional Center
Maui Community Correctional Center
Kauai Community Correctional Center
Arizona Red Rock Correctional Center
Women's Community Correctional CenterChart 26: Average Family/Marital Percentiles from Initial
LSI-R Assessments, by Correctional Facilities
F(3,931) = 5.92, p < .001
Percent
Family/Marital (State Average)

F(3,931) = 4.43, p < .001
Percent
Accommodation (State Average)
Chart 27: Average
Accommodation
Percentiles from Initial LSI-R Assessments, by Correctional Facilities
30.0%
33.0%
35.0%
36.0%
36.0%
38.0%
38.0%
41.0%
43.0%
0.0% 20.0% 40.0% 60.0% 80.0% 100.0%
Hawaii Community Correctional Center
Oahu Community Correctional Center
Maui Community Correctional Center
Halawa Correctional Facility
Kauai Community Correctional Center
Arizona Saguaro Correctional Center
Waiawa Correctional Facility
Arizona Red Rock Correctional Center
Women's Community Correctional Center
62.0%
67.0%
69.0%
72.0%
73.0%
73.0%
74.0%
74.0%
78.0%
0.0% 20.0% 40.0% 60.0% 80.0% 100.0%
Hawaii Community Correctional Center
Maui Community Correctional Center
Kauai Community Correctional Center
Oahu Community Correctional Center
Arizona Saguaro Correctional Center
Halawa Correctional Facility
Women's Community Correctional Center
Waiawa Correctional Facility
Arizona Red Rock Correctional CenterChart 28: Average Leisure/Recreation Percentiles from Initial
LSI-R Assessments, by Correctional Facilities
F(3,931) = 3.07, p < .01
Percent
Leisure/Recreation (State Average)

F(3,931) = 9.22, p < .001
Percent
Companions (State Average)
Chart 29: Average
Companions Percentiles
from Initial LSI-R Assessments, by Correctional Facilities
46.6%
50.3%
51.1%
51.2%
55.3%
57.1%
58.7%
61.4%
58.1%
0.0% 20.0% 40.0% 60.0% 80.0% 100.0%
Kauai Community Correctional Center
Hawaii Community Correctional Center
Arizona Red Rock Correctional Center
Oahu Community Correctional Center
Halawa Correctional Facility
Women's Community Correctional Center
Arizona Saguaro Correctional Center
Maui Community Correctional Center
Waiawa Correctional Facility
33.0%
39.0%
40.0%
42.0%
43.0%
43.0%
45.0%
46.0%
49.0%
0.0% 20.0% 40.0% 60.0% 80.0% 100.0%
Arizona Red Rock Correctional Center
Hawaii Community Correctional Center
Halawa Correctional Facility
Arizona Saguaro Correctional Center
Kauai Community Correctional Center
Oahu Community Correctional Center
Maui Community Correctional Center
Women's Community Correctional Center
Waiawa Correctional FacilityChart 30: Average Alcohol/Drug Problem Percentiles from Initial
LSI-R Assessments, by Correctional Facilities
F(3,923) = 5.68, p < .001
Percent Alcohol/
Drug Problem (State Average)

F(3,931) = 10.11, p < .001
Percent
Emotional/Personal (State Average)
Chart 31: Average
Emotional Percentiles
from Initial LSI-R Assessments, Personal, by Correctional Facilities
33.0%
39.0%
40.0%
42.0%
43.0%
43.0%
45.0%
46.0%
49.0%
0.0% 20.0% 40.0% 60.0% 80.0% 100.0%
Arizona Red Rock Correctional Center
Hawaii Community Correctional Center
Halawa Correctional Facility
Arizona Saguaro Correctional Center
Kauai Community Correctional Center
Oahu Community Correctional Center
Maui Community Correctional Center
Women's Community Correctional Center
Waiawa Correctional Facility
19.0%
19.0%
24.0%
25.0%
25.0%
25.0%
26.0%
27.0%
30.0%
0.0% 20.0% 40.0% 60.0% 80.0% 100.0%
Hawaii Community Correctional Center
Maui Community Correctional Center
Kauai Community Correctional Center
Oahu Community Correctional Center
Women's Community Correctional Center
Waiawa Correctional Facility
Arizona Saguaro Correctional Center
Halawa Correctional Facility
Arizona Red Rock Correctional CenterChart 32: Average Attitudes/Orientation Percentiles from
Initial LSI-R Assessments, by Correctional
Facilities
F(3,931) = 2.73, p < .01
Percent Attitudes/
Orientation (State Average)
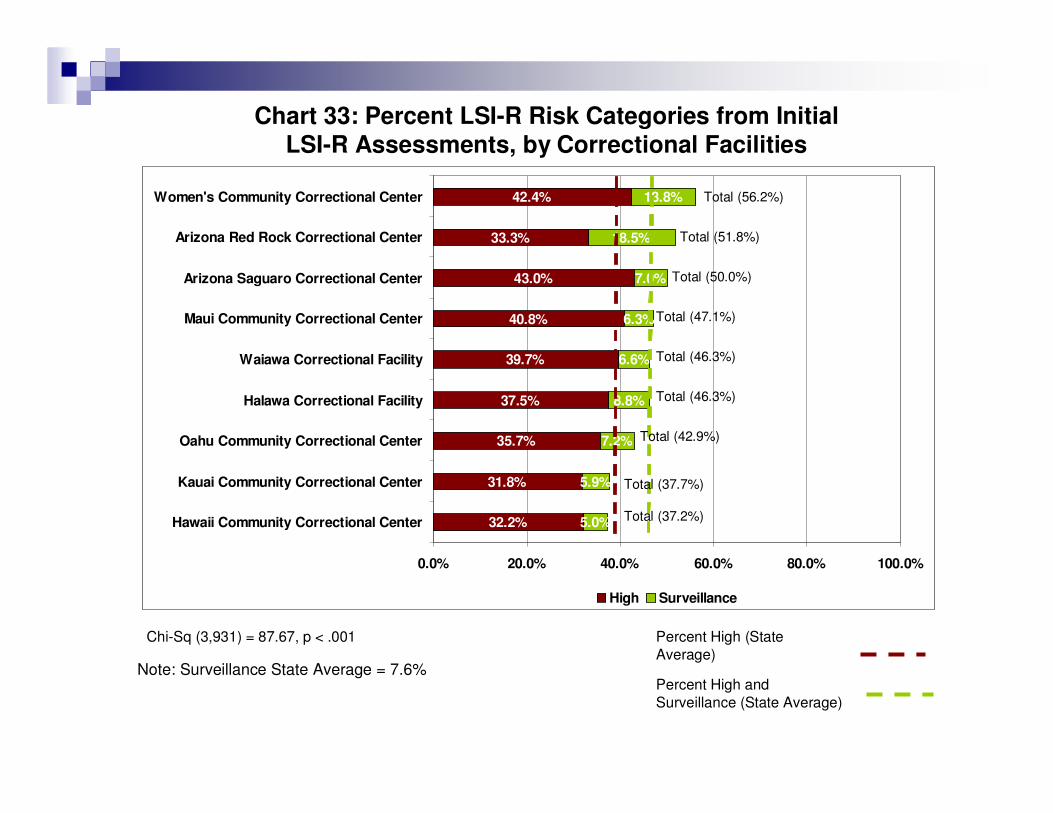
Chi-Sq (3,931) = 87.67, p < .001
Percent High and
Surveillance (State Average)
Chart 33: Percent LSI-R Risk Categories from Initial
LSI-R Assessments, by Correctional Facilities
Percent High (State
Average)Note: Surveillance State Average = 7.6%
32.2%
31.8%
35.7%
37.5%
39.7%
40.8%
43.0%
33.3%
42.4%
5.0%
5.9%
7.2%
8.8%
6.6%
6.3%
7.0%
18.5%
13.8%
0.0% 20.0% 40.0% 60.0% 80.0% 100.0%
Hawaii Community Correctional Center
Kauai Community Correctional Center
Oahu Community Correctional Center
Halawa Correctional Facility
Waiawa Correctional Facility
Maui Community Correctional Center
Arizona Saguaro Correctional Center
Arizona Red Rock Correctional Center
Women's Community Correctional Center
High Surveillance
Total (56.2%)
Total (51.8%)
Total (50.0%)
Total (47.1%)
Total (46.3%)
Total (46.3%)
Total (42.9%)
Total (37.7%)
Total (37.2%)

ASUS Rater Evaluation
by Correctional Facility
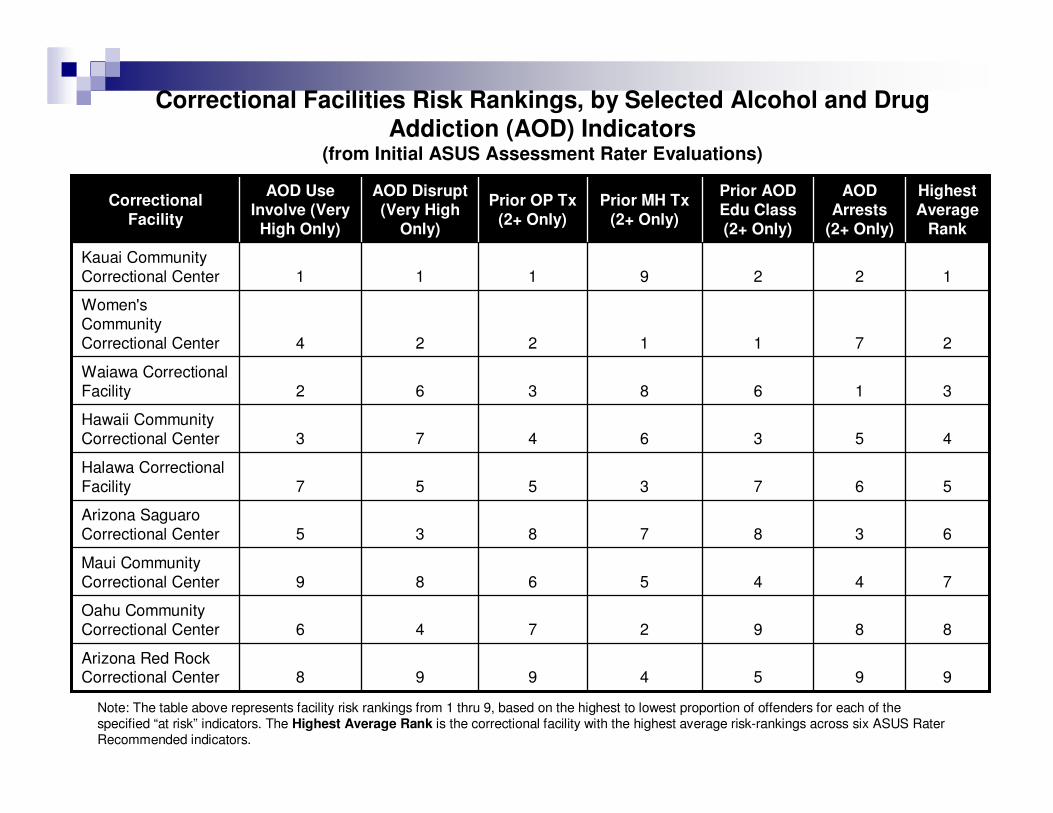
9954998Arizona Red Rock Correctional Center
8892746
Oahu Community
Correctional Center
7445689
Maui Community
Correctional Center
6387835
Arizona Saguaro
Correctional Center
5673557
Halawa Correctional
Facility
4536473
Hawaii Community
Correctional Center
3168362
Waiawa Correctional
Facility
2711224
Women's
Community
Correctional Center
1229111
Kauai Community
Correctional Center
Highest
Average Rank
AOD
Arrests (2+ Only)
Prior AOD
Edu Class (2+ Only)
Prior MH Tx(2+ Only)
Prior OP Tx(2+ Only)
AOD Disrupt
(Very High Only)
AOD Use
Involve (Very High Only)
Correctional Facility
Correctional Facilities Risk Rankings, by Selected Alcohol and Drug
Addiction (AOD) Indicators (from Initial ASUS Assessment Rater Evaluations)
Note: The table above represents facility risk rankings from 1 thru 9, based on the highest to lowest proportion of offenders for each of the specified “at risk” indicators. The Highest Average Rank is the correctional facility with the highest average risk-rankings across six ASUS Rater Recommended indicators.
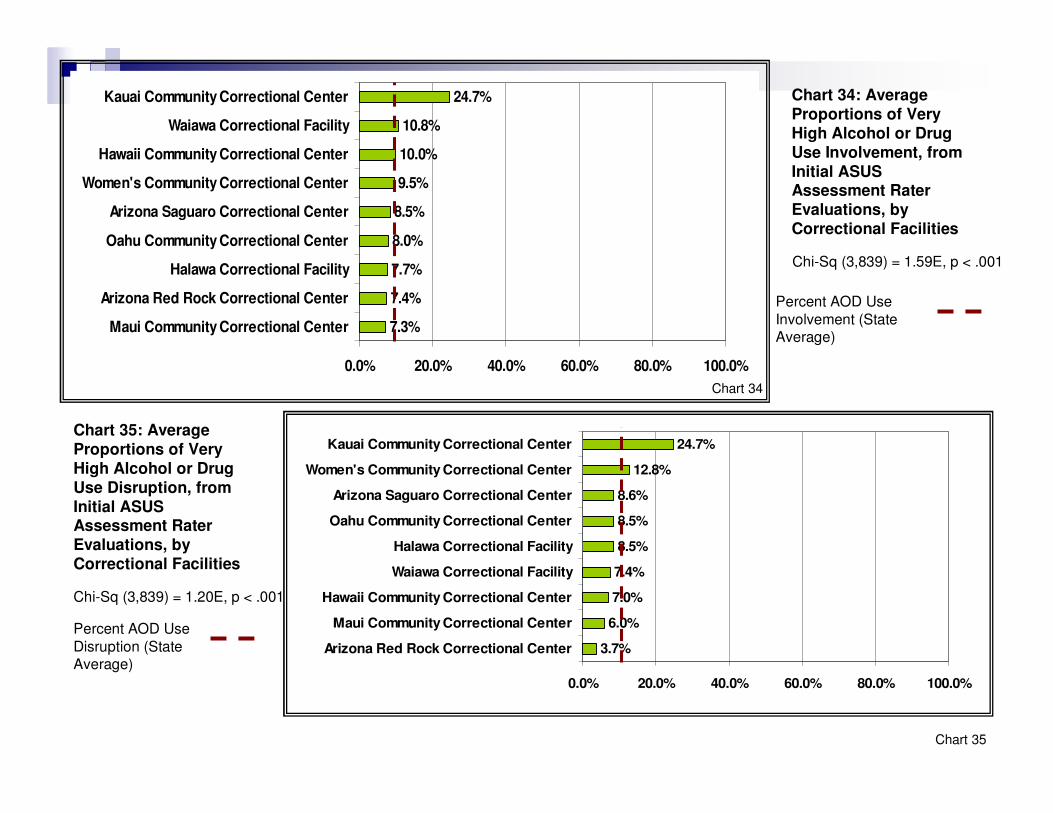
Chi-Sq (3,839) = 1.59E, p < .001
Percent AOD Use
Involvement (State Average)
Chart 34: Average
Proportions of Very
High Alcohol or Drug Use Involvement, from Initial ASUS Assessment Rater
Evaluations, by Correctional Facilities
7.3%
7.4%
7.7%
8.0%
8.5%
9.5%
10.0%
10.8%
24.7%
0.0% 20.0% 40.0% 60.0% 80.0% 100.0%
Maui Community Correctional Center
Arizona Red Rock Correctional Center
Halawa Correctional Facility
Oahu Community Correctional Center
Arizona Saguaro Correctional Center
Women's Community Correctional Center
Hawaii Community Correctional Center
Waiawa Correctional Facility
Kauai Community Correctional Center
3.7%
6.0%
7.0%
7.4%
8.5%
8.5%
8.6%
12.8%
24.7%
0.0% 20.0% 40.0% 60.0% 80.0% 100.0%
Arizona Red Rock Correctional Center
Maui Community Correctional Center
Hawaii Community Correctional Center
Waiawa Correctional Facility
Halawa Correctional Facility
Oahu Community Correctional Center
Arizona Saguaro Correctional Center
Women's Community Correctional Center
Kauai Community Correctional CenterChart 35: Average Proportions of Very High Alcohol or Drug
Use Disruption, from Initial ASUS Assessment Rater
Evaluations, by Correctional Facilities
Chi-Sq (3,839) = 1.20E, p < .001
Percent AOD Use
Disruption (State Average)
Chart 34
Chart 35

Chi-Sq (3,367) = 63.56, p < .001
Percent Prior
Outpatient Treatment (State Average)
Chart 36: Average
Proportions of (two or
more) Prior Outpatient Treatment from, Initial ASUS Assessment Rater Evaluations (2+ Only), by Correctional Facilities
0.0%
4.7%
5.7%
6.0%
7.5%
7.8%
9.5%
10.0%
12.3%
0.0% 20.0% 40.0% 60.0% 80.0% 100.0%
Arizona Red Rock Correctional Center
Arizona Saguaro Correctional Center
Oahu Community Correctional Center
Maui Community Correctional Center
Halawa Correctional Facility
Hawaii Community Correctional Center
Waiawa Correctional Facility
Women's Community Correctional Center
Kauai Community Correctional Center
3.8%
6.0%
7.2%
7.7%
8.0%
8.7%
11.2%
11.7%
16.6%
0.0% 20.0% 40.0% 60.0% 80.0% 100.0%
Kauai Community Correctional Center
Waiawa Correctional Facility
Arizona Saguaro Correctional Center
Hawaii Community Correctional Center
Maui Community Correctional Center
Arizona Red Rock Correctional Center
Halawa Correctional Facility
Oahu Community Correctional Center
Women's Community Correctional CenterChart 37: Average Proportions of (two or more) Prior Mental
Health Treatment, from Initial ASUS Assessment Rater
Evaluations, by Correctional Facilities
Chi-Sq (3,224) = 51.51, p < .001
Percent Prior
Mental Health Treatment (State Average)
Chart 36
Chart 37

Chi-Sq (3,220) = 41.04, p < .01
Percent Prior Drug
and Alcohol Education Classes (State Average)
Chart 38: Average
Proportions of (two or
more) Prior Drug and Alcohol Education Classes, from Initial ASUS Assessment Rater Evaluations, by Correctional Facilities
5.4%
6.7%
7.3%
7.7%
8.0%
9.5%
9.7%
11.4%
12.0%
0.0% 20.0% 40.0% 60.0% 80.0% 100.0%
Oahu Community Correctional Center
Arizona Saguaro Correctional Center
Halawa Correctional Facility
Waiawa Correctional Facility
Arizona Red Rock Correctional Center
Maui Community Correctional Center
Hawaii Community Correctional Center
Kauai Community Correctional Center
Women's Community Correctional Center
12.0%
28.1%
29.4%
30.1%
30.8%
31.2%
31.5%
33.8%
40.2%
0.0% 20.0% 40.0% 60.0% 80.0% 100.0%
Arizona Red Rock Correctional Center
Oahu Community Correctional Center
Women's Community Correctional Center
Halawa Correctional Facility
Hawaii Community Correctional Center
Maui Community Correctional Center
Arizona Saguaro Correctional Center
Kauai Community Correctional Center
Waiawa Correctional FacilityChart 39: Average Proportions of (two or more) Alcohol or Drug
Related Arrests, from Initial ASUS Assessment Rater
Evaluations, by Correctional Facilities
Chi-Sq (3,311) = 29.01, p < .05
Percent of Alcohol
or Drug Related Arrests (State Average)
Chart 38
Chart 39

Custody Status Analysis
• Demographics
• ASUS Scale
• LSI-R

Demographics by
Custody Status
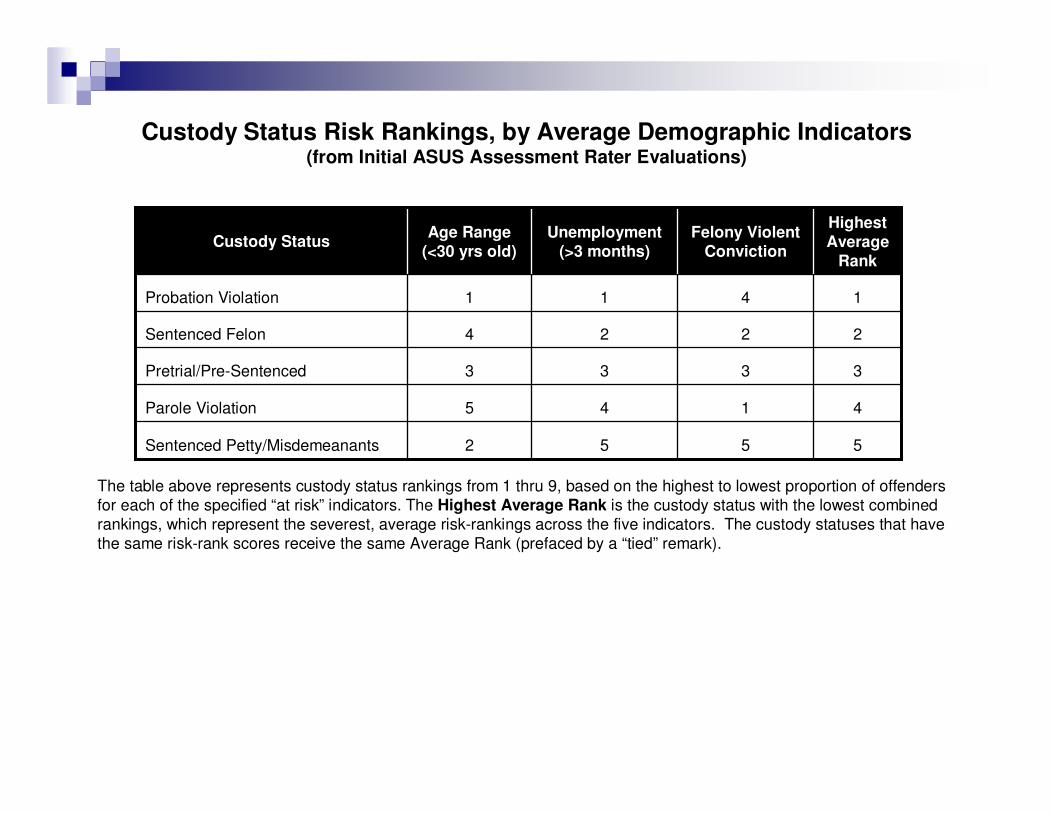
5552Sentenced Petty/Misdemeanants
4145Parole Violation
3333Pretrial/Pre-Sentenced
2224Sentenced Felon
1411Probation Violation
Highest
Average Rank
Felony Violent
Conviction
Unemployment
(>3 months)
Age Range
(<30 yrs old)Custody Status
Custody Status Risk Rankings, by Average Demographic Indicators (from Initial ASUS Assessment Rater Evaluations)
The table above represents custody status rankings from 1 thru 9, based on the highest to lowest proportion of offenders
for each of the specified “at risk” indicators. The Highest Average Rank is the custody status with the lowest combined
rankings, which represent the severest, average risk-rankings across the five indicators. The custody statuses that have
the same risk-rank scores receive the same Average Rank (prefaced by a “tied” remark).

Chart 40: Average
Proportion of
Incarcerated Offenders, by Gender and Custody Status
Chi Sq.(3,933) = 14.26, p < .05
Percent Female by
Custody Status
(State Average)
Percent Male by
Custody Status
(State Average)
17.5%
12.7%
11.2%
11.0%
8.4%
82.5%
87.3%
88.8%
89.0%
91.6%
0.0% 20.0% 40.0% 60.0% 80.0% 100.0%
Probation Violation
Pretrial/Pre-Sentenced
Sentenced Felon
Sentenced Petty/Misdemeanants
Parole Violation
Female Male
14.3%
29.0%
33.4%
37.2%
38.0%
0.0% 20.0% 40.0% 60.0% 80.0% 100.0%
Parole Violation
Sentenced Felon
Pretrial/Pre-
Sentenced
Sentenced
Petty/Misdemeanants
Probation ViolationChart 41: Average Proportion of Incarcerated
Offenders, by Age Range (Inmates <30 yrs old) and Custody Status
Chi Sq.(3,579) = 1.08E,
p < .001
Percent Age Range
by Custody Status
(State Average)

Chart 42: Average
Proportion of Incarcerated
Offenders, by Unemployment (Unemployed 3+ months) and Custody Status
Chi Sq.(3,331) = 59.26, p < .001
Percent
Employment by
Custody Status
(State Average)44.7%
46.9%
61.5%
62.4%
67.2%
0.0% 20.0% 40.0% 60.0% 80.0% 100.0%
Sentenced
Petty/Misdemeanants
Parole Violation
Pretrial/Pre-
Sentenced
Sentenced Felon
Probation Violation
9.9%
11.0%
13.7%
22.1%
32.3%
0.0% 20.0% 40.0% 60.0% 80.0% 100.0%
Sentenced
Petty/Misdemeanants
Probation Violation
Pretrial/Pre-
Sentenced
Sentenced Felon
Parole Violation
Chart 43: Average Proportion of Incarcerated offenders, by Type of
Offense (Felony Violent) and Custody Status
Chi Sq.(3,659) = 4.62E, p < .001
Percent Type of
Offense by Custody
Status (State
Average)
Chart 42
Chart 43
ASUS Scale by Custody
Status

5544Sentenced Petty/Misdemeanants
4433Pretrial/Pre-Sentenced
3252Sentenced Felon
2115Parole Violation
1321Probation Violation
Highest
Average Rank% Motivation% Defensive% MoodCustody Status
Note: The table above represents custody status risk rankings from 1 thru 9, based on the highest to lowest percentiles of offenders for each of the specified “at risk” indicators. The Highest Average Rank is the custody status with the lowest combined rankings, which represent the severest average risk-rankings across five ASUS scales. Custody statuses that have the same combined risk-rankings receive the same Average Rank (prefaced by a “tied” remark). Computed Risk Rankings are from statistically significant ASUS scales only.
Differences in correctional facilities for Disruption, Involvement, Social, and Global scales are not statistically significant, and subsequently not reported.
*Recommended Treatment Level represents the combined proportion of offenders at Residential Treatment, Therapeutic Community, and Assessment for Psychopathy levels.
Custody Status Risk Rankings, by ASUS Risk Indicators (from Initial ASUS Assessments)
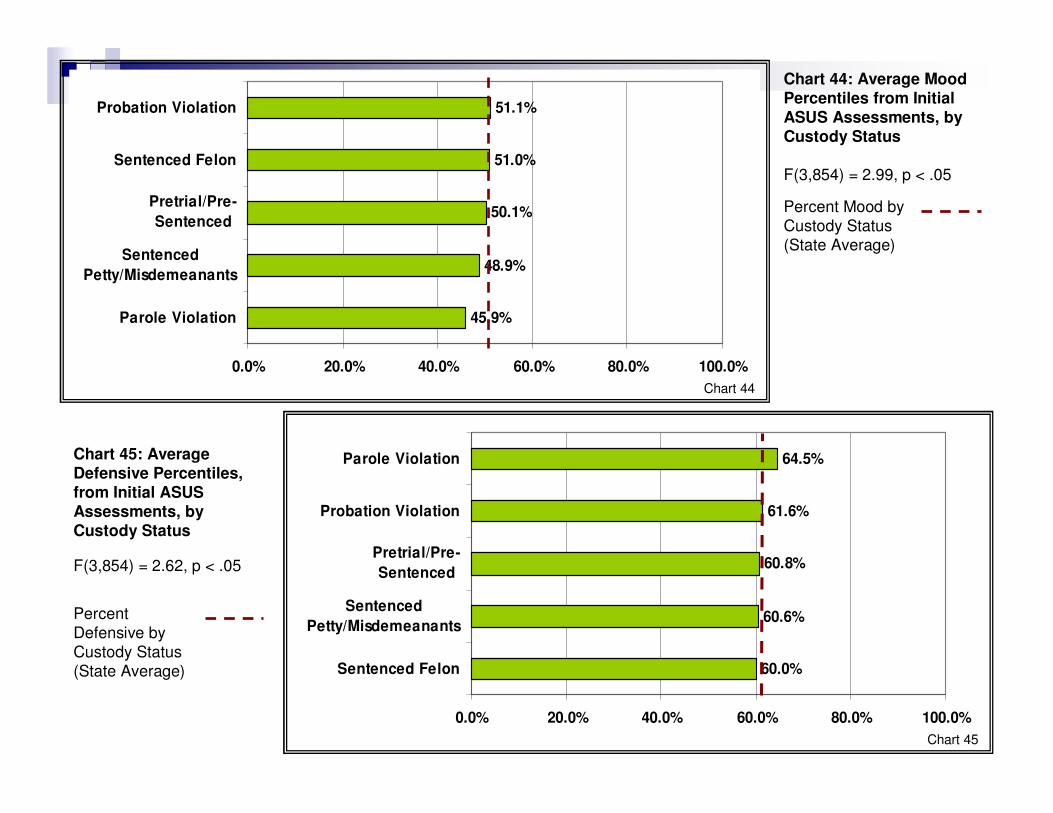
Chart 44: Average Mood
Percentiles from Initial
ASUS Assessments, by Custody Status
F(3,854) = 2.99, p < .05
Percent Mood by
Custody Status
(State Average)
45.9%
48.9%
50.1%
51.0%
51.1%
0.0% 20.0% 40.0% 60.0% 80.0% 100.0%
Parole Violation
Sentenced
Petty/Misdemeanants
Pretrial/Pre-
Sentenced
Sentenced Felon
Probation Violation
60.0%
60.6%
60.8%
61.6%
64.5%
0.0% 20.0% 40.0% 60.0% 80.0% 100.0%
Sentenced Felon
Sentenced
Petty/Misdemeanants
Pretrial/Pre-
Sentenced
Probation Violation
Parole ViolationChart 45: Average Defensive Percentiles,
from Initial ASUS Assessments, by Custody Status
F(3,854) = 2.62, p < .05
Percent
Defensive by
Custody Status
(State Average)
Chart 44
Chart 45

Chart 46: Average Motivation Percentiles from
Initial ASUS Assessments, by Custody Status
F(3,854)
=
2.99,
p
<
.05
F(3,854)
=
2.99,
p
<
.05
F(3,852) = 6.90, p < .01 Percent Motivation by Custody
Status (State Average)
52.1%
55.5%
55.8%
61.6%
66.0%
0.0% 20.0% 40.0% 60.0% 80.0% 100.0%
Sentenced
Petty/Misdemeanants
Pretrial/Pre-
Sentenced
Probation Violation
Sentenced Felon
Parole Violation
LSI-R by Custody Status

555155452352
Sentenced Petty/
Misdemeanants
443541535541Parole Violation
3343343411 (tie)14
Pretrial/
Pre-Sentenced
222422214423Sentenced Felon
1112131231 (tie)35Probation Violation
Highest
Average Rank
LSI-RA/OE/PAODCOML/RACCF/MFINE/ECHCustody Status
Custody Status Risk Rankings, by LSI-R Sub domains (from Initial LSI-R Assessments)
� Criminal History (CH)
� Education/Employment (E/E)
� Financial (FIN)
� Family/Marital (F/M)
� Accommodations (ACC)
� Leisure/Recreation (L/R)
� Companions (COM)
� Alcohol/Drugs (AOD)
� Emotion/Personal (E/P)
� Attitudes/Orientation (A/O)
� LSI-R Risk Categories High and Surveillance only (LSI-R)
KEY:
Note: The table above represents custody status risk rankings from 1 thru 9, based on the highest to lowest percentiles of
offenders for each of the specified “at risk” indicators. The Highest Average Rank is the custody status with the lowest
combined rankings, which represent the severest average risk-rankings across ten LSI-R subdomains and total score.
Custody Statuses that have the same risk-ranks receive the same Average Rank (prefaced by a “tied” remark). Computed
Risk Rankings are from statistically significant LSI-R subdomains and total score only.

Chart 47: Average Total LSI-R Score from
Initial LSI-R Assessments, by Custody Status
F(3,854)
=
2.99,
p
<
.05
F(3,854)
=
2.99,
p
<
.05
F(3,931) = 3.59, p < .01 Total LSI Score by Custody
Status (State Average)
22.9
23.1
24.4
24.6
24.7
0 20 40 60 80 100
Sentenced
Petty/Misdemeanants
Parole Violation
Pretrial/Pre-
Sentenced
Sentenced Felon
Probation Violation

Chart 48: Average
Criminal History
Percentiles from Initial LSI-R Assessments, by Custody Status
F(3,931) = 9.34, p < .001
Percent Criminal
History by
Custody Status
(State Average)44.7%
51.1%
51.5%
53.2%
56.9%
0.0% 20.0% 40.0% 60.0% 80.0% 100.0%
Probation Violation
Pretrial/Pre-
Sentenced
Sentenced Felon
Sentenced
Petty/Misdemeanants
Parole Violation
49.0%
49.7%
55.9%
56.4%
57.0%
0.0% 20.0% 40.0% 60.0% 80.0% 100.0%
Sentenced
Petty/Misdemeanants
Parole Violation
Probation Violation
Sentenced Felon
Pretrial/Pre-
Sentenced
Chart 49: Average Education/ Employment Percentiles from Initial
LSI-R Assessments, by Custody Status
F(3,931) = 7.08, p < .001
Percent Education/
Employment by
Custody Status
(State Average)
Chart 48
Chart 49
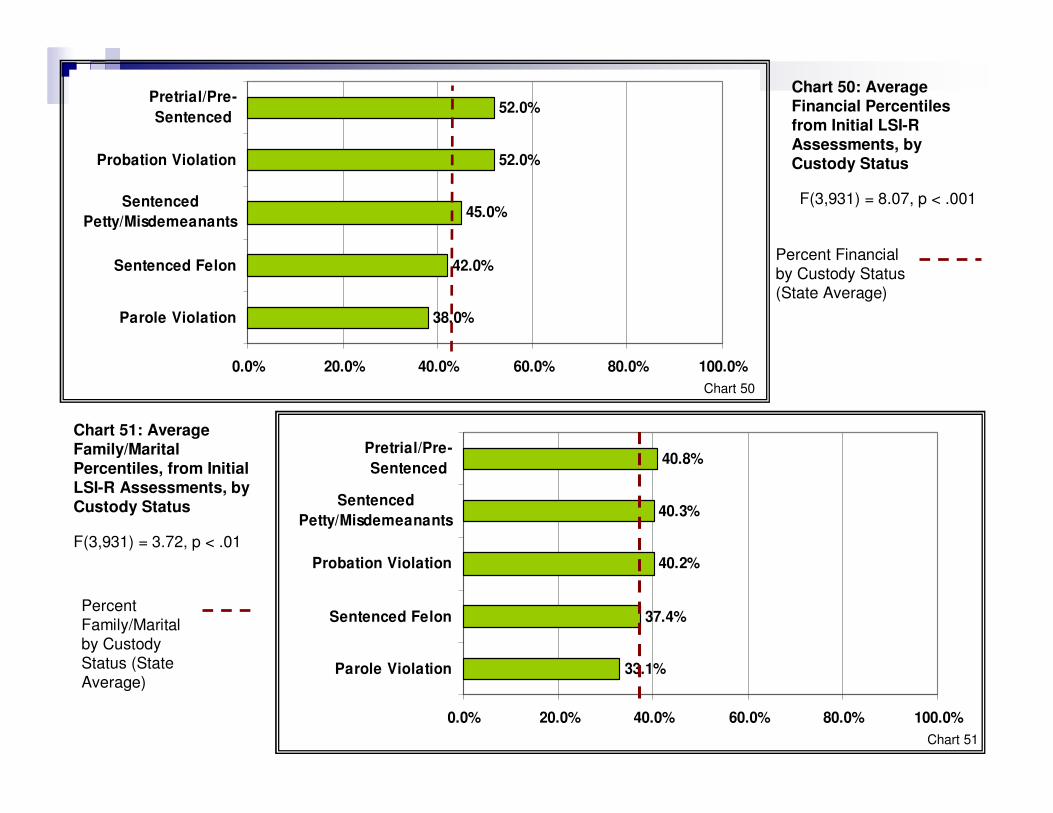
Chart 50: Average
Financial Percentiles
from Initial LSI-R Assessments, by Custody Status
F(3,931) = 8.07, p < .001
Percent Financial
by Custody Status
(State Average)
38.0%
42.0%
45.0%
52.0%
52.0%
0.0% 20.0% 40.0% 60.0% 80.0% 100.0%
Parole Violation
Sentenced Felon
Sentenced
Petty/Misdemeanants
Probation Violation
Pretrial/Pre-
Sentenced
33.1%
37.4%
40.2%
40.3%
40.8%
0.0% 20.0% 40.0% 60.0% 80.0% 100.0%
Parole Violation
Sentenced Felon
Probation Violation
Sentenced
Petty/Misdemeanants
Pretrial/Pre-
Sentenced
Chart 51: Average Family/Marital Percentiles, from Initial
LSI-R Assessments, by Custody Status
F(3,931) = 3.72, p < .01
Percent
Family/Marital
by Custody
Status (State
Average)
Chart 50
Chart 51

Chart 52: Average
Accommodation
Percentiles, from Initial LSI-R Assessments, by Custody Status
F(3,931) = 4.88, p < .001
Percent
Accommodation
by Custody
Status (State
Average)27.0%
30.0%
34.0%
35.0%
37.0%
0.0% 20.0% 40.0% 60.0% 80.0% 100.0%
Sentenced
Petty/Misdemeanants
Pretrial/Pre-
Sentenced
Parole Violation
Probation Violation
Sentenced Felon
62.0%
68.0%
71.0%
74.0%
75.0%
0.0% 20.0% 40.0% 60.0% 80.0% 100.0%
Parole Violation
Sentenced
Petty/Misdemeanants
Pretrial/Pre-
Sentenced
Sentenced Felon
Probation Violation
Chart 53: Average Leisure/Recreation Percentiles, from Initial
LSI-R Assessments, by Custody Status
F(3,931) = 8.51, p < .001
Percent Leisure/
Recreation by
Custody Status
(State Average)
Chart 52
Chart 53
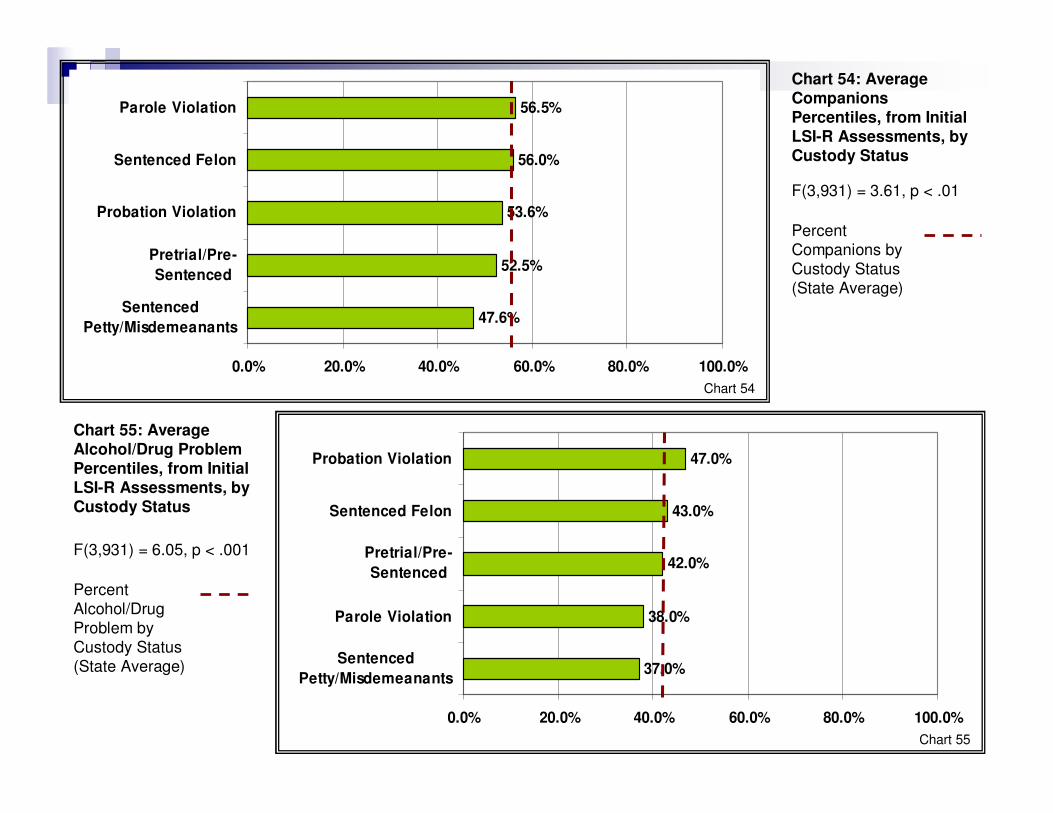
Chart 54: Average
Companions
Percentiles, from Initial LSI-R Assessments, by Custody Status
F(3,931) = 3.61, p < .01
Percent
Companions by
Custody Status
(State Average)
47.6%
52.5%
53.6%
56.0%
56.5%
0.0% 20.0% 40.0% 60.0% 80.0% 100.0%
Sentenced
Petty/Misdemeanants
Pretrial/Pre-
Sentenced
Probation Violation
Sentenced Felon
Parole Violation
37.0%
38.0%
42.0%
43.0%
47.0%
0.0% 20.0% 40.0% 60.0% 80.0% 100.0%
Sentenced
Petty/Misdemeanants
Parole Violation
Pretrial/Pre-
Sentenced
Sentenced Felon
Probation Violation
Chart 55: Average Alcohol/Drug Problem Percentiles, from Initial
LSI-R Assessments, by Custody Status
F(3,931) = 6.05, p < .001
Percent
Alcohol/Drug
Problem by
Custody Status
(State Average)
Chart 54
Chart 55
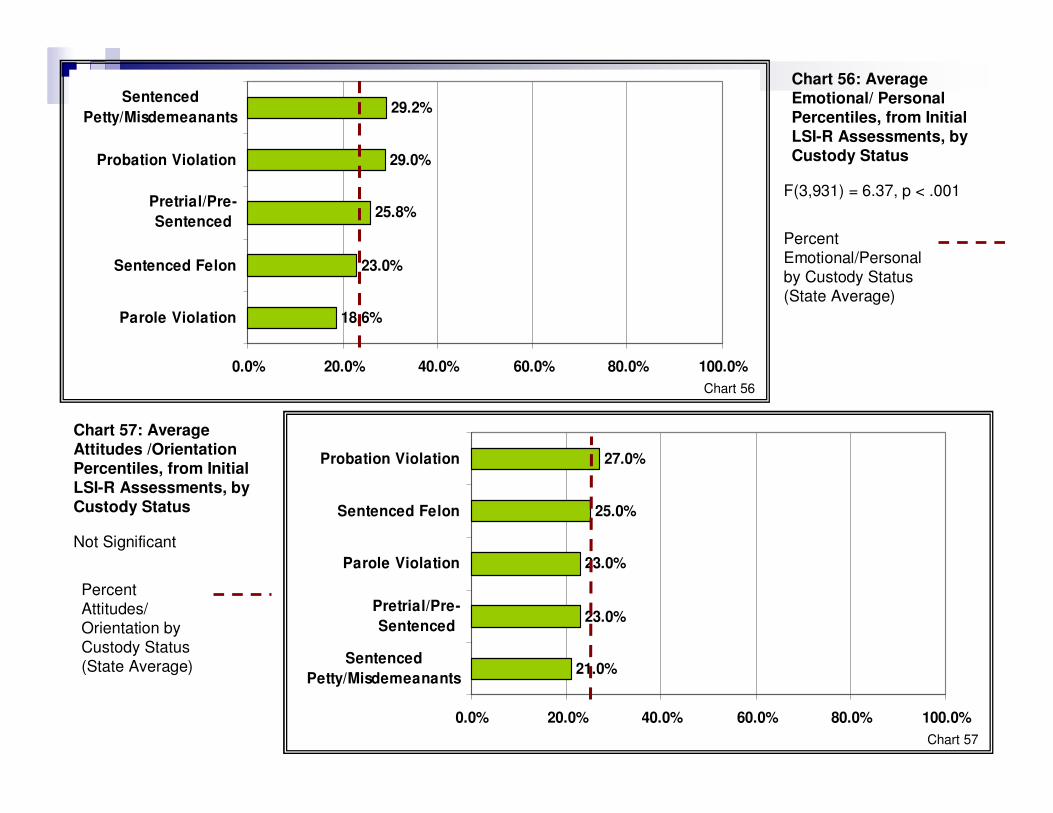
Chart 56: Average
Emotional/ Personal
Percentiles, from Initial LSI-R Assessments, by Custody Status
F(3,931) = 6.37, p < .001
Percent
Emotional/Personal
by Custody Status
(State Average)
18.6%
23.0%
25.8%
29.0%
29.2%
0.0% 20.0% 40.0% 60.0% 80.0% 100.0%
Parole Violation
Sentenced Felon
Pretrial/Pre-
Sentenced
Probation Violation
Sentenced
Petty/Misdemeanants
21.0%
23.0%
23.0%
25.0%
27.0%
0.0% 20.0% 40.0% 60.0% 80.0% 100.0%
Sentenced
Petty/Misdemeanants
Pretrial/Pre-
Sentenced
Parole Violation
Sentenced Felon
Probation Violation
Chart 57: Average Attitudes /Orientation Percentiles, from Initial
LSI-R Assessments, by Custody Status
Not Significant
Percent
Attitudes/
Orientation by
Custody Status
(State Average)
Chart 56
Chart 57