Department of Correctional Services Transforming prisons into correctional centres - places of new...
13
Department of Correctiona l Services Transforming prisons into correctional centres - places of new beginnings DEPARTMENT OF CORRECTIONAL SERVICES
-
Upload
roxanne-foster -
Category
Documents
-
view
251 -
download
2
Transcript of Department of Correctional Services Transforming prisons into correctional centres - places of new...

Department of
CorrectionalServices
Transforming prisons into correctional centres - places of new beginnings
DEPARTMENT OF CORRECTIONAL SERVICES

2005/06 – 2007/08
DEPARTMENT OF CORRECTIONAL SERVICES

33
PRINCIPLES FOR BUDGET ALLOCATION
2005/06
• Allocation for 2005/06 provided per Region, Programme , per Activity and Economic Classification.
• Allocation of budget based on zero bases / incremental bases as prescribed by the MTEF manual.

44
PRINCIPLES FOR BUDGET ALLOCATION
2005/06
• Inflation provided was 5.5% (Provision for price fluctuations etc).
• Annual salary adjustment of 4.8%.
• Pensions contribution of 16%.
• Key Cost Drivers : Personnel totals.
: Offender and awaiting trial totals.
: Strategic directions
(Implementation of White Paper and Centers of Excellence).

MTEF BASELINE ALLOCATIONS 2004/2005 - 2006/2007
Year 0Year 0
2004/20052004/2005
R’000R’000
Year 0+1Year 0+1
2005/20062005/2006
R’000R’000
Year 0+2Year 0+2
2006/20072006/2007
R’000R’000
Year 0+3Year 0+3
2007/20082007/2008
R’000R’000
Baseline Baseline AllocationAllocation
8 457 4928 457 492 9 234 0859 234 085 9 960 4889 960 488 10 974 34310 974 343
% Increase% Increase 11.811.8 9.29.2 7.97.9 10.210.2

66
ENE Baseline Allocations per Programme
2005/2006 – 2007/2008
2005/062005/06R’000R’000
2006/072006/07R’000R’000
2007/082007/08R’000R’000
1. Administration1. Administration 2 504 7482 504 748 2 639 6232 639 623 2 820 5672 820 5672. Security2. Security 3 513 1193 513 119 3 884 4413 884 441 4 243 0334 243 0333. Corrections3. Corrections 498 582498 582 579 607579 607 815 784815 7844. Care4. Care 932 824932 824 1 021 3631 021 363 1 150 7421 150 7425. Development5. Development 398 881398 881 417 799417 799 448 113448 1136. After Care6. After Care 341 693341 693 359 583359 583 385 970385 9707. Facilities7. Facilities 1 704 8031 704 803 1 757 9401 757 940 1 844 9951 844 995 PPP’s PPP’s 559 693559 693 579 657579 657 604 628604 628 Capital WorksCapital Works 984 396984 396 1 009 0381 009 038 1 059 4711 059 471 Facility ManagementFacility Management 160 714160 714 169 245169 245 180 896180 896Internal ChargesInternal Charges (660 565)(660 565) (699 868)(699 868) (734 861)(734 861)TotalTotal 9 234 0859 234 085 9 960 4889 960 488 10 974 34310 974 343

ENE Baseline Allocations per GFS
2005/2006 – 2007/20082005/062005/06R’000R’000
2006/072006/07R’000R’000
2007/082007/08R’000R’000
1. COMPENSATION OF EMP.1. COMPENSATION OF EMP. 5 902 5745 902 574 6 443 3656 443 365 7 094 8657 094 865
2. GOODS AND SERVICES2. GOODS AND SERVICES 1 956 1061 956 106 2 108 5432 108 543 2 394 4622 394 462
3. INT AND RENT ON LAND3. INT AND RENT ON LAND 4545 4848 5050
4.TRANFER PAYMENTS4.TRANFER PAYMENTS
Provinces & municipalities Provinces & municipalities 17 845 17 845 18 61818 618 20 17820 178Departmental agencies & accDepartmental agencies & acc 2 8902 890 3 0633 063 3 2163 216HouseholdsHouseholds 17 38917 389 19 71419 714 21 19421 194
CAPITAL ASSETSCAPITAL ASSETS
Buildings & other fixed Buildings & other fixed structures structures
1 205 5321 205 532 1 231 4351 231 435 1 286 9161 286 916
Machinery and equipmentMachinery and equipment 131 704131 704 135 702135 702 153 462153 462
TOTAL PAYMENTSTOTAL PAYMENTS 9 234 0859 234 085 9 960 4889 960 488 10 974 34310 974 343
88
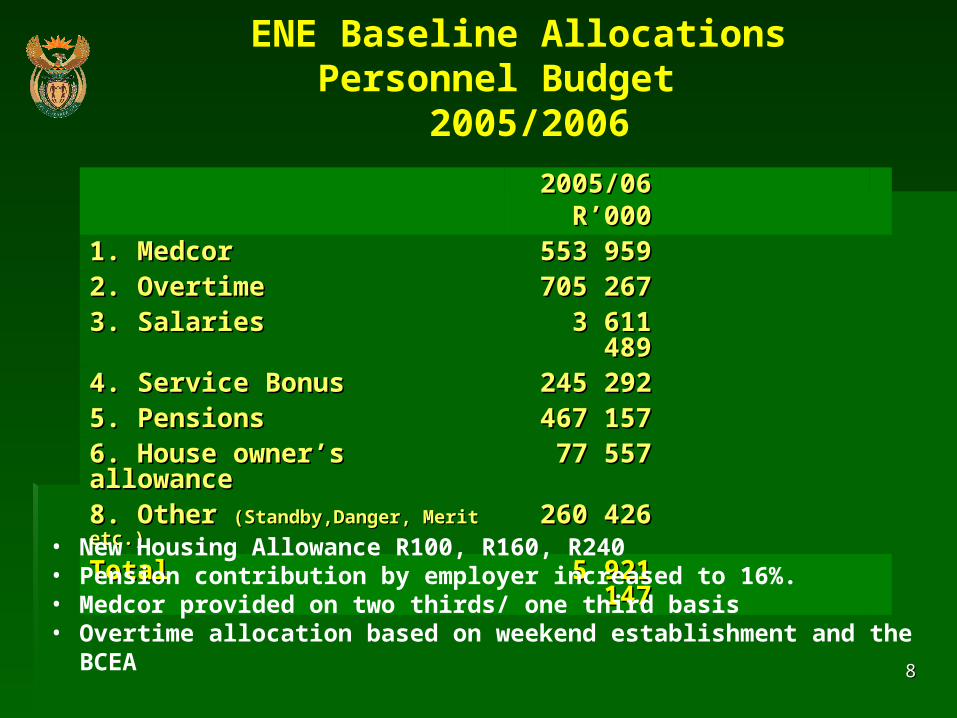
ENE Baseline Allocations Personnel Budget
2005/2006
2005/062005/06R’000R’000
1. Medcor1. Medcor 553 959553 959
2. Overtime2. Overtime 705 267705 267
3. Salaries3. Salaries 3 611 4893 611 489
4. Service Bonus4. Service Bonus 245 292245 292
5. Pensions5. Pensions 467 157467 157
6. House owner’s allowance6. House owner’s allowance 77 55777 557
8. Other 8. Other (Standby,Danger, Merit etc.)(Standby,Danger, Merit etc.)
260 426260 426
TotalTotal 5 921 1475 921 147• New Housing Allowance R100, R160, R240• Pension contribution by employer increased to 16%. • Medcor provided on two thirds/ one third basis• Overtime allocation based on weekend establishment and the BCEA

99
R egi onsDA SC P
2005/ 06
DA I P
2005/ 06
Fi n. DA I P
2005/ 06
Fi n. DA
P er s
% of V ote
A l l oc -
G auteng 1 5 035 49, 659 50, 267 7, 039 1 3%
Wes ter n C ape 1 3 576 29, 81 4 31 , 743 6, 239 1 1 %
N/ Wes t 651 4 1 1 , 600 1 1 , 670 1 , 747 4%
L i mpopo 6227 8, 853 8, 960 972 1 %
M pumal anga 4621 1 0, 073 1 0, 748 2, 250 4%
K waz ul u/ Natal 1 6 636 30, 1 53 32, 1 44 5, 1 23 9%
E as ter n C ape 8 731 22, 899 23, 620 4, 352 8%
N/ C ape 2637 5, 892 5, 730 1 , 035 2%
Fr ee State 4933 1 6, 768 1 7, 1 1 8 3, 465 6%
Head Offi c e 0 0 0 3, 778 42%T OT A L 75 908 1 85, 71 1 1 92, 000 36, 000 1 00%
ORIGINAL BUDGET PER REGION COST DRIVERS 2005/2006

ORIGINAL BUDGET PER PROVINCE
Regions2005/06
R '000 %
Gauteng 1,231,652 13%
Western Cape 1,039,511 11%
N/West 321,953 3%
Limpopo 108,937 1%
Mpumalanga 393,134 4%
Kwazulu/ Natal 857,051 9%
Eastern Cape 727,729 8%
N/Cape 171,525 2%
Free State 584,643 6%
Head Office 3,797,950 41%
TOTAL 9,234,085 100%
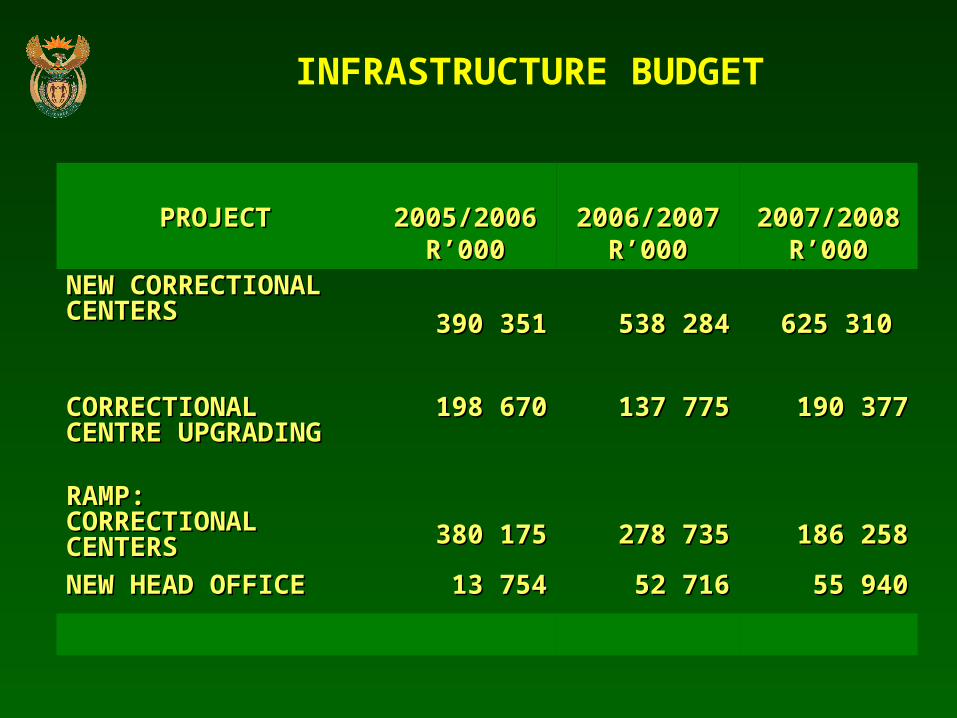
INFRASTRUCTURE BUDGET
PROJECTPROJECT 2005/20062005/2006R’000R’000
2006/20072006/2007R’000R’000
2007/20082007/2008R’000R’000
NEW CORRECTIONAL NEW CORRECTIONAL CENTERSCENTERS 390 351390 351 538 284538 284 625 310 625 310
CORRECTIONAL CORRECTIONAL CENTRE UPGRADINGCENTRE UPGRADING
198 670198 670 137 775137 775 190 377190 377
RAMP: RAMP: CORRECTIONAL CORRECTIONAL CENTERSCENTERS 380 175380 175 278 735278 735 186 258186 258
NEW HEAD OFFICENEW HEAD OFFICE 13 75413 754 52 71652 716 55 94055 940

2005/20062005/2006R’000R’000
2006/20072006/2007R’000R’000
2007/20082007/2008R’000R’000
LEEUWKOPLEEUWKOP 97 58897 588 130 449130 449 72 56072 560
KLERKSDORPKLERKSDORP 97 58897 588 130 449130 449 72 56072 560
KIMBERLEYKIMBERLEY 97 58897 588 130 449130 449 72 56072 560
NIGELNIGEL 97 58897 588 130 449130 449 72 560 72 560
NEW CORR. CENTRE NEW CORR. CENTRE (KZN)(KZN)
-- 3 6783 678 3 7503 750
NEW CORR. CENTRE NEW CORR. CENTRE (LIMP)(LIMP)
-- 5 7385 738 3 7303 730
NEW CORR. CENTRE NEW CORR. CENTRE (WC)(WC)
-- 3 5363 536 155 620155 620
NEW CORR. CENTRE NEW CORR. CENTRE (EC)(EC)
-- 3 5363 536 171 970171 970
TOTALTOTAL 390 350390 350 538 284538 284 625 309625 309
NEW CORRECTIONAL CENTRES

1313
Correctional Services values your role in breaking cycle of crime: in making rehabilitation work.
Thank you
Together we can strengthen social compact against crime, for better life.