HARTNELL COLLEGE STUDENT EQUITY PLAN · Web viewFocusing on the needs of the Salinas Valley,...
74
Hartnell College Student Equity Plan November 21, 2014 1 2 3 4 5 6 7 8 9 10 11 12 13 14 15 16 17 18 19 20 21 22 23 24 25 26 27 28
-
Upload
truongcong -
Category
Documents
-
view
214 -
download
0
Transcript of HARTNELL COLLEGE STUDENT EQUITY PLAN · Web viewFocusing on the needs of the Salinas Valley,...

Hartnell College
Student Equity Plan
November 21, 2014
1
23456789
10111213141516171819
20212223
2425262728

HARTNELL COLLEGE STUDENT EQUITY PLAN
Table of Contents
Signature Page..............................................................................................................
Executive Summary.......................................................................................................Target Groups............................................................................................................................Goals..........................................................................................................................................Activities.....................................................................................................................................Resources...................................................................................................................................Contact Person/Student Equity Coordinator.............................................................................
Campus-Based Research................................................................................................Overview....................................................................................................................................Indicator Definitions and Data...................................................................................................
Access...................................................................................................................................Course Completion (Retention)............................................................................................ESL and Basic Skills Completion............................................................................................Degree and Certificate Completion......................................................................................Transfer................................................................................................................................
Goals and Activities.......................................................................................................Access...................................................................................................................................Course Completion (Retention)............................................................................................ESL and Basic Skills Completion............................................................................................Degree and Certificate Completion......................................................................................Transfer................................................................................................................................
Budget..........................................................................................................................Sources of Funding...............................................................................................................
Evaluation Schedule and Process...................................................................................
Attachments (Optional).................................................................................................
2014 Student Equity Plan ii
29
3031323334
35
36
3738394041
42
4344454647484950
51
525354555657
58
59
60
6162

Hartnell CollegeStudent Equity Plan
Signature Page
District: Hartnell Community College District Date Approved by Board of Trustees:
College President:
Dr. Willard Lewallen
Vice President of Student Services:
Dr. Romero Jalomo
Vice President of Instruction:
Dr. Lori Kildal
Academic Senate President:
Ms. Carol Kimbrough
Student Equity Coordinator/Contact Person:
Ms. Kathy Mendelsohn
2014 Student Equity Plan iii
6364
65
66
67
68
6970
71

Executive Summary
2014 Student Equity Plan 4
72

District: Hartnell Community College District DRAFT
College: Hartnell College
EXECUTIVE SUMMARY
Executive SummaryTarget GroupsGoalsActivitiesResourcesContact Person/Student Equity Coordinator
Founded in 1920, Hartnell College is one of the oldest educational institutions in California and operates three campuses in the Salinas Valley: the Main Campus at 411 Central Avenue in Salinas, which opened in 1936; the Alisal Campus (formerly East Campus) at 1752 E. Alisal Street in Salinas; and the King City Education Center at 117 N. Second Street in King City, located in southern Monterey County. The King City Center celebrated its ten-year anniversary in 2012. The college also delivers on-site instruction at communities throughout its District.
The college’s nearly 10,000 students (7,100 FTES) are diverse, with Latino students accounting for more than 60percent of enrollments, reflecting the greater community population. Many students are the first in their family to attend college, and many speak Spanish as their primary language. Hartnell has earned the federal designation as a Hispanic Serving Institution. In 2012, the college was awarded two Title III HSI STEM and Articulation grants for the purpose of improving student access and success for underrepresented groups in the STEM disciplines.
With more than half of the District’s population living below the poverty level of income, the college provides an opportunity for making a significant social and economic impact on the community and the lives of the individuals.
Hartnell College is committed to ensuring student equity throughout the programs and services it offers, as is evidenced in Board Policy 5300:
The Board is committed to assuring student equity in educational programs and college services. The CEO or designee shall establish and implement a student equity plan that meets the Title 5 standards for such a plan.
This commitment is also portrayed in the College’s mission statement:
Focusing on the needs of the Salinas Valley, Hartnell College provides educational opportunities for students to reach academic goals in an environment committed to student learning, achievement and success.
In addition, Hartnell College has included ensuring equity across the college in its strategic planning:
2014 Student Equity Plan 5
73
74
75
7677787980818283848586878889909192939495969798
100101102103104105106107108109110111112113114

District: Hartnell Community College District DRAFT
College: Hartnell College
Strategic Priority 1—Student Access
Goal 1A: Hartnell College will provide higher education, workforce development, and lifelong learning opportunities—with seamless pathways—to all of the college’s present and prospective constituent individuals and groups.
Outcome 1A.6: Increase participation rates for historically underrepresented studentsOutcome 1A.5: Provide an inviting, welcoming, and supportive campus atmosphere for all student groups
Strategic Priority 2—Student Success
Goal 2A: Hartnell College will provide a supportive, innovative, and collaborative environment to help students pursue and achieve educational success.
Outcome 2B.1: By academic year 2017-2018, Hartnell College will achieve approximately equal success rates among all demographic groups for measures on the California Community College Chancellor’s Office “Student Success Scorecard”
Strategic Priority 3—Employee Diversity and Development Goal 3A: Hartnell College is committed to 1) increasing diversity among its employees; 2) providing an environment that is safe for and inviting to diverse persons, groups, and communities; and 3) becoming a model institution of higher education whose respect for diversity is easily seen and is fully integrated throughout its policies, practices, facilities, signage, curricula, and other reflections of life at the college.
Outcome 3A.1: During 2013-14, establish a Diversity Development Committee. Outcome 3A.2: To help Hartnell College become an ever-more welcoming place for all members of the campus community, by the end of the 2015—2016 academic year, successfully establish Hartnell College as a place that embraces all underrepresented, disenfranchised, and other protected persons and groups.
Hartnell College further supports the importance of equity by including it as one of the tenets of its core values:
Diversity and Equity—We embrace and celebrate differences and uniqueness among all students and employees. We welcome students and employees of all backgrounds.
Hartnell College began the development of the Student Equity Plan by inviting faculty, management, staff, and students to participate in the process; as a result, the SEP Work Group includes participants from the above constituents, who have been meeting regularly to discuss and analyze data and to develop the narrative, goals, activities, outcomes, and budget for the plan. The chair of the group meets weekly with the SEP/SSSP (Student Equity Plan/Student
2014 Student Equity Plan 6
115116117118119
121122123
124125126127
129130131
132133134135136137138139140141142143144145146147148149150151152153154155156

District: Hartnell Community College District DRAFT
College: Hartnell College
Success and Support Program) Steering Committee. Upon completion of the plan, it will be shared with the councils and committees that comprise the College’s participative governance structure before being submitted to the Board of Trustees and the Chancellor’s Office.
Target Groups
The SEP Work Group examined student equity success data by using the tools recommended in the “Updated Student Equity Plan” document as well as local college tools. Data was discussed and analyzed in the framework of the five student equity success indicators as identified by the Board of Governors in 2001:
A. AccessB. Course CompletionC. ESL and Basic Skills CompletionD. Degree and Certificate CompletionE. Transfer
Each of these success indicators was analyzed by using the disaggregated subgroups of gender, ethnicity, and age as well as DE, foster youth, and veterans. In addition, two methodologies (proportionality and the 80-Percent Rule) were used to measure disproportionate impact.
Resources used to compile data include the following: CCCCO Management Information Systems Data Mart to examine data, specifically the Basic Skills Cohort Progress Tracker, Enrollment Retention and Success Rate, Student Success Scorecard Metrics, Special Population/Term Count and Matriculation measures. Data was also gathered from Data on Demand and Hartnell’s Financial Aid Office and Student Services’ various Program Planning and Assessment (PPA) for Services, Offices & Non-Instructional Programs Comprehensive Review, Annual Review & Action Plan[s] Spring 2014. In addition, data was extracted from the College’s Title V tools.
The College noted the following from the data that were analyzed
A disproportionate impact exists in the successful completion of distance education (DE) courses vs. non-DE; the College needs to disaggregate data to determine which groups would benefit from more support services for courses offered in the DE modality.
Even in areas with no disproportionate impact, successful completion and persistence of English and math classes should be examined (especially from courses one level below transfer to transfer-level courses).
Foster youth show lower rates of success/persistence in all three areas examined.
2014 Student Equity Plan 7
157158159160161162163164165166167168169170171172173174175176177178179180181182183184185186187188189190191192193194195196197198

District: Hartnell Community College District DRAFT
College: Hartnell College
The “Under 17” age group is more successful in completion of courses than other age groups. (This may be because of high school concurrent enrollment of students in that age group.) The College should review developing success strategies for other age groups.
NOTE: Goals, Activities, and Outcomes are in the Goals, Activities, and Outcomes section of the plan. Once they have been finalized, they will be copied below into the Executive Summary
A. AccessThe percentage of each population group that is enrolled compared to that group’s representation in the adult population within the community served. This percentage is frequently calculated as a participation rate.
B. Course Completion The ratio of the number of credit courses that students, by population group, complete compared to the number of courses in which students in that group are enrolled on the census day of the term.
C. ESL and Basic Skills CompletionThe ratio of the number of students by population group who complete a degree-applicable course after having completed the final ESL or basic skills course compared to the number of those students who complete such a final ESL or basic skills course.
D. Degree and Certificate CompletionThe ratio of the number of students by population group who receive a degree or certificate to the number of students in that group with the same informed matriculation goal as documented in the student educational plan developed with a counselor/advisor.
E. TransferThe ratio of the number of students by population group who complete a minimum of 12 units and have attempted a transfer level course in mathematics or English, to the number of students in that group who actually transfer after one or more (up to six) years.
Resources:
Resources to implement the Student Equity Plan goals and activities to achieve outcomes are provided by the following sources of funding:
BSI funding Categorical funding Grant funding
o Title III, Part F, HSI STEM and Articulation Program, US Department of Educationo Title V, Part A, Developing Hispanic-Serving Institutions Program, US Department of Educationo TRiO Student Support Program, US Department of Education
2014 Student Equity Plan 8
199200201202203204205206207208209210211212213214215
216217218219220221222223224225226227228229230231232233234235236237238239240241

District: Hartnell Community College District DRAFT
College: Hartnell College
o National Science Foundationo California Endowmento Youth Empowerment Success Strategies Independent Living (YESS-ILP)—Foundation for
California Community Collegeso Independent Living Program (ILP)—County of Montereyo Transitional Age Foster Youth Health and Wellness Program (TAFY)o Foundation for California Community Collegeso CA College Pathways Initiativeo Walter S. Johnson Foundation
General Fund allocations for support programs, salaries, and benefits and professional development
Funding is allocated based on Program Planning and Assessment (PPA) documents and on alignment to the College’s Strategic Planning Priorities. The Student Equity Plan was developed by a work group of faculty, management, staff, and students and vetted through the College’s councils and committee structure.
Contact Person:
The contact person for the Hartnell College Student Equity Plan is
Kathy MendelsohnAcademic Affairs Dean, Learning Support, Resources, and LanguagesHartnell College831.755.6827 [email protected]
2014 Student Equity Plan 9
242243244245246247248249250251252253254255256257258259260261262263264265

District: Hartnell Community College District DRAFT
College: Hartnell College
Campus-Based Research
2014 Student Equity Plan 10
266267268

District: Hartnell Community College District DRAFT
College: Hartnell College
CAMPUS-BASED RESEARCH
Overview
Each of the five success indicators was analyzed based on gender, ethnicity, and age. Analysis of the data identified other groups in which gaps were observed, such as with distance education (DE). In addition, foster youth data and veterans’ data were examined.
Indicator Definitions and Data
A two part methodology was employed in conducting the following research. Per the instructions provided by the CCCCO:
The proportionality methodology compares the percentage of a disaggregated subgroup in an initial cohort to its own percentage in the resultant outcome group. The formula for proportionality is the percentage in the outcome group divided by the percentage in the original cohort (outcome percentage/cohort percentage). A ratio of 1.0 indicates that a subgroup is present in both conditions at the same rate. A ratio of less than 1.0 indicates that the subgroup is less prevalent in the outcome than the cohort. Conversely, a ratio greater than 1.0 indicates that the subgroup is more prevalent in the outcome than the cohort. The higher the proportionality, the higher the rate at which a subgroup has attained a desired educational outcome; the lower the proportionality index the lower the attainment rate.
The second method is the “80% Rule” methodology which was used in Title VII enforcement by the US Equal Opportunity Commission, Department of Labor, and the Department of Justice. The 80% Rule (the Index) states that:
A selection rate for any race, sex, or ethnic group which is less than four-fifths (4/5) (or eighty percent) of the rate for the group with the highest rate will generally be regarded by the Federal enforcement agencies as evidence of adverse impact, while a greater than four-fifths rate will generally not be regarded by Federal enforcement agencies as evidence of adverse impact. [Section 60-3, Uniform Guidelines on Employee Selection Procedure (1978); 43 FR 38295 (August 25, 1978)]
Using this methodology, the Index is calculated by dividing the completion rate of a non-reference subgroup into the completion rate of the reference subgroup, typically the one with the highest completion rate. A result of less than 80 percent is considered evidence of a disproportionate impact.
This investigation used the CCCCO Management Information Systems Data Mart to examine data, specifically the Basic Skills Cohort Progress Tracker, Enrollment Retention and Success Rate, Student Success Scorecard Metrics, Special Population/Term Count and Matriculation
2014 Student Equity Plan 11
269
270271272273274275276277278279280281282283284285286287288289290291292293294295296297298299300301302303304305306307308309310

District: Hartnell Community College District DRAFT
College: Hartnell College
measures. Data was also gathered from Data on Demand and Hartnell’s Financial Aid Office and Student Services’ various Program Planning and Assessment (PPA) for Services, Offices & Non-Instructional Programs Comprehensive Review, Annual Review & Action Plan[s] Spring 2014. In addition, data was extracted from the College’s own self-service research tools.
The five success indicator definitions as provided in “Attachment A: Instructions for Completion of the Student Equity Plan” were used in creating this report. In addition, other groups, such as foster youth, veterans, and DE students were included in the analysis of disproportionality.
2014 Student Equity Plan 12
311312313314315316317318319

District: Hartnell Community College District DRAFT
College: Hartnell College
CAMPUS-BASED RESEARCH
A. ACCESS. Compare the percentage of each population group that is enrolled to the percentage of each group in the adult population within the community served.
Research Findings
As reported in the Executive Summary, the Access indicator was analyzed using the disaggregated subgroups of gender, ethnicity, and age, as well as DE, foster youth, and veterans.
Access for Hispanics is similar in numbers to the population at 65 percent, high for non-Hispanic/Whites at 45 percent and low in all other demographic groups.
In addition to looking at access to college enrollment, the college also reviewed data about access to college services. The service data reviewed used the following indicators:
Orientation Services Received During the Term Orientation Services Received Prior Terms Assessment Placement Services Received during the Term Assessment Services Placement Received Prior Terms Assessment Services Other Received during the Term Counseling/Advisement Services Received during the Term Student Education Plan Development Services Received during the Term Academic Follow-up Services Received during the Term
Gender. The data for Hartnell College show that the number of female and male students enrolled is fairly equal. This is unlike many colleges, where female enrollments are much greater than the enrollments of male students. Although the College shows equal enrollment by gender, it is important to analyze the access of support services by gender. The access rates for men and women using support services were equal at 50 percent overall. Only half the cohort actually accessed any support (see table below). More than half the students who accessed services accessed counseling. Women are slightly more likely to access services before or during the first semester; however, overall men used counseling services more than women at a 3 to 2 ratio.
It is recommended that future analysis include looking at services used by students first by gender and then by ethnicity and age group.
2014 Student Equity Plan 13
320
321322323324325
326327
328329
330331332333334335336337338339340341342343344345346347348349350351352

District: Hartnell Community College District DRAFT
College: Hartnell College
Fall 2011 Fall 2012 Fall 2013Student
Count (Credit)
Student Count
(Credit)
Student Count
(Credit)23,592 20,302 20,6819,486 8,392 9,473
51% 52% 48%49% 48% 52%205 27 660% 59% 50%39% 41% 50%
3,685 2,663 2,68153% 57% 53%47% 43% 47%996 1,012 1,34853% 49% 48%47% 51% 52%
5,922 5,769 5,74557% 56% 56%43% 44% 44%
1,888 1,346 79059% 58% 64%40% 42% 36%964 667 28059% 57% 71%41% 43% 29%416 420 32170% 67% 71%30% 33% 29%
30 6 370% 33% 49%
100% 67% 51%Male
Male Academic Follow-up Services Received During The Term-Total
Female Male
Matriculation Services Data Not Reported In Term Female
Male Counseling/ Advisement Services Received During The Term-Total
Female Male
Student Education Plan Development Svs Received During The Term-TotalFemale
Male Assessment Placement Services Received During The Term-Total
Female Male
Assessment Services Placement Received Prior Terms Female
Male Orientation Services Received During The Term
Female Male
Orientation Services Received Prior Terms Female
California Community Colleges Chancellor's Office
Matriculation Services Summary Report
Hartnell CCDStudents Count In The Term
Female
Age Group. The population in the district is 178,780 with 30 percent (59,604) (see table below) under 30 years of age. Hartnell has approximately 10,000 students or approximately 6 percent of the population under 30 years of age each semester. The entry student is between 17 and 24 years of age and accounts for 54 percent of the college population. The 25-29 age group accounts for 11 percent of the college population. The 30-39 age group accounts for 13 percent, the 40-49 age group accounts for 10 percent, and the 50 years plus group, 8 percent (see table below). The 17-24 age group was most likely to access these services: Orientation Services, Assessment Placement Services, and Counseling/Advisement Services.
2014 Student Equity Plan 14
353354355356357358359360361362
363
Elsa Brisson, 08/31/14,
change

District: Hartnell Community College District DRAFT
College: Hartnell College
District Age Breakdown
Age 2010 Population % of Population15-19 20,088 11%20-24 19,778 11%25-29 19,738 11%30-34 18,921 11%35-39 17,056 10%40-44 16,337 9%45-49 15,335 9%50+ 51,527 29%Total 178,780
Ethnicity. The ethnicity of students at Hartnell College matches the ethnicity of the community, with two exceptions: White Non-Hispanic and Unknown. Differences in data reporting may account for this discrepancy. Hartnell students’ initial access to the college is parallel to the community at large in the district. The committee agreed that educational experiences and culture vary by age and may have an effect on access and completion. While no disproportionate impact exists, we noted the following about the different ethnic groups: Of the 18-24 year olds, the largest ethnic group is Hispanic, at 64 percent. The next largest group is White Non-Hispanic at 14 percent. All other ethnicities are represented at a very low rate. Starting with the 30-34 age group, the percentage of Hispanics accessing the college begins to decrease slightly and continues to decline. Starting with the 35-39 age group, the percentage of African Americans and all other ethnicities begins to increase, although the numbers are still small (see table below). The use of services across all ethnicities appears similar to the cohort numbers.
District Ethnicity BreakdownHartnell College Ethnicity Breakdown
Ethnicity 2010 Population % of Population 2006 Cohort (%)Hispanic 175,535 56% 55%White 114,057 37% 21%Filipino 7,089 2% 4%Black/African American 6,644 2% 3%Asian 4,418 1% 3%American Indian 3,893 1% <1%Pacific Islander 675 <1% <1%Unknown (Decline to state) 12%%Total 312,311
Foster Youth. According to the California College Pathways Milestone & Momentum Data Report, the percentage of foster youth who enrolled at Hartnell College in 2012-13 was 6
2014 Student Equity Plan 15
364365366367368369370371372373374375376377
378
379380381

District: Hartnell Community College District DRAFT
College: Hartnell College
percent (47 foster youth) of the general student population. The College recognizes that this number is low and emphasis should be placed on helping foster youth gain access to our educational services.
Analysis. Access for the largest ethnic group, Hispanics, is successful at Hartnell College. The College could examine how to meet the life-long learning needs of Hispanic students aged 30 or over as well as how to provide career transition education. The College needs to develop a campus plan for encouraging participation and providing support of foster youth.
2014 Student Equity Plan 16
382383384385386387388389
390

District: Hartnell Community College District DRAFT
College: Hartnell College
CAMPUS-BASED RESEARCH
B. COURSE COMPLETION. Ratio of the number of credit courses that students by population group actually complete by the end of the term compared to the number of courses in which students in that group are enrolled on the census day of the term.
Research Findings
As reported in the Executive Summary, the Course Completion success indicator was analyzed by using the disaggregated subgroups of gender, ethnicity, and age as well as DE, foster youth, and veterans. DE and non-DE were also compared across a span of Fall semesters from 2010 through 2013. Discussion regarding successful completion vs. retention led the College to define completion as students earning a grade of A, B, C, or P in courses. This was an important definition to clarify before research was done and data analyzed. For example, in Fall 2010, 8,312 of 9,753 (85 percent) students in credit courses were retained, but only 72 percent of them completed their courses successfully with a grade of C or better.
The 80% Rule (Index) was used to calculate disproportionate impacts on student success as a means for measuring the relative success among the categories of students that successfully completed their courses
Gender (DE Courses). While the success in DE courses for both genders in 2010-11, in 2011-12, and in 2012-13, is poor (between 47 and 54 percent), there is no disproportionate impact between genders during any of these time frames. However, it is clear that both male and female students require support services to improve success in DE courses.
Distance Education Success Rates by Gender
Gender Success Enrollment % Index** Success Enrollment % Index Success Enrollment % IndexFemale 968 2,054 47% 100% 1,831 3,391 54% 1,890 3,692 51%Male 655 1,395 47% 1,085 2,162 50% 93% 1,076 2,138 50% 98%Total 1,623 3,449 47% 2,916 5,553 53% 2,966 5,830 51%
No Disproportionate Impact
2010-11 2011-12 2012-13
Gender (Non-DE Courses). As can be seen from the table below, there is no disproportionate between genders for non-DE students.
2014 Student Equity Plan 17
391
392393394395396397398399400401402403404405406407408409410411412
413414415416417

District: Hartnell Community College District DRAFT
College: Hartnell College
Gender Success Enrollment % Index** Success Enrollment % Index Success Enrollment % IndexFemale 18,161 26,202 69% 89% 20,904 29,076 72% 90% 20,663 28,857 72% 93%Male 16,889 24,685 68% 88% 20,394 28,068 73% 91% 19,029 27,315 70% 90%DtS* 63 81 78% 100% 103 128 80% 100% 80 104 77% 100%Total 35,113 50,968 69% 41,401 57,272 72% 39,772 56,276 71%
No Disproportionate Impact
DtS* = Decline to state
Non-Distance Education Success Rates by Gender
2010-11 2011-12 2012-13
Age (DE Courses). A review of DE course completion data disaggregated by age indicates that success rates are poor for all age groups in 2010-11, in 2011-12, and in 2012-13. In addition to poor success, the data reveal that several age groups suffer an adverse impact (18-19 and 20-24 most significantly). While the number of groups disproportionately affected has decreased from five in 2010-11 to three in 2012-13, two of the groups impacted represented our largest age group population in DE courses. This supports the need for additional support services for DE students.
DE Success by Age Group
Age Group Success Enrollment % Index Success Enrollment % Index Success Enrollment % Index17 or less 0 3 0% 0% 0 0 NA NA 2 3 67% 98%18-19 523 1,191 44% 59% 1,022 1,955 52% 83% 1,021 2,033 50% 74%20-24 458 1,086 42% 56% 801 1,736 46% 73% 881 1,947 45% 67%25-29 257 498 52% 69% 416 734 57% 90% 432 777 56% 82%30-34 239 413 58% 77% 422 716 59% 94% 371 681 54% 80%35-39 92 182 51% 67% 196 310 63% 100% 208 309 67% 99%40-49 48 74 65% 86% 53 91 58% 92% 50 73 68% 100%50+ 9 12 75% 100% 7 13 54% 85% 5 12 42% 61%Total 1,626 3,459 47% 2917 5555 53% 2,970 5,835 51%
Disproportionate Impact
2010-11 2011-12 2012-13
Age (Non-DE Courses). As can be seen from the table below, there is very little disproportionate impact among age groups for students enrolled in non-DE courses.
Non-DE success by age group
Age Group Success Enrollment % Index Success Enrollment % Index Success Enrollment % Index17 or less 78 118 66% 78% 55 78 71% 84% 78 104 75% 91%18-19 15,629 23,912 65% 77% 18,912 27,351 69% 82% 18,904 27,631 68% 83%20-24 6,950 10,672 65% 77% 8,141 11,873 69% 82% 9,029 13,352 68% 82%25-29 3,152 4,382 72% 85% 3,631 4,864 75% 89% 3,432 4,609 74% 91%30-34 4,177 5,467 76% 90% 4,861 6,072 80% 95% 3,961 5,098 78% 95%35-39 3,072 3,863 80% 94% 3,748 4,464 84% 100% 2,645 3,346 79% 96%40-49 1,547 1,959 79% 93% 1,526 1,928 79% 94% 1,278 1,593 80% 98%50+ 508 595 85% 100% 527 642 82% 98% 445 543 82% 100%Total 35,113 50,968 69% 41401 57272 72% 39,772 56,276 71%
Very Little Disproportionate Impact
2010-11 2011-12 2012-13
Ethnicity (DE Courses). By far, the largest, and still growing, ethnic group of students at Hartnell College is Hispanic. In fact, the enrollment of Hispanic students in DE has increased by slightly
2014 Student Equity Plan 18
418419420421422423424425426427
428429430431432
433434435436

District: Hartnell Community College District DRAFT
College: Hartnell College
over 100 percent from 2010 to 2013. Disproportionate impact is seen among all ethnicities except Asian and White. Despite progress, additional support and follow-up is needed to achieve parity with White Non-Hispanic students as well as with non-DE students. It is clear that better support services are necessary for those groups adversely impacted in DE courses.
DE Success by Ethnicity
Success Enrollment % Index Success Enrollment % Index Success Enrollment % IndexAfrican American 28 88 32% 45% 58 201 29% 44% 75 248 30% 43%American Indian 10 26 38% 54% 24 41 59% 89% 23 47 49% 69%Asian 47 66 71% 100% 94 143 66% 100% 105 171 61% 86%Asian/Pacific Islander 71 139 51% 72% 144 274 53% 80% 114 228 50% 70%Hispanic 793 1,853 43% 60% 1,694 3,426 49% 75% 1,808 3,728 48% 68%Other Non-White 13 26 50% 70% 9 33 27% 41% 3 12 25% 35%Unknown 369 771 48% 67% 223 421 53% 80% 184 384 48% 67%White 295 490 60% 85% 653 988 66% 100% 643 996 65% 91%Decline to state? NA 18 28 64% 97% 15 21 71% 100%Total 1,626 3,459 47% 2,917 5,555 53% 2,970 5,835 51%
Disproportionate Impact
2012-132010-11 2011-12
Ethnicity (Non-DE Courses). While most ethnicities show little or no disproportionate impact in non-DE course success, the Index does indicate a slight disparity in non-DE courses among African Americans.
Success Enrollment % Index Success Enrollment % Index Success Enrollment % IndexAfrican American 657 1,044 63% 76% 1,142 1,749 65% 80% 1,178 1,860 63% 79%American Indian 194 279 70% 84% 280 381 73% 90% 250 366 68% 85%Asian 794 957 83% 100% 1,067 1,354 79% 96% 1,042 1,320 79% 99%Asian/Pacific Islander 1,437 1,906 75% 91% 1,863 2,417 77% 94% 1,747 2,236 78% 98%Hispanic 16,580 25,174 66% 79% 25,009 36,187 69% 84% 25,756 37,781 68% 85%Other Non-White 168 264 64% 77% 147 224 66% 80% 105 144 73% 91%Unknown 10,510 15,304 69% 83% 4,977 6,480 77% 94% 4,055 5,495 74% 92%White 4,773 6,040 79% 95% 6,783 8,302 82% 100% 5,556 6,951 80% 100%Decline to state? NA 133 178 75% 91% 83 123 67% 84%Total 35,113 50,968 69% 41,401 57,272 72% 39,772 56,276 71%
Currrently Very Little Disproportionate Impact
2012-132010-11 2011-12Non-DE Success by Ethnicity
Completion and Academic Standing. In regard to monitoring and following-up on students’ satisfactory academic progress, currently, only Financial Aid probation and progress notification is in place. Hartnell College has a Satisfactory Academic Progress (SAP) Policy/Process in place for students receiving financial aid. The same is not the case for students who are not receiving financial aid.
The United States Department of Education eligibility requirements apply to all forms of Federal Title IV student aid (Pell Grants, SEOG Grants, Federal Workstudy, and the Cal Grant Program) but do not apply to the California Board of Governors Fee Waiver Program (BOGW). Federal regulations also require that the standards applied to students receiving financial aid also apply to those students during periods when they are not receiving aid.
While several exceptions and factors are considered in the SAP process, and students can appeal any disqualification, it bears noting how the SAP process is implemented. Financial aid
2014 Student Equity Plan 19
437438439440441
442443444445446447
448449450451452453454455456457458459460461462463

District: Hartnell Community College District DRAFT
College: Hartnell College
students will be mailed a warning of financial aid Probation status if they fail to successfully complete 67 percent of units attempted, or earn less than a 2.0 cumulative GPA, or both at the end of their semester grading period. However, they continue to receive financial aid during the probationary period. Disqualification status occurs when financial aid students fail to meet the SAP requirements past the probationary period (one semester) or when they reach the maximum allowable attempted units. Once disqualified, those students will not receive financial aid pending appeals or achieving satisfactory academic progress.
Within that context, the following data from the Financial Aid Office reflects the following status of financial aid recipients in terms of academic progress from 2010 through 2014.
Satisfactory Academic Standing Count
2010-2011 N=7595 % 2011-2012
N=8051 % 2012-2013N=9764 %
Good Standing: 32% Good Standing: 32% Good Standing: 31%
Disqualified: 40% Disqualified: 40% Disqualified: 42%
Probation: 18% Probation: 17% Probation: 16%
New: 9% New: 10% New: 12%
Detailed information on academic standing by age, ethnicity, and gender is unavailable and would need to be collected and examined in order to determine disproportionate impact. Even so, the 3 percentage point drop in students on financial aid probation is minimal considering that the number of students disqualified is alarmingly high, hovering at around 41 percent.
For non-financial aid students, an academic probation notification and follow-up process is under development by the Dean of Student Affairs, Enrollment Services, the Enrollment Services Lead (Admissions & Records), and the Director of Information Technology Systems. This will be submitted for review by counselors and implementation in April 2015. Students will begin receiving notifications and follow-up for Fall 2015.
Foster Youth. In 2012-3013, it was reported in the California College Pathways Milestone & Momentum Data Report that 39 percent of all foster youth at Hartnell College completed credit courses, while the percentage of completion for the general student population was 70 percent. The percentage of foster youth achieving a GPA of 3.0 or over was 13 percent, while the percentage for the general student population was 29 percent.
At-risk Students. For the purposes of this plan, the definition of at-risk students is students enrolled in basic skills courses who have not received academic counseling, an education plan, or follow-up services. This population likely includes some financial aid students on academic probation and facing academic dismissal; however, the college has not kept statistical data
2014 Student Equity Plan 20
464465466467468469470471472473474475476
477478479480481482483484485486487488489490491492493494495496497498

District: Hartnell Community College District DRAFT
College: Hartnell College
disaggregating this group of students by whether they are taking basic skills or degree-applicable credit courses. A process for addressing and following up on non-financial aid students under academic probation is currently under development for implementation in Fall 2015.
CCCCO Datamart statistics on basic skills courses over the last four Fall semesters (2010-2013) reveal several aspects of the at-risk population at Hartnell College. For example, an average of 79 course sections served an average of 1,774 students, most of them credit-level basic skills courses. For context, a look at matriculation enrollment count data shows that Hartnell enrolled an average of 9,302 students in credit courses for those terms. In other words, 19 percent of students were enrolled in 200-level basic skills courses. What is less clear is what percentage of basic skills students have received follow-up services, such as student counseling, advising, and comprehensive individualized education plans.
What the data does show is that, based on the total term student count, although 72 percent of students were assessed for placement, 87 percent did not receive counseling or advisement and 94 percent of students did not receive an education plan. Just as distressing is the number of students actually receiving academic follow-up services: only 4 percent (365 of 9,302 on average). What these overall statistics do not indicate is the degree to which the 19 percent of students enrolled in basic skills courses are or are not receiving these services. This data needs to be collected and compiled, and the new ESARS and Ellucian software systems are now in place to do so.
Hartnell has enhanced its follow-up services for both at-large and specific student populations:
A. Under the Steps for Success initiative, at-large services such as assessment and orientations have been implemented for senior high school students at Hartnell’s feeder schools. Advisement activities in conjunction with student recruitment and other matriculation activities have been conducted and instituted over Spring semester for Hartnell’s new walk-in students.
B. The recently developed and implemented requirement for in-person or online Student Orientation has already begun to remedy the lack of counseling, advisement, and education plans for new students.
C. Required advisement and initial student education planning has been incorporated into the student orientation process and matriculation activities such as Panther Prep Days.
D. An Ellucian online education plan software is being implemented during Summer 2014. This will provide counselors with the ability to access and create student education plans online and collect data for program planning and assessment,
2014 Student Equity Plan 21
499500501502503504505506507508509510511512513514515516517518519520521522523524525526527528529530531532533534535536537538539540

District: Hartnell Community College District DRAFT
College: Hartnell College
including those for students in programs like EOPS, DSPS, CalWorks, Veterans, Athletes, etc.
E. Similarly, an ESARS counseling and appointment software is being implemented this summer. This software would allow more robust and accurate recording of follow-up services to all students, including those in EOPS, DSPS, CalWorks, Veterans, Athletes, etc.
F. The Financial Aid Academic Progress process was revised and updated in December 2013 and implemented in Spring 2014. An Academic Probation process for non-financial aid students is in development for initial implementation in Spring 2015 and full implementation in Fall 2015.
Although Hartnell provides significant services and resources for traditionally underserved student populations (DSPS, EOPS/CARE, HEP, MESA, TRIO, Crisis Counseling, Foster Kinship Care Education, and Child Care services), more is needed to specifically address academically challenged students. For example:
A. The Tutorial Center budget should be restored from the budget reductions that have reduced the services to students. The number of tutors and tutoring hours should be increased, including evening and weekend tutoring, and services for the Alisal Campus and the King City Center.
B. The establishment of a Student Success Center coordinating delivery of and improvement of basic skills students’ academic success.
2014 Student Equity Plan 22
541542543544545546547548549550551552553554555556557558559560561562563564565566567

District: Hartnell Community College District DRAFT
College: Hartnell College
CAMPUS-BASED RESEARCH
C. ESL and BASIC SKILLS COMPLETION. Ratio of the number of students by population group who complete a degree-applicable course after having completed the final ESL or basic skills course compared to the number of those students who complete such a final course.
As reported in the Executive Summary, the ESL and Basic Skills Completion success indicator was analyzed by using the disaggregated subgroups of gender, ethnicity, and age as well as DE, foster youth, and veterans.
Research Findings
According to the RPgroup report, Curricular Redesign and Gatekeeper Completion: A Multi-College Evaluation of the California Acceleration Project, from April 2014,
Large numbers of students are being placed in long remedial and basic skills sequences from which few emerge. Across the California Community College system, only 7 percent of students beginning at three levels below transfer-level successfully complete transferable math within three years. The comparable number for English is only 19 percent.
ESL Data:
ESL courses are divided in three different categories: listening, reading, and writing. The top-level ESL course is ESL 101 (one level below transfer), and the first degree/transferable course is ENG 1A. Two parallel tracks are available for persistence through ENG 1A. ESL students are counseled into the ESL 265ESL 101ENG 1A path; however, many ESL students choose to follow the ENG 253ENG 101ENG 1A route. While having multiple paths available is beneficial to students, it does make data collection more difficult. The ratio of the number of students who successfully completed the degree/transferable ESL/ENG course as compared to the number of students who successfully completed the top basic skills ESL course has been examined by age, ethnicity, and gender. However, the ratio for all the disaggregated factors is inconclusive. Because of changes in ESL course numbering and dual ESL pathways to ENG 1A, ESL data results from Datamart showed such small numbers that results were not significant enough to determine one specific area of disparity.
The research tool developed by a Hartnell Title V grant research team was used as an alternative to track ESL cohorts. Success and persistence for ESL students has improved from the 2009-11 cohort to the 2011-13 cohort, possibly attributed to increased numbers of Supplemental Instruction (SI) leaders and faculty-trained ESL tutors (since most tutors are also SI leaders. Continuing academic and student support is vital to the College’s ESL students to help them persist and succeed. One challenge is to identify students who would benefit from
2014 Student Equity Plan 23
568
569570571572573574575

District: Hartnell Community College District DRAFT
College: Hartnell College
the ESL track to transfer English and provide incentives for them to choose the appropriate track.
2009-11 Persistence
2009-11 Success
2011-13 Persistence
2011-13 Success
ESL 145/245 – ESL 165/265 25% 22.2% 54% 50%
ESL 145/245 – ENG 1A 0% 0% 8.3% 4.2%
ESL 165/265 – ENG 1A 39.5% 28.9% 45% 35%
(Persistence--Unduplicated number of students)ESL 145/245 = 4 levels below transferESL 165/265 = 2 levels below transfer (ESL equivalent of ENG 253)
Math Data
Age. In the Fall 2012 to Spring 2014 cohort, it is revealed that age groups 18 & 19 and 20-24 have lower success rates in completing MAT 121. Index percentages show that disproportional impact exists. However, disproportionate impact in MAT 123 affects a small percentage of MAT 123 students.
MathTwo levels below---> AA/AS degree level
Cohort start Cohort endFall 2012 Spring 2014
Fall 2012 initial course, initial semesterMAT-121 MAT-121 Success MAT-123 MAT-123 Persistence rate
Attempts Success Percentage Index Attempts Success from 121 Index17 or Less 24 17 71% 100% 18 12 71% 98%18 & 19 210 116 55% 78% 132 84 72% 100%20 to 24 30 16 53% 75% 15 9 56% 78%25 to 29 15 9 60% 85% 8 4 44% 62%30 to 34 4 4 100% NA* 2 2 50% NA*35 to 39 1 0 0% 0% 1 1 NA NA*40 to 49 7 4 57% 80% 5 3 75% NA*50 + 3 3 100% NA* 3 3 100% NA*
294 169 57% 184 118 70%
NA* n< or = 5, percent not used in 80% Rule Index
Disproportionate impacts in initial course success.Disproportionate impacts in persistence to degree applicable course.
Mathematics Total
2014 Student Equity Plan 24
576577578
579580581582583584585586587588589590
591592

District: Hartnell Community College District DRAFT
College: Hartnell College
The results in the tables below show that there is disproportionate impact by age group in both the persistence from attempting MAT 123 to success in transfer-level math courses and from success in completing MAT 123 to success in transfer-level courses. The 18 & 19 group is persisting at rates that are disproportionately higher. Reasons for this can be investigated and perhaps exported to other age groups.
Total Math 123 Total Trx Math PersistenceSuccess Success Index
17 or Less 35 21 60% 71%18 & 19 239 204 85% 100%20 to 24 35 15 43% 50%25 to 29 13 5 38% 45%30 to 34 9 4 44% 52%35 to 39 1 0 0% NA40 to 49 2 1 50% NA50 + 1 0 0% NA
335 250 75%
Total Math 123 Total Trx Math PersistenceAttempts Success Index
17 or Less 57 21 37% 67%18 & 19 372 204 55% 100%20 to 24 60 15 25% 45%25 to 29 18 5 28% 51%30 to 34 10 4 40% 73%35 to 39 2 0 0% NA40 to 49 2 1 50% NA50 + 1 0 0% NA
522 250 48%
Mathematics Total
Mathematics Total
Disproportionate Impact
Ethnicity. The analysis of data for students persisting from below degree level course to degree-level courses shows that there is disproportionate impact on success for African Americans and Multi-Ethnic students in initial course success; there is also an adverse impact on persistence to the degree-applicable course for Multi-Ethnic students and for White Non-Hispanic. Finally, it is interesting to note that although our population size for the African-American and White Non-Hispanic subgroups are small, the achievement gap between the two reversed as they finished Math 201 and entered Math 121. In 2009, the African-American subgroup was below the White Non-Hispanic subgroup by 5 percentage points; and in the 2011 cohort, this reversed to where
2014 Student Equity Plan 25
593594595596597598
599600601602603604605606607608609610

District: Hartnell Community College District DRAFT
College: Hartnell College
the African-American subgroup was now 3 percentage points higher in success rate upon completing the Math 201 course.
MathTwo levels below--->AA/AS degree level
Cohort start Cohort endFall 2012 Spring 2014
Fall 2012 initial course, initial semesterMAT-121 MAT-121 Success MAT-123 MAT-123 Persistence RateAttempts SuccessPercentage Index Attempts Success from 121 Index
African-American 8 3 38% 60% 3 2 67% 89%American Indian/Alaskan Native 1 1 100% NA* 1 1 100% NA*Asian 4 4 100% NA* 3 3 75% 100%Hispanic 234 137 59% 93% 152 99 72% 96%Multi-Ethnicity 7 2 29% 45% 3 1 50% 67%Pacific Islander 2 1 50% 79% 1 1 100% 133%Unknown 8 5 63% 100% 6 3 60% 80%White Non-Hispanic 30 16 53% 85% 14 7 44% 58%
294 169 57% 184 118 70% 93%
NA* n< or = 5, percent not used in 80% Rule Index
Disproportionate impacts in initial course success.Disproportionate impacts in persistence to degree applicable course.
Mathematics Total
As can be seen in the table below, there is a pattern of disproportionate impact on persistence from succeeding in MAT 123 to success in transfer-level math courses. Even if the Asian group is omitted as an outlier, there is disproportionate impact on African American, Multi-ethnicity and White Non-Hispanic ethnicity groups. (Note: Because some students take more than one transfer math class, persistence rate can be more than 100 percent).
In the
table below, there is a pattern of disproportionate impact on persistence from attempting MAT 123 to success in transfer-level math courses. Even if the Asian group is omitted as an outlier, there is disproportionate impact on African American, Multi-ethnicity and White Non-Hispanic ethnicity groups.
2014 Student Equity Plan 26
Total Math 123 Total Trx Math PersistenceSuccess Success Index
African-American 3 1 33% 41%Asian 14 19 136% NAHispanic 258 200 78% 95%Multi-Ethnicity 8 3 38% 46%Unknown 11 9 82% 100%White Non-Hispanic 41 18 44% 54%
335 250 75% 91%Mathematics Total
Total Math 123 Total Trx Math PersistenceAttempts Success Index Index Excluding Asian
African-American 7 1 14% 16% 24%Asian 21 19 90% 100% NAHispanic 414 200 48% 54% 81%Multi-Ethnicity 12 3 25% 28% 42%Unknown 15 9 60% 67% 100%White Non-Hispanic 53 18 34% 38% 57%
522 250 48%Mathematics Total
611612613
614
615616617618619620621622623624625626627628629630631632633634635636637

District: Hartnell Community College District DRAFT
College: Hartnell College
Gender. In examining gender data for the cohort that starts in Fall 2012 and ends in Spring 2014, the success rate for females is 18 percentage points higher than for males in the same period. There is a disproportionate impact for success for males. While the persistence rate for both males and females from three levels below transfer to AA/AS degree-level courses is poor, the Index results do not indicate any disparity for any of the gender subgroups.
MathThree levels below--->AA/AS degree level
Cohort start Cohort endFall 2012 Spring 2014
Fall 2012 initial course, initial semesterMAT-201 MAT-201 Success MAT-123 MAT-123 Persistence rateAttempts Success Percentage Index Attempts Success from 201 Index
Female 173 124 72% 100% 58 43 35% 100%Male 168 90 54% 74% 46 30 33% 95%
341 214 63% 104 73 34% 97%
Tracking to degree level success (completion)
Total
MAT 121 success rates for both males and females are poor, and the success for males is only 1 percentage point higher than that for female success in the Fall 2012-Spring 2014 cohort. Neither group, however, reflects a disproportionate impact. Additionally, the persistence from MAT 121 to MAT 123 needs to be increased.
MathTwo levels below--->Transfer level
Cohort start Cohort endFall 2012 Spring 2014
Fall 2012 initial course, initial semesterMAT-121 MAT-121 Success MAT-123 MAT-123 Persistence rateAttempts Success percentage Index Attempts Success from 121 Index
Female 172 98 57% 98% Female 108 72 42% 100%Male 122 71 58% 100% Male 76 46 38% 90%
294 169 57% 184 118 40%Mathematics Total Mathematics Total
Analysis. The examination of data for developmental math courses show that while there is a need to improve persistence in the math sequence, improvements have begun. Overall, students who started two levels below in the 2011-13 cohort had an increased success rate over the cohort that began in 2009-2011. Also, of those who persisted through transfer level courses, there was an overall increase of 8 percentage points in success rate. A closer look within age groups reveals that the 18- 19 age group experienced the largest gain in success rate out of those who persisted through transfer level coursework by a total of 11.7 percentage point increase. Out of the initial group, 18 percent of those aged 18-19 years successfully completed a transfer level Math course in the 2011 cohort which was a 4 percentage point increase over the 2009 cohort. Viewing disaggregated data by ethnicity it is clear that our largest population (Hispanics) made gains as well. In comparing males and females, the success
2014 Student Equity Plan 27
638639640641642643
644
645646647648649
650651652653654655656657658659660661662

District: Hartnell Community College District DRAFT
College: Hartnell College
rate out of the initial group for men remained the same for both cohorts, whereas the females had an increase of 3.3 percentage points in success rate out of the initial group.
In the cohort beginning three levels below, similar patterns in gains were made. Overall, the 2011 group had a higher success rate than the 2009 group by 1 percent. Of those who persisted through transfer level courses, the final success rate was higher for the 2011 cohort by 9 percentage points, indicating our students are better prepared for their transfer-level coursework in part due to the Supplemental Instruction leaders the college has implemented as well as the Math Academy. Looking at the subgroups, female and male success rates remained relatively constant for both cohorts, but females who persisted had an increase of 10 percentage points versus a 6 percentage point increase for males. The Hispanic subgroup, which is our largest population, also showed a gain of 3 percentage points in overall success Also, in 2009, only one Hispanic student persisted through transfer level courses; while in 2011, there were 20 Hispanic students who persisted through transfer level courses, which led to the large percent increase in success rate of 67 percent out of those who persisted in the Hispanic subgroup.
English Data
Age. For the cohort starting in Fall 2012 ending in Spring 2014 showing persistence from ENG 253 (two levels below transfer) to ENG-1A (transfer), the Index shows a disproportionate impact on students in the 20-24 age group. Success rates for completion of ENG 253 are poor in 20 to 24 and 25 to 29 age groups.
For the same time frame, the data show that there is disparity in success among those persisting from ENG-101 (one level below transfer) to ENG-1A in all age groups except those for which the number of students is too small. In addition, success rates in ENG-101 are poor in all age groups.
2014 Student Equity Plan 28
EnglishTwo levels below--->AA/AS degree level (ENG 1A)
Cohort start Cohort endFall 2012 Spring 2014
Fall 2012 initial course, initial semesterENG-253 ENG-253 Success ENG-1A ENG-1A Persistence Rate
Attempts Success Percentage Index Attempts Success from 253 Index17 or Less 25 20 80% 100% 15 9 45% 100%18 & 19 282 196 70% 87% 127 75 38% 85%20 to 24 33 16 48% 61% 6 5 31% 69%25 to 29 5 2 40% NA* 1 1 50% NA* 30 to 34 7 5 71% 89% 2 2 40% 89%35 to 39 2 0 0% NA* NA NA* 40 to 49 2 2 100% NA* 0% NA* 50 + 1 1 100% NA* 0% NA*
357 242 68% 151 92 38%
Disproportionate impacts in initial course success.Disproportionate impacts in persistence to degree applicable course.
English Total
663664665666667668669670671672673674675676677678679680681682683684685686687688689690691692693694695696697698699700701702703704705706

District: Hartnell Community College District DRAFT
College: Hartnell College
Ethnicity. While White Non-Hispanic has the highest success rate in ENG-253, it is Asian students who suffer for a disproportionate impact in successful completion; however, there is disproportionate impact in persistence of both Asian and Hispanic students to ENG 1A. The numbers of students persisting to ENG 1A from all but the Hispanic and White Non-Hispanic groups are too small to make conclusions about disproportionate impact (n<5). However, the fact that such a small number of these students persists to ENG 1A is further evidence for the need for supportive services. Success rates for both African American and Hispanic students are low, and there is an adverse impact in the Index for both those groups as well.
2014 Student Equity Plan 29
EnglishOne level below--->AA/AS degree level (ENG 1A)
Cohort start Cohort endFall 2012 Spring 2014
Fall 2012 initial course, initial semesterENG-101 ENG-101 Success ENG-1A ENG-1A Persistence Rate
Attempts SuccessPercentage Index Attempts Success from 101 Index17 or Less 42 20 48% 71% 21 17 85% 100%18 & 19 347 212 61% 91% 219 137 65% 76%20 to 24 54 29 54% 80% 21 15 52% 61%25 to 29 21 12 57% 85% 10 7 58% 69%30 to 34 12 8 67% 100% 3 3 38% 44%35 to 39 5 1 20% NA* 1 0 0% NA* 40 to 49 17 10 59% 88% 6 5 50% 59%50 + 5 1 20% NA* 1 0 0% NA* Unknown 2 0 0% 0 0 NA* NA*
505 293 58% 282 184 63%
NA* n< or = 5, percent not used in 80% Rule Index
Disproportionate impacts in initial course success.Disproportionate impacts in persistence to degree applicable course.
English Total
EnglishTwo levels below--->AA/AS degree level (ENG 1A)
Cohort start Cohort endFall 2012 Spring 2014
Fall 2012 initial course, initial semester
ENG-253 ENG-253 Success ENG-1A ENG-1A Persistence RateAttempts Success Percentage Index Attempts Success from 253 Index
African-American 5 2 40% *NA 0 0 0% *NAAsian 7 4 57% 70% 2 1 25% 45%Hispanic 325 222 68% 83% 142 85 38% 68%Multi-Ethnicity 4 1 25% *NA 1 1 100% *NAPacific Islander 1 0 0% *NA 0 0 NA *NAUnknown 4 4 100% *NA 1 0 0% *NAWhite Non-Hispanic 11 9 82% 100% 5 5 56% 99%
357 242 68% 151 92 38%
NA* n< or = 5, percent not used in 80% Rule Index
Disproportionate impacts in initial course success.Disproportionate impacts in persistence to degree applicable course.
English - Writing Total
707
709710711712713714715716717718
720

District: Hartnell Community College District DRAFT
College: Hartnell College
As can be seen in the table below, persistence from ENG-101 to ENG-1A shows a disproportionate impact for African Americans, Asians, Hispanics, and White Non-Hispanics.
2014 Student Equity Plan 30
EnglishOne level below--->AA/AS degree level (ENG 1A)
Cohort start Cohort endFall 2012 Spring 2014
Fall 2012 initial course, initial semesterENG-101 ENG-101 Success ENG-1A ENG-1A Persistence Rate
Attempts Success Percentage Index Attempts Success from 101 IndexAfrican-American 10 5 50% 68% 3 2 40% 45%Asian 15 11 73% 100% 9 7 64% 72%Hispanic 409 231 56% 77% 231 144 62% 70%Multi-Ethnicity 14 9 64% 88% 8 7 78% 87%Pacific Islander 2 2 100% *NA 2 1 50% *NAUnknown 15 9 60% 82% 9 8 89% 100%White Non-Hispanic 40 26 65% 89% 20 15 58% 65%
505 293 58% 282 184 63%
Disproportionate impacts in initial course success.Disproportionate impacts in persistence to degree applicable course.
English Total
721722723
725726

District: Hartnell Community College District DRAFT
College: Hartnell College
Gender. There is no disproportionate impact for gender in persistence from both ENG 253 and ENG 101 to ENG 1A based on the Index. However, the success of female students in ENG-101 is 5 percentage points higher than that for male students. In addition, females are more likely to persist to ENG-1A than males (10 percentage point difference in persistence rate).
Foster Youth. According to the California College Pathways Milestone & Momentum Data Report, in 2012-2013, 28 percent of foster youth enrolled completed a remedial course, while 49 percent of the general student population enrolled in remedial courses.
2014 Student Equity Plan 31
EnglishOne level below--->AA/AS degree level (ENG 1A)
Cohort start Cohort endFall 2012 Spring 2014
Fall 2012 initial course, initial semesterENG-101 ENG-101 Success ENG-1A ENG-1A Persistence Rate
Attempts Success Percentage Index Attempts Success from 101 IndexFemale 276 166 60% 100% 161 111 67% 100%Male 229 127 55% 92% 121 73 57% 86%
505 293 58% 282 184
Disproportionate impacts in initial course success.Disproportionate impacts in persistence to degree applicable course.
English Total
EnglishTwo levels below--->AA/AS degree level (ENG 1A)
Cohort start Cohort endFall 2012 Spring 2014
Fall 2012 initial course, initial semester
ENG-253 ENG-253 Success ENG-1A ENG-1A Persistence rateAttempts Success Percentage Index Attempts Success from 253 Index
Female 183 130 71% 100% 84 48 37% 95%Male 174 112 64% 91% 67 44 39% 100%
357 242 68% 151 92 38%
Disproportionate impacts in initial course success.Disproportionate impacts in persistence to degree applicable course.
English Total
727728729730731
734735736737738739740

District: Hartnell Community College District DRAFT
College: Hartnell College
Analysis. Students from all the subgroups have difficulty migrating from basic skills English courses to degree applicable/transferable courses. Additional academic support services need to be provided to improve the successful completion rates of the English course sequence through transfer level/degree level courses.
Data from Cognos, a business intelligence software was reviewed along with Chancellor’s Office Datamart data. Overall, students who started two levels below transfer in 2009-2011 had a 69 percent success rate. The Students who started two levels below transfer in 2011-2013 had a 70 percent success rate, representing a 1 percentage point increase in success rate. Both sources indicate a fairly high success rate. Also, when looking at the data for Hispanics and for the ages 18-19, there is 1 percentage point success rate increase from 2009-11 to 2011-13. However, in higher-level English courses (ENG 101 and ENG 1A), the success rate of both the Latino group and Age 18-19 group decreases from 2009-11 to 2011-13. The College should focus on interventions especially targeted at these two groups.
In comparing 2009-11 and 2011-13 cohorts, the percentage of students in the age group of 18 & 19 years old enrolling in ENG 253 (two levels below transfer) is significantly higher than the number of students from any other age groups. Both cohorts show remarkably high persistence and success through ENG 101. While persistence into ENG 1A for both groups is high, the ENG 1A success rates are the lowest through the progression of these three levels. However, while consistent between the two cohorts, the number and percentage of the 20-24 year old age group persisting to and successfully completing ENG 1A (transfer) is dismally low. Students in the 2011-13 cohort demonstrated more success in ENG 1A even though persistence was quite low. Students who are in either the 17 or less age group of the 25-29 age group show more promising success and percentages, but they each reflect fewer than 10 percent of enrollment in English.
Hartnell data show that the overall success and persistence in our English series (from two levels below transfer to transfer) is good; however, we might be able to see higher success rate if the college is able to increase the tutorial services hours or offer an English academy. When looking at the number of attempts, it indicates a high percentage of students repeat each course; the college needs to develop strategies to help students be successful in their first enrollment and increase student awareness of the need to “do something differently when repeating a class to ensure a different (successful) outcome.”
CCCCO Data Mart Scorecard Metrics indicate that a dramatic disparity emerges when the persistence of basic skills level students is compared with those who have completed at least 30 units. The following tables depict the disproportionate impacts in outcomes for persistence from remedial English and Math to transfer-level courses and of those who have completion of at least 30 units.
2014 Student Equity Plan 32
741742743744745746747748749750751752753754755756757758759760761762763764765766767
768769770771772773774775776777778779780781

District: Hartnell Community College District DRAFT
College: Hartnell College
The ethnicity data show that Asian students are most persistent to ENG 1A and all other groups are disproportionately impacted; however, once that outlier is removed, then only the American Indian/Alaskan Native group is impacted. All age groups with the exception of those under 20 show disproportionate impact in terms of persistence. It should be noted that many students who fall into the under 20 age group are most likely concurrently enrolled high school students who are fulfilling graduation requirements.
Ethnicity--Persistence to ENG 1A of Students Starting in Remedial English Age--Persistence to ENG 1A of Students Starting in Remedial English(Started in 2007-08; outcomes through 2012-13) (Started in 2007-08; outcomes through 2012-13)
Persistence Persistence6 Years Index Index without Outlier 6 Years Index Index without Outlier
African-American 33% 48% 70% Under 20 50% 100% NAAsian 69% 100% NA 20-24 35% 70% 100%Hispanic 42% 61% 89% 25-39 32% 64% 91%American Indian/AK Native 27% 39% 57% 40 and over 26% 52% 74%White Non-Hispanic 47% 68% 100%
Groups with fewer than 10 students in the cohort not shown Groups with fewer than 10 students in the cohort not shown
Disproportionate impact can also be observed in the math ethnicity data—all ethnicities show persistence issues from remedial to transfer-level math with the exception of the Asian group, even with that outlier removed. A disproportionate impact in persistence to transfer-level math is also reflected in the 25-39 and 40 and over age groups.
The College needs to observe what characteristics are displayed by Asian students and by students aged 20-24 and in what support activities they participate to help replicate that environment for other ethnic and age groups.
Ethnicity--Persistence to Transfer-level Math of Students Starting in Remedial Math Age--Persistence to Transfer-level Math of Students Starting in Remedial Math(Started in 2007-08; outcomes through 2012-13) (Started in 2007-08; outcomes through 2012-13)
Persistence Persistence6 Years Index Index without Outlier 6 Years Index
African-American 12% 17% 21% Under 20 37% 100%Asian 69% 100% NA 20-24 30% 81%Hispanic 31% 45% 53% 25-39 19% 51%American Indian/AK Native 18% 26% 31% 40 and over 22% 59%White Non-Hispanic 36% 52% 62%Filipino 58% 84% 100%
Groups with fewer than 10 students in the cohort not shown Groups with fewer than 10 students in the cohort not shown
Scorecard data also show that persistence data for both ethnicity and age shows fewer categories of disproportionate impact once the student has earned at least 30 units. The College needs to help students develop strategies to persist through to the “tipping point” of 30 units.
2014 Student Equity Plan 33
782783784785786787788
789790
791792793794795
796797798799
800801
802803804805806

District: Hartnell Community College District DRAFT
College: Hartnell College
Ethnicity--Persistence of Students to at least 30 units Age--Persistence of Students to at least 30 units(Started in 2007-08; outcomes through 2012-13) (Started in 2007-08; outcomes through 2012-13)
Persistence Persistence6 Years Index 6 Years Index
African-American 54% 74% Under 20 69% 100%Asian 65% 89% 20-24 60% 87%Hispanic 66% 90% 25-39 55% 80%American Indian/AK Native 54% 74% 40 and over 51% 74%White Non-Hispanic 68% 93%Filipino 73% 100%
Groups with fewer than 10 students in the cohort not shown Groups with fewer than 10 students in the cohort not shown
Disproportionate impacts in 6-year persistence Disproportionate impacts in 6-year persistence
2014 Student Equity Plan 34
807808

District: Hartnell Community College District DRAFT
College: Hartnell College
CAMPUS-BASED RESEARCH
D. DEGREE and CERTIFICATE COMPLETION. Ratio of the number of students by population group who receive a degree or certificate to the number of students in that group with the same informed matriculation goal.
Research Findings
As reported in the Executive Summary, the Degree and Certificate Completion success indicator was analyzed by using the disaggregated subgroups of gender, ethnicity, and age as well as DE, foster youth, and veterans.
The 2006-07 cohort was used to determine completion of degrees and certificates in six years. This cohort included 628 (53 percent) women and 559 (47 percent) men. The CCCCO Scorecard for Hartnell reports a 42 percent completion rate overall within a six-year time period.
Gender. The completion rate for men was 44 percent and for women 41 percent. A gender gap is observed as the number of women is higher to start and begins to decline with time. Reviewing degrees, attrition and transfer could provide more insight into this trend.
Completion Overall-GENDER2006-2007
Cohort Size Cohort Rate StudentsAll 1,192 42.0% 501Female 628 40.3% 253Male 559 43.5% 243
Age Group. The degree and certificate completion rate is at its highest at 46 percent in those starting in the cohort at less than 20 years of age. All other age groups are disproportionately impacted based on the 80% Rule Index. Students starting at 20-24 years of age are only about half as likely to finish at 25 percent. The completion rate for students starting at 25-39 or 40+ years of age were only about a third as likely to finish. The committee assumed not all was contributable to college preparation but also to environmental and economic issues, as well as potentially differing purposes for entering college. Degree and certificate completion was higher than transfer rates.
Completion Overall AGE Cohort No. Cohort %< 20 years old 1,008 46%20 to 24 years old 75 25%25 to 39 years old 69 15%40+ years old 36 17%
2014 Student Equity Plan 35
809
810811812

District: Hartnell Community College District DRAFT
College: Hartnell College
Ethnicity. The completion of degrees and certificates was reviewed from both college overall and intergroup comparisons. The two groups that had the highest percentage of completion were Asians at 64 percent and Filipinos at 51 percent; however, the number of degrees conferred on these two groups was a small percent of the cohort. Hispanics, the largest ethnicity at Hartnell, accounted for 71 percent of all degrees and certificates and the Hispanic group completion rate was 40 percent.
Completion Overall Cohort No. Cohort % Ethnicity No. Ethnicity %
African American 26 3% 10 2%American Indian/ Alaska Native 11 1% 4 1%Asian 42 4% 27 6%Filipino 41 4% 21 5%Hispanic 755 74% 305 71%Pacific Islander 9 1% 2 0.5%White 140 14% 63 15%
1,024 432
2014 Student Equity Plan 36
813

District: Hartnell Community College District DRAFT
College: Hartnell College
CAMPUS-BASED RESEARCH
E. TRANSFER. Ratio of the number of students by population group who complete a minimum of 12 units and have attempted a transfer level course in mathematics or English to the number of students in that group who actually transfer after one or more (up to six) years.
Research Findings
As reported in the Executive Summary, the Course Completion success indicator was analyzed by using the disaggregated subgroups of gender, ethnicity, and age as well as DE, foster youth, and veterans. The committee looked at the 2006-2007 cohort to discover inequalities in rates of transfer after six years of matriculation.
The members of the Student Equity Plan (SEP) Work Group are determined fulfill both the Hartnell College Board of Trustee Policy 5300 on Student Equity and the Hartnell College Mission Statement that the college ‘provides educational opportunities for students to reach academic goals in an environment committed to student learning, achievement and success’. Many of the college’s student body define reaching their academic goals as achieving successful transfer to a university.
Gender. The males and females of the 2006-2007 cohort have an equitable outcome with similar rates of transfer, males at 31 percent and females at 29 percent. While disproportionate impact was not found at the overall Gender category, more research is needed to disaggregate gender data in transfer among all ethnicities and in particular, African American and Hispanic males, to detect disproportionate impact.
Years to Transfer - 6 Years Years to Transfer - 6 Years Cohort Year 2006-2007Cohort Year 2006-2007Transferred Student Cohort Student
295 982Female 148 513Male 145 462Unknown 2 7
Hartnell CCD Total
Age Group. When the committee analyzed the data for each age group within the 2006-2007 cohort, no disproportionate impact was found in the 17 or Less category at 38 percent or the 18 & 19 category at 28 percent. The 17 to 20 age group is 30 percent of the 2014 Hartnell College student profile. However, the 20 to 24 demographic is 31 percent of the 2014 Hartnell College student profile and their transfer rate is in single digits within the 2006-2007 cohort and is only 15 percent.
And while the 25 to 39 year age group makes up 24 of the 2014 Hartnell College student profile, all three of the age groups in the 2006-2007 cohort show single digits and they ranked 25 to 29
2014 Student Equity Plan 37
814
815816817818819820821822823824825826827
828829830831832833834835836837838

District: Hartnell Community College District DRAFT
College: Hartnell College
at 6 percent, 30 to 34 at 0 percent, and 35 to 39 at 12 percent, and all but the highest achieving group (17 or less) show disproportionate impact.
Years to Transfer - 6 Years Years to Transfer - 6 Years Cohort Year 2006-2007Cohort Year 2006-2007Transferred Student Cohort Student
295 98217 or Less 158 41918 & 19 123 43720 to 24 7 4825 to 29 1 1830 to 34 0 1435 to 39 2 1740 to 49 1 1450 + 2 10Unknown 1 5
Hartnell CCD Total
Ethnicity. When the committee looked at data for each ethnicity for within the 2006-2007 cohort, a pattern of disproportionate impact was seen for African American, Hispanic, Pacific Islander, and Unknown ethnic subgroups. This is particularly important to investigate since the Hispanic subgroup makes 64 percent of the cohort.
The next largest group, White Non-Hispanic, had the highest transfer rate of 44 percent. Although Asians had the second highest transfer rate, the cohort size is low, as it was for the Filipino demographic. The African American subgroup, with a 29 percent transfer rate, reflected low numbers of overall students in the cohort. The American Indian/Alaskan Native subgroup, at 38 percent, the Pacific Islanders sub group, with a 25 percent transfer rate, had single digit numbers in the cohort.
Years to Transfer - 6 Years Years to Transfer - 6 Years Cohort Year 2006-2007Cohort Year 2006-2007Transferred Student Cohort Student
295 982African-American 5 17American Indian/Alaskan Native 3 8Asian 16 38Filipino 13 37Hispanic 171 625Pacific Islander 1 4Unknown 37 142White Non-Hispanic 49 111
Hartnell CCD Total
2014 Student Equity Plan 38
839840841
842843844845846847848849850851852853854
855856

District: Hartnell Community College District DRAFT
College: Hartnell College
An examination of Data on Demand statistics tracking the 2006-2007 cohort of 1,192 students tracked over period of six years provides an overall snapshot of the Hartnell’s Transfer, AA and Certificate, DSPS, and Economically Disadvantaged students. Based on this data, just over 65 percent of the cohort can be characterized as economically disadvantaged. Economic factors undoubtedly contribute to the fact that only 29 percent transferred, 18 percent achieved degrees and 4 percent achieved their certificates. However, the college could provide additional support to assist students to meet their goals. In effect, 51 percent of the cohort achieved their transfer and degree goals and with increased support, this number could be improved.
Data on Demand 2006-2007 through 2011-2012 CohortTotal Cohort 1192 100.00%
Transfer, Preparedness, and PersistenceTransfer 346 29.03%Transfer Prepared 326 27.35%Prepared 180 15.10%Persistence 705 59.14%
Certificate, Associate of Arts, Transfer, and PreparednessCertificate 44 3.69%AA 219 18.37%Transfer 326 27.35%
DSPS and Economic DisadvantageDSPS 79 6.60%Economic Disadvantage 779 65.35%
Foster Youth. In 2012-2013, the percentage of foster youth completing an AA or certificate was 11 percent compared to 18 percent of the general student population who completed a degree or certificate.
Analysis. This sampling of data reveals that specific groups not transferring at proportional rates and new creative support strategies are needed to close the achievement gap and increase the transfer rate for these specific groups, African Americans, Hispanics, and the 25 to 39 age groups. The key to increasing transfer among these groups will be to improve course completion and persistence rates for each year for all groups, and to continue to develop a culture of completion and transfer with orientation, educational plans, increased academic support in a Success Center, and . However, these targeted groups will need additional intervention strategies and support to achieve equitable outcomes in transfer.
2014 Student Equity Plan 39
857858859860861862863864865
866867868869870871872873874875876877878

Goals and Activities
2014 Student Equity Plan 40
879

District: Hartnell Community College District College: Hartnell College
GOALS AND ACTIVITIES
A. STUDENT SUCCESS INDICATOR FOR ACCESS“Compare the percentage of each population group that is enrolled to the percentage of each group in the adult population within the
community serve”
GOAL A.
The College will
A.1: Increase the number of students to represent their community distribution, especially focusing on African Americans in Salinas and the Salinas Valley. (Categorical Program Directors, Counselors, date)
A.2: Determine challenges for mature students with families in the 30-40 year age brackets to facilitate their access and success in college.
A.3: Ensure that students are on an early preparation track to begin completing the Hartnell College “Steps to Success” process for enrollment one-year prior to their actual enrollment.
A.4: Improve referrals to the Foster Youth Support Office (FKCE) for improved access to services.
ACTIVITY A.1 (Please include the target date in chronological order and identify the responsible person/group for each activity)
A.1: Develop an outreach plan and program that meets multiple ethnic- and age-group needs. Continue to collect and use data that describe the colleges students attend after high school as well as demographics that describe Hartnell incoming freshman. (Student Affairs; dates)
A.2: Enhance collaborative efforts with existing outreach programs from the offices of Academic Affairs, Student Life, and the Foundation by working with community groups and employers to access potential students and to learn their barriers to pursuing educational services at Hartnell. In addition, review the College’s current services and how they can be modified to help older students persist and experience success in the college environment. (Academic Affairs staff, Student Life staff, and Foundation staff; dates)
2014 Student Equity Plan 41
880
881
882883884885886887888889890891892893894895896897898899900901902903904905

District: Hartnell Community College District College: Hartnell College
GOAL A. (Continued)
A.3 Recruit and hire a “College Pathways Coordinator,” who will be responsible for coordinating with high schools, adult schools, community-based organizations, foster youth serving organizations, veteran serving organizations, and other organizations. (Foster & Kinship Care Grants Projects Director and staff, Categorical Programs Director and staff, Student Affairs staff; October 2014- May 2015)
A.4 Identify staff in all student support areas to create a Foster Youth Support Team. This new team will begin meeting in September 2014 with support and technical assistance from the John Burton Foundation. Campus staff will receive trainings with county child welfare social workers, ILP staff, foster care providers and others who work directly with foster youth to educate them about matriculation requirements. This team will develop a long-term plan to support foster youth on campus and support transfer and successful completion. (Foster & Kinship Care Grants Projects Director and staff, Categorical Programs Director and staff, Student Affairs staff; October 2014- May 2015)
EXPECTED OUTCOME A.1.1
A.1.a.1: High school students will be provided with incentives to finish high school and continue to college before 20 years of age.
A.1.a.2: High school students will be encouraged to access better guidance and ensure better preparation before they begin or during the first and subsequent semesters at Hartnell to improve outcomes and relieve frustrations caused by many issues such as taking courses not useful for their degrees, family and community challenges, and more (this was also an expected outcome for D).
A.2.b.1: Older students will report access to student and academic support services at all College on evenings, weekends and off site; develop a “Night College” for the 25 to 39 age groups with both evening academic affairs and student services support
A.2.b.1: Older students will be encouraged to access better guidance and ensure better preparation before they begin or during the first and subsequent semesters at Hartnell to improve outcomes and relieve frustrations caused by many issues such as taking courses not useful for their degrees, family and community challenges, and more (this was also an expected outcome for D).
A.4.1: Increase the number of high school high school seniors who participate in “Panther Prep Day” to 800 students on the Main Campus (to include Alisal Campus students) and 300 high school seniors at the King City Center, who will demonstrate completion of the “Steps to Success” process prior to their actual enrollment at Hartnell College.
2014 Student Equity Plan 42
906907908909910911912913914915916917918919920921922923924925926927928929930931932933934935936937

District: Hartnell Community College District College: Hartnell College
GOAL A. (Continued)
A.4.1: The number of foster youth referred for services and support will increase each year by 10 percent. The number of foster youth enrolled at the college will increase from 47 in 2013/2014 to 65 in 2017/2018.
2014 Student Equity Plan 43
938939940941942

District: Hartnell Community College District College: Hartnell College
GOALS AND ACTIVITIES
B. STUDENT SUCCESS INDICATOR FOR COURSE COMPLETION
“Ratio of the number of credit courses that students by population group actually complete by the end of the term compared to the number of courses in which students in that group are enrolled on the census day of the term”
GOAL B.
The College will
B.1: Increase and enhance Tutorial Center services to improve the degree and scope of service to students, including evening and weekend tutoring; increase the number of tutors and Supplemental Instruction teams; develop and offer strategy workshops that include information about placement preparation and options.
B.2: Provide additional support services for students enrolled in DE courses.
B.3: Provide additional services to encourage foster youth to successfully complete coursework and remain enrolled in college.
ACTIVITY B. (Please include the target date in chronological order and identify the responsible person/group for each activity)
B.1.a: Increase the tutorial services at all sites (including online tutoring) for students in ESL and developmental English and math students. Create and offer workshops, including Accuplacer Preparation, that need to be offered on a timely a basis to teach students how to succeed in the community college setting. (Tutorial Services Coordinator, Academic Affairs Dean (LSR&L), tutorial/SI coordinators, additional tutorial staff; September 2014-May 2015)
B.1.b: Provide flex opportunities for additional in-depth discussion and training made available through FIGs, workshops, “brown bag” session(s), and 3CSN activities to discuss, share, and implement reading/success strategies across the curriculum to include the main campus, Alisal Campus, and King City Center. (Faculty Flex Committee, Professional Development Committee, Student Success Committee, October 2014- May 2015)
2014 Student Equity Plan 44
943
944
945946
947
948
949950951952953954955956957958
959960961962963964965966967968969

District: Hartnell Community College District College: Hartnell College
GOAL B. (Continued)
B.2: Continue to provide support services for DE students (Tutorial Services Coordinator, Computer Center; October 2014- May 2015)
B.3: Foster youth will be given priority access to assessment, financial aid support, and counseling services in order to ensure that all matriculation requirements are completed in time to access priority registration. A foster youth services checklist will be developed for student support areas to track matriculation for services. This form will be used as a referral system and also will identify foster youth as eligible for these services. (Foster & Kinship Care Grants Projects Director and staff, Categorical Programs Director and staff, October 2014- May 2015)
EXPECTED OUTCOME B.1.1
B.1.a.1: Increase the number of students supported by tutorial services by 20 percent. Eighty percent of students participating in workshops about how to succeed in the community college setting will agree or strongly agree that workshop strategies will be useful in helping them succeed in college-level courses.
B.1.b.1: Faculty will share and learn student success strategies to apply in their courses; students will learn and demonstrate improved learning strategies that will apply across disciplines.
B.2.1: DE students will be provided with additional support, such as an Introduction to Online Learning course.
B.3.1: Of eligible foster youth, 100 percent will have completed the matriculation checklist by the end of their first semester.
2014 Student Equity Plan 45
970971972973974975976977978979980981982983984985986987988989990991992

District: Hartnell Community College District College: Hartnell College
GOALS AND ACTIVITIES
C. STUDENT SUCCESS INDICATOR FOR ESL AND BASIC SKILLS COMPLETION
“Ratio of the number of students by population group who complete a degree-applicable course after having completed the final ESL or basic skills course to the number of those students who complete such a final course”
GOAL C.
The College will
C.1: Expand the Early Support Program (ESP; also known as Early Alert) pilot to broader implementation across Hartnell campuses with online data gathering and reporting elements.
C.2: Continue to build institutional (academic and student) support programs to improve students’ academic persistence and migration from basic skills courses to degree applicable/transferable courses, and eventually transfer.
C.3: Establish a Student Success Center dedicated to promoting basic skills instruction among faculty and coordinating delivery of and improvement of basic skills students’ academic success.
C.4: Systematize and improve data gathering across the various counseling, student service, and tutorial programs that currently make contact with basic skills students.
C.5: Continue to support collaboration among Academic Affairs, Counseling, and Student Affairs to build on the developmental class offerings, schedules, and more effective placement assessment and enhance student learning (and/or vocational learning) to improve the success and persistence in ESL and basic skills courses; provide a dedicated basic skills counselor for students in developmental English, math, and ESL courses.
C.6: Assist foster youth who are required to take basic skills or remedial classes will successfully complete all basic skills coursework and go on to complete a degree applicable course.
2014 Student Equity Plan 46
993
994
995
996997998999
100010011002
10031004100510061007100810091010
1011101210131014101510161017

District: Hartnell Community College District College: Hartnell College
ACTIVITY C.1 (Please include the target date in chronological order and identify the responsible person/group for each activity)
C.1.a: Continue to pilot an Early-Alert system with all ESL/basic skills instructors (including the Alisal Campus and King City Center) to monitor academic difficulties for math and developmental students and to provide follow-up services (hire additional adjunct counselors to provide support for ESL/basic skills students, provide scholarships, calculators, ALEKS codes, books or book vouchers, provide additional tutorial support). (Student Affairs, Academic Affairs Dean (LSR&L), Dean of Counseling, Title V STEM Director, Basic Skills/STEM faculty; date)
C.1.b: Create a FIG to develop ESP “characteristics” (what is our system, what do we call success, what are the common traits of ESP students?) Develop implementation plan to include faculty, counselors, students, and support. Track. (FIG participants; date)
C.2.a: Identify an appropriate tool and procedures for assessing reading ability for students entering ENG 253. Collect and analyze results Develop and implement assessment. (Dean, Academic Affairs (LSR&L,), ENG faculty, ESL faculty; September 2014-June 2015)
C.2.b: Develop a mandatory bridge program and orientation for developmental and non-traditional students. By 2015, all students will be using the newly implemented interactive online orientation. Research and organization of the action plan on the institutional support program should be developed by June 2015. Developmental and non-traditional students must enroll in a mandatory bridge program by 2016. Accurate data on students’ academic mobility and persistence should be obtained at the end of each semester. (Academic Affairs and Student Affairs administrators and staff; August 2014-Fall 2016)
C.2.c: Create a Faculty Inquiry Group (FIG) to determine and analyze the “barrier points” preventing students from persisting through the levels of basic skills and ESL courses to transfer-level courses and to create “momentum points” to help students succeed. The institutional support program will establish several well organize venues to help students improve their success rate and reduce attrition. (Academic Affairs, Counseling, and Student Affairs management and faculty; October 2014-December 2015)
C.3: Create a student success center to provide academic support for students enrolled in basic skills English, math, and ESL courses. (Academic Affairs, Counseling, and Student Affairs management and faculty; October 2014-December 2015)
C.4: Continue to provide training to basic skills faculty in data collection and analysis. (IPE Office staff, September 2014-May 2016)
C.5: Schedule an embedded basic skills counselor to attend basic skills courses and provide support, advising, and counseling to developmental English, math, and ESL courses. (Academic Affairs, Counseling, and Student Affairs management and faculty; October 2014-December 2015)
2014 Student Equity Plan 47
10181019102010211022102310241025102610271028102910301031103210331034103510361037103810391040104110421043104410451046104710481049

District: Hartnell Community College District College: Hartnell College
GOAL C. (Continued)
C.6.a: Provide tutors to be available for foster youth who will help facilitate the development of study skills and provide course assistance. (Student Support Team and Foster & Kinship Care Grants Projects Director and staff; October 2014-December 2015)
C.6.b: Develop workshops for foster youth in partnership with campus support programs. These workshops will identify student needs to provide the support for foster youth to complete remedial classes. The college will find tutors to be available for foster youth who will help facilitate the development of study skills and provide course assistance. (Student Support Team and Foster & Kinship Care Grants Projects Director and staff; October 2014-December 2015)
EXPECTED OUTCOME C.1.1
C.1.a.1: A minimum of 40 faculty will begin or continue to participate in Early Alert pilot; of the students identified for Early Alert, 50 percent will participate in intervention strategies and be tracked by the Early Alert Counselor. Of these students, 35 percent will be retained and succeed.
C.1.b.1: Faculty will develop a comprehensive ESP plan that will include defining the purpose of early alert (for faculty and students), developing plans to encourage “buy in” (faculty and students) establishing processes and procedures, defining staffing needs, identifying workshop topics, determining scheduling logistics to effectively and efficiently implement the ESP
C.2.a.1: Faculty will use data from reading assessments to develop strategies and curriculum to provide support for student reading success.
C.2.a.2: Faculty and staff will report that annual data provides strong evidence of students’ persistence and migration from basic skills to degree applicable/transfer course.
C.3.1: Faculty will discuss and develop strategies and momentum points that will provide students with academic and success strategies by offering workshops (time management, habits of mind, study skills, etc.), facilitating the formation of study groups, creating learning communities, etc., in a tutorial or student success center environment.
C.3.4.b Faculty will have easy access to data and support in analyzing data.
2014 Student Equity Plan 48
1050105110521053105410551056105710581059106010611062
1063106410651066106710681069107010711072107310741075107610771078107910801081

District: Hartnell Community College District College: Hartnell College
GOAL C. (Continued)
C.3.5: Students enrolled in basic skills courses will have more direct access to support, advising, and counseling to help them succeed and persist in their developmental English, math, and ESL courses through to transfer-level courses.
C.3.6: The percentage of first time, credit foster youth who started at remedial classes will decrease from 47 percent to 40 percent in 2017/2018, which will be above the rate of the general population.
2014 Student Equity Plan 49
10821083108410851086108710881089

District: Hartnell Community College District College: Hartnell College
GOALS AND ACTIVITIES
D. STUDENT SUCCESS INDICATOR FOR DEGREE AND CERTIFICATE COMPLETION
“Ratio of the number of students by population group who receive a degree or certificate to the number of students in that group with the same informed matriculation goal”
GOAL D.
The College will
D.1: Engage in a mixed method research project to review challenges and issues that confront students during their first and second years at Hartnell College.
D.2: Continue to strengthen efforts to provide counseling, advisement, and education plans for new students by building those requirements into newly implemented online Student Orientation.
D.3: Provide support to encourage foster youth to successfully receive a degree or certificate in alignment with the informed matriculation goal.
ACTIVITY D.1 (Please include the target date in chronological order and identify the responsible person/group for each activity)
D.1: Continue to develop and provide modified longitudinal research that captures several moments in students’ college trajectory at Hartnell: college experiences and career progression of alumni at Hartnell and other colleges; quantitative data available and existing surveys; tracking of degrees certificates. (Academic Affairs staff, Student Life staff, and Foundation staff; date).
D.2: Increase the number of new students who are provided with counseling and advisement and who develop education plans. (Student Affairs staff; July 2014-May 2015)
2014 Student Equity Plan 50
10901091
1092
1093
109410951096109710981099110011011102110311041105
1106
1107110811091110111111121113
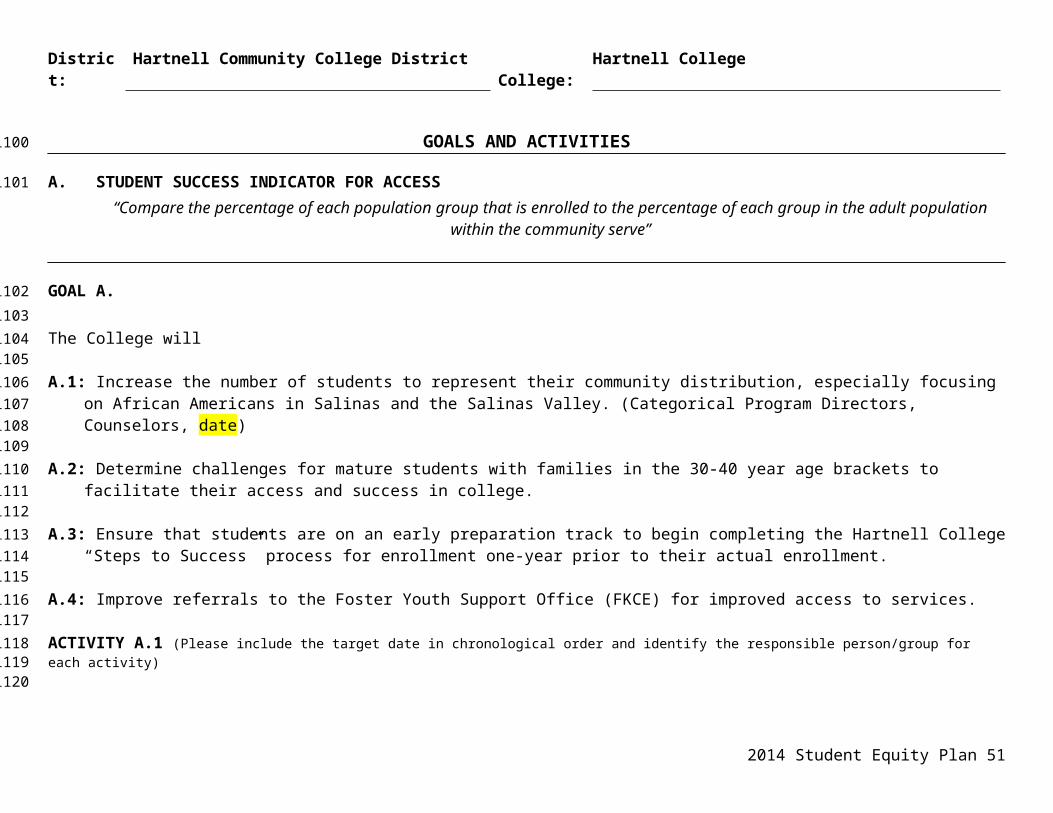
District: Hartnell Community College District College: Hartnell College
GOAL D. (Continued)
D.3.a: Designate a Foster Youth Services Initiative Liaison in the financial aid office. The Foster Youth support team will work with the liaison to schedule quarterly meetings with foster youth to review their progress. Support services will be assigned to foster youth to maintain Satisfactory Academic Progress. (Foster & Kinship Care Grants Projects Director and staff; date)
D.3.b: Schedule an academic counselor to meet quarterly with foster youth students to ensure they are on track for completion of education goals. (Foster & Kinship Care Grants Projects Director and staff; date)
EXPECTED OUTCOME D.1.1
D.1.1: Student success efforts will be supported with quantifiable, easy-to-access data to target challenges to target degree and certificate completion barriers to students, to include collaboration with high schools and four-year colleges to track and provide statistically reliable samples.
D.2.1: Students will receive better guidance and preparation before or during the first and subsequent semesters at Hartnell to improve certificate and degree completion.
D.3.1: The number of foster youth to receive a degree over the next six years will increase by 20 percent.
2014 Student Equity Plan 51
111411151116111711181119112011211122112311241125
11261127112811291130113111321133
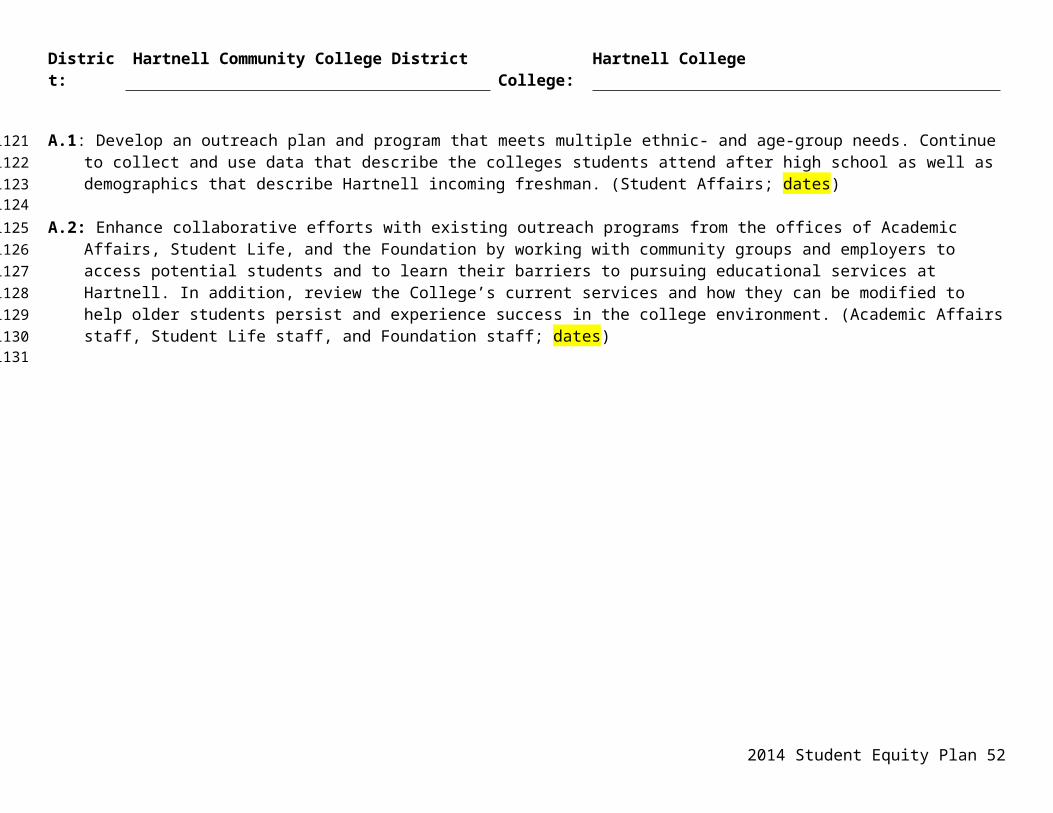
District: Hartnell Community College District College: Hartnell College
GOALS AND ACTIVITIES
E. STUDENT SUCCESS INDICATOR FOR TRANSFER
“Ratio of the number of students by population group who complete a minimum of 12 units and have attempted a transfer level course in mathematics or English to the number of students in that group who actually transfer after one or more (up to six) years”
GOAL E.The College will
E.1: Provide a supportive, innovative, and collaborative environment to help students pursue and achieve educational success and that addresses and meets the diverse learning needs of students.
E.2: Increase the transfer rate for all students, in particular for Hispanic and African American students, with a particular focus on Hispanic and African American males by greatly improving the first-year experience (post high school summer and academic year) for all Hartnell College students. Provide professional development in first-year curriculum and student development theories to faculty and staff (In alignment with the Hartnell College Strategic Plan 2013-2018, Strategic Priority 2, Student Success, Goal 2A and 2B)
E.3: Explore the development of a dual enrollment program with the Salinas Union High School District starting with Salinas High School (Middle College) (VP Academic Affairs staff, VP Student Affairs staff, SUHS District staff; high school and Hartnell BOTs; Fall 2018).
E.4: Implement the Ellucian Colleague Student Planning Programs which include electronic educational planning, course registration, Early Alert, and degree completion tracking. (Student Affairs staff and Academic Affairs staff; Fall 2016)
E.5: Increase the transfer rate of foster youth to four-year institutions within the Central Coast Higher Education Network.
ACTIVITY E.1 (Please include the target date in chronological order and identify the responsible person/group for each activity)
E.1.a: Continue to provide and expand transfer information and counseling to students through the Career and Transfer Center by offering one-on-one and group workshops. (Student Affairs staff; July 2014-May 2017)
2014 Student Equity Plan 52
1134
1135
1136
1137
11381139
11401141
11421143

District: Hartnell Community College District College: Hartnell College
GOAL E. (Continued)
E.1.b: Identify all Hartnell College student partnerships and pathways, such as bridge programs, Veterans and Foster-Kinship Independent Living program, Salinas Adult School and other Monterey County Adult Schools and Monterey County Office of Education Migrant Region 16 and align the Hartnell College service delivery model and institutional message; strengthen transfer partnerships and programs at the community college level such as Title V-Gavilan, CSUMB RN BSN and with public colleges and university transfer programs at the California State University and University of California ,such as the Educational Opportunity Programs. (Academic Affairs staff, Student Affairs staff and Foundation staff, Fall 2016)
E.1.c: Offer a first-year experience program on pilot basis to incoming, first-year students.; develop a peer mentoring program to guide at-risk students (low-income students, first-generation students and underrepresented minorities) through what the “hidden curriculum (“norms, values, and expectations” that govern interactions among Hartnell College students, faculty, staff and administrators”). (Student Affairs staff and Academic Affairs staff; Fall 2016)
E.2: Develop a “Culture of Transfer Support” using a year-round Panther Prep Program curriculum and “pull-in” programs at feeder high schools for all demographic groups with a particular focus on the Latino and African American males; establish transfer support programs for women, veterans, foster students, low income and first generation students (Academic Affairs staff, Student Affairs staff, Foundation staff; Fall 2016).
E.3: Meet with interested representatives of the Salinas Union High School District to explore the development of a dual enrollment program. (VP Academic Affairs staff, VP Student Affairs staff, SUHS District staff; high school and Hartnell BOTs; Fall 2018)
E.4: Provide Ellucian Colleague Student Planning Programs, which include electronic educational planning, course registration, Early Alert, and degree completion tracking, to all students. (Student Affairs staff and Academic Affairs staff; Fall 2016)
E.5: Develop and implement best-practice strategies based on research and programmatic successes within the network by data pulls and site visits in California and out of state and develop MOUs with partner schools. (Foster & Kinship Care Grants Projects Director and staff; date)
2014 Student Equity Plan 53
11441145
1146114711481149
115011511152

District: Hartnell Community College District College: Hartnell College
GOAL E. (Continued)
EXPECTED OUTCOME E.1.1
E.1.1 The numbers of students who receive comprehensive educational planning by increasing the means and number of matriculation activities and student contact will increase.
E.2.1 The number of students who transfer, specifically those who are Hispanic, African American, foster youth, and veterans, will increase.
E.3.1 High school students will recognize and use an additional pathway to Hartnell College for high school students.
E.4.1 Students will indicate access to and use of tools that will assist them in planning course and degree/certificate completion and transfer.
E.5.1: The percentage of foster youth who complete a minimum of 12 units and have successfully completed a college level English and Math will transfer to a four year institution within the Central Coast Higher Education Network will increase by 10 percent by 2017/2018.
2014 Student Equity Plan 54
1153115411551156115711581159116011611162116311641165116611671168

Budget
2014 Student Equity Plan 55

District: Hartnell Community College District DRAFT
College: Hartnell College
SOURCES OF FUNDING
Resources to implement the Student Equity Plan goals and activities to achieve outcomes are provided by the following sources of funding:
BSI funding Categorical funding Grant funding
o Title III, Part F, HSI STEM and Articulation grants (CUSP and STP grants)o Title III, Part F, HSI STEM and Articulation Program, US Department of Educationo Title V, Part A, Developing Hispanic-Serving Institutions Program, US Department of Educationo TRiO Student Support Program, US Department of Educationo National Science Foundationo California Endowmento Youth Empowerment Success Strategies Independent Living (YESS-ILP)—Foundation for
California Community Collegeso Independent Living Program (ILP)—County of Montereyo Transitional Age Foster Youth Health and Wellness Program (TAFY)o Foundation for California Community Collegeso CA College Pathways Initiativeo Walter S. Johnson Foundation
General Fund allocations for support programs, salaries, and benefits and professional development
Funding is allocated based on Program Planning and Assessment (PPA) documents and on alignment to the College’s Strategic Planning Priorities. The Student Equity Plan was developed by a work group of faculty, management, staff, and students and vetted through the College’s councils and committee structure.
2014 Student Equity Plan 56
1169
117011711172117311741175117611771178117911801181118211831184118511861187118811891190119111921193119411951196
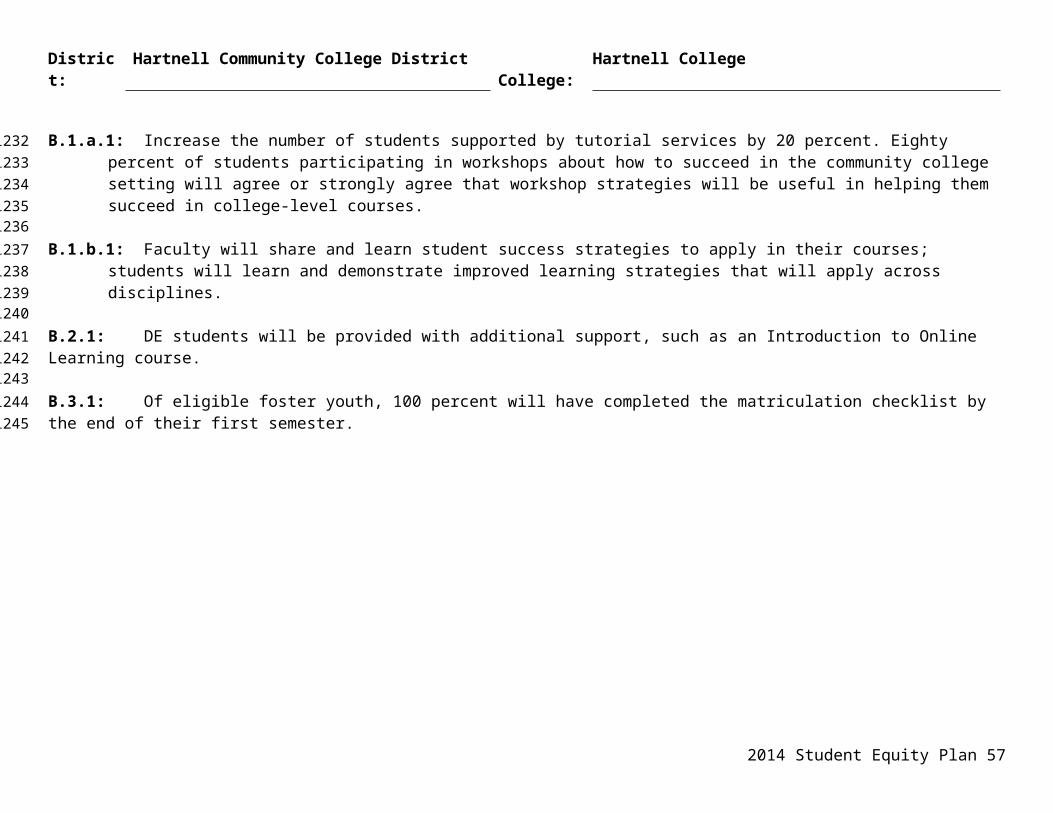
Evaluation Schedule and Process
2014 Student Equity Plan 57
11971198119912001201120212031204120512061207120812091210121112121213

District: Hartnell Community College District DRAFT
College: Hartnell College
EVALUATION SCHEDULE AND PROCESS
Each of the goals and activities identified in the Student Equity Plan will be evaluated by the Student Success Committee and other appropriate groups (Student Affairs, Academic Affairs, etc.). Assessment factors will include a review of goal/activity types, timelines, and achievement of identified outcomes and will be used to determine an assessment schedule.
Data will be shared with faculty and staff to be included in program planning and assessment discussions for their disciplines and areas.
2014 Student Equity Plan 58
1214
12151216121712181219122012211222

Attachments
2014 Student Equity Plan 59
1223122412251226122712281229