Happiness Parameters 1
30
582 30 Optimal Condition of Happiness: Application of Taguchi Robust Parameter Design on Evidences from India Prabhat Pankaj and Roma Mitra Debnath Abstract The present empirical paper attempts to quantify the optimal condition of happiness, measured in terms of subjective wellbeing (SWB), by using Taguchi Robust Parameter Design. The study uses evidences from survey conducted in New Delhi across various segment of people covering 193 respondents. Responses on a total of 25 sources of happiness pertaining to three broad facets- domain satisfaction, lifetime pursuits and global experiences have been obtained. Taguchi orthogonal array design has been used separately on sources of happiness for these three broad facets at 3 and 5 levels. The optimization results suggest that among domain facet, a marginal change in good family life & wellbeing, good inter-personal relationship and good employment & job satisfaction would cause a large change in happiness. While for lifetime pursuit of happiness, most important sources are yoga & meditation, principles & responsibility, and cultural participation. Among the extra-domain sources pertaining to global experiences, factors such as responsible political leadership and low inflation have been found most important. The paper suggests that a prudent public policy could address these factors and also account for ways to improve them for achieving greater happiness for greater number of people. Keywords: Subjective Wellbeing, Facets of Happiness, Taguchi Orthogonal Design, Optimal Scaling, Public Policy, India.
-
Upload
disaindhani -
Category
Documents
-
view
221 -
download
0
Transcript of Happiness Parameters 1

8/4/2019 Happiness Parameters 1
http://slidepdf.com/reader/full/happiness-parameters-1 1/30
582
30
Optimal Condition of Happiness:Application of Taguchi Robust Parameter Design onEvidences from India
Prabhat Pankaj and Roma Mitra Debnath
Abstract
The present empirical paper attempts to quantify the optimal condition of happiness, measured in terms of subjective wellbeing (SWB), by usingTaguchi Robust Parameter Design. The study uses evidences from surveyconducted in New Delhi across various segment of people covering 193respondents. Responses on a total of 25 sources of happiness pertaining tothree broad facets- domain satisfaction, lifetime pursuits and globalexperiences have been obtained. Taguchi orthogonal array design has beenused separately on sources of happiness for these three broad facets at 3 and 5levels. The optimization results suggest that among domain facet, a marginalchange in good family life & wellbeing, good inter-personal relationship and
good employment & job satisfaction would cause a large change in happiness.While for lifetime pursuit of happiness, most important sources are yoga &meditation, principles & responsibility, and cultural participation. Amongthe extra-domain sources pertaining to global experiences, factors such asresponsible political leadership and low inflation have been found mostimportant. The paper suggests that a prudent public policy could addressthese factors and also account for ways to improve them for achieving greater happiness for greater number of people.
Keywords: Subjective Wellbeing, Facets of Happiness, Taguchi Orthogonal
Design, Optimal Scaling, Public Policy, India.

8/4/2019 Happiness Parameters 1
http://slidepdf.com/reader/full/happiness-parameters-1 2/30
Optimal Condition of Happiness
583
I. Introduction
The growing stock of knowledge on happiness research suggeststhat self-reported happiness is a real scalar variable and hence itsquantification and the inter-personal comparison are possible. Therecent work by Centre of Bhutan Studies (2007) provides the first
evidence of a comprehensive applied research on happiness,measured in terms of subjective wellbeing (SWB). It takes intoaccount a holistic approach and applies non-parametric tests toascertain the relationship between conditions of happiness andself-reported happiness per se. Factor analysis has been usedextensively and the findings could establish the underlying factorsbeing contributed by an array of conditions of happiness.However, a pertinent question still remains to be answered is-which array of conditions make into an optimal condition forhappiness. Once such array possibly can be arrived, the publicpolicy focus may be tuned to enhance country’s happiness.
The econometrics and non-parametric measures fail to answer thisquestion as they mainly are designed to establish cause-and-effectrelation between variables. But, in order to obtain a total solution,it is imperative that optimal condition is looked into. TaguchiRobust Parameter Design provides the basis for obtaining anorthogonal array of conditions out of the given conditions whichwould explain the optimal situation. With this method, the impactof a marginal change in an individual aspect of happiness can beassessed and thereby such results may hold key to mould publicpolicy for achieving greater happiness. The robustness of Taguchiapproach over other methods is that it does not exclude the noisefactors and consider them as part of the design. This is significant
for happiness study as conditions of happiness has been reportedto be as significant as conditions of unhappiness. The presentstudy uses evidences from survey conducted in New Delhi, Indiaacross various segment of people.

8/4/2019 Happiness Parameters 1
http://slidepdf.com/reader/full/happiness-parameters-1 3/30
Practice and Measurement of Gross National Happiness
584
The study is divided into six sections. Section I introduces thestudy and outlines the objectives and purpose of undertaking thestudy. Section II reviews relevant literature on happiness studieswith a view of deriving a proper framework support for thepresent study. Section III describes the data collection process andsize of sample for the present study. It also describes the
methodology used in empirical estimation. Section IV outlines theresults derived on the socio-economic characteristics of sampleand their relationship with happiness. Section V provides theoutput of empirical results on optimal scaling. The last section isdevoted to discussion of results and conclusion.
II. Review of literature
There has been a phenomenal growth in happiness research since1960s with over 3000 published studies explored this subject in avariety of ways [visit, www.authentichappiness.sas.upenn.edu).As more and more has been discovered, there is also a growing
realization among scholars that more needs to be explored. Likethe subject of happiness itself, the convergence of opinion on itsresearch is far from the sight. Happiness research hasn’t been moreabout understanding it as perfectly as possible but it has beenmore about how the research can help individuals and societies tobecome as happy as possible. This makes research more relevanton a subject as elusive as happiness. There is a shift in domain ofhappiness research from psychology to that of applied psychologywherein the focus is on happiness increase research. Thecontribution of gross national happiness (GNH) in enhancing thestatus the happiness research is enormous. In fact, GNH hasprovided an alternative world view which will go a long way in
securing the greatest happiness for greatest mass.
The literature on subjective wellbeing or happiness is fast growingand a comprehensive review of these literature can be found inVeenhoven (in press); many attempting to seek interventions toincrease happiness (Fava 1999; Fava and Ruini 2003). Studies have

8/4/2019 Happiness Parameters 1
http://slidepdf.com/reader/full/happiness-parameters-1 4/30
Optimal Condition of Happiness
585
pointed out clearly the distinction between the two components of“satisfaction” (happiness); “life (global) satisfactions” and“domain (work, family, self, etc.) satisfactions.” The leadingresearcher and authority on happiness Rutt Veenhoven visualizedhappiness as the degree to which an individual judges the overallquality of life-as-a-whole favourably. Psychologist Jonathan
Freeman pointed out that people may pursue happinessdifferently, but by and large it is the same happiness for everyone.Therefore, happiness can be viewed and discussed both as a globalas well as individual concept.
Myths about happiness
Despite a phenomenal growth on happiness research by socialscientists across the globe in recent time, the generally held mythsabout happiness still continues. This seems more influenced by thelack of clinical research on happiness and in general on positiveemotions. Understandably, clinical research on human emotions
has tended to focus more on negative emotions. It has beenobserved that about 83% of research in psychology has dealt withnegative feelings. However, theorists like Abraham Maslow, CarlRodgers and others started focusing on positive emotions andinitiated research into areas such as peak experience, optimalmental health, self-actualization, love etc. Partly, the lack ofobjective research on happiness is also contributed by a sort ofmystical and philosophical view about it, which says thathappiness is all that we are looking for but it is all pervasive. Themore we think about it, the more distant it becomes. Therefore themyth about happiness continues that it is unexplainable because itis something that just happens. More so, the situation assumes adark proposition when added by the myth that it is not advisableto talk about happiness (any good thing that happens to you)because if any one tries do so, he/she would tend to loose it.Happiness sharing therefore is a big no-no!
8/4/2019 Happiness Parameters 1
http://slidepdf.com/reader/full/happiness-parameters-1 5/30
Practice and Measurement of Gross National Happiness
586
Three facets of happiness to break the myth
Studies have pointed out that happiness is to be understood in itsvarious facets. Three of such facets for a better understanding ofhappiness could be when we look at it from domain, lifetime andglobal experiences point of view. Happiness is good emotional
feeling in the first place and our domain experiences add to it. Thisresults in happy mood, largely contributed by our family,workplace, living conditions, access to basic facilities etc. But “I amin happy mood” is a different response in comparison to “I am ahappy person” response. In the second response, individual countson past experiences and weighed on lifetime experiences onwhole. Such experience would entail extra-domain factors whichthe individual has derived from society and world at large.Happiness, in this sense, is a generalization that has been madeabout life. It becomes an index of satisfaction with life. The largerthe time frame considered for such evaluation of life, the greaterthe chances of its being influenced by extra-domain factors.
Therefore, when we ask: “How are you these days?” The responseevaluates domain plus lifetime pursuits of happiness. Similarly,when we ask: “How happy are you keeping your whole life intoaccount, overall?” The response most likely is based on theevaluation of domain along with lifetime and global(external/societal) pursuits.
Happiness, in this sense, has three facets. All three are similar asthey explain positive emotional feeling and they are inter-relatedtoo. Shorter the period of evaluation, greater it tends to be moodbased. Larger the span of evaluation, greater it tends to beexperience based. Therefore, macro and societal factors are truly
significant for a lifetime based evaluation of happy experience.More importantly, against the commonly held myth, happinessbecomes explainable!

8/4/2019 Happiness Parameters 1
http://slidepdf.com/reader/full/happiness-parameters-1 6/30
Optimal Condition of Happiness
587
Determinants of happiness
Bentham provided one of the earliest accounts of the calculus ofpain and pleasure while bringing the discussion on utility to theforefront in England in 1789 (Stigler 1965). Bentham’s thirty-twocircumstances explained pleasure and pain. However, discussionin economics thereafter centered on discovering and rediscovering
the principles of marginal utility and later on their measurement.Utility is akin to welfare. An enhancement in welfare can bemeasured in terms of changes in utility. More income bringsenhanced consumption which increases utility and hence welfare(happiness). The object of public policy would be to maximize thesum of happiness in society. Since marginal utility of money ismore for poor, it makes sense to focus on the redistribution ofincome. Studies have confirmed that happiness, not income,constitutes the ultimate goal of most individuals (Easterlin 1995,2001; Oswald 1997; Ng 1997). Easterlin provided one of the earliestempirical works about self reported happiness. The decade of
1990s witnessed increased awareness on the subject andeconomists have shown that happiness is not an entirelypersonalized phenomenon; rather, it also depends on conditionslike unemployment, inflation and income (Clark and Oswald 1994;Oswald 1997; Easterlin 2001). Some scholars have also tried toquantify the effect of variables such as freedom (Frey and Stutzer2002), air pollution (visit:www.authentichappiness.sas.upenn.edu), aircraft noise (Praag andBaarsma 2001) and climate (Rehdanz and Maddison).
A good deal of discussion on this subject can be found in Layard(2003) which emphasized that GDP is a hopeless measure of
welfare demonstrated by the fact that despite several fold increasein per capita GDP the happiness of the population tended tostagnate. Layard points out that Pareto optimality lends us to asituation where no one could be happier without someone elsebeing less happy. Even if we account for problems such asasymmetric information, short-sightedness, externalities anddiseconomies of scale, it only can suggest that higher real wage
8/4/2019 Happiness Parameters 1
http://slidepdf.com/reader/full/happiness-parameters-1 7/30
Practice and Measurement of Gross National Happiness
588
will make population happier. It fails to realize that our wantsonce we are above subsistence level, are largely derived fromsociety and they are major factors affecting happiness. Karl Marxsaid-“A house may be large or small; as long as the surroundinghouses are equally small, it satisfies all social demands for adwelling. But if a palace rises beside the little house, the little
house shrinks into a hut.” (quoted in Layard 2003). Layardconcludes that rational policy-making is possible since happinessis a real scalar variable and can be compared between people.
Helliwel (2001), perhaps, is the only author who attempted toanalyze international and inter-personal difference in subjectivewell-being while making use of data from three waves of theWorld Value Survey covering about fifty different countries. Thestudy uses large international samples of data combiningindividual and societal level determinants of well-being. The studyestablishes the link among social capital, education, income andwell-being. It also identifies the direct and indirect linkage
between social capital and well-being. Happiness depends on a lotmore than people’s purchasing power. It depends on tastes whichpeople acquire from environment and on the whole social contextin which we all live. Therefore, situation such as pertaining toincome, work, family, and health do contribute to happiness andthey also account for the overall happiness rating/index. Layard’s(2003) discussion also focuses on factors such as pertaining tofreedom, religion, trust, and morality as important facets of liferesulting in upward movement in happiness index.
Layard and Helliwell’s study lends great deal of support to thepresumption that establishing the link between individual and
aggregate happiness is important, as both individual and societalfactors determine the extent of rise or fall in well-being (happiness)index. But, an important questions still remains to be answered is-which combination of individual and societal factors would lead togreatest happiness. Answering this question would provideinsight as to how public policy can address the issue of happiness.
8/4/2019 Happiness Parameters 1
http://slidepdf.com/reader/full/happiness-parameters-1 8/30
Optimal Condition of Happiness
589
A question still largely unanswered. This is here the present studymakes headway and attempts to provide a framework for possibleexplanation.
III. Data and methodology
The pioneer work by the Center for Bhutan Studies (CBS) on Gross
National Happiness and Material Welfare in Bhutan and Japan (2007)provides a comprehensive outline of domain, lifetime and globalfactors which are comprehended as important. The pilot survey forassessing psychological and subjective wellbeing of Bhutanesepeople outlined 14 such sources of wellbeing. These sources are acombination of domain, lifetime and global pursuits. The sourcesoutlined are:
1. Financial security2. Good family life and wellbeing of family3. Good health4. Resources for farm production
5. Access to basic facilities6. Personal development and education7. Faith and spiritual pursuits8. Employment and job satisfaction9. Good governance & welfare system10. Good inter-personal relations11. Principles and responsibility12. Community vitality13. Country’s peace and security14. Recreation
Based on the findings of CBS study and others (as reviewed earlierin this paper) and also keeping the situational analysis of Delhi asan urban mega city, the following sources of happiness underbroad three facets of domain, lifetime and global have beenincorporated in the study:
Domain Lifetime Pursuits Global Experiences

8/4/2019 Happiness Parameters 1
http://slidepdf.com/reader/full/happiness-parameters-1 9/30
Practice and Measurement of Gross National Happiness
590
Satisfaction Satisfaction Satisfaction
Financial security Cultural participationGood governance andwelfare system
Personal development& education Cultural identity Buoyant economy
Good healthFaith and spiritualpursuits(religiosity)
Responsive law andorder
Employment & jobsatisfaction Honesty & integrity
Responsive justicesystem
Own housePrinciples andresponsibility Low inflation
Own vehicle andpersonal transport Yoga and meditation
Responsive politicalleadership
Marriage Pride in nationhood
ChildrenGlobal linkage(globalization)
Good family life andwell-being of family
Good interpersonalrelations
Leisure and recreation
Data have been collected through a structured and pre-testedquestionnaire. The five point scale is used for each response. Thehappiness question has been framed by using the most prescribedoverall experience question on five point scale. The sample hasbeen selected on random basis, using six employment categories asthe purposive benchmark. No definite number for each categorysample has been fixed. A total of 193 valid responses have beenused for empirical analysis.
As stated earlier the method of Taguchi Robust Parameter Design
has been used for estimating the optimal combination of factorsseparately among three broad facets. Taguchi estimation usessignal-to-noise as a metric designed to optimize the robustness of afactor. The method also provides rank orders of factors. Rankvalues tend to order the factors from the greatest effect (based inthe delta values) to the least effect on the response characteristic.

8/4/2019 Happiness Parameters 1
http://slidepdf.com/reader/full/happiness-parameters-1 10/30
Optimal Condition of Happiness
591
Delta measures the size of the effect by taking the differencebetween the highest and lowest value for each responsecharacteristic.
The empirical estimation with respect to Taguchi orthogonal arraydesign has been done using MINITAB software. The other
estimations in the paper have used SPSS software.IV. Socio-economic characteristics and Happiness
Happiness trends
Chart 1 provides the distribution of sample according to theirresponses on happiness status. The overall experiences of urbancity people in Delhi looks fairly mixed with of course largerproportion of population reporting to be above average on fivepoint scale. About 62% of the sample reported to be happier thanaverage, while about 18.5% of them are lower than average. If wetake the middle point in the scale representing a neutral position in
happiness scale, about 19% of sample seems to have stuck over it.
Chart 1: Overall Happiness
0 20 40 60 80
Not at all happy
Somewhat happy
Happy
Very happy
Extremely happy
Number of sample
8/4/2019 Happiness Parameters 1
http://slidepdf.com/reader/full/happiness-parameters-1 11/30

8/4/2019 Happiness Parameters 1
http://slidepdf.com/reader/full/happiness-parameters-1 12/30
Optimal Condition of Happiness
593
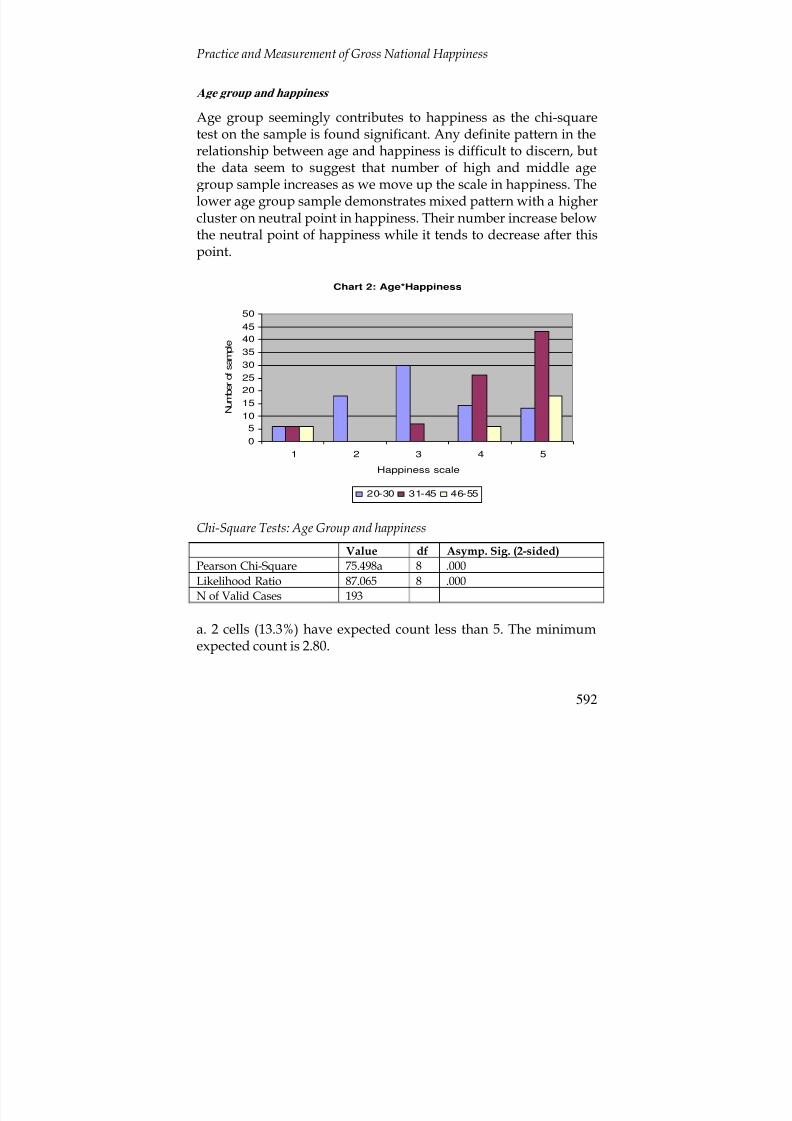
Marital status and happiness
The chi-square test is significant, suggesting that marital status hasa relationship with happiness. The distribution of sample depictedin Chart 2 suggests that more number of unmarried people tend tobe happier as we move up the happiness scale. The reporting bymarried people seemingly gives the feeling that the distribution is
bell-shaped with more number of people reporting to be justhappy. The number tends to increase below this point while ittends to decrease above this point. The other category people aremostly widow and their size of sample is very low. Their reportingsuggests that they are either extremely happy or not at all happy.
Chart 3: Marital Status*Happiness
0
10
20
30
40
50
60
70
1 2 3 4 5
Happiness scale
N u m b e r o f s a m p l e
Married Unmarried Others
Chi-Square Tests: Marital status and happiness
Value df Asymp. Sig. (2-sided)
Pearson Chi-Square 73.557a 8 .000
Likelihood Ratio 73.361 8 .000
Linear-by-Linear Association 11.734 1 .001N of Valid Cases 193
a. 5 cells (33.3%) have expected count less than 5. The minimumexpected count is 1.21.
8/4/2019 Happiness Parameters 1
http://slidepdf.com/reader/full/happiness-parameters-1 13/30
Practice and Measurement of Gross National Happiness
594
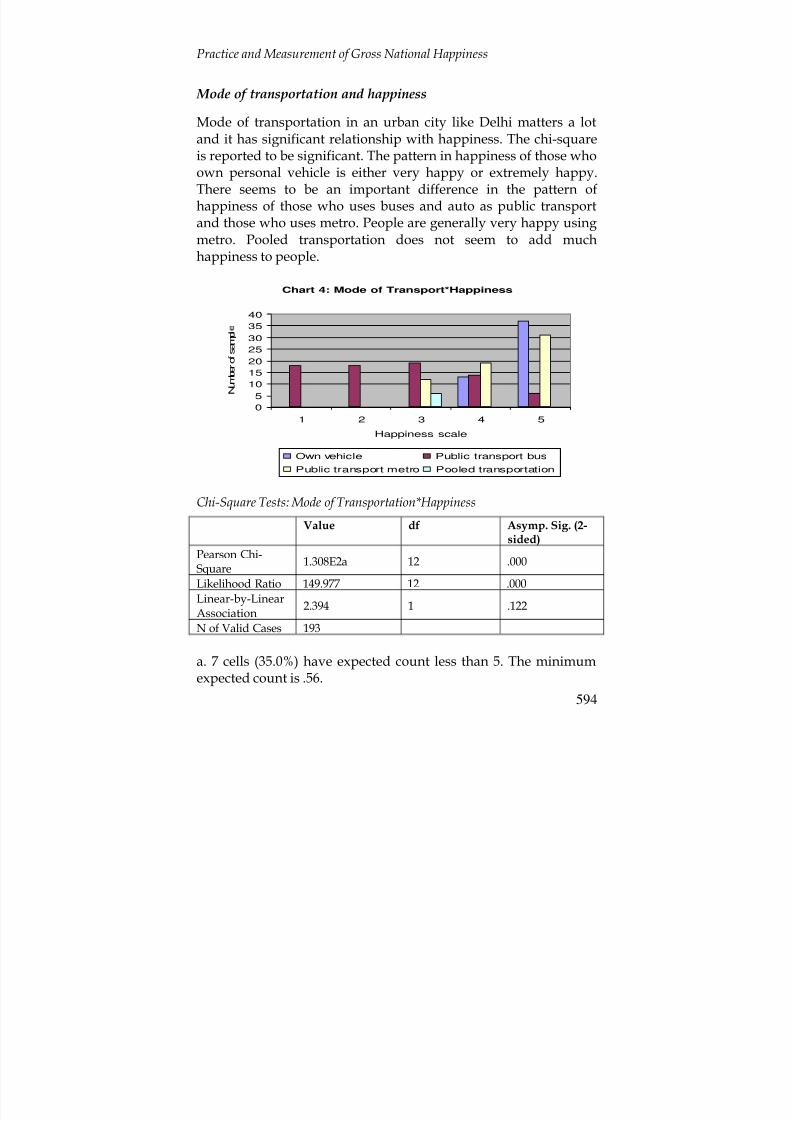
Mode of transportation and happiness
Mode of transportation in an urban city like Delhi matters a lotand it has significant relationship with happiness. The chi-squareis reported to be significant. The pattern in happiness of those whoown personal vehicle is either very happy or extremely happy.
There seems to be an important difference in the pattern ofhappiness of those who uses buses and auto as public transportand those who uses metro. People are generally very happy usingmetro. Pooled transportation does not seem to add muchhappiness to people.
Chart 4: Mode of Transport*Happiness
0
5
10
15
20
25
30
35
40
1 2 3 4 5
Happiness scale
N
u m b e r o f s a m p l
Own vehicle Public transport bus
Public transport metro Pooled transportation
Chi-Square Tests: Mode of Transportation*Happiness
Value df Asymp. Sig. (2-sided)
Pearson Chi-Square
1.308E2a 12 .000
Likelihood Ratio 149.977 12 .000Linear-by-LinearAssociation
2.394 1 .122
N of Valid Cases 193
a. 7 cells (35.0%) have expected count less than 5. The minimumexpected count is .56.

8/4/2019 Happiness Parameters 1
http://slidepdf.com/reader/full/happiness-parameters-1 14/30
Optimal Condition of Happiness
595
Accommodation type and happiness
Yet another significant factor contributing to happiness in a megacity like Delhi is the type of accommodation people live in. Thesignificant chi-square suggests that accommodation type in notindependent of happiness. Those who own house are happier in
comparison to those who do not and are forced to live in rentedaccommodation. People in government and officialaccommodation are comparatively happy perhaps dependingupon the type of accommodation and locality.
Chart 5: Accommodation Type*Happiness
05
10
15
20
25
30
35
40
1 2 3 4 5
Happiness scale
N
u m b e r o f s a m p l e
Rented Offical Own
Chi-Square Tests: Accommodation Type*Happiness
Value df Asymp. Sig. (2-sided)
Pearson Chi-Square
83.342a 8 .000
Likelihood Ratio 101.555 8 .000Linear-by-LinearAssociation
65.137 1 .000
N of Valid Cases 193
a. 4 cells (26.7%) have expected count less than 5. The minimumexpected count is 3.73.

8/4/2019 Happiness Parameters 1
http://slidepdf.com/reader/full/happiness-parameters-1 15/30
Practice and Measurement of Gross National Happiness
596
V. Optimal Scaling: Empirical Results
The optimal scaling for finding out the best sources of happinesshas been undertaken using Taguchi robust parameter design. Thisexercise is undertaken separately for the three facets of happinessas described earlier. The three facets are Domain Satisfaction,
Lifetime Pursuits, and Global Experiences. There are 11 sourcesidentified under domain facet of happiness. For the facet oflifetime pursuits of happiness, 6 sources have been listed while forglobal experiences facet of happiness 8 sources have beenidentified. The selection of sources are based on CBS study, otherempirical and theoretical literature and finally the prevailing socio-economic condition of India and specially that of urban mega citylike Delhi. For example, selection of transportation mode,accommodation type and yoga & meditation are primarily basedon the prevailing socio-economic situation of Delhi city. Furtherdiscussion on these sources is undertaken in the next section.
Domain satisfaction and happiness
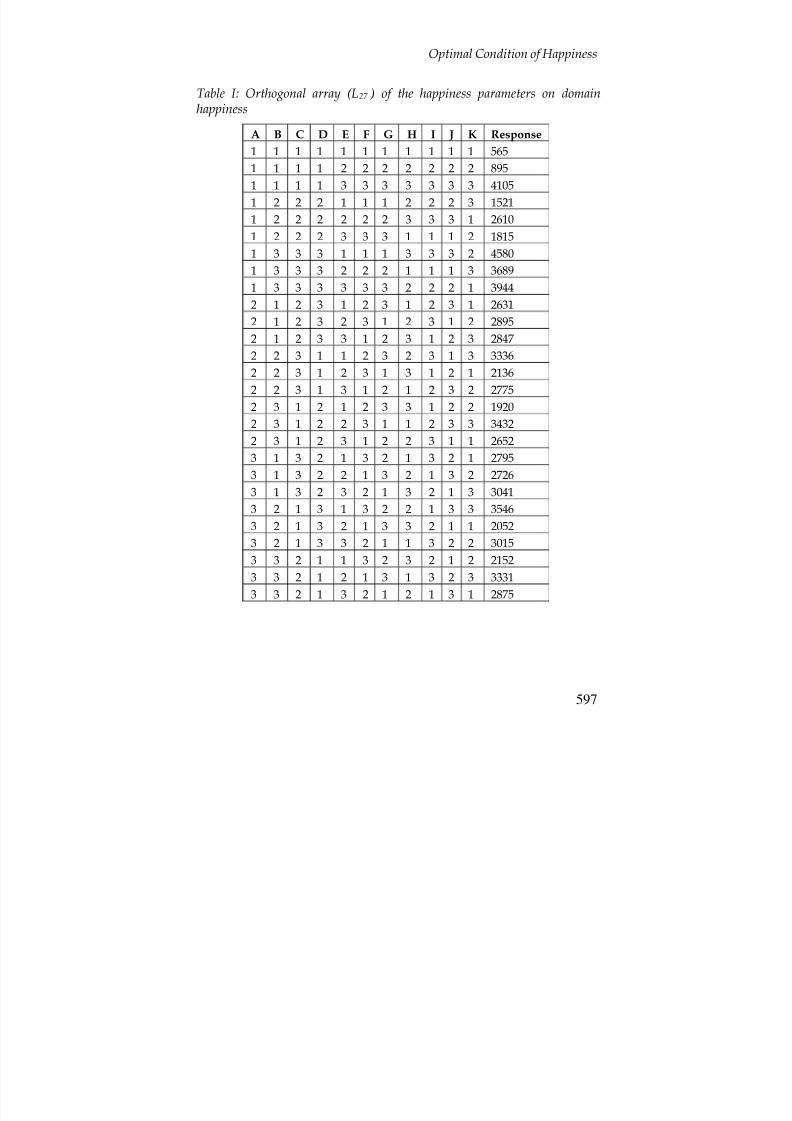
Domain satisfaction results are presented in Table I, II and III.Table I provides Taguchi’s unique orthogonal array used for 11sources on three level analyses. The response calculation has beendone on the basis of given orthogonal structure, converting fivelevel responses into three levels of low, medium and high. Table IIpresents the list of sources used for domain satisfaction analysis.Table III presents the results of robust parameter design. Deltameasures the size of the effect by taking the difference between thehighest and lowest value for each response characteristic. Based onthree levels mean responses, the ranking of sources suggests thatthe top five sources which provide domain satisfaction to the
largest extent are good family life & wellbeing of family, goodinter-personal relationship, good employment & job satisfaction,and leisure & recreation. Financial security and children haveemerged as the least important source of domain happiness. Rankorders the factors from the greatest effect (based in the deltavalues) to the least effect on the response characteristic.
8/4/2019 Happiness Parameters 1
http://slidepdf.com/reader/full/happiness-parameters-1 16/30
Optimal Condition of Happiness
597
Table I: Orthogonal array (L27 ) of the happiness parameters on domainhappiness
A B C D E F G H I J K Response
1 1 1 1 1 1 1 1 1 1 1 565
1 1 1 1 2 2 2 2 2 2 2 895
1 1 1 1 3 3 3 3 3 3 3 4105
1 2 2 2 1 1 1 2 2 2 3 1521
1 2 2 2 2 2 2 3 3 3 1 2610
1 2 2 2 3 3 3 1 1 1 2 1815
1 3 3 3 1 1 1 3 3 3 2 4580
1 3 3 3 2 2 2 1 1 1 3 3689
1 3 3 3 3 3 3 2 2 2 1 3944
2 1 2 3 1 2 3 1 2 3 1 2631
2 1 2 3 2 3 1 2 3 1 2 2895
2 1 2 3 3 1 2 3 1 2 3 2847
2 2 3 1 1 2 3 2 3 1 3 3336
2 2 3 1 2 3 1 3 1 2 1 2136
2 2 3 1 3 1 2 1 2 3 2 27752 3 1 2 1 2 3 3 1 2 2 1920
2 3 1 2 2 3 1 1 2 3 3 3432
2 3 1 2 3 1 2 2 3 1 1 2652
3 1 3 2 1 3 2 1 3 2 1 2795
3 1 3 2 2 1 3 2 1 3 2 2726
3 1 3 2 3 2 1 3 2 1 3 3041
3 2 1 3 1 3 2 2 1 3 3 3546
3 2 1 3 2 1 3 3 2 1 1 2052
3 2 1 3 3 2 1 1 3 2 2 3015
3 3 2 1 1 3 2 3 2 1 2 2152
3 3 2 1 2 1 3 1 3 2 3 3331
3 3 2 1 3 2 1 2 1 3 1 2875

8/4/2019 Happiness Parameters 1
http://slidepdf.com/reader/full/happiness-parameters-1 17/30
Practice and Measurement of Gross National Happiness
598
Table II: Description of the parameters and their levels used in the domainhappiness
Factor Description Levels
A Financial Security 1 2 3
B Personal Development & education 1 2 3
C Good Health 1 2 3
D Employment & Job Satisfaction 1 2 3E Own House 1 2 3
F Own Vehicle and personal transport 1 2 3
G Marriage 1 2 3
H Children 1 2 3
I Good family life and well-being of family 1 2 3
J Good interpersonal relations 1 2 3
K Leisure and recreation 1 2 3
Table III: Mean Response of various parameters under study of Domainhappiness
Level
F i n a n c i a l
S e c u r i t y
P e r s o n a l
D e v e l o p
m e n t
& e d u c a
t i o n
G o d h e a
l t h
G o o d
E m p l o y m e n t
a n d j o b
s a t i s f a c t i o n
O w n
h o u s e
O w n
V e h i c l e
a n d
p e r s o n a l
t r a n s p o r t
1 2636 2500 2465 2463 2561 2561
2 2736 2534 2520 2501 2641 2688
3 2837 3175 3225 3244 3008 2980
Delta 201 675 760 781 447 419Rank 10 6 4 3 7 8
8/4/2019 Happiness Parameters 1
http://slidepdf.com/reader/full/happiness-parameters-1 18/30
Optimal Condition of Happiness
599
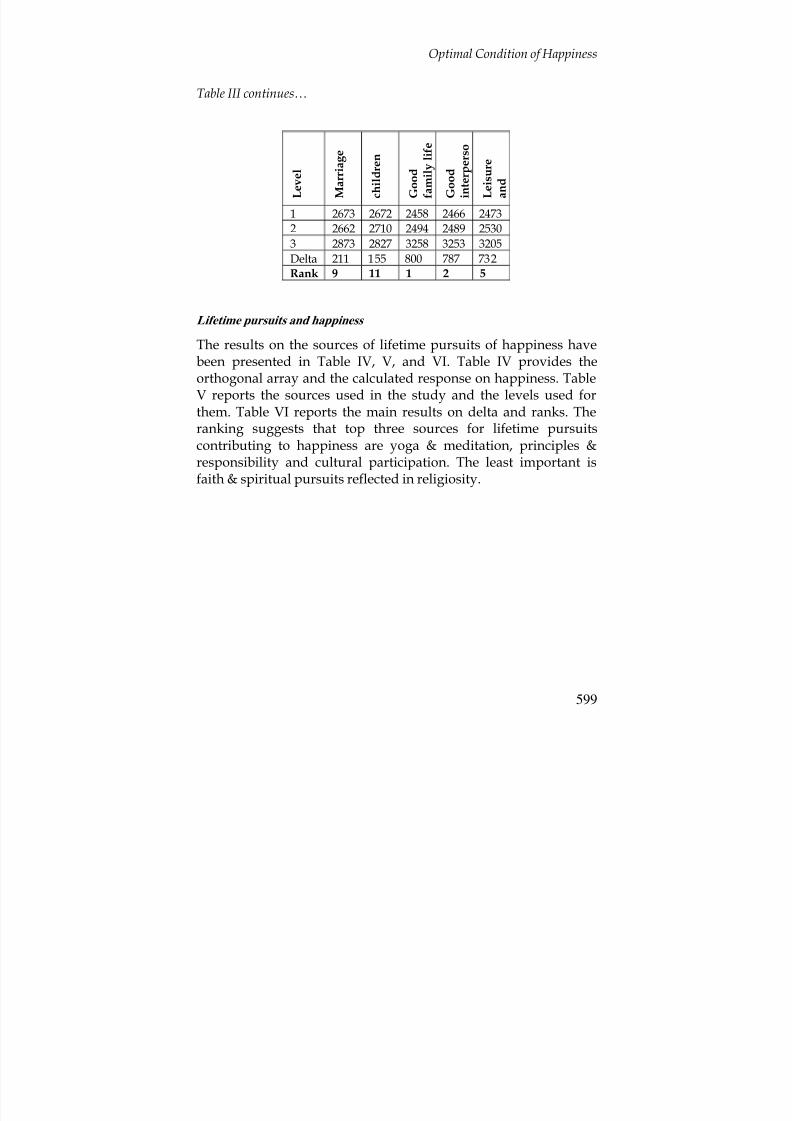
Table III continues…
L
e v e l
M
a r r i a g e
c
h i l d r e n
G
o o d
f a m i l y l i f e
G
o o d
i n t e r p e r s o
L
e i s u r e
a
n d
1 2673 2672 2458 2466 2473
2 2662 2710 2494 2489 2530
3 2873 2827 3258 3253 3205
Delta 211 155 800 787 732Rank 9 11 1 2 5
Lifetime pursuits and happiness
The results on the sources of lifetime pursuits of happiness havebeen presented in Table IV, V, and VI. Table IV provides theorthogonal array and the calculated response on happiness. Table
V reports the sources used in the study and the levels used forthem. Table VI reports the main results on delta and ranks. Theranking suggests that top three sources for lifetime pursuitscontributing to happiness are yoga & meditation, principles &responsibility and cultural participation. The least important isfaith & spiritual pursuits reflected in religiosity.

8/4/2019 Happiness Parameters 1
http://slidepdf.com/reader/full/happiness-parameters-1 19/30
Practice and Measurement of Gross National Happiness
600
Table IV: Orthogonal array (L25 ) of the happiness parameters on lifetimehappiness
A B C D E F Response
1 1 1 1 1 1 41
1 2 2 2 2 2 324
1 3 3 3 3 3 794
1 4 4 4 4 4 462
1 5 5 5 5 5 1433
2 1 2 3 4 5 943
2 2 3 4 5 1 1017
2 3 4 5 1 2 710
2 4 5 1 2 3 355
2 5 1 2 3 4 523
3 1 3 5 2 4 1001
3 2 4 1 3 5 1082
3 3 5 2 4 1 821
3 4 1 3 5 2 885
3 5 2 4 1 3 8254 1 4 2 5 3 828
4 2 5 3 1 4 767
4 3 1 4 2 5 1220
4 4 2 5 3 1 816
4 5 3 1 4 2 697
5 1 5 4 3 2 858
5 2 1 5 4 3 1056
5 3 2 1 5 4 1211
5 4 3 2 1 5 1080
5 5 4 3 2 1 663
8/4/2019 Happiness Parameters 1
http://slidepdf.com/reader/full/happiness-parameters-1 20/30
Optimal Condition of Happiness
601
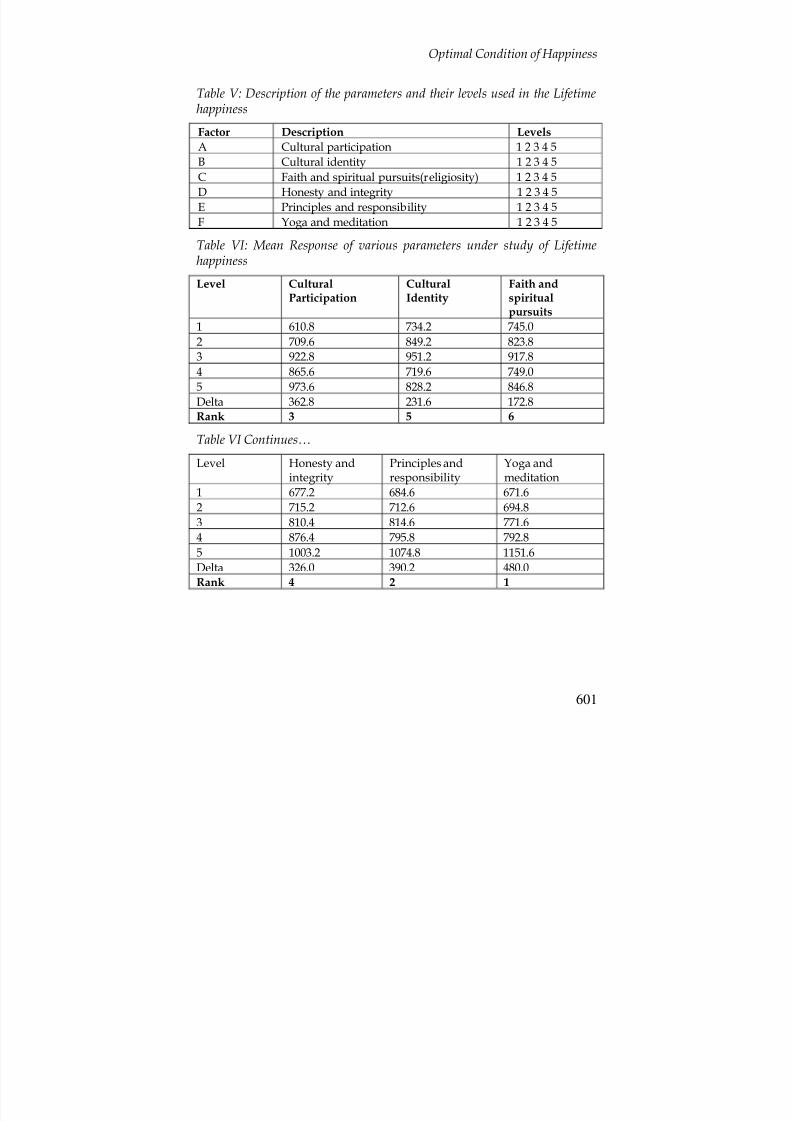
Table V: Description of the parameters and their levels used in the Lifetimehappiness
Factor Description Levels
A Cultural participation 1 2 3 4 5
B Cultural identity 1 2 3 4 5
C Faith and spiritual pursuits(religiosity) 1 2 3 4 5
D Honesty and integrity 1 2 3 4 5E Principles and responsibility 1 2 3 4 5
F Yoga and meditation 1 2 3 4 5
Table VI: Mean Response of various parameters under study of Lifetimehappiness
Level CulturalParticipation
CulturalIdentity
Faith andspiritualpursuits
1 610.8 734.2 745.0
2 709.6 849.2 823.8
3 922.8 951.2 917.8
4 865.6 719.6 749.0
5 973.6 828.2 846.8Delta 362.8 231.6 172.8Rank 3 5 6
Table VI Continues…
Level Honesty andintegrity
Principles andresponsibility
Yoga andmeditation
1 677.2 684.6 671.6
2 715.2 712.6 694.8
3 810.4 814.6 771.6
4 876.4 795.8 792.8
5 1003.2 1074.8 1151.6
Delta 326.0 390.2 480.0Rank 4 2 1

8/4/2019 Happiness Parameters 1
http://slidepdf.com/reader/full/happiness-parameters-1 21/30
Practice and Measurement of Gross National Happiness
602
Global experiences and happiness
Table VII, VIII and IX report the results of global experiences andtheir relative significance in happiness. Table VII presents theorthogonal array and the calculated responses. Table VIII presentsthe eight selected sources contributing to global experiences whichare likely to affect happiness and the three levels used. Table IX
presents the results of calculation and reports delta values and theranking of sources. The results indicate that most important foursources among global experiences are responsive politicalleadership, low inflation, global linkage, and good governance &welfare system. The bottom positions are occupied by responsive
justice system and responsive law & order.
Table VII: Orthogonal array (L27 ) of the happiness parameters on GlobalExperiences and happiness
A B C D E F G H Response
1 1 1 1 1 1 1 1 26
1 1 1 1 2 2 2 2 1251 1 1 1 3 3 3 3 714
1 2 2 2 1 1 1 2 149
1 2 2 2 2 2 2 3 366
1 2 2 2 3 3 3 1 611
1 3 3 3 1 1 1 3 418
1 3 3 3 2 2 2 1 481
1 3 3 3 3 3 3 2 952
2 1 2 3 1 2 3 1 336
2 1 2 3 2 3 1 2 468
2 1 2 3 3 1 2 3 646
2 2 3 1 1 2 3 2 650
2 2 3 1 2 3 1 3 614
2 2 3 1 3 1 2 1 448
2 3 1 2 1 2 3 3 524
2 3 1 2 2 3 1 1 430
2 3 1 2 3 1 2 2 490
3 1 3 2 1 3 2 1 498

8/4/2019 Happiness Parameters 1
http://slidepdf.com/reader/full/happiness-parameters-1 22/30
Optimal Condition of Happiness
603
3 1 3 2 2 1 3 2 456
3 1 3 2 3 2 1 3 715
3 2 1 3 1 3 2 2 596
3 2 1 3 2 1 3 3 672
3 2 1 3 3 2 1 1 587
3 3 2 1 1 3 2 3 727
3 3 2 1 2 1 3 1 4593 3 2 1 3 2 1 2 600
Table VIII: Description of the parameters and their levels used in the GlobalExperiences and happiness
Factor DESCRIPTION LEVELS
A Good governance and welfare system 1 2 3
B Buoyant Economy 1 2 3
C Responsive law and order 1 2 3
D Responsive justice system 1 2 3
E low inflation 1 2 3
F Responsive Political Leadership 1 2 3
G Pride in Nationhood 1 2 3
H Global Linkage 1 2 3
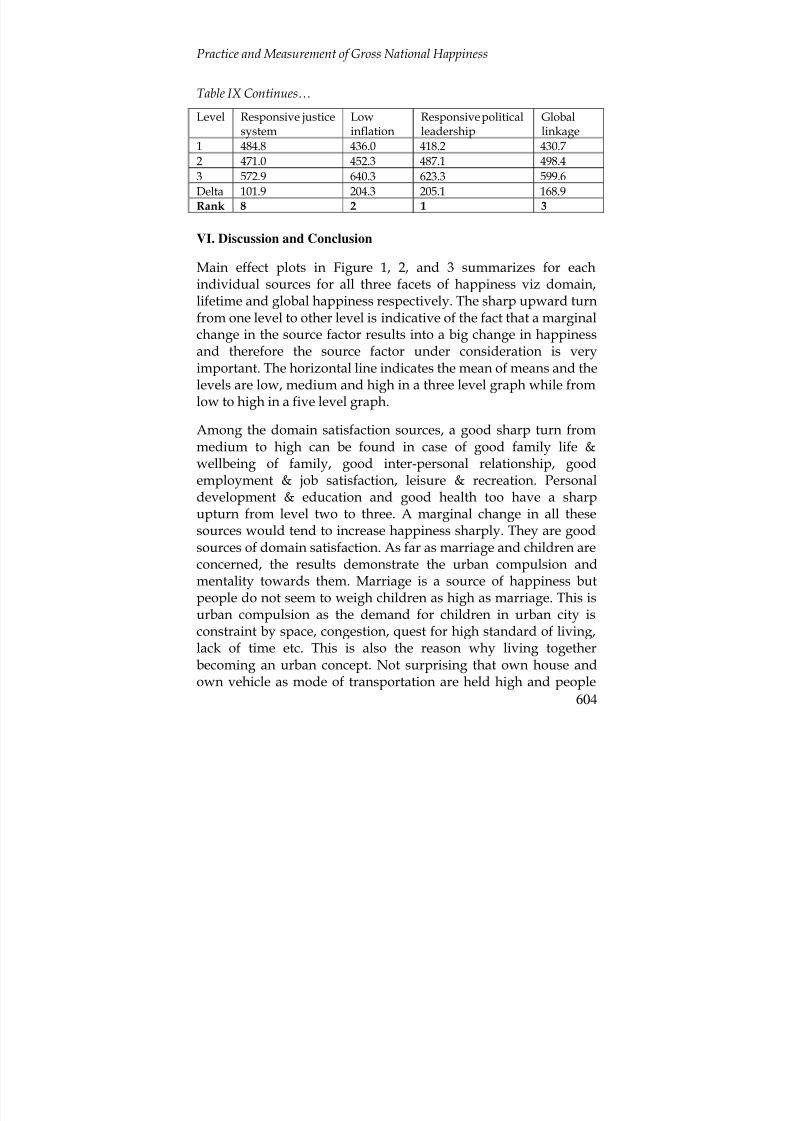
Table IX: Mean Response of various parameters under study of globalexperiences and happiness
Level Good governance andwelfare system
Buoyanteconomy
Responsive lawand order
Pride innationhood
1 426.9 442.7 462.7 445.2
2 511.8 521.4 484.7 46.3
3 590.0 564.6 581.3 597.1
Delta 163.1 121.9 118.7 151.9Rank 4 6 7 5
8/4/2019 Happiness Parameters 1
http://slidepdf.com/reader/full/happiness-parameters-1 23/30
Practice and Measurement of Gross National Happiness
604
Table IX Continues…
Level Responsive justicesystem
Lowinflation
Responsive politicalleadership
Globallinkage
1 484.8 436.0 418.2 430.7
2 471.0 452.3 487.1 498.4
3 572.9 640.3 623.3 599.6
Delta 101.9 204.3 205.1 168.9Rank 8 2 1 3
VI. Discussion and Conclusion
Main effect plots in Figure 1, 2, and 3 summarizes for eachindividual sources for all three facets of happiness viz domain,lifetime and global happiness respectively. The sharp upward turnfrom one level to other level is indicative of the fact that a marginalchange in the source factor results into a big change in happinessand therefore the source factor under consideration is veryimportant. The horizontal line indicates the mean of means and the
levels are low, medium and high in a three level graph while fromlow to high in a five level graph.
Among the domain satisfaction sources, a good sharp turn frommedium to high can be found in case of good family life &wellbeing of family, good inter-personal relationship, goodemployment & job satisfaction, leisure & recreation. Personaldevelopment & education and good health too have a sharpupturn from level two to three. A marginal change in all thesesources would tend to increase happiness sharply. They are goodsources of domain satisfaction. As far as marriage and children areconcerned, the results demonstrate the urban compulsion andmentality towards them. Marriage is a source of happiness butpeople do not seem to weigh children as high as marriage. This isurban compulsion as the demand for children in urban city isconstraint by space, congestion, quest for high standard of living,lack of time etc. This is also the reason why living togetherbecoming an urban concept. Not surprising that own house andown vehicle as mode of transportation are held high and people

8/4/2019 Happiness Parameters 1
http://slidepdf.com/reader/full/happiness-parameters-1 24/30
Optimal Condition of Happiness
605
seem to derive more happiness once these are met with. The resultalso confirms that introduction of metro in Delhi has increasedhappiness in general wherein with road congestion increasing day-by-day; people have got solace of comfortable and secure means oftransportation. Financial security has been taken as a neutralsource of happiness. A marginal change in earnings may not bring
about a big change in happiness. In a way, Delhi urban data clearlypoints out that money is not a major source of happiness for them.
Figure 1: Main Effect Plots of Domain Happiness Sources
M e a n
o f M e a n s
321
3200
2800
2400
321 321 321
321
3200
2800
2400
321 321 321
321
3200
2800
2400321 321
Financial Security Personal Development & educatio Good Health Employment & Job Satisfaction
Own House Own Vehicle and personal transp marriage children
good fami ly l ife a nd wel bei ng o good i nterpersonal rel at ions l ei sure a nd recerati on
Main Effects Plot (data means) for Means
The lifetime pursuits in a busy urban city take a luxury formwherein a lot of time which will have huge opportunity cost needsto be invested. The results suggest that New Delhi is no exception.Therefore, it is not surprising that people have weighed yoga &meditation as the best source of happiness in the pursuit of better
8/4/2019 Happiness Parameters 1
http://slidepdf.com/reader/full/happiness-parameters-1 25/30
Practice and Measurement of Gross National Happiness
606
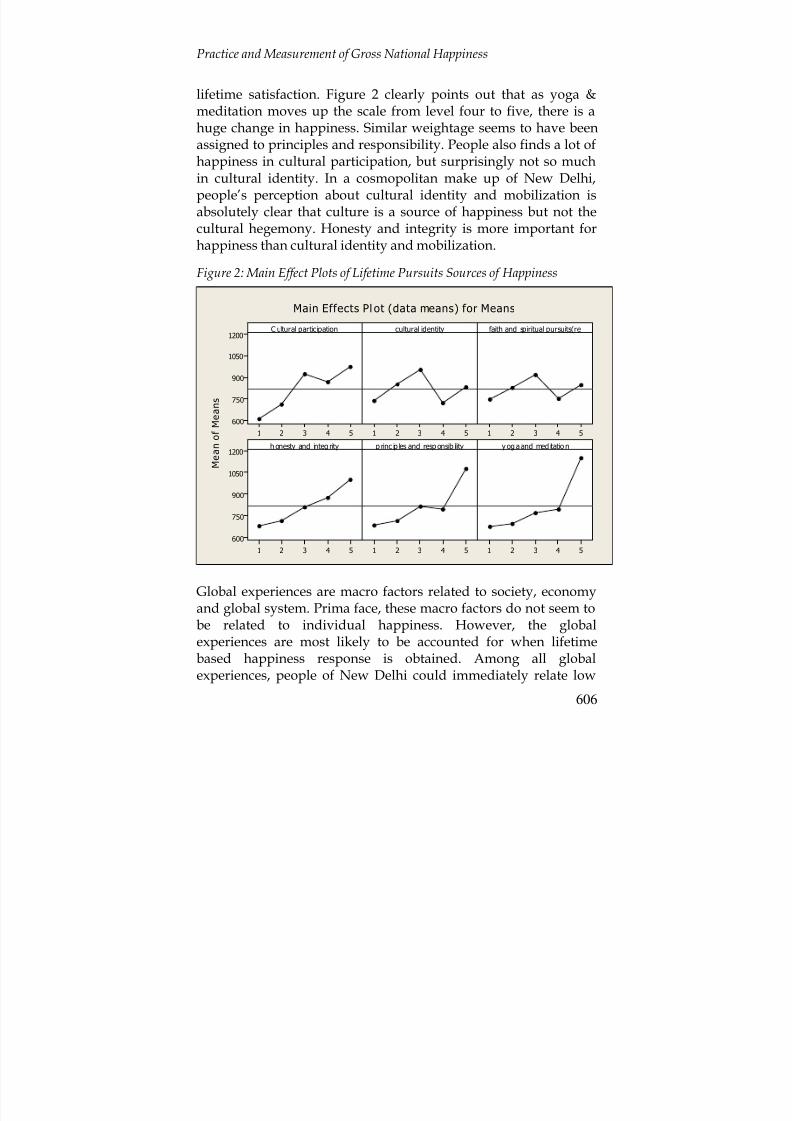
lifetime satisfaction. Figure 2 clearly points out that as yoga &meditation moves up the scale from level four to five, there is ahuge change in happiness. Similar weightage seems to have beenassigned to principles and responsibility. People also finds a lot ofhappiness in cultural participation, but surprisingly not so muchin cultural identity. In a cosmopolitan make up of New Delhi,
people’s perception about cultural identity and mobilization isabsolutely clear that culture is a source of happiness but not thecultural hegemony. Honesty and integrity is more important forhappiness than cultural identity and mobilization.
Figure 2: Main Effect Plots of Lifetime Pursuits Sources of Happiness
M e a n
o f M e a n s
54321
1200
1050
900
750
600
54321 54321
54321
1200
1050
900
750
600
54321 54321
C ultural participation cultural identity faith and spiritual pursuits(re
h onesty and integ rity p rinc ip les and resp onsib ility y og a and med itatio n
Main Effects Pl ot (data means) for Means
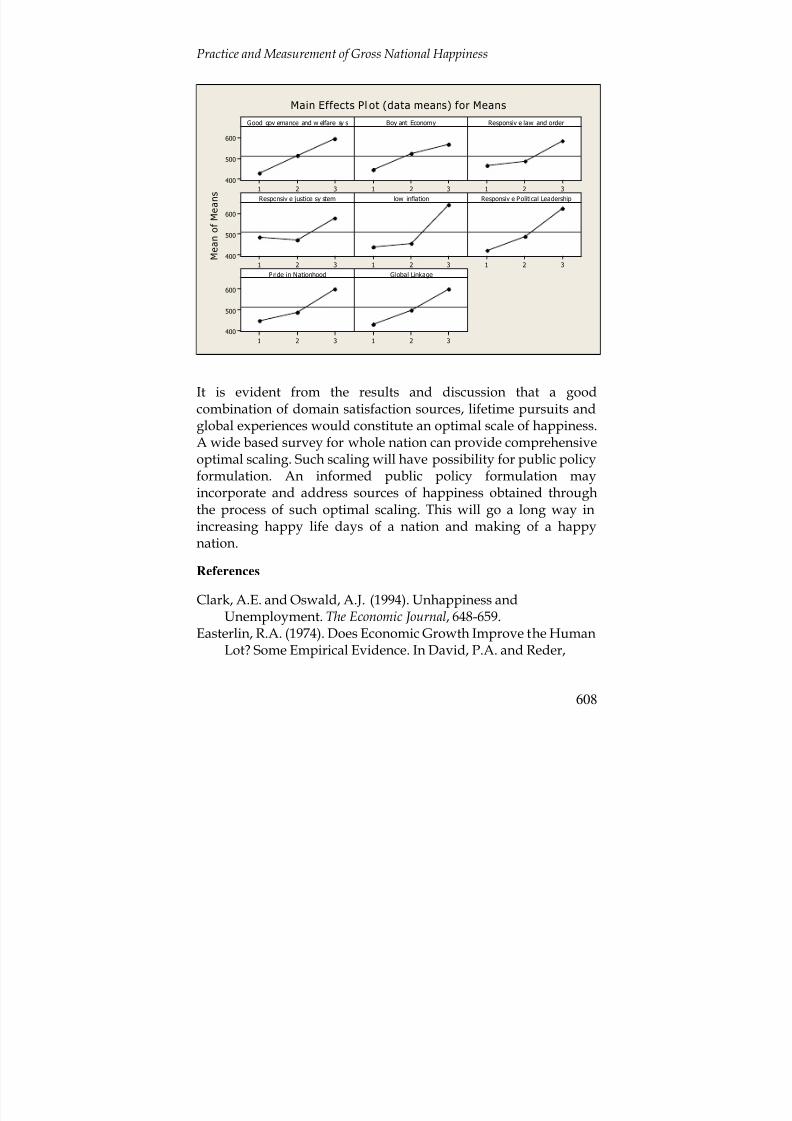
Global experiences are macro factors related to society, economyand global system. Prima face, these macro factors do not seem tobe related to individual happiness. However, the globalexperiences are most likely to be accounted for when lifetimebased happiness response is obtained. Among all globalexperiences, people of New Delhi could immediately relate low
8/4/2019 Happiness Parameters 1
http://slidepdf.com/reader/full/happiness-parameters-1 26/30
Optimal Condition of Happiness
607
inflation and responsible political system as the most importantexperiences affecting happiness. Figure 3 clearly provides a sharpupturn in these two cases when we move from level two to three.Next level of important global experiences is good governance,and good law & order situation.
About responsible justice system, Figure 3 reports that when wemove from level one to two it actually goes down and from two tothree it takes upturn. This indicates that people’s choice about
justice system is absolutely clear in favour of a proactive and highdeliverable system. In fact, a prolonged and low deliverablesystem is justice is a source of unhappiness.
A buoyant economy is a source of happiness where people do notlike economic slump or recession. In fact the expressed choice forglobal linkage is extremely positive. Therefore, a healthy andbuoyant economy with better global linkage creates good globalexperiences and leads to enhancement in happiness.
Figure 3: Main Effect Plots of Global Experience Sources of Happiness
8/4/2019 Happiness Parameters 1
http://slidepdf.com/reader/full/happiness-parameters-1 27/30
Practice and Measurement of Gross National Happiness
608
M e a n
o f M e a n s
321
600
500
400
321 321
321
600
500
400
321 321
321
600
500
400
321
Good gov ernance and w elfare sy s Boy ant Economy Responsiv e law and order
Responsiv e justice sy stem low inflation Responsiv e Political Leadership
Pride in Nationhood Global Linkage
Main Effects Pl ot (data means) for Means
It is evident from the results and discussion that a goodcombination of domain satisfaction sources, lifetime pursuits andglobal experiences would constitute an optimal scale of happiness.A wide based survey for whole nation can provide comprehensiveoptimal scaling. Such scaling will have possibility for public policyformulation. An informed public policy formulation mayincorporate and address sources of happiness obtained throughthe process of such optimal scaling. This will go a long way inincreasing happy life days of a nation and making of a happynation.
References
Clark, A.E. and Oswald, A.J. (1994). Unhappiness andUnemployment. The Economic Journal, 648-659.
Easterlin, R.A. (1974). Does Economic Growth Improve the HumanLot? Some Empirical Evidence. In David, P.A. and Reder,

8/4/2019 Happiness Parameters 1
http://slidepdf.com/reader/full/happiness-parameters-1 28/30
Optimal Condition of Happiness
609
M.W. (eds.) Nations and Households in Economic Growth: Essaysin Honor of Moses Abramovitz. New York.
Easterlin, R.A. (1995). Will Raising the Incomes of all Increases theHappiness of all? Journal of Economic Behavior and Organization,35-47.
Easterlin, R. A. (2001). Income and Happiness: Towards a Unified
Theory. The Economic Journal, 465-484.Easterlin, R.A. (2002). Happiness in Economics , Cheltenham, UK.Fava, G. A. (1999). Well-Being Therapy: Conceptual and Technical
Issues. Psychotherapy and Psychosomatics, 68, 171-179.Fava, G. A. and Ruini, C. (2003). Development and Characteristics
of a Well-being Enhancing Pshychotherapeutic Strategy: Well-being Therapy. Journal of Behaviour Therapy and ExperimentalPsychiatry, 34, 45-63.
Frey, B.S. and Stutzer, A. (2000). Happiness, Economy andInstitution. The Economic Journal, 918-938.
Helliwell, J. F. (2001). How is Life? Combining Individual and NationalVariables to Explain Subjective Well-Being. Working Paper 9065,
NBER, Cambridge.Frey, B.S. and Stutzer, A. (2002). Happiness, Economy and
Institution. The Economic Journal, 918-938.Kennedy, P. A (1998). Guide to Econometrics. MIT Press, Cambridge.Layard, R. (2003). Happiness: Has Social Science a Clue? Lionel
Robbins Memorial Lectures, 2002/3, LSE, London.Namgyal, T. S. and Wangchuk, T. (1998). Measuring Gross
National Happiness: A Predictive Model for QuantifyingSocial and Environmental Wellbeing in Bhutan. SherubDoenme. 4(1&2),1-24. Sherubtse College, Bhutan.
Ng, Y. K. (1997). A Case for Happiness, Cardinalism andInterpersonal Comparability. The Economic Journal,1848-1858.
Oswald, A.J. (1997). Happiness and Economic Performance. TheEconomic Journal, 1815-1831.
Pankaj, Prabhat K. (2003). Population and Happiness. In Pankaj,P.K. and Gyeltshen, T. (eds.) Population and Development:Bhutan’s Quest for a Common Ground. Sherubtse College,Bhutan.

8/4/2019 Happiness Parameters 1
http://slidepdf.com/reader/full/happiness-parameters-1 29/30
Practice and Measurement of Gross National Happiness
610
Pankaj, Prabhat K. and Dorjee, T. (2005). Measuring IndividualHappiness in Relation to Gross National Happiness Bhutan.In Karma Ura and Karma Galay (Eds) Gross National Happinessand Development. Thimphu: The Centre for Bhutan Studies.
Planning Commission Bhutan 2020 (1999). A Vision for Peace,Prosperity and Happiness. Thimphu: Royal Government of
Bhutan.Planning Commission (2002). Ninth Five Year Plan 2002-07 , Main
Document. Thimphu: RGoB.Praag, B.M.S. and Baarsma, B.E. (2001). The Shadow Price of Aircraft
Noise Nuisance: A New Approach to the Internalization of Externalities. Tinbergen Institute, The Netherlands, DiscussionPaper TI 2001-010/3.
Rehdanz, K. and Maddison, D. Climate and Happiness , posted onnet, contact email [email protected].
Royal Government of Bhutan (2000). Development Towards GrossNational Happiness. Thimphu: Ministry of Finance.
Stigler, George J. (1965). Essays in the History of Economics.
University of Chicago Press.Triandis, H.C. (2000). Cultural Syndromes and Subjective Well-
being. In Diener, E. and Suh, E.M. (eds.) Culture and SubjectiveWell-being. Cambridge: MIT Press.
The Centre for Bhutan Studies (2007). Gross National Happiness and Material Welfare in Bhutan and Japan. Thimphu: The Centre forBhutan Studies.
Veenhoven, R. (in press). The Greatest Happiness Principle:happiness as an aim of public policy. In Linley, A. and Joseph,S. (eds) Positive Psychology in Practice. Hobken, New Jersey,
John Wiley and Sons. Quoted from (29).Veenhoven, R. World Database of Happiness, at
http://www.eur.nl/fsw/research/happiness/Welsch, H. (2003). Preferences over Prosperity and Pollution:
Environmental Valuation based on Happiness Surveys.Kyklos,55, 473-494, quoted from Rehdanz and Maddison(2003). http://www.authentichappiness.sas.upenn.edu/

8/4/2019 Happiness Parameters 1
http://slidepdf.com/reader/full/happiness-parameters-1 30/30
Optimal Condition of Happiness
611


![The Seven Secrets of Happiness[1]](https://static.fdocuments.us/doc/165x107/5476240fb4af9fb40a8b606b/the-seven-secrets-of-happiness1.jpg)