Happiness Mahat
24
Happiness beyond Well Being: Some Reflections of Canadian Society Abstract This paper aims to analyze two conflicting views on happiness that are being debated in cotemporary societies using the data from General Social Survey (2003) in Canada. While well being demands for objective indicators (such as income and education) to be maximized as a means and an ends of happiness, satisfaction is judged on the basis of subjective features that determine one’s perceptions, values and attitudes to impact on own and others’ lives. The challenges are then to unite the two concepts that fill the gap between the well being and satisfaction so as to accomplish the sustainable happiness. _______________________________________________________________________ _ 1. Introduction Def ini ng happiness involv es a comple x proces s unlike its simpli cit y in wor ding. Happiness has different dimensions. Classical economists have conceived happiness in terms of economic well being as an instrument of overall happiness impacting on physical, mental and social aspects of an individual. This is based on economic utilization of resources from the point of capital productivity and has a deep connection with Gross national product (Brien, 2005; Bracho, 2005; Spaemann, 2003). However, this concept of happiness has been challenged within a new science paradigm dominated by human psychology. The new science approach values both tangible and intangible dimensions of life, and their mutual dependency, as they are two sides of same coin (Argyle, 2001; Layard, 2005; Tideman, 2005). Happin ess can be understood as a state of satisfac tion or conten tment and well- being, based on our natural identity (Bracho, 2005). Happiness in well being dimension relates more with physical and external aspects of our beings. WHO links wellbeing with health as it sees health as a state of complete physical, mental and social well-being, and not merely the absence of disease or infirmity (Helliwell, 2005). 1
-
Upload
ishara-mahat -
Category
Documents
-
view
220 -
download
0
Transcript of Happiness Mahat

8/8/2019 Happiness Mahat
http://slidepdf.com/reader/full/happiness-mahat 1/24
Happiness beyond Well Being: Some Reflections of Canadian Society
Abstract
This paper aims to analyze two conflicting views on happiness that are being debated in cotemporary
societies using the data from General Social Survey (2003) in Canada. While well being demands for
objective indicators (such as income and education) to be maximized as a means and an ends of happiness,
satisfaction is judged on the basis of subjective features that determine one’s perceptions, values and
attitudes to impact on own and others’ lives. The challenges are then to unite the two concepts that fill the
gap between the well being and satisfaction so as to accomplish the sustainable happiness.
_______________________________________________________________________
_
1. Introduction
Defining happiness involves a complex process unlike its simplicity in wording.
Happiness has different dimensions. Classical economists have conceived happiness in terms of
economic well being as an instrument of overall happiness impacting on physical, mental and
social aspects of an individual. This is based on economic utilization of resources from the point
of capital productivity and has a deep connection with Gross national product (Brien, 2005;
Bracho, 2005; Spaemann, 2003). However, this concept of happiness has been challenged within
a new science paradigm dominated by human psychology. The new science approach values
both tangible and intangible dimensions of life, and their mutual dependency, as they are two
sides of same coin (Argyle, 2001; Layard, 2005; Tideman, 2005).
Happiness can be understood as a state of satisfaction or contentment and well-being,
based on our natural identity (Bracho, 2005). Happiness in well being dimension relates more
with physical and external aspects of our beings. WHO links wellbeing with health as it sees
health as a state of complete physical, mental and social well-being, and not merely the absence
of disease or infirmity (Helliwell, 2005).
1

8/8/2019 Happiness Mahat
http://slidepdf.com/reader/full/happiness-mahat 2/24
Happiness as a state of contentment reflects more spiritual and inner aspects of our
identity. Wisdom is a prerequisite of such happiness, as it leads us to choose a correct path of
living, in which, we can differentiate what makes us happy or unhappy (Bracho, 2005; Tideman,
2005). It would involve a qualitative judgment on values and other intangibles that go beyond its
initial premises (Argyle, 2001; Layard, 2005; Tideman, 2005). Tideman further argues that we
can end up being unhappy even after being wealthy or healthy. Thus if we assume that we would
be happier as we consume more, we are overlooking the intricate functioning of human brain
(Graham & Pettinato, 2002; Tideman, 2005; Sen, 1992).
To some extent, happiness may be caused by objective features such as wealth and
employment, however, there are subjective features that might be most important, which we are
not aware of (Argyle, 2001: 222). For instance, how we perceive those conditions in given
circumstances that makes us happy or unhappy. Happiness is not about absence or presence of
objectivity but is closely tied up with “how people see things to a considerable extent their
perceptions, even if they are false are more important than reality” (Borrow, 1980: 125).
2. Objectives of the Study
The overall goal of this case study is to reflect the general happiness of people in Canadian
society. The specific objectives are following;
1. To identify and analyze the factors that affect happiness of people in Canada
using different explanatory variables as indicators,
2. To indicate the problems and suggest few strategies for foreseeing the happiness
of people beyond wellbeing.
2

8/8/2019 Happiness Mahat
http://slidepdf.com/reader/full/happiness-mahat 3/24
3. Perspectives of Happiness: Theoretical Framework
In pursuit of happiness, the gross national happiness (GNH) over gross national product
(GNP) was first initiated in a small country Bhutan. GNH has four important dimensions:
sustainable and equitable economic life, social and cultural identity, environmental harmony and
local governance and the combination of all contributes to spiritual integrity (Prakke, 2005).
Bhutanese as proponent of Buddhist spirituality enjoy high GNH, which could be taken by the
nations of high GNP (Galay, 2001). GNH seeks to maximize happiness rather than economic
growth. It recognizes that an individual has material, spiritual and emotional needs (Hirata,
2005). Hence, people can not be happy just because the nation has a high growth or GNP, but if
people are happier based on high GNH. Layard (2005) confers that people in West are no
happier than fifty years ago despite a massive increase in their purchasing power. Income has
little or no effect on happiness once reaching a minimum threshold, although it can contribute to
happiness to that level of threshold (Frey & Stutzer, 2002: 75).
A Nobel economist Amartya Sen (1983) claims that human beings are not “rational
fools” to be motivated merely by the economic benefit that is based on production and exchange.
In fact, they could equally be moved by other regarded values of justice, fairness, trust, honoring
of contracts, civic duty, religions, and cultural heritages (Sen, 1983). In this sense, wisdom and
compassions owe a great value in transforming resources into capabilities and thereby the well
being. Linking the capabilities with well being, Sen (1992) contends that freedom of choice
(which determines the capabilities) has a direct impact on the well being achieved. The
capabilities are more intrinsic than the extrinsic. If we rely only on the utility based pleasure,
happiness and desires, we are paralyzing our inner strength (Sen, 1992). Sen further states that
“the grumbling rich man may well be less happy than a contented peasant, but he does have a
3

8/8/2019 Happiness Mahat
http://slidepdf.com/reader/full/happiness-mahat 4/24
higher standard living than the peasant” (cited in Graham & Pettinato, 2002: 71). In pursuit of
such happiness, the revolutionary leaders (such as Franklin, and Jefferson) in Europe and North
America in 18th century valued indigenous wisdom in their struggle to fight against feudalism to
make more human freer society (Bracho, 2005).
Well being based on utilitarian judgments or consumption is likely to be transitory. An
extra pleasure that is associated with additional material goods has short tenure and it even
disappears with continued consumption (Bruni & Porta, 2005: 124). This process of adaptation
supplements the socially comparative or even competitive process in consumption.
Consequently, people continue to strive for higher aspirations, which affect their well being.
Individual well being is determined by the gap between aspirations and achievement (Bruni &
Porta, et.al, 2005). Happiness measured on objective indicators (such as income and
employment) by new classical economists is often found to be contradictory to the results of
empirical research. For instance, one of the causal relations of unhappiness is linked with
unemployment, however, unhappy people are indeed less successful in labor market (Argyle,
2001; Frey & Stutzer, 2002). As a result, they are likely to be frequent laid off from employment.
Russell (1975) highlights on one’s feeling of security and self-esteem as a basis of
happiness as they allow reasons for own values in judgment of others. Russell further analyzed
increasing failure of family life and its negative association with happiness and the need for the
individual to have pride in his/her work. Personal happiness partly depends on external forces
and partly on oneself (Layard, 2005; Russell, 1975). For instance, a person has a little control
over loosing his/her parents. Strong personal relationships contribute to happiness with less
stress, improved health, and increased self esteem (Belliotti, 2004: 61). Similarly, social support
and sense of control on own lives are interchangeable and are the most important sources of well
4
8/8/2019 Happiness Mahat
http://slidepdf.com/reader/full/happiness-mahat 5/24
being. Hobbes argues that human beings are inherently social and their happiness depends on the
quality of their relationship with other people (cited in Layard, 2005).
Above all, one’s way to perceive things or their attitudes in given circumstances largely
matter, which is a unique means of human freedom (Layard, 2005: 8).
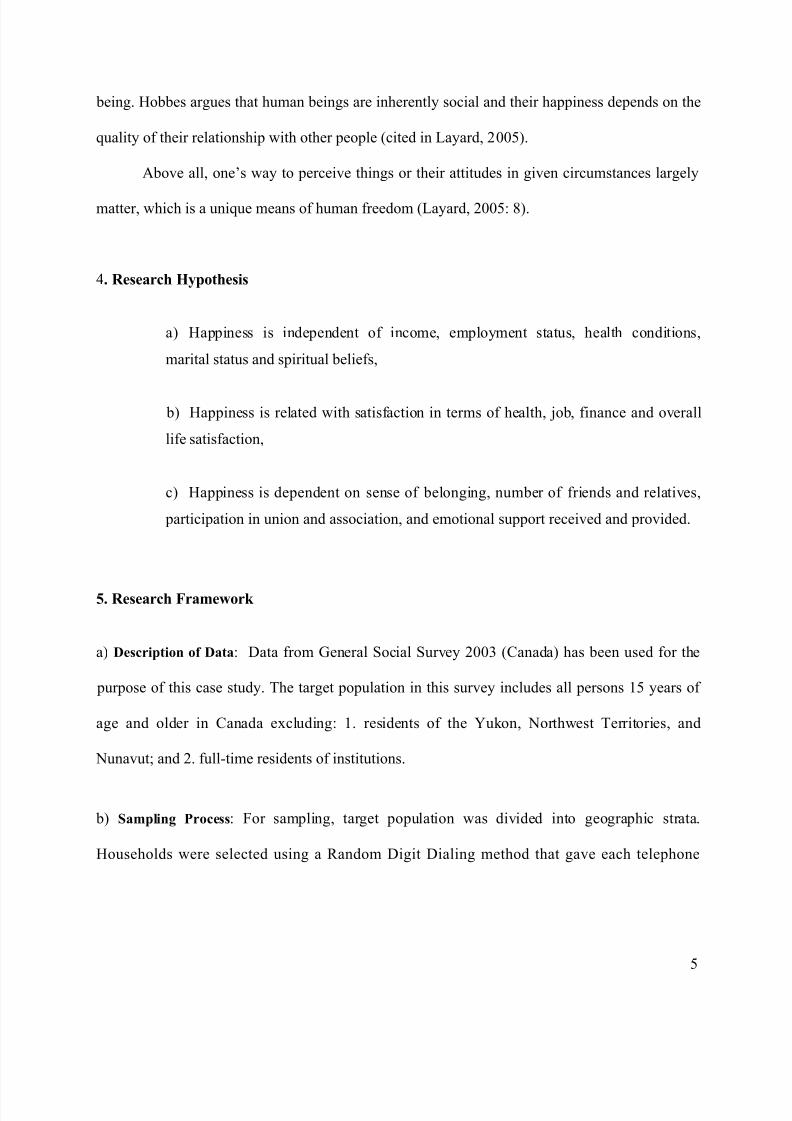
4. Research Hypothesis
a) Happiness is independent of income, employment status, health conditions,
marital status and spiritual beliefs,
b) Happiness is related with satisfaction in terms of health, job, finance and overall
life satisfaction,
c) Happiness is dependent on sense of belonging, number of friends and relatives,
participation in union and association, and emotional support received and provided.
5. Research Framework
a) Description of Data: Data from General Social Survey 2003 (Canada) has been used for the
purpose of this case study. The target population in this survey includes all persons 15 years of
age and older in Canada excluding: 1. residents of the Yukon, Northwest Territories, and
Nunavut; and 2. full-time residents of institutions.
b) Sampling Process: For sampling, target population was divided into geographic strata.
Households were selected using a Random Digit Dialing method that gave each telephone
5

8/8/2019 Happiness Mahat
http://slidepdf.com/reader/full/happiness-mahat 6/24
number in a stratum an equal chance of being selected. One person aged 15 or older was
randomly selected from each selected household to participate in the survey.
c) Selection of Variables: Happiness is selected as a dependent variable and the explanatory
variables are categorized into well being and state of contentment, as they are presumed to have
impact on happiness. Wellbeing variables include income, employment status, and self assessed
health. State of contentment variables consist of satisfaction to health, finance, job satisfaction,
and overall life satisfaction, sense of belongingness, and number of closed friends and relatives
Some variables such as gender, age group, are used as control variables to see their implications
on the relationship between dependent and other independent variables.
d) Measurement of variables: Variables are measured in three scales depending on their nature.
For example, income, age group, and number of hours volunteered, are measured in interval ratio
scale, and other categorical variables are either in nominal or in ordinal scale. For example,
happiness, sense of belongingness, and self assessed health, satisfaction (health, job, finances,
whole life) are measured in ordinal scale and gender, employment status, emotional support and
participation in group activities are measured in nominal scale. Ordinal scales are assigned from
lowest number to the highest. For instance 1 is assigned for very unhappy and 4 for very happy
and this scaling is consistent with other ordinal variables as well. Some variables are recoded and
dummies are created as necessary for the purpose of analysis.
6. Analysis of Findings
Analysis has been segregated into two parts. The first part focuses on well being aspects of
happiness and thus measuring on more objective indicators such as income, health and
6
8/8/2019 Happiness Mahat
http://slidepdf.com/reader/full/happiness-mahat 7/24
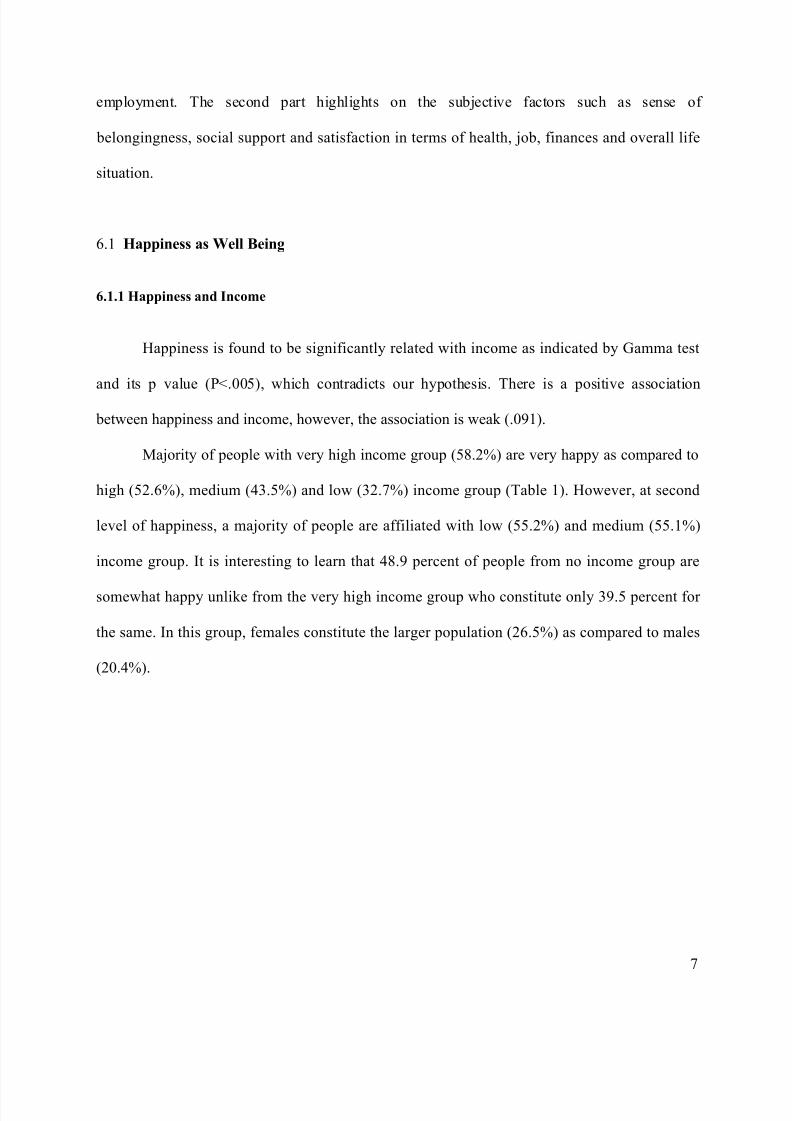
employment. The second part highlights on the subjective factors such as sense of
belongingness, social support and satisfaction in terms of health, job, finances and overall life
situation.
6.1 Happiness as Well Being
6.1.1 Happiness and Income
Happiness is found to be significantly related with income as indicated by Gamma test
and its p value (P<.005), which contradicts our hypothesis. There is a positive association
between happiness and income, however, the association is weak (.091).
Majority of people with very high income group (58.2%) are very happy as compared to
high (52.6%), medium (43.5%) and low (32.7%) income group (Table 1). However, at second
level of happiness, a majority of people are affiliated with low (55.2%) and medium (55.1%)
income group. It is interesting to learn that 48.9 percent of people from no income group are
somewhat happy unlike from the very high income group who constitute only 39.5 percent for
the same. In this group, females constitute the larger population (26.5%) as compared to males
(20.4%).
7

8/8/2019 Happiness Mahat
http://slidepdf.com/reader/full/happiness-mahat 8/24
Table 1: Happiness by Household Income
Since there is a great variation in income among different age group and between gender,
it is worth considering these variables into account. For this purpose, multiple regression analysis
Happiness Household Income Total
Low Medium High Very High
Very Unhappy 14.8(2.4 %)
45(.9 %)
57.2
(.5%)37.4
(.4%)154.4(.8 %)
Somewhat unhappy 71.1
(9.7%)
216.8
(4.4%)
276
(2.8%)
180.4
(2%)
744.3
(3.9%)
Somewhat happy 844.9(55.2%)
2574.4(51.1%)
3277.6(44.1%)
2142.8(39.8%)
8839.7(46.8%)
Very happy 876.2
(32.7%)
2669.9
(43.5%)
3399.2
(52.6%)
2222.3
(58.2%)
9167.6
(48.5%)
Total 1807100 %
5506100 %
7010100 %
4583100 %
18906.0100%
Gamma (value).091
(Std. error).009
(Approx T (b)10.362
(Sig.).000
8

8/8/2019 Happiness Mahat
http://slidepdf.com/reader/full/happiness-mahat 9/24
has been used to see the effect of each independent variable on dependent variable controlling
for each other.
Table 2: Happiness by Gender, Age group and Income
VariablesUn standardized
CoefficientsStandardizedCoefficients t Sig.
B Std. Error Beta
(Constant) 3.118 .020 156.346 .000
sex .041 .009 .034 4.721 .000
Age group of therespondent (7categories)
-.013 .003 -.035 -4.812 .000
Total household income .042 .002 .179 24.456 .000
a Dependent Variable: happiness
Table 2 indicates that the household income have a significant partial effect on level of
happiness controlling for age and gender and vice versa as indicated by t test and corresponding
p values(<.005).
While age has a negative correlation with happiness, household income has a positive
correlation with the same. For instance, happiness decreases by .013 with every year increase in
age and increases by .04 for every unit increase in income. However, the association between age
and happiness (.035) and income and happiness (.174) is weak indicating the low strength of
association.
Overall, the above analysis indicates that income has a significant effect on determining
happiness regardless of gender, and age group.
6.1.2 Happiness and Employment Status
Happiness is also highly dependent on the employment status as indicated by the Chi-
Square test and its corresponding p value (<.005) below. Interestingly, a larger part of the
9

8/8/2019 Happiness Mahat
http://slidepdf.com/reader/full/happiness-mahat 10/24
population who are unemployed (67.2%) are found to be very happy as compared to the self
employed (51.2%) and paid employment (50.3%). However, at second level of happiness, paid
employment and self employed constitute a larger population than the unemployed group (Table
3).
Table 3: Happiness by Employment Status
Happiness Employment Status Total
Paid
employment
Self employed Unemployed
Very Unhappy 115.9(.5 %)
22.4(.4 %)
.5
(1.6%)138.8(.8 %)
Somewhat unhappy 558.7
(3.2%)
108.1
(3.4%)
2.5
(1.6%)
699.3
(3.9%)
Somewhat happy 6631.0(46.0%)
1283.0(44.9%)
29.9(29.7%)
7943.9(46.8%)
Very happy 6876.5
(50.3%)
1330.5
(51.2%)
31.0
(67.2%)
8238.0
(48.5%)
Total 14182.0100 %
2744.0100 %
64.0100 %
18010.0100%
Chi-Square 206.275 9 (DF) .000(sig.)
10

8/8/2019 Happiness Mahat
http://slidepdf.com/reader/full/happiness-mahat 11/24
We can explore the multivariate relationship between employment status and happiness
controlling for age and gender using multiple regression analysis.
Table 4: Happiness by Employment Status, Age and Gender
VariablesUn standardized
CoefficientsStandardizedCoefficients t Sig.
B Std. Error Beta(Constant)
3.493 .010349.69
6.000
dummy for self-employed .024 .013 .012 1.889 .059
dummy for no labor force -.075 .010 -.057 -7.355 .000
dummy for unemployed .165 .076 .014 2.161 .031
Age group of therespondent
-.016 .003 -.047 -6.302 .000
sex .028 .008 .023 3.523 .000
a Dependent Variable: happiness
As indicated in table 4, employment status still seems to be significant regardless of
gender and age, and vice versa. Those who are not in labor force (higher % of women than men)
have a high significant partial effect on happiness as compared to other groups controlling for
age and gender. Naturally, the association between these two is negative. Happiness decreases by
.075 for this group as compared to paid employment groups (.i.e. 3.493-.075 = 3.418). Similarly,
unemployment has a moderate effect on happiness controlling for age and gender. Interestingly,
the association between these two (unemployment and happiness) is positive. For instance,
happiness increases by .165 for unemployed as compared to paid employment groups and this
increment is also higher than for self employed (.024). Self employed is almost significant in
11
8/8/2019 Happiness Mahat
http://slidepdf.com/reader/full/happiness-mahat 12/24
determining happiness controlling for age and gender, while gender and age are still significant
controlling for employment status. For instance, males are happier than females irrespective of
their age and employment status as the level of happiness increases by .028 for males. However,
the association of each independent variable with happiness is weak, which ranges from .012 to .
057.
6.1.3 Happiness and Health
Health is found to have a significant effect on happiness (p <.005) rejecting our
hypothesis of independence. There is a positive association between these two, and the
association is quite strong as indicated by gamma value (.419).
A larger portion of the population (66.2%) with excellent health condition is very happy
as compared to people with other health conditions (Table 5). However, at second level of
happiness, the majority belongs to fair (61.4%) and good (58.3%) health condition than the
excellent health condition. It was also observed that old adults were happier with only very good
health condition as compared with younger age group who were happier with excellent health
condition.
Table 5: Happiness by Self assessed Health Rate
12

8/8/2019 Happiness Mahat
http://slidepdf.com/reader/full/happiness-mahat 13/24
Table 6 below summarizes the correlation between different well being variables.
The highest correlation (.341) exists between employment and income. Interestingly, the
correlation of employment with all other variables including happiness is negative. In most of the
cases, correlation is not strong although they are significant. For instance, employment is
significantly correlated with happiness, however, their association is weak (.078). Relatively
strong correlation (.318) exists between health and happiness given the scaling, which ranges
from 1 to 5 for health and 1 to 4 for happiness.
Happiness Self Assessed Health Condition Total
Poor Fair Good Very good Excellent
Very Unhappy 6.5(9.0 %)
19.6(1.9%)
54.0(.6 %)
70.2(.3%)
50.7(.2%)
201.1(.8 %)
Somewhat unhappy 31.6(20.7%)
95.0(9.9%)
261.4(4.3%)
339.8(2.1%)
245.3(1.6%)
973.0(3.9%)
Somewhat happy 374.9
(50.2%)
1128.1
(61.4%)
3103.8
(58.3%)
4034.1
(44.1%)
2912.8
(32.0%)
11553
(46.8%)
Very happy 389.0(20.1%)
1170.3(26.7%
3219.8(36.7%)
4185.0(53.5%)
3021.0(66.2%)
11985.0(48.5%)
Total 802
100 %
2413
(100%)
6639
100 %
8629
100 %
6229
100 %
24712
100%
Gamma (value).419
(Std.Error).008
(Approx.T)49.052
(sig.).000
13

8/8/2019 Happiness Mahat
http://slidepdf.com/reader/full/happiness-mahat 14/24
Table 6: Correlation between Different Variables
**Correlation is significant at the 0.01 level (2-tailed).
Analyzing the well being factors that affected happiness proved a statistical significance
of each independent variables, which rejects our hypothesis of independence. However, none of
these indicators reflected that happiness was attained to the highest level with the highest level of
achievement implying the low strength of association.
6.2 Happiness as State of Contentment
HHs
income Healthy Happiness EmploymentHHs income Pearson Correlation 1 .269(**) .170(**) -.341(**)
Sig. (2-tailed) .000 .000 .000
N 19008 18991 18906 19003
Healthy Pearson Correlation .269(**) 1 .318(**) -.282(**)
Sig. (2-tailed) .000 .000 .000
N 18991 24911 24712 24895
Sig. (2-tailed) .000 .000 .000 .000N 18887 24000 23850 24014
Happiness Pearson Correlation .170(**) .318(**) 1 -.078(**)
Sig. (2-tailed) .000 .000 .000
N 18906 24712 24741 24726
Employment Pearson Correlation -.341(**) -.282(**) -.078(**) 1
Sig. (2-tailed) .000 .000 .000N 19003 24895 24726 24935
Sig. (2-tailed) .000 .201 .000 .000
N 18992 24872 24703 24893
14

8/8/2019 Happiness Mahat
http://slidepdf.com/reader/full/happiness-mahat 15/24
6.2.1 Satisfaction with health, job, finances and overall life
Happiness is analyzed on the basis of satisfaction in different aspects. Although
satisfaction is measured in ordinal scale (ranges from 1 to 5), multiple regression method is used
in order to see the relative effect of each satisfaction variables on happiness controlling for
others. Satisfaction in each aspect (job, finance, health, whole life) is found to have a significant
partial effect on happiness controlling for the rest as indicated by t test and their corresponding p
values (P<.005).
Table 7: Happiness by Satisfaction in Job, Finances, Health and Whole life
VariablesUn standardized
CoefficientsStandardizedCoefficients t Sig.
B Std. Error Beta(Constant) 1.599 .021 76.682 .000satisfaction with health .076 .005 .101 15.675 .000
satisfaction with your job and activity
.063 .005 .092 13.812 .000
satisfaction withfinances
.045 .004 .065 10.065 .000
satisfaction as a whole .305 .006 .377 53.161 .000
a Dependent Variable: happiness
Each of satisfaction variables is found to be positively associated with happiness. For
instance, happiness increases by .305 for every unit increase in life satisfaction as a whole and
the association between these two is relatively strong (.377), which ranges up to .065 at lowest.
6.2.2. Happiness and Social Support
Social support is measured in terms of belongingness, and number of closed friends and relatives
and trusted neighbors and the support for each other. Happiness has a strong dependency on
sense of belongingness as indicated by Gamma test and its p value (<.005) and the association
between these two is moderate (.340).
15

8/8/2019 Happiness Mahat
http://slidepdf.com/reader/full/happiness-mahat 16/24
A larger portion of people with strong sense of belongingness (65.5%) is very happy as
compared to somewhat strong sense of belongingness (49.5%) and the rest (Table 8). However,
at second level of happiness, a majority are affiliated with somewhat weak (57.2%) and very
weak (53.4%) sense of belongingness than the people with strong and very strong sense of
belongingness.
Table 8: Happiness by Sense of Belonging to Local Community
Happiness Sense of Belongingness Total
Very
weak
Somewhat
weak
Somewhat
strong
Very
strong
Very Happy16.9
(3.7%)42.2
(.8%)97.4
(.4%)39.5
(.6%)196.0(.8%)
Somewhat unhappy 81.9(11.1%)
204.1(5.5%)
471.0(2.7%)
191.0(2.0%)
948.0(3.9%)
Somewhat happy 977.7(53.4%)
2436.5(57.2%)
5623.8(47.0%)
2281.1(31.8%)
11319.0(46.7%)
Very happy 1018.5(31.8%)
2538.3(36.5%)
5858.8(49.9%)
2376.4(65.5%)
11792.0(48.6%)
Total2095.0(100%)
5221.0(100%)
12051.0(100%)
4888.0(100.0%)
24255.0(100.0%)
Gamma (Value).340
(Std. error)(.009)
(Approx. T)35.655
(Sig.).000
16

8/8/2019 Happiness Mahat
http://slidepdf.com/reader/full/happiness-mahat 17/24
Social support is further analyzed using multiple regression method including number of
independent variables such as number of friends and relatives, and number of trusted
neighborhood. Each of these variables has a significant partial effect on happiness controlling for
the rest as indicated by t test and corresponding p values (<.005). While each of them has
positive association with happiness, the association is still weak (Table 9). For instance, every
increase in number of close relatives, happiness increases by .063 and the association between
these two is .121 and ranges up to .048 at lowest.
Table 9: Happiness by Friends, Relatives, and Neighborhood
VariablesUn standardized
CoefficientsStandardizedCoefficients t Sig.
B Std. Error Beta(Constant) 2.880 .017 164.681 .000How many relatives do youhave who you feel close to?
.063 .004 .121 17.600 .000
How many close friends doyou have?
.049 .004 .086 12.463 .000
No. of Neighborhoodtrusted
.053 .004 .085 12.836 .000
a Dependent Variable: happiness
• Emotional Support
Emotional support both for receiving and providing is found to have a significant effect
(p<.005) on happiness regardless of gender (Table 10). While receiving emotional support has a
negative association with happiness, providing the support has a positive association with the
same. It is interesting to learn that people feel happier when they can provide the emotional
support unlike when they receive it, as happiness decreases by .078 for those who receive
emotional support. Support provided and received in other ways is highly insignificant regardless
of the gender, and gender is still significant regardless of any kind of support.
17

8/8/2019 Happiness Mahat
http://slidepdf.com/reader/full/happiness-mahat 18/24
Table 10: Happiness by Emotional and Other Support
VariablesUn standardized
CoefficientsStandardizedCoefficients t Sig.
B Std. Error Beta(Constant) 3.417 .007 479.790 .000received help by emotionalsupport
-.078 .009 -.063 -8.695 .000
received help by other way -.007 .015 -.003 -.484 .629
gave help by emotionalsupport
.066 .009 .054 7.389 .000
gave help by other way .001 .012 .000 .059 .953sex .016 .008 .013 2.045 .041
a Dependent Variable: happiness
The association between happiness and all kind of support is weak, which ranges from .
000 to .063, although all of these variables collectively have a significant effect on happiness as
indicated by F test and its corresponding p value (<.005).
As in case of well being variables, variables relating to state of contentment are found to
have a significant effect on happiness that supports our hypothesis.
7. Conclusion
• Problems
Although well being and contentment variables revealed a statistical significance on pursuing
happiness, direction of causality was not clearly identified in many cases. For instance, causality
was not explicit in case of employment as happiness was found to be increased with unemployed
groups than with paid and self employed groups. The reasons for such outcomes (happiness
associated with unemployed and not in labor force) could be attributed to the social security
system that helps to achieve certain level of wellbeing to majority of the poor in the country.
However, this type of happiness counts only the objective indicators, while disregarding many
other intangible variables that go beyond their living conditions. For instance, majority of people
with disabilities in Canada have lived the worst lives even with good living conditions under the
18

8/8/2019 Happiness Mahat
http://slidepdf.com/reader/full/happiness-mahat 19/24
government support system in absence of social support, which might have more positive impact
on their living (personal observation, 2006). On the other hand, those who are unemployed may
have enjoyed better family lives with spouse income and thus feel happier, however, is less
likely for the majority.
Similarly, while income has a significant effect on happiness, but happiness was declined
once reaching to a threshold of high income as people from medium and high income group were
happier as compared to very high income group at second level of happiness. This is in line with
inferences drawn by other scholars in the past. The similar patterns were observed with other
wellbeing variables. Such outcome suggests that happiness can not be achieved merely by the
accomplishment of the wellbeing. Although, all these variables were found to be significant in
determining happiness regardless of control variables such as gender and age none of them
indicated a strong association except in case of health. Moreover, given the large sample size of
the survey, statistical significance alone reveals a little validity of the observations under study.
In any case, these findings would have been more meaningful, if they were supported by
some qualitative analysis. For instance, when using gender as a control variable, it is particularly
significant to study the power relations especially among low income households that determine
their access and control over income and other resources, which has a large impact on their well
being. Similarly, the dependency of old aged parents to their children for accessing their income
will have a significant effect on their level of happiness. Age can also have a significant effect on
their health condition affecting their level of happiness.
Similar to the well being variables, causality was not clearly depicted with contentment
variables as well. For instance, people with very strong sense of belongingness were less happy
than those with only strong sense of belongingness. While, satisfaction (finance, health, job and
19
8/8/2019 Happiness Mahat
http://slidepdf.com/reader/full/happiness-mahat 20/24
whole), sense of belongingness, social support (number of friends and relatives, trusted
neighbors), and emotional support in both ways revealed a statistical significance in determining
happiness, none of the association was strong except in case of life satisfaction as a whole.
Perhaps such outcomes could be linked with the problems in measurement process as the survey
methods are less valid in measuring satisfaction and interpersonal relationships as compared to
the observational studies.
Most importantly, the qualitative factors such as gender relations, social norms, aging factors,
and indigenous wisdom were not included in the analysis, which has limited the practical validity
of the above findings as indicated earlier. Given the existing social mechanism of capitalist
society, women are bearing the larger cost of social reproduction, which largely affects their
positions in labor market and thereby their state of contentment. For instance, more than 80 % of
women in North America choose the job and career that accommodate the demands of domestic
labor (Jacobs, 2004). Indigenous wisdom and knowledge are more than the degree that comes
from formal institutions and thus important to be considered while analyzing people’s
perceptions. Especially, personal relationships are strongly based on wisdom factors than the
formal education, which determines people’s attitude and their ways of thinking to impact
positively on everyone’s lives.
• Strategies
Happiness is more about building personal strength through development of positive
psychology, which enables people to live fulfilling lives even in less agreeable situations, as life
conditions are not always agreeable (Hirata, 2005). It is thus critical to focus on GNH approach
based on comprehensive development, which ultimately helps to build personal strength, ethos
20
8/8/2019 Happiness Mahat
http://slidepdf.com/reader/full/happiness-mahat 21/24
and values that are most important. Especially in the West, development approaches are
explicitly concerned with improvement in system and living conditions and not with living.
Unfortunately, personal attitude, values and inner strength are higher to the system that allows
people to sustain their happiness beyond well being.
Indigenous wisdom has proved to be very significant in pursuing happiness that teaches
human beings to live in harmony, peace, unity and security (Bracho, 2005; Lini, 2000). Such
wisdom leads to build human technologies that are linked to natural law of society, spiritual
beliefs, creation of stories, cultural values, and personal and social relationships. These human
technologies can have a significant role especially in North American society, where well beings
are exclusively linked with level of consumption and system of production and exchange.
A critical condition for happiness is to abandon the fear of not having enough (most often at
the expense of others), which is sheltered within the materialism. Instead, an emphasis should be
on sustainable happiness through one’s perceptions to impact on one’s own and other’s lives. In
this sense, wisdom and compassion together transforms human brain to the spirit enabling them
to attain the maximum level of happiness.
Happiness bridges the gap between well being and satisfaction as two sides of same coin.
People’s physical and mental well being is affected by their sense of belongingness, and the love
and compassion they can share among each other. Wellbeing is deeply rooted on people’s
choices to perceive, realize and act towards their own values and judgments that energize their
instincts towards the overall happiness.
8. Scope for Further Research
21

8/8/2019 Happiness Mahat
http://slidepdf.com/reader/full/happiness-mahat 22/24
As indicated earlier, the general social survey has its limitations in many aspects in
measuring the well being and satisfaction variables. In order to have more accuracy on
estimating people’s happiness with a good measurement process, the qualitative analysis
becomes highly significant apart from the quantitative measurements. It is thus desirable to focus
on ethnographic studies on some qualitative aspects such as measuring satisfaction and
interpersonal relationships. For instance, power relations, sense of belongingness and satisfaction
are hardly quantifiable. In such cases, it is particularly important to document the process than to
depict an outcome for ensuring high validity of the measurement. For instance, measuring
belongingness with ordinal scales provide options to say strong or weak but do not reflect the
real circumstances of participants, on which they feel how it is strong or weak, which is most
critical. In addition the survey responses on such issues could largely be influenced by the social
desirability bias. The supplementary information obtained through ethnographic studies adds
strength to the survey information for deepening the analysis, on which the validity is based upon
for this kind of research.
References
Argyle, M. (2001) The Psychology of Happiness, Taylor and Francis Inc. New York.
Barrow, R. (1980) Happiness, Martin Robertson, Oxford.
Belliotti, A.R. (2004) Happiness is Overrated, Rowman and Littlefield Publishers Inc.
Bracho, F. (2005) ‘Happiness and Indigenous Wisdom in the History of the Americas’,
Proceedings of 2nd International Conference on Gross national Happiness,
Rethinking Development , Local Pathways to Global Wellbeing, St. Francis Xavier
University, Antigonish, Nova Scotia, Canada http://www.gpiatlantic.org/conference/program.htm
Brien, C. (2005) ‘Planning for Sustainable Happiness: Harmonizing Our Internal and External
22

8/8/2019 Happiness Mahat
http://slidepdf.com/reader/full/happiness-mahat 23/24
Landscapes’ Proceedings of 2nd International Conference on Gross national Happiness,
Rethinking Development , Local Pathways to Global Wellbeing, St. Francis Xavier University,
Antigonish, Nova Scotia, Canada.
Bruni L. and Porta L. (2005) Economic and Happiness: Framing the Analysis, Oxford University Press.
Frey, S.B and Stutzer, A. (2002) Happiness and Economics, Princeton University
Press, Oxford.
Galay, K. (2001) ‘Bhutanese Context of Civil Society’ Journal of Bhutan Studies, 3(1),
199-218.
Graham, C. and Pettinato, S. (2002) Happiness and Hardship: Opportunity and Insecurity in New Market Economics, Brookings Institution Press, Washington.
Helliwell, F.J. (2005) ‘Well-Being, Social Capital and Public Policy: What’s New? Proceedings
of 2nd International Conference on Gross national Happiness: Rethinking Development ,
Local Pathways to Global Wellbeing, St. Francis Xavier University, Antigonish, Nova Scotia,
Canada.
Hirata, J. (2005) ‘How Should Happiness Guide Policy? Why Gross National Happiness is not
opposed to Democracy’ Proceedings of 2nd International Conference on Gross national
Happiness: Rethinking Development , Local Pathways to Global Wellbeing, St. Francis Xavier
University, Antigonish, Nova Scotia, Canada.
Jacobs, A.L. (2004) Pursuing Equal Opportunities: The Theory and Practice of
Egalitarian Justice , Cambridge University Press
Lini, H. (2000) ‘Appropriate Education to meet Human Security Needs of the 21st Century’
Proceedings of International Conference on Poverty Prosperity and Progress, Victoria
University of Wellington, Aotearoa, New Zealand.
http://www.devnet.org.nz/conf/Papers/lini.pdf
Layard, R. (2005) Happiness lessons from New Science, The Penguin press, New York
23

8/8/2019 Happiness Mahat
http://slidepdf.com/reader/full/happiness-mahat 24/24
Prakke, D. (2005) ‘The ‘Buddhist Truth of Happiness: Spirituality and Development – the case
of governance in Bhutan’, Proceedings of 2nd International Conference on Gross national
Happiness: Rethinking Development , Local Pathways to Global Wellbeing, St. Francis
Xavier University, Antigonish, Nova Scotia, Canada.
Russell, B. (1975) The Conquest of Happiness, Allen and Unwin, London.
Sen, A. K . (1983) ‘Rational Fools: A Critique of the Behavioural Foundations of
Economic Theory’, In A. K. Sen (Ed.), Choice, Welfare and Measurement .
Oxford: Basil Blackwell Publisher, pp. 84-106.
Sen, A.K. (1999) Development as Freedom, Oxford, University press. UK.
Sen, A.K. (1992) Inequalities Reexamined , Harvard University Press, Cambridge Masschuttees.
Spaemann, R. (2000) Happiness and Benevolence, University of Notre Dame Pres, London
Tideman, G.S. (2005) ‘Mind Over Matter : Towards a New Paradigm for Business and Economics’
Proceedings of 2nd International Conference on Gross national Happiness: Rethinking
Development , Local Pathways to Global Wellbeing, St. Francis Xavier University, Antigonish,
Nova Scotia, Canada.