HANOVER-HORTON SCHOOL DISTRICT - michigan.gov · 2002 Debt ... perform the audit to obtain...
68
HANOVER-HORTON SCHOOL DISTRICT FINANCIAL STATEMENTS JUNE 30, 2007 KARL L. DRAKE CERTIFIED PUBLIC ACCOUNTANT
Transcript of HANOVER-HORTON SCHOOL DISTRICT - michigan.gov · 2002 Debt ... perform the audit to obtain...

HANOVER-HORTON
SCHOOL DISTRICT
FINANCIAL STATEMENTS
JUNE 30, 2007
KARL L. DRAKE
CERTIFIED PUBLIC ACCOUNTANT

Board of Education Kathie Michel President Brian Brockie Vice President Chris Vincent Secretary Leon Densmore Treasurer Chris Murphy Board Member Kirk Mercer Board Member Joseph Childs Board Member
Management Linda Brian Superintendent Andrienne Spencer Business Manager Karl L. Drake, PC Auditor Thrun Law Firm, P.C. Attorney Rosenfeld, Grover, and Frang, P.C. Attorney
HANOVER-HORTON SCHOOL DISTRICT
LIST OF PRINCIPAL INDIVIDUALS
JUNE 30, 2007
Karl L. Drake, P.C.

HANOVER–HORTON SCHOOL DISTRICT
TABLE OF CONTENTS
PAGE
INDEPENDENT AUDITOR’S REPORT ………………………………………....….…………...... 1-2 MANAGEMENT’S DISCUSSION AND ANALYSIS…………………………………………….... 3-10 BASIC FINANCIAL STATEMENTS
District-Wide Financial Statements
Statement of Net Assets………………………………………………………………………….. 11
Statement of Activities…………………………………………………………………….……... 12
Fund Financial Statements
Balance Sheet - Governmental Funds………………………………………………………….… 13
Statement of Revenue, Expenditures and Changes in Fund Balance - Governmental Funds…….. 14
Reconciliation of the Statement of Revenue, Expenditures and Changes in Fund Balances of Governmental Funds to the Statement of Activities…………………………... 15
Fiduciary Fund
Statement of Fiduciary Net Assets……………………………………………………………….. 16
Notes to Financial Statements……………………………………………………………………… 17-28
REQUIRED SUPPLEMENTAL INFORMATION
Budgetary Comparison Schedule - General Fund……………………………………….………….. 30Budgetary Comparison Schedule - Debt Funds………………………………………………….…. 31
OTHER SUPPLEMENTAL INFORMATION
GENERAL FUND
Statement of Revenue, Expenditures and Changes in Fund Balance - Budget and Actual....…………………………………........….…………………..…….…...... 34-36
SPECIAL REVENUE FUNDS
Combining Balance Sheet.......…………………………...…………...........……………………...... 38
Combining Statement of Revenue, Expenditures and Changes in Fund Balances - Budget and Actual.……………………………………………………...………...………...... 39-40

PAGE
DEBT RETIREMENT FUNDS
Combining Balance Sheet.........................…………………………………………..….… 42
Statement of Revenue, Expenditures and Changes in Fund Balances - Budget and Actual.………………..……………………………………….………... 43-44
CAPITAL PROJECT FUND
Balance Sheet…………………………………….…………………………………...….. 46
Statement of Revenue, Expenditures and Changes in Fund Balance - Budget and Actual.…………………………………………………...…………...... 47
AGENCY FUNDS
Statement of Assets and Liabilities............……………………………………………….. 49
Statement of Changes in Assets and Liabilities....................……............……...…………. 50
Detailed Statement of Changes in Assets and Liabilities....................……............………..………... 51-53 STATEMENTS OF INDEBTEDNESS
Bus Loans……………………………………………………………………………….… 55
Durant Debt……………………………………………………………………………….. 55
1999 Debt…………………………………………………………………………………. 56
2002 Debt…………………………………………………………………………………. 57 REPORT ON INTERNAL CONTROL OVER FINANCIAL REPORTING AND ON COMPLIANCE AND OTHER MATTERS BASED ON AN AUDIT OF FINANCIAL STATEMENTS PERFORMED IN ACCORDANCE WITH GOVERNMENT AUDITING STANDARDS..............….………………………………………………………………...... 58-59
Karl L. Drake, P.C.

INDEPENDENT AUDITOR’S REPORT Board of Education Hanover-Horton School District Horton, Michigan 49246 We have audited the accompanying financial statements of the governmental activities, each major fund, and the aggregate remaining fund information of Hanover-Horton School District, as of and for the year ended June 30, 2007, which collectively comprise the School District’s basic financial statements as listed in the table of contents. These financial statements are the responsibility of Hanover-Horton School District’s management. Our responsibility is to express opinions on these financial statements based on our audit.
We conducted our audit in accordance with United States generally accepted auditing standards and the standards applicable to financial audits contained in Government Auditing Standards, issued by the Comptroller General of the United States. Those standards require that we plan and perform the audit to obtain reasonable assurance about whether the financial statements are free of material misstatement. An audit includes examining, on a test basis, evidence supporting the amounts and disclosures in the financial statements. An audit also includes assessing the accounting principles used and significant estimates made by management, as well as evaluating the overall financial statement presentation. We believe that our audit provides a reasonable basis for our opinions.
In our opinion, the financial statements referred to above present fairly, in all material respects, the respective financial position of the governmental activities, each major fund, and the aggregate remaining fund information of Hanover-Horton School District as of June 30, 2007, and the respective changes in financial position, thereof for the year then ended in conformity with United States generally accepted accounting principles.
The administration’s discussion and analysis and budgetary comparison information on pages 3 through 10 and 29-31 is not a required part of the basic financial statements but is supplemental information required by the Governmental Accounting Standards Board. We have applied certain limited procedures, which consisted principally of inquiries of management regarding the methods of measurement and presentation of the required supplemental information. However, we did not audit the information and express no opinion on it.
-1-
Karl L. Drake, P.C. Certified Public Accountant 3775 Kimmel Road (517) 937-9333 Phone / 563-2552 FaxHorton, Michigan 49246 Email: [email protected]
Karl L. Drake, P.C.

Board of Education Hanover-Horton School District In accordance with Government Auditing Standards, we have also issued our report dated September 24, 2007 on our consideration of Hanover-Horton School District’s internal control over financial reporting and out tests of its compliance with certain provisions of laws, regulations, contracts, and grants. Our audit was made for the purpose of forming an opinion on the general purpose financial statements taken as a whole. The combining and individual fund financial statements, and statistical data, listed in the table of contents are presented for purposes of additional analysis and are not a required part of the general purpose financial statements of the Hanover-Horton School District. Such information has been subjected to the auditing procedures applied in the audit of the general purpose financial statements, and in our opinion, the information is fairly stated in all material respects in relation to the general purpose financial statements taken as a whole.
Karl L. Drake, P.C. Certified Public Accountant September 24, 2007
-2-
Karl L. Drake, P.C.

HANOVER–HORTON SCHOOL DISTRICT
This section of Hanover-Horton School District’s annual financial report presents discussion and analysis of the School District’s financial performance during the year ended June 30, 2007. It is best read in conjunction with the School District’s financial statements, which immediately follow this section. Using This Annual Report
This annual report consists of a series of financial statements and notes to those statements. These statements are organized so the reader can understand Hanover–Horton School District financially as a whole. The District-Wide Financial Statements provide information about the activities of the entire School District, presenting both an aggregate view of the School District’s finances and a longer-term view of those finances. The fund financial statements provide the next level of detail. For governmental activities, these statements tell how services were financed in the short-term as well as what remains for future spending. The fund financial statements look at the School District’s operations in more detail than the district-wide financial statements by providing information about the School District’s most significant funds - the General Fund and Debt Funds, with all other funds presented in one column as non-major funds. The remaining statement, the statement of fiduciary net assets, presents financial information about activities for which the School District acts solely as an agent for the benefit of students and parents.
Management’s Discussion and Analysis (MD&A) (Required Supplemental Information)
Basic Financial Statements
District-Wide Financial Statements Fund Financial Statements
Notes to the Basic Financial Statements
Budgetary Information for the General Fund and Debt Funds (Required Supplemental Information)
Other Supplemental Information
Reporting The School District As A Whole - District-Wide Financial Statements
One of the most important questions asked about the School District is, “As a whole, what is the School District’s financial condition as a result of the year’s activities?” The statement of net assets and the statement of activities, which appear first in the School District’s financial statements, report information on the School District as a whole and its activities in a way that helps answer this question. These statements are prepared to include all assets and liabilities, using the accrual basis of accounting, which is similar to the accounting used by most private-sector companies. All of the current year’s revenue and expenses are taken into account regardless of when cash is received or paid.
Management’s Discussion and Analysis
-3-

These two statements report the School District’s net assets - the difference between assets and liabilities, as reported in the statement of net assets - as one way to measure the School District’s financial health or financial position. Over time, increases or decreases in the School District’s net assets - as reported in the statement of activities - are indicators of whether its financial health is improving or deteriorating. The relationship between revenues and expenses is the School District’s operating results. However, the School District’s goal is to provide services to our students, not to generate profits as commercial entities do. One must consider many other non-financial factors, such as the quality of the education provided and the safety of the schools, to assess the overall health of the School District. The statement of net assets and statement of activities report the governmental activities for the School District, which encompass all of the School District’s services, including instruction, supporting services, community services, athletics, and food services. Property taxes, unrestricted State Aid (foundation allowance revenue), and State and federal grants finance most of these activities. Reporting The School District’s Most Significant Funds - Fund Financial Statements
The School District’s fund financial statements provide detailed information about the most significant funds - not the School District as a whole. Some funds are required to be established by State law and by bond covenants. However, the School District establishes funds as needed to help it control and manage money for particular purposes or to show that it’s meeting legal responsibilities for using certain taxes, grants, and other money. The governmental funds of the School District use the following accounting approach:
Governmental Funds - All of the School District’s services are reported in governmental funds. Governmental fund reporting focuses on showing money inflows and outflow and the balances remaining at year end that are available for spending. They are reported using an accounting method called modified accrual accounting, which measures cash and all other financial assets that can readily be converted to cash. The governmental fund statements provide a detailed short-term view of the operations of the School District and the services it provides. Governmental fund information helps you determine whether there are more or fewer financial resources that can be spent in the near future to finance the School District’s programs. The relationship (or differences) between governmental activities (reported in the statement of net assets and the statement of activities) and governmental funds is described in a reconciliation.
-4-
Karl L. Drake, P.C.
HANOVER-HORTON SCHOOL DISTRICT
Reporting The School District’s Fiduciary Responsibilities - The School District As Trustee
The School District is the trustee, or fiduciary, for its student activity funds. All of the School District’s fiduciary activities are reported in separate statements of fiduciary net assets. These activities are excluded from the School District’s other financial statements because the School District cannot use these assets to finance its operations. The School District is responsible for ensuring that the assets reported in these funds are used for their intended purposes. The School District As A Whole
Recall that the statement of net assets provides the perspective of the School District as a whole. Table I provides a summary of the School District’s net assets as of June 30, 2007 and 2006:
TABLE 1
Governmental Activities
(In Millions)
ASSETS 2007 2006
Current and other assets $ 3.0 $ 3.2 Capital assets - Net of accumulated depreciation 9.6 9.9
TOTAL ASSETS 12.6 13.1 LIABILITIES
Current liabilities 1.7 1.7 Long-term liabilities 7.2 7.7
TOTAL LIABILITIES 8.9 9.4 NET ASSETS
Invested in property and equipment - Net of related debt 1.8 1.6 Restricted 0.2 0.2 Unrestricted 1.7 1.9
TOTAL NET ASSETS $ 3.7 $ 3.7
Management’s Discussion and Analysis
-5-

The above analysis focuses on the net assets (see Table 1). The change in net assets (see Table 2) of the School District’s governmental activities is discussed below. The School District’s net assets were $3.7 million at June 30, 2007. Capital assets, net of related debt totaling $1.8 million compares the original cost, less depreciation of the School District’s capital assets to long-term debt, including accrued interest on capital appreciation bonds, used to finance the acquisition of those assets. Most of the debt will be repaid from voter-approved property taxes collected as the debt service comes due. Restricted net assets are reported separately to show legal constraints from debt covenants and enabling legislation that limit the School District’s ability to use those net assets for day-to-day operations. The remaining amount of net assets ($1.7 million) was unrestricted. The $1.7 million in unrestricted net assets of governmental activities represents the accumulated results of all past years’ operations. The operating results of the General Fund will have a significant impact on the change in unrestricted net assets from year to year. The results of this year’s operations for the School District as a whole are reported in the statement of activities (see Table 2), which shows the changes in net assets for fiscal year 2007 and 2006.
TABLE 2
Governmental Activities
(In Millions)
REVENUE 2007 2006
Program Revenue Charges for services $ 0.7 $ 0.7 Grants and categoricals 0.7 0.5
General Revenue Property taxes 1.7 1.7 State foundation allowance 8.6 8.7 Other 0.2 0.2
TOTAL REVENUE $ 11.9 $ 11.8
-6-
Karl L. Drake, P.C.
HANOVER-HORTON SCHOOL DISTRICT Management’s Discussion and Analysis
FUNCTION/PROGRAM EXPENSES (In Millions)
2007
2006 Instruction $ 6.6 $ 6.5 Support Services 3.7 3.6 Food Services 0.5 0.5 Athletics 0.3 0.3 Interest on Long-Term Debt 0.4 0.4 Depreciation (unallocated) 0.5 0.5
TOTAL FUNCTION/PROGRAM EXPENSES 12.0 11.8
INCREASE <DECREASE> IN NET ASSETS $ -0.1 $ 0.0
The School District experienced a decrease in net assets of approximately $50 thousand. Key reasons for the change in net assets were limited state aid revenue increases, rising costs for fuel and energy, and surcharges for transportation of supplies and materials. The decrease in net assets differs from the change in fund balance and a reconciliation appears on page 15. The net cost shows the financial burden that was placed on the State and the School District’s taxpayers by each of these functions. Since property taxes for operations and unrestricted State aid constitute the vast majority of School District operating revenue sources, the Board of Education and administration must annually evaluate the needs of the School District and balance those needs with State-prescribed available unrestricted resources. The School District’s Funds As noted earlier, the School District uses funds to help it control and manage money for certain purposes. Looking at funds helps the reader consider whether the School District is being accountable for the resources taxpayers and others provide to it and may provide more insight into the School District’s overall financial health.
-7-

As the School District completed this year, the governmental funds reported a combined fund balance of $1.9 million, which is a decrease of $0.2 million from last year. The primary reason for the decrease is increasing fringe benefit expenditures. The General Fund, the principal operating fund, saw fund balance decrease $158,855 to $1,609,286, which is less than the budgeted decrease of $379,069.
• Special Revenue Funds remained stable from the prior year, showing a net increase of approximately $10,257.
• Combined, the Debt Service Funds showed a fund balance decrease of $10,020. Millage
rates are determined annually to ensure that the School District accumulates sufficient resources to pay annual bond issue-related debt service. Fund Balances in the Debt Service Funds are reserved since they can only be used to pay debt service obligations.
General Fund Budgetary Highlights Over the course of the year, the School District amends its budget as it attempts to deal with changes in revenues and expenditures. State law requires that the budget be amended to ensure that expenditures do not exceed appropriations. A schedule showing the School District’s original and final budget amounts compared with amounts actually paid and received is provided in required supplemental information of these financial statements. General Fund Budgetary Highlights To avoid an additional drop in the fund balance, the School District has made significant cuts in staffing levels. Increases in fringe benefit costs, as well as rising costs in energy and transportation continue to negatively impact the School District’s budget.
-8-
Karl L. Drake, P.C.
HANOVER-HORTON SCHOOL DISTRICT
Capital Asset And Debt Administration
Capital Asset
At June 30, 2007, the School District had $9.5 million invested in a broad range of capital assets, including land, buildings, furniture, and equipment. This amount represents a net decrease (including additions and disposals) of approximately $331,335 or 3 percent, from last year.
2007 2006
Land and Improvements $ 2,019,727 $ 2,019,727 Buildings and Improvements 11,875,334 11,799,618 Buses and Other Vehicles 804,892 794,559 Furniture and Equipment 766,170 772,670
Total Capital Assets 15,466,123 15,386,574
Less Accumulated Depreciation 5,906,030 5,495,146
Net Capital Assets $ 9,560,093 $ 9,891,428
The additions for this year included completing the new library addition and a new bus. New debt of $30,000 was issued for these additions. Debt
At the end of this year, the School District had $7.7 million in bonds and loans outstanding versus $8.2 million in the previous year - a decrease of 6 percent. Debt consisted of the following:
2007 2006
General Obligation Bonds $ 7,678,211 $ 8,193,211 Bus Loans 40,869 31,731
$ 7,719,080 $ 8,224,942
The School District’s General Obligation Bond rating continues to be equivalent to the State’s credit rating. The State limits the amount of general obligation debt that schools can issue to 15 percent of the assessed value of all taxable property within the School District’s boundaries. If the School District issues “qualified debt,” i.e., debt backed by the State of Michigan, such obligations are not subject to this debt limit. The School District’s outstanding unqualified general obligation debt of $7.7 million is significantly below the statutorily imposed limit.
Management’s Discussion and Analysis
-9-

Economic Factors And Next Year’s Budgets And Rates
The elected officials and administration considered many factors when setting the School District’s 2007-08 fiscal year budget. One of the most important factors affecting the budget is the student count. The State foundation revenue is determined by multiplying the blended student count (using the two separate count days) times the per student foundation allocation. The blended count for the 2007-08 school year is 25 percent of the count from February 2007, and 75 percent of the count from September 2007. The 2007-08 fiscal year budget was based on an estimate of students that will be enrolled in September 2007. Approximately 75 percent to 80 percent of total General Fund revenues are from the foundation allowance. Under State law, the School District cannot access additional property tax revenue for general operations. As a result, district funding is heavily dependent on the State’s ability to fund local school operations. Based on early enrollment data at the end of the 2007-2008 school year, we anticipate that the fall student count will decrease by an additional 7 students from the spring 2007 student count. This is a reduction of 21 students from the fall of 2006. Once the final student count and related per pupil funding is validated, State law requires the School District to amend the budget as actual district resources are not sufficient to fund original appropriations. Because the School District’s revenue is heavily dependent on State funding and the health of the State’s School Aid Fund, the actual revenue received depends on the State’s ability to collect revenue to fund its appropriation to school districts. The State periodically holds a revenue consensus conference to estimate revenues. Based on the results of the most recent conference, the State estimates funds are sufficient to fund the appropriation. Contacting The School District’s Financial Management This financial report is designed to provide the School District’s citizens, taxpayers, customers, investors and creditors of the Hanover-Horton School District with a general overview of the School District’s finances and to demonstrate the School District’s accountability for the money it receives. If you have questions about this report or need additional financial information, contact the Business Manager, 237 Farview Street, Horton, Michigan 49246.
-10-
Karl L. Drake, P.C.
HANOVER-HORTON SCHOOL DISTRICT
Governmental Activities
ASSETS 2007 2006
Current Assets
Cash and Cash Equivalents $ 1,437,989 $ 1,560,346 Due From Other Governmental Units 1,537,652 1,603,201 Accounts Receivable 9,252 10,146 Inventories 4,855 3,471 Prepaid Expenditures 352 6,496
Total Current Assets 2,990,100 3,183,660
Non-Current Assets
Capital Assets 15,466,123 15,386,574 Less: Accumulated Depreciation -5,906,030 -5,495,146
Total Non-Current Assets 9,560,093 9,891,428
TOTAL ASSETS $ 12,550,193 $ 13,075,088
LIABILITIES AND NET ASSETS
Current Liabilities
Accounts Payable $ 4,946 $ 6,919 Accrued Salaries and Expenses 1,067,865 1,067,635 Deferred Revenue 32,919 --- Accrued Interest 55,618 56,359 Bonds and Loans Payable, Due within One Year 565,564 541,207
Total Current Liabilities 1,726,912 1,672,120
Non-Current Liabilities
Bonds Payable 7,138,211 7,672,866 Loans Payable 15,305 10,869
Total Non-Current Liabilities 7,153,516 7,683,735
TOTAL LIABILITIES 8,880,428 9,355,855
NET ASSETS
Invested in Capital Assets, Net of Related Debt 1,785,395 1,610,127 Restricted for Debt Service 129,087 139,107 Restricted for Capital Projects 41,351 107,469 Unrestricted Unrestricted 1,713,932 1,713,932 1,862,530 1,862,530
TOTAL NET ASSETS 3,669,765 3,719,233
TOTAL LIABILITIES AND NET ASSETS $ 12,550,193 $ 13,075,088
District-Wide Financial Statements
STATEMENT OF NET ASSETS
JUNE 30, 2007
See Accompanying Notes to Financial Statements -11-

Program Revenues
Governmental Activities
Expenses
Charges
For Services
Operating
Grants
Net (Expense)
Revenue and Changes in Net Assets
FUNCTIONS/PROGRAMS 2007 2006
Governmental Activities Instruction $ 6,579,987 $ 226,924 $ 415,618 $ -5,937,445 $ -6,032,691Support Services 3,697,172 81,690 70,270 -3,545,212 -3,339,547Food Services 464,959 280,228 190,070 5,339 13,531Athletics 302,665 67,005 --- -235,660 -247,696Community Services 35,430 29,389 --- -6,041 2,967Interest on Long-Term Debt 361,577 --- --- -361,577 -346,033Depreciation (Unallocated) 467,046 --- --- -467,046 -498,926
Total Governmental Activities $ 11,908,836 $ 685,236 $ 675,958 -10,547,642 -10,448,395 General Revenue
Taxes Property Taxes, Levied for General Operations 891,135 806,281Property Taxes, Levied for Debt Service 835,858 891,656State of Michigan Aid, Unrestricted 8,647,725 8,661,001
Interest Earnings 76,542 79,410
Other 46,914 77,403
Total General Revenue 10,498,174 10,515,751 CHANGE IN NET ASSETS -49,468 67,356
NET ASSETS - BEGINNING OF YEAR 3,719,233 3,651,877 NET ASSETS - END OF YEAR $ 3,669,765 $ 3,719,233
STATEMENT OF ACTIVITIES
YEAR ENDED JUNE 30, 2007
See Accompanying Notes to Financial Statements. -12-
Karl L. Drake, P.C.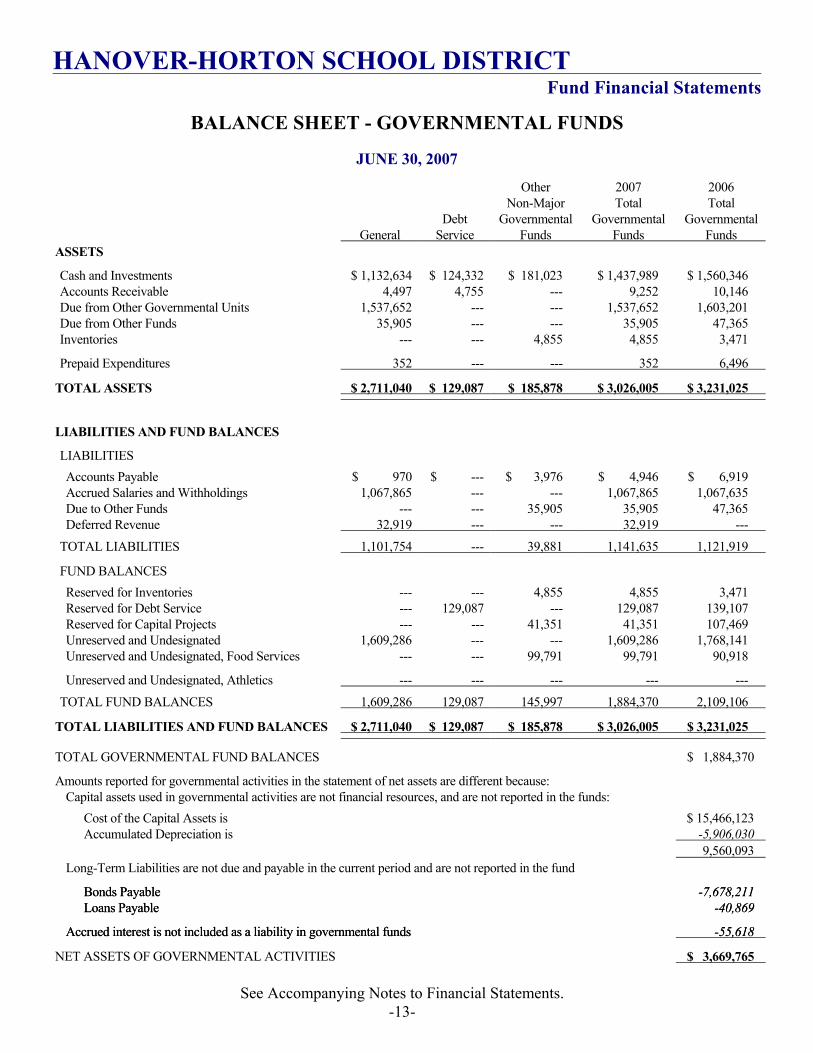
General
Debt Service
Other Non-Major
Governmental Funds
2007 Total
Governmental Funds
2006 Total
Governmental Funds
ASSETS
Cash and Investments $ 1,132,634 $ 124,332 $ 181,023 $ 1,437,989 $ 1,560,346 Accounts Receivable 4,497 4,755 --- 9,252 10,146 Due from Other Governmental Units 1,537,652 --- --- 1,537,652 1,603,201 Due from Other Funds 35,905 --- --- 35,905 47,365 Inventories --- --- 4,855 4,855 3,471
Prepaid Expenditures 352 --- --- 352 6,496
TOTAL ASSETS $ 2,711,040 $ 129,087 $ 185,878 $ 3,026,005 $ 3,231,025
LIABILITIES AND FUND BALANCES
LIABILITIES
Accounts Payable $ 970 $ --- $ 3,976 $ 4,946 $ 6,919 Accrued Salaries and Withholdings 1,067,865 --- --- 1,067,865 1,067,635 Due to Other Funds --- --- 35,905 35,905 47,365 Deferred Revenue 32,919 --- --- 32,919 ---
TOTAL LIABILITIES 1,101,754 --- 39,881 1,141,635 1,121,919
FUND BALANCES
Reserved for Inventories --- --- 4,855 4,855 3,471 Reserved for Debt Service --- 129,087 --- 129,087 139,107 Reserved for Capital Projects --- --- 41,351 41,351 107,469 Unreserved and Undesignated 1,609,286 --- --- 1,609,286 1,768,141 Unreserved and Undesignated, Food Services --- --- 99,791 99,791 90,918
Unreserved and Undesignated, Athletics --- --- --- --- ---
TOTAL FUND BALANCES 1,609,286 129,087 145,997 1,884,370 2,109,106
TOTAL LIABILITIES AND FUND BALANCES $ 2,711,040 $ 129,087 $ 185,878 $ 3,026,005 $ 3,231,025
TOTAL GOVERNMENTAL FUND BALANCES $ 1,884,370
Amounts reported for governmental activities in the statement of net assets are different because: Capital assets used in governmental activities are not financial resources, and are not reported in the funds:
Cost of the Capital Assets is $ 15,466,123 Accumulated Depreciation is -5,906,030 9,560,093
Long-Term Liabilities are not due and payable in the current period and are not reported in the fund
Bonds Payable Bonds Payable -7,678,211 -7,678,211 Loans Payable Loans Payable -40,869 -40,869
Accrued interest is not included as a liability in governmental funds Accrued interest is not included as a liability in governmental funds -55,618 -55,618
NET ASSETS OF GOVERNMENTAL ACTIVITIES $ 3,669,765
See Accompanying Notes to Financial Statements. -13-
HANOVER-HORTON SCHOOL DISTRICT Fund Financial Statements
BALANCE SHEET - GOVERNMENTAL FUNDS
JUNE 30, 2007

General
Debt Service
Other Non-Major
Governmental Funds
2007 Totals
Totals REVENUE
Local Sources $ 863,040 $ 381,208 $ 2,555,144 $ 2,587,982 8,993,785 --- 37,169 9,030,954 8,855,528
Federal Sources 139,828 --- 133,442 273,270 Miscellaneous --- --- --- ---
TOTAL REVENUE 10,444,509 863,040 551,819 11,859,368 11,788,939 EXPENDITURES
Current 6,579,987 --- --- 6,579,987 6,496,357
Supporting Services 3,700,172 --- 763,496 4,463,668 Community Services 35,430 --- --- 35,430 33,461
Debt Service 20,862 --- 893,922 1,014,978 Capital Outlay --- 79,844 141,097 967,352
TOTAL EXPENDITURES 873,060 843,340 12,114,104 12,824,016
EXCESS OF REVENUE OVER <UNDER> EXPENDITURES
46,805
-291,521
-254,736
OTHER FINANCING SOURCES <USES>
2006
$ 1,310,896 State Sources
345,429 ---
Instruction
4,311,868
873,060 61,253
10,397,704
-10,020 -1,035,077
Loan Proceeds 30,000 --- --- 30,000 --- Operating Transfers In --- --- 235,660 235,660 247,696
-235,660 Operating Transfers Out --- --- -235,660 -247,696
TOTAL OTHER FINANCING SOURCES <USES>
-205,660
---
235,660
30,000
---
NET CHANGE IN FUND BALANCES
-158,855
-10,020
-55,861
-224,736
FUND BALANCES - BEGINNING OF YEAR
1,768,141
139,107
201,858
2,109,106
3,144,183
FUND BALANCES - END OF YEAR
$ 1,609,286
$ 129,087
$ 145,997
$ 1,884,370
$ 2,109,106
-1,035,077
See Accompanying Notes to Financial Statements. -14-
STATEMENT OF REVENUE, EXPENDITURES AND CHANGES IN FUND BALANCES - GOVERNMENTAL FUNDS
YEAR ENDED JUNE 30, 2007
Karl L. Drake, P.C.

NET CHANGE IN FUND BALANCES - TOTAL GOVERNMENTAL FUNDS $ -224,736
Amounts reported for governmental activities in the statement of activities are different because:
- Governmental funds report capital outlays as expenditures; in the statement of activities, these costs are allocated over their estimated useful lives as depreciation.
Depreciation Expense -467,046 Capital Outlay 135,711 -331,335
- Loan proceeds recorded as other financing sources in the governmental funds, but not in the statement of activities (where it increases long-term debt)
-30,000
- Accrued interest is recorded in the statement of activities when incurred; it is not reported in governmental funds until paid
741
- Repayments of bond and loan principal is an expenditure in the governmental funds, but not in the statement of activities (where it reduces long-term debt)
535,862
CHANGE IN NET ASSETS OF GOVERNMENTAL ACTIVITIES $ -49,468
See Accompanying Notes to Financial Statements. -15-
HANOVER-HORTON SCHOOL DISTRICT Fund Financial Statements
RECONCILIATION OF THE STATEMENT OF REVENUE, EXPENDITURESAND CHANGES IN FUND BALANCES OF GOVERNMENTAL FUNDS
TO THE STATEMENT OF ACTIVITIES
YEAR ENDED JUNE 30, 2007

ASSETS 2007 2006
Cash and Cash Equivalents $ 238,554 $ 244,562 Accounts Receivable --- ---
TOTAL ASSETS $ 238,554 $ 244,562
LIABILITIES
Due to Others $ --- $ --- Due to Student Groups 238,554 244,562
TOTAL LIABILITIES $ 238,554 $ 244,562
Fiduciary Fund
STATEMENT OF FIDUCIARY NET ASSETS
JUNE 30, 2007
See Accompanying Notes to Financial Statements. -16-
Karl L. Drake, P.C.

HANOVER-HORTON SCHOOL DISTRICT
NOTE 1 - SUMMARY OF SIGNIFICANT ACCOUNTING POLICIES
The accounting policies of the School District conform to United States generally accepted accounting principles as applicable to governmental units. The following is a summary of the significant accounting policies.
A. REPORTING ENTITY: Hanover-Horton School District is located in Jackson County, Michigan. The School District is a K through 12 system. The School District is governed by a School Board consisting of seven Board members, all of whom are elected by School District residents.
As defined by Governmental Accounting Standards Board (GASB) No. 14, the financial reporting entity consists of (1) the primary government, (2) organizations for which the primary government is financially accountable, and (3) other organizations for which the primary government is not accountable, but for which the nature and significance of their relationship with the primary government are such that exclusion would cause the reporting entity’s financial statements to be misleading or incomplete. The primary government has financial accountability if it:
1. appoints a voting majority of the organization’s board, and has the ability to impose its will on the organization; or
2. there is a potential for the component unit to provide certain financial benefits to, or impose certain financial burdens on, the primary government.
Based on the above criteria, no additional organizations or entities are included in these financial statements. B. BASIS OF PRESENTATION
District-Wide and Fund Financial Statements
The district-wide financial statements (i.e., the statement of net assets and the statement of changes in net assets) report information on all of the nonfiduciary activities of the primary government. For the most part, the effect of interfund activity has been removed from these statements. Governmental activities, which normally are supported by taxes and intergovernmental revenues, are reported separately from business-type activities, which rely to a significant extent on fees and charges for support. All the district’s government wide activities are considered governmental activities.
The statement of activities demonstrates the degree to which the direct expenses of a given function or segment are offset by program revenues. Direct expenses are those that are clearly identifiable with a specific function. Program revenue includes (1) charges to customers or applicants who purchase, use, or directly benefit from goods, services, or privileges provided
Notes To Financial Statements
-17-

by a given function and (2) grants and contributions that are restricted to meeting the operational or capital requirements of a particular function. Taxes, intergovernmental payments, and other items not properly included among program revenues are reported instead as general revenue.
Separate financial statements are provided for governmental funds and fiduciary funds, even though the latter are excluded from the government-wide financial statements. Major individual governmental funds are reported as separate columns in the fund financial statements.
District-Wide Statements - The district-wide financial statements are reported using the economic resources measurement focus and the accrual basis of accounting. Revenue is recorded when earned and expenses are recorded when a liability is incurred, regardless of the timing of related cash flows. Property taxes are recognized as revenue in the year for which they are levied. Grants, categorical aid and similar items are recognized as revenue as soon as all eligibility requirements imposed by the provider have been met.
As a general rule, the effect of inter-fund activity has been eliminated from the government-wide financial statements.
Fund Based Statements - Governmental fund financial statements are reported using the current financial resources measurement focus and the modified accrual basis of accounting. Revenue is recognized as soon as it is both measurable and available. Revenue is considered to be available if it is collected within the current period or soon enough thereafter to pay liabilities of the current period. For this purpose, the government considers revenues to be available if they are collected within 60 days of the end of the current fiscal period. Expenditures generally are recorded when a liability is incurred, as under accrual accounting. However, debt service expenditures, as well as expenditures related to compensated absences and severance pay, are recorded only when payment is due.
Property taxes, unrestricted state aid, intergovernmental grants and interest associated with the current fiscal period are all considered to be susceptible to accrual and so have been recognized as revenue of the current fiscal period. All other revenue items are considered to be available only when cash is received by the government.
The fiduciary fund statement is also reported using the economic resources measurement focus and the accrual basis of accounting.
GOVERNMENTAL FUNDS
General Fund - The General Fund is the general operating fund of the School District. It is used to account for all financial resources except those required to be accounted for in another fund.
Special Revenue Funds - Special Revenue Funds are used to account for the proceeds of specific revenue sources (other than Building and Site Funds) that are legally restricted to expenditures for specified purposes. The Special Revenue Funds maintained by the School District are the Food Service Fund and Athletic Fund.
-18-
Karl L. Drake, P.C.

NOTE 1 - SUMMARY OF SIGNIFICANT ACCOUNTING POLICIES (CONTINUED)
GOVERNMENTAL FUNDS (CONTINUED)
Debt Retirement Funds - These funds are used to account for the accumulation of resources for, and for the payment of, general long-term debt principal, interest, and related costs. Debt Retirement Funds maintained by the School District are to retire outstanding 1999, 2002 and Durant bonded indebtedness.
Capital Project Funds - Capital Project Funds are used to account for financial resources to be used for the acquisition or construction of major capital facilities. The school maintains one capital project fund.
FIDUCIARY FUNDS
Agency Fund - The Agency Fund is used to account for assets held by the School as an agent for student clubs and organizations. The Agency Fund is custodial in nature (assets equal liabilities) and does not involve measurement of results of operations.
C. BUDGETS AND BUDGETARY ACCOUNTING: The General Fund, Special Revenue Funds, and Debt Retirement Funds are under formal budgetary control. Budgets are adopted on the modified accrual basis of accounting. Amendments are by action of the Board.
P.A. 621 of 1978, Section 18 (1), as amended, provides that a local unit shall not incur expenditures in excess of the amount appropriated.
In the body of the financial statements, the School’s actual expenditures and budgeted expenditures for the budgetary funds have been shown on a functional basis. The approved budgets of the School for these budgetary funds were adopted at the functional level.
D. PROPERTY TAXES: Property taxes are attached as an enforceable lien on property as of January 1. Taxes are levied and payable on December 1. The District collects its taxes through the local township treasurers. Settlement of the delinquent real property taxes is funded by Jackson and Hillsdale Counties. The District recognizes property tax revenue in the year of levy except for delinquent personal property taxes, which are recorded as revenue when received. E. INVENTORIES: Inventories are accounted for at cost on a first-in, first-out basis of accounting with the exception of USDA Commodities that are recorded at market value. Inventory consists of expendable supplies held for consumption and USDA Commodities.
F. CASH EQUIVALENTS: The School District considers all highly liquid investments with maturity of three months or less when purchased to be cash equivalents.
G. FINANCIAL INSTRUMENTS: The School does not require collateral to support financial instruments subject to credit risk.
HANOVER-HORTON SCHOOL DISTRICT Notes To Financial Statements
-
19-

H. SHORT-TERM INTERFUND RECEIVABLES AND PAYABLES: During the course of operations, numerous transactions occur between individual funds for goods provided or services rendered. These receivables and payables are classified as “due from other funds” or “due to other funds” on the balance sheet.
I. FUND EQUITY: Reservations of fund balance represent these portions of fund equity not appropriable for expenditure or legally segregated for a specific future use.
J. CAPITAL ASSETS: Capital assets, which include land, buildings, equipment, and vehicles, are reported in the applicable governmental column in the government-wide financial statements. The government defines capital assets as assets with an initial individual cost of more than $5,000 and an estimated useful life in excess of 1 year. Such assets are recorded at historical cost or estimated historical cost if purchased or constructed. Donated capital assets are recorded at estimated fair market value at the date of donation. Costs of normal repair and maintenance that do not add to the value materially extended asset life are not capitalized. The school district does not have infrastructure type assets.
Buildings, equipment, and vehicles are depreciated using the straight-line method over the following useful lives:
Buildings and additions 20-50 years
Buses and other vehicles 5-10 years
Furniture and other equipment 5-20 years
K. LONG-TERM OBLIGATIONS: In the government-wide financial statements, long-term debt and other long-term obligations are reported as liabilities in the statement of net assets. Bond premiums and discounts, as well as issuance costs, are deferred and amortized over the life of the bonds using the effective interest method. Bonds payable are reported net of the applicable bond premium or discount. Bond issuance costs are reported as deferred charges and amortized over the term of the related debt.
In the fund financial statements, governmental fund types recognize bond premiums and discounts, as well as bond issuance costs, during the current period.
Premiums received on debt issuances are reported as other financing sources while discounts are reported as other financing uses. Issuance costs are reported as debt service expenditures.
-20-
Karl L. Drake, P.C.

HANOVER-HORTON SCHOOL DISTRICT
L. TOTAL COLUMNS ON COMBINED STATEMENTS: Total columns on the Combined Statements are captioned (Memo Only) to indicate that they are presented only to facilitate financial analysis. Data in these columns do not present financial position or results of operations in conformity with generally accepted accounting principles. Neither is such data comparable to a consolidation. Inter-fund eliminations have not been made in the aggregation of this data.
M. STATE CATEGORICAL REVENUE: The School District also receives revenue from the State to administer certain categorical education programs. State rules require that revenue earmarked for these programs be expended for its specific purpose. Categorical funds received, which are not expended by the close of the fiscal year, are recorded as deferred revenue.
N. RISK MANAGEMENT: The School District is exposed to various risks of loss to torts; theft of, damage to and destruction of assets; errors and omissions; and natural disasters for which the School District carries commercial insurance. Liabilities in excess of insurance coverage, if any, are reported when it is probable that a loss has occurred and the amount of the loss can be reasonably estimated.
O. ESTIMATES: The preparation of financial statements in conformity with United States generally accepted accounting principles requires management to make estimates and assumptions that affect the reported amounts of assets and liabilities and disclosure of contingent assets and liabilities at the date of the financial statements and the reported amounts of revenues and expenditures during the reporting period. Actual results could differ from those estimates.
NOTE 2 - DEPOSITS WITH FINANCIAL INSTITUTIONS
A. LEGAL OR CONTRACTUAL PROVISIONS FOR DEPOSITS AND INVESTMENTS: The Michigan Political Subdivisions Act No. 20, Public Acts of 1943, as amended by Act No. 217, Public Acts of 1982, states the District, by resolution, may authorize investment of surplus funds as follows:
1. In bonds and other direct obligations of the United States or an agency or instrumentality of the United States.
2. In certificates of deposit, savings accounts, or depository receipts of a bank, which is a member of the Federal Deposit Insurance Corporation; or a savings and loan association, which a member of the Federal Savings and Loan Insurance Corporation; or a credit union, which is insured by the National Credit Union Association; but only if the bank, savings and loan association, or credit union complies with Subsection (2).
Notes To Financial Statements
-21-

3. In commercial paper rated at the time of purchase within the 2 highest classifications established by not less than 2 standard rating services and which matures not more than 270 days after the date of purchase. Not more than 50% of any fund may be invested in commercial paper at any time.
4. In United States government or Federal agency obligation repurchase agreements.
5. In bankers’ acceptances of United States banks.
6. In mutual funds composed of investment vehicles that are legal for direct investment by local units of government in Michigan.
The School District is in compliance with State law regarding their cash deposits.
B. TYPES OF DEPOSITS AND INVESTMENTS: The School District maintains its cash deposits in two financial institutions. At June 30, 2007, the book value of the School District’s deposits was $-62,890 and the bank balance was $55,282. Of the bank balance, $55,282 was covered by federal depository insurance and $0 was uninsured and uncollateralized.
Statutes authorize the School District to invest in obligations of the U.S. Treasury and U.S. agencies and instrumentalities, U.S. government or federal agency obligation repurchase agreements, obligations of the State, Certificates of Deposit, Commercial paper rated prime, Bankers’ acceptances, and Mutual funds and Investment pools composed entirely of instruments that are legal for direct investment by a School District.
The School District invests surplus funds with the Comerica Bank School Cash Investment Fund in investment trust accounts in accordance with Sections 622, 1221, and 1223 of the School Code.
Investments are stated at cost, which approximates market value. The Comerica Bank School Cash Investment Fund is categorized as a mutual fund. Each School District owns a prorata share of each investment or deposit, which is held in the name of the fund.
The amount of investments as of June 30, 2007, which are not required to be categorized as to level of risk are as follows:
Carrying Amount Book Amount
General Fund $ 1,203,919 $ 1,203,919 Cafeteria Fund 124,416 124,416 Debt Retirement Fund 123,733 123,733 Capital Projects Fund 41,221 41,221 Trust and Agency Fund 246,144 246,144
$ 1,739,433 $ 1,739,433
-22-
Karl L. Drake, P.C.

B. TYPES OF DEPOSITS AND INVESTMENTS (CONTINUED) Investments are categorized into these three categories of credit risk:
1. Insured or registered, or securities held by the government or its agent in the District’s name.
2. Uninsured or unregistered, with securities held by the counter party’s trust department or agent in the District’s name.
3. Uninsured or unregistered, with securities held by the counter party, or by its trust department or agent but not in the District’s name.
NOTE 3 - INVENTORY
There is $4,855 of inventory in the Special Revenue Fund - Food Service. NOTE 4 - DUE FROM OTHER GOVERNMENTAL UNITS
The Due from Other Governmental Units at June 30, 2007, is comprised of the following:
General Fund
State of Michigan - State Aid $ 1,519,140 - Title 1 6,409 - Improving Teacher Quality 11,823 - Title 5 280
Total Due From Other Governmental Units $ 1,537,652
NOTE 5 - DUE TO/FROM OTHER FUNDS
Due to/due from at June 30, 2007, consisted of the following:
Due To: Due From:
General Fund $ 25,266 Food Service $ 25,266 General Fund 10,639 Athletic 10,639
$ 35,905 $ 35,905
HANOVER-HORTON SCHOOL DISTRICT Notes To Financial Statements
-
23-

NOTE 6 - CAPITAL ASSETS
Capital asset activity of the school district’s Governmental activities was as follows:
Balance July 1, 2006
Additions
Disposals and
Adjustments
Balance
June 30, 2007
Assets not being depreciated: Land $ 1,150 $ --- $ --- $ 1,150
Capital assets being depreciated: Land improvement 2,018,577 --- --- 2,018,577 Building and building improvements 11,799,618 75,716 --- 11,875,334 Buses and other vehicles 794,559 59,995 49,662 804,892 Furniture and equipment 772,670 --- 6,500 766,170
Subtotal 15,385,424 135,711 56,162 15,464,973
Accumulated depreciation: Land Improvements 161,216 40,372 --- 201,588 Building and building improvements 4,266,828 280,675 --- 4,547,503 Buses and other vehicles 523,857 75,272 49,662 549,467 Furniture and equipment 543,245 70,727 6,500 607,472
Subtotal 5,495,146 467,046 56,162 5,906,030 Net capital assets being depreciated 9,890,278 -331,335 --- 9,558,943 Net capital assets $ 9,891,428 $ -331,335 $ --- $ 9,560,093
Depreciation expense was not charged to activities as the District considers its assets to impact multiple activities and allocation is not practical. NOTE 7 - ACCRUED SALARIES AND FRINGE BENEFITS
Salaries payable at June 30, 2007, of $697,873 represents the unpaid portion of teacher contracts for the 2006-07 school year. On these salaries there are also fringe benefits payable at year-end totaling $369,992. NOTE 8 - LONG-TERM DEBT
Long-Term Debt is comprised of bonded debt, bus notes and other notes payable. During the year ended June 30, 2007, long-term debt changed as follows:
-24-
Karl L. Drake, P.C.
NOTE 8 - LONG-TERM DEBT (CONTINUED)
Bond Issue
Balance 6/30/06
Additional Debt
2006-07 Payments
Balance 6/30/07
1999 Debt $ 6,345,000 $ --- $ 465,000 $ 5,880,000 2002 Debt 1,805,000 --- 50,000 1,755,000 Durant Debt 43,211 --- --- 43,211
Comerica Bus Loan 10,411 --- 10,411 --- Comerica Bus Loan 21,320 --- 10,451 10,869 County National Bus Loan --- 30,000 --- 30,000
$ 8,224,942 $ 30,000 $ 535,862 $ 7,719,080
Amounts needed over the next five years for debt principal payments are as follows:
Bus
Loans
1999 Refunding
Debt
2002 Debt
Durant Debt
Total
2007-08 $ 25,564 $ 465,000 $ 75,000 $ --- $ 565,5642008-09 15,305 460,000 125,000 5,867 606,1722009-10 --- 455,000 155,000 6,147 616,1472010-11 --- 450,000 175,000 17,384 642,3842011-12 --- 445,000 175,000 6,746 626,746 40,869 2,275,000 705,000 36,144 3,057,013
2012 - Maturity --- 3,605,000 1,050,000 7,067 4,662,067
$ 40,869 $ 5,880,000 $ 1,755,000 $ 43,211 $ 7,719,080
NOTE 9 - DEFINED BENEFIT PENSION PLAN
The School District participates in the Michigan Public School Employees’ Retirement System (MPSERS), which is a multiple-employer public employee retirement system. MPSERS maintains two plans: the Basic Plan and a Member Investment Plan (MIP). The retirement statute requires that the School District contribute 14.56% of the aggregate annual compensation paid to all employees who are members of the Retirement System. Effective October 1, 1996, the rate increased to 15.17%, and has changed annually since then. For the year ending June 30, 2007, the rate was 17.74%.
HANOVER-HORTON SCHOOL DISTRICT Notes To Financial Statements
-25-

-
Members joining MIP prior to January 1, 1990, contribute at a fixed rate of 3.9% of gross wages. Members joining MIP January 1, 1990 or later contribute at the following graduated permanently fixed ate: 3% of the first $5,000; 3.6% of $5,001 through $15,000; 4.3% of all wages over $15,000. After January 1, 1990, membership in MIP is mandatory.
All benefits vest after 10 years of service. Basic Plan members may retire at age 55 with 30 years of credited service, or at age 50 with 10 or more years of credited service. A Member Investment Plan (MIP) member may retire at any age with 30 years of credited service or at age 60 with 5 years of service. Both Basic and MIP Plan members may retire at age 55 with 15 years of service and receive reduced early retirement benefits. The system also provides non-duty disability benefits after 10 years of service for MIP members and 15 years of service for basic plan members. The service provision is waived for duty disability and duty death benefits. Benefits are paid monthly over the member’s or survivor’s lifetime and are equal to 1.5% of the member’s final average compensation times the member’s years of credited service. The final average compensation period for basic members is 60 consecutive months and for MIP members it is 36 consecutive months. The system also provides health, dental and vision insurance coverage for retirees. MIP members receive a fixed 3% annual increase of the initial benefit. Basic members share in investment earnings over 8%.
The employees covered by the plan include: all teaching and non-teaching employees, employees paid from federal funds, students working summer months but not attending classes, and students working in a school other than the one they are enrolled in and attending classes.
During the year ended June 30, 2007, the School District contributed $1,030,275 to the Retirement System, which is 16.36% of current fiscal year covered compensation of $6,297,300. The rate for the current contract year is 17.74%, which the School District paid on all covered compensation. Employees contributed an additional $199,281 or 3.42% of eligible wages of $5,834,116. Total wages of the district totaled $6,353,497.80.
The “actuarial accrued liability” is a standardized disclosure measure of the present value of pension benefits, adjusted for the effects of projected salary increases and step-rate benefits, estimated to be payable in the future as a result of employee service to date. The measure, which is the actuarial present value of credited projected benefits, is intended to help users assess the System’s funding status on a going-concern basis, assess progress made in accumulating sufficient assets to pay benefits when due, and make comparisons among retirement plans and employers. The System does not make separate measurements of assets and pension benefits obligation for individual employers. The actuarial accrued liability at September 30, 2005, for the System as a whole, determined through an actuarial valuation performed, as of that date, was $48.2 billion. The total pension benefit obligation has increased by $1.9 billion from September 30, 2004 to September 30, 2005.
The System’s net assets available for benefits on that date (valued at market) were $38.2 billion leaving an unfunded actuarial accrued liability of $10.0 billion. Ten-year historical trend information is presented in the System’s September 30, 2006, comprehensive annual financial report.
26-
Karl L. Drake, P.C.
HANOVER-HORTON SCHOOL DISTRICT
NOTE 10 - BUDGETARY ACCOUNTING
During the year ended June 30, 2007, the School incurred no expenditures that were in excess of the amounts appropriated.
NOTE 11 - FUND BALANCE
Components of Fund Balance at June 30, 2007, are as follows:
1. $4,855 of fund balance in the Special Revenue - Food Service Fund is reserved. This amount represents inventory supplies and USDA commodity inventories on hand at year-end and is not available for current appropriations and expenditures of the Hot Lunch Fund.
2. The balance of the Unreserved Fund Balance is undesignated and is available to fund
future School operations. The June 30, 2007, Unreserved General Fund Balance of $1,609,286 compares to June 30, 2006, Unreserved General Fund Balance of $1,768,141.
NOTE 12 - COMPENSATED ABSENCES
The School’s policy is not to compensate employees for vacation time not used during the school year. No provision is made in these financial statements for absences. Accumulated sick pay policies are as follows:
Teachers
Credited with 11 sick leave days per year; maximum accumulation of 130 days allowed; amounts over 130 days not used are paid at a rate of $55 per day. A retirement leave benefit of $55 per day (maximum $750) is paid to teachers, employed by the District for ten years or more, retiring from the District.
Support Personnel
Credited with one day per month for months worked; maximum accumulation of 120 days allowed; amounts over 120 days not used are paid at a rate of 50% of the employee’s daily rate. A retirement leave benefit of 50% of the daily rate (maximum $500) is paid upon retirement from the District.
Notes To Financial Statements
-27-

NOTE 13 - SINKING FUND
The School has established a sinking fund. Taxpayers will fund the Sinking Fund with 1 mill of property taxes for the next 5 years. This money will be used for facility repairs and improvements. Collections of these taxes will begin in the summer of 2007. NOTE 14 - DEFERRED REVENUE
The School has received revenue designated for specific programs that was not spent at June 30, 2007. The following are the programs and the amount of revenue deferred.
Program Amount
At Risk $ 15,134 Medicaid 17,785
$ 32,919
-28-
Karl L. Drake, P.C.
REQUIRED SUPPLEMENTAL INFORMATION
HANOVER-HORTON SCHOOL DISTRICT
-29-

Budgeted Amounts Actual Variance Original Final (Budgetary Basis) REVENUE
Local Sources $ 1,317,388 $ 1,317,035 $ 1,310,896 $ -6,139 State Sources 8,646,381 9,010,291 8,993,785 -16,506 Federal Sources 227,515 167,519 139,828 -27,691 Other Sources 30,000 30,000 30,000 ---
TOTAL REVENUE 10,221,284 10,524,845 10,474,509 -50,336 EXPENDITURES
Current Instruction
Basic Programs 5,694,638 6,065,988 6,000,118 65,870 Added Needs 651,890 603,847 579,869 23,978
Supporting Services Pupil 508,449 479,869 450,267 29,602 Instructional Staff 167,978 167,181 158,995 8,186 Administration 1,352,845 1,260,831 1,236,265 24,566 Business Services 1,822,431 1,909,676 1,854,645 55,031
Community Services 39,847 37,761 35,430 2,331 Capital Outlay 70,000 61,254 61,253 1 Debt Service 25,210 20,862 20,862 ---
Other Uses - Operating Transfers 302,001 296,645 235,660 60,985
TOTAL EXPENDITURES 10,635,289 10,903,914 10,633,364 270,550 EXCESS OF REVENUE OVER <UNDER> EXPENDITURES AND OTHER USES
-414,005
-379,069
-158,855
220,214 BUDGETARY FUND BALANCE - JULY 1, 2006
1,768,141
1,768,141
1,768,141
---
BUDGETARY FUND BALANCE -JUNE 30, 2007
$ 1,354,136
$ 1,389,072
$ 1,609,286
$ 220,214
-30-
BUDGETARY COMPARISON SCHEDULE - GENERAL FUND
YEAR ENDED JUNE 30, 2007

Budgeted Amounts Actual Variance Original Final (Budgetary Basis) REVENUE
Local Sources $ 848,445 $ 855,484 $ 863,040 $ 7,556 State Sources --- --- --- --- Federal Sources --- --- --- --- Other Sources --- --- --- ---
TOTAL REVENUE 848,445 855,484 863,040 7,556 EXPENDITURES
Current Instruction
Basic Programs --- --- --- --- Added Needs --- --- --- ---
Supporting Services Pupil --- --- --- --- Instructional Staff --- --- --- --- Administration --- --- --- --- Business Services --- --- --- ---
Community Services --- --- --- --- Capital Outlay --- --- --- --- Debt Service 874,639 874,639 873,060 1,579
Other Uses - Operating Transfers --- --- --- ---
TOTAL EXPENDITURES 874,639 874,639 873,060 1,579 EXCESS OF REVENUE OVER <UNDER> EXPENDITURES AND OTHER USES
-26,194
-19,155
-10,020
9,135 BUDGETARY FUND BALANCE - JULY 1, 2006
139,107
139,107
139,107
---
BUDGETARY FUND BALANCE -JUNE 30, 2007
$ 112,913
$ 119,952
$ 129,087
$ 9,135
HANOVER-HORTON SCHOOL DISTRICT
BUDGETARY COMPARISON SCHEDULE - DEBT FUNDS
YEAR ENDED JUNE 30, 2007
-31-
Karl L. Drake, P.C.

OTHER SUPPLEMENTAL INFORMATION
-
32-
Karl L. Drake, P.C.

GENERAL FUND
HANOVER-HORTON SCHOOL DISTRICT
-33-

Budget
Actual
Favorable <Unfavorable>
Prior Year Actual
REVENUE
LOCAL SOURCES
Current Property Tax Levy $ 894,286 $ 891,135 $ -3,151 $ 806,281Interest and Penalties - Delinquent Taxes 6,773 7,458 685 5,537Tuition 1,226 1,226 --- 3,125Sale of School Property 4,200 4,200 --- ---Refunds 20,903 20,698 -205 13,228
Interest Earned 39,431 46,218 6,787 42,401Rental of School Facilities 9,405 9,405 --- 8,500Transportation 16,230 17,708 1,478 15,204Kids Club Fees 30,250 29,389 -861 36,428Career Prep 23,000 23,000 --- 23,000
Literacy --- --- --- 39,142Other 3,184 3,184 --- 2,626Data Processing Support 20,000 31,577 11,577 29,617Special Education 248,147 225,698 -22,449 219,248
TOTAL REVENUE FROM LOCAL SOURCES 1,317,035 1,310,896 -6,139 1,244,337
STATE SOURCES
Non Plaintiff Durant Settlement 10,543 10,543 --- 10,543State Aid 8,649,098 8,647,725 -1,373 8,661,001Middle School Math 17,665 17,666 1 ---Special Education 219,788 219,788 --- 22,449At Risk 113,197 98,063 -15,134 92,586
TOTAL REVENUE FROM STATE SOURCES 9,010,291 8,993,785 -16,506 8,786,579
FEDERAL SOURCES
Title II - D 1,338 1,168 -170 1,952Title I 97,792 80,101 -17,691 126,258Title II - A 68,005 57,388 -10,617 71,211Drug Free --- 786 786 ---Title V 384
385 1 1,326
Homeland Security --- --- --- 3,957SPSR --- --- --- 1,116
TOTAL REVENUE FROM FEDERAL SOURCES 167,519 139,828 -27,691 205,820
TOTAL REVENUE AND INCOMING TRANSFERS
$ 10,494,845 $ 10,444,509
$ -50,336 $ 10,236,736
General Fund
STATEMENT OF REVENUE, EXPENDITURES AND CHANGES IN FUND BALANCE BUDGET AND ACTUAL
FISCAL YEAR ENDED JUNE 30, 2007
-34-
Karl L. Drake, P.C.

HANOVER-HORTON SCHOOL DISTRICT General Fund
STATEMENT OF REVENUE, EXPENDITURES AND CHANGES IN FUND BALANCE BUDGET AND ACTUAL
FISCAL YEAR ENDED JUNE 30, 2007
Budget
Actual Favorable
<Unfavorable> Prior Year
Actual EXPENDITURES
Instruction
BASIC PROGRAMS
Elementary School $ 2,236,453 $ 2,218,672 $ 17,781 $ 1,120,434 Middle School 1,527,704 1,520,333 7,371 1,549,881 High School 2,168,134 2,128,274 39,860 2,094,781 Summer School 133,697 132,839 858 74,789 Other --- --- --- ---
TOTAL BASIC PROGRAMS 6,065,988 6,000,118 65,870 5,839,885
ADDED NEEDS
Special Education 504,820 499,768 5,052 530,214 Compensatory Education 99,027 80,101 18,926 126,258 Other --- --- --- ---
TOTAL ADDED NEEDS 603,847 579,869 23,978 656,472
Total Instruction 6,669,835 6,579,987 89,848 6,496,357
Supportive Services
PUPIL
Guidance 217,670 215,885 1,785 201,653 Extra Duties/Aides 191,808 175,272 16,536 191,887 Staff Development 70,391 59,110 11,281 74,489
TOTAL PUPIL 479,869 450,267 29,602 468,029
INSTRUCTIONAL STAFF
Library 167,181 158,995 8,186 186,815 Audio Visual --- --- --- ---
TOTAL INSTRUCTIONAL STAFF 167,181 158,995 8,186 186,815
ADMINISTRATION
Board of Education 61,834 55,143 6,691 120,210 Central Administration 418,698 408,272 10,426 397,356 School Administration 780,299 772,850 7,449 750,421
TOTAL ADMINISTRATION $ 1,260,831 $ 1,236,265 $ 24,566 $ 1,267,987
-35-

Budget
Actual
Favorable <Unfavorable>
Prior Year Actual
EXPENDITURES
Supportive Services - Continued
BUSINESS SERVICES
Operation and Maintenance $ 1,195,720 $ 1,174,175 $ 21,545 $ 1,032,923 Pupil Transportation 597,446 574,834 22,612 502,956 Technology 35,740 35,954 -214 74,482 Other 80,770 69,682 11,088 15,048
TOTAL BUSINESS SERVICES 1,909,676 1,854,645 55,031 1,625,409
Total Supportive Services 3,817,557 3,700,172 117,385 3,548,240
Community Services Kids Club 35,623 34,147 1,476 33,461 Other 2,138 1,283 855 ---
Total Community Services 37,761 35,430 2,331 33,461
Debt Service 20,862 20,862 --- 85,684
Capital Outlay 61,254 61,253 1 82,810
TOTAL EXPENDITURES $ 10,607,269 $ 10,397,704 $ 209,565 $ 10,246,552
EXCESS REVENUE OVER EXPENDITURES
-112,424
46,805
159,229
-9,816
OTHER FINANCING SOURCES <USES>
Loan Proceeds 30,000 30,000 --- --- Operating Transfers In --- --- --- --- Operating Transfers Out -296,645 -235,660 60,985 -247,696
TOTAL OTHER FINANCING SOURCES <USES>
-266,645
-205,660
60,985
-247,696
EXCESS REVENUE AND OTHER FINANCING SOURCES OVER <UNDER> EXPENDITURES AND OTHER USES
$ -379,069
-158,855
$ 220,214
$ -257,512
FUND BALANCE - JULY 1, 2006 1,768,141
FUND BALANCE - JUNE 30, 2007 $ 1,609,286
-36-
Karl L. Drake, P.C.

SPECIAL REVENUE FUNDS
-37-
HANOVER-HORTON SCHOOL DISTRICT

Special Revenue Funds
COMBINING BALANCE SHEET
JUNE 30, 2007
Food Service Fund
Athletic Fund
Totals
ASSETS
Cash and Investments $ 129,033 $ 10,639 $ 139,672 Due From Other Governmental Units --- --- --- Due From Other Funds --- --- --- Prepaid Expenses --- --- --- Inventory 4,855 --- 4,855
TOTAL ASSETS $ 133,888 $ 10,639 $ 139,672
LIABILITIES AND FUND EQUITY
LIABILITIES
Due to Other Funds $ 25,266 $ 10,639 $ 35,905 Accounts Payable 3,976 --- 3,976 Accrued Salaries --- --- --- Accrued Expenses --- --- ---
TOTAL LIABILITIES 29,242 10,639 39,881
FUND EQUITY
Fund Balance - Reserved for Inventory 4,855 --- 4,855 Fund Balance - Unreserved 99,791 --- 99,291
TOTAL FUND EQUITY 104,646 --- 104,646
TOTAL LIABILITIES AND FUND EQUITY $ 133,888 $ 10,639 $ 144,527
-38-
Karl L. Drake, P.C.

Food Service
Budget
Actual Favorable
<Unfavorable> REVENUE
Food Services Goods Sold $ 5,000 $ 6,062 $ 1,062
Student Meals 200,000 196,260 -3,740 Adult Meals 13,000 13,686 686 Ala Carte Meals 45,000 47,629 2,629 Breakfast 13,000 13,796 796
Vending Machine Sales 2,500 2,795 295 State Aid 20,856 37,169 16,313 Federal Aid 116,000 133,442 17,442 Federal USDA Commodities in Kind 10,000 19,459 9,459 Other Income 100 --- -100
Interest Income 4,800 4,918 118
Athletic Activities Admission to Games --- --- ---
TOTAL REVENUE 430,256 475,216 44,960 EXPENDITURES
Salaries 142,587 143,299 -712 Fringe Benefits 105,155 105,030 125 Dues and Fees 1,460 1,346 114 Purchased Services 3,972 2,451 1,521 Food and Supplies 212,705 205,561 7,144
Travel and Conferences 550 117 433 Miscellaneous 2,200 1,518 682 Repairs 3,500 1,509 1,991 Capital Outlay 4,500 4,128 372
TOTAL EXPENDITURES $ 476,629 $ 464,959 $ 11,670
HANOVER-HORTON SCHOOL DISTRICT Special Revenue Funds
COMBINING STATEMENT OF REVENUE, EXPENDITURES AND CHANGES IN FUND BALANCES - BUDGET AND ACTUAL
FISCAL YEAR ENDED JUNE 30, 2007
-39a-

Athletic Activities Totals (Memo Only)
Budget
Actual Favorable
<Unfavorable>
Budget
Actual Favorable
<Unfavorable>
$ --- $ --- $ --- $ 5,000 $ 6,062 $ 1,062
--- --- --- 200,000 196,260 -3,740 --- --- --- 13,000 13,686 686 --- --- --- 45,000 47,629 2,629 --- --- ---
13,000 13,796 796
--- --- --- 2,500 2,795 295 --- --- --- 20,856 37,169 16,313 --- --- --- 116,000 133,442 17,442 --- --- --- 10,000 19,459 9,459 --- --- --- 100 --- -100
--- --- --- 4,800 4,918 118
66,876 67,005 129 66,876 67,005 129
66,876 67,005 129 497,132 542,221 45,089
178,856 175,495 3,361 321,443 318,794 2,649 59,432 57,851 1,581 164,587 162,881 1,706 10,450 8,900 1,550 11,910 10,246 1,664 23,280 21,990 1,290 27,252 24,441 2,811 22,195 18,795 3,400 234,900 224,356 10,544
1,408 1,263 145 1,958 1,380 578 21,227 18,371 2,856 23,427 19,889 3,538
300 --- 300 3,800 1,509 2,291 --- --- --- 4,500 4,128 372
$ 317,148 $ 302,665 $ 14,483 $ 793,777 $ 767,624 $ 26,153
-39b-
Karl L. Drake, P.C.

COMBINING STATEMENT OF REVENUE, EXPENDITURES AND CHANGES IN
Food Service
Budget
Actual Favorable
<Unfavorable>
EXCESS REVENUE OVER <UNDER> EXPENDITURES $ -46,373 $ 10,257 $ 56,630 OTHER FINANCING SOURCES <USES>
Operating Transfers In 46,373 --- -46,373 Operating Transfers Out --- --- ---
TOTAL OTHER FINANCING SOURCES <USES> 46,373 --- -46,373
EXCESS REVENUE AND OTHER SOURCES OVER EXPENDITURES AND OTHER USES
$ ---
10,257
$ 10,257
FUND BALANCE - BEGINNING OF YEAR 94,389
FUND BALANCE - END OF YEAR $ 104,646
HANOVER-HORTON SCHOOL DISTRICT Special Revenue Funds
FUND BALANCES - BUDGET AND ACTUAL
FISCAL YEAR ENDED JUNE 30, 2007
-40a-

Athletic Activities Totals (Memo Only)
Budget
Actual Favorable
<Unfavorable>
Budget
Actual Favorable
<Unfavorable>
$ -250,272 $ -235,660 $ 14,612 $ -296,645 $ -225,403 $ 71,242
250,272 235,660 -14,612 296,645 235,660 -60,985 --- --- --- --- --- ---
250,272 235,660 -14,612 296,645 235,660 -60,985
$ ---
---
$ ---
$ ---
10,257
$ 10,257
--- 94,389
$ --- $ 104,646
-4
0b-
Karl L. Drake, P.C.
-
HANOVER-HORTON SCHOOL DISTRICT
DEBT RETIREMENT FUNDS
41-

Debt V Debt VI Durant Totals
ASSETS
Cash and Investments $ 80,879 $ 43,453 $ --- $ 124,332Due from other Funds --- --- --- ---Accounts Receivable 4,037 718 --- 4,755
TOTAL ASSETS $ 84,916 $ 44,171 $ --- $ 129,087
LIABILITIES AND FUND EQUITY
LIABILITIES Accounts Payable $ --- $ --- $ --- $ ---Due to Other Funds --- --- --- ---
TOTAL LIABILITIES --- --- --- ---
FUND EQUITY Fund Balance 84,916 44,171 --- 129,087
TOTAL LIABILITIES AND FUND EQUITY $ 84,916 $ 44,171 $ --- $ 129,087
Debt Retirement Funds
COMBINING BALANCE SHEET
JUNE 30, 2007
-42-
Karl L. Drake, P.C.
Debt V
Budget
Actual Favorable
<Unfavorable> REVENUE
Current Taxes $ 690,992 $ 696,548 $ 5,556 Delinquent Taxes --- --- --- Interest and Penalties on Delinquent Property Taxes 3,219 3,464 245 Earned Interest 18,886 18,993 107 State Aid Revenue --- --- ---
Miscellaneous --- --- ---
TOTAL REVENUE 713,097 719,005 5,908
EXPENDITURES
Principal on Bonds 465,000 465,000 --- Interest on Bonds 281,283 281,283 --- Interest on School Bond Loan Fund --- --- --- Agent Fees and Other 1,500 619 881
TOTAL EXPENDITURES 747,783 746,902 881
EXCESS REVENUE OVER <UNDER> EXPENDITURES -34,686 -27,897 6,789
Loan Proceeds --- --- Operating Transfers In --- --- ---
--- ---
---
EXCESS REVENUE AND OTHER SOURCES OVER <UNDER> EXPENDITURES AND OTHER USES
-27,897 $ 6,789
$ -34,686
112,813
OTHER FINANCING SOURCES
---
Operating Transfers Out ---
TOTAL OTHER FINANCING SOURCES --- ---
FUND BALANCE - BEGINNING OF YEAR
FUND BALANCE - END OF YEAR $ 84,916
HANOVER-HORTON SCHOOL DISTRICT Debt Retirement Funds
STATEMENT OF REVENUE, EXPENDITURES AND CHANGES IN FUND BALANCES BUDGET AND ACTUAL
FISCAL YEAR ENDED JUNE 30, 2007
-43a-

Debt VI Durant
Budget
Actual Favorable
<Unfavorable>
Budget
Actual Favorable
<Unfavorable>
$ 139,268 $ 42 $ --- $ --- $ --- --- --- --- --- --- ---
619 673 54 --- --- --- 2,500 1,552 --- --- ---
--- ---
--- --- --- --- ---
142,387 144,035 1,648 --- --- ---
--- --- 75,856 75,855 1 ---
--- --- --- --- ---
50,000 50,000 --- --- --- --- --- ---
1,000 303 697 --- ---
126,856 126,158
698 --- --- --- ,
15,531
--- --- --- --- --- --- --- --- --- --- --- ---
--- --- ---
17,877 $ 2,346 $ --- --- $ ---
26,294 ---
$ 44,171 $ ---
$ 139,310
4,052 --- --- --- ---
---
17,877 2,346 --- --- ---
--- --- --- --- --- ---
--- --- ---
$ 15,531
-43b-
Karl L. Drake, P.C.

<Unfavorable>
Total
Budget
Actual Favorable
Current Taxes $ 830,260 $ 5,598 Delinquent Taxes --- --- Interest and Penalties on Delinquent Property Taxes 3,838 4,137 299 Earned Interest 21,386 23,045 1,659
Miscellaneous ---
515,000 515,000 --- Interest on Bonds 357,139 1 Interest on School Bond Loan Fund --- --- --- Agent Fees and Other 2,500 922 1,578
TOTAL EXPENDITURES 874,639 873,060 1,579
EXCESS REVENUE OVER <UNDER> EXPENDITURES -19,155 -10,020 9,135
OTHER FINANCING SOURCES <USES>
---
Loan Proceeds --- --- --- Operating Transfers In --- --- --- Operating Transfers Out --- ---
TOTAL OTHER FINANCING SOURCES <USES> --- --- ---
EXCESS REVENUE AND OTHER SOURCES OVER <UNDER> EXPENDITURES AND OTHER USES
$ -19,155
-10,020
$ 9,135
FUND BALANCE - BEGINNING OF YEAR 139,107
FUND BALANCE - END OF YEAR $ 129,087
REVENUE
$ 835,858 ---
State Aid Revenue --- --- --- ---
--- ---
TOTAL REVENUE 855,484 863,040 7,556
EXPENDITURES
Principal on Bonds 357,138
HANOVER-HORTON SCHOOL DISTRICT Debt Retirement Funds
STATEMENT OF REVENUE, EXPENDITURES AND CHANGES IN FUND BALANCES BUDGET AND ACTUAL
FISCAL YEAR ENDED JUNE 30, 2007
-44-

CAPITAL PROJECT FUND
-
45-
Karl L. Drake, P.C.

ASSETS
2007
2006
Cash and Investments $ 107,469 Accounts Receivable
---
$ 41,351 --- ---
Due from Other Funds ---
$ 41,351 $ 107,469
LIABILITIES AND FUND EQUITY
LIABILITIES
Accounts Payable $ ---
FUND EQUITY
Fund Balance 41,351 107,469
TOTAL LIABILITIES AND FUND EQUITY $ 41,351 $ 107,469
TOTAL ASSETS
$ ---
Due to Other Funds --- --- TOTAL LIABILITIES --- ---
-46-
HANOVER-HORTON SCHOOL DISTRICT Capital Project Fund
COMPARATIVE BALANCE SHEET
JUNE 30, 2007 and 2006

Budget
Actual
Favorable <Unfavorable>
Prior Year Actual
REVENUE
Current Taxes $ --- $ --- $ --- Delinquent Taxes --- --- --- --- Grants 5,927 7,237 55,000 Earned Interest 2,360 2,361 1 15,354 Miscellaneous --- --- --- ---
8,287 9,598 1,311 70,354
33,057
EXPENDITURES
Capital Outlay 108,773 75,716 884,542
108,773
-66,118
34,368
-814,188
OTHER FINANCING SOURCES
--- --- Operating Transfers In --- --- ---
---
TOTAL OTHER FINANCING SOURCES --- --- ---
EXCESS REVENUE AND OTHER SOURCES OVER <UNDER> EXPENDITURES AND OTHER USES
$ -100,486
-66,118
$ 34,368
$ -814,188
FUND BALANCE - BEGINNING OF YEAR 107,469
FUND BALANCE - END OF YEAR $ 41,351
$ ---
1,310
TOTAL REVENUE
TOTAL EXPENDITURES 75,716 33,057 884,542
EXCESS REVENUE OVER <UNDER> EXPENDITURES
-100,486
OISD Contribution --- --- ---
Operating Transfers Out ---- --- ---
---
Capital Project Fund
STATEMENT OF REVENUE, EXPENDITURES AND CHANGES IN FUND BALANCE - BUDGET AND ACTUAL
FISCAL YEAR ENDED JUNE 30, 2007
-47-
Karl L. Drake, P.C.

HANOVER - HORTON SCHOOL DISTRICT
AGENCY FUNDS
-48-

Agency Funds
STATEMENT OF ASSETS AND LIABILITIES
JUNE 30, 2007
ASSETS
Due From Other Funds
Cash and Investments $ 238,554 Accounts Receivable ---
---
TOTAL ASSETS $ 238,554
LIABILITIES
Due to Other Funds
$ --- Due to Student Groups 238,554
TOTAL LIABILITIES
$ 238,554
-49-
Karl L. Drake, P.C.
HANOVER - HORTON SCHOOL DISTRICT Agency Funds
SUMMARY STATEMENT OF CHANGES IN ASSETS AND LIABILITIES
FISCAL YEAR ENDED JUNE 30, 2007
Disbursements
Balance 6/30/07
Balance 6/30/06
Receipts
ASSETS
$ 244,562 Accounts Receivable --- --- ---
---
Cash and Investments $ 326,628 $ 332,636 $ 238,554 ---
Due From Other Funds --- --- ---
TOTAL ASSETS $ 244,562 $ 326,628 $ 332,636 $ 238,554
LIABILITIES
$ ---
Due to Other Funds $ --- $ --- $ --- Due to Student Groups 244,562 326,628 332,636 238,554
TOTAL LIABILITIES $ 244,562 $ 332,636
$ 326,628 $ 238,554
-50-

ACTIVITY
Due to Student Groups 6/30/06
Receipts
Disbursements
Due to Student Groups 6/30/07
Academic Boosters $ 1,219 $ 1,000 $ 2,045 $ 174 Academic Service Learning 1,674 2,200 1,225 2,649 After Prom party 821 ---
9,294 6
3,927 29,632 36,749 -3,190 6,753
--- 2,585 1,865
Benevolence 15 --- 1,536 788
Choir 487 334
5,079 7,040
2009 3,278 4,627 1,399
Counseling
524 5,804
11,842 Elementary Classroom 535 --- 535
5,603 4,880
--- 633
H-H Renaissance Account 1,446
Counseling
524 5,804
11,842 Elementary Classroom 535 --- 535
5,603 4,880
--- 633
H-H Renaissance Account 1,446
--- 821 Alumni Account 46 9,334 Athletic JAVA 174 --- --- 174
Athletic Tournaments Athletic Vending 3,816 8,016 5,079 Band Account 92 1,684 1,771 5 Band Fundraising 1,357 5,985 6,420 922 Band Travels 720
--- 15 Calendar Sales 1,280 2,028 Cheerleaders 753 4,744 5,134 363
908 1,061 Citizens for Education --- 500 383 117
Class of 2006 2,601 --- 540 2,061 2007 7,964 2,846 5,731 2008 4,725 13,883 11,568
6,506 2010 --- 6,433 4,265 65 2,168
2,168
Competitive Grant (JCF) Competitive Grant (JCF) 180 180 --- --- --- --- 180 180 100 100 --- --- --- --- 100 100
Drama Club Drama Club 3,484 3,484 1,969 1,969 1,540 1,540 3,913 3,913 Drop-In Computer Lab Drop-In Computer Lab 308 308 262 262 46 46 Earnings on Investments Earnings on Investments 8,004
8,004
11,888 11,888 14,088 14,088
Educational Fund Grants Educational Fund Grants 109 109 2,897 2,897 2,762 2,762 244 244 Elementary Elementary 16,901 16,901 12,108 12,108 16,635 16,635
--- --- Elementary Field Trips Elementary Field Trips 3,150 3,150 7,333 7,333 Elementary Girls Basketball
Elementary Girls Basketball
6,578
6,578
18,129
18,129
16,790 16,790 7,917
7,917
Elementary Lighthouse Project Elementary Lighthouse Project --- --- 633 633 Elementary Pop Fund Elementary Pop Fund 4,730 4,730 1,447 1,447 470 470 5,707 5,707 Elementary Staff Retirement Elementary Staff Retirement 226 226 --- --- --- --- 226 226 Elementary Student Council Elementary Student Council 3,580 3,580 9,530 9,530 9,846 9,846 3,264 3,264 Entrepreneurial Entrepreneurial --- --- 30 30 --- --- 30 30
H-H Concessions H-H Concessions 5,824 5,824 30 30 390 390 5,464 5,464 3,251 3,251 900 900 2,705 2,705
H-H Music Boosters H-H Music Boosters 22,223 13,023 5,90816,708
Agency Funds
DETAILED STATEMENT OF CHANGES IN ASSETS AND LIABILITIES INTERNAL ACTIVITIES FUND
FISCAL YEAR ENDED JUNE 30, 2007
-51- Karl L. Drake, P.C.

HANOVER - HORTON SCHOOL DISTRICT Agency Funds
DETAILED STATEMENT OF CHANGES IN ASSETS AND LIABILITIES INTERNAL ACTIVITIES FUND
FISCAL YEAR ENDED JUNE 30, 2007
ACTIVITY
Due to Student Groups 6/30/06
Receipts
Disbursements
Due to Student Groups 6/30/07
HS ARC Youth Club 450 4,797 2,497 966 --- 9
2,425 19
HS Cross Country
HS Football 3,665 3,829 HS French Club
HS Human Relations
3,473 2,584
590
--- --- 86 ---
636
--- 6
2,642 4,628 2,866 Independent Living
73 Junior Pro Boys Basketball 1,170 4,258 4,730
97 --- ---
10,634 6 1,272
380 50
2,750 HS Art 957 HS Baseball 18 2,206 237 HS Baton --- --- 19 HS Bottle Refund
952 851 530 1,273
HS Business Manage Class 1,066 7,020 7,402 684 826 2,816 3,782 -140
HS English Dept 500 --- --- 500 385 221 176 15,600 7,054 8,722
2
2,956 1,270 1,647 2,579 HS Journalism 1,762 875 715 1,922 HS Miscellaneous 3,252 3,826 2,899 HS National Honor Society 1,048 2,369 833 HS Portfolio Supplies 590 --- ---
HS Tech Lab 662 124 611 175 HS Ski Club --- --- HS Softball --- 86 HS Spanish Club 236 888 488 HS Student Council 10,675 4,308 6,556 8,427
HS Teacher’s Lounge 974 683 1,221 436 HS Track 44 2,267 1,587 724 HS Web Site Develop 230 --- --- 230 HS Weight Room --- --- --- HS Wrestling --- --- 6
HS Yearbook 4,852 160 50 443 -233
JCF Youth Mini Grant --- --- 73 698
Kids Club 7,428 --- 2,095 5,333
Ladd Scholarship 97 Library Fund 3,920 15,123 15,686 3,357 Loss and Damage 3,980 2,617 11,997
th Grade Basketball Program 2,050 2,713 609 Maintenance Rewards and Recognition --- 430
M. Bytnar Memorial Fund 382 --- --- 382
-52-

ACTIVITY
Due to Student Groups 6/30/06
Receipts
Disbursements
Due to Student Groups 6/30/07
23,583 10,417 49 --- --- --- ---
MS Cheerleading 831 2,288 2,784 335 MS Choir 3,701 3,020
4,681
MS Lego Club 180 ---
5,424 3,105 2,062 6,467 MS Popcorn Repair Fund 423 --- --- 423 MS Rewards 1,611 2,100 2,985 726
MS Running Club 64 1,928 -2 MS Skills Class --- --- 179 MS Student Council 5,943 1,487
--- --- 753 2,413 897
2,000 459 1,000 170 1,289
New Press Box 340 --- 340 Night Lights 2,179 4,778
75 --- 75
Pop Machine 2,802 6,432 6,538 2,696 PTA 7 89 89 7 RIOT Account 846 --- --- 846 Robbie Curtis Charitable 1,004 --- 1,004 Ruth Creps Scholarship 33,173 22,250 13,173
Soccer 2,201 9,661 11,142 720 Student Teacher Fund 390 --- 1,080 Summer Lights 769 --- --- 769 Supplies R Us 4,208 1,430 1,920 3,718
17 1,203
1,000 --- 1,000
Total $ 244,562 $ 326,628 $ 238,554 $ 332,636
MS Activity 8,381 25,619 MS Art Fund 49 MS Class of 2012 499 499
4,000
--- 180 MS Miscellaneous 2,661 2,146 3,063 1,744 MS Pop Machine
1,994 179
5,087 2,343 MS Weight Training 753 MS Yearbook 1,008 2,302
McGee Scholarship L.E. 2,104 2,000 2,104 New Library
--- 5,465 2,866
Destination Imagination ---
--- 2,250
690
Volleyball Boosters 170 1,050
Wall of Fame ---
-53-

HANOVER - HORTON SCHOOL DISTRICT
STATEMENTS OF INDEBTEDNESS
-54-
Karl L. Drake, P.C.
$ 40,869
Balance Outstanding - June 30, 2007
Balance payable as follows:
PRINCIPAL
LOAN YEAR INTEREST RATE INTEREST TOTAL
Comerica Bank
0010-9 2007-08 4.00% $ 10,869 $ 435 $ 11,304
4.15% 14,695
2008-09 4.15% 635 15,940
30,000 1,880 31,880
$ 40,869 $ 2,315 $ 43,184
Hillsdale County National Bank 2007-08
1,245
15,940
15,305
DURANT DEBT
Balance Outstanding - June 30, 2007
$ 43,211
Balance payable as follows:
Year Rate Interest Principal Total
2006 - 07 4.761% $ 2,057 $ 5,345 $ --- 2007 - 08 4.761% 1,804 5,600 ---
1,537 2009 - 10
965 6,439 22,210 4.761%
7,403
2008 - 09 4.761% 5,867 7,404 4.761% 1,257 6,147 7,404
2010 - 11
4.761%
2011 - 12 657 6,746 7,403 2012 - 13 4.761% 336 7,067
$ 8,613 $ 43,211 $ 51,824
-55-
Statements Of Indebtedness
BUS LOANS
YEAR ENDED JUNE 30, 2007
Karl L. Drake, P.C.

HANOVER-HORTON SCHOOL DISTRICT Statements Of Indebtedness
1999 REFUNDING DEBT
YEAR ENDED JUNE 30, 2007
$ 5,880,000
Balance Outstanding - June 30, 2007
Balance payable as follows:
Rate Interest
Year Principal Total
$ 727,450 2008 - 09 243,385 460,000
4.30% 205,185 450,000 655,185
185,835 445,000 2012 - 13 4.40% 440,000
4.50% 147,118 612,118 2014 - 15 4.55% 126,193 460,000 586,193 2015 - 16 4.60% 105,262 455,000 560,262
2016 - 17 4.65% 84,333 450,000 534,333 2017 - 18 4.70% 63,407 450,000 513,407
4.75% 445,000 2019 - 20 4.80% 21,120 440,000 461,120
$ 1,877,318 $ 5,880,000 $ 7,757,318
2007 - 08 4.10% $ 262,450 $ 465,000 4.15% 703,385
2009 - 10 4.20% 224,295 455,000 679,295 2010 - 11
2011 - 12 4.35% 630,835 166,477 606,477
2013 - 14 465,000
2018 - 19 42,258 487,258
-56-

Balance Outstanding - June 30, 2007
$ 1,755,000
Balance payable as follows:
Year Rate Interest Total
Principal
3.50% $ 75,000 $ 149,230 2008 - 09 3.65% 125,000 196,605 2009 - 10 3.85% 155,000 222,043 2010 - 11 4.00% 175,000 236,075
2011 - 12 4.10% 175,000 --- 46,900
2013 - 14 4.25%---
2015 - 16
2016 - 17 4.65% --- 16,275 2017 - 18 4.65% 350,000 366,275
$ 518,428
$ 1,755,000 $ 2,273,428
2007 - 08 $ 74,230 71,605 67,043 61,075
54,075 229,075 2012 - 13 4.25% 46,900
46,900 350,000 396,900 2014 - 15 4.50% 32,025 32,025
4.50% 32,025 350,000 382,025
16,275 16,275
-57-
Statements Of Indebtedness
2002 DEBT
YEAR ENDED JUNE 30, 2007
Karl L. Drake, P.C.

REPORT ON INTERNAL CONTROL OVER FINANCIAL REPORTING AND ON COMPLIANCE
Hanover-Horton School District Horton, Michigan 49246
We have audited the financial statements of the governmental activities, each major fund, and the aggregate remaining fund information of Hanover-Horton School District, as of and for the year ended June 30, 2007, which collectively comprise the Hanover-Horton School District’s basic financial statements and have issued our report thereon dated September 24, 2007. We conducted our audit in accordance with auditing standards generally accepted in the United States of America and the standards applicable to financial audits contained in Government Auditing Standards, issued by the Comptroller General of the United States.
AND OTHER MATTERS BASED ON AN AUDIT OF FINANCIAL STATEMENTS PERFORMED IN ACCORDANCE WITH GOVERNMENT AUDITING STANDARDS
Board of Education
Internal Control Over Financial Reporting
In planning and performing our audit, we considered the District’s internal control over financial reporting as a basis for designing our auditing procedures for the purpose of expressing our opinions on the financial statements, but not for the purpose of expressing an opinion on the effectiveness of the District’s internal control over financial reporting. Accordingly, we do not express an opinion on the effectiveness of Hanover-Horton School District’s internal control over financial reporting.
Our consideration of the internal control over financial reporting was for the limited purpose described in the preceding paragraph and would not necessarily identify all deficiencies in internal control over financial reporting that might be significant deficiencies or material weaknesses. However, as discussed below, we identified certain deficiencies in internal control over financial reporting that we consider to be significant deficiencies.
A control deficiency exists when the design or operation of a control does not allow management or employees, in the normal course of performing their assigned functions, to prevent or detect misstatements on a timely basis. A significant deficiency is a control deficiency, or combination of control deficiencies, that adversely affects the District’s ability to initiate, authorize, record, process, or report financial data reliably in accordance with generally accepted accounting principles such that there is more than a remote likelihood that a misstatement of the District’s financial statements that is more than inconsequential will not be prevented or detected by the District’s internal control. We consider the deficiencies described below to be significant deficiencies in internal control over financial reporting. Audit Adjustments
As part of the audit process, adjusting entries were recommended to management and consequently made to adjust various general ledger balances as of June 30, 2007. These journal entries were necessary in order for the financial statements to be materially correct.
-58-
Karl L. Drake, P.C. Certified Public Accountant 3775 Kimmel Road (517) 937-9333 Phone / 563-2552 FaxHorton, Michigan 49246 Email: [email protected]

A material weakness is a significant deficiency, or combination of significant deficiencies, that results in more than a remote likelihood that a material misstatement of the financial statements will not be prevented or detected by the District’s internal control.
Our consideration of the internal control over financial reporting was for the limited purpose described in the first paragraph of this section and would not necessarily identify all deficiencies in the internal control that might be significant deficiencies and, accordingly, would not necessarily disclose all significant deficiencies that are also considered to be material weaknesses. However, we believe that none of the significant deficiencies described above is a material weakness.
Compliance and Other Matters
As part of obtaining reasonable assurance about whether Hanover-Horton School District’s financial statements are free of material misstatement, we performed tests of its compliance with certain provisions of laws, regulations, contracts and grant agreements, noncompliance with which could have a direct and material effect on the determination of financial statement amounts. However, providing an opinion on compliance with those provisions was not an objective of our audit and, accordingly, we do not express such an opinion.
This report is intended solely for the information and use of management, the Board of Education, and the State of Michigan, and is not intended to be and should not be used by anyone other than these specified parties.
We noted certain matters that we reported to management of the Hanover-Horton School District in a separate letter dated September 24, 2007.
Karl L. Drake, PC Certified Public Accountant September 24, 2007
-59-

Karl L. Drake, P.C. Certified Public Accountant
3775 Kimmel Road (517) 937-9333 Phone / 563-2552 Fax
Horton, Michigan 49246 Email: [email protected]
September 24, 2007
Hanover-Horton School District Horton, Michigan 49246 We have audited the financial statements of Hanover-Horton School District for the year ended June 30, 2007, and have issued our report thereon dated September 24, 2007. In planning and performing our audit of the financial statements, we considered the School District’s internal control structure in order to determine our auditing procedures for the purpose of expressing our opinion on the general-purpose financial statements and not to provide assurance on the internal control structure. The management of Hanover-Horton School District is responsible for establishing and maintaining an internal control structure. In fulfilling this responsibility, estimates and judgements by management are required to assess the expected benefits and related costs of internal control structure policies and procedures. The objectives of an internal control structure are to provide management with reasonable, but not absolute, assurance that assets are safeguarded against loss from unauthorized use or disposition, and that transactions are executed in accordance with management’s authorization and recorded in accordance with United States generally accepted accounting principles. Because of inherent limitations in any internal control structure, errors or irregularities may nevertheless occur and not be detected. Also, projection of any evaluation of the structure to future periods is subject to the risk that procedures may become inadequate because of changes in conditions or that the effectiveness of the design and operation of policies and procedures may deteriorate. Our consideration of the internal control structure would not necessarily disclose all matters in the internal control structure that might be a reportable condition under standards established by the American Institute of Certified Public Accountants. Reportable conditions involve matters coming to our attention relating to significant deficiencies in the design or operation of the internal control structure that, in our judgment, could adversely affect the school’s ability to record, process, summarize and report financial data consistent with the assertions of management in the financial statements.
Board of Education

Therefore, we have prepared the following comments and recommendations to communicate the results of our testing and observations, and to make suggestions to improve upon the existing internal control structure. Financial Overview
The District continues to be in a stable financial position. The State of Michigan has not yet finalized its budget for the next fiscal year, so the status of funding is very much in question. It is important to dramatically limit planned expenditures in the General Fund until the state funding is known.
The General Fund finished the year with a fund balance of $1,609,286. This is a decrease of $155,855 from the prior year balance. This represents a 20% decrease in General Fund fund balance over the last two years. The Cafeteria Fund ended with a fund balance of $104,646, which is an increase of $10,257 over the prior year balance. The fund balance in the debt retirement accounts decreased by $10,020 to $129,087. The capital projects fund ended the year with a fund balance of $41,351.
Future Challenges
The District faces continuing challenges in maintaining its financial stability. Health care costs have been increasing by over 10% per year for several years. This year’s cost will be stable, but cost increases are expected to continue. Also, the mandatory contribution for retirement is increasing. The rate for this past year was 16.34%. The current year has an increase to approximately 17.74%. Future years will continue to increase until the retirement fund is stable. At September 30, 2005, the retirement system had an unfunded actuarial accrued liability of $10 billion, so it will take a major restructuring of the system to bring stability. Many Districts are facing considerable budget and program cuts to maintain financial solvency. Hanover-Horton Schools are in good enough financial position to withstand these increases in the short-term. Maintaining a balanced budget will be a challenge but is important to maintain long-term financial stability. The above comments are intended for the use of the Board of Education and management of the Hanover-Horton School District. This restriction is not intended to limit the distribution of this report, which is a matter of public record. Sincerely,
Karl L. Drake, CPA