Hamstrings muscle anatomyand function, and implications for strain injury · Hamstrings muscle...
181
•
-
Upload
duongthuan -
Category
Documents
-
view
223 -
download
0
Transcript of Hamstrings muscle anatomyand function, and implications for strain injury · Hamstrings muscle...
Loughborough UniversityInstitutional Repository
Hamstrings muscle anatomyand function, and
implications for straininjury
This item was submitted to Loughborough University's Institutional Repositoryby the/an author.
Additional Information:
• A Doctoral Thesis. Submitted in partial fulfilment of the requirementsfor the award of Doctor of Philosophy of Loughborough University.
Metadata Record: https://dspace.lboro.ac.uk/2134/18033
Publisher: c© P. E. Evangelidis
Rights: This work is made available according to the conditions of the Cre-ative Commons Attribution-NonCommercial-NoDerivatives 4.0 International(CC BY-NC-ND 4.0) licence. Full details of this licence are available at:https://creativecommons.org/licenses/by-nc-nd/4.0/
Please cite the published version.
HAMSTRINGS MUSCLE ANATOMY AND FUNCTION, AND
IMPLICATIONS FOR STRAIN INJURY
by
Pavlos E. Evangelidis
A Doctoral Thesis
Submitted in partial fulfilment of the requirements
for the award of
Doctor of Philosophy of Loughborough University
January 2015
© by P. E. Evangelidis 2015
i
ABSTRACT
The main aim of this thesis was to examine hamstrings anatomy and its influence on knee flexor muscle function in healthy young men. A secondary aim was to better understand the implications of hamstrings anatomy and function, and their variability, in relation to the risk of strain injury.
The functional and conventional H:Q ratios (examined up to high angular velocities) as well as the knee joint angle-specific isometric H:Q ratio exhibited good test-retest reliability at joint positions that closely replicated the conditions of high injury risk.
Football players did not exhibit any differences in angle-specific or peak torque H:Q ratios compared to recreationally active controls. Knee extensor and flexor strength, relative to body mass, of footballers and controls was similar for all velocities, except concentric knee flexor strength at 400° s-1 (footballers +40%; P < 0.01).
Muscle volume explained 30-71% and 38-58% of the differences between individuals in knee extensors and flexors torque respectively across a range of velocities. A moderate correlation was also found between the volume of these antagonistic muscle groups (R2= 0.41). The relative volume of the knee extensors and flexors explained ~20% of the variance in the isometric H:Q ratio and ~31% in the high velocity functional H:Q ratio.
Biceps femoris long head exhibited a balanced myosin heavy chain isoform distribution (47.1% type I and 52.9 % total type II) in young healthy men, while BFlh muscle composition was not related to any measure of knee flexor maximal or explosive strength.
Biceps femoris long head proximal aponeurosis area varied considerably between participants (>4-fold) and was not related to biceps femoris long head maximal anatomical cross-sectional area (r= 0.04, P= 0.83). Consequently, the aponeurosis:muscle area ratio exhibited 6-fold variability (range, 0.53 to 3.09; CV= 32.5%). Aponeurosis size was not related to isometric or eccentric knee flexion strength.
The findings of this thesis suggest that the main anatomical factor that contributes to knee flexors function in vivo is hamstrings muscle size, while muscle composition and aponeurosis size do not seem to have a significant influence. The high inter-individual variability of the biceps femoris long head proximal aponeurosis size suggests that a disproportionately small aponeurosis may be a risk factor for strain injury. In contrast, biceps femoris long head muscle composition does not seem to explain the high incidence of strain injuries in this muscle. Quadriceps and hamstrings muscle size imbalances contribute to functional imbalances that may predispose to strain injury and correction of any size imbalance may be a useful injury prevention tool. Finally, regular exposure to football training and match-play does not seem to influence the balance of muscle strength around the knee joint.
Keywords: Hamstrings, anatomy, muscle size, muscle balance, aponeurosis size, muscle composition, hamstrings-to-quadriceps ratio, maximal strength, explosive strength, MRI

ii
Publications
Evangelidis PE, Pain MT, & Folland J. (2015). Angle-specific hamstring-to-quadriceps ratio:
A comparison of football players and recreationally active males. Journal of Sports Sciences,
33(3), 309-19.
Evangelidis PE, Massey GJ, Pain MT, & Folland JP. (2014). Biceps femoris aponeurosis
size: A potential risk factor for strain injury? Medicine and Science in Sports and Exercise,
(Ahead of print), doi: 10.1249/mss.0000000000000550.
Conference proceedings
Evangelidis PE, Massey GJ, Ferguson RA, Wheeler PC, Pain MT, Folland JP. (2014). Biceps
femoris long head myosin heavy chain isoform composition and knee flexion maximal and
explosive strength. Book of abstracts of the 19th annual Congress of the European College of
Sport Science, 2-5 July, Amsterdam, The Netherlands, p. 367.
P.E. Evangelidis, G.J. Massey, M.T.G. Pain, J.P. Folland. (2014). Is biceps femoris long head
aponeurosis size a risk factor for hamstring strain injury? British Journal of Sports Medicine,
48, 591-592.
Evangelidis P.E., Pain M.T.G., Folland J.P. (2013). Angle-specific hamstring-to-quadriceps
ratio. A comparison of football players and recreationally active males. Journal of Sports
Sciences, 32:sup1, s35-s36.

iii
This thesis is dedicated to the memory of my father, Lefteris, for his
lifelong efforts to provide me the best possible education. Thank you, Dad.

iv
ACKNOWLEDGEMENTS
I would like to express my sincere gratitude to my supervisors, Dr Jonathan Folland and Dr Matthew Pain, for giving me the opportunity to undertake this PhD and for their excellent guidance, advice and support during my studies.
The completion of this thesis would have not been possible without the love, care, support, and patience of Maria Korkou, who was there for me in the most difficult time of my life. Words are not enough to express my gratitude.
I would like to express my deepest gratitude to Dr Greg Bogdanis, for his friendship and ongoing support, guidance and advice. He has always been a massive inspiration for me.
I would also like to extend my deepest gratitude to my uncle, Antonis Evangelidis, whose support during my studies was invaluable.
I would like to give special thanks to Garry Massey for his friendship and collaboration during the data collection and analysis for Chapters 5, 6 and 7. It was a pleasure working with him and made the long days in the lab much easier.
I am indebted to all my friends and family who were always supportive and understanding.
I would also like to express my sincere appreciation to the following people:
Dr Patrick Wheeler for conducting the muscle biopsies.
Dr Richard Ferguson for his training and support in the analysis of the muscle samples.
Dr Steph Forrester for her constructive critique of my work during the Annual Review meetings.
Dr Martin Lewis for his assistance with the isokinetic dynamometer and his advice on writing Matlab code.
Daniel Grasso for his support during data collection for Chapters 1 and 2.
Nikos Schoinochoritis for his help with participant recruitment for Chapters 1 and 2.
Dimitris Voukelatos for his useful advice on writing Matlab code.
Finally, I would like to thank all of the volunteers who participated in my studies for their time and effort.
v
TABLE OF CONTENTS
1 CHAPTER 1 - GENERAL INTRODUCTION ................................................................ 2
2 CHAPTER 2 – LITERATURE REVIEW ........................................................................ 7
2.1 INTRODUCTION ..................................................................................................... 7
2.2 PART I – BASIC MUSCLE STRUCTURE AND FUNCTION ............................... 7
2.2.1 Overview of muscle structure ................................................................................ 7
2.2.2 Muscle contraction (Excitation-contraction coupling) .......................................... 8
2.2.3 Muscle composition ............................................................................................... 8
2.2.4 Muscle architecture ................................................................................................ 9
2.2.5 Fundamental muscle mechanics ............................................................................ 9
2.2.5.1 Force-length relationship ............................................................................... 9
2.2.5.2 Force-velocity relationship .......................................................................... 10
2.3 PART II – DETERMINANTS OF MUSCLE FUNCTION .................................... 12
2.3.1 Determinants of maximum strength..................................................................... 12
2.3.1.1 Muscle size and architecture ........................................................................ 12
2.3.1.2 Moment arm ................................................................................................. 14
2.3.1.3 Agonist activation ........................................................................................ 14
2.3.1.4 Antagonist co-activation .............................................................................. 15
2.3.1.5 Muscle composition ..................................................................................... 15
2.3.1.6 Muscle-tendon unit stiffness ........................................................................ 16
2.3.2 Determinants of explosive strength ..................................................................... 18
2.3.2.1 Maximal strength ......................................................................................... 18
2.3.2.2 Agonist activation ........................................................................................ 18
2.3.2.3 Muscle composition ..................................................................................... 19
2.3.2.4 Muscle-tendon unit stiffness ........................................................................ 19
2.4 PART III – HAMSTRINGS ANATOMY AND FUNCTION DURING
SPRINTING ............................................................................................................ 21
2.4.1 Hamstrings anatomy ............................................................................................ 21
2.4.2 Hamstrings function during sprinting .................................................................. 25
2.5 PART IV – HAMSTRINGS STRAIN INJURIES .................................................. 27
2.5.1 Site of injury ........................................................................................................ 27
2.5.2 The inciting mechanism of hamstrings strain injury ............................................ 28
2.5.3 Risk factors .......................................................................................................... 30
Table of Contents
vi
2.5.3.1 Previous injury ............................................................................................. 30
2.5.3.2 Strength imbalances ..................................................................................... 32
2.5.3.3 Hamstrings anatomy .................................................................................... 34
2.5.3.4 Fatigue.......................................................................................................... 35
2.5.3.5 Age ............................................................................................................... 36
2.5.3.6 Flexibility ..................................................................................................... 37
3 CHAPTER 3 – RELIABILITY OF ISOMETRIC AND ISOVELOCITY
HAMSTRINGS-TO-QUADRICEPS RATIO AND STRENGTH MEASURES OF
THE KNEE EXTENSORS AND FLEXORS ................................................................. 39
3.1 INTRODUCTION ................................................................................................... 39
3.2 METHODS .............................................................................................................. 42
3.2.1 Participants ........................................................................................................... 42
3.2.2 Overview .............................................................................................................. 42
3.2.3 Dynamometer Procedures .................................................................................... 42
3.2.4 Torque-velocity relationship assessment ............................................................. 43
3.2.4.1 Isometric strength......................................................................................... 43
3.2.4.2 Concentric and Eccentric strength ............................................................... 43
3.2.5 Torque data analysis ............................................................................................ 44
3.2.6 Knee joint angle ................................................................................................... 44
3.2.7 Isometric Hamstrings-to-Quadriceps ratio ........................................................... 45
3.2.8 Functional Hamstrings-to-Quadriceps ratio ......................................................... 45
3.2.9 Conventional Hamstring-to-Quadriceps ratio ...................................................... 45
3.2.10 Statistics ............................................................................................................... 45
3.3 RESULTS ................................................................................................................ 47
3.3.1 Torque-velocity relationship ................................................................................ 47
3.3.2 Hamstring-to-quadriceps ratios ............................................................................ 48
3.4 DISCUSSION .......................................................................................................... 50
4 CHAPTER 4 – ANGLE-SPECIFIC HAMSTRINGS-TO-QUADRICEPS RATIO.
A COMPARISON OF FOOTBALL PLAYERS AND RECREATIONALLY
ACTIVE MALES .............................................................................................................. 54
4.1 INTRODUCTION ................................................................................................... 54
4.2 METHODS .............................................................................................................. 56
Table of Contents
vii
4.2.1 Participants ........................................................................................................... 56
4.2.2 Overview .............................................................................................................. 56
4.2.3 Dynamometer Procedures .................................................................................... 57
4.2.4 Isometric Peak Torque assessment ...................................................................... 57
4.2.5 Dynamic Peak Torque assessment ....................................................................... 58
4.2.6 Data Analysis ....................................................................................................... 58
4.2.6.1 Peak Torque ................................................................................................. 58
4.2.6.2 Angle-specific torque ................................................................................... 58
4.2.6.3 Knee joint angle ........................................................................................... 59
4.2.6.4 Isometric Hamstrings-to-Quadriceps ratio ................................................... 60
4.2.6.5 Functional Hamstrings-to-Quadriceps ratio ................................................. 60
4.2.6.6 Conventional Hamstrings-to-Quadriceps ratio ............................................ 60
4.2.7 Statistical Analysis ............................................................................................... 61
4.3 RESULTS ................................................................................................................ 62
4.3.1 Anthropometric characteristics ............................................................................ 62
4.3.2 H:Q ratios ............................................................................................................. 62
4.3.3 Angle-specific torque ........................................................................................... 64
4.4 DISCUSSION .......................................................................................................... 68
5 CHAPTER 5 – QUADRICEPS AND HAMSTRINGS RELATIVE MUSCLE
SIZE INFLUENCES KNEE-JOINT STRENGTH BALANCE ................................... 73
5.1 INTRODUCTION ................................................................................................... 73
5.2 METHODS .............................................................................................................. 75
5.2.1 Participants ........................................................................................................... 75
5.2.2 Overview .............................................................................................................. 75
5.2.3 Measurements and Data analysis ......................................................................... 75
5.2.3.1 Dynamometer procedures ............................................................................ 75
5.2.3.2 Isometric Strength ........................................................................................ 76
5.2.3.3 Concentric and eccentric strength ................................................................ 77
5.2.3.4 Magnetic resonance imaging (MRI) ............................................................ 77
5.2.4 Statistical analysis ................................................................................................ 78
5.3 RESULTS ................................................................................................................ 79
5.3.1 Descriptive data for muscle size and strength...................................................... 79
5.3.2 Relationships between muscle size, strength and HQ ratio ................................. 80
Table of Contents
viii
5.4 DISCUSSION .......................................................................................................... 84
6 CHAPTER 6 – DO MUSCLE SIZE AND COMPOSITION EXPLAIN KNEE
FLEXOR MUSCLE FUNCTION IN MAN? .................................................................. 88
6.1 INTRODUCTION ................................................................................................... 88
6.2 METHODS .............................................................................................................. 90
6.2.1 Participants ........................................................................................................... 90
6.2.2 Overview .............................................................................................................. 90
6.2.3 Measurements and Data analysis ......................................................................... 91
6.2.3.1 Torque-velocity relationship ........................................................................ 91
6.2.3.2 Explosive isometric strength ........................................................................ 92
6.2.3.3 Magnetic resonance imaging (MRI) ............................................................ 93
6.2.3.4 Muscle sampling and myosin heavy chain composition .............................. 94
6.2.4 Statistical analysis ................................................................................................ 95
6.3 RESULTS ................................................................................................................ 96
6.3.1 Descriptive data on BFlh MHC isoform distribution, hamstrings muscle size
and knee flexor strength ..................................................................................... 96
6.3.2 Relationships of hamstrings muscle size and BFlh MHC isoform distribution
with knee flexion strength .................................................................................. 97
6.4 DISCUSSION ........................................................................................................ 100
7 CHAPTER 7 – BICEPS FEMORIS APONEUROSIS SIZE: A POTENTIAL
RISK FACTOR FOR STRAIN INJURY? ................................................................... 104
7.1 INTRODUCTION ................................................................................................. 104
7.2 METHODS ............................................................................................................ 106
7.2.1 Participants ......................................................................................................... 106
7.2.2 Overview ............................................................................................................ 106
7.2.3 Measurements and Data analysis ....................................................................... 107
7.2.3.1 Isometric strength....................................................................................... 107
7.2.3.2 Eccentric strength....................................................................................... 108
7.2.3.3 Magnetic resonance imaging (MRI) .......................................................... 109
7.2.4 Statistical analysis .............................................................................................. 111
7.3 RESULTS .............................................................................................................. 112
7.3.1 Descriptive data on size of the MTU components and knee flexor strength ..... 112

Table of Contents
ix
7.3.2 Relationships between the size of the different MTU components ................... 113
7.3.3 Relationships between the size of the MTU components with knee flexor
strength ............................................................................................................. 114
7.4 DISCUSSION ........................................................................................................ 116
8 CHAPTER 8 – GENERAL DISCUSSION ................................................................... 120
8.1 INTRODUCTION ................................................................................................. 120
8.2 Hamstrings muscle function: Replicating the biomechanics of the late swing
phase of sprinting .................................................................................................. 121
8.3 Strength balance around the knee joint and implications for hamstrings strain
injuries ................................................................................................................... 124
8.4 Influence of hamstrings anatomy on muscle function, and potential influence on
injury predisposition .............................................................................................. 126
8.5 Future research ....................................................................................................... 129
9 APPENDICES ................................................................................................................. 131
9.1 APPENDIX A – ISOKINETIC DYNAMOMETRY ............................................ 131
9.1.1 Position and stabilisation ................................................................................... 131
9.1.2 Knee joint alignment and gravity correction ..................................................... 132
9.1.3 Ankle-joint position during knee flexion contractions ...................................... 132
9.1.4 Isovelocity range identification .......................................................................... 133
9.1.5 Angle-specific torque ......................................................................................... 135
9.2 APPENDIX B – FORCE SIGNAL FILTERING .................................................. 138
9.2.1 Explosive isometric contractions ....................................................................... 138
9.3 APPENDIX C – MAGNETIC RESONANCE IMAGING ................................... 139
9.3.1 Scanning parameters .......................................................................................... 139
9.3.2 MR images analysis ........................................................................................... 139
9.3.2.1 Muscle anatomical cross-sectional area and volume ................................. 139
9.3.2.2 BFlh proximal aponeurosis area and BFlh/ST proximal tendon CSA ....... 142
10 REFERENCES ................................................................................................................ 146
x
LIST OF FIGURES
Figure 2.1. Force-length relationship. L0 corresponds to sarcomere optimal length
where maximal actin-myosin overlap occurs and maximal tension is
produced. Total force is the sum of active and passive force components
(adapted from Kandel et al., 2012). .................................................................... 10
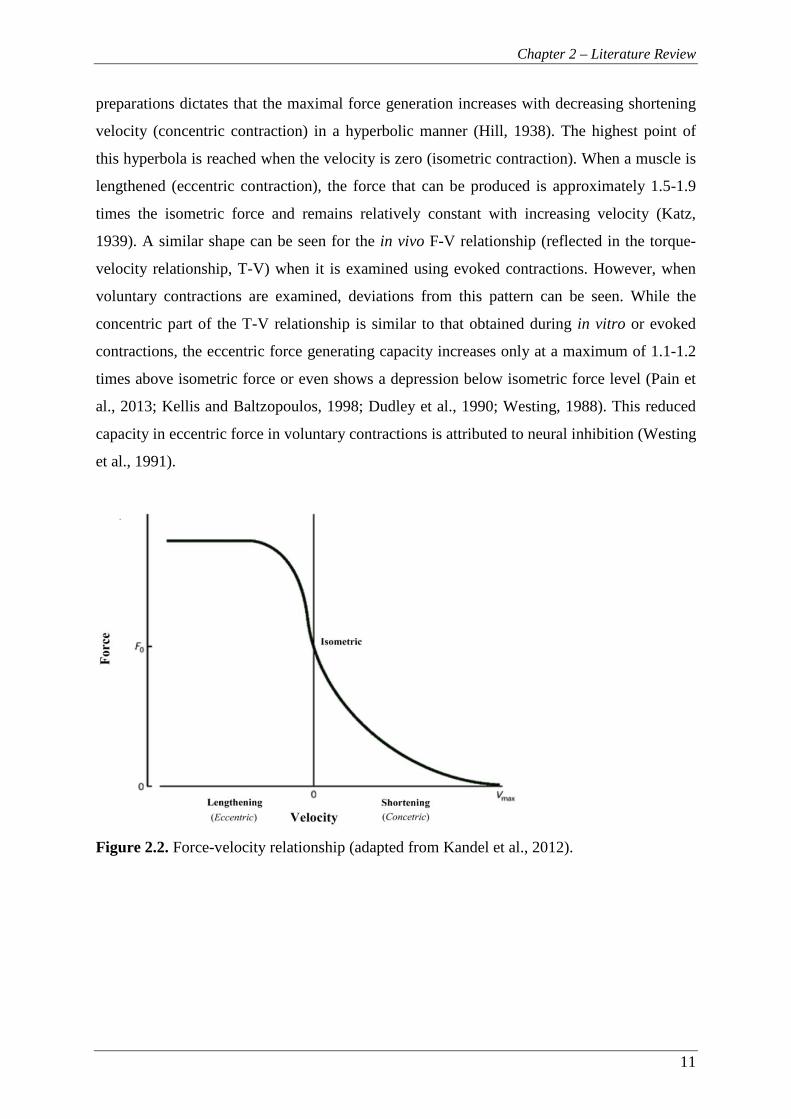
Figure 2.2. Force-velocity relationship (adapted from Kandel et al., 2012). .......................... 11
Figure 2.3. Illustration of the hamstrings muscle group in the right leg (posterior view)
(adapted from Schuenke et al., 2010). ................................................................ 21
Figure 2.4. Individuals with narrow proximal BFlh aponeurosis experience higher
strains (red colour) near the aponeurosis during active lengthening
compared to individuals with wider aponeurosis (adapted from Fiorentino
et al., 2014a). ...................................................................................................... 23
Figure 2.5. Example of the late swing phase during sprinting (A, photo adapted from
AFP/Joe Klamar). Note that, towards the end of the late swing phase, the
leading leg is slightly flexed at the hip (120-140°, 180°= full extension)
and nearly fully extended at the knee joint. During this phase, all
hamstrings muscles reach their peak strains, with BFlh experiencing the
greatest strain (Schache et al., 2012). In addition, computational model
simulations predict that, during the late swing phase, the BFlh peak local
strains are located near the proximal MTJ and increase with running speed
(B, picture adapted from Fiorentino et al., 2014b). These biomechanical
conditions are believed to lead the predisposed athlete to a hamstrings
strain injury (Fiorentino et al., 2014b, Chumanov et al., 2012; Schache et
al., 2012). ............................................................................................................ 29
Figure 4.1. Angle-specific isometric H:Q ratio for footballers (filled squares, n=10) and
controls (open squares, n= 14). Data are presented as mean ± SD. .................... 62
Figure 4.2. Angle-specific functional H:Q ratio for footballers (Fb, filled squares) and
controls (Con, open squares) at: (A) 60° s-1 (Fb, n= 10, Con, n= 14), (B)
240° s-1 (Fb, n= 9; Con, n= 13) and (C) 400° s-1 (Fb, n= 10, Con, n= 14).
Data are presented as mean ± SD. ...................................................................... 63
Figure 4.3. Angle-specific conventional H:Q ratio for footballers (Fb, filled squares)
and controls (Con, open squares) at: (A) 60° s-1 (Fb, n= 10, Con, n= 14),
List of Figures
xi
(B) 240° s-1 (Fb, n= 9; Con, n= 13) and (C) 400° s-1 (Fb, n= 8, Con, n=
10). Data are presented as mean ± SD. ............................................................... 63
Figure 4.4. Non angle-specific functional (squares) and conventional (triangles) H:Q
ratio for footballers (filled symbols, n= 10) and controls (open symbols,
n= 14). Data are presented as mean ± SD. .......................................................... 64
Figure 4.5. Knee extensors angle-specific torque relative to body mass for footballers
(Fb, filled squares) and controls (Con, open squares) at concentric (A) 60°
s-1 (Fb, n= 10; Con, n= 14), (B) 240° s-1 (Fb, n= 9; Con, n= 13), (C) 400°
s-1 (Fb, n= 10; Con, n= 14), and eccentric (D) 60° s-1 (Fb, n= 10; Con, n=
14), (E) 240° s-1 (Fb, n= 9; Con, n= 14), (F) 400° s-1 (Fb, n= 10; Con, n=
14). Data are presented as mean ± SD. ............................................................... 65
Figure 4.6. Knee flexors angle-specific torque relative to body mass for footballers (Fb,
filled squares) and controls (Con, open squares) at concentric (A) 60° s-1
(Fb, n= 10; Con, n= 14), (B) 240° s-1 (Fb, n= 10; Con, n= 14), (C) 400° s-1
(Fb, n= 8; Con, n= 10), and eccentric (D) 60° s-1 (Fb, n= 10; Con, n= 14),
(E) 240° s-1 (Fb, n= 10; Con, n= 14), (F) 400° s-1 (Fb, n= 10; Con, n= 14).
Data are presented as mean ± SD. *: P < 0.01. .................................................. 66
Figure 5.1. Torque-velocity relationship of the knee extensors (open squares) and
flexors (filled squares) in A) absolute values and B) relative to isometric
strength (n= 31). Knee extensors absolute strength was higher than knee
flexors at all velocities (P< 0.001). In contrast, when strength was
normalised to isometric values knee flexors had higher values than knee
extensors at each velocity (-350° s-1, P= 0.016; -50° s-1, P= 0.023; 50° s-1,
P< 0.001; 350° s-1, P< 0.001). ............................................................................ 80
Figure 5.2. Relationships between A) quadriceps and hamstrings muscle volume, B)
quadriceps muscle volume and knee extensor isometric strength and C)
hamstrings muscle volume and knee flexor isometric strength (n= 31). ........... 82
Figure 5.3. Correlations of H:Q volume ratio with A) isometric H:Q ratio, B) functional
H:Q ratio at 50° s-1 and C) functional H:Q ratio at 350° s-1 (n= 31). ................. 83
Figure 6.1. Example sodium dodecyl sulphate (SDS) polyacrylamide gel
electrophoresis separation of the different myosin heavy chain (MHC)
isoforms in biceps femoris long head muscle sampled from 5 participants. ...... 94
List of Figures
xii
Figure 6.2. Knee flexion explosive strength expressed as time from zero to absolute (A)
and relative (B) torque levels. Data are mean ± SD (n= 31) with inter-
individual coefficient of variation (CV) presented at each torque level. ............ 97
Figure 6.3. Relationships between concentric strength at 350° s-1and (A) hamstrings
volume and (B) BFlh total MHC-II isoform content (n= 31). BFlh: biceps
femoris long head, MHC: myosin heavy chain. ................................................. 99
Figure 7.1. Isometric measurements of the knee flexors were made with this custom-
made isometric dynamometer in the joint configuration shown. Isovelocity
torque measurements were made with a Con-Trex isokinetic
dynamometer. ................................................................................................... 108
Figure 7.2. Example MR images of (A) BFlh ACSA (main) and BFlh proximal
aponeurosis to muscle contact distance (inset) and (B) measurement of the
BFlh/ST proximal tendon CSA. ....................................................................... 111
Figure 7.3. Muscle-aponeurosis contact interface distance along the length of the BFlh
muscle (interpolated data every 5% of muscle length). (A) Three
individual participants (Maximum, minimum and typical (mid-range)
aponeurosis area). The circles indicate the relative muscle length where
the aponeurosis width measurement was performed on each individual.
(B) Group mean + SD. ...................................................................................... 112
Figure 7.4. A scatter plot of BFlh proximal aponeurosis area and BFlh ACSAmax (n=
30). The individuals with the lowest and highest aponeurosis size (7.5 vs.
33.5 cm2; >4-fold difference), had very similar sized BFlh muscles
(ACSAmax, 14.1 vs. 13.3 cm2) and thus aponeurosis:muscle size ratios of
0.53 vs. 2.52. ..................................................................................................... 113
Figure 7.5. Scatter plots between knee flexors isometric strength and (A) BFlh
ACSAmax, (B) BFlh proximal aponeurosis area and C) BFlh/ST proximal
tendon CSA (n= 30). ......................................................................................... 115
Figure 9.1. Hip joint angle of A) 120° (180°= full extension) replicating the late swing
phase of sprinting and adopted in this thesis) and B) 95° which is typically
used in knee joint isokinetic dynamometry testing. ......................................... 131
Figure 9.2. Example of the ankle-joint position during maximal knee flexion
contraction. Participants were instructed to maintain a dorsiflexed ankle
joint in order to control for the contribution of gastrocnemius to the knee
flexor torque. .................................................................................................... 133
List of Figures
xiii
Figure 9.3. Example of the torque (blue), crank velocity (green) and crank angle (red)
raw data during knee extensors concentric (Con) and eccentric (Ecc)
isokinetic contractions at 60, 240 and 400° s-1. The isovelocity data within
±10% of the prescribed crank velocity was identified by removing the
acceleration and deceleration phases (grey areas). ........................................... 134
Figure 9.4. Example of the torque (blue), crank velocity (green) and crank angle (red)
raw data during knee flexors concentric (Con) and eccentric (Ecc)
isokinetic contractions at 60, 240 and 400° s-1. The isovelocity data within
±10% of the prescribed crank velocity was identified by removing the
acceleration and deceleration phases (grey areas). ........................................... 135
Figure 9.5. Example of Gaussian fitting on raw knee extensor concentric (Con) and
eccentric (Ecc) isovelocity strength data at 60, 240 and 400° s-1. .................... 136
Figure 9.6. Example of Gaussian fitting on raw knee flexor concentric (Con) and
eccentric (Ecc) isovelocity strength data at 60, 240 and 400° s-1. .................... 137
Figure 9.7. The force signal during knee flexors explosive isometric contractions was
filtered with a 4th order Butterworth filter with a low pass cut-off filter of
500 Hz (A). The inclusion of frequencies up to 500 Hz provided a
reference envelope that facilitated the accurate and reliable identification
of the force onset. In contrast, application of a low frequency smoothing
filter (e.g. 100-point moving average, B) would result in an asymptotic
curve, making the identification subjective and unreliable (adapted from
Tillin et al., 2013). ............................................................................................ 138
Figure 9.8. A-D) Example of (left) hamstrings muscles (biceps femoris long head (red),
biceps femoris short head (orange), semitendinosus (yellow),
semimembranosus (green)) segmentation in magnetic resonance images at
20, 40, 60 and 80% of hamstrings length (defined as the distance from the
most proximal to the most distal image in which hamstrings were
identified). E) Three-dimensional reconstruction of the hamstrings
muscles (posterior view of the left leg). ........................................................... 140
Figure 9.9. Example of hamstrings muscle volume calculation. Cubic spine
interpolation was used to interpolate the muscle cross-sectional area
(CSA) between the analysed magnetic resonance images and volume was
calculated as the area under curve (grey area). BFlh: biceps femoris long

List of Figures
xiv
head, BFsh: biceps femoris short head, ST: semitendinosus, SM:
semimembranosus. ........................................................................................... 141
Figure 9.10. Example of biceps femoris long head (right) proximal muscle-aponeurosis
contact interface distance delineation at 20, 40, 60 and 80% of proximal
aponeurosis length. ........................................................................................... 142
Figure 9.11. Muscle-aponeurosis contact interface distance along the length of the BFlh
muscle (interpolated data every 5% of muscle length). Data presented as
group mean + SD. ............................................................................................. 143
Figure 9.12. Example MR image of the BFlh/ST proximal tendon CSA. ............................ 144

xv
LIST OF TABLES
Table 2.1. Hamstrings muscles architectural data derived from cadaveric studies
(Kellis et al., 2012, 2010, 2009; Ward et al., 2009; Woodley and Mercer,
2005). ............................................................................................................. 24
Table 3.1. Isometric peak torque for knee extensors and flexors presented as mean ±
SD with the respective reliability measures (n= 9). ....................................... 47
Table 3.2. Isovelocity peak torque for knee extensors and flexors for each
measurement session presented as mean ± SD with the respective
reliability measures (n= 9). ............................................................................ 48
Table 3.3. Isometric H:Q ratio presented as mean ± SD for each measurement
session with the respective reliability measures (n= 9). Different from
165°, * P< 0.05 .............................................................................................. 49
Table 3.4. Conventional and functional ratio at different angular velocities measured
during two repeated measurement sessions together with the respective
reliability measures. Data are presented as mean ± SD (n= 9). ..................... 49
Table 4.1. P-values, confidence intervals (CI) and effect sizes for the differences
between footballers (Fb) and controls (Con). ................................................ 67
Table 5.1. Descriptive data of the quadriceps and hamstrings muscle size
measurements and the hamstrings-to-quadriceps muscle size ratio (H:Q)
(n= 31). ........................................................................................................... 79
Table 5.2. Bivariate correlations coefficients between quadriceps and hamstrings
muscle volume with knee extensors and flexors maximal isometric,
concentric and eccentric strength (n= 31). * P< 0.01, ** P< 0.001............... 81
Table 6.1. Descriptive data of biceps femoris muscle composition, hamstrings
muscle volume, and knee flexor strength. The muscle volumes of the
constituent muscles were compared to BFlh, and maximal strength
measures were compared to isometric strength. * P< 0.05, ** P< 0.01 ........ 96
Table 6.2. Bivariate correlation coefficients of knee flexor maximal strength with
hamstrings muscle volume and biceps femoris long head muscle
composition (n= 31). MHC: myosin heavy chain, ** P< 0.01, † P< 0.001 .. 98
Table 6.3. Bivariate correlation coefficients between knee flexor explosive strength
(absolute and relative) measures with hamstrings muscle volume and
List of Tables
xvi
biceps femoris long head composition. (n= 31). MHC: myosin heavy
chain, * P< 0.05 ............................................................................................. 98
Table 7.1. Bivariate correlations (r-values) between the size of the hamstrings
muscle group and different components of the biceps femoris long head
muscle-tendon unit with knee flexor isometric (n= 30) and eccentric (n=
29) strength. ACSAmax, maximal anatomical cross-sectional area; CSA,
cross-sectional area. * P< 0.05, ** P< 0.01. ................................................ 114

1
Chapter 1
General Introduction

Chapter 1 - General Introduction
2
1 CHAPTER 1 - GENERAL INTRODUCTION
High-speed running and jumping are integral to human locomotion and sports participation.
The hamstrings muscle group, as the primary knee flexor and a major hip extensor, plays a
leading role in these activities (Schache et al., 2014; Novacheck, 1998; Baratta et al., 1988).
Furthermore, an active hamstrings muscle group provides dynamic knee joint control and
stability, and thus it is necessary for maintaining joint integrity. Despite these important roles
of the hamstrings there is limited knowledge about precise details and inter-individual
differences in hamstrings anatomy and how these influence function in vivo. Hamstrings
exhibit a notorious susceptibility to strain injuries, which are consistently reported as the most
prevalent injury in sports that involve high-speed running or sprinting (12-17% of all injuries:
Alonso et al., 2012; Ekstrand et al., 2011a, 2011b; Orchard and Seward, 2002). The impact of
hamstrings strains on the affected athletes is further emphasized by the 12-40% recurrence
rate (Alonso et al., 2012; Ekstrand et al., 2011a, 2011b; Elliot et al., 2011; Verrall et al.,
2006; Woods et al., 2004; Orchard and Seward, 2002). These alarming epidemiological data
expose the limited current understanding of the aetiology, prevention and treatment of
hamstrings strain injuries, which require fundamental knowledge about hamstrings anatomy
and function.
Whilst the exact time at which non-contact hamstrings strain injury occurs remains debatable
(Chumanov et al., 2012; Orchard, 2012), it is believed that strains occur during the late swing
phase of sprinting (Chumanov et al., 2012; Schache et al., 2012), when the biarticular
hamstrings are at their peak stretch and exert high forces eccentrically to decelerate the
forward movement of the shank prior to ground contact. The muscle most often injured is the
biceps femoris long head (BFlh), often at its proximal myotendinous junction (MTJ)
(Koulouris and Connell, 2003; De Smet and Best, 2000).
Over recent decades, a large number of investigations have strived to determine the risk
factors that predispose people to hamstrings strains. Although a plethora of risk factors have
been suggested, only two are supported by substantial scientific evidence; the history of
hamstrings injury (Hagglund et al., 2013; Gabbe et al., 2006; Orchard, 2001) and age
(Arnason et al., 2004; Orchard, 2001). Strong evidence also exists for the muscle strength
imbalances (unilateral and bilateral) as a risk factor (Croisier et al., 2008) yet there is still
some controversy (Bennell et al., 1998). Other proposed risk factors include reduced
Chapter 1 - General Introduction
3
flexibility, hamstrings anatomy, fatigue and ethnicity (Opar et al., 2012); however, the
existing evidence for these is inconclusive. It is commonly speculated that hamstrings
anatomy contributes to their susceptibility to injury, yet there is a surprising lack of
experimental data to substantiate these speculations. In addition, the structure-function
relationship for the hamstrings working in vivo has received relatively little attention.
Abnormalities in hamstrings morphology subsequent to injury, such as atrophy and persistent
scar tissue (Silder et al., 2008), may preclude the valid investigation of structure and function
relationships in previously injured individuals. Therefore, a first step would be to investigate
the interrelations between hamstrings anatomy and function in a normal, uninjured
population. The main aim of this thesis was to examine hamstrings anatomy and its influence
on knee flexor muscle function in vivo within normal, young individuals. A secondary aim
was to better understand the implications of hamstrings anatomy and function, and their
variability, in relation to the risk of strain injury. A particular focus of this thesis was the
BFlh muscle-tendon unit (MTU), due to its vulnerability to strain injuries.
There is a long-standing belief that individuals with weak knee flexors relative to extensors
are at an increased risk for hamstrings strains (Croisier et al., 2008; Heiser et al., 1984). The
reciprocal strength balance of the muscles around the knee joint is routinely monitored with
the hamstrings-to-quadriceps (H:Q) ratio derived from the peak isometric or dynamic torque
values of joint extensors and flexors. Despite the wide use of the H:Q ratio as a potential risk
factor for strain injury, it is usually obtained in conditions that ignore the biomechanical
conditions related to strain injuries. During the late swing phase of sprinting, the hip joint is
flexed at ~120-140° (Guex et al., 2012; Novacheck, 1998), while the knee joint angular
velocity is very high (>1200° s-1, Higashihara et al., 2010). Simulating these conditions, to
the greatest possible extent, in the assessment of the H:Q ratio would provide a more
meaningful measure of the reciprocal strength balance at the knee joint. In addition, no study
to date has accounted for the discrepancy between the knee joint angle and crank angle that
occurs during isometric testing. It has been shown that this discrepancy can be up to 20° for
knee extension (Tsaopoulos et al., 2011; Arampatzis et al., 2004), whilst a similarly large
difference may be present for knee flexion resulting in a total offset in the assessed knee joint
angle between knee extensors and flexors of up to 40°. Finally, even though the H:Q ratio is
often calculated over a range of velocities, its reliability at high velocities has yet to be
examined. The development of a testing protocol that addresses the aforementioned
limitations would be expected to improve the ecological validity of the H:Q ratio. However, it
Chapter 1 - General Introduction
4
is important to first establish the reliability of such a protocol. The aim of the first study was
to evaluate the inter-session reliability of the isometric (angle-specific) and isovelocity
(functional and conventional) H:Q ratios using a protocol that included muscle function
measurements with high angular velocities, and joint positions and muscle actions that
closely replicate those of high injury risk. This involved first the assessment of the reliability
of the knee flexors and extensors torque measurements across the torque-velocity relationship
(Chapter 3).
Whilst footballers are particularly affected by hamstrings strain injuries (Ekstrand et al.,
2011a; Woods et al., 2004), the findings in the literature are inconclusive regarding the
influence of football participation on H:Q ratio, although there is some evidence to suggest a
disproportionate development of either the knee extensors (Iga et al., 2009) or flexors
(Fousekis et al., 2010; Cometti et al., 2001). To date all studies in footballers have examined
the H:Q ratio using the peak torque of the reciprocal muscle groups for its calculation. This
approach ignores the fact that knee extensors and flexors exert their peak torque at different
knee joint angles (~115° and ~150° respectively, Knapik et al., 1983), which may reduce the
validity of the H:Q ratio to assess the antagonistic muscle function at the more extended knee
joint angles where hamstrings strains are thought to occur. It is possible that a hazardous
muscle strength imbalance may be angle-specific and more pronounced at the extended knee
joint positions. The aim of the second study was to compare the angle-specific H:Q ratios
between football players and recreationally active controls up to high angular velocities
(Chapter 4).
Despite the extensive use of the H:Q ratio, there is limited knowledge of the factors that
influence this ratio. Muscle size is a primary determinant of maximal strength (Fukunaga et
al., 2001), and it would be expected that the relative size of antagonistic muscles, such as
quadriceps and hamstrings, would directly influence their respective strength balance.
However, to date the association between quadriceps and hamstrings muscle size has not
been directly examined and the only two studies that have examined the influence of the H:Q
muscle size ratio on their strength ratio did not find any relationship (Akagi et al., 2014,
2012). However, they only examined the isometric H:Q ratio which may not reflect the
distinct function of the reciprocal muscles during late swing phase in sprinting. The aim of
the third study was to examine the relationship between knee extensors (quadriceps) and
flexors (hamstrings) muscle size, the association of each muscle’s size with its strength, and

Chapter 1 - General Introduction
5
investigate if the muscle size ratio was related to the isometric and functional strength ratios
(Chapter 5).
An aspect of the hamstrings anatomy that has often been speculated to contribute to strain
injuries is muscle composition. However, the only existing data on BFlh muscle composition
are derived solely from cadavers (Dahmane et al., 2006; Garrett et al., 1984; Johnson et al.,
1973). In a much-cited study, Garret et al. (1984) reported that the hamstrings of a small
number of cadavers had a ‘high proportion’ of type II fibres in the hamstrings (54.5%)
compared to other leg muscles (quadriceps, 51.9%; adductor magnus, 44.8%) and suggested
that this may contribute to their susceptibility to injury. However, vastus lateralis, an
antagonist muscle to BFlh, has been found to contain a greater proportion of type II fibres
within a large cohort of physically active, young men (66.1%; Staron et al., 2000); yet it does
not exhibit a high frequency of strain injuries. In addition, as hamstrings muscle composition
has only been determined within cadavers, its influence on knee flexor maximal and
explosive strength remains unknown. The aim of the fourth study was to determine the BFlh
myosin heavy chain (MHC) isoform distribution and to examine the association of
hamstrings muscle size and BFlh MHC composition with knee flexor strength, including
maximal strength measurements across the torque-velocity relationship (concentric, isometric
and eccentric) as well as explosive isometric strength (Chapter 6).
Recently, two studies calculated higher localised tissue strains for individuals with a narrow
BFlh proximal aponeurosis using computational modelling and dynamic MR imaging and
suggested that individuals with a narrow aponeurosis are at an increased risk of strain injury
due to the increased strains near the proximal BFlh MTJ (Fiorentino et al., 2012; Rehorn and
Blemker, 2010). Further, a preliminary report from the same research group (Handfield et al.,
2010) suggested that the width of the BFlh proximal aponeurosis was highly variable
between individuals and unrelated to the size of the BFlh muscle. These results suggest,
counterintuitively, that within the BFlh MTU, the size of the force generator (muscle) is not
proportional to the size of the force transmitter (aponeurosis). The aim of the fifth study was
to examine the relationship of BFlh proximal aponeurosis area with muscle size (maximal
anatomical cross-sectional area and volume) and knee flexor strength (isometric and
eccentric) (Chapter 7).

6
Chapter 2
Literature Review
Chapter 2 – Literature Review
7
2 CHAPTER 2 – LITERATURE REVIEW
2.1 INTRODUCTION
This review is divided into four main parts; the first part gives a brief description of the
muscle apparatus and its fundamental properties, as expressed at the sarcomere- and in vivo
level. The following part presents the morphological and neural factors that determine muscle
function. The third part gives a description of the anatomy of the hamstrings muscle group,
while it also describes the function of hamstrings during sprinting, the activity during which
the majority of strain injuries occur. The final part of this review describes and discusses the
problem of the hamstrings strain injuries.
2.2 PART I – BASIC MUSCLE STRUCTURE AND FUNCTION
2.2.1 Overview of muscle structure
Skeletal muscles are designed to produce force for human locomotion and skeletal support.
Their structure exhibits a high level of organisation from the molecular to the whole-muscle
level. The smallest functional unit of muscle is the sarcomere which is composed primarily of
myosin and actin proteins and the interaction of these proteins is responsible for the
production of force. Chains of sarcomeres form the myofibrils which are grouped into muscle
fibres by the endomysium. Each muscle fibre contains thousands of sarcomeres in series (a
hamstrings’ muscle fibre contains ~43,000 sarcomeres in series; Enoka, 2002), while the
number of fibres contained within a muscle varies from a few hundreds up to >1,000,000
(Enoka, 2002). Bundles of muscle fibres are surrounded by the perimysium and form the
muscle fascicles. In turn, muscle fascicles are grouped together with the epimysium to form
the muscle. Endomysium, perimysium and epimysium are layers of non-contractile
connective tissue composed of collagen that also assist in force transmission (Huijing, 1999).
Finally, muscles are attached through their aponeuroses and tendons onto the skeleton.
Similar to the layers of connective tissue that envelop the muscle, tendons and aponeuroses
also consist of collagen. In the examination of muscle function in vivo, the smallest functional
unit is a muscle along with its tendons, collectively described as the muscle-tendon unit
(MTU).

Chapter 2 – Literature Review
8
2.2.2 Muscle contraction (Excitation-contraction coupling)
Muscle contraction is initiated upon arrival of a propagating neural impulse (action potential)
from the motor neurons and through the neuromuscular junction (via the neurotransmitter
acetylcholine) onto the muscle fibre membrane (sarcolemma). The action potential causes
depolarisation of the sarcolemma and propagates longitudinally along the fibre length and
transversely into the muscle cell, via the transverse tubules (T-tubules). As the action
potential travels through the T-tubules, it causes Ca2+ to be released from the sarcoplasmic
reticulum into the muscle cell. The released Ca2+ then binds onto the specialised area of the
troponin and causes the troponin-tropomyosin complex to move and reveal the active sites on
the actin filaments. Then, the already energised myosin heads - through hydrolysis of their
adenosine triphosphate (ATP) molecule - bind to the exposed active sites and form the cross-
bridges. The stored energy from the ATP hydrolysis is then released causing a rotation of the
myosin heads, called power stroke. The power stroke generates force causing the actin
filament to slide towards the centre of the sarcomere and the sarcomere to shorten (sliding
filament theory). Following the power stroke, a new ATP molecule binds onto the myosin
heads which then detach from the initial active sites and are ready to attach on new ones
further along the fibre, forming new cross-bridges. This cycle continues as long as the
concentration of the intracellular Ca2+ remains elevated. When the action potential generation
ceases, the intracellular Ca2+ returns back to the sarcoplasmic reticulum and the contraction
ends.
2.2.3 Muscle composition
Muscle fibres can be classified according to their structural and functional properties. A
commonly used histochemical method classifies fibres according to their myofibrillar
ATPase activity into three main (I, IIA, IIX) and four intermediate (IC, IIC, IIAC, IIAX)
types (Staron and Hikida, 1992). The more recent electrophoretic method separates and
quantifies the different myosin heavy chain (MHC) isoforms. In human muscles, three main
(MHC-I, MHC-IIA, MHC-IIX) and two hybrid (MHC-I-IIA, MHC-IIA-IIX) isoform types
have been identified (Bottinelli and Reggiani, 2000). In vitro examination has shown that the
maximum shortening velocity is ~4-fold greater in fibres expressing MHC-IIX isoform
compared to fibres with MHC-I, while the maximum shortening velocities of the intermediate
fibres fall within this range (Bottinelli et al., 1999). However, there is a degree of overlap in
shortening velocities within the continuum of MHC isoforms. Similarly, fibres with MHC-

Chapter 2 – Literature Review
9
IIX isoforms produce ~1.5-fold greater specific tension and >8-fold greater power than type I
fibres (Bottinelli et al., 1996), with the MHC-IIA fibres being intermediate. Further, MHC-II
fibres exhibit also ~6-fold greater rate of force development than MHC-I (Harridge et al.,
1996). Although MHC isoform content is a main determinant of function in vitro, its
influence on muscle function in vivo is unclear (discussed further in 2.3.1.5 & 2.3.2.3).
2.2.4 Muscle architecture
Architecture of a muscle is the internal arrangement of its fibres. Muscle fibres can be
arranged in series, in parallel and at an angle relative to the muscle’s line of action. The
arrangement of sarcomeres in series and, thus longer fibre length, facilitates maximal
excursion and shortening velocity, while the arrangement of sarcomeres in parallel (i.e.
increased number of cross-bridges in parallel) is optimal for greater force production. Finally,
the arrangement of the muscle fibres at an angle relative to the muscle’s line of action
(pennation angle) is a trade-off between the force that can effectively be transmitted to the
line of action (as a function of the cosine of the pennation angle) and the number of fibres
that can be accommodated within a given muscle volume. It has been shown that the
optimum pennation angle is 45° (Alexander and Vernon, 1975), however the majority of the
human muscles exhibit a pennation angle that does not exceed 30° at rest.
2.2.5 Fundamental muscle mechanics
2.2.5.1 Force-length relationship
The magnitude of force produced by a sarcomere is determined by the number of cross-
bridges formed and power strokes performed at any particular moment in time. The number
of cross-bridges that can be formed is dictated by the degree of overlap between myosin and
actin filaments (Gordon et al., 1966). The highest amount of force can be generated when this
overlap is maximal and corresponds to a relatively narrow range of optimal sarcomere
lengths (plateau region, Fig. 2.1). If the sarcomere is stretched beyond the plateau region
(descending limb), then the myosin-actin overlap is reduced, fewer cross-bridges can be
formed and, consequently, less force can be produced. Similarly, if the sarcomere length is
shorter than optimal (ascending limb), the interaction between myosin and actin filaments
becomes less efficient as the actin filaments move across the centre of the sarcomere and
overlap with the actin filaments of the opposite side.

Chapter 2 – Literature Review
10
Figure 2.1. Force-length relationship. L0 corresponds to sarcomere optimal length where
maximal actin-myosin overlap occurs and maximal tension is produced. Total force is the
sum of active and passive force components (adapted from Kandel et al., 2012).
The force-length (F-L) relationship of a whole muscle is smoother than that obtained from
single fibres and sarcomeres due to the non-uniform sarcomere lengths. Similarly, at the in
vivo level, the F-L relationship (reflected in the torque-length relationship, T-L) has a broader
shape compared to the F-L. In addition to the non-uniform sarcomere lengths, the difference
in the shape of T-L is due to the geometry of the tendons with which the muscle attaches onto
the skeleton, the resultant moment arms and the contribution of other muscles. At muscle
lengths longer than the optimal, the force produced is not solely due to the interaction of
myosin and actin filaments (active force); rather, large structural proteins within the
sarcomeres (titin), as well as the connective tissue (i.e. epimysium, perimysium,
endomysium) and the cytoskeleton provide tension upon stretching (passive force) which
increases at longer muscle lengths. The T-L relationship is obtained through maximal
voluntary isometric contractions at different angles over the range of motion of the joint in
examination.
2.2.5.2 Force-velocity relationship
Whilst the F-L relationship describes how changes in muscle length influence force
generation, the force-velocity (F-V) relationship considers the influence of contraction
velocity on muscle force (Fig. 2.2). The F-V relationship examined in isolated muscle
Chapter 2 – Literature Review
11
preparations dictates that the maximal force generation increases with decreasing shortening
velocity (concentric contraction) in a hyperbolic manner (Hill, 1938). The highest point of
this hyperbola is reached when the velocity is zero (isometric contraction). When a muscle is
lengthened (eccentric contraction), the force that can be produced is approximately 1.5-1.9
times the isometric force and remains relatively constant with increasing velocity (Katz,
1939). A similar shape can be seen for the in vivo F-V relationship (reflected in the torque-
velocity relationship, T-V) when it is examined using evoked contractions. However, when
voluntary contractions are examined, deviations from this pattern can be seen. While the
concentric part of the T-V relationship is similar to that obtained during in vitro or evoked
contractions, the eccentric force generating capacity increases only at a maximum of 1.1-1.2
times above isometric force or even shows a depression below isometric force level (Pain et
al., 2013; Kellis and Baltzopoulos, 1998; Dudley et al., 1990; Westing, 1988). This reduced
capacity in eccentric force in voluntary contractions is attributed to neural inhibition (Westing
et al., 1991).
Figure 2.2. Force-velocity relationship (adapted from Kandel et al., 2012).
Chapter 2 – Literature Review
12
2.3 PART II – DETERMINANTS OF MUSCLE FUNCTION
2.3.1 Determinants of maximum strength
Maximum strength is the capacity of the muscles to produce maximal force (or torque).
Maximal strength is influenced by a number of structural and neural factors. This section will
give an overview of the main factors that determine maximal strength.
2.3.1.1 Muscle size and architecture
As muscle force in vitro is directly related to the number of contracting sarcomeres in
parallel, it can be assumed that muscle size is the primary determinant of maximal strength in
vivo. Examination of this relationship has shown that various indices of muscle size
(specifically anatomical cross-sectional area (ACSA), physiological cross-sectional area
(PCSA) or volume), explain a substantial proportion of the inter-individual variability in
maximal isometric (elbox flexors, R2=0.58, Akagi et al., 2009; plantar flexors, R2= 0.42,
Bamman et al., 2000; quadriceps, R2= 0.35, Maughan et al., 1983), concentric (plantar
flexors, R2= 0.22-0.24, Baxter and Piazza, 2014; quadriceps R2= 0.39-0.74, Blazevich et al.,
2009; hamstrings, R2= 0.31-0.41, Masuda et al., 2003) and eccentric (knee extensors R2=
0.35-0.46, knee flexors, R2= 0.47-0.48, Carvalho et al., 2012) strength of various muscles.
Nevertheless, there is no consensus to which index of muscle size is a better predictor of
maximal strength. The effective PCSA, which represents the total cross sectional area of all
muscle fibres and also accounts for any angulation between the fibres and muscle’s line of
action, is considered as the most theoretically appropriate measure of muscle size, as it best
accounts for the muscle architecture. Yet, muscle volume and anatomical cross-sectional area
have been found to be better determinants of maximal strength in vivo (Blazevich et al., 2009;
Fukunaga et al., 2001; Bamman et al., 2000). This may be due to the difficulty of accurately
measuring the architectural parameters needed for the calculation of PCSA as the
measurement of muscle volume, pennation angle and fascicle length are required.
Despite the relationship between muscle size and maximal strength, current data show a large
variation in the strength of this relationship, while a substantial portion (26-78%) of the inter-
individual differences in strength remains unexplained. Therefore, other variables are likely
to contribute to differences in maximal strength, including muscle architecture (Aagaard et
al., 2001), moment arm (Baxter and Plazza, 2014; Blazevich et al., 2009), agonist neural
Chapter 2 – Literature Review
13
activation (Westing et al., 1990) and antagonist co-activation (Kellis and Baltzopoulos,
1998).
Pennation angle (PA) is related to muscle size (Ikegawa et al., 2008; Kawakami et al., 2006;
Aagaard et al., 2001; Kawakami et al., 1993). For example, Kawakami et al. (2006) examined
the relationship between PA and muscle thickness for triceps brachii, vastus lateralis and
gastrocnemius muscles in 711 men and women (age: 3-94 years) and found that PA inter-
individual differences explained 31-66% of the differences in muscle thickness. This positive
correlation between PA and muscle size reflects the fact that a greater PA allows for more
muscle fibres to be accommodated within the same muscle volume (Kawakami et al., 1993),
even though some of the force of the fibres is not resolved along the line of action of the
aponeurosis/tendon (according to the cosine of the PA). This beneficial effect of increasing
PA on isometric strength is thought to only exist up to a PA of 45º after which the loss of
force resolved to the tendon exceeds any gains in force production from the fibres (Alexander
& Vernon, 1975). Also, muscle contraction causes the muscle fibres to rotate and for a given
muscle shortening the fibres shorten less and thus they operate at a length closer to their
optimal. Finally, as the muscle fibres shorten less due to the fibre rotation (relative to their
insertion point), they also shorten at a lower velocity relative to the total muscle shortening
velocity and according to the F-V relationship, this facilitates the production of near-maximal
forces.
Fascicle length (FL) also influences the muscle’s force production capacity. A muscle with
longer fascicles has more sarcomeres in-series and, therefore, has a higher maximal
shortening velocity, while it can produce near-maximal forces over a greater muscle length
range (Lieber and Friden, 2000). Experimental data showed that FL was related with sprint
performance (Abe et al., 2001, 2000; Kumagai et al., 2000). In a study by Abe et al. (2000),
sprinters exhibited greater FL compared to distance runners and controls. In another study,
Kumagai et al. (2000) showed that longer FL of vastus lateralis and gastrocnemius muscles
were significantly related to 100-m sprint performance (r= -0.40 to -0.57, P< 0.05). These
authors suggested two possible mechanisms by which FL increases power and consequently
sprint performance. First, longer FL increases shortening velocity and as power is the product
of muscle force exerted by shortening velocity, longer FL would increase power. Second, at a
given shortening velocity the sarcomeres of longer FL would shorten less over a range of
motion and, therefore, they would operate closer to their optimum length. This would result
in increased force production at that velocity which, in turn, would result in increased power

Chapter 2 – Literature Review
14
production. These findings suggest that FL may facilitate higher force production at higher
velocities. However, further research is needed to elucidate the influence of FL on maximal
isometric and dynamic strength.
2.3.1.2 Moment arm
The torque produced by a muscle is the product of the muscle force applied and the
perpendicular distance between the joint centre of rotation and the line of muscle action.
Therefore, it can be assumed that moment arm is a determinant factor of maximal strength.
However, the existing data are mixed as Blazevich et al. (2009) reported a significant
correlation between moment arm and maximal isometric (r= 0.50) but not concentric knee
extensor torque (r= 0.43-0.44) in a mixed cohort of young men and women (n= 19). Also,
when muscle volume was introduced into a regression analysis with moment arm, it did not
improve the prediction of maximal isometric torque (Blazevich et al., 2009). In contrast,
Baxter and Piazza (2014) found that, within 20 young men, plantar flexor moment arm was
significantly related with isometric (r= 0.56) and concentric torque at various velocities (r=
0.66–0.69) and these correlations were similar or stronger than the correlations between
plantar flexor volume and torque (r= 0.47–0.57). Based on these results, the authors argued
that moment arm was at least as important a determinant of maximal strength as muscle
volume.
2.3.1.3 Agonist activation
Electromyography (EMG) and electrical stimulation studies have shown that even during
maximal voluntary contractions, individuals cannot activate fully their agonist musculature
(Tillin et al., 2011; Kooistra et al., 2007; de Ruiter et al., 2004). This is most pronounced in
eccentric contractions during which peak torque has consistently been found to be lower in
voluntary compared to evoked or superimposed contractions (Pain et al., 2013; Westing et al.,
1990; Dudley et al., 1990). Westing et al. (1990) reported an increased torque production by
21-24% on average during eccentric contractions (60-360° s-1) with superimposed electrical
stimulation compared to maximal voluntary contractions. In a different study, the same
authors reported a decreased EMG activity of the superficial knee extensors during eccentric
compared to concentric contractions at various velocities (45-360° s-1), suggesting the
presence of neural inhibition for the agonist muscles (Westing et al., 1991). Interestingly, a
difference between voluntary and superimposed eccentric contractions was evident in
sedentary but not in elite high-jumpers, suggesting that any neural inhibition may be
Chapter 2 – Literature Review
15
attenuated by training (Amiridis et al., 1996). While the exact mechanism(s) remains
unknown, it is believed that neural mechanisms at spinal and supraspinal levels inhibit
neuromuscular activation during maximal eccentric efforts of untrained individuals. This
neural inhibition is thought to protect the joint from potentially injurious high levels of force
that can be produced during eccentric contractions (Duchateau and Baudry, 2014).
2.3.1.4 Antagonist co-activation
Upon activation, the net joint torque exerted is the result of the torque produced by the
agonist muscle(s) and any opposing torque produced by the antagonist muscle(s). Therefore,
it is clear that the level of antagonist co-activation has the potential to influence the resultant
net joint torque. Aagaard et al. (2000) reported a 15-35% of hamstrings antagonist co-
activation during slow isokinetic knee extensions (30° s-1) compared to a 10% antagonist co-
activation of the quadriceps. The same authors reported that the level of hamstrings co-
activation was higher at the more extended knee joint angles compared to the mid-range joint
positions. Yet, other studies did not confirm this effect of angular position in antagonistic co-
activation (Kellis and Baltzopoulos, 1997). Kellis and Baltzopoulos (1996) found that
hamstrings antagonist co-activation during isokinetic knee extensions increased by 31% from
30 to 150° s-1 i.e. it is velocity dependent, while antagonistic activity of both quadriceps and
hamstrings was higher during concentric contractions than eccentric. Overall, it seems that
the level of antagonist co-activation is muscle-specific, and depends on the type and velocity
of contraction.
The antagonistic co-activation is thought to be an injury preventing mechanism that reduces
the net joint torque and also increases the stiffness of the joint (Kellis and Baltzopoulos,
1998; Hagood et al., 1990; Baratta et al., 1988). For example, hamstrings co-activation during
knee extension has been suggested to reduce the anterior shear of the tibia and thus the stress
on the anterior cruciate ligament (ACL) (Aagaard et al., 2000; Baratta et al., 1988).
Furthermore, the lower antagonistic co-activation during eccentric compared to concentric
contractions may also partly explain the higher torques seen in eccentric (compared to
concentric) contractions (Kellis and Baltzopoulos, 1996).
2.3.1.5 Muscle composition
As discussed in 2.2.3, type II fibres (i.e. fibres that express MHC-IIA and IIX isoforms)
exhibit greater specific tension than type I in vitro (Bottinelli et al., 1996). As hamstrings
muscle composition has only been determined within cadavers, its influence on muscle
Chapter 2 – Literature Review
16
function remains unknown. However, the influence of muscle composition on maximal
strength in vivo has been examined in the vastus lateralis muscle in relation to knee extensors
strength and a significant correlation has been reported in some of these studies (Gür et al.,
2003; Aagaard & Andersen 1998; Viitasalo & Komi, 1978; Thorstensson et al., 1976) while
others did not confirm such a relationship (Maughan and Nimmo, 1984; Schantz et al., 1983;
Viitasalo et al., 1981; Inbar et al., 1981). However, within the studies that reported a
significant correlation several limitations may have confounded their results. For example, in
order to ensure a large variability in the muscle composition of their examined cohorts, some
investigators included highly diverse, athletic populations (Gür et al., 2003) where numerous
other variables (e.g. hypertrophy) could be acting as confounding factors. Other confounding
factors included examination of small cohorts (Aagaard & Andersen, 1998) or no
consideration of gravitational effects or acceleration artefacts (Schantz et al., 1983;
Thorstensson et al., 1976). In contrast to the above mentioned studies, Maughan and Nimmo
(1984) did not find any relationship between knee extensors maximal strength and vastus
lateralis muscle composition within physically active men. Overall, the existing data on the
relationship between muscle composition and in vivo maximal strength are mixed and
confounded by methodological limitations.
2.3.1.6 Muscle-tendon unit stiffness
Muscle force is transferred by the tendinous tissues (aponeuroses and tendons) to the skeleton
for any action to occur at the joint level. Therefore, the interaction of the muscle-tendon unit
has important effects on the in vivo function. This interaction is influenced by the mechanical
properties of the aponeurosis and tendon tissues. Stiffness is an important mechanical
property of these structures and can be defined as the resistance of a material to deformation.
Therefore, a stiff tendon would resist any stretching while a more compliant tendon would
change its length more for a given force. The implication of this property on muscle function
is that a more compliant tendon will shift the T-L curve to the right and the optimum muscle
length will be at a slightly longer position.
In a computational modelling study, Lemos et al. (2008) measured the influence of tendon
and aponeurosis compliance on F-L relationship and found that increased compliance
resulted in a rightward shift of the F-L and the peak isometric force occurred at longer
muscle-tendon unit lengths. They also found that increased compliance resulted in reduced
peak isometric force. The authors discussed that whilst isometric contractions suggest a static
Chapter 2 – Literature Review
17
muscle-tendon unit length, this is not the case for the contractile elements. Therefore, from
rest to contraction fibres shortened more (on average 4.59 mm) when the compliance of the
tendinous tissues was increased compared to a muscle-tendon unit with stiffer tendon and
aponeurosis (on average 2.74 mm). These findings were in accordance to the results of an in
vivo study by Kubo et al. (2006) who found that both elongation and strain in vastus lateralis
tendon and aponeurosis exhibited a weak but significant correlation with the knee extensor
peak isometric torque exerted at 100° relative to 50° (i.e. an index of an individual’s optimal
angle) (elongation, r= 0.48, P< 0.05; strain, r= 0.42, P< 0.05). This result suggested that
increased MTU compliance is related to a greater force production at longer muscle lengths.
Finally, significant positive relationships have been found between MTU stiffness and
maximal isometric (r= 0.57-0.67, Hannah and Folland, 2014; r= 0.58, Stenroth et al., 2012)
and dynamic strength (r= 0.54-0.60, Bojsen-Moller et al., 2005) suggesting that the MTU
stiffness scales with muscle strength and the functional capacity of the muscle. If this is the
case, the fibre shortening afforded by the tendon and aponeurosis compliance during the
transition from rest to maximum torque would be similar irrespective of strength.
Chapter 2 – Literature Review
18
2.3.2 Determinants of explosive strength
Explosive strength can be defined as the ‘capability to increase contractile force from a low
or resting level as quickly as possible’ (Folland et al., 2013) and is typically assessed during
isometric contractions. Determinants of explosive strength include maximal strength (Folland
et al., 2013; Andersen and Aagaard, 2006), neural activation (Folland et al, 2013; Tillin et al.,
2010), fibre type composition (Harridge et al., 1996) and muscle-tendon unit stiffness
(Bojsen-Moller et al., 2005).
2.3.2.1 Maximal strength
Maximal strength has been found to correlate well with explosive strength, especially during
the later stages of an explosive contraction (Folland et al., 2013; Andersen and Aagaard,
2006). Folland et al. (2013) showed that maximal voluntary strength explained 35-90% of the
variance in explosive strength (measured as force at specific time points after contraction
onset). The same authors also showed that the influence of maximal strength on explosive
strength increased as the explosive contraction progressed and the highest correlation was
seen at 150 ms (r= 0.95). Similar findings were presented by Andersen and Aagaard (2006)
who also reported an increasing contribution of maximal strength to explained variance in
explosive strength (measured as rate of force development in time epochs from contraction
onset up to 250 ms). The lowest (yet significant) correlation was reported at 0-50 ms time
epoch (r= 0.40, P< 0.05) and the highest at time intervals >150 ms (r> 0.80, P< 0.001).
Overall, maximal strength seems to be a primary determinant of explosive strength during the
later stages of an explosive contraction. This is probably expected, as maximal strength
represents the maximal capacity of voluntary force production and it can be achieved in >400
ms from contraction onset (Thorstensson et al., 1976). Therefore, as the explosive contraction
progresses over time, the force levels achieved are increasingly influenced by the maximal
voluntary force (Folland et al., 2014).
2.3.2.2 Agonist activation
Both cross-sectional and training studies have shown that explosive strength is influenced by
agonist activation (Folland et al., 2013; Tillin et al., 2011, 2010; de Ruiter et al., 2007, 2006,
2004; Aagaard et al., 2002). In a cohort of forty untrained individuals, agonist activation was
found to be a significant determinant of explosive strength, particularly at the initial part of an
explosive contraction (<75 ms) explaining 17-37% of the differences in absolute and 21-51%
in relative (normalised to maximal strength) explosive strength (Folland et al., 2013).

Chapter 2 – Literature Review
19
Furthermore, the same authors reported large inter-individual variability in the agonist
activation at the early stages of contraction (50 ms, CV= 38%) These results confirmed
previous findings in smaller cohorts (n≤ 11, de Ruiter et al., 2007, 2006, 2004). In a
comparison study between power athletes and untrained individuals, Tillin et al. (2010)
reported that the greater normalised rate of force development exhibited by the athletes was
explained by their higher neural activation (greater synchrony in the activation onset of the
agonist muscles and greater EMG amplitude in the first 50 ms after contraction onset).
Training studies have also provided some evidence of the relationship between agonist
activation and explosive strength (Tillin and Folland, 2104; Tillin et al., 2011; Aagaard et al.,
2002). For example, Aagaard et al. (2002) found a concurrent increase in EMG amplitude
and explosive strength after 14 weeks of heavy-resistance training. Overall, the level of
agonist activation seems to be a significant determinant of explosive strength during the early
stages of contraction.
2.3.2.3 Muscle composition
At the single-fibre level, rate of force development was found to be slower in MHC-I fibres
compared to MHC-II fibres (Harridge et al., 1996). However, when these authors examined
evoked contractions in vivo, there was no relationship between time to peak torque and
muscle composition in three different muscles (vastus lateralis, triceps brachii and soleus).
Only when the data from the individual muscles were pooled together, a significant
relationship arose (r= 0.99) (Harridge et al., 1996). Other investigators have reported
significant association between muscle composition and voluntary explosive force in vivo
(Viitasalo et al., 1981; Viitasalo and Komi, 1978). For example, Viitasalo and Komi (1978)
reported a significant correlation between % type I fibres and time to reach 30% maximal
force in a double-leg press exercise (r= 0.48, P< 0.01). However, the inclusion of athletes
from different training modalities and the testing procedures used (double-leg press) may
have confounded their results. From the existing data, it remains unclear whether muscle
composition influences explosive strength in vivo.
2.3.2.4 Muscle-tendon unit stiffness
Theoretically, a stiffer muscle-tendon unit would facilitate a more effective force
transmission from muscle fibres to the skeleton. Therefore - ceteris paribus - individuals with
a stiffer muscle-tendon unit would be expected to exhibit greater explosive strength. This
hypothesis was confirmed by Bojsen-Moller et al. (2005) who found a moderate positive

Chapter 2 – Literature Review
20
correlation between knee extensor explosive isometric strength and vastus lateralis tendon-
aponeurosis stiffness (r= 0.55, P< 0.05). However, in that study there was no control for the
influence of maximal strength in the examined relationship. As both explosive strength and
muscle-tendon unit stiffness are influenced by maximal strength, their results may merely
reflect the effect of maximal strength on these variables. Hannah and Folland (2014) also
reported significant correlations of knee extensors voluntary and evoked explosive strength
(measured as time to achieve specific levels of force) and vastus lateralis muscle-tendon unit
stiffness (voluntary, r= -0.35 to -0.54, P< 0.05; evoked, r= -0.41 to -0.64, P< 0.05), but these
relationships became non-significant when maximal strength was taken into account. These
findings suggest that, when the influence of maximal strength is taken into account, muscle-
tendon stiffness is not an important determinant of explosive strength.

Chapter 2 – Literature Review
21
2.4 PART III – HAMSTRINGS ANATOMY AND FUNCTION DURING
SPRINTING
2.4.1 Hamstrings anatomy
The term ‘hamstrings’ refers to three muscles located in the posterior thigh; the
semitendinosus (ST) and the semimembranosus (SM) are located at the medial side, and the
biceps femoris at the lateral side (Fig. 2.3). The biceps femoris has two anatomically and
functionally distinct heads, the long (BFlh) and the short (BFsh) head. The BFlh, ST and SM
cross the hip and the knee joint (biarticular muscles) and due to this configuration they are
primary knee flexors and major hip extensors. The BFsh crosses only the knee joint (mono-
articular muscle) and, therefore, contributes only to knee flexion. The medial and lateral
hamstrings also assist in knee and hip internal and external rotation respectively.
Figure 2.3. Illustration of the hamstrings muscle group in the right leg (posterior view)
(adapted from Schuenke et al., 2010).
The proximal region of the hamstrings presents a complex morphology. The BFlh and ST are
closely related sharing a common (conjoint) proximal tendon (van der Made et al., 2013;
Battermann et al., 2011; Miller et al., 2007). The conjoint tendon arises from the medial facet
of the ischial tuberosity (Battermann et al., 2011), while connections with the sarcotuberous
Chapter 2 – Literature Review
22
ligament have also been reported (Sato et al., 2013; Woodley and Mercer, 2005; Martin,
1968). Also, some ST muscle fibres originate directly from the ischial tuberosity (Woodley
and Mercer, 2005). The two muscles separate from their common tendon at ~9 cm distally
from the ischium (Battermann et al., 2011; Miller et al., 2007). The origin of the SM is also
located at the ischial tuberosity (lateral facet), with a lateral (Miller et al., 2007) or
anterolateral (van der Made et al., 2013) position relative to the BFlh/ST conjoint tendon.
Some studies described that the most proximal site of the SM tendon is also directly
connected with the BFlh/ST conjoint tendon (van der Made et al., 2013) or by means of
fibrous adhesions, however other studies did not report such connections (Sato et al., 2012;
Woodley and Mercer, 2005). As the SM tendon extends distally, it twists from anterolateral
to posteromedial position relative to the BFlh/ST tendon. Distally, the BFlh exhibits three
insertion sites; the head of the fibula, the lateral condyle and the fascia of the leg (Koulouris
and Connel, 2005). The BFsh originates from the linea aspera of the femur and shares the
distal tendon of the BFlh for its attachment. The ST inserts via a long tendon onto the
anteromedial part of the tibia while the SM inserts onto the posterior surface of the medial
tibial condyle.
The BFlh and SM have long proximal and distal tendons (including their aponeuroses)
extending up to or more than half the total muscle length (Woodley and Mercer, 2005) so that
they overlap, while the ST has a long distal but short proximal tendon with no overlap
between the two (van der Made et al., 2013). Preliminary reports found the size of the
proximal BFlh aponeurosis to be highly variable between individuals (Handsfield et al,
2010), while computational modelling studies reported that a small BFlh aponeurosis
concentrates high strains (Fig. 2.4, Fiorentino et al., 2014a, 2012; Rehorn and Blemker,
2010). These findings suggest that the size of the proximal BFlh aponeurosis may be a risk
factor for strain injury (discussed further in 2.5.3.3). Concerning the ST, it has a distinct V-
shaped tendinous inscription (or raphe) that divides the muscle into two regions (van der
Made et al., 2013; Woodley and Mercer, 2005).
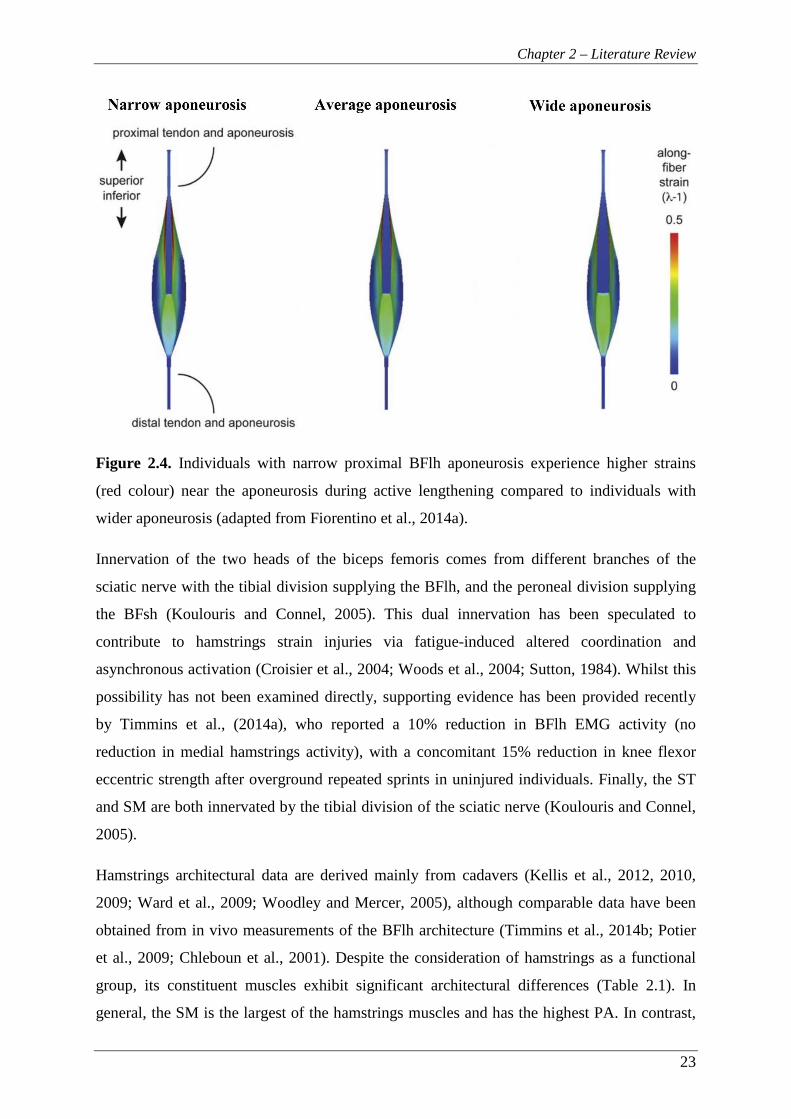
Chapter 2 – Literature Review
23
Figure 2.4. Individuals with narrow proximal BFlh aponeurosis experience higher strains
(red colour) near the aponeurosis during active lengthening compared to individuals with
wider aponeurosis (adapted from Fiorentino et al., 2014a).
Innervation of the two heads of the biceps femoris comes from different branches of the
sciatic nerve with the tibial division supplying the BFlh, and the peroneal division supplying
the BFsh (Koulouris and Connel, 2005). This dual innervation has been speculated to
contribute to hamstrings strain injuries via fatigue-induced altered coordination and
asynchronous activation (Croisier et al., 2004; Woods et al., 2004; Sutton, 1984). Whilst this
possibility has not been examined directly, supporting evidence has been provided recently
by Timmins et al., (2014a), who reported a 10% reduction in BFlh EMG activity (no
reduction in medial hamstrings activity), with a concomitant 15% reduction in knee flexor
eccentric strength after overground repeated sprints in uninjured individuals. Finally, the ST
and SM are both innervated by the tibial division of the sciatic nerve (Koulouris and Connel,
2005).
Hamstrings architectural data are derived mainly from cadavers (Kellis et al., 2012, 2010,
2009; Ward et al., 2009; Woodley and Mercer, 2005), although comparable data have been
obtained from in vivo measurements of the BFlh architecture (Timmins et al., 2014b; Potier
et al., 2009; Chleboun et al., 2001). Despite the consideration of hamstrings as a functional
group, its constituent muscles exhibit significant architectural differences (Table 2.1). In
general, the SM is the largest of the hamstrings muscles and has the highest PA. In contrast,

Chapter 2 – Literature Review
24
the ST appears to have the longest fascicle lengths with the smallest pennation angle (van der
Made et al., 2013; Kellis et al., 2012, 2010; Ward et al., 2009). In an effort to compare the
muscle architecture within the hamstrings group, Kellis et al. (2012) calculated a difference
index (δ, Blazevich et al., 2006; Lieber et al., 1992) based on muscle thickness, PA and FL
measured in cadavers. The highest similarity was observed between BFlh and SM and the
lowest between BFlh and ST. Kellis et al. (2012) also suggested that each of the lateral
(BFlh-BFsh) and medial (ST-SM) hamstrings pairs is composed of one muscle designed for
force production (short fascicle length and high pennation angle) and one for excursion (long
fascicle length and small pennation angle). In addition to the differences between the
hamstrings muscles, significant intramuscular variations have been found for the BFlh and
ST architecture (Kellis et al., 2010). Namely, the BFlh exhibited 35% higher pennation angle
(23.96° vs. 17.78°, P< 0.05) and 12% longer fascicle length (7.12 cm vs. 6.35 cm, P< 0.05) at
its most proximal site (initial 20% of MTU length) compared to the most distal site (last 25%
of the MTU length). In contrast, the ST exhibited 67% higher pennation angle (14.69° vs.
8.81°, P< 0.05) and 18% longer fascicle length (15.49 cm vs. 13.10 cm, P< 0.05) distally
compared to the most proximal site (Kellis et al., 2010).
Table 2.1. Hamstrings muscles architectural data derived from cadaveric studies (Kellis et
al., 2012, 2010, 2009; Ward et al., 2009; Woodley and Mercer, 2005).
Currently, the limited data on the hamstrings muscle composition are derived solely from
cadavers and the biceps femoris has been reported to contain 33.1-54.5% type II fibres
(Dahmane et al., 2006; Garret et al., 1984; Johnson et al., 1973). In the only study that has
examined the muscle composition of all hamstrings muscles, Garret et al. (1984) found an
average of 54.5%, 58.2%, 57.5% and 50.5% type II fibres for the BFlh, BFsh, ST and SM
respectively. In that study, hamstrings were reported to contain a higher proportion of type II
fibres than other thigh muscles (quadriceps, 51.9% and adductor magnus, 44.8%) and the
authors suggested that this muscle composition may contribute to the high susceptibility of

Chapter 2 – Literature Review
25
the hamstrings to strain injuries. Yet, in vivo studies have shown that the VL muscle, an
antagonist to BFlh muscle function, contains a greater proportion of MHC-II isoform (66.1%
total MHC-II in 95 physically active young men; Staron et al., 2000). The limited cadaver
data on hamstrings composition do not provide any evidence on whether hamstrings
composition is a risk factor for strain injuries. To elucidate whether such an association
exists, the hamstrings muscle composition in healthy young adults needs to be determined
first.
2.4.2 Hamstrings function during sprinting
Hamstrings strain injuries are suggested to occur primarily during high-speed running or
sprinting at maximal or near maximal speed (Askling et al., 2013, 2007). Therefore, it is
important to understand the function of hamstrings during this high-risk activity. The
hamstrings muscle group is composed of three biarticular muscles (biceps femoris long head
(BFlh), semitendinosus (ST) and semimembanosus (SM)) that cross the hip and knee joint
and one mono-articular muscle (biceps femoris short head, BFsh) which crosses the knee
joint. This configuration allows hamstrings to act as both hip extensors and knee flexors.
During running, hamstrings activation starts at the mid-swing phase and continues through
the late swing to the stance or early swing phase (Schache et al., 2012; Chumanov et al.,
2011; Higashihara et al., 2010; Yu et al., 2008; Kyrolaien et al., 1999). During the late swing
phase, hamstrings undergo eccentric loading to decelerate the forward movement of both the
thigh and the shank (Yu et al., 2008; Thelen et al., 2005). After the successful control of the
knee extension, and prior to the subsequent foot contact, a transition of the hamstrings action
from eccentric to concentric occurs as knee flexion commences (stretch-shortening cycle).
This concentric activity continues throughout the stance phase (Schache et al., 2012;
Chumanov et al., 2011) contributing to the hip extension as the body moves forwards.
However, some eccentric activity has also been reported during the late stance phase for the
BFlh and ST (Yu et al., 2008) or the BFsh (Schache et al., 2012). Yu et al. (2008) suggested
that this discrepancy may be due to the differences in lower extremity kinematics between
treadmill and overground sprinting used in these studies. This suggestion was based on
results from Frishberg (1983), who found that during take-off the knee joint was at a more
extended position in overground sprinting compared to treadmill sprinting, implying that the
hamstrings MTU were at a longer length in the former case.
Chapter 2 – Literature Review
26
Modelling studies have shown that muscle-tendon unit stretch increases with increasing
running velocity up to ~80% of maximum, but remains relatively constant at faster velocities
(Schache et al., 2013; Thelen et al., 2005). However, the magnitude of strain differs between
the hamstrings muscles. Musculoskeletal modelling studies have shown that, during the late
swing phase, it is the BFlh muscle-tendon unit that exhibits the greatest extension (9.8-13.0%
change in length relative to upright standing length) compared to SM (7.7-11.0%) and ST
(8.4-11%) (Schache et al., 2013, 2012; Chumanov et al., 2011; Thelen et al., 2005). Recently,
Fiorentino et al. (2014b) were the first to quantify the along-fibre strains in the BFlh during
sprinting (at 70%, 85% and 100% of maximum speed) using computational modelling and
predicted that, while the strain of the MTU and the whole-fibre remain relatively constant, the
peak local fibre stains near the proximal MTJ increase at higher speeds. In addition, the local
fibre strains were found to be increasingly non-uniform as the speed increased (Fiorentino et
al., 2014a).
Riley et al. (2010) calculated that, during low speed running (3.16 m s-1), the peak iliacus
MTU length occurred simultaneously with the peak biceps femoris MTU length of the
contralateral limb, and the authors suggested that the hip flexors of one limb may influence
the hamstrings stretch of the contralateral limb. The implication of this timing is that tight hip
flexors may cause increased anterior pelvis tilt, which would in turn stretch further the
contralateral BFlh MTU and potentially increase the risk for strain injury in that muscle. The
role of hip flexors in BFlh MTU stretch during running was also highlighted in another
modelling study (Chumanov et al., 2007), which reported that hip flexors induced >20 mm
increase in biceps femoris stretch of the contralateral limb at near maximal and maximal
running speeds.
In conclusion, current data show that hamstrings activation is greatest during the late swing
and early stance phases. The former involves a stretch-shortening cycle with a large eccentric
action of the hamstrings that imposes different loading on each of the different hamstrings
muscles, while the latter involves a high concentric loading. The high biomechanical load
imposed on this muscle group highlights their significance during high-speed running
activity.

Chapter 2 – Literature Review
27
2.5 PART IV – HAMSTRINGS STRAIN INJURIES
Hamstrings strain injuries are the most prevalent injuries in sprint-based sports (e.g. different
codes of football and track sprinting; Alonso et al., 2012; Ekstrand et al., 2011; Orchard et al.,
2001) accounting for 12-17% of all injuries, while they also exhibit a high re-injury rate (12-
40%; Alonso et al., 2012; Ekstrand et al., 2011a, 2011b; Elliot et al., 2011; Verrall et al.,
2006; Woods et al., 2004; Orchard and Seward, 2002). A significant amount of research has
been conducted in order to improve our understanding on hamstrings strain injuries; however
their high rates of incidence and persistent nature highlight that our knowledge on the
mechanisms, the risk factors and the rehabilitation process of strain injuries remains limited.
2.5.1 Site of injury
Hamstrings strain injuries affect predominantly the BFlh muscle (Malliaropoulos et al., 2010;
Askling et al., 2013, 2007; Koulouris and Connell, 2003; Slavotinek et al., 2002; De Smet
and Best, 2000; Garrett et al., 1989). In a carefully selected cohort (over a 3-year period) of
18 sprinters who sustained a first-time hamstrings strain injury (verified by magnetic
resonance imaging, MRI), Askling et al. (2007) reported that the BFlh was the primary site of
injury for all individuals. Other studies that have used MRI to confirm the location of the
injury, have reported that the BFlh was affected in 60-83% of the total hamstrings strains
(Hallen and Ekstrand, 2014; Askling et al., 2013; Koulouris and Connell, 2003; Slavotinek et
al., 2002; De Smet and Best, 2000). Despite the general agreement on the muscle that is
mostly injured, controversy exists on the second most injured muscle with some studies
reporting the ST (Askling et al., 2007; Slavotinek et al., 2002; De Smet and Best, 2000) while
others the SM (Hallen and Ekstrand, 2014; Koulouris and Connell, 2003; Malliaropoulos et
al., 2011). While it is unclear why this discrepancy in injury patterns exists, it is possible that
the type of activity may determine the muscle involved (Askling et al., 2013, 2006, 2000).
Interestingly, in a prospective randomised controlled trial Askling et al. (2013) reported that,
within 75 football players that sustained an acute hamstrings strain injury, the BFlh was
primarily affected in sprinting-type strains (94%) while the SM in stretching-type injuries
(76%). However, currently there is no clear understanding why these muscles are injured at
different conditions. Concerning the exact location of strain injuries, Garret et al. (1987)
reported that all experimentally-induced strains examined in animal models occurred in the
muscle tissue adjacent to the MTJ, even though other in vitro studies reported damage at the
MTJ itself (Tidball and Chan, 1989). In vivo examinations in humans have shown that the

Chapter 2 – Literature Review
28
hamstrings strains are commonly located near a MTJ (proximal or distal) (Malliaropoulos et
al., 2010; Koulouris and Connell, 2003; Slavotinek et al., 2002; De Smet and Best, 2000).
Despite the fact that some studies specifically identified the BFlh proximal MTJ to be mostly
affected (Askling et al., 2007; De Smet and Best, 2000), others provide only a general
description of the ‘proximal’ BFlh (with no further details) as the most common injury site
(Koulouris and Connell, 2003; Slavotinek et al., 2002; Garrett et al., 1989). It is unclear why
strain injuries occur near the MTJ, however it has been reported that sarcomeres near the
MTJ (within ~1 mm from the MTJ into the muscle) are stiffer compared to the central
sarcomeres of the muscle fibre and therefore stretch less as a response to an applied force
(Noonan, 1992). In addition, emerging evidence suggest that the morphology of the BFlh
MTU may contribute to increased localised strains along the proximal MTJ and therefore
increase the risk of a strain injury (discussed further in 2.5.3.3).
In conclusion, current data suggest that the proximal BFlh is the primary site of hamstrings
strain injuries, while the MTJ (proximal or distal) is typically involved irrespective of the
muscle affected.
2.5.2 The inciting mechanism of hamstrings strain injury
The majority of the hamstrings strain injuries occur during high-speed running or sprinting
(Askling et al., 2013, 2007; Brooks et al., 2006; Woods et al., 2004). However, the exact time
of injury has yet to be clearly identified. Muscle strain injuries are the result of excessive
stretch, either passive or more commonly active (i.e. eccentric contraction, Lieber and Fridén,
1993; Garret et al., 1987). In sprinting, hamstrings undergo eccentric contraction during the
mid- and late swing phases (Schache et al., 2012; Chumanov et al., 2011; Thelen et al., 2005)
as well as during the late stance phase (Schache et al., 2012; Yu et al., 2008) (see 2.4.2).
Modelling studies have calculated that all hamstrings muscles reach their peak stretch during
the late swing phase, with the BFlh experiencing the highest strain of all hamstrings muscles.
(Schache et al., 2012). Moreover, the BFlh highest peak local strains are located near the
proximal MTJ (Fig. 2.5B, Fiorentino et al. 2014b), which is the site where strain injuries
typically occur (see 2.5.1). Therefore, the late swing phase is believed to correspond to the
time of injury (Higashihara et al., 2014; Schache et al., 2013, 2012; Chumanov et al., 2012,
2011; Thelen et al., 2005). This belief is also supported by two case studies of hamstrings
strain injuries that occurred during data collection in biomechanical studies (Schache et al.,
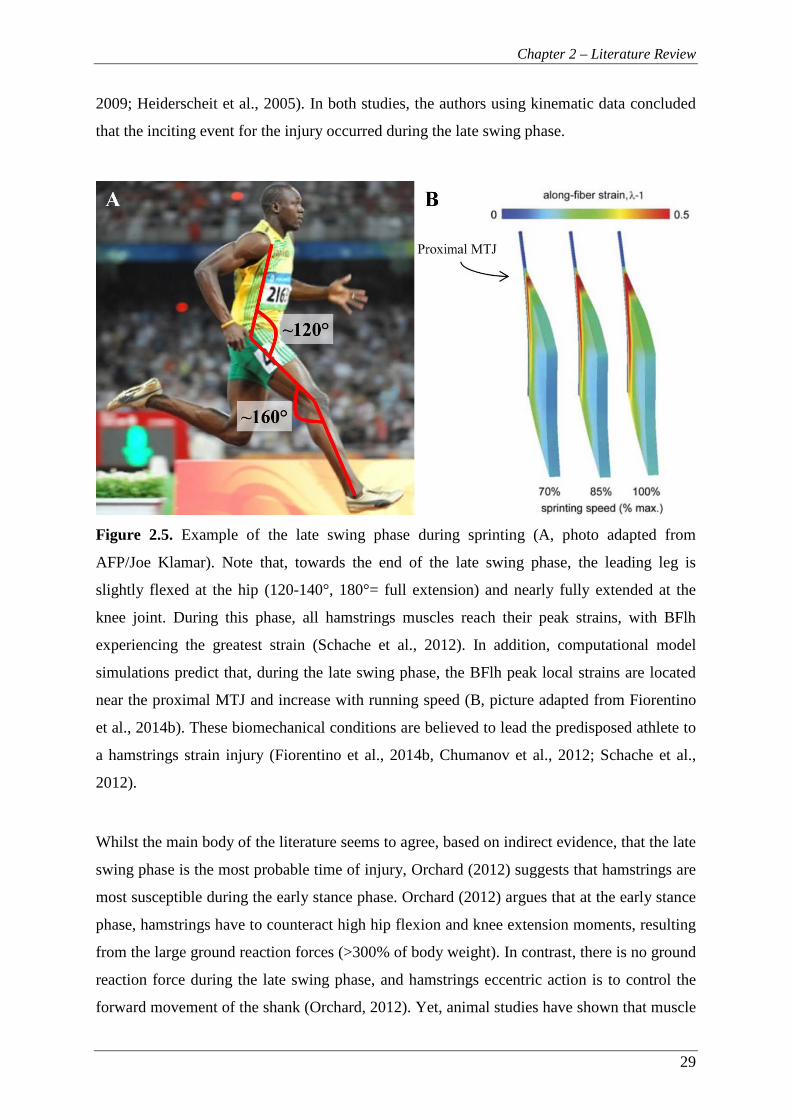
Chapter 2 – Literature Review
29
2009; Heiderscheit et al., 2005). In both studies, the authors using kinematic data concluded
that the inciting event for the injury occurred during the late swing phase.
Figure 2.5. Example of the late swing phase during sprinting (A, photo adapted from
AFP/Joe Klamar). Note that, towards the end of the late swing phase, the leading leg is
slightly flexed at the hip (120-140°, 180°= full extension) and nearly fully extended at the
knee joint. During this phase, all hamstrings muscles reach their peak strains, with BFlh
experiencing the greatest strain (Schache et al., 2012). In addition, computational model
simulations predict that, during the late swing phase, the BFlh peak local strains are located
near the proximal MTJ and increase with running speed (B, picture adapted from Fiorentino
et al., 2014b). These biomechanical conditions are believed to lead the predisposed athlete to
a hamstrings strain injury (Fiorentino et al., 2014b, Chumanov et al., 2012; Schache et al.,
2012).
Whilst the main body of the literature seems to agree, based on indirect evidence, that the late
swing phase is the most probable time of injury, Orchard (2012) suggests that hamstrings are
most susceptible during the early stance phase. Orchard (2012) argues that at the early stance
phase, hamstrings have to counteract high hip flexion and knee extension moments, resulting
from the large ground reaction forces (>300% of body weight). In contrast, there is no ground
reaction force during the late swing phase, and hamstrings eccentric action is to control the
forward movement of the shank (Orchard, 2012). Yet, animal studies have shown that muscle
Chapter 2 – Literature Review
30
damage is a result of the muscle fibre strain that occurs during active lengthening rather than
the level of force per se (Lieber and Fridén, 1993).
2.5.3 Risk factors
Hamstrings strain injuries are a persistent problem for the athletes, teams and physicians
involved, and the identification of the factors that can lead to these injuries is of high
importance. The risk factors can be described as intrinsic and extrinsic. The intrinsic risk
factors are those that relate to the individual/athlete (e.g. muscle strength and flexibility),
while the extrinsic risk factors are related to the environment (e.g. the game conditions, other
athletes, climate etc.). The multifactorial nature of the hamstrings strain injuries suggests that
it is not the sole existence of a single risk factor that leads to injury; rather, an injury is the
result of the accumulation of a number of risk factors in combination with exposure to high
risk conditions and ultimately an inciting event. According to a model proposed by
Meeuwisse et al. (2007), the risk factors are dynamic and change the susceptibility of an
individual. For example, sprint training may provide adaptations that protect an individual
from hamstrings strain injuries, and therefore decrease the risk of injury. On the other hand,
residual fatigue, due to excessive training with inadequate rest, can cause reduced hamstrings
eccentric strength that increases the risk for strain injury. Meeuwisse et al. (2007) suggest that
an athlete is susceptible when ‘the intrinsic and extrinsic risk factors and the interactions
between all of the risks accumulate’.
Despite the significant research efforts over the last decades, there is a surprisingly limited
knowledge of what constitutes a risk factor for hamstrings strain injury. Numerous potential
risk factors have been suggested, however only a few of them are supported by robust
scientific evidence. More high-quality studies (e.g. large, randomised controlled studies) are
needed to improve our understanding of the risk factors for hamstrings strain injuries. This
section presents an overview of the main risk factors proposed in the literature.
2.5.3.1 Previous injury
A previous hamstrings injury has been consistently reported as a significant risk factor for a
subsequent strain injury, and athletes with a history of hamstrings strains have 2-5 times
increased risk for a future injury (Hagglund et al., 2013; 2006; Engebretsen et al., 2010;
Gabbe et al., 2006; Arnason et al., 2004; Orchard, 2001; Verrall et al., 2001). Silder et al.
(2008) found evidence of scar tissue adjacent to the injury site up to 23 months after the
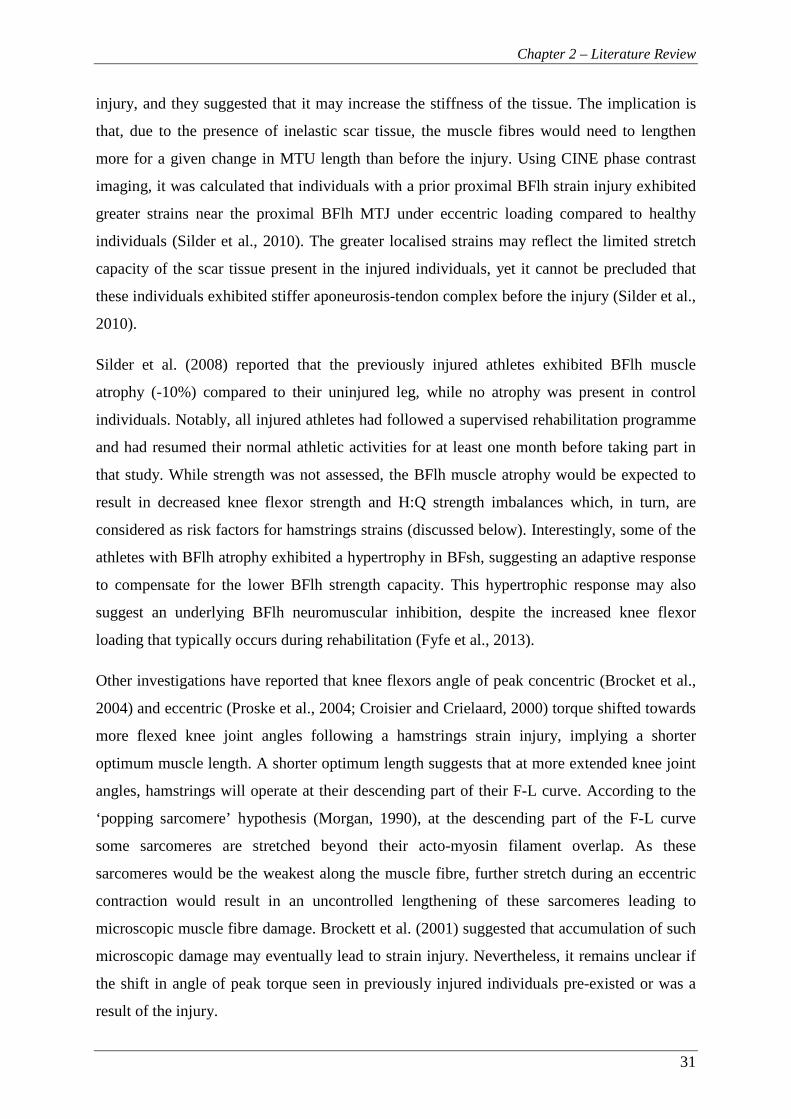
Chapter 2 – Literature Review
31
injury, and they suggested that it may increase the stiffness of the tissue. The implication is
that, due to the presence of inelastic scar tissue, the muscle fibres would need to lengthen
more for a given change in MTU length than before the injury. Using CINE phase contrast
imaging, it was calculated that individuals with a prior proximal BFlh strain injury exhibited
greater strains near the proximal BFlh MTJ under eccentric loading compared to healthy
individuals (Silder et al., 2010). The greater localised strains may reflect the limited stretch
capacity of the scar tissue present in the injured individuals, yet it cannot be precluded that
these individuals exhibited stiffer aponeurosis-tendon complex before the injury (Silder et al.,
2010).
Silder et al. (2008) reported that the previously injured athletes exhibited BFlh muscle
atrophy (-10%) compared to their uninjured leg, while no atrophy was present in control
individuals. Notably, all injured athletes had followed a supervised rehabilitation programme
and had resumed their normal athletic activities for at least one month before taking part in
that study. While strength was not assessed, the BFlh muscle atrophy would be expected to
result in decreased knee flexor strength and H:Q strength imbalances which, in turn, are
considered as risk factors for hamstrings strains (discussed below). Interestingly, some of the
athletes with BFlh atrophy exhibited a hypertrophy in BFsh, suggesting an adaptive response
to compensate for the lower BFlh strength capacity. This hypertrophic response may also
suggest an underlying BFlh neuromuscular inhibition, despite the increased knee flexor
loading that typically occurs during rehabilitation (Fyfe et al., 2013).
Other investigations have reported that knee flexors angle of peak concentric (Brocket et al.,
2004) and eccentric (Proske et al., 2004; Croisier and Crielaard, 2000) torque shifted towards
more flexed knee joint angles following a hamstrings strain injury, implying a shorter
optimum muscle length. A shorter optimum length suggests that at more extended knee joint
angles, hamstrings will operate at their descending part of their F-L curve. According to the
‘popping sarcomere’ hypothesis (Morgan, 1990), at the descending part of the F-L curve
some sarcomeres are stretched beyond their acto-myosin filament overlap. As these
sarcomeres would be the weakest along the muscle fibre, further stretch during an eccentric
contraction would result in an uncontrolled lengthening of these sarcomeres leading to
microscopic muscle fibre damage. Brockett et al. (2001) suggested that accumulation of such
microscopic damage may eventually lead to strain injury. Nevertheless, it remains unclear if
the shift in angle of peak torque seen in previously injured individuals pre-existed or was a
result of the injury.
Chapter 2 – Literature Review
32
Some interesting data emerged from a recent study reporting 18-20% reduced EMG activity
during eccentric contractions for the previously injured BFlh but not for the medial
hamstrings compared to the uninjured leg in recreational athletes (Opar et al., 2013b). This
neural inhibition was accompanied with 10-11% lower eccentric strength compared to the
uninjured leg. Again, all participants had undergone rehabilitation and were permitted to
return to competition at the time of testing which was conducted at least 2 months after the
injury. The authors discussed that previously injured BFlh may be less responsive to eccentric
training (a widely recommended tool in hamstrings strains pre- and rehabilitation,
Heiderscheit et al., 2010) and therefore more susceptible to a future injury. In another study
by the same authors (Opar et al., 2013a), similar reductions in BFlh neural activation (but not
the medial hamstrings) were reported along with lower knee flexor rate of torque
development and reduced impulse at 50 ms and 100 ms after the contraction onset in slow
eccentric contractions. However, these retrospective studies cannot elucidate whether the
reduced BFlh neural activation was the cause or the result of the hamstrings injury and
further prospective studies are needed.
In summary, hamstrings injuries result in neuromuscular and functional alterations that may
be present long after the injury occurrence and even when athletes are cleared to return to
their usual athletic activities, while these changes may predispose them to re-current strain
injuries.
2.5.3.2 Strength imbalances
Knee joint muscle strength imbalances are typically assessed by comparing the knee
extensors or flexors strength between the two sides (bilateral imbalances) and/or by
calculating the relative strength of the knee extensors and flexors (H:Q ratio) unilaterally.
Originally, the H:Q ratio was calculated from the concentric peak torque of the knee
extensors and flexors, known as the conventional ratio. Later, the dynamic strength ratio
(Dvir et al., 1989) or functional ratio (Aagaard et al., 1998, 1995) was introduced, which
calculates the ratio of hamstrings peak eccentric to quadriceps peak concentric torque, and it
is thought to better reflect the reciprocal antagonistic function of these muscles during
athletic activities such as sprinting and kicking. Despite the widespread use of the H:Q ratio,
there are no objective cut-off ratio limits due to differences in isokinetic dynamometers and
exercise protocols used (Croisier, 2002).
Chapter 2 – Literature Review
33
Strength imbalances, either bilateral for knee flexors or between knee extensors and flexors
of the same leg, have been long considered a risk factor for strain injuries (Fousekis et al.,
2010; Yeung et al., 2009; Croisier et al., 2008, 2002, 2000; Orchard et al., 1997; Heiser et al.,
1984). Croisier et al. (2002) found that the most affected functional parameters in previously
injured individuals were the hamstrings eccentric bilateral strength and the hamstrings
eccentric to quadriceps concentric strength ratio (functional H:Q ratio). These authors
highlighted the discriminating character of the eccentric strength deficits and discussed that
had they only examined the concentric strength, 23% of the individuals with a history of
strain injury would have not been identified with strength imbalances. In a large prospective
study (n= 462) that examined the relationship between strength imbalances and injury risk,
Croisier et al. (2008) recorded 35 hamstrings injuries and found that professional footballers
with preseason strength imbalances that were left untreated, either bilateral hamstrings
strength deficits >15% and/or a low conventional (<0.47-0.49) or functional (<0.80-0.89)
H:Q strength ratio), had >4-fold increased risk of strain injury during the subsequent season
compared to players with no strength imbalances. In addition, players with initial imbalances
that were restored (according to statistically defined cut-off criteria) reduced their risk of
injury to levels comparable to players with no imbalances. In a smaller prospective study,
Yeung et al. (2009) examined forty-four sprinters over 1 year and recorded a total of 12
hamstrings strain injuries in 8 athletes. Using Cox regression analysis, it was found that
athletes with a conventional H:Q ratio <0.60 exhibit a 17-fold greater risk for a hamstrings
strain injury. Another small prospective study (n= 37) has also reported that a conventional
H:Q ratio <0.61 at 60° s-1 increases the risk of strain injury in American football players. In
contrast to the aforementioned studies, Bennell et al. (1998) did not find any association
between low bilateral hamstrings strength ratio (<0.90) or low H:Q strength ratio (<0.60) and
increased risk of strain injury. However, they only recorded 9 injuries over a season in a
cohort of 102 athletes. It is important to highlight that most of the above studies have used
relatively small sample sizes and recorded a low number of hamstrings injuries. A number of
20-50 injury cases are needed to detect a moderate to strong association with a potential risk
factor (Bahr and Holme, 2003). Considering the multifactorial nature of the hamstrings strain
injuries, it is unlikely that any single factor will exhibit a strong relationship with this type of
injury. In that case, >200 injury cases are needed to detect small to moderate associations
(Bahr and Holme, 2003). It is clear that further large-scale prospective studies are needed to
better understand the relationship between strength imbalances and hamstrings strains.
Chapter 2 – Literature Review
34
Most studies that examined the knee joint muscle strength imbalances have focused on the
H:Q peak torque ratio. However, the time needed to achieve peak isometric torque can be
>400 ms (Thorstensson et al., 1976), which is substantially longer than the time available for
the knee flexors to decelerate the shank during the late swing phase (<100 ms, Schache et al.,
2013). Therefore, examination of the explosive H:Q ratio could provide valuable information
that would otherwise be undetected by a maximal strength ratio. Indeed, Hannah et al. (2014)
examined the explosive H:Q ratio of the reciprocal muscle groups and found that at the initial
50 ms from the activation onset, the explosive H:Q ratio was significantly lower compared to
the maximal strength H:Q ratio (0.17 vs. 0.56, P< 0.001), suggesting that the knee joint is
particularly vulnerable to injury at that time. Interestingly, this large difference was mainly
attributed to the 2 times longer hamstrings electromechanical delay compared to quadriceps
(44.0 vs. 22.6 ms, P< 0.001). It must be noted however that in that study the explosive H:Q
ratio was examined isometrically, while hamstrings act eccentrically during the late swing
phase. The type of contraction has been found to exhibit a differential influence on explosive
torque production capacity (Tillin et al., 2012).
2.5.3.3 Hamstrings anatomy
Despite the common speculation that the anatomy of the hamstrings might influence injury
risk, this has received surprisingly little attention. Only recently, two studies using
computational modelling and dynamic MR imaging, calculated higher localised tissue strains
for individuals with a narrow proximal BFlh aponeurosis and they suggested that a
disproportionately small BFlh proximal aponeurosis may be a potential risk factor for strain
injury (Fiorentino et al., 2012; Rehorn and Blemker, 2010). Initially, Rehorn and Blemker
(2010) examined finite element models of BFlh based on MR images and examined the
influence of proximal and distal aponeurosis dimensions on stretch distribution in the muscle
during a simulated eccentric contraction and found that a decrease in proximal aponeurosis
width by 80% resulted in 60% increase in peak stretches along the proximal MTJ. The
findings of that study were confirmed by an in vivo study from the same laboratory that used
CINE dynamic MR imaging to measure the BFlh strains during active and passive
lengthening in 13 individuals (Fiorentino et al., 2012). Specifically, they found that
individuals with a narrow BFlh proximal aponeurosis experienced the highest strains near the
aponeurosis during active lengthening compared to individuals with a wider aponeurosis.
These two studies provided the first evidence that aponeurosis size may contribute to
hamstrings strain injuries and that individuals with a narrow aponeurosis may be at an
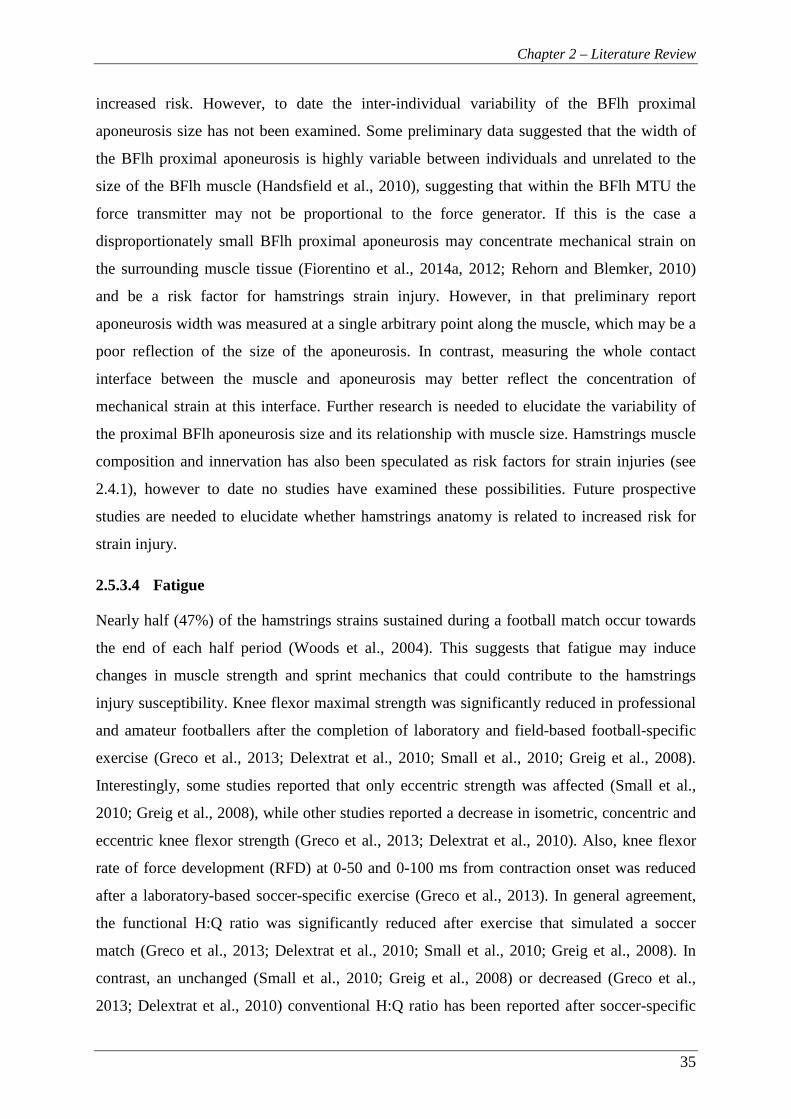
Chapter 2 – Literature Review
35
increased risk. However, to date the inter-individual variability of the BFlh proximal
aponeurosis size has not been examined. Some preliminary data suggested that the width of
the BFlh proximal aponeurosis is highly variable between individuals and unrelated to the
size of the BFlh muscle (Handsfield et al., 2010), suggesting that within the BFlh MTU the
force transmitter may not be proportional to the force generator. If this is the case a
disproportionately small BFlh proximal aponeurosis may concentrate mechanical strain on
the surrounding muscle tissue (Fiorentino et al., 2014a, 2012; Rehorn and Blemker, 2010)
and be a risk factor for hamstrings strain injury. However, in that preliminary report
aponeurosis width was measured at a single arbitrary point along the muscle, which may be a
poor reflection of the size of the aponeurosis. In contrast, measuring the whole contact
interface between the muscle and aponeurosis may better reflect the concentration of
mechanical strain at this interface. Further research is needed to elucidate the variability of
the proximal BFlh aponeurosis size and its relationship with muscle size. Hamstrings muscle
composition and innervation has also been speculated as risk factors for strain injuries (see
2.4.1), however to date no studies have examined these possibilities. Future prospective
studies are needed to elucidate whether hamstrings anatomy is related to increased risk for
strain injury.
2.5.3.4 Fatigue
Nearly half (47%) of the hamstrings strains sustained during a football match occur towards
the end of each half period (Woods et al., 2004). This suggests that fatigue may induce
changes in muscle strength and sprint mechanics that could contribute to the hamstrings
injury susceptibility. Knee flexor maximal strength was significantly reduced in professional
and amateur footballers after the completion of laboratory and field-based football-specific
exercise (Greco et al., 2013; Delextrat et al., 2010; Small et al., 2010; Greig et al., 2008).
Interestingly, some studies reported that only eccentric strength was affected (Small et al.,
2010; Greig et al., 2008), while other studies reported a decrease in isometric, concentric and
eccentric knee flexor strength (Greco et al., 2013; Delextrat et al., 2010). Also, knee flexor
rate of force development (RFD) at 0-50 and 0-100 ms from contraction onset was reduced
after a laboratory-based soccer-specific exercise (Greco et al., 2013). In general agreement,
the functional H:Q ratio was significantly reduced after exercise that simulated a soccer
match (Greco et al., 2013; Delextrat et al., 2010; Small et al., 2010; Greig et al., 2008). In
contrast, an unchanged (Small et al., 2010; Greig et al., 2008) or decreased (Greco et al.,
2013; Delextrat et al., 2010) conventional H:Q ratio has been reported after soccer-specific
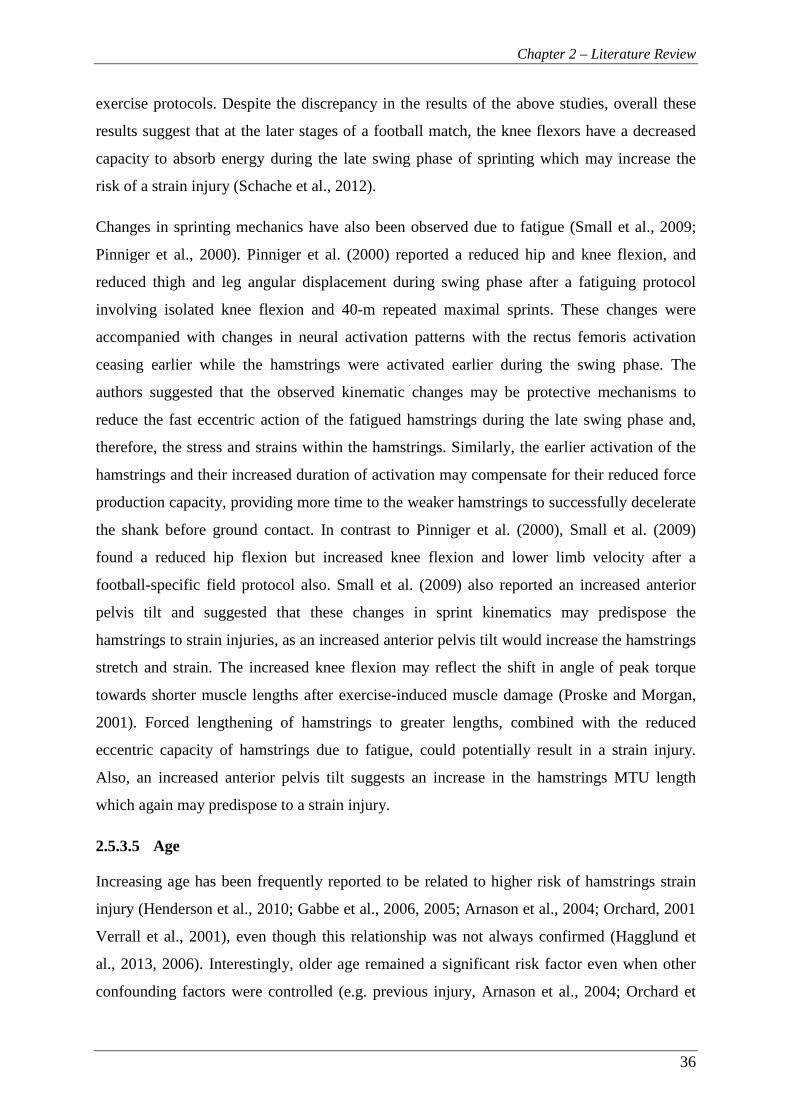
Chapter 2 – Literature Review
36
exercise protocols. Despite the discrepancy in the results of the above studies, overall these
results suggest that at the later stages of a football match, the knee flexors have a decreased
capacity to absorb energy during the late swing phase of sprinting which may increase the
risk of a strain injury (Schache et al., 2012).
Changes in sprinting mechanics have also been observed due to fatigue (Small et al., 2009;
Pinniger et al., 2000). Pinniger et al. (2000) reported a reduced hip and knee flexion, and
reduced thigh and leg angular displacement during swing phase after a fatiguing protocol
involving isolated knee flexion and 40-m repeated maximal sprints. These changes were
accompanied with changes in neural activation patterns with the rectus femoris activation
ceasing earlier while the hamstrings were activated earlier during the swing phase. The
authors suggested that the observed kinematic changes may be protective mechanisms to
reduce the fast eccentric action of the fatigued hamstrings during the late swing phase and,
therefore, the stress and strains within the hamstrings. Similarly, the earlier activation of the
hamstrings and their increased duration of activation may compensate for their reduced force
production capacity, providing more time to the weaker hamstrings to successfully decelerate
the shank before ground contact. In contrast to Pinniger et al. (2000), Small et al. (2009)
found a reduced hip flexion but increased knee flexion and lower limb velocity after a
football-specific field protocol also. Small et al. (2009) also reported an increased anterior
pelvis tilt and suggested that these changes in sprint kinematics may predispose the
hamstrings to strain injuries, as an increased anterior pelvis tilt would increase the hamstrings
stretch and strain. The increased knee flexion may reflect the shift in angle of peak torque
towards shorter muscle lengths after exercise-induced muscle damage (Proske and Morgan,
2001). Forced lengthening of hamstrings to greater lengths, combined with the reduced
eccentric capacity of hamstrings due to fatigue, could potentially result in a strain injury.
Also, an increased anterior pelvis tilt suggests an increase in the hamstrings MTU length
which again may predispose to a strain injury.
2.5.3.5 Age
Increasing age has been frequently reported to be related to higher risk of hamstrings strain
injury (Henderson et al., 2010; Gabbe et al., 2006, 2005; Arnason et al., 2004; Orchard, 2001
Verrall et al., 2001), even though this relationship was not always confirmed (Hagglund et
al., 2013, 2006). Interestingly, older age remained a significant risk factor even when other
confounding factors were controlled (e.g. previous injury, Arnason et al., 2004; Orchard et

Chapter 2 – Literature Review
37
al., 2001). Further, every additional year of age increases the risk of injury by 1.4-1.8 times in
professional athletes such that a 30-year old athlete has 14-18 times greater risk than a 20-
year old (Henderson et al., 2010; Arnason et al., 2004). However, it remains unclear why
older athletes are predisposed to strain injuries. In a prospective study, Gabbe et al. (2006)
found that older athletes (≥25 years) had increased body mass and reduced hip flexibility
compared to younger athletes (≤20 years) and multivariate analysis showed that these were
independent risk factors for strain injury in the older athletes. Finally, Orchard et al. (2001)
speculated that lumber degeneration leading to L5/S1 nerve impingement may result in
hamstrings denervation and loss of muscle strength in older individuals. However, these
suggestions are not supported by any scientific evidence and therefore it remains unclear why
increasing age predisposes to hamstrings strains.
2.5.3.6 Flexibility
Current findings concerning the relationship between hamstrings flexibility and risk of strain
injury are conflicting. Three prospective studies in professional footballers have found that
decreased flexibility of hip and knee flexors increases the risk of hamstrings strain injury
(Henderson et al., 2010; Bradley and Portas, 2007; Witvrouw et al., 2003), while other
studies did not find any association (Engebretsen et al., 2010; Yeung et al., 2009; Gabbe et
al., 2006, 2005; Arnason et al, 2004). While it is unclear why this discrepancy in the results
exists, it may be partly due to the different methods used and the difficulty in differentiating
hamstrings flexibility from flexibility in the lumbar spine and pelvis (Opar et al., 2013;
Dallinga et al., 2012; Prior et al., 2009).
38
Chapter 3
Reliability of isometric and isovelocity hamstrings-to-quadriceps ratio and strength measures for the
knee extensors and flexors

Chapter 3 – Hamstrings-to-quadriceps ratio reliability
39
3 CHAPTER 3 – RELIABILITY OF ISOMETRIC AND
ISOVELOCITY HAMSTRINGS-TO-QUADRICEPS RATIO AND
STRENGTH MEASURES OF THE KNEE EXTENSORS AND
FLEXORS
3.1 INTRODUCTION
Strength imbalance between the knee extensors and flexors has been suggested as a risk
factor for hamstrings strains and anterior cruciate ligament injuries (Croisier et al., 2008,
2002; Sugiura et al., 2008; Griffin et al., 2006). Typically, the strength balance around the
knee joint is examined with the hamstrings-to-quadriceps peak torque ratio (H:Q) using
isokinetic dynamometry. However, the assessment of the H:Q ratio is commonly performed
in conditions that do not reflect the biomechanics of the activities where injuries occur (e.g.
late swing phase of sprinting for strain injuries, Chumanov et al., 2012). Accounting for these
conditions would be expected to improve the validity of the measurements; yet, the reliability
of such protocol should be established before its employment. In addition, the ‘ideal’ protocol
should require the minimum amount of time and involvement from the athletes, in order to
minimise any disruption of their training schedule and maximise the frequency of
performance monitoring. Therefore, the development of an ecologically valid, reliable
protocol that assesses the strength balance of the knee extensors and flexors in the least time
spent in the laboratory is critical.
Three main variations of the H:Q ratio can be calculated: isometric, conventional and
functional ratios. The conventional ratio is defined as the knee flexors to extensors concentric
peak torque, whilst the functional ratio as the knee flexors eccentric to knee extensors
concentric peak torque. Whilst the functional ratio is considered to reflect better the
antagonistic function of these muscle groups (Aagaard et al., 1998, 1995), the ecological
validity of the H:Q ratio remains limited. In most studies, knee extensor and flexor strength is
assessed at a seated, upright position with the hip joint at 90-100° (180°= full extension).
However, this position is far from the ~120-140° hip flexion during the late swing phase
when strain injuries occur (Guex et al., 2012; Novacheck, 1998). Another limitation is the
large discrepancy in the angular velocity of the knee joint during athletic activities (e.g.
>1200° s-1 during kicking or sprinting, Higashihara et al., 2010; Kellis and Katis, 2007) and
Chapter 3 – Hamstrings-to-quadriceps ratio reliability
40
that attainable in isokinetic dynamometry (≤500° s-1). Clearly, this limitation cannot be
overcome with current dynamometers; however, the H:Q ratio has been examined at high
isokinetic velocities, even though the reliability of measurements >240° s-1 has not been
established. At higher isokinetic velocities, individuals may have a difficulty to maintain
maximal neuromuscular activation due to the short available time resulting in greater torque
variability at those velocities (Caruso et al., 2012; Iga et al., 2006). Therefore, it is important
to ensure that muscle strength testing at velocities >240° s-1 produces reliable measurements.
The adoption of a testing position that resembles the hip angle during the late swing phase
along with the examination of H:Q ratio at the highest attainable velocities would improve
the ecological validity of the reciprocal strength assessment. However it is essential to
establish the reliability of these measurements.
The isovelocity ratios are based on the peak torque of the reciprocal muscles, irrespective of
the angle at which peak torque occurs. However, the isometric H:Q ratio is calculated at a
specific angle that is the same for both muscle groups (Kong and Burns, 2010). A significant
limitation of the isometric ratio is that during dynamometry measurements of ‘isometric’
knee flexion and extension contractions, movement occurs at the knee joint resulting in a
discrepancy between the crank angle and the actual knee-joint angle (Tsaopoulos et al.,
2011). This movement is mainly due to the deformation of the soft tissue of the leg and the
compliance of the dynamometer, and despite a fixed crank angle it has been found to afford
up to 20° of discrepancy between crank angle and knee angle for knee extension (Tsaopoulos
et al., 2011; Arampatzis et al., 2004). Similar differences would be expected for knee flexion,
when the knee joint moves forwards and up relative to the dynamometer rotational axis. As
knee flexion and extension contractions are in opposite directions, the discrepancy in actual
knee joint angles between knee extensor and flexor peak torque could be as large as 40°.
Therefore, valid isometric ratios that are genuinely angle specific require measurement of
knee joint angle that is independent of crank angle. However, to date no studies have
accounted for the discrepancy in the examination of the isometric H:Q ratio and thus the
reliability of the isometric ratio obtained at true knee joint angles remains to be examined.
Therefore, the aim of this study was to evaluate the inter-session reliability of the isometric
(knee-joint angle-specific) and isovelocity (functional and conventional) H:Q ratios using a
short protocol that included muscle function measurements up to high angular velocities and
joint positions that closely replicate the conditions of high injury risk. This involved the

Chapter 3 – Hamstrings-to-quadriceps ratio reliability
41
assessment of the reliability of the knee flexors and extensors torque measurements across the
torque-velocity relationship.
Chapter 3 – Hamstrings-to-quadriceps ratio reliability
42
3.2 METHODS
3.2.1 Participants
Nine healthy, recreationally active males (age 24 ± 3 years, height 178 ± 6 cm and body mass
69.9 ± 8 kg, mean ± SD) volunteered to take part in this study. None of the participants were
involved in systematic physical training or had any previous experience of strength/power
training (i.e. weight training, plyometrics) of the lower body musculature. Their physical
activity was assessed using the International Physical Activity Questionnaire short format
[www.ipaq.ki.se/downloads.htm, (Craig et. al., 2003)] and their average energy expenditure
was 2244 ± 1284 MET-minutes/week. After completing the physical activity and health
screen questionnaires, participants provided written informed consent for their participation
in this study, which was approved by the Loughborough University Ethical Advisory
Committee. All participants were healthy with no musculo-skeletal problems or injuries of
the lower back, pelvis or legs. Participants were instructed not to take part in any
unaccustomed or strenuous physical activity for at least 2 days prior to each laboratory visit.
3.2.2 Overview
All participants visited the laboratory on four occasions, each separated by 7 days, at a
consistent time of day. All sessions involved unilateral measurements of dominant leg knee
flexor and extensor strength conducted with an isokinetic dynamometer (Con-Trex MJ, CMV
AG, Duebendorf, Switzerland). The first and third session involved identical isometric knee
flexor and extensor assessment while the second and fourth session involved identical
dynamic assessment of both muscle groups. All isometric contractions performed in the first
and third sessions, were recorded with a video camera in order to assess actual knee-joint
angles during these isometric contractions, and also facilitate conversion of crank angles to
actual knee-joint angles during all the contractions. Participants were familiarized with the
procedures of the dynamic assessment during their first visit to the laboratory. All testing
sessions were conducted by the same investigator to avoid inter-examiner variability.
3.2.3 Dynamometer Procedures
Participants were seated on the dynamometer chair with a hip angle of 120° (180°= full
extension). Two 3-point belts secured the torso and additional straps tightly secured the pelvis
and the distal thigh of their dominant leg. A brace was also placed in front of the non-
Chapter 3 – Hamstrings-to-quadriceps ratio reliability
43
involved leg. The alignment of the knee joint with the dynamometer rotational axis during
active muscle contractions was done separately for knee extension and flexion contractions.
Specifically, in each case the alignment was done during isometric contractions of >50%
MVF at a knee joint angle of ~115°. The dynamometer’s shin brace was placed ~2 cm above
the medial malleolus, anterior to the shank for knee extension contractions and posterior for
knee flexion contractions, prior to the shank being tightly secured to the dynamometer lever
arm. During the knee extension contractions, an additional moulded rigid plastic shin pad,
lined with 2 mm of high density foam, was tightly secured to the tibia to avoid any
discomfort to the shin during maximum contractions. The range of motion was established
passively and anatomical zero was set at the most extended position where participants felt
comfortable and without excessive stretch of their hamstrings. Passive torque measurements
were recorded while the tested leg was passively moved through the full range of motion and
thereafter active torque values were corrected for passive torque by the dynamometer
software. Participants were instructed to grasp the handles next to the seat during maximal
contractions. Standardised verbal encouragement was given by the same investigator and
online visual feedback of the crank torque was provided on a computer screen. Torque, crank
angle and crank angular velocity were recorded at 512 Hz during all contractions.
3.2.4 Torque-velocity relationship assessment
3.2.4.1 Isometric strength
Measurements were recorded first with the knee flexors and then the knee extensors. Prior to
the recorded contractions for each muscle group, participants completed a standardized
warm-up consisting of a progressive series of submaximal contractions. For the assessment of
peak isometric torque of each muscle group, participants performed two sets of five
maximum contractions, one at each of five different crank angles (165°, 150°, 135°, 120° and
105° in a randomized order; 180°= full extension). Participants were instructed to “push” or
“pull” as hard and as fast as possible for 3-5 s. One-minute rest was given between each
contraction, with 2 min between sets and 5 min between muscle groups.
3.2.4.2 Concentric and Eccentric strength
Initially, participants performed a standardized warm-up protocol with five submaximal
contractions of progressively higher intensity. Following the warm-up, first the knee
extensors were tested for their concentric and eccentric torque at three velocities, and then the
knee flexors were also tested at the same concentric and eccentric velocities. This involved a
Chapter 3 – Hamstrings-to-quadriceps ratio reliability
44
protocol of concentric-eccentric contractions at low (60° s-1), medium (240° s-1) and high
(400° s-1) angular velocities in this order. At each velocity participants performed 2 sets of 2
(60° s-1), 3 (240° s-1) or 5 (400° s-1) concentric-eccentric contractions over approximately 80-
85° of range of motion. A minimum of one-minute rest was given between each set, with 2
min between velocities and 5 min between muscle groups.
3.2.5 Torque data analysis
The isometric contraction with the highest torque at each crank angle was chosen for further
analysis. Isometric peak torque was defined as the average over a 500 ms epoch around (250
ms either side) the instantaneous highest torque. In order to account for the differences
between crank angle and knee-joint angle between the two sessions, the isometric torque-
knee joint angle data for each muscle group was smoothed by performing 2nd order
polynomial fitting to the raw torque values. Then the polynomial fit was used to interpolate
torque values for knee joint angles at 105, 120, 135, 150 and 165°. The isometric torque for
each muscle group and the isometric H:Q ratio data presented are the interpolated values. The
concentric and eccentric contractions at each velocity with the highest torque and isovelocity
range were chosen for further analysis. In order to control for the torque overshoot during the
acceleration and deceleration phases (Schwartz et al., 2010), data during these phases were
excluded and the constant isovelocity period (within ±10% of the prescribed crank angular
velocity, Baltzopoulos et al., 2012) was identified. Peak torque was calculated by averaging
the torque values over a 1-2° range of angles around the highest recorded torque value.
3.2.6 Knee joint angle
In order to account for the dynamometer compliance and the position change of the knee joint
relative to the dynamometer crank during testing, the actual knee joint angle was determined
during the isometric contractions. A video camera (Panasonic NV-GS200 mini-DV, Japan)
was used to record sagittal plane images at a sampling rate of 50 Hz. The camera was
positioned ~2.5 m perpendicular to the dynamometer and mounted on a tripod at a height of
~2.2 m in order to have an unobstructed view of the knee joint. Joint centres were identified
with 2 cm diameter circular marks drawn on the surface of the hip (greater trochanter), knee
(lateral collateral ligament just below the lateral femoral epicondyle) and ankle (lateral
malleolus of the fibula) joints. The knee joint angle was measured from the coordinates of the
three anatomical reference points during each participant’s best isometric contraction at each
angle. The camera tilt relative to the plane of movement, introduced a systematic error to the
Chapter 3 – Hamstrings-to-quadriceps ratio reliability
45
knee joint angle measurements. To quantify this error, the horizontal and vertical sides of a
right angle with known dimensions that was on the plane of movement, were digitised and
used as a scaling factor. The error was found to be on average ±6° (range= 0-14°) over a 90°
range of motion (90-180°, 180°= full extension). However, this systematic error was not
expected to influence the reliability of the angle-specific torque measurement as the same
camera position was replicated throughout the measurements. The measured knee joint angles
were plotted against the respective crank angles and a quadratic equation was fitted in order
to generate a knee joint angle-crank angle relationship for each muscle group. These
relationships facilitated conversion of crank angles recorded during all contractions
(isometric, concentric and eccentric) to actual knee joint angles. The coefficient of
determination for these relationships (knee joint angle vs. crank angle), calculated for each
muscle group of each participant, were very high (0.9729 ≤ R2 ≤ 1).
3.2.7 Isometric Hamstrings-to-Quadriceps ratio
The isometric hamstrings-to-quadriceps ratio (H:Qisom) was calculated by dividing the
hamstrings torque at each knee-joint angle by the quadriceps torque at the same angle.
3.2.8 Functional Hamstrings-to-Quadriceps ratio
The dynamic hamstrings-to-quadriceps functional ratio (H:Qfunc) was calculated by dividing
the hamstrings eccentric peak torque at each angular velocity by the quadriceps concentric
peak torque at the same velocity.
3.2.9 Conventional Hamstring-to-Quadriceps ratio
The hamstrings-to-quadriceps conventional ratio (H:Qconv) was calculated by dividing the
hamstrings concentric peak torque by the quadriceps concentric peak torque at the same
angular velocity.
3.2.10 Statistics
Group data are presented as mean ± standard deviation (SD) between individuals. Differences
between sessions for peak torque and H:Q ratios were examined with one-way repeated
measures analysis of variance. Test-retest absolute reliability was assessed with the intra-
individual standard deviation (SDw) and the coefficient of variation (CVw, calculated as the
SDw divided by the mean of the two sessions for each individual). No established cut-off
criteria exist for the interpretation of the reliability statistics. In this study, the arbitrary
Chapter 3 – Hamstrings-to-quadriceps ratio reliability
46
classification followed was: <10% high, 10-15% moderate and >15% low for the CV, and
<0.60 low, 0.60-0.80 moderate and >0.80 high for the ICC. Differences in the CVw statistic
were examined with repeated measures analysis of variance and post hoc comparisons were
performed with paired t-tests with Bonferonni correction. The intra-class correlation
coefficient (ICC; two-way random effects model with single measure reliability - 2,1) was
used to assess the relative reliability. Differences in the ICC statistic between muscle groups
were examined with paired t-tests. A P< 0.05 level of significance was used for all statistical
tests.
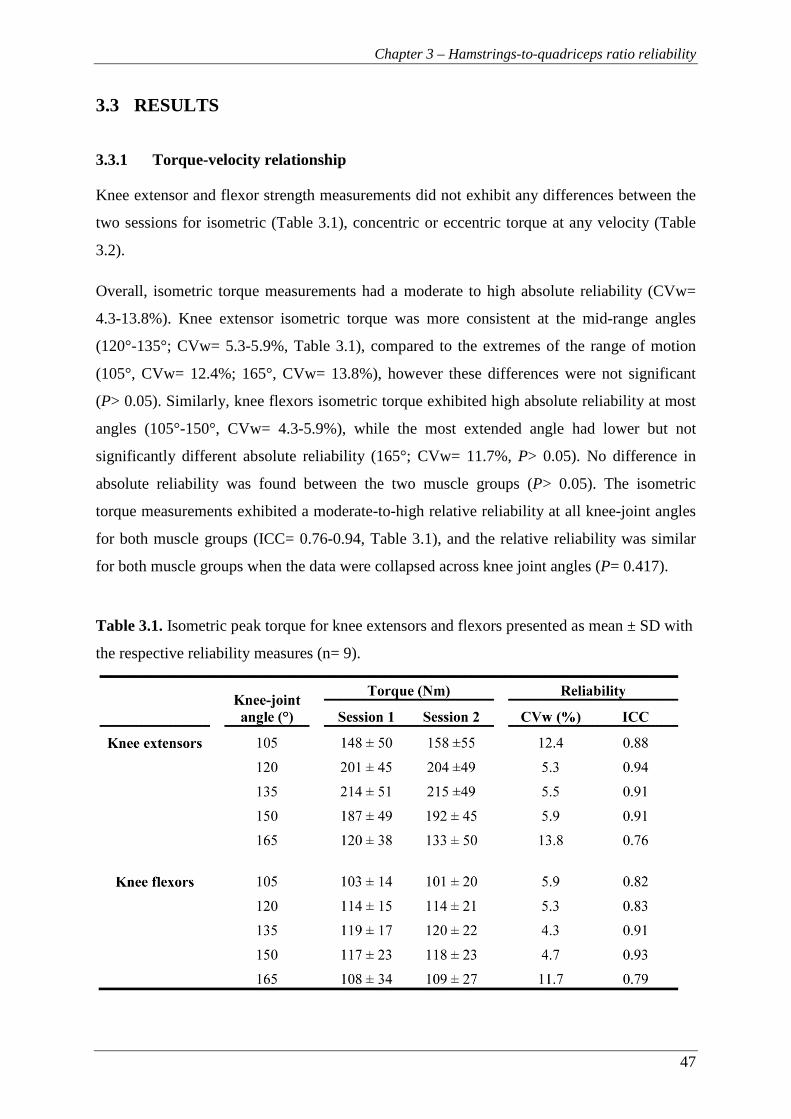
Chapter 3 – Hamstrings-to-quadriceps ratio reliability
47
3.3 RESULTS
3.3.1 Torque-velocity relationship
Knee extensor and flexor strength measurements did not exhibit any differences between the
two sessions for isometric (Table 3.1), concentric or eccentric torque at any velocity (Table
3.2).
Overall, isometric torque measurements had a moderate to high absolute reliability (CVw=
4.3-13.8%). Knee extensor isometric torque was more consistent at the mid-range angles
(120°-135°; CVw= 5.3-5.9%, Table 3.1), compared to the extremes of the range of motion
(105°, CVw= 12.4%; 165°, CVw= 13.8%), however these differences were not significant
(P> 0.05). Similarly, knee flexors isometric torque exhibited high absolute reliability at most
angles (105°-150°, CVw= 4.3-5.9%), while the most extended angle had lower but not
significantly different absolute reliability (165°; CVw= 11.7%, P> 0.05). No difference in
absolute reliability was found between the two muscle groups (P> 0.05). The isometric
torque measurements exhibited a moderate-to-high relative reliability at all knee-joint angles
for both muscle groups (ICC= 0.76-0.94, Table 3.1), and the relative reliability was similar
for both muscle groups when the data were collapsed across knee joint angles (P= 0.417).
Table 3.1. Isometric peak torque for knee extensors and flexors presented as mean ± SD with
the respective reliability measures (n= 9).
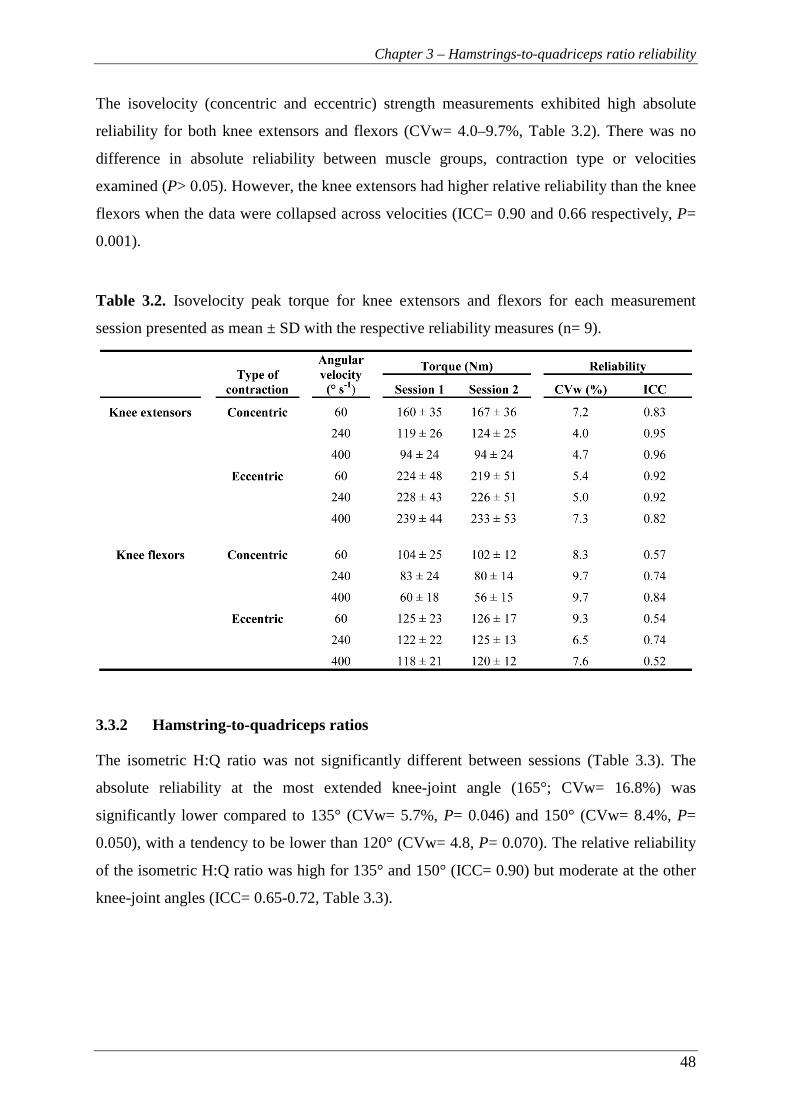
Chapter 3 – Hamstrings-to-quadriceps ratio reliability
48
The isovelocity (concentric and eccentric) strength measurements exhibited high absolute
reliability for both knee extensors and flexors (CVw= 4.0–9.7%, Table 3.2). There was no
difference in absolute reliability between muscle groups, contraction type or velocities
examined (P> 0.05). However, the knee extensors had higher relative reliability than the knee
flexors when the data were collapsed across velocities (ICC= 0.90 and 0.66 respectively, P=
0.001).
Table 3.2. Isovelocity peak torque for knee extensors and flexors for each measurement
session presented as mean ± SD with the respective reliability measures (n= 9).
3.3.2 Hamstring-to-quadriceps ratios
The isometric H:Q ratio was not significantly different between sessions (Table 3.3). The
absolute reliability at the most extended knee-joint angle (165°; CVw= 16.8%) was
significantly lower compared to 135° (CVw= 5.7%, P= 0.046) and 150° (CVw= 8.4%, P=
0.050), with a tendency to be lower than 120° (CVw= 4.8, P= 0.070). The relative reliability
of the isometric H:Q ratio was high for 135° and 150° (ICC= 0.90) but moderate at the other
knee-joint angles (ICC= 0.65-0.72, Table 3.3).
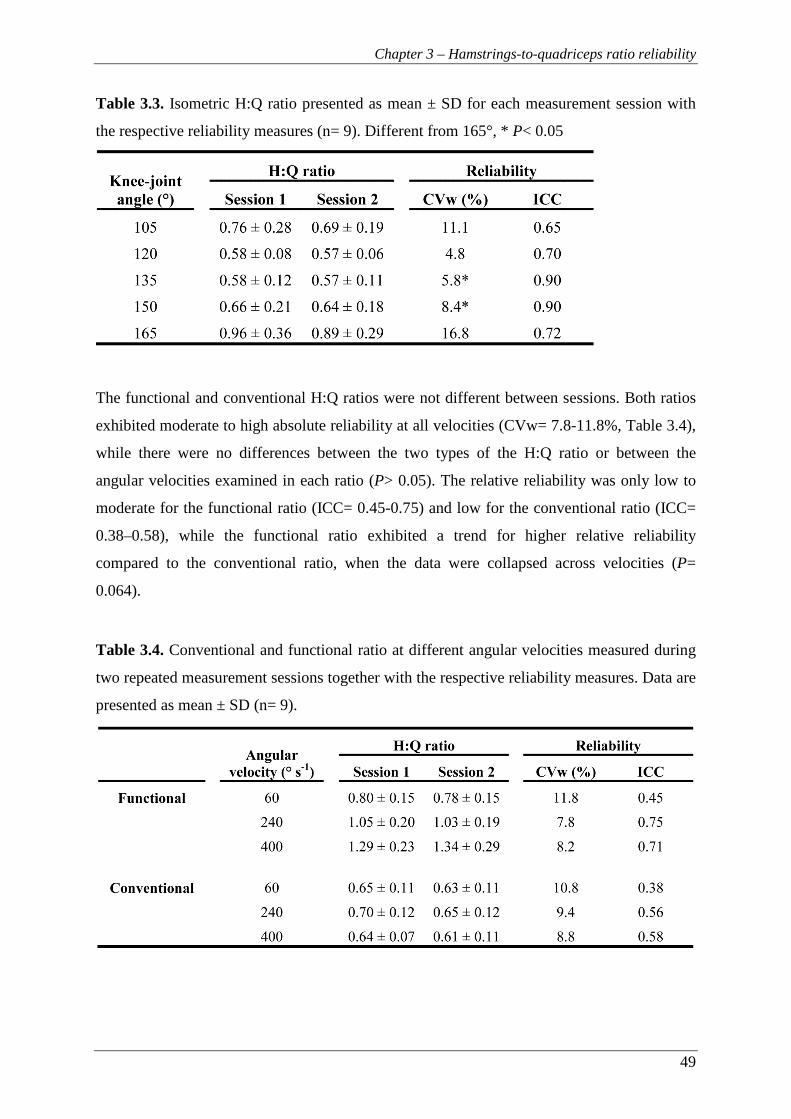
Chapter 3 – Hamstrings-to-quadriceps ratio reliability
49
Table 3.3. Isometric H:Q ratio presented as mean ± SD for each measurement session with
the respective reliability measures (n= 9). Different from 165°, * P< 0.05
The functional and conventional H:Q ratios were not different between sessions. Both ratios
exhibited moderate to high absolute reliability at all velocities (CVw= 7.8-11.8%, Table 3.4),
while there were no differences between the two types of the H:Q ratio or between the
angular velocities examined in each ratio (P> 0.05). The relative reliability was only low to
moderate for the functional ratio (ICC= 0.45-0.75) and low for the conventional ratio (ICC=
0.38–0.58), while the functional ratio exhibited a trend for higher relative reliability
compared to the conventional ratio, when the data were collapsed across velocities (P=
0.064).
Table 3.4. Conventional and functional ratio at different angular velocities measured during
two repeated measurement sessions together with the respective reliability measures. Data are
presented as mean ± SD (n= 9).
Chapter 3 – Hamstrings-to-quadriceps ratio reliability
50
3.4 DISCUSSION
The main aim of this study was to examine the test-retest reliability of the isometric,
functional and conventional H:Q ratio using a short protocol that replicated the hip and knee
joint angles during conditions of high injury risk. We found that the functional and
conventional H:Q ratio exhibited good absolute reliability but low to moderate relative
reliability. Furthermore, the knee-joint angle-specific isometric H:Q ratio exhibited high
absolute reliability at all mid-range angles, but it was less reliable at extreme knee joint
angles. Overall, the applied protocol assessed the knee-joint strength balance with acceptable
test-retest reliability similar to that reported in the literature.
Even though the H:Q ratio is extensively used to identify potentially injurious knee-joint
strength imbalances, it is often obtained in conditions that ignore the biomechanics of the
hamstrings strain injury. The protocol employed in this study accounted for these conditions
(i.e. relatively extended hip joint position and high knee-joint angular velocities) to the
greatest possible extent, and produced reliable measurements of the isovelocity and isometric
H:Q ratios. Both functional and conventional ratios had moderate to high absolute reliability
at all examined velocities (CVw= 7.8-11.8%). The current investigation is the first to
examine the reliability of the H:Q ratio at velocities >240° s-1, and found that it can be
examined with acceptable reliability at velocities up to 400° s-1. Concerning the lower
velocities, our results are within the range of previous findings (Ayala et al., 2012;
Impellizzeri et al., 2008; Sole et al., 2007). However, absolute reliability for the isovelocity
H:Q ratios has been found to vary significantly (60° s-1, CV= 5.1-7.1%; Impellizzeri et al.,
2008; 60-240° s-1, CV= 16.3-20.6%; Ayala et al., 2012). These studies thoroughly
familiarised their participants using 3 testing sessions and more extensive protocols compared
to the current study. However, Ayala et al. (2012) reported low reliability which may be due
to the adoption of a prone testing position, as at that position it is more difficult to control for
extraneous movement at the hip joint. Despite the good absolute reliability found for the H:Q
ratios in our study, the relative reliability was generally low. Similar results have been
reported previously (Ayala et al., 2012; Impellizzeri et al., 2008; Sole et al., 2007).
Overall, concentric and eccentric strength measurements for the knee extensors and flexors
had high absolute reliability (CVw= 4.0-9.7%) suggesting that this protocol accurately
assessed the individuals’ torque-velocity relationship. These results are better (Ayala et al.,
2013) or similar to those reported in other studies (Sole et al., 2007; Pincivero et al., 1997).

Chapter 3 – Hamstrings-to-quadriceps ratio reliability
51
However, higher absolute reliability has been found in studies that provided more thorough
familiarisation (Impellizzeri et al., 2008; Maffiuletti et al., 2007; Gleeson and Mercer, 1992).
In this study, a relatively short protocol was applied in an effort to reduce the time needed for
the assessment of the reciprocal strength balance at the knee joint. While extensive
familiarisation would be expected to improve the reliability of the measurements (Hopkins et
al., 2001), it is not always feasible when assessing athletes.
In our study, the relative reliability of isovelocity strength was higher for the knee extensors
compared to knee flexors when collapsed across different contraction types and velocities
(0.90 and 0.65 respectively, P= 0.001). Yet, other studies reported similar relative reliability
between these muscle groups (Impellizzeri et al., 2008; Maffiuletti et al., 2007; Sole et al.,
2007; Gleeson and Mercer, 1992). These studies examined more heterogeneous cohorts
including males and females compared to the current investigation. As the relative reliability
examines how well the individuals maintain their rank within the cohort from session to
session, individuals with similar peak torque values may change rank between sessions
without exhibiting large intra-individual differences. This may explain the relatively low
relative reliability (low ICC) in the current study, despite high absolute reliability (low CVw).
This is the first study to examine the reliability of the measured angle-specific isometric H:Q
ratio. The isometric ratio was highly consistent (CVw= 4.8-8.4%) at knee joint angles
between 120° and 150°, but less reliable at the extended position of 165°. A similar pattern
was noted for the angle-specific isometric torque which was consistent between sessions for
the mid-range knee-joint angles (CVw= 4.3-5.9%) and more variable at the extremes,
particularly for the knee extensors (CVw=11.7–13.8%). This may be partly explained by the
need to extrapolate outside the range of measured angles for some individuals and therefore
the predicted values may be considerably away from the real ones due to the inherent
uncertainty of extrapolation (Chapra, 2008). Also, at these more extreme positions
participants reported increased discomfort compared to the other angles and this may have
also influenced their motivation. Similarly, there is evidence to suggest that voluntary
activation of the knee extensors during maximum efforts may be inhibited at shorter muscle
lengths/extended positions (Becker and Awiszus, 2001) potentially due to the shorter muscle
spindle lengths which, in turn, decrease the Ia afferents discharge rate resulting in lower
excitatory drive. Another possible mechanism is the increase in knee joint ligament tension
that would alter the gamma drive to quadriceps spindles and finally the excitatory drive
(Becker and Awiszus, 2001). The above-mentioned methodological and physiological factors

Chapter 3 – Hamstrings-to-quadriceps ratio reliability
52
may explain the reduced consistency of knee extensor peak torque measurements at the most
extended position. To our knowledge, the only other study that examined the isometric H:Q
ratio reported lower absolute reliability at a single crank angle (120°, CVw= 10.6%; de
Carvalho Froufe Andrade et al., 2013). For knee extensors and flexors isometric torque, our
findings are in accordance with previous investigations (120°, knee extensors, CVw= 4.2-
5.5% knee flexors, CVw= 4.7-5.8 %, de Carvalho Froufe Andrade et al., 2013; Maffiuletti et
al., 2007). In our study, the relative reliability of the isometric H:Q ratio was moderate to
high suggesting that individuals maintained their position within the cohort well (ICC= 0.70-
0.90). However, de Carvalho Froufe Andrade et al. (2013) reported higher reliability (ICC=
0.87). Generally, good relative reliability was found for the isometric strength assessment of
the individual muscle groups (ICC= 0.76-0.94). However, Maffiuletti et al. (2007) reported
very high relative reliability (ICC> 0.97) for both knee extensors and flexors. This difference
is likely due to the examination of a more diverse cohort of males and females with high
between-subjects variability (CV, 27.5% (extensors) and 30.7% (flexors) vs 5.3% for both
muscle groups at 120° in the current study) resulting in high ICC scores.
In conclusion, the protocol used in the present study produced consistent measurements
between sessions of the functional, conventional and isometric H:Q ratio and the torque-
velocity relationship of the knee extensors and flexors up to high angular velocities. The
lower relative reliability compared to other studies may be attributed to the small
homogenous sample size and the limited familiarisation allowed. The results of this study
supported the further use of the current protocol in the examination of the strength balance
between footballers and normal individuals (Chapter 4).
Chapter 4 – Angle-specific hamstrings-to-quadriceps ratio
53
Chapter 4
Angle-specific hamstrings-to-quadriceps ratio. A comparison of football players and recreationally
active males

Chapter 4 – Angle-specific hamstrings-to-quadriceps ratio
54
4 CHAPTER 4 – ANGLE-SPECIFIC HAMSTRINGS-TO-
QUADRICEPS RATIO. A COMPARISON OF FOOTBALL
PLAYERS AND RECREATIONALLY ACTIVE MALES
4.1 INTRODUCTION
Hamstrings strains have been reported as one of the most common injuries in a variety of
football codes, accounting for 12-16% of all injuries (Woods et al., 2004). Woods et al (2004)
found an average of 90 training days and 15 matches were missed per club per season due to
hamstrings strains. This type of injury is thought to occur during the late swing phase of
sprinting when the hamstrings are at their peak stretch and working eccentrically to
decelerate the shank (Heiderscheit et al., 2005).
Muscle imbalances and particularly hamstrings-to-quadriceps imbalances, have been widely
suggested as potential risk factors for non-contact knee joint injuries and hamstrings strains
(Yeung et al., 2009; Croisier et al., 2008, 2002). Hamstrings-to-quadriceps imbalances can be
defined as disproportionately low hamstrings strength (maximal or explosive) relative to
quadriceps strength (Hannah et al., 2014; Greco et al., 2013; Zebis et al., 2011). Furthermore,
it has been shown that correcting muscle strength imbalances of football players decreased
the incidence of hamstrings injuries during the subsequent season (Croisier et al., 2008).
Regular football training and match play could induce an imbalance in hamstrings-to-
quadriceps function. For example, football participation involves running and jumping on
soft turf as well as frequent kicking both of which may promote disproportionate quadriceps
development. However, it remains unclear if football players present a systematic
hamstrings-to-quadriceps imbalance that predisposes them to hamstrings strains.
Muscle balance at the knee joint has typically been quantified by measuring the hamstrings-
to-quadriceps peak torque ratio. Originally, it was calculated from the concentric peak torque
of the two muscle groups, known as the conventional ratio. Later the functional ratio was
introduced (Aagaard et al., 1995), which calculates the ratio of hamstrings peak eccentric to
quadriceps peak concentric torque, and it is thought to better reflect the reciprocal
antagonistic function of the muscles during athletic activities such as sprinting and kicking.
However, the opposing quadriceps and hamstrings muscles exert their peak torque at
different knee joint angles (~115° and ~150° respectively, 180°= full extension) (Knapik et

Chapter 4 – Angle-specific hamstrings-to-quadriceps ratio
55
al., 1983). This joint angle discrepancy inherent within any peak torque ratio may reduce the
validity of the functional ratio to assess reciprocal antagonistic muscle function. Assessment
of the knee flexors to extensors strength ratio at the same knee joint angle may provide a
more functionally relevant measurement. This angle-specific functional strength ratio could
be calculated throughout the range of motion, although measurements at extended knee joint
positions, similar to those during the late swing phase, may be most relevant for hamstrings
strain injury. It is possible that a hazardous muscle strength imbalance may be angle-specific
and more pronounced at the extended knee joint positions. Therefore, monitoring the angle-
specific muscle strength balance over the range of motion, and particularly at extended knee
joint positions where injuries usually occur, may be crucial for the detection of any strength
imbalances. However, there are no data on the knee joint angle-specific strength balance over
the range of motion of either footballers or healthy, recreationally active population.
From the limited findings in the literature it is unclear how football participation influences
hamstrings-to-quadriceps muscle balance, with evidence for disproportionate development of
the knee extensors (Tourny-Chollet & Leroy, 2002; Iga et al., 2009) and the knee flexors
(Cometti et al., 2001; Fousekis et al., 2010). A lower functional H:Q ratio at a range of
different velocities has been reported for footballers compared to untrained males, with
footballers presenting higher quadriceps concentric strength, but similar hamstrings eccentric
strength to that of controls (Tourny-Chollet & Leroy, 2002; Iga et al., 2009). Based on these
results it can be hypothesized that football participation develops quadriceps strength more
than the hamstrings, leading to an imbalance that may predispose to injury. Contrary to this
suggestion, two other studies have found professional players to have a higher functional H:Q
ratio than players at a lower standard of competition (Cometti et al., 2001; Fousekis et al.,
2010). Therefore, it is currently unclear how football participation affects knee joint muscle
balance, and in particular the angle-specific functional ratio at extended joint positions
remains unknown.
An angle-specific H:Q ratio across the range of motion and at a range of different velocities
would provide a more complete understanding of the strength balance between the knee
extensors and flexors and thoroughly examine whether footballers have a different muscle
balance from that of normal, recreationally active individuals. Therefore the aim of this study
was to compare the angle-specific H:Q ratios between football players and recreationally
active controls up to high angular velocities.

Chapter 4 – Angle-specific hamstrings-to-quadriceps ratio
56
4.2 METHODS
4.2.1 Participants
Ten male football players (age 21 ± 1 years, height 180.7 ± 6 cm, body mass 78 ± 8 kg, mean
± SD) and fourteen healthy, recreationally active males (age 25 ± 3 years, height 177 ± 5 cm,
body mass 69.7 ± 7 kg, mean ± SD) volunteered to take part in this study. The football
players were members of Loughborough University’s 1st team which competed in Midlands
Football Alliance (9th tier of English football) and BUCS Premier League (3rd place for 2011-
12), and had on average 8.5 ± 6 years of experience in football practice and competition.
They completed 4-5 football training sessions and 1-2 matches per week. The players also
performed limited strength training; 1-2 times per month during the season and up to 8 times
per month during pre-season. All testing sessions for the football players took place during
the season. None of the control group participants were involved in systematic physical
training or had any previous experience of strength/power training (i.e. weight training,
plyometrics) of the lower body musculature. The physical activity of the control group was
assessed using the International Physical Activity Questionnaire short format
[www.ipaq.ki.se/downloads.htm, (Craig et. al., 2003)] and their average energy expenditure
was 1850 ± 1138 MET-minutes/week. Participants completed physical activity and health
screen questionnaires before providing written informed consent for their participation in this
study, which was approved by the Loughborough University Ethical Advisory Committee.
All participants were healthy with no history of musculo-skeletal problems or injuries of the
lower back, pelvis or legs. Participants were instructed not to take part in any unaccustomed
or strenuous physical activity for at least 2 days prior to each laboratory visit.
4.2.2 Overview
All testing sessions were performed in the afternoon and each participant visited the
laboratory at a consistent time of day on two occasions 7 days apart. These sessions involved
unilateral measurements of the dominant leg (defined as the preferred leg when kicking a
ball), specifically knee flexor and extensor strength assessed with an isokinetic dynamometer
(Con-Trex MJ, CMV AG, Duebendorf, Switzerland). The first session involved
anthropometric measurements and isometric knee flexor and extensor assessment, as well as
familiarisation with the concentric and eccentric measurements of both muscle groups. The
second session involved concentric and eccentric strength measurements of both muscle

Chapter 4 – Angle-specific hamstrings-to-quadriceps ratio
57
groups. Video images were recorded during the isometric contractions in session 1 and used
to calculate the knee joint angle-crank angle relationships during extension and flexion
contractions. These relationships were used to calculate knee joint angle from crank angle
during the dynamic contractions.
4.2.3 Dynamometer Procedures
The participants were seated on the dynamometer chair with a hip angle of 120° (180°= full
extension). This hip angle was selected because of its relevance to high injury risk situations
i.e. similar to the hip angle during late swing phase in sprinting (Guex et al., 2012) when
hamstrings strains are thought to occur. Two 3-point belts secured the torso and additional
straps secured the pelvis and the distal thigh of their dominant leg. A brace was also placed in
front of the non-involved leg. The alignment of the knee joint with the dynamometer
rotational axis during active muscle contractions was done separately for knee extension and
flexion contractions. Specifically, in each case the alignment was done during isometric
contractions of >50% MVF at a knee joint angle of ~115°. The dynamometer’s shin brace
was placed ~2 cm above the medial malleolus, anterior to the shank for knee extension
contractions and posterior for knee flexion contractions, prior to the shank being tightly
secured to the dynamometer lever arm. During the knee extension contractions, an additional
moulded rigid plastic shin pad, lined with 2 mm of high density foam, was tightly secured to
the tibia to avoid any discomfort to the shin during maximum contractions. The range of
motion was established and anatomical zero was set at the most extended position where
participants felt comfortable and without excessive stretch of their hamstrings. Passive torque
measurements were recorded while the tested leg was passively moved through the full range
of motion and thereafter active torque values were corrected for passive torque by the
dynamometer software. Participants were instructed to grasp the handles next to the seat
during maximal contractions. Standardized verbal encouragement was given by the same
investigator and online visual feedback of the crank torque was provided on a computer
screen. Torque, crank angle and crank angular velocity were recorded at 512 Hz during all
contractions.
4.2.4 Isometric Peak Torque assessment
Measurements were recorded first with the knee flexors and then the knee extensors. Prior to
the recorded contractions for each muscle group, participants completed a standardized
warm-up consisting of a progressive series of submaximal contractions. For the assessment of
Chapter 4 – Angle-specific hamstrings-to-quadriceps ratio
58
peak isometric torque of each muscle group, participants performed two sets of five
maximum contractions, one at each of five different crank angles (165°, 150°, 135°, 120° and
105° in a randomized order; 180°= full extension). Participants were instructed to “push” or
“pull” as hard and as fast as possible for 3-5 s. One-minute rest was given between each
contraction, with 2 min between sets and 5 min between muscle groups.
4.2.5 Dynamic Peak Torque assessment
Initially, participants performed a standardized warm-up protocol with five submaximal
contractions of progressively higher intensity. Following the warm-up, first the knee
extensors were tested for their isovelocity torque at three velocities, and then the knee flexors
were also tested at the same velocities. This involved a protocol of concentric-eccentric
contractions at low (60° s-1), medium (240° s-1) and high (400° s-1) angular velocities in this
order. At each velocity participants performed 2 sets of 2 (60° s-1), 3 (240° s-1) or 5 (400° s-1)
concentric-eccentric contractions over approximately 80-85° of range of motion. A minimum
of one-minute rest was given between each set, with 2 min between velocities and 5 min
between muscle groups.
4.2.6 Data Analysis
4.2.6.1 Peak Torque
The isometric contraction with the highest torque at each crank angle was chosen for further
analysis. Isometric peak torque was defined as the average over a 500 ms epoch around (250
ms either side) the instantaneous highest torque. The concentric and eccentric contractions at
each velocity with the highest torque and isovelocity range were chosen for further analysis.
In order to control for the torque overshoot during the acceleration and deceleration phases
(Schwartz et al., 2010), data during these phases were excluded and the constant isovelocity
period (within ±10% of the prescribed crank angular velocity, Baltzopoulos et al., 2012) was
identified. Peak torque was calculated by averaging the torque values over a 1-2° range of
angles around the highest recorded torque value.
4.2.6.2 Angle-specific torque
The isometric torque-knee joint angle data for each muscle group was smoothed by
performing 2nd order polynomial fitting to the raw torque values. Then the polynomial fit was
used to interpolate torque values for knee joint angles at 105, 120, 135, 150 and 165°. The
isovelocity torque-knee joint angle data at each velocity, for each muscle group was

Chapter 4 – Angle-specific hamstrings-to-quadriceps ratio
59
smoothed by performing Gaussian fitting (Forrester et al., 2011) using a root mean square
method to minimise the error to the raw torque values (Matlab, The Mathworks, Inc., Natick,
MA, USA). Then the Gaussian fit was used to interpolate torque values for knee joint angles
every 5° over the relevant isovelocity range for each angular velocity: 100-160° for 60° s-1;
105-160° for 240° s-1; and 115-145° for 400° s-1. Data from contractions in which participants
failed to maximally activate the examined muscle group throughout the range of motion were
discarded.
4.2.6.3 Knee joint angle
In order to account for the dynamometer compliance and the position change of the knee joint
relative to the dynamometer crank during testing, the actual knee joint angle was determined
during the isometric contractions. A video camera (Panasonic NV-GS200 mini-DV, Japan)
was used to record sagittal plane images at a sampling rate of 50 Hz. The camera was
positioned ~2.5 m perpendicular to the dynamometer and mounted on a tripod at a height of
~2.2 m in order to have an unobstructed view of the knee joint. Joint centres were identified
with 2 cm diameter circular marks drawn on the surface of the hip (greater trochanter), knee
(lateral collateral ligament just below the lateral femoral epicondyle) and ankle (lateral
malleolus of the fibula) joints. The knee joint angle was measured from the coordinates of the
three anatomical reference points during each participant’s best isometric contraction at each
angle. The camera tilt relative to the plane of movement, introduced a systematic error to the
knee joint angle measurements. To quantify this error, the horizontal and vertical sides of a
right angle with known dimensions that was on the plane of movement, were digitised and
used as a scaling factor. The error was found to be on average ±6° (range= 0-14°) over a 90°
range of motion (90-180°, 180°= full extension). However, this systematic error was not
expected to invalidate the comparison of the angle-specific torque and the H:Q ratios between
the examined cohorts as the same camera position was replicated throughout the
measurements. The measured knee joint angles were plotted against the respective crank
angles and a quadratic equation was fitted in order to generate a knee joint angle-crank angle
relationship for each muscle group. These relationships facilitated conversion of crank angles
recorded during all contractions (isometric, concentric and eccentric) to actual knee joint
angles. The coefficient of determination for these relationships (knee joint angle vs. crank
angle), calculated for each muscle group of each participant, were very high (0.9729 ≤ R2 ≤
1), however on average the hamstrings regression line was slightly steeper than that of the
quadriceps.
Chapter 4 – Angle-specific hamstrings-to-quadriceps ratio
60
4.2.6.4 Isometric Hamstrings-to-Quadriceps ratio
The isometric hamstrings-to-quadriceps ratio (H:Qisom) was calculated by dividing the
hamstrings torque at each knee joint angle by the quadriceps torque at the same angle.
4.2.6.5 Functional Hamstrings-to-Quadriceps ratio
The non-angle specific dynamic hamstrings-to-quadriceps functional ratio (H:Qfunc) was
calculated by dividing the hamstrings eccentric peak torque (Hecc) at each angular velocity
by the quadriceps concentric peak torque (Qcon) at the same velocity. Peak torque was
independent of knee joint angle, and thus the measurements of each muscle group were made
at different angles.
H:Qfunc= Hecc / Qcon
The dynamic angle-specific hamstrings-to-quadriceps functional ratio (H:Qfuncθ) was
calculated by dividing the hamstrings eccentric torque (Heccθ) at each angular velocity and
knee joint angle by the quadriceps concentric torque (Qconθ) at the same velocity and knee
joint angle.
H:Qfuncθ= Heccθ / Qconθ
4.2.6.6 Conventional Hamstrings-to-Quadriceps ratio
The non-angle specific hamstrings-to-quadriceps conventional ratio (H:Qconv) was
calculated by dividing the hamstrings concentric peak torque (Hcon) by the quadriceps
concentric peak torque (Qcon) at the same angular velocity. Peak torque was independent of
knee joint angle, and therefore the measurements of each muscle group were made at
different angles.
H:Qconv= Hcon / Qcon
The angle-specific hamstrings-to-quadriceps conventional ratio (H:Qconvθ) was calculated by
dividing the hamstrings concentric angle-specific torque (Hconθ) at each angular velocity and
knee joint angle by the quadriceps concentric angle-specific torque (Qconθ) at the same
velocity and knee joint angle.
H:Qconvθ= Hconθ / Qconθ

Chapter 4 – Angle-specific hamstrings-to-quadriceps ratio
61
4.2.7 Statistical Analysis
Group data are presented as mean ± SD. Torque values were normalized to body mass to
compare the two groups (Folland et al., 2008). A two-way repeated measures analysis of
variance (ANOVA) was used to determine if there were differences between groups for
angle-specific torque (groups x angle) and angle-specific H:Q ratios (groups x angle). For the
non-angle-specific torque and ratios a two-way repeated measures ANOVA was used (groups
x velocity). The assumption of sphericity was assessed with Mauchly’s test and the
Greenhouse-Geisser correction was applied when needed. When differences were found by
ANOVA, independent t-test with Holm-Bonferonni correction of the P level of significance
for multiple comparisons was used as a post-hoc test. A P < 0.05 level of significance was
used for all comparisons. The effect sizes were calculated using the Cohen’s d statistic. All
statistical procedures were performed with IBM SPSS 19 (IBM Corporation, Armonk, NY).

Chapter 4 – Angle-specific hamstrings-to-quadriceps ratio
62
4.3 RESULTS
4.3.1 Anthropometric characteristics
Football players had higher body mass compared to the controls (78 ± 8 vs. 69.7 ± 7 kg, t22= -
2.37, P= 0.027), but there were no differences in height between the groups, (footballers:
180.7 ± 6 cm; controls: 177 ± 5 cm, t22= -0.37, P= 0.73).
4.3.2 H:Q ratios
The angle-specific isometric H:Q ratio was not different between groups, F1,22= 0.71, P= 0.41
(Fig. 4.1; Table 4.1). Furthermore, the angle-specific functional H:Q ratio was similar for
both groups at all three velocities (0.12 < P < 0.50) (Fig. 4.2). This was also the case for the
angle-specific conventional H:Q ratio with no differences between the groups at any velocity
(0.055 < P < 0.612) (Fig. 4.3). In addition, when non-angle-specific functional and
conventional H:Q ratios were compared there were also no differences between groups
(F1,22= 0.14, P= 0.71 and F1,22= 0.15, P= 0.71 respectively) (Fig. 4.4).
Figure 4.1. Angle-specific isometric H:Q ratio for footballers (filled squares, n=10) and
controls (open squares, n= 14). Data are presented as mean ± SD.

Chapter 4 – Angle-specific hamstrings-to-quadriceps ratio
63
Figure 4.2. Angle-specific functional H:Q
ratio for footballers (Fb, filled squares) and
controls (Con, open squares) at: (A) 60° s-1
(Fb, n= 10, Con, n= 14), (B) 240° s-1 (Fb, n=
9; Con, n= 13) and (C) 400° s-1 (Fb, n= 10,
Con, n= 14). Data are presented as mean ±
SD.
Figure 4.3. Angle-specific conventional H:Q
ratio for footballers (Fb, filled squares) and
controls (Con, open squares) at: (A) 60° s-1
(Fb, n= 10, Con, n= 14), (B) 240° s-1 (Fb, n=
9; Con, n= 13) and (C) 400° s-1 (Fb, n= 8,
Con, n= 10). Data are presented as mean ±
SD.
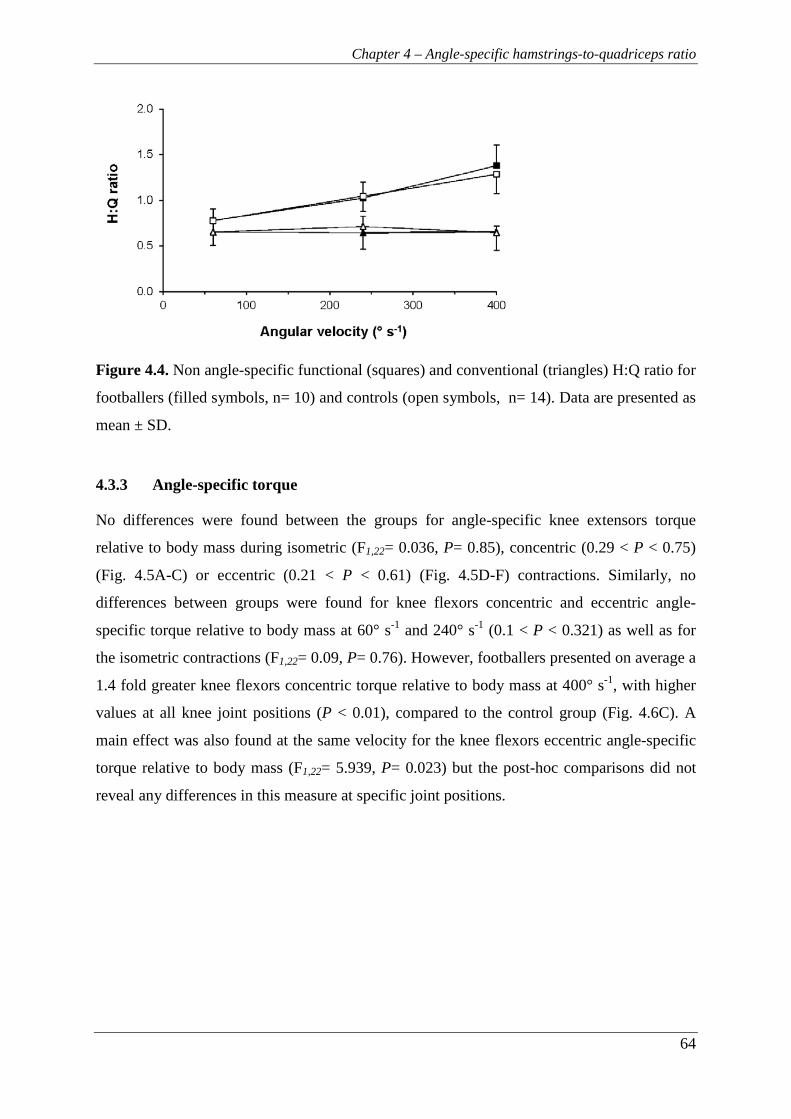
Chapter 4 – Angle-specific hamstrings-to-quadriceps ratio
64
Figure 4.4. Non angle-specific functional (squares) and conventional (triangles) H:Q ratio for
footballers (filled symbols, n= 10) and controls (open symbols, n= 14). Data are presented as
mean ± SD.
4.3.3 Angle-specific torque
No differences were found between the groups for angle-specific knee extensors torque
relative to body mass during isometric (F1,22= 0.036, P= 0.85), concentric (0.29 < P < 0.75)
(Fig. 4.5A-C) or eccentric (0.21 < P < 0.61) (Fig. 4.5D-F) contractions. Similarly, no
differences between groups were found for knee flexors concentric and eccentric angle-
specific torque relative to body mass at 60° s-1 and 240° s-1 (0.1 < P < 0.321) as well as for
the isometric contractions (F1,22= 0.09, P= 0.76). However, footballers presented on average a
1.4 fold greater knee flexors concentric torque relative to body mass at 400° s-1, with higher
values at all knee joint positions (P < 0.01), compared to the control group (Fig. 4.6C). A
main effect was also found at the same velocity for the knee flexors eccentric angle-specific
torque relative to body mass (F1,22= 5.939, P= 0.023) but the post-hoc comparisons did not
reveal any differences in this measure at specific joint positions.
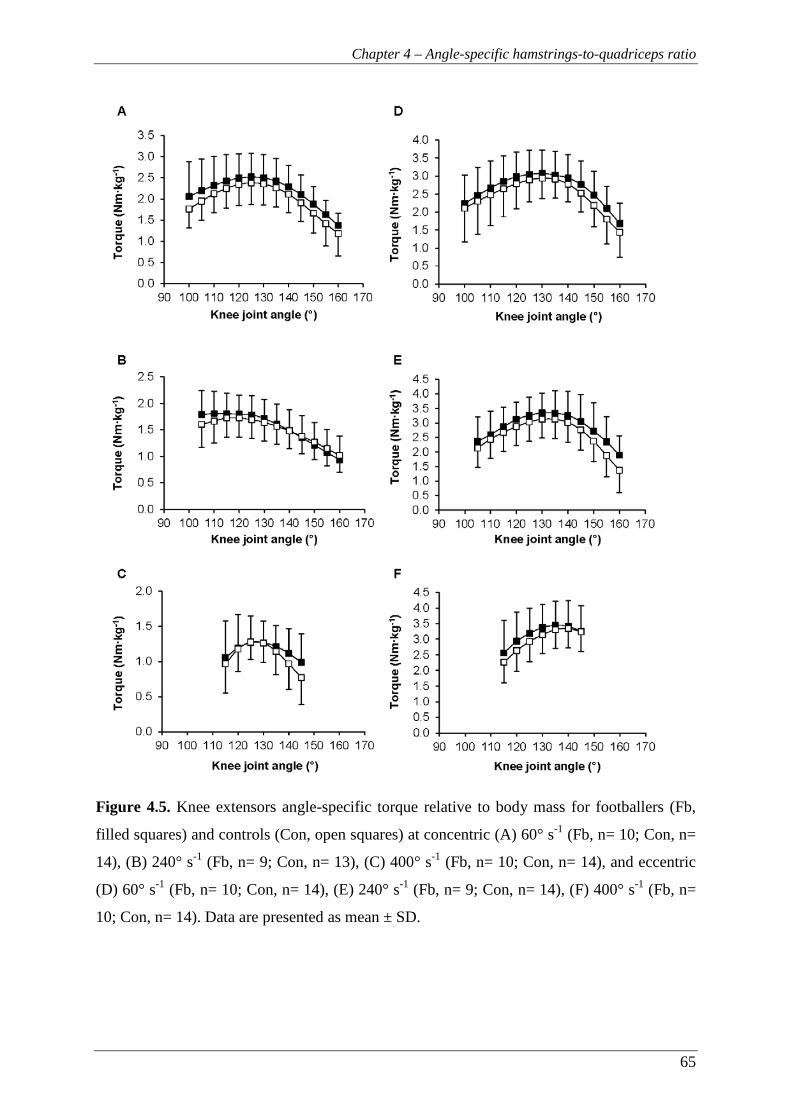
Chapter 4 – Angle-specific hamstrings-to-quadriceps ratio
65
Figure 4.5. Knee extensors angle-specific torque relative to body mass for footballers (Fb,
filled squares) and controls (Con, open squares) at concentric (A) 60° s-1 (Fb, n= 10; Con, n=
14), (B) 240° s-1 (Fb, n= 9; Con, n= 13), (C) 400° s-1 (Fb, n= 10; Con, n= 14), and eccentric
(D) 60° s-1 (Fb, n= 10; Con, n= 14), (E) 240° s-1 (Fb, n= 9; Con, n= 14), (F) 400° s-1 (Fb, n=
10; Con, n= 14). Data are presented as mean ± SD.
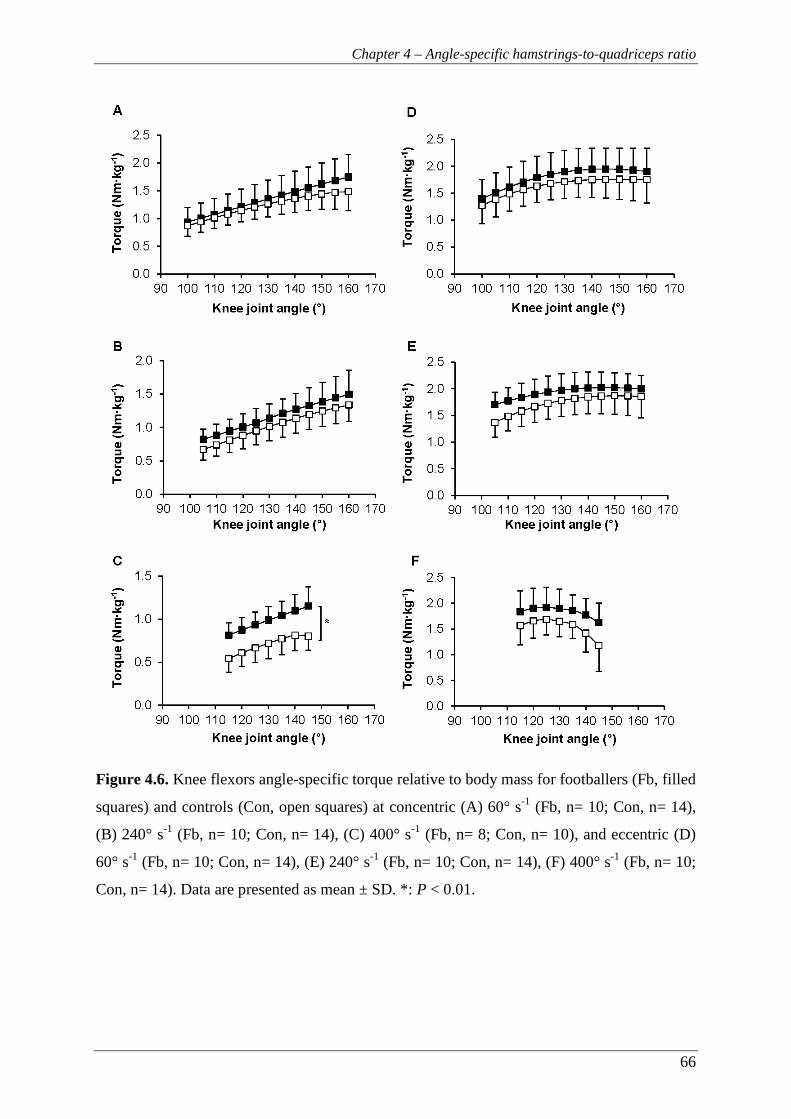
Chapter 4 – Angle-specific hamstrings-to-quadriceps ratio
66
Figure 4.6. Knee flexors angle-specific torque relative to body mass for footballers (Fb, filled
squares) and controls (Con, open squares) at concentric (A) 60° s-1 (Fb, n= 10; Con, n= 14),
(B) 240° s-1 (Fb, n= 10; Con, n= 14), (C) 400° s-1 (Fb, n= 8; Con, n= 10), and eccentric (D)
60° s-1 (Fb, n= 10; Con, n= 14), (E) 240° s-1 (Fb, n= 10; Con, n= 14), (F) 400° s-1 (Fb, n= 10;
Con, n= 14). Data are presented as mean ± SD. *: P < 0.01.

Chapter 4 – Angle-specific hamstrings-to-quadriceps ratio
67
Table 4.1. P-values, confidence intervals (CI) and effect sizes for the differences between
footballers (Fb) and controls (Con).
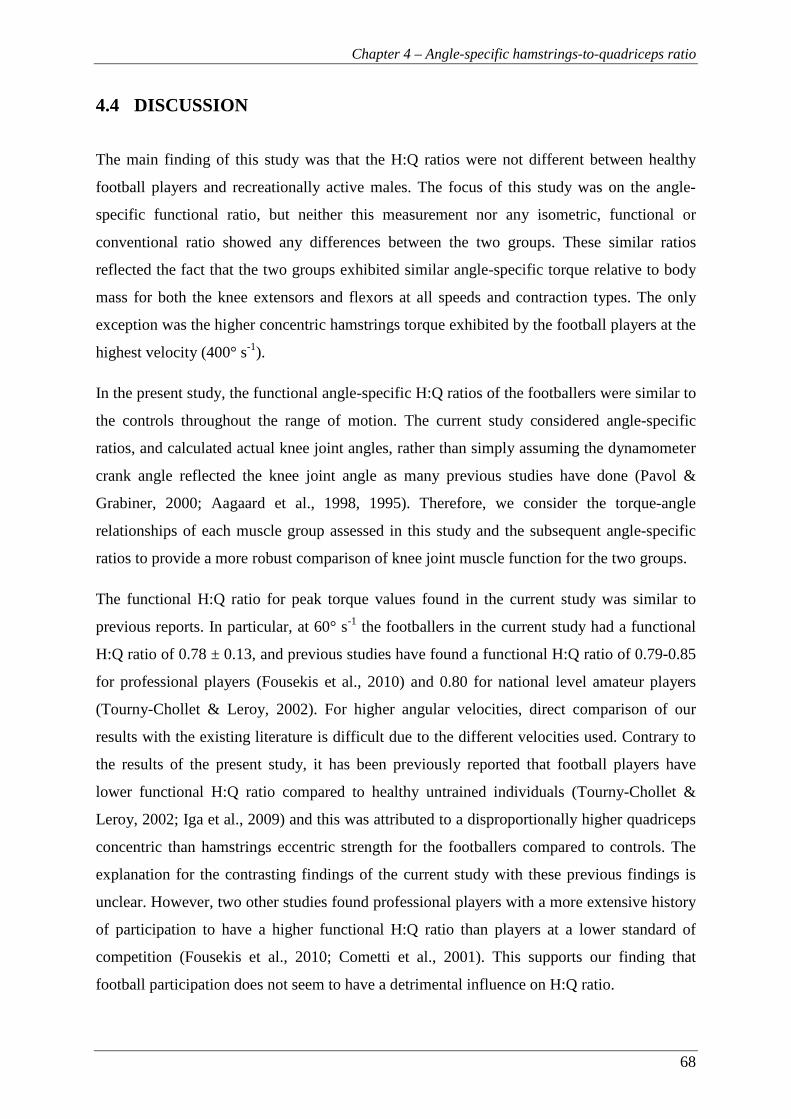
Chapter 4 – Angle-specific hamstrings-to-quadriceps ratio
68
4.4 DISCUSSION
The main finding of this study was that the H:Q ratios were not different between healthy
football players and recreationally active males. The focus of this study was on the angle-
specific functional ratio, but neither this measurement nor any isometric, functional or
conventional ratio showed any differences between the two groups. These similar ratios
reflected the fact that the two groups exhibited similar angle-specific torque relative to body
mass for both the knee extensors and flexors at all speeds and contraction types. The only
exception was the higher concentric hamstrings torque exhibited by the football players at the
highest velocity (400° s-1).
In the present study, the functional angle-specific H:Q ratios of the footballers were similar to
the controls throughout the range of motion. The current study considered angle-specific
ratios, and calculated actual knee joint angles, rather than simply assuming the dynamometer
crank angle reflected the knee joint angle as many previous studies have done (Pavol &
Grabiner, 2000; Aagaard et al., 1998, 1995). Therefore, we consider the torque-angle
relationships of each muscle group assessed in this study and the subsequent angle-specific
ratios to provide a more robust comparison of knee joint muscle function for the two groups.
The functional H:Q ratio for peak torque values found in the current study was similar to
previous reports. In particular, at 60° s-1 the footballers in the current study had a functional
H:Q ratio of 0.78 ± 0.13, and previous studies have found a functional H:Q ratio of 0.79-0.85
for professional players (Fousekis et al., 2010) and 0.80 for national level amateur players
(Tourny-Chollet & Leroy, 2002). For higher angular velocities, direct comparison of our
results with the existing literature is difficult due to the different velocities used. Contrary to
the results of the present study, it has been previously reported that football players have
lower functional H:Q ratio compared to healthy untrained individuals (Tourny-Chollet &
Leroy, 2002; Iga et al., 2009) and this was attributed to a disproportionally higher quadriceps
concentric than hamstrings eccentric strength for the footballers compared to controls. The
explanation for the contrasting findings of the current study with these previous findings is
unclear. However, two other studies found professional players with a more extensive history
of participation to have a higher functional H:Q ratio than players at a lower standard of
competition (Fousekis et al., 2010; Cometti et al., 2001). This supports our finding that
football participation does not seem to have a detrimental influence on H:Q ratio.
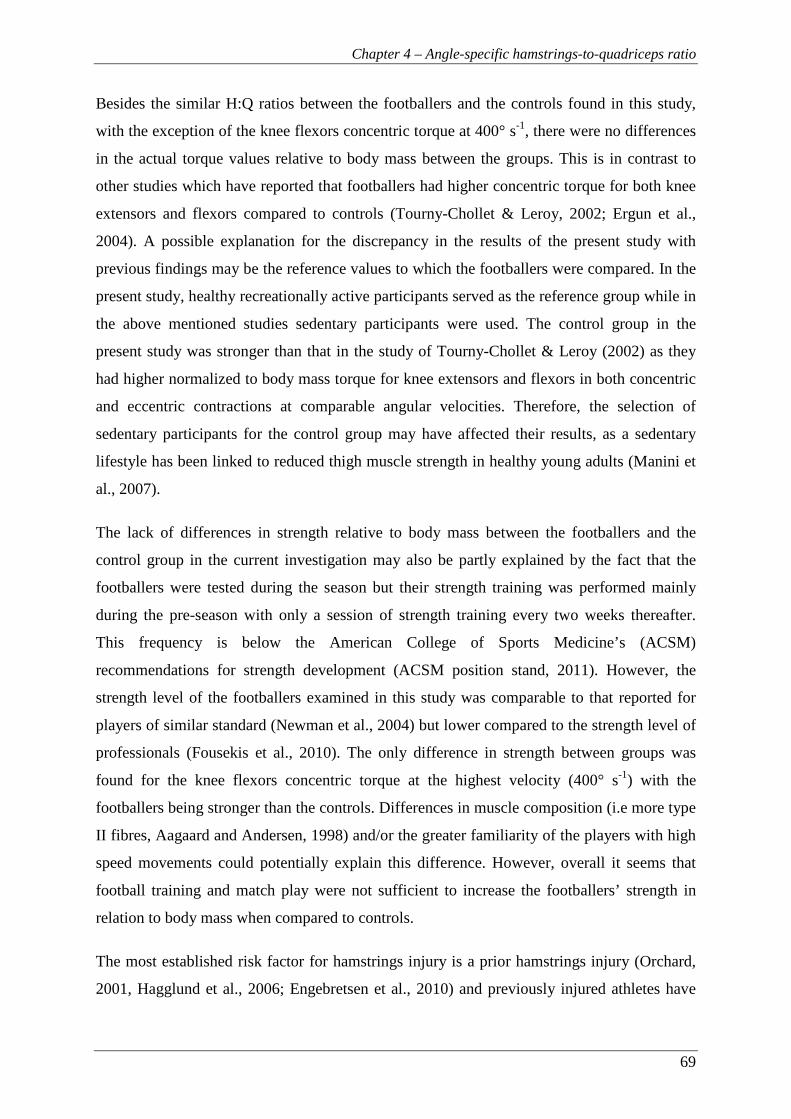
Chapter 4 – Angle-specific hamstrings-to-quadriceps ratio
69
Besides the similar H:Q ratios between the footballers and the controls found in this study,
with the exception of the knee flexors concentric torque at 400° s-1, there were no differences
in the actual torque values relative to body mass between the groups. This is in contrast to
other studies which have reported that footballers had higher concentric torque for both knee
extensors and flexors compared to controls (Tourny-Chollet & Leroy, 2002; Ergun et al.,
2004). A possible explanation for the discrepancy in the results of the present study with
previous findings may be the reference values to which the footballers were compared. In the
present study, healthy recreationally active participants served as the reference group while in
the above mentioned studies sedentary participants were used. The control group in the
present study was stronger than that in the study of Tourny-Chollet & Leroy (2002) as they
had higher normalized to body mass torque for knee extensors and flexors in both concentric
and eccentric contractions at comparable angular velocities. Therefore, the selection of
sedentary participants for the control group may have affected their results, as a sedentary
lifestyle has been linked to reduced thigh muscle strength in healthy young adults (Manini et
al., 2007).
The lack of differences in strength relative to body mass between the footballers and the
control group in the current investigation may also be partly explained by the fact that the
footballers were tested during the season but their strength training was performed mainly
during the pre-season with only a session of strength training every two weeks thereafter.
This frequency is below the American College of Sports Medicine’s (ACSM)
recommendations for strength development (ACSM position stand, 2011). However, the
strength level of the footballers examined in this study was comparable to that reported for
players of similar standard (Newman et al., 2004) but lower compared to the strength level of
professionals (Fousekis et al., 2010). The only difference in strength between groups was
found for the knee flexors concentric torque at the highest velocity (400° s-1) with the
footballers being stronger than the controls. Differences in muscle composition (i.e more type
II fibres, Aagaard and Andersen, 1998) and/or the greater familiarity of the players with high
speed movements could potentially explain this difference. However, overall it seems that
football training and match play were not sufficient to increase the footballers’ strength in
relation to body mass when compared to controls.
The most established risk factor for hamstrings injury is a prior hamstrings injury (Orchard,
2001, Hagglund et al., 2006; Engebretsen et al., 2010) and previously injured athletes have
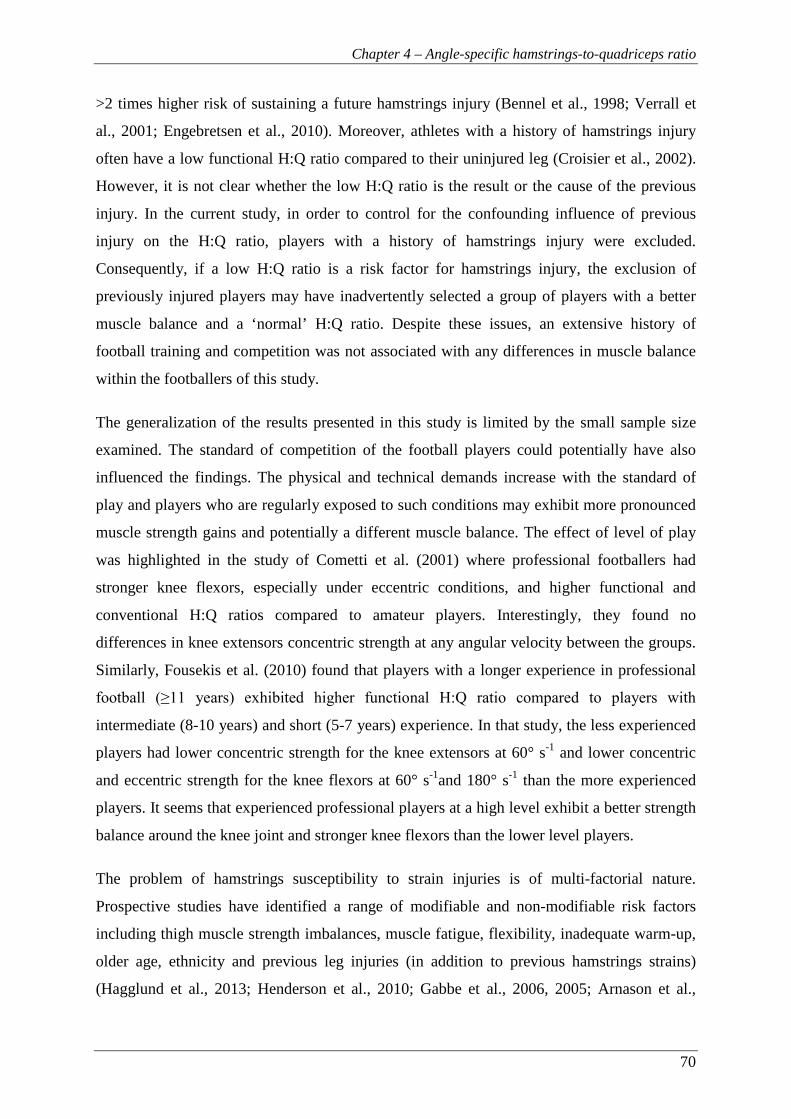
Chapter 4 – Angle-specific hamstrings-to-quadriceps ratio
70
>2 times higher risk of sustaining a future hamstrings injury (Bennel et al., 1998; Verrall et
al., 2001; Engebretsen et al., 2010). Moreover, athletes with a history of hamstrings injury
often have a low functional H:Q ratio compared to their uninjured leg (Croisier et al., 2002).
However, it is not clear whether the low H:Q ratio is the result or the cause of the previous
injury. In the current study, in order to control for the confounding influence of previous
injury on the H:Q ratio, players with a history of hamstrings injury were excluded.
Consequently, if a low H:Q ratio is a risk factor for hamstrings injury, the exclusion of
previously injured players may have inadvertently selected a group of players with a better
muscle balance and a ‘normal’ H:Q ratio. Despite these issues, an extensive history of
football training and competition was not associated with any differences in muscle balance
within the footballers of this study.
The generalization of the results presented in this study is limited by the small sample size
examined. The standard of competition of the football players could potentially have also
influenced the findings. The physical and technical demands increase with the standard of
play and players who are regularly exposed to such conditions may exhibit more pronounced
muscle strength gains and potentially a different muscle balance. The effect of level of play
was highlighted in the study of Cometti et al. (2001) where professional footballers had
stronger knee flexors, especially under eccentric conditions, and higher functional and
conventional H:Q ratios compared to amateur players. Interestingly, they found no
differences in knee extensors concentric strength at any angular velocity between the groups.
Similarly, Fousekis et al. (2010) found that players with a longer experience in professional
football (≥11 years) exhibited higher functional H:Q ratio compared to players with
intermediate (8-10 years) and short (5-7 years) experience. In that study, the less experienced
players had lower concentric strength for the knee extensors at 60° s-1 and lower concentric
and eccentric strength for the knee flexors at 60° s-1and 180° s-1 than the more experienced
players. It seems that experienced professional players at a high level exhibit a better strength
balance around the knee joint and stronger knee flexors than the lower level players.
The problem of hamstrings susceptibility to strain injuries is of multi-factorial nature.
Prospective studies have identified a range of modifiable and non-modifiable risk factors
including thigh muscle strength imbalances, muscle fatigue, flexibility, inadequate warm-up,
older age, ethnicity and previous leg injuries (in addition to previous hamstrings strains)
(Hagglund et al., 2013; Henderson et al., 2010; Gabbe et al., 2006, 2005; Arnason et al.,

Chapter 4 – Angle-specific hamstrings-to-quadriceps ratio
71
2004; Orchard et al., 2001; Verrall et al., 2001). Since knee joint muscle imbalances do not
seem to be present in previously uninjured footballers, other factors must contribute to the
high hamstrings injury rates seen in football. Regular exposure to football training and
matches, that involve extensive sprinting and kicking, is likely to be important in the high
incidence of hamstrings strains. Muscle fatigue has been proposed as a possible factor as half
of the hamstrings injuries sustained during matches occur near the end of each half (Woods et
al., 2004). Recent studies using protocols that induced soccer-specific fatigue found
decreased functional H:Q ratios and reduced hamstrings eccentric torque at the end of each
half (Small et al., 2010; Delextrat et al., 2010; Greig et al., 2008).
In conclusion, in previously uninjured football players there was no intrinsic muscle
imbalance and the high rate of hamstrings injuries seen in this sport may be due to other risk
factors and/or simply regular exposure to a high risk activity (football training & match play).
72
Chapter 5
Quadriceps and hamstrings relative muscle size influences knee-joint strength balance
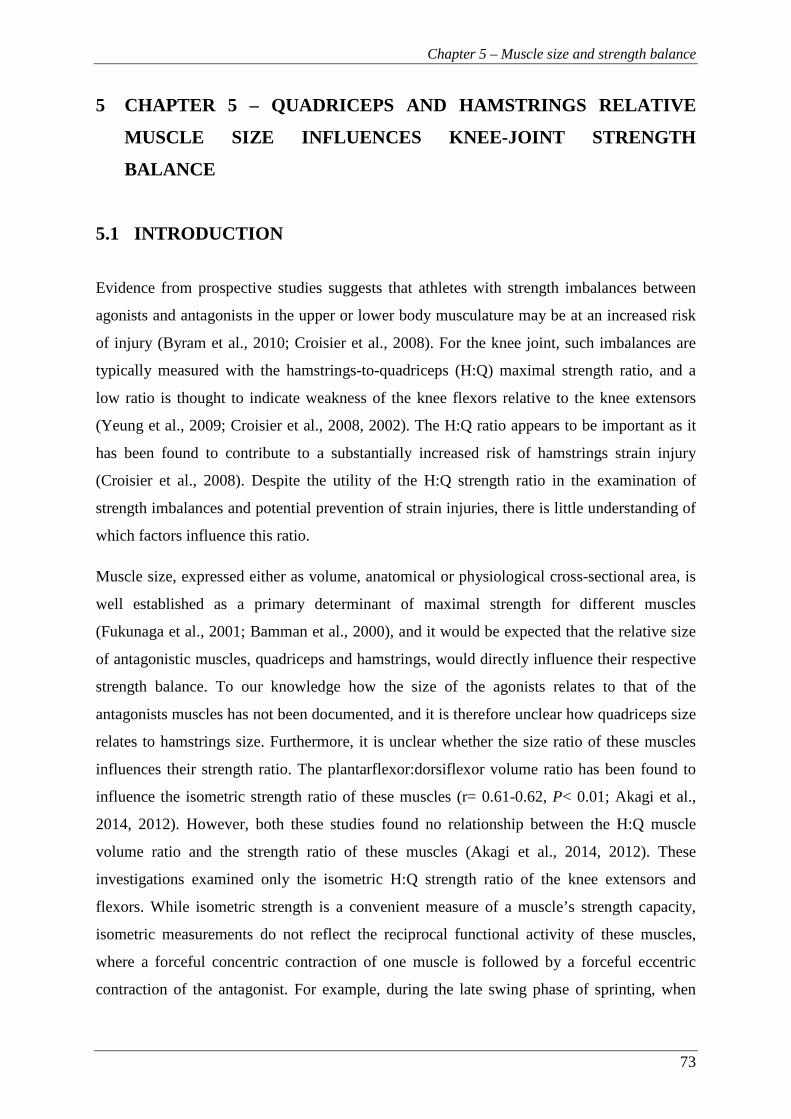
Chapter 5 – Muscle size and strength balance
73
5 CHAPTER 5 – QUADRICEPS AND HAMSTRINGS RELATIVE
MUSCLE SIZE INFLUENCES KNEE-JOINT STRENGTH
BALANCE
5.1 INTRODUCTION
Evidence from prospective studies suggests that athletes with strength imbalances between
agonists and antagonists in the upper or lower body musculature may be at an increased risk
of injury (Byram et al., 2010; Croisier et al., 2008). For the knee joint, such imbalances are
typically measured with the hamstrings-to-quadriceps (H:Q) maximal strength ratio, and a
low ratio is thought to indicate weakness of the knee flexors relative to the knee extensors
(Yeung et al., 2009; Croisier et al., 2008, 2002). The H:Q ratio appears to be important as it
has been found to contribute to a substantially increased risk of hamstrings strain injury
(Croisier et al., 2008). Despite the utility of the H:Q strength ratio in the examination of
strength imbalances and potential prevention of strain injuries, there is little understanding of
which factors influence this ratio.
Muscle size, expressed either as volume, anatomical or physiological cross-sectional area, is
well established as a primary determinant of maximal strength for different muscles
(Fukunaga et al., 2001; Bamman et al., 2000), and it would be expected that the relative size
of antagonistic muscles, quadriceps and hamstrings, would directly influence their respective
strength balance. To our knowledge how the size of the agonists relates to that of the
antagonists muscles has not been documented, and it is therefore unclear how quadriceps size
relates to hamstrings size. Furthermore, it is unclear whether the size ratio of these muscles
influences their strength ratio. The plantarflexor:dorsiflexor volume ratio has been found to
influence the isometric strength ratio of these muscles (r= 0.61-0.62, P< 0.01; Akagi et al.,
2014, 2012). However, both these studies found no relationship between the H:Q muscle
volume ratio and the strength ratio of these muscles (Akagi et al., 2014, 2012). These
investigations examined only the isometric H:Q strength ratio of the knee extensors and
flexors. While isometric strength is a convenient measure of a muscle’s strength capacity,
isometric measurements do not reflect the reciprocal functional activity of these muscles,
where a forceful concentric contraction of one muscle is followed by a forceful eccentric
contraction of the antagonist. For example, during the late swing phase of sprinting, when

Chapter 5 – Muscle size and strength balance
74
hamstrings strains are thought to occur (Chumanov et al., 2012), a forceful eccentric
contraction of the knee flexors is required to decelerate the shank after a forceful concentric
contraction of the knee extensors. Furthermore, due to the force-velocity relationship and the
high knee joint velocities involved in sprinting, the knee flexor eccentric strength is expected
to remain relatively constant at high velocities compared to isometric strength while
concentric strength is expected to decrease significantly (Pain et al., 2013; Kellis and
Baltzopoulos, 1998). Isokinetic dynamometers clearly cannot replicate the knee joint
velocities experienced during sprinting, yet the use of the knee flexors eccentric to knee
extensors concentric strength (functional H:Q ratio) up to high velocities seems to provide a
more functionally relevant assessment of the H:Q strength balance (Aagaard et al., 1998,
1995; Dvir et al., 1989). Moreover, to date how the relative size of the knee extensors
(quadriceps) and flexors (primarily hamstrings) influences their functional H:Q strength ratio
has not been examined.
The aim of the present study was to examine the relationship between knee extensors
(quadriceps) and flexors (hamstrings) muscle size (volume and anatomical cross-sectional
area), the association of each muscle’s size with its strength, and investigate if the muscle
size ratio was related to the isometric and functional strength ratios. Based on previous
observations of a strong relationship between the size and strength of individual muscles, we
hypothesized that the H:Q muscle size ratio would be positively correlated to their functional
strength ratio.
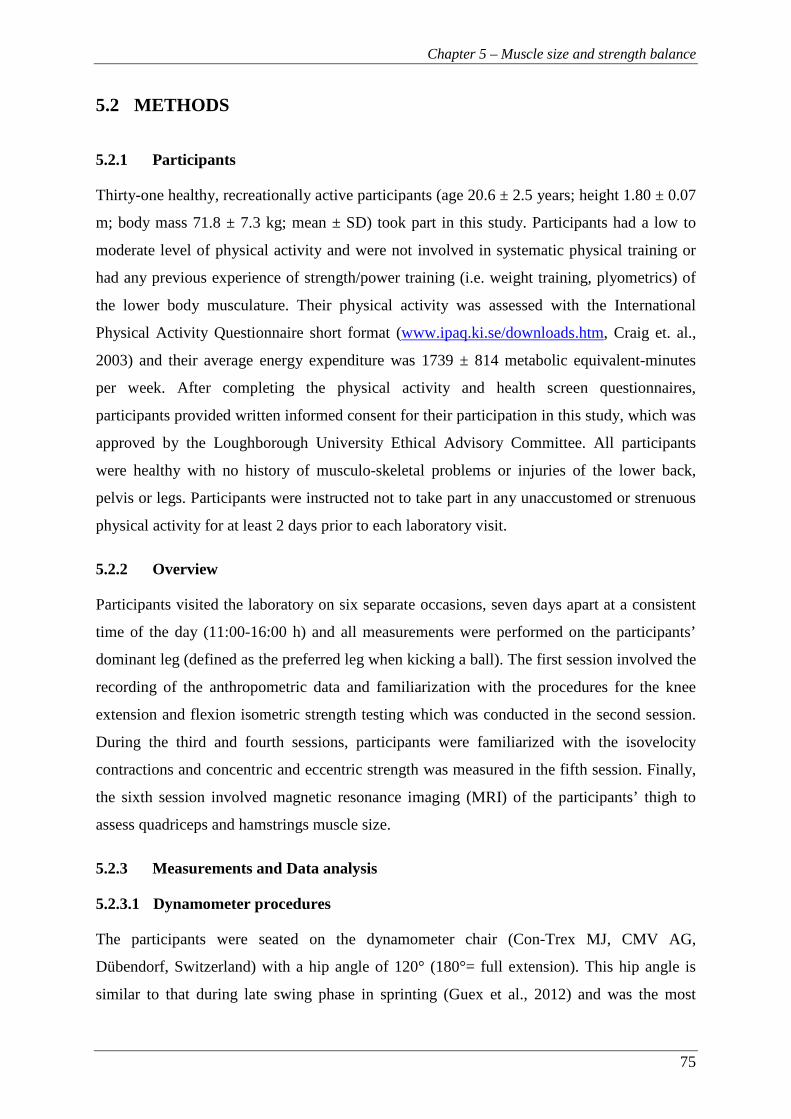
Chapter 5 – Muscle size and strength balance
75
5.2 METHODS
5.2.1 Participants
Thirty-one healthy, recreationally active participants (age 20.6 ± 2.5 years; height 1.80 ± 0.07
m; body mass 71.8 ± 7.3 kg; mean ± SD) took part in this study. Participants had a low to
moderate level of physical activity and were not involved in systematic physical training or
had any previous experience of strength/power training (i.e. weight training, plyometrics) of
the lower body musculature. Their physical activity was assessed with the International
Physical Activity Questionnaire short format (www.ipaq.ki.se/downloads.htm, Craig et. al.,
2003) and their average energy expenditure was 1739 ± 814 metabolic equivalent-minutes
per week. After completing the physical activity and health screen questionnaires,
participants provided written informed consent for their participation in this study, which was
approved by the Loughborough University Ethical Advisory Committee. All participants
were healthy with no history of musculo-skeletal problems or injuries of the lower back,
pelvis or legs. Participants were instructed not to take part in any unaccustomed or strenuous
physical activity for at least 2 days prior to each laboratory visit.
5.2.2 Overview
Participants visited the laboratory on six separate occasions, seven days apart at a consistent
time of the day (11:00-16:00 h) and all measurements were performed on the participants’
dominant leg (defined as the preferred leg when kicking a ball). The first session involved the
recording of the anthropometric data and familiarization with the procedures for the knee
extension and flexion isometric strength testing which was conducted in the second session.
During the third and fourth sessions, participants were familiarized with the isovelocity
contractions and concentric and eccentric strength was measured in the fifth session. Finally,
the sixth session involved magnetic resonance imaging (MRI) of the participants’ thigh to
assess quadriceps and hamstrings muscle size.
5.2.3 Measurements and Data analysis
5.2.3.1 Dynamometer procedures
The participants were seated on the dynamometer chair (Con-Trex MJ, CMV AG,
Dübendorf, Switzerland) with a hip angle of 120° (180°= full extension). This hip angle is
similar to that during late swing phase in sprinting (Guex et al., 2012) and was the most
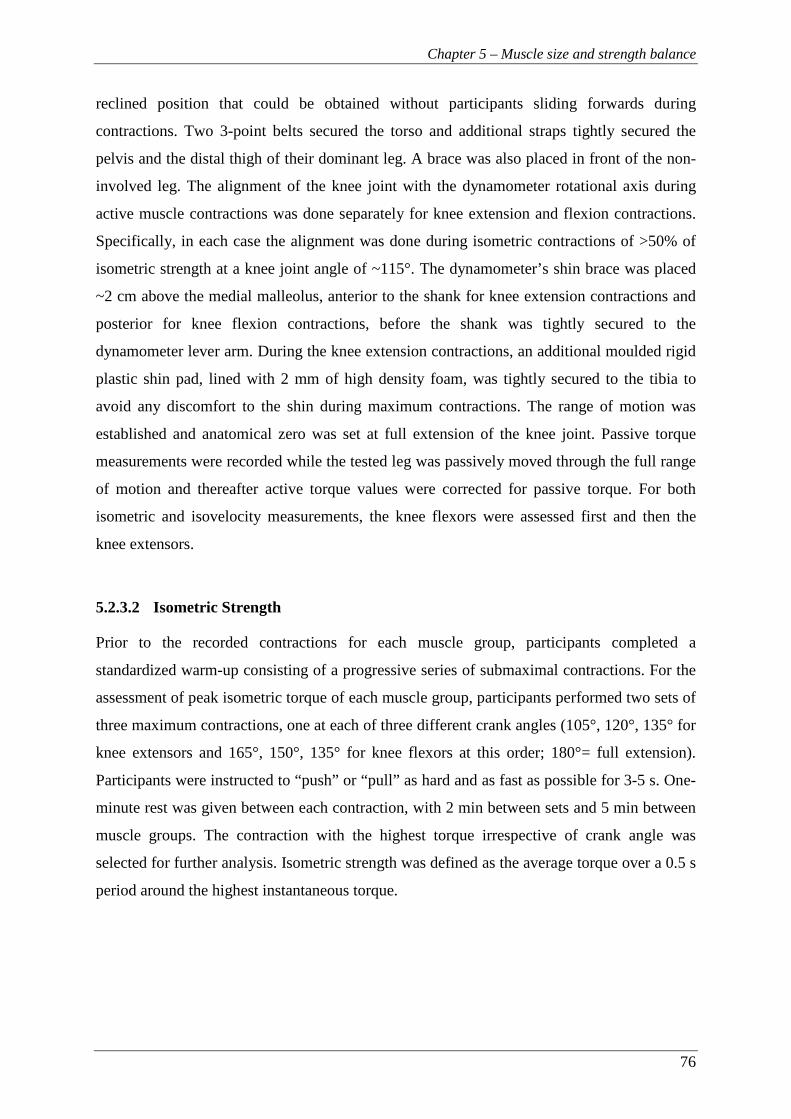
Chapter 5 – Muscle size and strength balance
76
reclined position that could be obtained without participants sliding forwards during
contractions. Two 3-point belts secured the torso and additional straps tightly secured the
pelvis and the distal thigh of their dominant leg. A brace was also placed in front of the non-
involved leg. The alignment of the knee joint with the dynamometer rotational axis during
active muscle contractions was done separately for knee extension and flexion contractions.
Specifically, in each case the alignment was done during isometric contractions of >50% of
isometric strength at a knee joint angle of ~115°. The dynamometer’s shin brace was placed
~2 cm above the medial malleolus, anterior to the shank for knee extension contractions and
posterior for knee flexion contractions, before the shank was tightly secured to the
dynamometer lever arm. During the knee extension contractions, an additional moulded rigid
plastic shin pad, lined with 2 mm of high density foam, was tightly secured to the tibia to
avoid any discomfort to the shin during maximum contractions. The range of motion was
established and anatomical zero was set at full extension of the knee joint. Passive torque
measurements were recorded while the tested leg was passively moved through the full range
of motion and thereafter active torque values were corrected for passive torque. For both
isometric and isovelocity measurements, the knee flexors were assessed first and then the
knee extensors.
5.2.3.2 Isometric Strength
Prior to the recorded contractions for each muscle group, participants completed a
standardized warm-up consisting of a progressive series of submaximal contractions. For the
assessment of peak isometric torque of each muscle group, participants performed two sets of
three maximum contractions, one at each of three different crank angles (105°, 120°, 135° for
knee extensors and 165°, 150°, 135° for knee flexors at this order; 180°= full extension).
Participants were instructed to “push” or “pull” as hard and as fast as possible for 3-5 s. One-
minute rest was given between each contraction, with 2 min between sets and 5 min between
muscle groups. The contraction with the highest torque irrespective of crank angle was
selected for further analysis. Isometric strength was defined as the average torque over a 0.5 s
period around the highest instantaneous torque.

Chapter 5 – Muscle size and strength balance
77
5.2.3.3 Concentric and eccentric strength
After the completion of a standardized warm-up protocol with five submaximal contractions
of progressively higher intensity, participants performed 3 sets of 2, and 3 sets of 3,
concentric-eccentric contractions at 50° s-1 and 350° s-1 respectively (in this order), over
~100° of range of motion. There was ≥1 min rest between each set and ≥2 min rest between
velocities. Participants were instructed to grasp the handles next to the seat during maximal
contractions. Standardized verbal encouragement was given by the same investigator and
online visual feedback of the crank torque was provided on a computer screen.
The torque, crank angle and crank velocity signals were sampled at 2000 Hz with a PC using
Spike 2 software (CED, Cambridge, UK) and smoothed with a finite impulse response filter
at 15 Hz. The acceleration and deceleration phases were excluded in order to disregard torque
overshoot during these phases (Schwartz et al., 2010) and the constant isovelocity period
(within ±5% of the prescribed crank angular velocity) was identified. Finally, concentric and
eccentric strength was defined as the highest instantaneous torque recorded within the
isovelocity range of any concentric and eccentric contraction respectively.
5.2.3.4 Magnetic resonance imaging (MRI)
A 1.5 T MRI scanner (Signa HDxt, GE) was used to scan the dominant leg in the supine
position with the hip and knee joints extended. T1-weighted axial plane images were acquired
from the anterior superior iliac spine to the knee joint space in two blocks and oil filled
capsules were placed on the lateral side of the participants’ thigh to help with the alignment
of the blocks during analysis. The following imaging parameters were used: imaging matrix:
512 x 512, field of view: 260 mm x 260 mm, spatial resolution: 0.508 mm x 0.508 mm, slice
thickness: 5 mm, inter-slice gap: 0 mm. MR images were analysed with Osirix software
(version 4.0, Pixmeo, Geneva, Switzerland).
MR images were analysed with Osirix software (version 4.0, Pixmeo, Geneva, Switzerland).
The hamstrings (biceps femoris long head, biceps femoris short head, semitendinosus,
semimembranosus) and quadriceps (rectus femoris, vastus lateralis, vastus medialis, vastus
intermedius) muscles were manually outlined in every third image starting from the most
proximal image in which the muscle appeared. The largest anatomical cross-sectional area of
each muscle was defined as ACSAmax and muscle volume was calculated using cubic spline
interpolation (GraphPad Prism 6, GraphPad Software, Inc.). Two investigators conducted the
image analysis and all manual segmentation measurements of each muscle were completed
by the same investigator. To examine the reliability of the analysis procedures, the images

Chapter 5 – Muscle size and strength balance
78
from 6 randomly selected participants were re-analysed a week later and the coefficient of
variation (CV) was calculated. The CVs for measurements of muscle volume and ACSAmax
were 0.5% and 1.2% (quadriceps), and 0.5% and 1.1% (hamstrings).
5.2.4 Statistical analysis
Data are presented as mean ± SD. Strength differences between muscle groups were
examined with a two-way repeated measures ANOVA (muscle x velocity). A significant
main effect was further examined with a post-hoc paired t-test with Holm-Bonferroni
correction. Bivariate relationships were examined using Pearson product moment correlations
between the dependent variables and the Holm-Bonferroni correction was used to control for
multiple tests. The level of significance was set at P< 0.05. All statistical procedures were
performed with IBM SPSS 22 (IBM Corporation, Armonk, NY).

Chapter 5 – Muscle size and strength balance
79
5.3 RESULTS
5.3.1 Descriptive data for muscle size and strength
On average quadriceps had a ~2.5-fold larger muscle volume than hamstrings (1937.3 ±
265.1 cm3 and 794.1 ± 122.2 cm3 respectively, Table 5.1) and both muscle groups exhibited
moderate variability between individuals (CV, 13.7% [Q] and 15.4% [H]). Consequently the
H:Q volume ratio was 0.41 ± 0.05 (CV= 11.5%). The difference in size between the opposing
muscle groups was smaller when considering ACSAmax (< 2-fold) that was reflected by a
H:Q ACSAmax ratio of 0.52 ± 0.06 (Table 5.1).
Table 5.1. Descriptive data of the quadriceps and hamstrings muscle size measurements and
the hamstrings-to-quadriceps muscle size ratio (H:Q) (n= 31).
The knee extensors were stronger than flexors across the torque-velocity relationship (P<
0.001, Fig. 5.1A). The highest torque occurred isometrically for knee extensors, but
eccentrically (50° s-1) for knee flexors. When normalized to isometric values the shape of the
torque-velocity relationships was quite distinct for the two muscle groups, with the knee
flexors achieving higher concentric and eccentric torques than the extensors (P< 0.05, Fig.
5.1B).
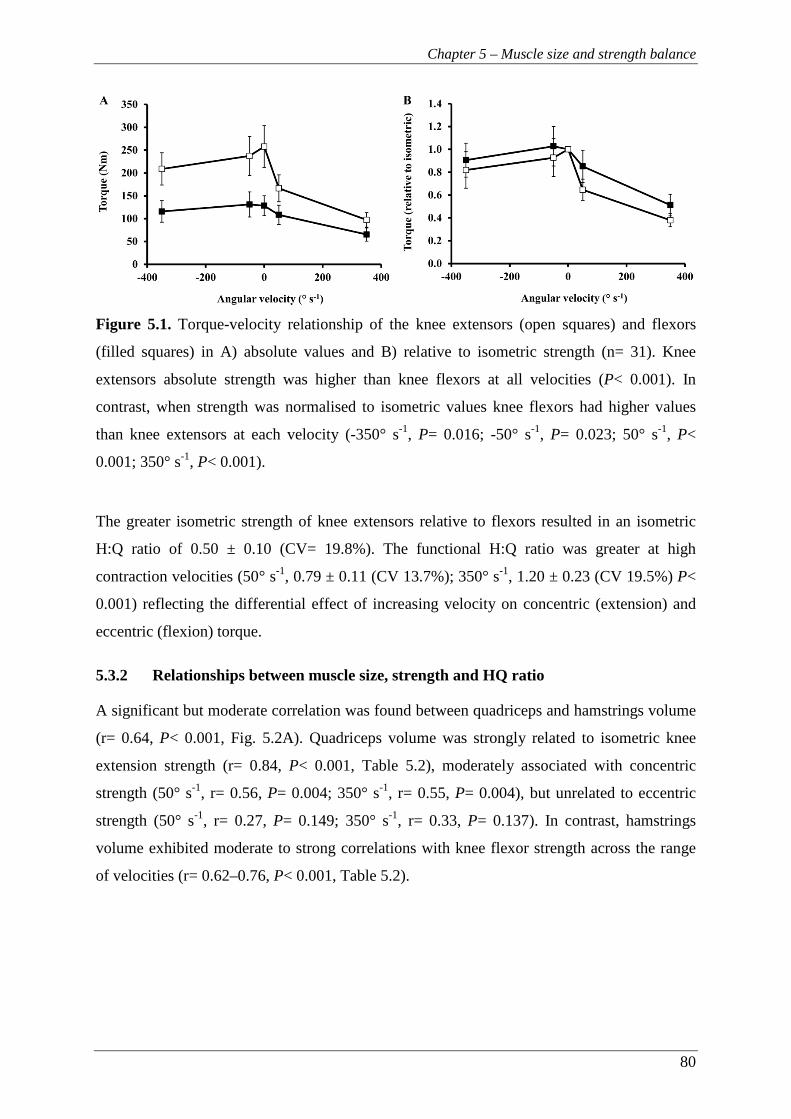
Chapter 5 – Muscle size and strength balance
80
Figure 5.1. Torque-velocity relationship of the knee extensors (open squares) and flexors
(filled squares) in A) absolute values and B) relative to isometric strength (n= 31). Knee
extensors absolute strength was higher than knee flexors at all velocities (P< 0.001). In
contrast, when strength was normalised to isometric values knee flexors had higher values
than knee extensors at each velocity (-350° s-1, P= 0.016; -50° s-1, P= 0.023; 50° s-1, P<
0.001; 350° s-1, P< 0.001).
The greater isometric strength of knee extensors relative to flexors resulted in an isometric
H:Q ratio of 0.50 ± 0.10 (CV= 19.8%). The functional H:Q ratio was greater at high
contraction velocities (50° s-1, 0.79 ± 0.11 (CV 13.7%); 350° s-1, 1.20 ± 0.23 (CV 19.5%) P<
0.001) reflecting the differential effect of increasing velocity on concentric (extension) and
eccentric (flexion) torque.
5.3.2 Relationships between muscle size, strength and HQ ratio
A significant but moderate correlation was found between quadriceps and hamstrings volume
(r= 0.64, P< 0.001, Fig. 5.2A). Quadriceps volume was strongly related to isometric knee
extension strength (r= 0.84, P< 0.001, Table 5.2), moderately associated with concentric
strength (50° s-1, r= 0.56, P= 0.004; 350° s-1, r= 0.55, P= 0.004), but unrelated to eccentric
strength (50° s-1, r= 0.27, P= 0.149; 350° s-1, r= 0.33, P= 0.137). In contrast, hamstrings
volume exhibited moderate to strong correlations with knee flexor strength across the range
of velocities (r= 0.62–0.76, P< 0.001, Table 5.2).

Chapter 5 – Muscle size and strength balance
81
Table 5.2. Bivariate correlations coefficients between quadriceps and hamstrings muscle
volume with knee extensors and flexors maximal isometric, concentric and eccentric strength
(n= 31). * P< 0.01, ** P< 0.001
A moderate correlation was found between H:Q volume ratio and isometric H:Q ratio (r=
0.45, P= 0.024) as well as functional H:Q ratio at 350° s-1 (r= 0.56, P= 0.003) (Fig. 5.3),
while there was a tendency for a relationship between H:Q volume ratio and functional H:Q
ratio at slow velocity (r= 0.34, P= 0.059).
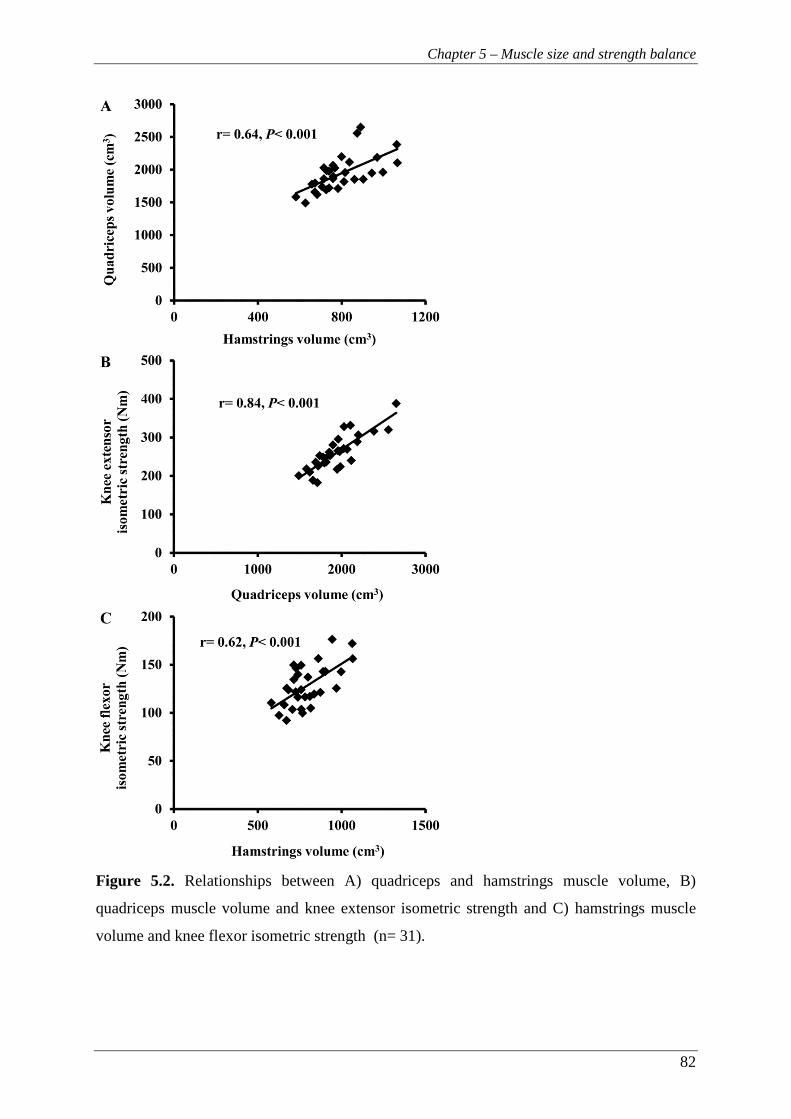
Chapter 5 – Muscle size and strength balance
82
Figure 5.2. Relationships between A) quadriceps and hamstrings muscle volume, B)
quadriceps muscle volume and knee extensor isometric strength and C) hamstrings muscle
volume and knee flexor isometric strength (n= 31).

Chapter 5 – Muscle size and strength balance
83
Figure 5.3. Correlations of H:Q volume ratio with A) isometric H:Q ratio, B) functional H:Q
ratio at 50° s-1 and C) functional H:Q ratio at 350° s-1 (n= 31).

Chapter 5 – Muscle size and strength balance
84
5.4 DISCUSSION
This study examined the association between the size of the knee extensors and flexors, how
the size of these muscle groups was related to their function across the torque-velocity
relationship, and whether the muscle size ratio was associated with the H:Q strength ratios.
We found that muscle volume explained 38-58% of the differences between individuals in
knee flexor strength (isometric 38%, concentric 50-55%, eccentric 48-58%) and up to 71% of
the variation in knee extensor strength (isometric 71%, concentric 30-31%, eccentric - not
significant). Further, there was a moderate correlation between the size of these antagonistic
muscle groups (R2= 0.41). Finally, in support of our hypothesis, we found that the relative
size of the knee extensors and flexors explained 12-31% of the variability in H:Q strength
ratios. These findings suggest that muscle size is not only an important determinant of the
knee extensors and flexors’ strength, but it also influences the strength balance around the
knee joint.
Muscle size of the knee extensors (quadriceps) and flexors (hamstrings) exhibited strong
correlations with their respective isometric strength (r= 0.62-0.84, P< 0.001). Interestingly,
although hamstrings volume was strongly related to knee flexor strength at all velocities and
contraction modes, quadriceps size was only moderately related to knee extensor concentric
strength (r= 0.55-0.56, P< 0.01) and not related to eccentric strength (r= 0.27-0.33, P> 0.05).
In voluntary eccentric contractions, neural factors have been suggested to inhibit knee
extensor strength (Amiridis et al., 1996; Westing et al., 1991; 1990; Dudley et al., 1990) and
may supersede any relationship of muscle size and eccentric strength. For example, in
untrained individuals maximal voluntary eccentric contractions of the knee extensors appear
to be inhibited by up to 24% (Amiridis et al., 1996; Westing et al., 1990). While this
inhibition is not evident in highly trained athletes (Amiridis et al., 1996), normal individuals
seem to be unable to achieve complete muscle activation in spite of their ‘maximal’ effort.
While the exact mechanism(s) remains unknown, it is believed that neural mechanisms at
spinal and supraspinal levels inhibit neuromuscular activation during maximal eccentric
efforts of untrained individuals and this is thought to protect the joint from potentially
injurious high levels of force that can be produced during eccentric contractions (Duchateau
and Baudry, 2014). Nonetheless, hamstrings volume was strongly related to knee flexor
eccentric strength (r= 0.69-0.76, P< 0.001) suggesting that neural inhibition during eccentric
contractions may be muscle-specific. Overall, the results of this study suggest that muscle
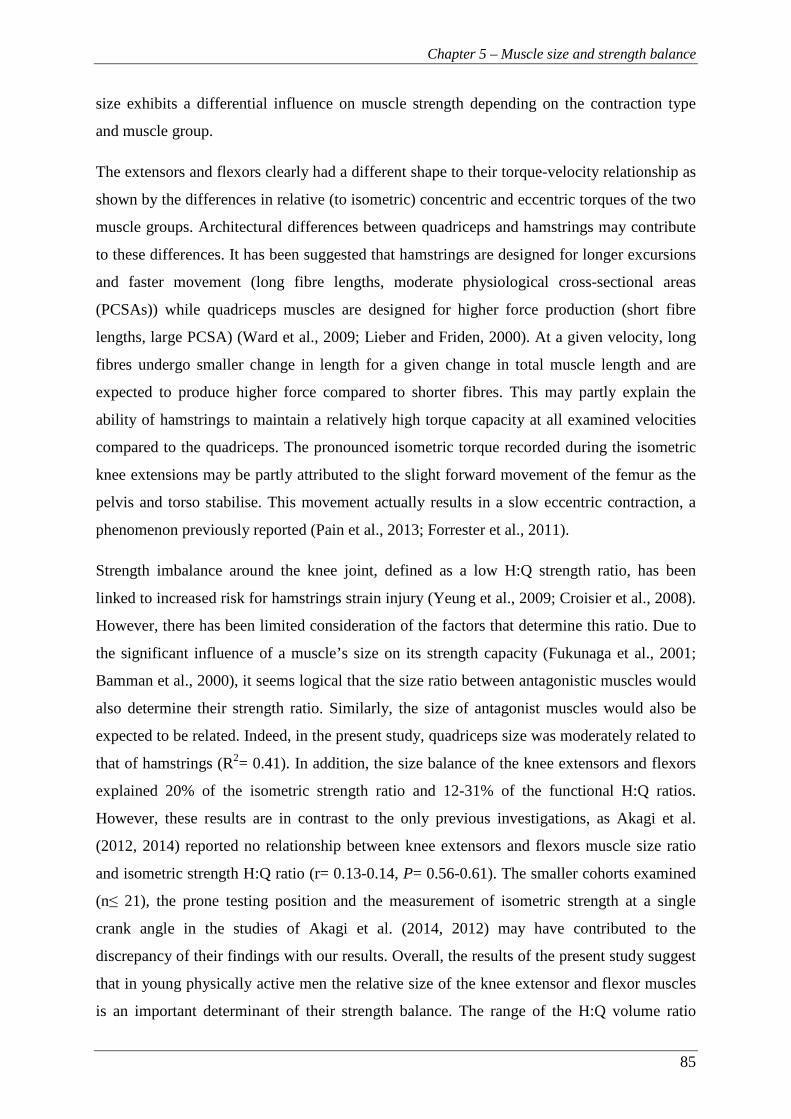
Chapter 5 – Muscle size and strength balance
85
size exhibits a differential influence on muscle strength depending on the contraction type
and muscle group.
The extensors and flexors clearly had a different shape to their torque-velocity relationship as
shown by the differences in relative (to isometric) concentric and eccentric torques of the two
muscle groups. Architectural differences between quadriceps and hamstrings may contribute
to these differences. It has been suggested that hamstrings are designed for longer excursions
and faster movement (long fibre lengths, moderate physiological cross-sectional areas
(PCSAs)) while quadriceps muscles are designed for higher force production (short fibre
lengths, large PCSA) (Ward et al., 2009; Lieber and Friden, 2000). At a given velocity, long
fibres undergo smaller change in length for a given change in total muscle length and are
expected to produce higher force compared to shorter fibres. This may partly explain the
ability of hamstrings to maintain a relatively high torque capacity at all examined velocities
compared to the quadriceps. The pronounced isometric torque recorded during the isometric
knee extensions may be partly attributed to the slight forward movement of the femur as the
pelvis and torso stabilise. This movement actually results in a slow eccentric contraction, a
phenomenon previously reported (Pain et al., 2013; Forrester et al., 2011).
Strength imbalance around the knee joint, defined as a low H:Q strength ratio, has been
linked to increased risk for hamstrings strain injury (Yeung et al., 2009; Croisier et al., 2008).
However, there has been limited consideration of the factors that determine this ratio. Due to
the significant influence of a muscle’s size on its strength capacity (Fukunaga et al., 2001;
Bamman et al., 2000), it seems logical that the size ratio between antagonistic muscles would
also determine their strength ratio. Similarly, the size of antagonist muscles would also be
expected to be related. Indeed, in the present study, quadriceps size was moderately related to
that of hamstrings (R2= 0.41). In addition, the size balance of the knee extensors and flexors
explained 20% of the isometric strength ratio and 12-31% of the functional H:Q ratios.
However, these results are in contrast to the only previous investigations, as Akagi et al.
(2012, 2014) reported no relationship between knee extensors and flexors muscle size ratio
and isometric strength H:Q ratio (r= 0.13-0.14, P= 0.56-0.61). The smaller cohorts examined
(n≤ 21), the prone testing position and the measurement of isometric strength at a single
crank angle in the studies of Akagi et al. (2014, 2012) may have contributed to the
discrepancy of their findings with our results. Overall, the results of the present study suggest
that in young physically active men the relative size of the knee extensor and flexor muscles
is an important determinant of their strength balance. The range of the H:Q volume ratio
Chapter 5 – Muscle size and strength balance
86
(0.34-0.51) suggests that in some individuals hamstrings are 50% larger relative to quadriceps
than other individuals. This would suggest that individuals with proportionately small
hamstrings may be at greater risk of injury and they should be specifically targeted for
prehabilitation training.
In conclusion, as hypothesised the size of quadriceps and hamstrings muscles was related
(R2= 0.41) and the relative size of the knee extensors and flexors explained the H:Q strength
ratios. Therefore muscle size imbalances contribute to functional imbalances and may be an
underlying risk factor for injury. For some individuals correcting an underlying muscle size
imbalance through resistance training may be an appropriate injury prevention strategy.
87
Chapter 6
Do muscle size and composition explain knee flexor muscle function in man?
Chapter 6 – Do muscle size and composition explain knee flexor muscle function?
88
6 CHAPTER 6 – DO MUSCLE SIZE AND COMPOSITION EXPLAIN
KNEE FLEXOR MUSCLE FUNCTION IN MAN?
6.1 INTRODUCTION
Understanding the determinants of muscle function is important for maintaining and
improving function and consequently athletic performance and human health, including
injury, illness and ageing. The hamstrings muscle group is the primary knee flexor and a
major hip extensor and therefore plays a leading role in human locomotion and athletic
activities such as running and jumping (Schache et al., 2014; Novacheck, 1998; Baratta et al.,
1988). Hamstrings activation is also considered important for dynamic knee joint control and
stability, and thus maintaining joint integrity. Furthermore, hamstrings strain injuries are the
most common injury in a variety of sprint-based sports (e.g. different codes of football and
track sprinting; Alonso et al., 2012; Ekstrand et al., 2011; Orchard et al., 2002), and these
injuries predominantly affect the biceps femoris long head muscle (BFlh; Woodley &
Mercer, 2004). Chapter 5 showed that hamstrings muscle size is an important determinant of
knee flexors function. However, whether muscle composition would further explain the
interindividual differences in knee flexors function remains unknown.
In fact, hamstrings myosin heavy chain (MHC) composition in young healthy individuals
remains unknown as current BFlh muscle composition data are derived solely from cadavers
(Dahmane et al., 2006; Garrett et al., 1984; Johnson et al., 1973). Within cadaver specimens
the histochemically examined biceps femoris fibre type II composition has been reported to
be 33.1-54.5% (Dahmane et al., 2006; Garret et al., 1984; Johnson et al., 1973). The small
sample size (n= 6-15), the old age and unknown physical activity history of these participants
may limit the relevance of these data to young healthy, active populations. Nevertheless,
Garret et al. (1984) reported that hamstrings contained a higher proportion of type II fibres
(55.2%) than the quadriceps (51.9%) or adductor magnus (44.8%) and suggested that this
muscle composition may contribute to the high susceptibility of the hamstrings to strain
injuries. However, the methodological limitations of that study (small sample size (n= 10) of
elderly cadavers) highlight the need to determine hamstrings muscle composition in healthy
young adults in order to understand if their composition contributes to their high incidence of
strain injury.
Chapter 6 – Do muscle size and composition explain knee flexor muscle function?
89
As hamstrings muscle composition has only been determined within cadavers, its influence
on muscle function remains unknown. However, within the quadriceps femoris a significant
correlation between maximum isometric or isovelocity (15-240° s-1) strength and
composition of the vastus lateralis (VL) has often (Gür et al., 2003; Aagaard & Andersen
1998; Viitasalo & Komi, 1978; Thorstensson et al., 1976) but not always been reported
(Schantz et al., 1983; Inbar et al., 1981; Viitasalo et al., 1981). Some of these studies
examined this relationship within diverse athletic and training populations (e.g. Gür et al.,
2003), where numerous other variables (e.g. hypertrophy) could be acting as confounding
factors (Folland and Williams, 2007) while other studies examined small cohorts (n≤ 7;
Aagaard & Andersen, 1998). Nevertheless, according to the balance of evidence from
quadriceps studies, hamstrings muscle composition appears likely to influence maximum
strength of the knee flexors. In addition, based on in-vitro studies fibre type composition has
a more pronounced influence on function at high velocities (Bottinelli et al., 1999), however
current investigations have used relatively slow velocities (≤ 240° s-1). Similarly, the rate of
force development has been shown to be greater in type II fibres (based on their MHC
composition) in rats (Metzger and Moss, 1990) and humans (Harridge et al., 1996). Previous
research suggests that a correlation between explosive isometric strength in vivo and muscle
composition might also be expected (Viitasalo et al., 1981; Viitasalo & Komi, 1978).
Whilst the influence of hamstrings muscle composition on function in vivo remains to be
elucidated, muscle size has been consistently found to be a substantial determinant of
isometric strength in various muscles (e.g. elbox flexors, r= 0.76, Akagi et al., 2009; plantar
flexors, r= 0.65, Bamman et al., 2000; knee extensors, r= 0.59, Maughan et al., 1983).
Considering the hamstrings, the three studies we are aware of reported quite diverse
relationships between muscle size and isometric/concentric strength measures (r= 0.41 to
0.80; Akagi et al., 2012; Kanehisa et al., 1994; Masuda et al., 2003). However, none of these
studies examined eccentric or explosive strength. It is also possible that the combined
influence of muscle composition and muscle size may further explain the variability in
hamstrings muscle function, however the combined influence of these factors has not been
investigated.
Therefore, the aim of this study was to determine the BFlh MHC isoform distribution and to
examine the association of hamstrings muscle size and BFlh MHC composition with knee
flexor strength, including maximal strength measurements across the torque-velocity
relationship (concentric, isometric and eccentric) as well as explosive isometric strength.
Chapter 6 – Do muscle size and composition explain knee flexor muscle function?
90
6.2 METHODS
6.2.1 Participants
Thirty-one healthy, recreationally active participants (age 20.6 ± 2.5 years; height 1.79 ± 0.71
m; body mass 71.8 ± 7.3 kg; mean ± SD) took part in this study. Participants had a low to
moderate level of physical activity and were not involved in systematic physical training or
had any previous experience of strength/power training (i.e. weight training, plyometrics) of
the lower body musculature. Their physical activity was assessed with the International
Physical Activity Questionnaire short format (www.ipaq.ki.se/downloads.htm, Craig et. al.,
2003) and their average energy expenditure was 1739 ± 814 metabolic equivalent-minutes
per week. After completing the physical activity and health screen questionnaires,
participants provided written informed consent for their participation in this study, which was
approved by the Loughborough University Ethical Advisory Committee. All participants
were healthy with no history of musculo-skeletal problems or injuries of the lower back,
pelvis or legs. Participants were instructed not to take part in any unaccustomed or strenuous
physical activity for at least 2 days prior to each laboratory visit and to refrain from alcohol
and caffeine for the last 24 h before each visit.
6.2.2 Overview
Participants visited the laboratory on seven separate occasions, seven days apart at a
consistent time of the day (11:00-16:00 h). All the measurements were conducted on the
participants’ dominant leg (defined as their kicking leg). The first session involved recording
anthropometric data and familiarization with the procedures for testing knee flexor explosive
isometric strength that was measured during the second and third sessions. The third and
fourth sessions involved familiarization with the isokinetic dynamometer procedures, while
the knee flexor torque-velocity relationship was examined in the fifth session. The sixth
session involved magnetic resonance imaging (MRI) of the participants’ thigh to assess the
hamstrings muscle size. In the final session, muscle tissue samples were obtained from the
BFlh muscle.
Chapter 6 – Do muscle size and composition explain knee flexor muscle function?
91
6.2.3 Measurements and Data analysis
6.2.3.1 Torque-velocity relationship
The participants were seated on an isokinetic dynamometer chair (Con-Trex MJ, CMV AG,
Dübendorf, Switzerland) with a hip angle of 120° (180°= full extension). This hip angle is
similar to that during late swing phase during sprinting (Guex et al., 2012). Two 3-point belts
secured the torso and additional straps tightly secured the pelvis and the distal thigh of their
dominant leg. A brace was also placed in front of the non-involved leg. The alignment of the
knee joint centre with the dynamometer rotational axis was performed during isometric
contractions of >50% of maximal isometric voluntary torque (MVT) at a knee joint angle of
~115°. The dynamometer’s shin brace was placed posterior to the shank ~2 cm above the
medial malleolus before the shank was tightly secured to the dynamometer lever arm. The
range of motion was established and anatomical zero was set at full extension of the knee
joint. Passive torque measurements were recorded while the tested leg was passively moved
through the full range of motion and thereafter active torque values were corrected for
passive torque. Participants were instructed to grasp the handles next to the seat during
maximal contractions. Standardized verbal encouragement was given by the same
investigator and online visual feedback of the crank torque was provided on a computer
screen. The torque, crank angle and crank velocity signals were sampled at 2000 Hz with a
PC using Spike 2 software (CED, Cambridge, UK) and smoothed with a finite impulse
response filter at 15 Hz before any further analysis.
For isometric strength measurement, participants first completed a standardized warm-up
consisting of a progressive series of submaximal contractions before they performed two sets
of three maximum contractions, one at each of three different crank angles (165°, 145° and
125° in a consistent order; 180°= full extension) near the angle where knee flexors exert their
maximal torque (Knapik et al., 1983). Participants were instructed to flex their knee and
“pull” as hard and as fast as possible for 3-5 s. One-minute rest was given between each
contraction and 2 min between sets. The contraction with the highest torque irrespective of
crank angle was selected for further analysis. Isometric strength was defined as the average
torque over a 0.5 s period around the highest instantaneous torque.
For the concentric and eccentric strength measurement, participants first completed a
standardized warm-up protocol with five submaximal concentric-eccentric contractions of
progressively higher intensity. Then, they performed knee flexors maximal concentric-
eccentric contractions at 50° s-1 (3 sets of 2 reciprocal contractions) and 350° s-1 (3 sets of 3
Chapter 6 – Do muscle size and composition explain knee flexor muscle function?
92
reciprocal contractions) over ~100° of range of motion. There was ≥1 min rest between each
set and ≥2 min rest between velocities. For the concentric-eccentric contractions, the
acceleration and deceleration phases were excluded in order to disregard torque overshoot
during these phases (Schwartz et al., 2010) and the constant isovelocity period was identified
(within ±5% of the prescribed crank angular velocity). Finally, concentric and eccentric
strength at each velocity was defined as the highest instantaneous torque recorded within the
isovelocity range of the relevant contractions.
The high velocity torque ratio was defined as the concentric strength at 350° s-1 divided by
the isometric strength (Tcon350/Tisom). A similar high-to-low velocity torque ratio has been
found to correlate with muscle composition (Gür et al., 2003).
6.2.3.2 Explosive isometric strength
Participants lay in a prone position on a custom-made isometric dynamometer at fixed hip
(140°, 180°= full extension) and knee (150°) joint angles selected to replicate the joint
positions during the late swing phase of sprinting (Guex et al., 2012) when hamstrings strains
are thought to occur. To minimize any extraneous movements, participants were fastened
with two straps across the hips, a strap over the lower back and a strap over the distal thigh
just above the knee joint. A metal ankle cuff with a lining of high density neoprene was
placed ~4 cm above the medial malleolus and the distal leg was tightly secured to the cuff
with straps. Force was measured with a calibrated strain gauge (linear response up to 500 N,
Force Logic UK, UK) in series with the ankle cuff and perpendicular to the tibia. The force
signal was amplified (x370) and sampled at 2000 Hz with an external analog-to-digital
converter (Micro 1401-3, CED, Cambridge, UK). A PC recorded and displayed the data
using the Spike 2 software (CED, Cambridge, UK). In order to remove the high-frequency
oscillation in the signal (just above 500 Hz), the force signal was filtered with a 4th order
Butterworth filter with a low pass cut-off frequency of 500 Hz (see Appendix B). The
frequencies <500 Hz were used as a reference envelope for detecting the force onset during
the explosive contractions. A lower frequency filter (e.g. 15-20 Hz) would transform the
signal into a gradually rising asymptotic curve, and therefore the sudden transition from rest
to force production would be removed resulting in subjective and unreliable recognition of
the force onset (Tillin et al., 2013). The distance between the knee joint space and the centre
of the ankle cuff was measured to calculate knee flexion torque.
After a standardised warm-up, participants performed 3 maximal knee flexion contractions to
establish the target torque for the subsequent explosive contractions (see below). A computer
Chapter 6 – Do muscle size and composition explain knee flexor muscle function?
93
screen provided real time visual feedback by displaying the torque response. Thereafter
participants completed 10 explosive contractions with 30 s rest between contractions. They
were instructed to contract ‘as fast and as hard as possible’ for ~1 s with an emphasis on
‘fast’ without any countermovement or pre-tension. Real-time visual feedback was provided
on the computer screen displaying the torque response, with specific performance feedback
of the time from 1% to 80% of peak torque. For the detection of any countermovement or
pre-tension, the resting torque was displayed on a sensitive scale. Standardized verbal
encouragement was given throughout the maximal and explosive contractions.
During offline analysis the three valid explosive contractions (achieved torque ≥80% of peak
torque with no discernible counter-movement or pre-tension - change of baseline signal <0.2
Nm for the 100 ms prior to the onset of contraction), with the fastest time from onset to 50%
of peak torque were selected for further analysis. Analysis of these contractions consisted of
measurement of the time from contraction onset to 10, 50, and 90 Nm and the time from
contraction onset to 15, 45 and 75% of peak torque. Force onsets were identified manually by
visual identification by a trained investigator using a systematic approach which is considered to
be more valid than automated methods (Tillin et al., 2013; Tillin et al., 2010). The three analysed
explosive contractions were averaged within each measurement session, before averaging
across the two sessions when these measurements were made.
6.2.3.3 Magnetic resonance imaging (MRI)
A 1.5 T MRI scanner (Signa HDxt, GE) was used to scan the dominant leg in the supine
position with the hip and knee joints extended. T1-weighted axial plane images were acquired
from the anterior superior iliac spine to the knee joint space in two overlapping blocks and oil
filled capsules were placed on the lateral side of the participants’ thigh to help with the
alignment of the blocks during analysis. The following imaging parameters were used:
imaging matrix: 512 x 512, field of view: 260 mm x 260 mm, spatial resolution: 0.508 mm x
0.508 mm, slice thickness: 5 mm, inter-slice gap: 0 mm.
MR images were analysed with Osirix software (version 4.0, Pixmeo, Geneva, Switzerland).
The BFlh, biceps femoris short head, semitendinosus and semimembranosus muscles were
manually outlined in every third image starting from the most proximal image in which the
muscle appeared. All manual segmentation measurements were completed by the same
investigator. Muscle volume was calculated using cubic spline interpolation (GraphPad Prism
6, GraphPad Software, Inc.). To examine reliability of the analysis procedures, the images

Chapter 6 – Do muscle size and composition explain knee flexor muscle function?
94
from 6 randomly selected participants were re-analysed a week later and the coefficient of
variation (CV) was calculated. The CV for muscle volume was on average 0.6%.
6.2.3.4 Muscle sampling and myosin heavy chain composition
Muscle samples (~0.04 g) from the mid-section BFlh (~50% thigh length) of the dominant
leg were obtained under local anaesthesia (1% lidocaine) using the microbiopsy technique
(Pro-Mag Ultra, Angiotech, Medical Device Technologies, FL, USA). Samples were
immediately frozen in liquid nitrogen and stored at -80°C for further analysis. MHC content
was determined by sodium dodecyl sulphate (SDS) polyacrylamide gel electrophoresis using
a method derived from that previously described (Fauteck & Kandarian, 1995).
Electrophoresis (Mini-Protean 3, Bio-Rad) was performed on 6% (crosslinking 2.7%)
polyacrylamide resolving gels with 4% (crosslinking 2.7%) stacking gels at ~4°C. The gels
were electrophoresed at a constant 100 V for 1 h, and thereafter at a constant 6 mA for ~18 h.
Gels were immediately silver stained (SilverQuest Silver Staining Kit, Invitrogen) and
protein bands quantified by densitometry (ChemiDoc XRS+ System, Bio-Rad). Muscle
samples were classified according to the relative expression of the three MHC isoforms: type
I, IIA, and IIX (Fig. 6.1). The MHC analysis was run in duplicate and the mean of the 2
analyses was taken. When the first 2 analyses had a difference >10% a third analysis was run.
For each individual, the representative MHC distribution was defined as the mean of all
repeats in which the different MHC isoforms were within 10% between analyses. The CV for
repeat samples was 3.9% for MHC-I, 5.7% for MHC-IIA and 8.4% for MHC-IIX.
Figure 6.1. Example sodium dodecyl sulphate (SDS) polyacrylamide gel electrophoresis
separation of the different myosin heavy chain (MHC) isoforms in biceps femoris long head
muscle sampled from 5 participants.

Chapter 6 – Do muscle size and composition explain knee flexor muscle function?
95
6.2.4 Statistical analysis
Data are presented as mean ± SD. One-way analysis of variance was used to examine for
differences in muscle volume between the constituents muscles of hamstrings and in knee
flexors torque at the different velocities. Bivariate relationships were examined using Pearson
product moment correlations between the dependent variables and the Holm-Bonferroni
correction was used to control for multiple tests. The level of significance was set at P< 0.05.
All statistical procedures were performed with IBM SPSS 22 (IBM Corporation, Armonk,
NY).
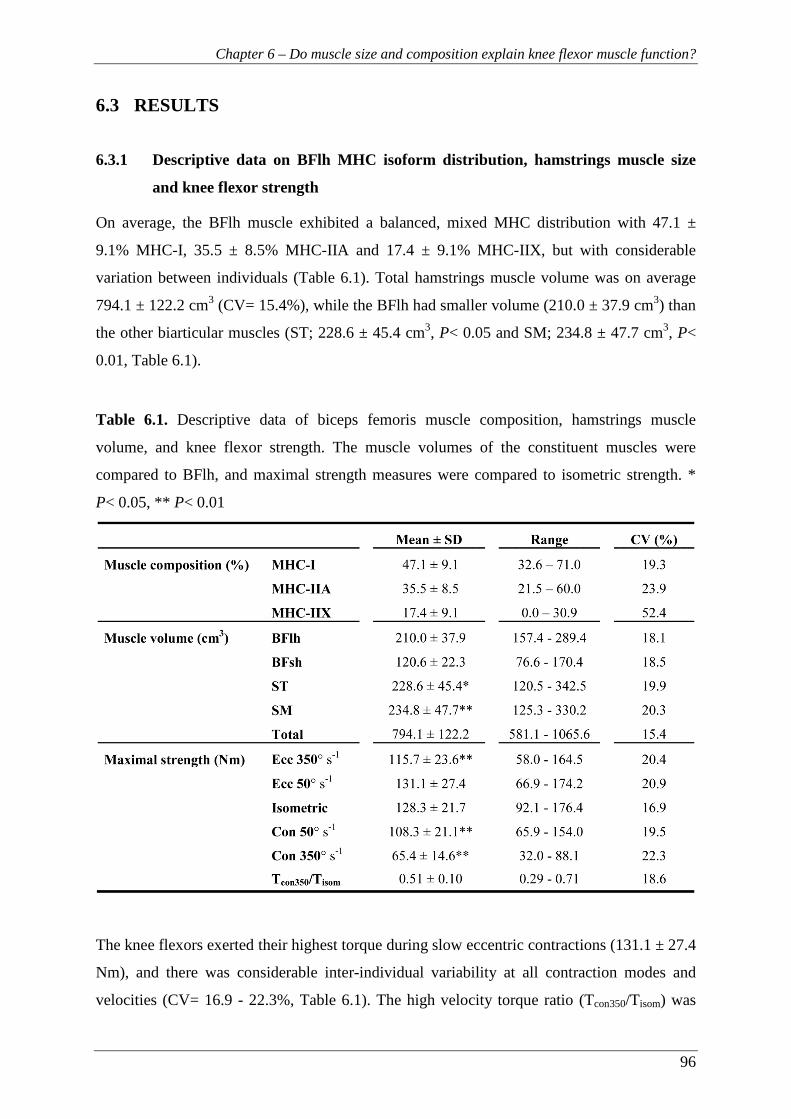
Chapter 6 – Do muscle size and composition explain knee flexor muscle function?
96
6.3 RESULTS
6.3.1 Descriptive data on BFlh MHC isoform distribution, hamstrings muscle size
and knee flexor strength
On average, the BFlh muscle exhibited a balanced, mixed MHC distribution with 47.1 ±
9.1% MHC-I, 35.5 ± 8.5% MHC-IIA and 17.4 ± 9.1% MHC-IIX, but with considerable
variation between individuals (Table 6.1). Total hamstrings muscle volume was on average
794.1 ± 122.2 cm3 (CV= 15.4%), while the BFlh had smaller volume (210.0 ± 37.9 cm3) than
the other biarticular muscles (ST; 228.6 ± 45.4 cm3, P< 0.05 and SM; 234.8 ± 47.7 cm3, P<
0.01, Table 6.1).
Table 6.1. Descriptive data of biceps femoris muscle composition, hamstrings muscle
volume, and knee flexor strength. The muscle volumes of the constituent muscles were
compared to BFlh, and maximal strength measures were compared to isometric strength. *
P< 0.05, ** P< 0.01
The knee flexors exerted their highest torque during slow eccentric contractions (131.1 ± 27.4
Nm), and there was considerable inter-individual variability at all contraction modes and
velocities (CV= 16.9 - 22.3%, Table 6.1). The high velocity torque ratio (Tcon350/Tisom) was

Chapter 6 – Do muscle size and composition explain knee flexor muscle function?
97
0.51 ± 0.10 (CV= 18.6%). Knee flexor explosive strength, measured as time to specific
torques, was found to vary between individuals, particularly during the later stages of the
explosive contractions (Fig. 6.2).
Figure 6.2. Knee flexion explosive strength expressed as time from zero to absolute (A) and
relative (B) torque levels. Data are mean ± SD (n= 31) with inter-individual coefficient of
variation (CV) presented at each torque level.
6.3.2 Relationships of hamstrings muscle size and BFlh MHC isoform distribution
with knee flexion strength
Hamstrings muscle volume had moderate to strong correlations with knee flexor torque at all
velocities (r= 0.62 – 0.76, P< 0.01, Table 6.2). In contrast, no relationship was found between
BFlh muscle composition and maximal strength at any velocity (-0.22 < r < 0.24, P> 0.05,
Fig. 6.3) or Tcon350/Tisom (-0.16 < r < 0.24, P> 0.05). When torque values at all velocities were
expressed relative to muscle volume there remained no association with BFlh muscle
composition (-0.29 < r < 0.35, P> 0.05).
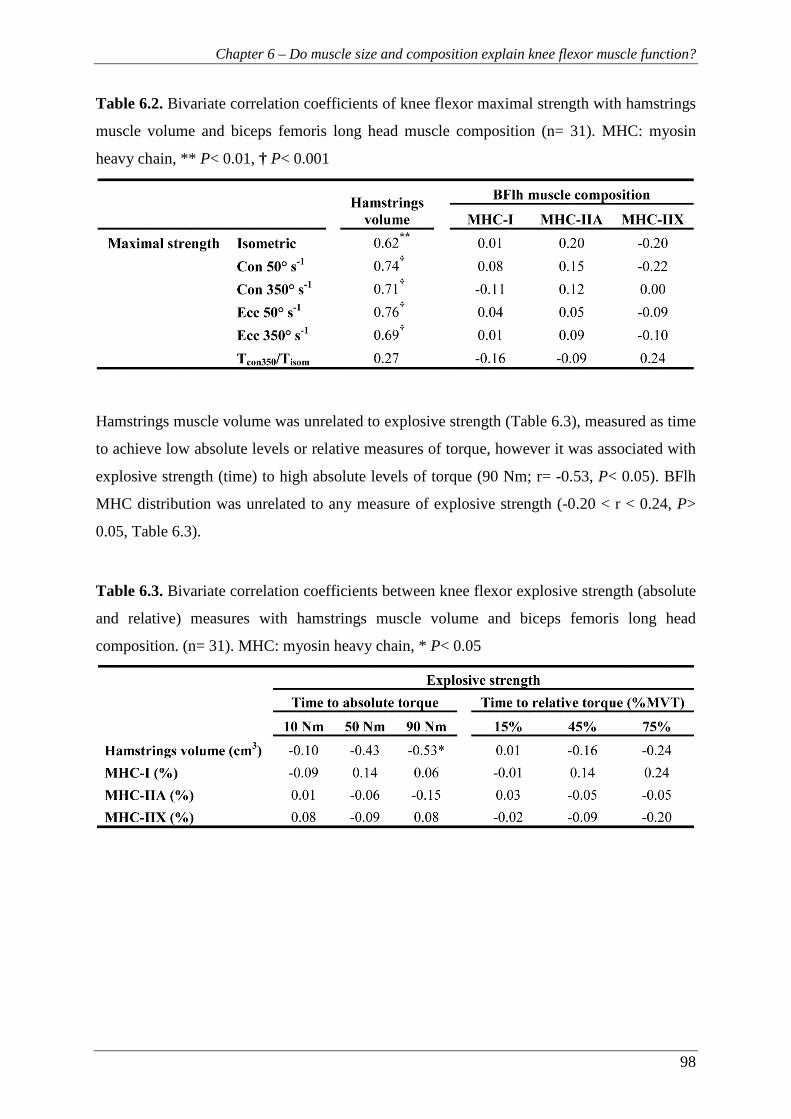
Chapter 6 – Do muscle size and composition explain knee flexor muscle function?
98
Table 6.2. Bivariate correlation coefficients of knee flexor maximal strength with hamstrings
muscle volume and biceps femoris long head muscle composition (n= 31). MHC: myosin
heavy chain, ** P< 0.01, † P< 0.001
Hamstrings muscle volume was unrelated to explosive strength (Table 6.3), measured as time
to achieve low absolute levels or relative measures of torque, however it was associated with
explosive strength (time) to high absolute levels of torque (90 Nm; r= -0.53, P< 0.05). BFlh
MHC distribution was unrelated to any measure of explosive strength (-0.20 < r < 0.24, P>
0.05, Table 6.3).
Table 6.3. Bivariate correlation coefficients between knee flexor explosive strength (absolute
and relative) measures with hamstrings muscle volume and biceps femoris long head
composition. (n= 31). MHC: myosin heavy chain, * P< 0.05
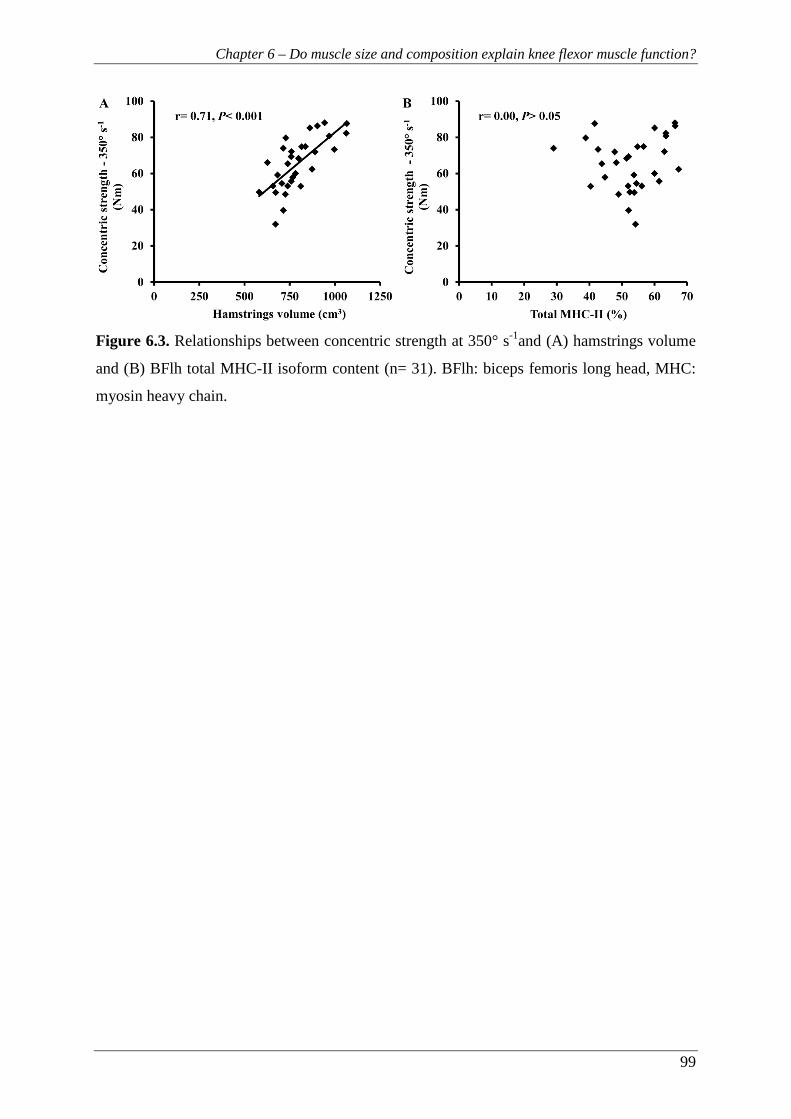
Chapter 6 – Do muscle size and composition explain knee flexor muscle function?
99
Figure 6.3. Relationships between concentric strength at 350° s-1and (A) hamstrings volume
and (B) BFlh total MHC-II isoform content (n= 31). BFlh: biceps femoris long head, MHC:
myosin heavy chain.
Chapter 6 – Do muscle size and composition explain knee flexor muscle function?
100
6.4 DISCUSSION
This study examined the influence of hamstrings muscle size and BFlh muscle composition
on knee flexors maximal and explosive strength. We found that within the examined cohort,
the BFlh exhibited on average a balanced MHC isoform distribution that appears very similar
to that of the other thigh muscles (see below), and therefore does not support the suggestion
that BFlh composition contributes to the high incidence of strain injury in this muscle.
Further, we found that 38-58% of the variance in knee flexor maximum torque at isometric
and at a range of concentric and eccentric velocities was attributable to differences in
hamstrings muscle volume, while BFlh MHC distribution was not related to any measure of
maximal or explosive strength.
The present study is the first to directly examine the BFlh muscle composition in vivo and our
results showed that, on average, the BFlh muscle had a balanced distribution of slow and fast
MHC isoforms (47.1 ± 9.1% MHC-I and 52.9 ± 9.1% total MHC-II) in young healthy men.
Hamstrings muscle composition has been linked to the high injury rate seen in this muscle
(Garret et al., 1984). In a much cited study, Garret et al. reported a BFlh muscle composition
within a small cohort of elderly cadavers to be similar to our data (54.5 ± 2.8% type II fibres
and 45.5 ± 2.8% type I of total number of sampled fibres), yet based on small differences
compared to other muscles (quadriceps, 51.9%; adductor magnus, 44.8% type II fibres) they
argued that the ‘high proportion’ of fast fibres in the hamstrings compared to other leg
muscles may contribute to their susceptibility to injury. However, the VL muscle, an
antagonist to BFlh muscle function, has been reported to contain a greater proportion of
MHC-II isoform (66.1% total MHC-II in 95 physically active young men; Staron et al., 2000)
compared to the BFlh in our cohort. Consequently, the composition of the BFlh does not
seem to explain the high incidence of strain injuries within this muscle compared to other
muscles. Therefore, other aspects of hamstrings structure (e.g. aponeurosis size, Evangelidis
et al., 2014) or function (eccentric actions at long lengths, Schache et al., 2012) are likely to
explain the high incidence of strain injuries in this muscle. On an individual basis however,
the proportion of MHC-II isoforms could still be a risk factor for hamstrings strain injury.
Type II fibres are selectively affected by eccentric exercise-induced muscle damage in both
animals and humans (Lieber and Friden, 1988; Friden et al., 1983), even after a single
eccentric contraction (Lovering and Deyne, 2004). Structural differences between fibre types
(e.g. thinner Z-disks in type II fibres; Luther, 2009) may contribute to the selective damage of
Chapter 6 – Do muscle size and composition explain knee flexor muscle function?
101
type II fibres (Friden and Lieber, 1992). Even though eccentric exercise-induced muscle
damage is not synonymous to strain injury, it does cause disruption of the muscle structure at
the microscopic level and it is possible that accumulation of such damage may eventually
lead to a macroscopic injury (Brocket et al., 2004, 2001). Considering all the changes in the
muscle apparatus as a result of eccentric exercise-induced damage (reduction of force-
generating capacity, shift of optimum fibre length and impairment of the excitation-
contraction coupling, Morgan and Allen, 1999), it would be logical to hypothesize that
individuals with a high percentage of type II fibres in their hamstrings may be at an increased
risk for strain injury when exposed to high-risk conditions. Within our cohort, total MHC-II
isoform content ranged from 29.0-67.4% and it is possible that individuals with a high
proportion of type II fibres could be at higher risk of injury. Future retrospective and
prospective studies are needed to elucidate the relationship between muscle composition and
the incidence of individual strain injuries.
Whilst MHC composition is a major determinant of function in single fibres (Bottinelli et al.,
1996), in this study no correlation was found between BFlh muscle composition and knee
flexors maximal or explosive strength in vivo. The lack of relevant previous data on the
hamstrings prevents any direct comparison with our findings; however similar studies on
knee extensors reported mixed results for the relationship of strength with muscle
composition. Some studies examined this relationship within athletes with diverse training
and competition backgrounds e.g. untrained, endurance, and strength and power athletes (Gür
et al., 2003; Viitasalo et al., 1981; Viitasalo & Komi, 1978). Whilst this approach produces a
wide range of muscle composition values, numerous other neuromuscular characteristics also
likely vary between these groups (e.g. muscle size, architecture, neural drive) and these could
confound any relationship of strength and muscle composition. Similar limitations confound
the results of studies that reported a significant influence of muscle composition on explosive
isometric strength in highly diverse cohorts (elite high jumpers vs. recreationally active
individuals; Viitasalo et al., l981; elite athletes of various sports, Viitasalo and Komi, 1978).
In vivo studies of muscle composition are typically limited to a single biopsy and it may not
fully reflect the composition in other regions of the muscle (Elder et al., 1982), however fibre
type distribution appears to be similar for biopsy samples taken from proximal and distal
(Garret et al, 1984) as well as superficial and deep sites (Edgerton et al., 1975). In addition,
BFlh muscle composition may not represent that of the other hamstrings muscles.
Nevertheless, in the present study within a group of non-athletic young men, muscle

Chapter 6 – Do muscle size and composition explain knee flexor muscle function?
102
composition did not explain their differences in maximal or explosive strength despite the
large inter-individual variability in these measures (CV; maximal strength: 16.9-22.3%;
explosive strength: 15.7-44.1%).
Our results revealed that hamstrings volume explained a significant portion of the variance in
isometric (38%), concentric (50-55%) and eccentric (48-58%) knee flexor strength. These
values are within the range of previous findings for the hamstrings (Akagi et al., 2012;
Masuda et al., 2003; Kanehisa et al., 1994). Two small studies (n< 16) that examined the
combined influence of muscle size and composition found that knee extensor strength was
related to quadriceps ACSA (Johansson et al., 1987; Maughan and Nimmo, 1984), but only
Johansson et al. (1987) reported a significant relationship of muscle composition with
maximal concentric strength at 180° s-1 after accounting for muscle size. Despite the
significant correlations found in this study, the variability in knee flexors torque-velocity
relationship can be attributed only in part (38-58%) to differences in hamstrings muscle size.
This may be partly due to the fact that other muscles (i.e. gastrocnemius, gracilis, sartorius
and popliteus) also contribute to knee flexor torque but their volume was not measured.
Whilst we found that MHC composition does not seem to be a determining factor, other
variables likely to explain some of the remaining variance in knee flexors maximal strength
include moment arm (Baxter and Piazza, 2014), muscle architecture (Aagaard et al., 2001),
level of agonist activation (Westing et al., 1990) and antagonist co-activation (Kellis and
Baltzopoulos, 1998).
In contrast to maximal strength, explosive strength was not influenced by muscle size apart
from at high levels of absolute torque (time from rest to 90 Nm; r= -0.53, P< 0.01). Whilst no
similar data exist on hamstrings, elbow flexors isometric explosive strength has been related
to muscle volume, but only during the later stages of contraction (150 ms, r= 0.69, P< 0.001)
at relatively high levels of force (~80% MVF; Erskine et al., 2014).
In conclusion, the balanced MHC distribution found in BFlh muscle which appears similar to
other thigh muscles, and therefore seems unlikely to contribute to the high susceptibility of
the BFlh to strain injury. Hamstrings muscle volume explained 38-58% of the inter-
individual differences in knee flexors torque at a range of velocities while BFlh muscle
composition was not associated with maximal or explosive strength.

103
Chapter 7
Biceps femoris aponeurosis size: A potential risk factor for strain injury?

Chapter 7 – Biceps femoris proximal aponeurosis size
104
7 CHAPTER 7 – BICEPS FEMORIS APONEUROSIS SIZE: A
POTENTIAL RISK FACTOR FOR STRAIN INJURY?
7.1 INTRODUCTION
The susceptibility of the hamstrings to strain injuries is well documented with the majority of
these injuries located near the proximal myotendinous junction (MTJ) of the biceps femoris
long head muscle (BFlh) (Woodley and Mercer, 2004). While some risk factors for
hamstrings strain injuries have been identified (e.g. previous strain injury, strength
imbalances and muscle fatigue) (van Beijsterveldt et al., 2013; Opar et al., 2012) whether the
anatomical structure of the BFlh muscle-tendon unit (MTU), including the aponeurosis,
might influence injury risk has received very little attention. Only recently has a
disproportionately small BFlh proximal aponeurosis been suggested as a potential risk factor
for hamstrings strain injury, following two studies that calculated higher localised tissue
strains for individuals with a narrow proximal aponeurosis using computational modelling
and dynamic MR imaging (Fiorentino et al., 2012; Rehorn and Blemker, 2010).
In a pennate muscle the force from the muscle fibres is transmitted to the tendon primarily via
the aponeurosis. It seems reasonable to assume that a bigger and stronger muscle would have
a larger and stronger aponeurosis and tendon in order to effectively and safely transfer the
contractile force to the bone. Therefore, a degree of scaling between the size of the force
generator and force transmitters seems intuitive. Within the quadriceps the vastus lateralis
(VL) aponeurosis area has been found to be in proportion to total quadriceps volume (Abe et
al., 2012). However, whether this is the case for the hamstrings remains largely unknown. A
preliminary report suggested that the width of the BFlh proximal aponeurosis was highly
variable between individuals and unrelated to the size of the BFlh muscle (Handsfield et al.,
2010) suggesting that the force transmitter may not be proportional to the force generator. If
this is the case, a disproportionately small BFlh proximal aponeurosis may concentrate
mechanical strain on the surrounding muscle tissue (Fiorentino et al., 2014; Fiorentino et al.,
2012; Rehorn and Blemker, 2010) and be a risk factor for hamstrings strain injury. However,
in this preliminary report aponeurosis width was measured at a single arbitrary point along
the muscle, which may be a poor reflection of the size of the aponeurosis. In contrast,
measuring the whole contact interface between the muscle and aponeurosis may better reflect
the concentration of mechanical strain at this interface.
Chapter 7 – Biceps femoris proximal aponeurosis size
105
From a functional perspective, aponeurosis size might be expected to be most strongly related
to the maximum force transmitted through these tissues, and thus muscle strength. Whilst,
experimental measurement of the in vivo force generating capacity of the BFlh may not be
possible, knee flexor torque, which is primarily due to hamstrings activation, can be assessed.
Maximal isometric torque is a convenient measurement of muscle function, although higher
torques can often be achieved eccentrically which likely contribute to the high risk of BFlh
MTU strains during eccentric actions (Heiderscheit et al., 2005). However, the relationship
between aponeurosis size and isometric or eccentric muscle strength has yet to be
investigated.
The aim of this study was to examine the relationship of BFlh proximal aponeurosis area with
muscle size (maximal anatomical cross-sectional area and volume) and knee flexor strength
(isometric and eccentric). Based on the role of the aponeurosis as a force transmitter within
the MTU, we hypothesized that BFlh proximal aponeurosis area would be positively related
to muscle size and strength.

Chapter 7 – Biceps femoris proximal aponeurosis size
106
7.2 METHODS
7.2.1 Participants
Thirty healthy, recreationally active participants (age 20.7 ± 2.6 years; height 1.79 ± 0.07 m;
body mass 72.2 ± 7.2 kg; mean ± SD) took part in this study. Participants had a low to
moderate level of physical activity and were not involved in systematic physical training or
had any previous experience of strength/power training (i.e. weight training, plyometrics) of
the lower body musculature. Their physical activity was assessed with the International
Physical Activity Questionnaire short format (www.ipaq.ki.se/downloads.htm) (Craig et al.,
2003) and their average energy expenditure was 1826 ± 936 metabolic equivalent-
minutes/week. After completing the physical activity and health screen questionnaires,
participants provided written informed consent for their participation in this study, which was
approved by the Loughborough University Ethical Advisory Committee. All participants
were healthy with no history of musculo-skeletal problems or injuries of the lower back,
pelvis or legs. Participants were instructed not to take part in any unaccustomed or strenuous
physical activity for at least 2 days prior to each laboratory visit.
7.2.2 Overview
All participants visited the laboratory on four separate occasions seven days apart at a
consistent time of the day (11:00-16:00 h) for measurements on the knee flexors of their
dominant leg (defined as the preferred leg when kicking a ball). The first session involved
collection of the anthropometric data and familiarization with the isometric and eccentric
strength measurements. The second session involved the measurement of the knee flexion
isometric strength and further familiarisation with the eccentric strength measurements. In the
third session, participants repeated the isometric strength testing and also performed the
eccentric strength measurements. The final session involved magnetic resonance imaging
(MRI) of the participants’ thigh to assess the BFlh proximal aponeurosis area, hamstrings
maximal anatomical cross-sectional area (ACSAmax), and BFlh/semitendinosus (ST)
conjoint proximal tendon CSA.

Chapter 7 – Biceps femoris proximal aponeurosis size
107
7.2.3 Measurements and Data analysis
7.2.3.1 Isometric strength
Participants lay in a prone position on a custom-made isometric dynamometer with hip and
knee joint angles of 40° and 30° respectively (0°= full extension) (Fig. 7.1). These angles
were selected because of their relevance to the angles during the late swing phase in sprinting
(Guex et al., 2012) when hamstrings strains are thought to occur. To minimize any
extraneous movements, participants were fastened with two straps across the hips, a strap
over the lower back and a strap over the distal thigh just above the knee joint. A metal ankle
cuff with a lining of high density neoprene was placed ~2 cm above the medial malleolus and
the distal leg was tightly secured to the cuff with straps. The distance between the knee joint
space and the centre of the ankle cuff was measured and used for calculation of the knee
flexion torque. Force was measured with a calibrated strain gauge (linear response up to 500
N, Force Logic UK) connected in series to the ankle cuff and positioned perpendicularly to
the tibia. The force signal was amplified (x370) and sampled at 2000 Hz with an external
analog-to-digital converter (Micro 1401-3, CED, Cambridge, UK). A PC recorded and
displayed the data using the Spike 2 software (CED, Cambridge, UK). The force signal was
filtered with a 4th order Butterworth filter with a low pass cut-off frequency of 500 Hz. The
frequencies <500 Hz were used as a reference envelope for detecting the force onset during
the explosive contractions (see Appendix B). A lower frequency filter (e.g. 15-20 Hz) would
transform the signal into a gradually rising asymptotic curve, and therefore the sudden
transition from rest to force production would be removed resulting in subjective and
unreliable recognition of the force onset (Tillin et al., 2013).
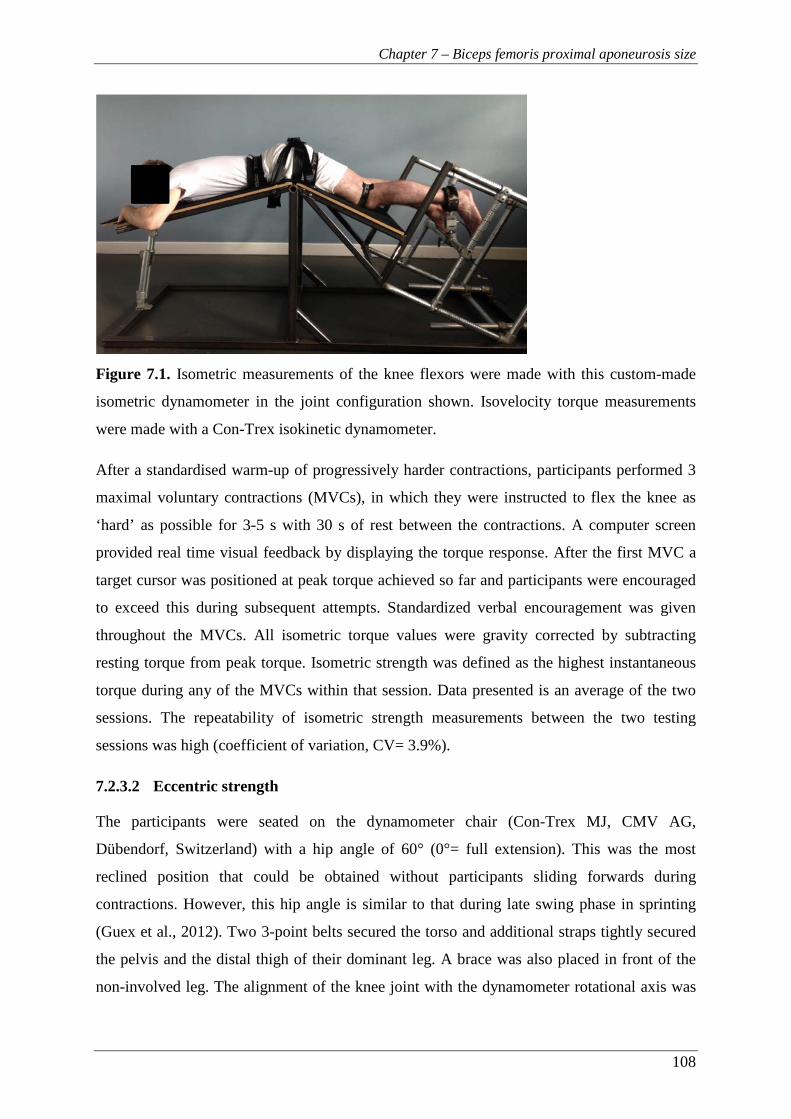
Chapter 7 – Biceps femoris proximal aponeurosis size
108
Figure 7.1. Isometric measurements of the knee flexors were made with this custom-made
isometric dynamometer in the joint configuration shown. Isovelocity torque measurements
were made with a Con-Trex isokinetic dynamometer.
After a standardised warm-up of progressively harder contractions, participants performed 3
maximal voluntary contractions (MVCs), in which they were instructed to flex the knee as
‘hard’ as possible for 3-5 s with 30 s of rest between the contractions. A computer screen
provided real time visual feedback by displaying the torque response. After the first MVC a
target cursor was positioned at peak torque achieved so far and participants were encouraged
to exceed this during subsequent attempts. Standardized verbal encouragement was given
throughout the MVCs. All isometric torque values were gravity corrected by subtracting
resting torque from peak torque. Isometric strength was defined as the highest instantaneous
torque during any of the MVCs within that session. Data presented is an average of the two
sessions. The repeatability of isometric strength measurements between the two testing
sessions was high (coefficient of variation, CV= 3.9%).
7.2.3.2 Eccentric strength
The participants were seated on the dynamometer chair (Con-Trex MJ, CMV AG,
Dübendorf, Switzerland) with a hip angle of 60° (0°= full extension). This was the most
reclined position that could be obtained without participants sliding forwards during
contractions. However, this hip angle is similar to that during late swing phase in sprinting
(Guex et al., 2012). Two 3-point belts secured the torso and additional straps tightly secured
the pelvis and the distal thigh of their dominant leg. A brace was also placed in front of the
non-involved leg. The alignment of the knee joint with the dynamometer rotational axis was
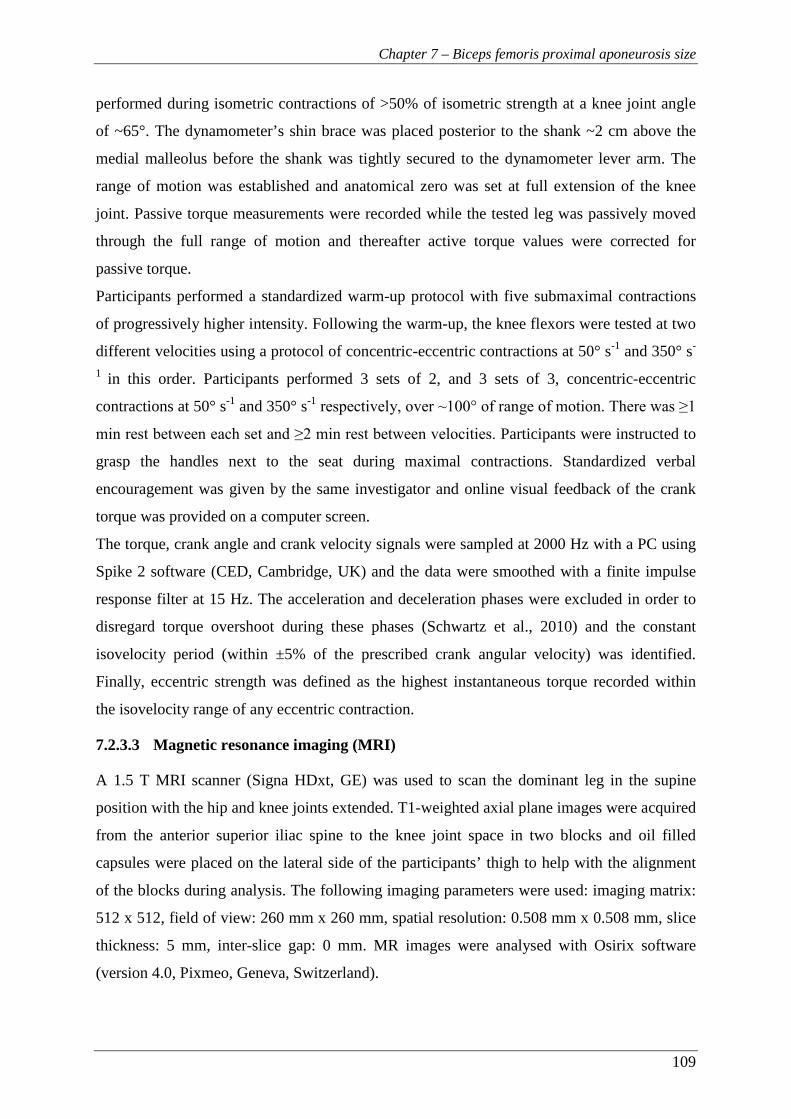
Chapter 7 – Biceps femoris proximal aponeurosis size
109
performed during isometric contractions of >50% of isometric strength at a knee joint angle
of ~65°. The dynamometer’s shin brace was placed posterior to the shank ~2 cm above the
medial malleolus before the shank was tightly secured to the dynamometer lever arm. The
range of motion was established and anatomical zero was set at full extension of the knee
joint. Passive torque measurements were recorded while the tested leg was passively moved
through the full range of motion and thereafter active torque values were corrected for
passive torque.
Participants performed a standardized warm-up protocol with five submaximal contractions
of progressively higher intensity. Following the warm-up, the knee flexors were tested at two
different velocities using a protocol of concentric-eccentric contractions at 50° s-1 and 350° s-
1 in this order. Participants performed 3 sets of 2, and 3 sets of 3, concentric-eccentric
contractions at 50° s-1 and 350° s-1 respectively, over ~100° of range of motion. There was ≥1
min rest between each set and ≥2 min rest between velocities. Participants were instructed to
grasp the handles next to the seat during maximal contractions. Standardized verbal
encouragement was given by the same investigator and online visual feedback of the crank
torque was provided on a computer screen.
The torque, crank angle and crank velocity signals were sampled at 2000 Hz with a PC using
Spike 2 software (CED, Cambridge, UK) and the data were smoothed with a finite impulse
response filter at 15 Hz. The acceleration and deceleration phases were excluded in order to
disregard torque overshoot during these phases (Schwartz et al., 2010) and the constant
isovelocity period (within ±5% of the prescribed crank angular velocity) was identified.
Finally, eccentric strength was defined as the highest instantaneous torque recorded within
the isovelocity range of any eccentric contraction.
7.2.3.3 Magnetic resonance imaging (MRI)
A 1.5 T MRI scanner (Signa HDxt, GE) was used to scan the dominant leg in the supine
position with the hip and knee joints extended. T1-weighted axial plane images were acquired
from the anterior superior iliac spine to the knee joint space in two blocks and oil filled
capsules were placed on the lateral side of the participants’ thigh to help with the alignment
of the blocks during analysis. The following imaging parameters were used: imaging matrix:
512 x 512, field of view: 260 mm x 260 mm, spatial resolution: 0.508 mm x 0.508 mm, slice
thickness: 5 mm, inter-slice gap: 0 mm. MR images were analysed with Osirix software
(version 4.0, Pixmeo, Geneva, Switzerland).
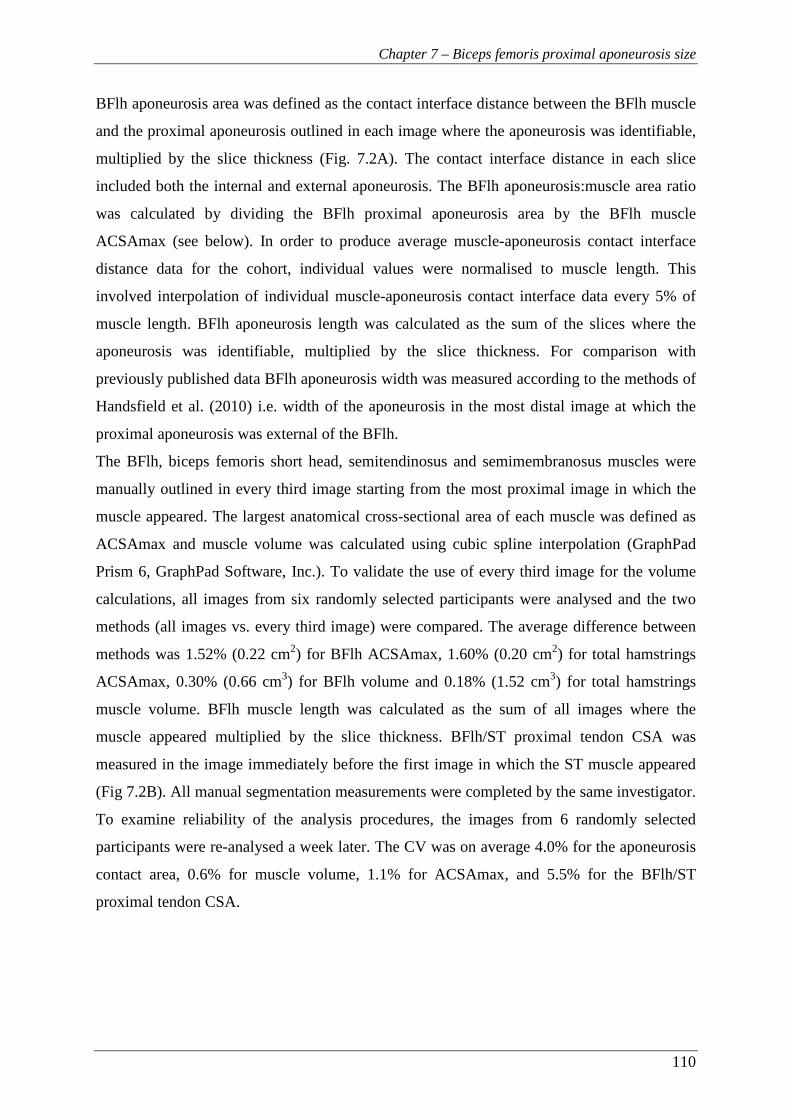
Chapter 7 – Biceps femoris proximal aponeurosis size
110
BFlh aponeurosis area was defined as the contact interface distance between the BFlh muscle
and the proximal aponeurosis outlined in each image where the aponeurosis was identifiable,
multiplied by the slice thickness (Fig. 7.2A). The contact interface distance in each slice
included both the internal and external aponeurosis. The BFlh aponeurosis:muscle area ratio
was calculated by dividing the BFlh proximal aponeurosis area by the BFlh muscle
ACSAmax (see below). In order to produce average muscle-aponeurosis contact interface
distance data for the cohort, individual values were normalised to muscle length. This
involved interpolation of individual muscle-aponeurosis contact interface data every 5% of
muscle length. BFlh aponeurosis length was calculated as the sum of the slices where the
aponeurosis was identifiable, multiplied by the slice thickness. For comparison with
previously published data BFlh aponeurosis width was measured according to the methods of
Handsfield et al. (2010) i.e. width of the aponeurosis in the most distal image at which the
proximal aponeurosis was external of the BFlh.
The BFlh, biceps femoris short head, semitendinosus and semimembranosus muscles were
manually outlined in every third image starting from the most proximal image in which the
muscle appeared. The largest anatomical cross-sectional area of each muscle was defined as
ACSAmax and muscle volume was calculated using cubic spline interpolation (GraphPad
Prism 6, GraphPad Software, Inc.). To validate the use of every third image for the volume
calculations, all images from six randomly selected participants were analysed and the two
methods (all images vs. every third image) were compared. The average difference between
methods was 1.52% (0.22 cm2) for BFlh ACSAmax, 1.60% (0.20 cm2) for total hamstrings
ACSAmax, 0.30% (0.66 cm3) for BFlh volume and 0.18% (1.52 cm3) for total hamstrings
muscle volume. BFlh muscle length was calculated as the sum of all images where the
muscle appeared multiplied by the slice thickness. BFlh/ST proximal tendon CSA was
measured in the image immediately before the first image in which the ST muscle appeared
(Fig 7.2B). All manual segmentation measurements were completed by the same investigator.
To examine reliability of the analysis procedures, the images from 6 randomly selected
participants were re-analysed a week later. The CV was on average 4.0% for the aponeurosis
contact area, 0.6% for muscle volume, 1.1% for ACSAmax, and 5.5% for the BFlh/ST
proximal tendon CSA.

Chapter 7 – Biceps femoris proximal aponeurosis size
111
Figure 7.2. Example MR images of (A) BFlh ACSA (main) and BFlh proximal aponeurosis
to muscle contact distance (inset) and (B) measurement of the BFlh/ST proximal tendon
CSA.
7.2.4 Statistical analysis
One participant did not complete the eccentric strength assessment. Data are presented as
mean ± SD. The bivariate relationships between the size of the different MTU components
and the relationships between the size of the MTU components and the knee flexor strength
measures were examined using Pearson product moment correlations between the dependent
variables and the level of significance was set at P< 0.05. All statistical procedures were
performed with IBM SPSS 20 (IBM Corporation, Armonk, NY).
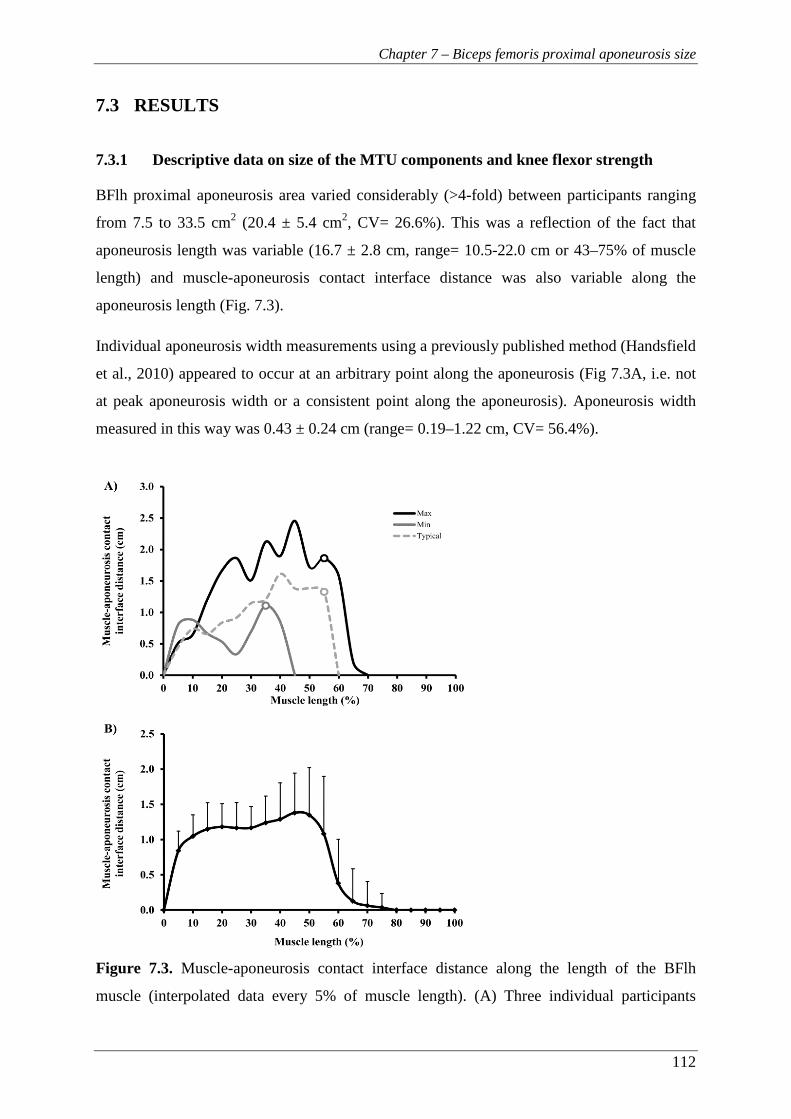
Chapter 7 – Biceps femoris proximal aponeurosis size
112
7.3 RESULTS
7.3.1 Descriptive data on size of the MTU components and knee flexor strength
BFlh proximal aponeurosis area varied considerably (>4-fold) between participants ranging
from 7.5 to 33.5 cm2 (20.4 ± 5.4 cm2, CV= 26.6%). This was a reflection of the fact that
aponeurosis length was variable (16.7 ± 2.8 cm, range= 10.5-22.0 cm or 43–75% of muscle
length) and muscle-aponeurosis contact interface distance was also variable along the
aponeurosis length (Fig. 7.3).
Individual aponeurosis width measurements using a previously published method (Handsfield
et al., 2010) appeared to occur at an arbitrary point along the aponeurosis (Fig 7.3A, i.e. not
at peak aponeurosis width or a consistent point along the aponeurosis). Aponeurosis width
measured in this way was 0.43 ± 0.24 cm (range= 0.19–1.22 cm, CV= 56.4%).
Figure 7.3. Muscle-aponeurosis contact interface distance along the length of the BFlh
muscle (interpolated data every 5% of muscle length). (A) Three individual participants
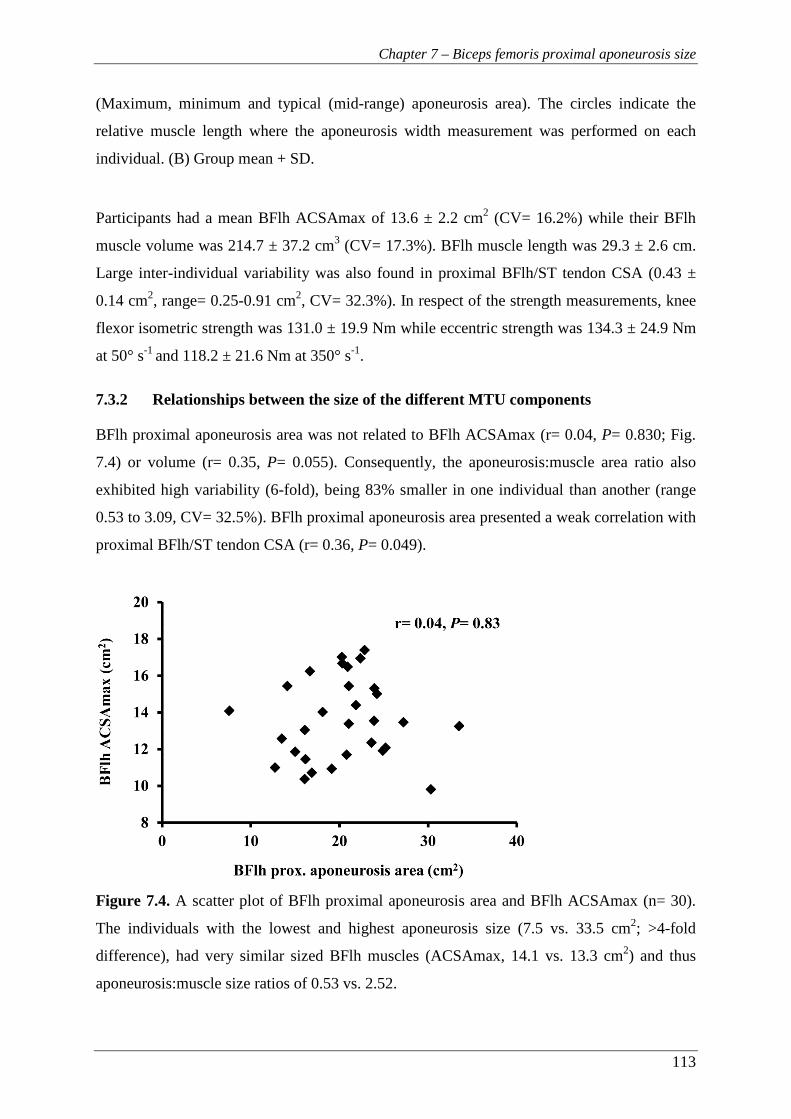
Chapter 7 – Biceps femoris proximal aponeurosis size
113
(Maximum, minimum and typical (mid-range) aponeurosis area). The circles indicate the
relative muscle length where the aponeurosis width measurement was performed on each
individual. (B) Group mean + SD.
Participants had a mean BFlh ACSAmax of 13.6 ± 2.2 cm2 (CV= 16.2%) while their BFlh
muscle volume was 214.7 ± 37.2 cm3 (CV= 17.3%). BFlh muscle length was 29.3 ± 2.6 cm.
Large inter-individual variability was also found in proximal BFlh/ST tendon CSA (0.43 ±
0.14 cm2, range= 0.25-0.91 cm2, CV= 32.3%). In respect of the strength measurements, knee
flexor isometric strength was 131.0 ± 19.9 Nm while eccentric strength was 134.3 ± 24.9 Nm
at 50° s-1 and 118.2 ± 21.6 Nm at 350° s-1.
7.3.2 Relationships between the size of the different MTU components
BFlh proximal aponeurosis area was not related to BFlh ACSAmax (r= 0.04, P= 0.830; Fig.
7.4) or volume (r= 0.35, P= 0.055). Consequently, the aponeurosis:muscle area ratio also
exhibited high variability (6-fold), being 83% smaller in one individual than another (range
0.53 to 3.09, CV= 32.5%). BFlh proximal aponeurosis area presented a weak correlation with
proximal BFlh/ST tendon CSA (r= 0.36, P= 0.049).
Figure 7.4. A scatter plot of BFlh proximal aponeurosis area and BFlh ACSAmax (n= 30).
The individuals with the lowest and highest aponeurosis size (7.5 vs. 33.5 cm2; >4-fold
difference), had very similar sized BFlh muscles (ACSAmax, 14.1 vs. 13.3 cm2) and thus
aponeurosis:muscle size ratios of 0.53 vs. 2.52.
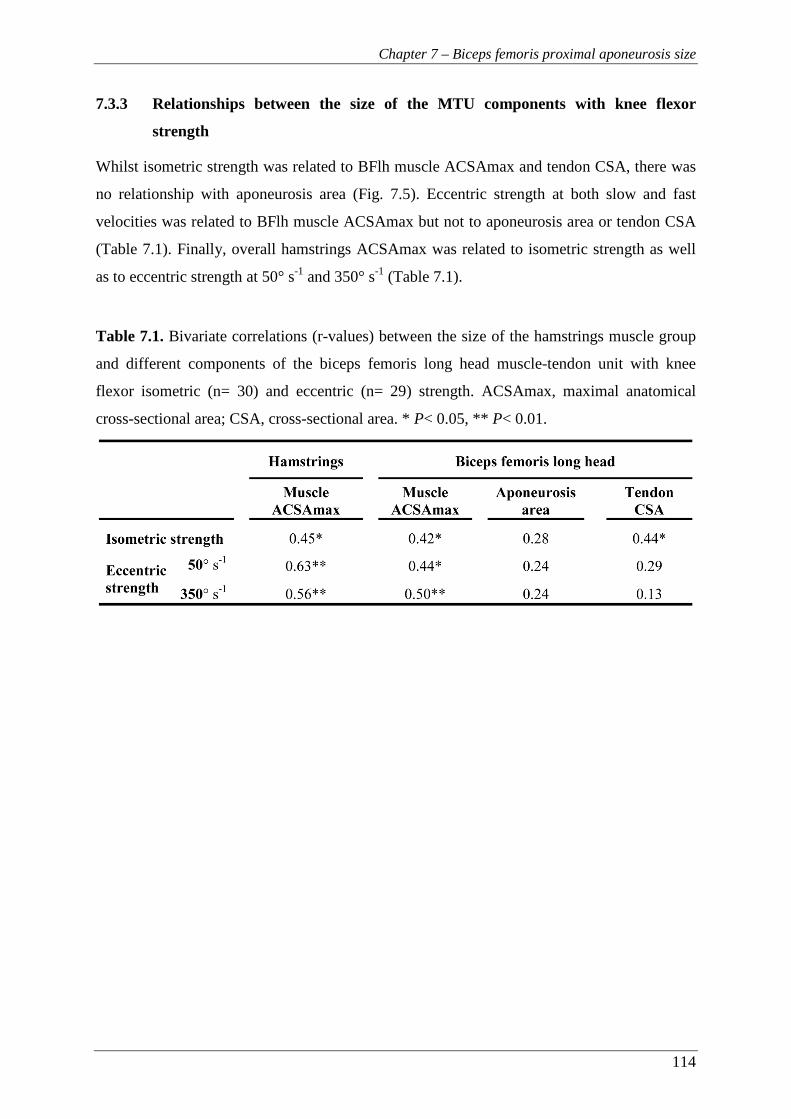
Chapter 7 – Biceps femoris proximal aponeurosis size
114
7.3.3 Relationships between the size of the MTU components with knee flexor
strength
Whilst isometric strength was related to BFlh muscle ACSAmax and tendon CSA, there was
no relationship with aponeurosis area (Fig. 7.5). Eccentric strength at both slow and fast
velocities was related to BFlh muscle ACSAmax but not to aponeurosis area or tendon CSA
(Table 7.1). Finally, overall hamstrings ACSAmax was related to isometric strength as well
as to eccentric strength at 50° s-1 and 350° s-1 (Table 7.1).
Table 7.1. Bivariate correlations (r-values) between the size of the hamstrings muscle group
and different components of the biceps femoris long head muscle-tendon unit with knee
flexor isometric (n= 30) and eccentric (n= 29) strength. ACSAmax, maximal anatomical
cross-sectional area; CSA, cross-sectional area. * P< 0.05, ** P< 0.01.
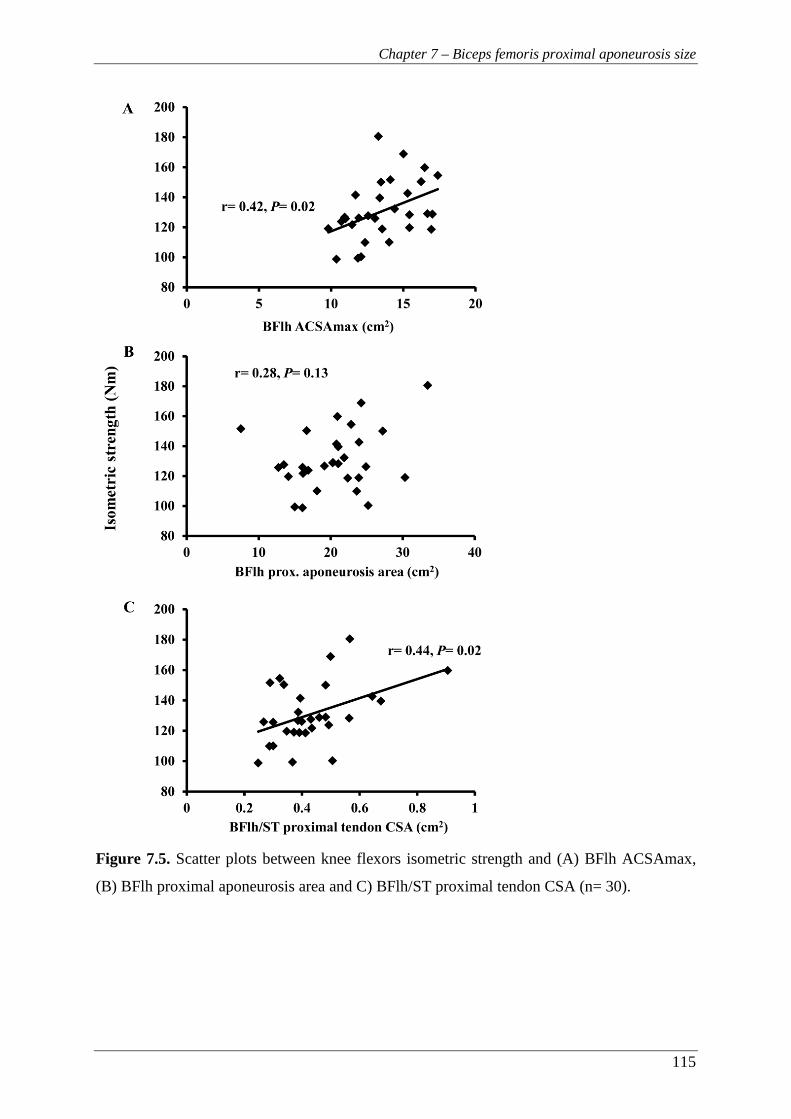
Chapter 7 – Biceps femoris proximal aponeurosis size
115
Figure 7.5. Scatter plots between knee flexors isometric strength and (A) BFlh ACSAmax,
(B) BFlh proximal aponeurosis area and C) BFlh/ST proximal tendon CSA (n= 30).
Chapter 7 – Biceps femoris proximal aponeurosis size
116
7.4 DISCUSSION
The present study examined the variability of the BFlh proximal aponeurosis size in healthy,
recreationally active population and the relationships of the aponeurosis size with BFlh
muscle size and knee flexor function. The main finding was that the proximal aponeurosis
size was highly variable between individuals and, in contrast to our hypothesis, it was not
related to muscle size or knee flexor maximal isometric or eccentric strength. The
disproportion between aponeurosis size and muscle size/strength suggests that individuals
with a relatively small aponeurosis will be subject to greater mechanical strain in the muscle
tissue surrounding the aponeurosis which may predispose them to hamstrings strain injuries.
Despite the homogenous nature of the recruited cohort there was a large 4.5-fold variability
in BFlh proximal aponeurosis area between participants that was substantially greater than
the variability in BFlh muscle ACSAmax (1.8-fold). Moreover, contrary to our hypothesis
these two variables were unrelated, and consequently the aponeurosis:muscle area ratio in
this study ranged from 0.53 to 3.09 exhibiting a 6-fold range, and being 83% smaller in one
individual than another even within this relatively homogenous cohort. Interestingly, the
individuals with the lowest and highest aponeurosis area in this study (7.5 and 33.5 cm2
respectively) had similar BFlh ACSAmax (14.1 and 13.3 cm2; Fig. 7.4) and consequently
their aponeurosis:muscle area ratios were 0.53 and 2.52. Similarly, from a functional
perspective, our results showed that aponeurosis size was unrelated to knee flexor strength,
whilst the size of the other components of the MTU (muscle and tendon area) was associated
with muscle strength (Fig. 7.5).
The lack of relationship between aponeurosis size and muscle size may have important
implications for the mechanical strain within the muscle tissue surrounding the aponeurosis.
Based on modelling and in vivo measurements of mechanical strain, individuals with a
relatively small aponeurosis:muscle size ratio would be expected to experience greater
mechanical strain in the muscle tissue adjacent to the aponeurosis with a greater potential for
injurious muscle strains (Fiorentino et al., 2014; Fiorentino et al., 2012; Rehorn and Blemker,
2010). Therefore, our results in combination with the fact that hamstrings strain injuries
typically occur near the BFlh proximal MTJ (Koulouris and Connell, 2003) suggest that
individuals with a low aponeurosis:muscle size ratio may be at an increased risk of
hamstrings strain injury.

Chapter 7 – Biceps femoris proximal aponeurosis size
117
This study is the first to directly examine the relationship between BFlh muscle and
aponeurosis size. The only similar data we are aware of examined a different muscle and
found VL aponeurosis area in a cohort of elite weightlifters and recreationally active males to
be strongly related to total quadriceps muscle volume (R2= 0.85) (Abe et al., 2012). Whilst
the adaptation of tendon in response to resistance training has been shown with increases in
size and stiffness (Kongsgaard et al., 2007; Seynnes et al., 2009), it remains unknown
whether the aponeurosis shows similar plasticity. The greater VL aponeurosis area exhibited
by the elite weightlifters compared to the recreationally active students in the study of Abe et
al (2012) suggests that this difference may be an adaptive response to resistance training. If
this were the case BFlh aponeurosis size may be modifiable through training and this could
reduce the risk of strain injury. Interestingly, Wakahara et al. (2015) found a small increase in
vastus lateralis aponeurosis width (1.9%, P= 0.050) after 12 weeks of resistance training.
However, these results should be treated with caution due to methodological limitations in
their study (small training cohort, n= 11, no correction for multiple tests). Nevertheless, the
notion that strength training may increase the aponeurosis area has significant implications as
individuals with a small aponeurosis relative to their BFlh muscle size may be able to
increase their aponeurosis size and reduce the mechanical strains therein. This could be a
powerful injury prevention tool that could be put in place prior to strain injury occurrence in
at-risk individuals. Future studies should further examine the effect of strength training on
aponeurosis size.
For comparative reasons, we measured aponeurosis width replicating the methods of a
preliminary report (Handsfield et al., 2010) and the range of values obtained here (0.19–1.22
cm) were similar with their results. However, this method involved the measurement of
aponeurosis width at an arbitrary point which corresponded to different relative positions
along both the aponeurosis and muscle for each individual (Fig. 7.3A), nor was it the point of
peak muscle-aponeurosis contact interface distance. These limitations in the width
measurement do not allow for any valid comparison with aponeurosis area or examination of
the differences between individuals. Furthermore, the individuals exhibiting the lowest and
highest aponeurosis area (>4-fold difference) both had mid-range aponeurosis widths (0.32
vs. 0.63 cm; <2-fold difference). Therefore the aponeurosis width measurement appeared to
be a limited reflection of aponeurosis size and inter-individual variability in this study.
Both aponeurosis and free tendon are considered to have a high safety factor (i.e. the ratio of
failure stress to peak operating stress) such that the aponeurosis and tendon are capable of
Chapter 7 – Biceps femoris proximal aponeurosis size
118
accommodating a range of loads well beyond the normal functional range with no risk of
injury to these structures (Azizi et al., 2009; Biewener et al., 2005). This may partly explain
the lack of relationship between muscle strength and aponeurosis size. Nevertheless, strain
injuries typically occur within the muscle tissue adjacent to the aponeurosis rather than within
the aponeurosis. Therefore, whilst a small aponeurosis may have a sufficient safety factor to
preclude aponeurosis injury it could make the adjacent muscle tissue vulnerable to injury.
An interesting observation made during the analysis of the MR images was that the BFlh
aponeurosis extends not only longitudinally along the side of the muscle belly but also
transversely into the muscle (Fig. 7.2A), in agreement with a previous report (Fiorentino et
al., 2012). Anecdotally, the proportion of the internal aponeurosis to the total aponeurosis
area between our participants appeared highly variable. However, it is currently unknown
how this aponeurosis morphology affects force transmission and stress distribution and
further study is needed to elucidate its relationship with muscle size and strength.
Despite the large number of studies examining possible risk factors for strain injuries, it is
still unclear how to identify individuals at high risk of strain injury, especially those with no
history of injury. The emerging evidence that aponeurosis size may be a risk factor for such
injuries has significant implications. Establishment of such an anatomical feature as a risk
factor would greatly help to distinguish at-risk individuals before an injury occurs. For that
reason, a prospective study investigating aponeurosis area relative to muscle size and strength
and recording which athletes go on to suffer a strain injury would provide valuable
information. Also, the possible interaction of aponeurosis area with other established risk
factors (e.g. previous strain injury and strength imbalances) should be considered.
Some limitations of this study have to be considered. First, the knee joint axis of rotation was
assumed to be passing through the knee joint space which was identified using superficial
anatomy. It was also assumed that knee flexors strength measurement in vivo reflected the
force generating capacity of BFlh muscle and the forces transmitted by the proximal
aponeurosis.
In conclusion, the present study showed that the BFlh proximal aponeurosis size exhibits high
variability within a relatively homogenous cohort of healthy young men and it was not related
to muscle size or knee flexor strength. Therefore, individuals with a relatively small
aponeurosis may be at increased risk of hamstrings strain injury.
119
Chapter 8
General Discussion
Chapter 8 – General Discussion
120
8 CHAPTER 8 – GENERAL DISCUSSION
8.1 INTRODUCTION
The main aim of this thesis was to examine the hamstrings anatomy and its influence on knee
flexor muscle function in vivo within young healthy men. A secondary aim was to better
understand the implications of hamstrings anatomy and function, and their variability, in
relation to the risk of strain injury. To address these aims, a series of studies were conducted
and the main findings are as follows:
1. The functional, conventional and knee joint angle-specific isometric H:Q ratios exhibited
good test-retest reliability examined with a short protocol that included muscle function
measurements up to high angular velocities and joint positions that closely replicated the
conditions of high injury risk (Chapter 3).
2. Football players did not exhibit any difference in angle-specific or peak torque H:Q ratios
(isometric, functional or conventional) compared to recreationally active controls. In
addition, knee extensor and flexor strength, relative to body mass, of footballers and
controls was similar for all velocities, except concentric knee flexor strength at 400° s-1
(footballers +40%; P < 0.01) (Chapter 4).
3. Muscle volume explained 30-71% and 38-58% of the differences between individuals in
knee extensors and flexors torque respectively across a range of velocities. A moderate
correlation was also found between the volume of these antagonistic muscle groups (R2=
0.41). Finally, the relative volume of the knee extensors and flexors explained a
significant proportion of the variance in both the isometric (~20%) and high velocity
functional (~31%) H:Q ratio (Chapter 5).
4. On average, BFlh exhibited a balanced MHC isoform distribution (47.1 ± 9.1% MHC-I
and 52.9 ± 9.1% total MHC-II) in young healthy men, while BFlh MHC distribution was
not related to any measure of knee flexor maximal or explosive strength (Chapter 6).
5. BFlh proximal aponeurosis area varied considerably between participants (>4-fold) and
was not related to BFlh ACSAmax (r= 0.04, P= 0.83). Consequently, the
aponeurosis:muscle area ratio (defined as BFlh proximal aponeurosis area divided by
BFlh ACSAmax) exhibited 6-fold variability (range, 0.53 to 3.09; CV= 32.5%), being
83% smaller in one individual than another. Moreover, aponeurosis size was not related
Chapter 8 – General Discussion
121
to isometric (r= 0.28, P= 0.13) or eccentric knee flexion strength (r= 0.24, P≥ 0.20)
(Chapter 7).
8.2 HAMSTRINGS MUSCLE FUNCTION: REPLICATING THE
BIOMECHANICS OF THE LATE SWING PHASE OF SPRINTING
The first step towards a better understanding of the role of knee flexors muscle function on
hamstrings injuries is to assess muscle function in conditions that replicate the time when the
injury occurs. Therefore, it is important to examine the knee flexors muscle function in
biomechanical conditions that closely replicate those during the late swing phase of sprinting.
However, most studies in the literature on hamstrings function have not accounted for these
conditions. For this reason, an initial step was to develop and assess the reliability of a more
ecologically valid protocol for the assessment of knee flexor function under relevant
biomechanical conditions (Chapter 3). Isokinetic dynamometry, within its limitations, allows
for the examination of muscle function across the torque-velocity relationship, and more
importantly during eccentric contractions at controlled velocities, while the investigator can
also control the hip and knee joint positions. The adoption of a seated position with a reclined
back rest at 120° was selected as the most representative of the hip joint angle during the late
swing phase (Fig. 2.5A), without the participants sliding forwards during contractions.
Current isokinetic dynamometers cannot reach angular velocities higher than 500° s-1, which
is less than half of that attained by the knee joint in sprinting (>1200° s-1, Higashihara et al.,
2010). However, valid isokinetic dynamometer data can be obtained only within the
isovelocity phase, after the exclusion of the acceleration and deceleration phases
(Baltzopoulos et al., 2012). Further, any increase of the target velocity will also increase the
acceleration and deceleration phases, resulting in a progressively narrower isovelocity
window. The isovelocity window for the highest angular velocity used in this thesis (400° s-1)
was ~20°. The application of Gaussian fitting to the raw torque data allowed mild
extrapolation (5° on each side) resulting in a final isovelocity window of 30° for that velocity.
The results presented in Chapter 3 suggest that the assessment of hamstrings and quadriceps
torque-velocity relationships exhibited acceptable test-retest reliability when examined using
a testing position that resembled the hip and knee joint angles during the late swing phase and
up to high angular velocities. Therefore this protocol was applied to a subsequent study
(Chapter 4).
Chapter 8 – General Discussion
122
However, due to the specific aims of the later studies (Chapters 5-7) the isokinetic protocol
used in these experiments was further amended as follows:
1. Two familiarisation sessions were introduced before the isovelocity measurements.
2. The highest angular velocity was reduced to 350° s-1 in order to provide a sufficient
isovelocity range for the examination of muscle function.
It has been shown that the discrepancy between crank angle and knee joint angle during
isometric and isovelocity contractions can be up to 20° for knee extension (Tsaopoulos et al.,
2011; Arampatzis et al., 2004; Kaufman et al., 1995), while similar differences might be
expected for knee flexion. These discrepancies would invalidate an angle-specific approach
to the examination of reciprocal muscle function and specifically H:Q strength ratios which
was the main focus of Chapter 4. Therefore, the actual knee joint angles were calculated from
video analysis in Chapters 3 and 4.
Any discrepancy between the knee joint and crank angle may also influence the torque
measurements as the torque recorded by the dynamometer is different from that exerted by
the muscle (or muscle group) under investigation (Herzog, 1988). The dynamometer torque is
equal to the muscle force applied on the crank arm multiplied by the perpendicular distance
from the axis of rotation of the crank to the line of force application (dynamometer moment
arm). However, the torque exerted by the muscle is equal to the muscle force multiplied by
the perpendicular distance from the knee joint axis of rotation to the line of force application
(leg moment arm). A difference between the knee joint and the crank axis of rotation would
influence the torque recorded by the dynamometer. The accurate identification of the knee
joint axis can be achieved only with advanced imaging techniques not easily accessible (e.g.
real-time X-ray video recordings, Tsaopoulos et al., 2011). For this reason, superficial
anatomy was used and skin markers were drawn to assist the digitisation process. Although
skin movement during the contractions may introduce additional error in the alignment of the
knee joint with the crank, this technique is generally acceptable. While the torque values
presented in this thesis correspond to the dynamometer recording, great care was taken to
minimise the error due to misalignment. Specifically, the assumed knee joint centre was
carefully aligned with the crank rotational axis during isometric contraction (>50% MVF).
Furthermore, this was done separately for each muscle group, a procedure that to our
knowledge is novel during isokinetic measurements of the antagonistic knee joint muscles for

Chapter 8 – General Discussion
123
the calculation of H:Q ratio. In addition, the participants’ torso, pelvis, thigh and lower leg
were tightly secured to the dynamometer.
Other factors that can influence the dynamometer torque measurements are the gravity effect
and the moment of inertia of the crank and leg. The gravity effect has the most significant
impact on torque measurements, and also influences knee extensor and flexor torque
recording differently. For knee-joint angles between 90° and 180° (180°= full extension),
gravity opposes the direction of force application during knee extensions and failing to
correct for this effect, the knee extensor torque would be underestimated. The opposite is true
for the knee flexor torque. To account for the effect of gravity, all torque measurements in
this thesis were gravity corrected. Due to the exclusive use of the torque data within the
isovelocity region (excluding the acceleration and deceleration phases), the effect of the
moment of inertia of both the dynamometer crank and the leg were considered to be
negligible (Herzog, 1988). It must be acknowledged however that a small discrepancy
between the crank velocity and the leg velocity may have been present (Herzog, 1988).
For the examination of the knee flexors explosive strength (Chapter 6), a low-compliance
custom-made dynamometer was used. Similar to isokinetic dynamometer measurements, the
hip and knee joint angles (140° and 150° respectively) were selected based on their relevance
to the late swing phase.
Chapter 8 – General Discussion
124
8.3 STRENGTH BALANCE AROUND THE KNEE JOINT AND
IMPLICATIONS FOR HAMSTRINGS STRAIN INJURIES
Chapters 4 and 5 aimed to improve the understanding on the reciprocal strength balance
around the knee joint and the factors that may influence this balance. Brocket et al. (2004)
reported that athletes with a history of hamstrings strain injuries exhibited an angle of peak
torque at more flexed knee joint angles compared to uninjured athletes, whilst there was no
difference in peak torque H:Q strength ratio. While it is unclear whether the reduced angle of
peak torque pre-existed or resulted from the injuries, this finding implies that a potentially
harmful imbalance may be angle-specific and more pronounced at the extended knee joint
angles. The angle-specific examination of the H:Q ratio of a high-risk cohort of university-
level footballers did not reveal any intrinsic strength imbalance compared to a recreationally
active control group (Chapter 4). These results imply that football practice and play does not
lead to potentially hazardous strength imbalances as other studies have suggested (Iga et al.,
2009; Tourny-Chollet and Leroy, 2002). In support to our results, professional football
players also present higher functional H:Q ratio than lower level players (Fousekis et al.,
2010; Cometti et al., 2001). Nevertheless, hamstrings strains remain one of the most
prevalent injuries in football. The fact that most hamstrings strains in football occur during
running or sprinting (Woods et al., 2004) precludes the notion that football-specific activities
(e.g. kicking, tackling) may explain the high injury rates. It seems that the sprint-specific
biomechanical conditions can lead to injury. However, exposure alone to these conditions is
unlikely to be singularly responsible for strain injuries, and more likely it is the summation of
a number of risk factors combined with the high strains and eccentric forces in sprinting, that
could lead to an injury.
The angle-specific functional H:Q ratio in both football players and normal individuals was
≥1.0 throughout the range of motion at the intermediate and high velocities (Chapter 4). A
ratio of 1.0, described as point of equality (Coombs et al., 2002), suggests that the knee
flexors strength is sufficient to counterbalance knee extensor strength. However, there are
some limitations of the H:Q ratio measurements that should be highlighted. First, functional
relevance of the angle-specific H:Q ratio would appear to rely on the assumption that the
hamstrings and quadriceps muscles are active simultaneously at the specified angles, and not
sequentially active in different phases of the gait cycle. Simulation and EMG studies have
shown that simultaneous activation of the hamstrings and quadriceps occurs only at the more

Chapter 8 – General Discussion
125
extended knee joint angles, prior to the ground contact (Chumanov et al., 2007; Thelen et al.,
2005; Kyrolainen et al., 1999). Therefore, at these knee joint angles calculation of an angle-
specific H:Q strength ratio is relevant and informative of the reciprocal strength balance. In
contrast, at the more flexed joint angles where no simultaneous activation of hamstrings and
quadriceps occurs, the angle-specific ratio may not be functionally relevant. Another
limitation of the H:Q ratio is that it assumes that the hamstrings function to counter knee
extension generated by the quadriceps. However, during the late swing phase the knee
extension occurs mainly due to the transfer of the angular momentum of the thigh to the
shank (Yeow, 2013), and only at the more extended knee joint angles do the quadriceps
actively contribute to the knee extension moment. Essentially, at the beginning of the late
swing phase the hamstrings are counteracting the preceding hip flexor action (primarily due
to rectus femoris and iliopsoas activation). Therefore a more complete examination of the
strength balance, within the context of hamstrings strain injuries, should also account for the
influence of the hip flexors. The above limitations of the H:Q ratio may explain the mixed
results in the literature concerning its use as a risk factor for strain injuries. Prospective
studies that include some measure of hip flexor strength may enhance our understanding of
the association between strength imbalances and hamstrings strain injuries.
Despite the extensive use of the H:Q ratio, there has been very little attention on the factors
that determine this ratio. In contrast to previous investigations (Akagi et al., 2014, 2012), the
present results showed that the muscle size ratio of the quadriceps and hamstrings contributed
significantly to their strength ratio (isometric, r= 0.45, P= 0.024; functional 350° s-1, r= 0.56,
P= 0.003, Chapter 5). In addition, examination of the range of H:Q volume ratio values
(0.34-0.51) reveals that some individuals had 50% smaller hamstrings relative to quadriceps
than other individuals. Together these results suggest that within normal, previously
uninjured individuals some exhibit underlying size and strength imbalances that may
predispose them to strain injury, and corrective strength training might be expected to
mitigate this risk.
Chapter 8 – General Discussion
126
8.4 INFLUENCE OF HAMSTRINGS ANATOMY ON MUSCLE
FUNCTION, AND POTENTIAL INFLUENCE ON INJURY
PREDISPOSITION
The findings in Chapters 5, 6 and 7 highlight the importance of hamstrings muscle size as the
main anatomical factor that influences knee flexors function in vivo, while muscle
composition and aponeurosis size do not seem to have a significant influence.
An interesting finding in Chapter 5 was the differential influence of muscle size on
hamstrings and quadriceps torque during different types of contractions and especially
eccentric strength. Hamstrings muscle size explained ~50% (48-58%) of the interindividual
differences in knee flexor eccentric strength, but quadriceps size did not influence knee
extensors eccentric strength. This finding implies a much smaller influence of morphological
factors on eccentric quadriceps strength and may suggest a greater influence of neural factors,
compared to knee flexors. In this case neural inhibition could limit the eccentric activation of
the quadriceps and effective utilisation of the available muscle mass. This suggestion is in
contrast to previous studies where no difference in eccentric torque relative to isometric was
found between the knee extensors and flexors (Pain et al., 2013). However, the smaller
sample size examined in that study (n= 15), and the fact that their data for knee flexor were
‘noticeably noisier’ compared to the extensors may have influenced their results. Direct
examination of the hypothesis for a differential influence of neural inhibition on knee
extensors and flexors eccentric strength would provide valuable information on muscle
function of the main muscle groups around the knee joint. However, it is methodologically
challenging as direct stimulation of hamstrings through the sciatic nerve is prevented by the
overlying gluteus maximus muscle, while transcutaneous stimulation induces high discomfort
at relatively low levels of stimulation (Pain et al., 2013).
Chapter 6 provided some novel data on hamstrings MHC composition and revealed that in a
relatively large, young population the BFlh muscle composition does not seem to be a likely
explanation for the high rate of strain injuries in this muscle. In the literature, muscle
composition has been speculated to be an explanation for the common incidence of
hamstrings strain injury (Noonan and Garret, 1999; Garret et al., 1990, 1984), but there is no
direct evidence to support these speculations. These speculations were largely based on an
early examination of the hamstrings muscle composition in a small number of elderly
Chapter 8 – General Discussion
127
cadavers (n= 10, Garret et al., 1984). In that study, the total hamstrings (44.8% type I and
55.2% type II fibres) and BFlh muscle composition (45.5% type I and 54.5% type II fibres)
reported were very similar to the current study (47.1 ± 9.1% MHC-I and 52.9 ± 9.1% total
MHC-II). However, based on small differences compared to other muscles (quadriceps,
51.9%; adductor magnus, 44.8% type II fibres) Garrett et al. (1984) argued that the ‘high
proportion’ of fast fibres in the hamstrings compared to these other leg muscles may
contribute to their susceptibility to injury. Yet, their claim is not supported by the existing
data on in vivo muscle composition of the thigh muscles. Specifically, within a large cohort
of physically active young men (n= 95) the VL muscle was found to contain a greater
proportion of MHC-II isoform (66.1% total MHC-II, Staron et al., 2000) compared to the
BFlh in our cohort. Yet, the vastus lateralis does not exhibit high strain injury rates.
Consequently, the composition of the BFlh does not seem to explain the high incidence of
strain injuries within this muscle compared to other muscles. Nevertheless, it must be
acknowledged that on an individual basis, a high proportion of MCH-II isoform could still be
a risk factor for hamstrings strain injuries. In the current study, some individuals exhibited
>65% of total type II fibres and they may be more susceptible to strain injuries. Future
investigations are needed to elucidate any direct relationship between muscle composition
and risk for strain injury.
Chapter 6 also showed that BFlh muscle composition does not influence knee flexor maximal
or explosive strength. Whilst no other data on in vivo hamstrings MHC or fibre type
composition exist, these findings are in contrast to a number of studies reporting a significant
influence for quadriceps (e.g. Gür et al., 2003; Aagaard & Andersen, 1998). This discrepancy
can be largely explained by the examination of diverse athletic and training populations (Gür
et al., 2003) or small cohorts (Aagaard & Andersen, 1998) in these previous investigations.
The selection of individuals that were not involved in structured, systematic training in the
current study is likely to have reduced the variability in other neuromuscular variables such
as muscle size, architecture and neural drive that may confound the relationship between
strength and muscle composition.
An expected relationship between the size of the force generator (muscle) and the force
transmitters (tendon and aponeurosis) was not confirmed for the BFlh MTU, and some
important implications arise from these findings. Chapter 7 showed that the BFlh proximal
aponeurosis size is highly variable between healthy individuals (up to 4-fold in the studied
cohort), and some individuals have a disproportionally small aponeurosis relative to muscle
Chapter 8 – General Discussion
128
size, manifested by a low aponeurosis:muscle area ratio. These individuals would be expected
to experience greater mechanical strains along the aponeurosis and potentially a greater risk
of strain injury. Previous modelling and dynamic imaging studies support this suggestion as
they have calculated increased strains in individuals with small proximal aponeurosis size
(Fiorentino et al., 2012; Rehorn and Blemker, 2010). However, these studies based their
calculations on a crude measurement of aponeurosis width (using a single MR image at an
arbitrary point) that did not fully reflect the extent of the aponeurosis size variability. In
contrast, the methods applied in the current study involved the delineation of the proximal
aponeurosis-muscle contact interface distance in all images that the aponeurosis could be
identified. In addition, this measurement included a previously observed (Fiorentino et al.,
2012) but not quantified portion of the aponeurosis that extends into the muscle belly and
forms a significant part of the total aponeurosis area in some individuals. It must be noted
that the proximal aponeurosis presents a complex morphology and in some individuals it was
difficult to accurately distinguish the aponeurosis from other structures (e.g. epimysium).
Therefore, higher resolution MR images (e.g. 3T) are recommended for future work to
minimise these limitations.
The results of a previous study on quadriceps imply that aponeurosis size may adapt in
response to training load (Abe et al., 2012). Indeed, Wakahara et al. (2015) reported a small
increase in vastus lateralis aponeurosis width (1.9%, P= 0.050) after 12 weeks of resistance
training. However, the small training cohort (n= 11), the applied statistical methods (paired t-
tests with no correction for multiple tests) and the borderline P-value suggest that their
findings should be treated with caution. Nevertheless, the notion that strength training may
increase the aponeurosis area has significant implications as individuals with a small
aponeurosis relative to their BFlh muscle size may be able to increase their aponeurosis size
and reduce the mechanical strains therein. This could be a powerful injury prevention tool
that could be put in place prior to strain injury occurrence in at-risk individuals. Clearly,
future studies should further examine the effect of strength training on aponeurosis size.

Chapter 8 – General Discussion
129
8.5 FUTURE RESEARCH
Following the findings in the present thesis, promising areas for further research on muscle
function and hamstrings strain injury prevention have been revealed. Future research could:
1. Examine prospectively the changes in angle-specific and peak torque H:Q ratio in
response to football practice.
2. Assess the hip and knee joint function and strength balance, and potential
combinations to better understand the function of these muscles.
3. A prospective study of muscle strength and balance as risk factors for hamstrings
strain injury that includes the hip flexors, in addition to the knee extensors and
flexors, would greatly enhance our understanding of the role of strength imbalances in
hamstrings strains.
4. Explore further the neuromuscular factors that contribute to the different relative
eccentric strength of the knee extensors and flexors. A possible muscle-specific neural
inhibition warrants further investigation. Development of an appropriate methodology
for hamstrings electrical stimulation may be required.
5. Examine the relationship between BFlh muscle composition and the incidence of
strain injuries prospectively in high-risk athletic populations.
6. Investigate prospectively the aponeurosis area relative to muscle size and strength and
record which athletes go on to suffer a strain injury. Also, further investigations could
explore the effect of strength training on BFlh proximal aponeurosis size.

130
Appendices

Appendix A
131
9 APPENDICES
9.1 APPENDIX A – ISOKINETIC DYNAMOMETRY
9.1.1 Position and stabilisation
The participants were seated on the dynamometer chair with a hip angle of 120° (180°= full
extension). This hip angle was selected because of its relevance to high injury risk situations
i.e. similar to the hip angle during late swing phase in sprinting (Guex et al., 2012) when
hamstrings strains are thought to occur. While this hip joint angle is more ecologically valid
compared to the hip angle typically used in isokinetic dynamometer testing of the knee joint
muscles (95°-105°, Fig. 9.1), the more extended hip joint resulted in an increased difficulty to
stabilise the hip joint during contractions. To minimise any excessive hip joint movement, a
strap was placed across the pelvis, on the anterior superior iliac spine, that was in addition to
the two 3-point built-in straps across the torso and pelvis. Care was taken not to cause any
posterior pelvis tilt with the additional pelvis strap.
Figure 9.1. Hip joint angle of A) 120° (180°= full extension) replicating the late swing phase
of sprinting and adopted in this thesis) and B) 95° which is typically used in knee joint
isokinetic dynamometry testing.
To ensure maximal stabilisation of the participants, the distal thigh was also secured with a
10-cm wide velcro strap while a brace was placed in front of the non-involved leg. Finally,
participants were instructed to grasp the handles next to the seat during maximal contractions.
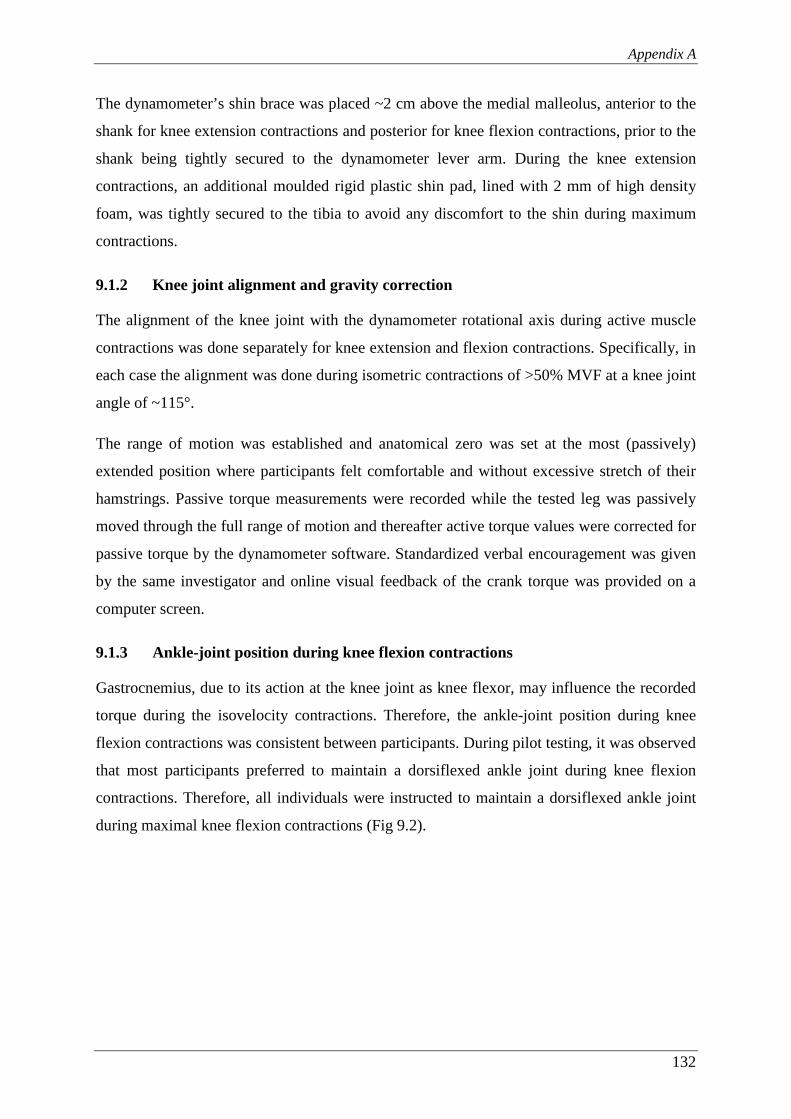
Appendix A
132
The dynamometer’s shin brace was placed ~2 cm above the medial malleolus, anterior to the
shank for knee extension contractions and posterior for knee flexion contractions, prior to the
shank being tightly secured to the dynamometer lever arm. During the knee extension
contractions, an additional moulded rigid plastic shin pad, lined with 2 mm of high density
foam, was tightly secured to the tibia to avoid any discomfort to the shin during maximum
contractions.
9.1.2 Knee joint alignment and gravity correction
The alignment of the knee joint with the dynamometer rotational axis during active muscle
contractions was done separately for knee extension and flexion contractions. Specifically, in
each case the alignment was done during isometric contractions of >50% MVF at a knee joint
angle of ~115°.
The range of motion was established and anatomical zero was set at the most (passively)
extended position where participants felt comfortable and without excessive stretch of their
hamstrings. Passive torque measurements were recorded while the tested leg was passively
moved through the full range of motion and thereafter active torque values were corrected for
passive torque by the dynamometer software. Standardized verbal encouragement was given
by the same investigator and online visual feedback of the crank torque was provided on a
computer screen.
9.1.3 Ankle-joint position during knee flexion contractions
Gastrocnemius, due to its action at the knee joint as knee flexor, may influence the recorded
torque during the isovelocity contractions. Therefore, the ankle-joint position during knee
flexion contractions was consistent between participants. During pilot testing, it was observed
that most participants preferred to maintain a dorsiflexed ankle joint during knee flexion
contractions. Therefore, all individuals were instructed to maintain a dorsiflexed ankle joint
during maximal knee flexion contractions (Fig 9.2).
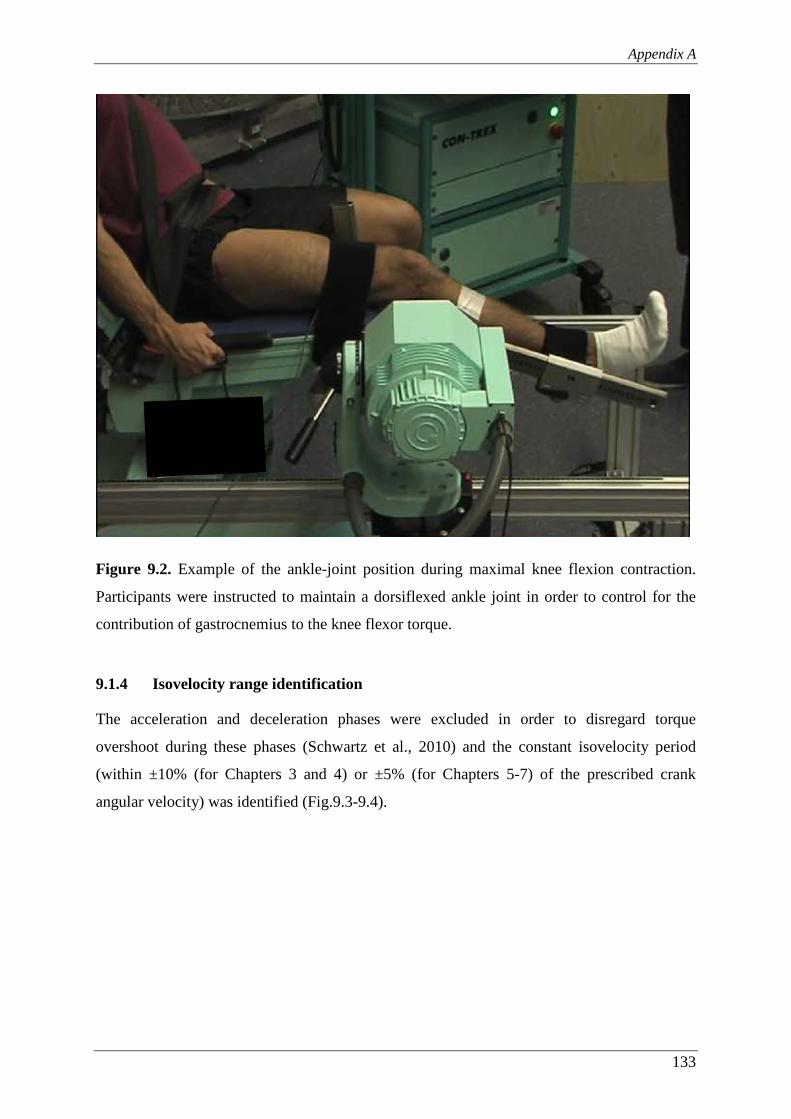
Appendix A
133
Figure 9.2. Example of the ankle-joint position during maximal knee flexion contraction.
Participants were instructed to maintain a dorsiflexed ankle joint in order to control for the
contribution of gastrocnemius to the knee flexor torque.
9.1.4 Isovelocity range identification
The acceleration and deceleration phases were excluded in order to disregard torque
overshoot during these phases (Schwartz et al., 2010) and the constant isovelocity period
(within ±10% (for Chapters 3 and 4) or ±5% (for Chapters 5-7) of the prescribed crank
angular velocity) was identified (Fig.9.3-9.4).
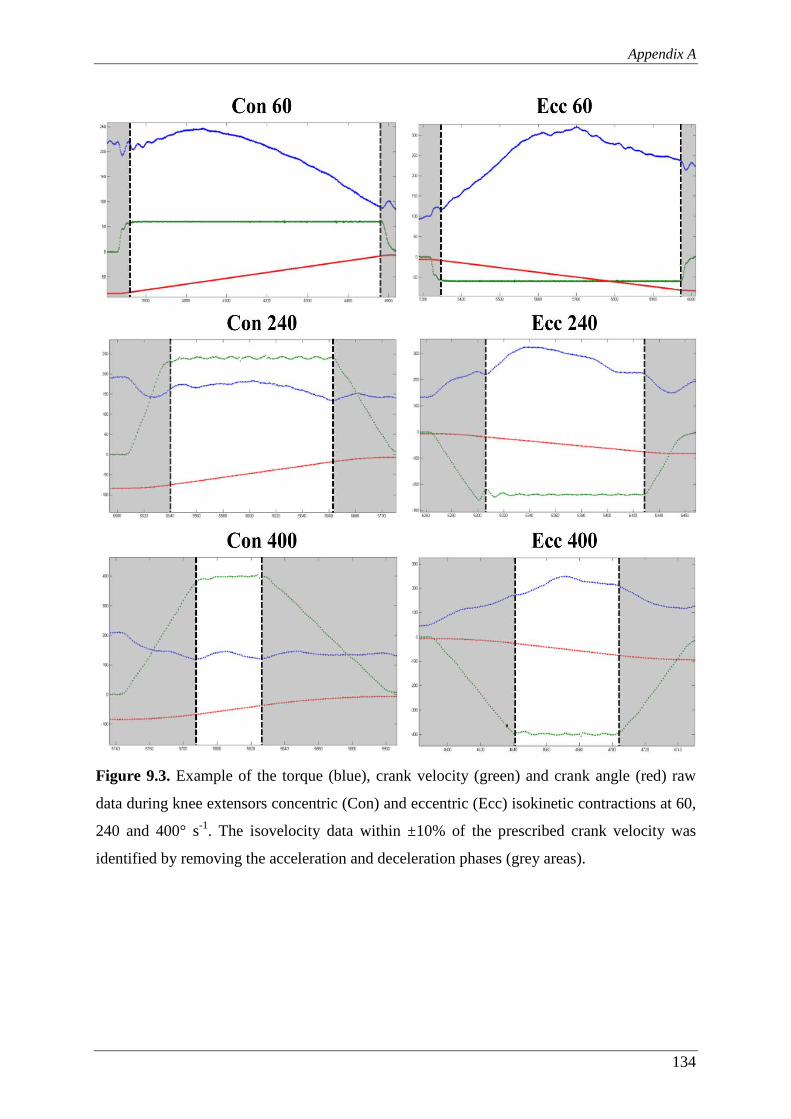
Appendix A
134
Figure 9.3. Example of the torque (blue), crank velocity (green) and crank angle (red) raw
data during knee extensors concentric (Con) and eccentric (Ecc) isokinetic contractions at 60,
240 and 400° s-1. The isovelocity data within ±10% of the prescribed crank velocity was
identified by removing the acceleration and deceleration phases (grey areas).

Appendix A
135
Figure 9.4. Example of the torque (blue), crank velocity (green) and crank angle (red) raw
data during knee flexors concentric (Con) and eccentric (Ecc) isokinetic contractions at 60,
240 and 400° s-1. The isovelocity data within ±10% of the prescribed crank velocity was
identified by removing the acceleration and deceleration phases (grey areas).
9.1.5 Angle-specific torque
In Chapters 3 and 4, the angle-specific torque was calculated. For the isometric contractions
(Chapter 3), this was done by smoothing torque-knee joint angle data for each muscle group
by performing 2nd order polynomial fitting to the raw torque values. Then the polynomial fit
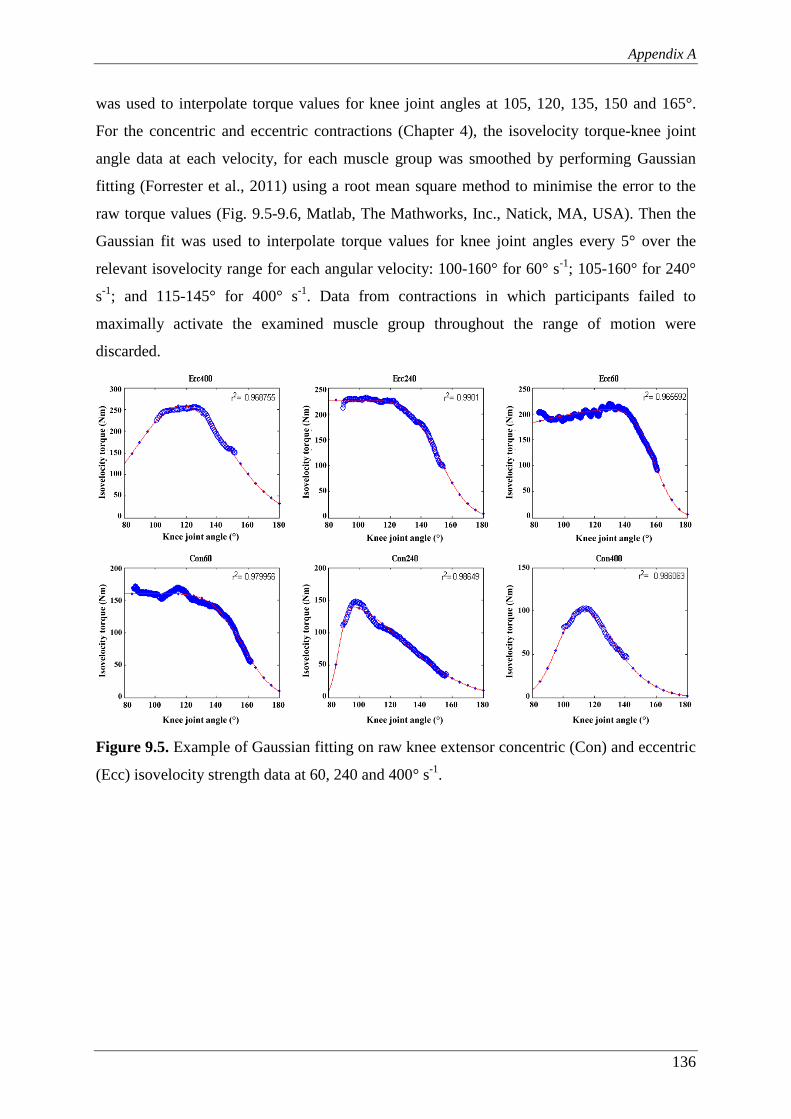
Appendix A
136
was used to interpolate torque values for knee joint angles at 105, 120, 135, 150 and 165°.
For the concentric and eccentric contractions (Chapter 4), the isovelocity torque-knee joint
angle data at each velocity, for each muscle group was smoothed by performing Gaussian
fitting (Forrester et al., 2011) using a root mean square method to minimise the error to the
raw torque values (Fig. 9.5-9.6, Matlab, The Mathworks, Inc., Natick, MA, USA). Then the
Gaussian fit was used to interpolate torque values for knee joint angles every 5° over the
relevant isovelocity range for each angular velocity: 100-160° for 60° s-1; 105-160° for 240°
s-1; and 115-145° for 400° s-1. Data from contractions in which participants failed to
maximally activate the examined muscle group throughout the range of motion were
discarded.
Figure 9.5. Example of Gaussian fitting on raw knee extensor concentric (Con) and eccentric
(Ecc) isovelocity strength data at 60, 240 and 400° s-1.
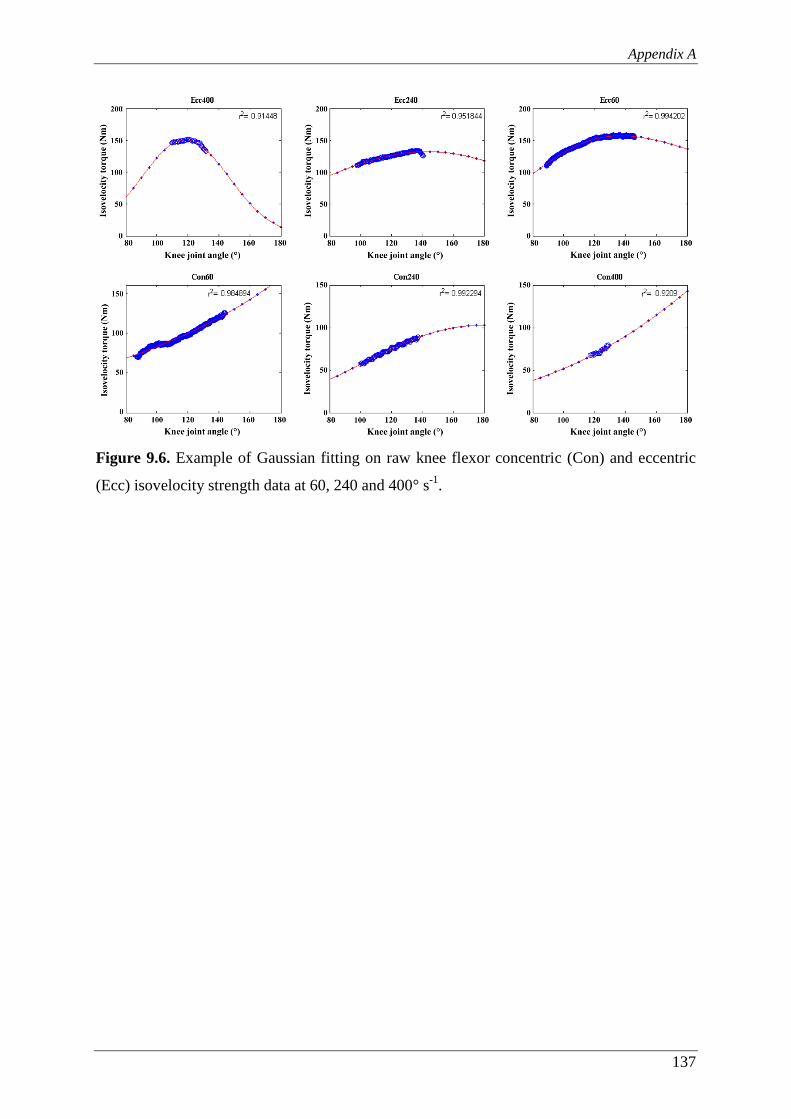
Appendix A
137
Figure 9.6. Example of Gaussian fitting on raw knee flexor concentric (Con) and eccentric
(Ecc) isovelocity strength data at 60, 240 and 400° s-1.
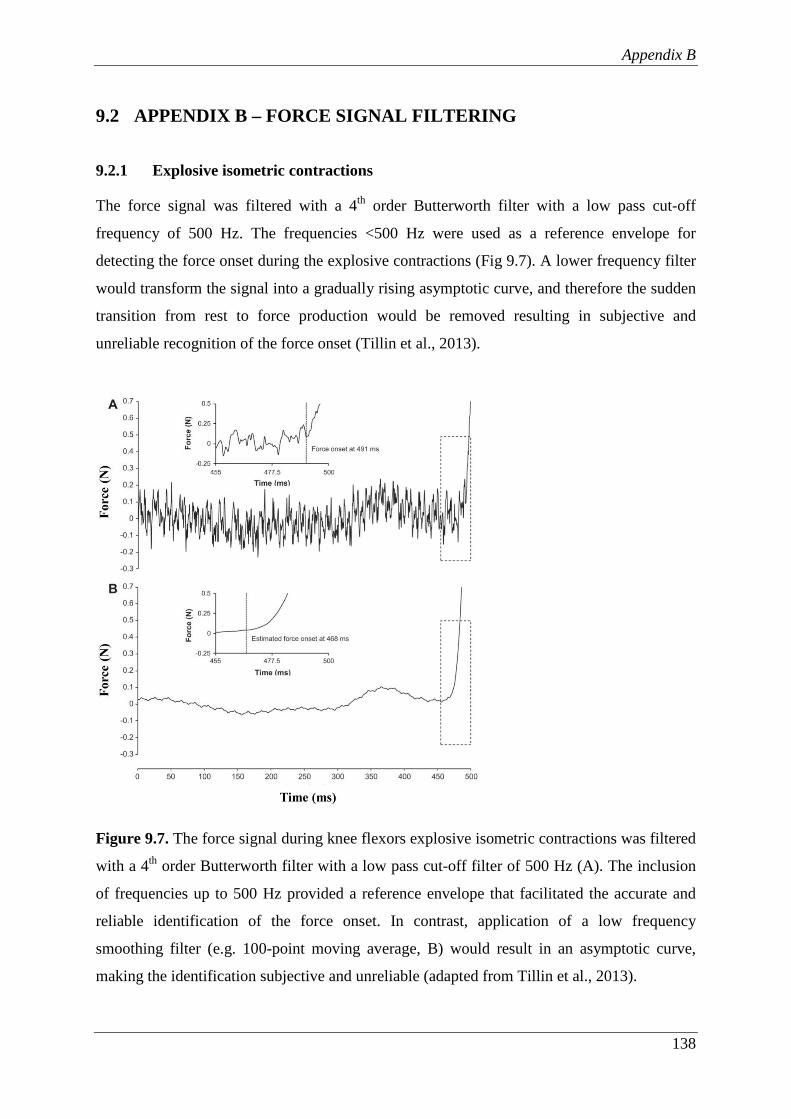
Appendix B
138
9.2 APPENDIX B – FORCE SIGNAL FILTERING
9.2.1 Explosive isometric contractions
The force signal was filtered with a 4th order Butterworth filter with a low pass cut-off
frequency of 500 Hz. The frequencies <500 Hz were used as a reference envelope for
detecting the force onset during the explosive contractions (Fig 9.7). A lower frequency filter
would transform the signal into a gradually rising asymptotic curve, and therefore the sudden
transition from rest to force production would be removed resulting in subjective and
unreliable recognition of the force onset (Tillin et al., 2013).
Figure 9.7. The force signal during knee flexors explosive isometric contractions was filtered
with a 4th order Butterworth filter with a low pass cut-off filter of 500 Hz (A). The inclusion
of frequencies up to 500 Hz provided a reference envelope that facilitated the accurate and
reliable identification of the force onset. In contrast, application of a low frequency
smoothing filter (e.g. 100-point moving average, B) would result in an asymptotic curve,
making the identification subjective and unreliable (adapted from Tillin et al., 2013).
Appendix C
139
9.3 APPENDIX C – MAGNETIC RESONANCE IMAGING
9.3.1 Scanning parameters
A 1.5 T MRI scanner (Signa HDxt, GE) was used to scan the dominant leg in the supine
position with the hip and knee joints extended. T1-weighted axial plane images were acquired
from the anterior superior iliac spine to the knee joint space in two blocks and oil filled
capsules were placed on the lateral side of the participants’ thigh to help with the alignment
of the blocks during analysis. The following imaging parameters were used: imaging matrix:
512 x 512, field of view: 260 mm x 260 mm, spatial resolution: 0.508 mm x 0.508 mm, slice
thickness: 5 mm, inter-slice gap: 0 mm. MR images were analysed with Osirix software
(version 4.0, Pixmeo, Geneva, Switzerland).
9.3.2 MR images analysis
9.3.2.1 Muscle anatomical cross-sectional area and volume
MR images were analysed with Osirix software (version 4.0, Pixmeo, Geneva, Switzerland).
The hamstrings (biceps femoris long head, biceps femoris short head, semitendinosus,
semimembranosus) and quadriceps (rectus femoris, vastus lateralis, vastus medialis, vastus
intermedius) muscles were manually outlined in every third image starting from the most
proximal image in which the muscle appeared (Fig. 9.8). The largest anatomical cross-
sectional area of each muscle was defined as ACSAmax and muscle volume was calculated
using cubic spline interpolation to interpolate the CSA between the analysed images (Fig. 9.9,
GraphPad Prism 6, GraphPad Software, Inc.). Two investigators conducted the image
analysis and all manual segmentation measurements of each muscle were completed by the
same investigator. To examine the reliability of the analysis procedures, the images from 6
randomly selected participants were re-analysed a week later and the coefficient of variation
(CV) was calculated. The CVs for measurements of muscle volume and ACSAmax were
0.5% and 1.2% (quadriceps), and 0.5% and 1.1% (hamstrings).
To validate the use of every third image for the volume calculations, all images from six
randomly selected participants were analysed and the two methods (all images vs. every third
image) were compared. The average difference between methods was 1.52% (0.22 cm2) for
BFlh ACSAmax, 1.60% (0.20 cm2) for total hamstrings ACSAmax, 0.30% (0.66 cm3) for
BFlh volume and 0.18% (1.52 cm3) for total hamstrings muscle volume.

Appendix C
140
Figure 9.8. A-D) Example of (left) hamstrings muscles (biceps femoris long head (red),
biceps femoris short head (orange), semitendinosus (yellow), semimembranosus (green))
segmentation in magnetic resonance images at 20, 40, 60 and 80% of hamstrings length
(defined as the distance from the most proximal to the most distal image in which hamstrings
were identified). E) Three-dimensional reconstruction of the hamstrings muscles (posterior
view of the left leg).
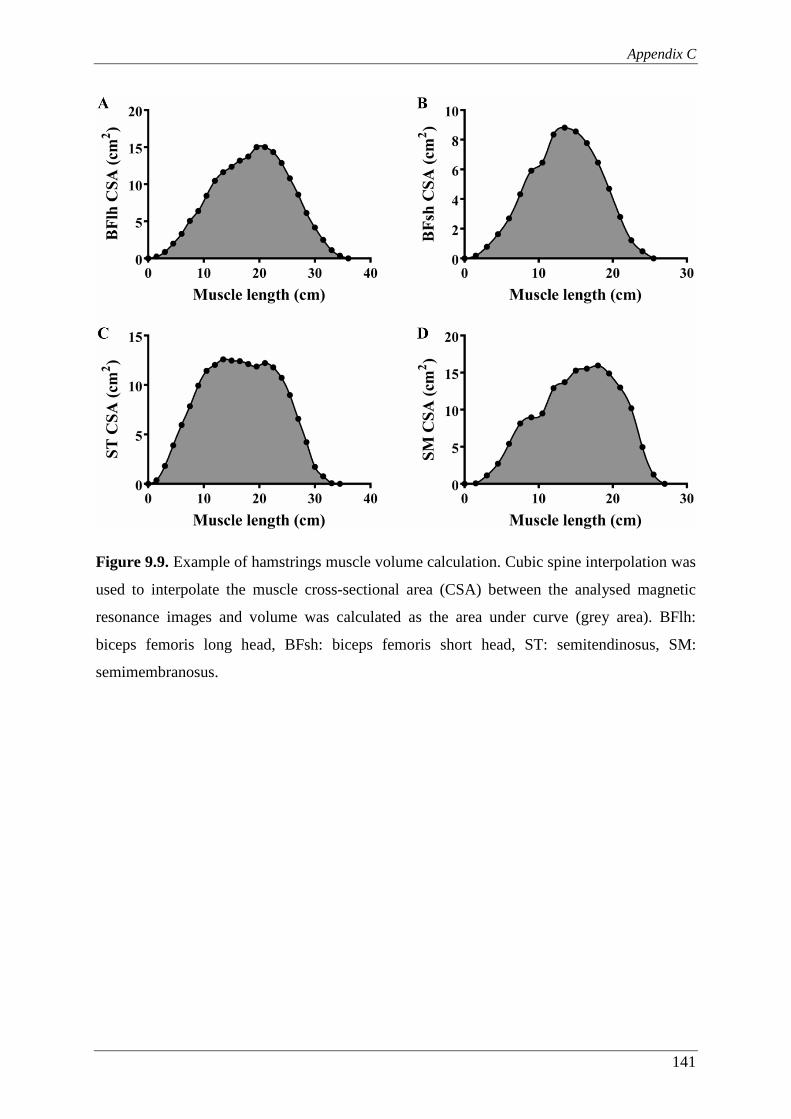
Appendix C
141
Figure 9.9. Example of hamstrings muscle volume calculation. Cubic spine interpolation was
used to interpolate the muscle cross-sectional area (CSA) between the analysed magnetic
resonance images and volume was calculated as the area under curve (grey area). BFlh:
biceps femoris long head, BFsh: biceps femoris short head, ST: semitendinosus, SM:
semimembranosus.

Appendix C
142
9.3.2.2 BFlh proximal aponeurosis area and BFlh/ST proximal tendon CSA
BFlh aponeurosis area was defined as the contact interface distance between the BFlh muscle
and the proximal aponeurosis outlined in each image where the aponeurosis was identifiable,
multiplied by the slice thickness (Fig. 9.10). The contact interface distance in each slice
included both the internal and external aponeurosis. The BFlh aponeurosis:muscle area ratio
was calculated by dividing the BFlh proximal aponeurosis area by the BFlh muscle
ACSAmax (see above).
Figure 9.10. Example of biceps femoris long head (right) proximal muscle-aponeurosis
contact interface distance delineation at 20, 40, 60 and 80% of proximal aponeurosis length.
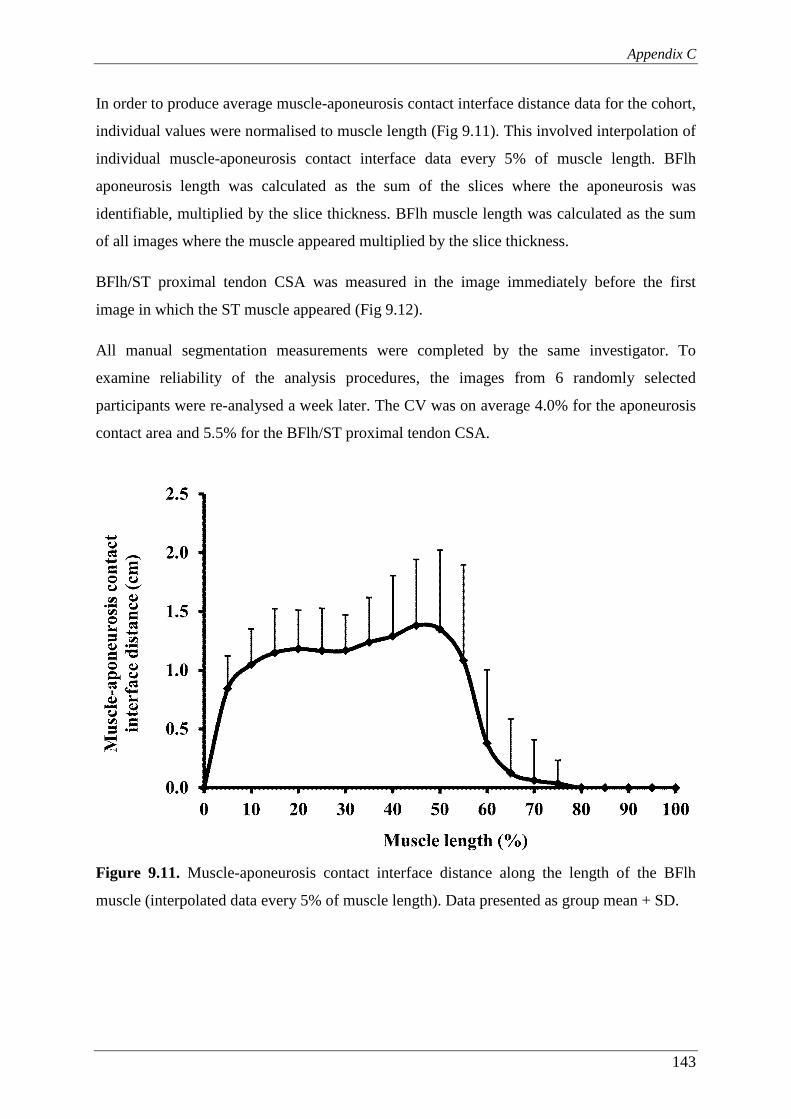
Appendix C
143
In order to produce average muscle-aponeurosis contact interface distance data for the cohort,
individual values were normalised to muscle length (Fig 9.11). This involved interpolation of
individual muscle-aponeurosis contact interface data every 5% of muscle length. BFlh
aponeurosis length was calculated as the sum of the slices where the aponeurosis was
identifiable, multiplied by the slice thickness. BFlh muscle length was calculated as the sum
of all images where the muscle appeared multiplied by the slice thickness.
BFlh/ST proximal tendon CSA was measured in the image immediately before the first
image in which the ST muscle appeared (Fig 9.12).
All manual segmentation measurements were completed by the same investigator. To
examine reliability of the analysis procedures, the images from 6 randomly selected
participants were re-analysed a week later. The CV was on average 4.0% for the aponeurosis
contact area and 5.5% for the BFlh/ST proximal tendon CSA.
Figure 9.11. Muscle-aponeurosis contact interface distance along the length of the BFlh
muscle (interpolated data every 5% of muscle length). Data presented as group mean + SD.
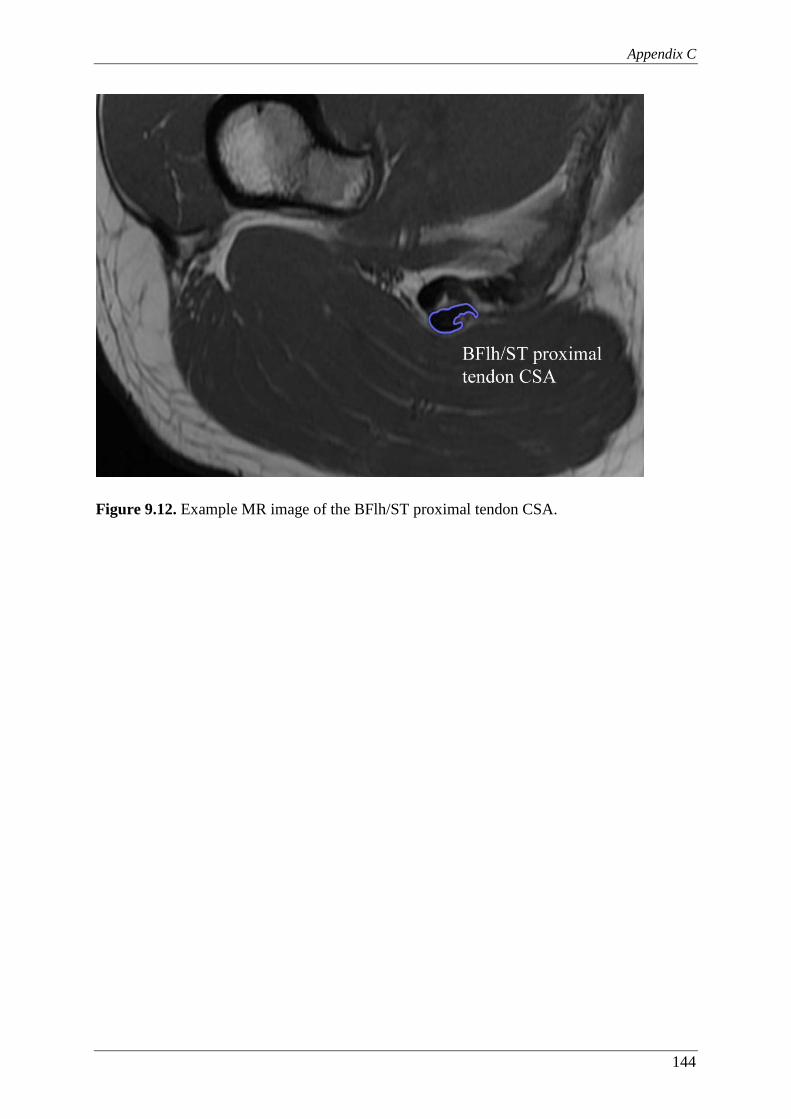
Appendix C
144
Figure 9.12. Example MR image of the BFlh/ST proximal tendon CSA.

145
References
References
146
10 REFERENCES
Aagaard P & Andersen JL. (1998). Correlation between contractile strength and myosin heavy chain isoform composition in human skeletal muscle. Medicine and Science in Sports and Exercise, 30(8), 1217-1222.
Aagaard P, Andersen JL, Dyhre-Poulsen P, Leffers AM, Wagner A, Magnusson SP, Halkjaer-Kristensen J, & Simonsen EB. (2001). A mechanism for increased contractile strength of human pennate muscle in response to strength training: changes in muscle architecture. The Journal of Physiology, 534, 613-623.
Aagaard P, Simonsen EB, Andersen JL, Magnusson P, & Dyhre-Poulsen P. (2002). Increased rate of force development and neural drive of human skeletal muscle following resistance training. Journal of Applied Physiology, 93(4), 1318-1326.
Aagaard P, Simonsen EB, Andersen JL, Magnusson SP, Bojsen-Møller F, & Dyhre-Poulsen P. (2000). Antagonist muscle coactivation during isokinetic knee extension. Scandinavian Journal of Medicine and Science in Sports, 10(2), 58-67.
Aagaard P, Simonsen EB, Magnusson SP, Larsson B, & Dyhre-Poulsen P. (1998). A new concept for isokinetic hamstring: quadriceps muscle strength ratio. The American Journal of Sports Medicine, 26(2), 231-237.
Aagaard P, Simonsen EB, Trolle M, Bangsbo J, & Klausen, K. (1995). Isokinetic hamstring/quadriceps strength ratio: influence from joint angular velocity, gravity correction and contraction mode. Acta Physiologica Scandinavica, 154(4), 421–427.
Abe T, Fukashiro S, Harada Y, & Kawamoto K. (2001). Relationship between sprint performance and muscle fascicle length in female sprinters. Journal of Physiological Anthropology and Applied Human Science, 20(2), 141-147.
Abe T, Kumagai K, & Bemben MG. (2012). Muscle aponeurosis area in hypertrophied and normal muscle. Journal of Trainology, 1(2), 23–27.
Abe T, Kumagai K, & Brechue WF. (2000). Fascicle length of leg muscles is greater in sprinters than distance runners. Medicine and Science in Sports and Exercise, 32(6), 1125-1129.
Akagi R, Tohdoh Y, & Takahashi H. (2012). Muscle strength and size balances between reciprocal muscle groups in the thigh and lower leg for young men. International Journal of Sports Medicine, 33(5), 386-389.
Akagi R, Tohdoh Y, & Takahashi H. (2014). Strength and size ratios between reciprocal muscle groups in the thigh and lower leg of male collegiate soccer players. Clinical Physiology and Functional Imaging, 34(2), 121-125.
Akagi, R, Takai, Y, Kato, E, Fukuda, M, Wakahara, T, Ohta, M, Kanehisa, H, Kawakami, Y, & Fukunaga, T. (2009). Relationships between muscle strength and indices of muscle cross-sectional area determined during maximal voluntary contraction in middle-aged and elderly individuals. Journal of Strength and Conditioning Research, 23(4), 1258-1262.
References
147
Alexander R McN & Vernon A. (1975). The dimensions of knee and ankle muscles and the forces they exert. Journal of Human Movement Studies, 1, 115-123.
Alonso JM, Edouard P, Fischetto G, Adams B, Depiesse F, & Mountjoy M. (2012). Determination of future prevention strategies in elite track and field: analysis of Daegu 2011 IAAF Championships injuries and illnesses surveillance. British Journal of Sports Medicine, 46(7), 505-514.
American College of Sports Medicine. Position stand (2011). Quantity and quality of exercise for developing and maintaining cardiorespiratory, musculoskeletal, and neuromotor fitness in apparently healthy adults: guidance for prescribing exercise. Medicine and Science in Sports and Exercise, 43, 1334-1359.
Amiridis IG, Martin A, Morlon B, Martin L, Cometti G, Pousson M, & van Hoecke J. (1996). Co-activation and tension-regulating phenomena during isokinetic knee extension in sedentary and highly skilled humans. European Journal of Applied Physiology, 73(1-2), 149-156.
Andersen LL & Aagaard P. (2006). Influence of maximal muscle strength and intrinsic muscle contractile properties on contractile rate of force development. European Journal of Applied Physiology, 96(1), 46-52.
Arampatzis A, Karamanidis K, De Monte G, Stafilidis S, Morey-Klapsing G, & Brüggemann GP. (2004). Differences between measured and resultant joint moments during voluntary and artificially elicited isometric knee extension contractions. Clinical Biomechanics, 19(3), 277-83.
Arnason A, Sigurdsson BS, Gudmundsson A, Holme I, Engebretsen L, & Bahr R. (2004). Risk factors for injuries in football. The American Journal of Sports Medicine, 32(1 Suppl.), 5S–16S.
Askling C, Saartok T, & Thorstensson A. (2006). Type of acute hamstring strain affects flexibility, strength, and time to return to pre-injury level. British Journal of Sports Medicine, 40(1), 40-4.
Askling C, Tengvar M, Saartok T, & Thorstensson A. (2000). Sports related hamstring strains--two cases with different etiologies and injury sites. Scandinavian Journal of Medicine and Science in Sports, 10(5), 304-307.
Askling CM, Tengvar M, & Thorstensson A. (2013). Acute hamstring injuries in Swedish elite football: a prospective randomised controlled clinical trial comparing two rehabilitation protocols. British Journal of Sports Medicine, 47(15), 953-9.
Askling CM, Tengvar M, Saartok T, & Thorstensson A. (2007). Acute first-time hamstring strains during high-speed running: a longitudinal study including clinical and magnetic resonance imaging findings. The American Journal of Sports Medicine, 35(2), 197-206.
Ayala F, De Ste Croix M, Sainz de Baranda P, & Santonja F. (2012). Absolute reliability of hamstring to quadriceps strength imbalance ratios calculated using peak torque, joint angle-specific torque and joint ROM-specific torque values. International Journal of Sports Medicine, 33(11), 909-916.

References
148
Ayala F, De Ste Croix M, Sainz de Baranda P, & Santonja F. (2013). Absolute reliability of isokinetic knee flexion and extension measurements adopting a prone position. Clinical Physiology and Functional Imaging, 33(1), 45-54.
Azizi E, Halenda GM, & Roberts TJ. (2009). Mechanical properties of the gastrocnemius aponeurosis in wild turkeys. Integrative and Comparative Biology, 49(1), 51-58.
Bahr R & Holme I. (2003). Risk factors for sports injuries--a methodological approach. British Journal of Sports Medicine, 37(5), 384-392.
Baltzopoulos B, King M, Gleeson N, & De Ste Croix M. (2012). The BASES expert statement on measurement of muscle strength with isokinetic dynamometry. The Sport and Exercise Scientist, 31, 12-13.
Bamman MM, Newcomer BR, Larson-Meyer DE, Weinsier RL, & Hunter GR. (2000). Evaluation of the strength-size relationship in vivo using various muscle size indices. Medicine and Science in Sports and Exercise, 32(7), 1307-1313.
Baratta R, Solomonow M, Zhou BH, Letson D, Chuinard R, & D'Ambrosia R. (1988). Muscular coactivation. The role of the antagonist musculature in maintaining knee stability. The American Journal of Sports Medicine, 16(2), 113-122.
Battermann N, Appell HJ, Dargel J, & Koebke J. (2011). An anatomical study of the proximal hamstring muscle complex to elucidate muscle strains in this region. International Journal of Sports Medicine, 32(3), 211-215.
Baxter JR & Piazza SJ. (2014). Plantar flexor moment arm and muscle volume predict torque-generating capacity in young men. Journal of Applied Physiology, 116, 538–544.
Becker R & Awiszus F. (2001). Physiological alterations of maximal voluntary quadriceps activation by changes of knee joint angle. Muscle & Nerve, 24(5), 667-672.
Bennell K, Wajswelner H, Lew P, Schall-Riaucour A, Leslie S, Plant D, & Cirone J. (1998). Isokinetic strength testing does not predict hamstring injury in Australian Rules footballers. British Journal of Sports Medicine, 32, 309–314.
Biewener AA. (2005). Biomechanical consequences of scaling. Journal of Experimental Biology, 208, 1665-1676.
Blazevich AJ, Coleman DR, Horne S, & Cannavan D. (2009). Anatomical predictors of maximum isometric and concentric knee extensor moment. European Journal of Applied Physiology, 105(6), 869-878.
Blazevich AJ, Gill ND, Zhou S. (2006). Intra- and intermuscular variation in human quadriceps femoris architecture assessed in vivo. Journal of Anatomy, 209(3), 289-310.
Bojsen-Møller J, Magnusson SP, Rasmussen LR, Kjaer M, & Aagaard P. (2005). Muscle performance during maximal isometric and dynamic contractions is influenced by the stiffness of the tendinous structures. Journal of Applied Physiology, 99(3), 986-994.
Bottinelli R & Reggiani C. (2000). Human skeletal muscle fibres: molecular and functional diversity. Progress in Biophysics and Molecular Biology, 73(2-4), 195-262.

References
149
Bottinelli R, Canepari M, Pellegrino MA, & Reggiani C. (1996). Force-velocity properties of human skeletal muscle fibres: myosin heavy chain isoform and temperature dependence. The Journal of Physiology, 495, 573-586.
Bottinelli R, Pellegrino MA, Canepari M, Rossi R, & Reggiani C. (1999). Specific contributions of various muscle fibre types to human muscle performance: an in vitro study. Journal of Electromyography and Kinesiology, 9(2), 87-95.
Bradley PS & Portas MD. (2007). The relationship between preseason range of motion and muscle strain injury in elite soccer players. Journal of Strength and Conditioning Research, 21(4), 1155-1159.
Brockett CL, Morgan DL, & Proske U. (2004). Predicting hamstring strain injury in elite athletes. Medicine and Science in Sports and Exercise. 36(3), 379-387.
Brockett CL, Morgan DL, Proske U. (2001). Human hamstring muscles adapt to eccentric exercise by changing optimum length. Medicine and Science in Sports and Exercise, 33(5), 783-790.
Brooks JH, Fuller CW, Kemp SP, & Reddin DB. (2006). Incidence, risk, and prevention of hamstring muscle injuries in professional rugby union. The American Journal of Sports Medicine, 34(8), 1297-1306.
Byram IR, Bushnell BD, Dugger K, Charron K, Harrell FE Jr, & Noonan TJ. (2010). Preseason shoulder strength measurements in professional baseball pitchers:identifying players at risk for injury. The American Journal of Sports Medicine, 38(7), 1375-1382.
Caruso JF, Brown LE, & Tufano JJ. (2012). The reproducibility of isokinetic dynamometry data. Isokinetics and Exercise Science, 20, 239-253.
Carvalho HM, Coelho-e-Silva M, Valente-dos-Santos J, Gonçalves RS, Philippaerts R, Malina R. (2012). Scaling lower-limb isokinetic strength for biological maturation and body size in adolescent basketball players. European Journal of Applied Physiology, 112(8), 2881-2889.
Chapra SC. (2008). Applied numerical methods with MATLAB for engineers and scientists. 2nd ed. McGraw-Hill.
Chleboun GS, France AR, Crill MT, Braddock HK, & Howell JN. (2001). In vivo measurement of fascicle length and pennation angle of the human biceps femoris muscle. Cells, Tissues, Organs, 169(4), 401-409.
Chumanov ES, Heiderscheit BC, & Thelen DG. (2011). Hamstring musculotendon dynamics during stance and swing phases of high-speed running. Medicine and Science in Sports and Exercise, 43(3), 525-532.
Chumanov ES, Heiderscheit BC, Thelen DG. (2007). The effect of speed and influence of individual muscles on hamstring mechanics during the swing phase of sprinting. Journal of Biomechanics, 40(16), 3555-3562.
Chumanov ES, Schache AG, Heiderscheit BC, & Thelen DG. (2012). Hamstrings are most susceptible to injury during the late swing phase of sprinting. British Journal of Sports Medicine, 46(2), 90.
References
150
Cometti G, Maffiuletti N A, Pousson M, Chatard J-C, & Maffulli N. (2001). Isokinetic strength and anaerobic power of elite, subelite and amateur French soccer players. International Journal of Sports Medicine, 22(1), 45–51.
Coombs R & Garbutt G. (2002). Developments in the use of the hamstring/quadriceps ratio for the assessment of muscle balance. Journal of Sports Science and Medicine, 1(3), 56-62.
Craig CL, Marshall AL., Sjöström M, Bauman AE, Booth ML, Ainsworth BE, Pratt M., Ekelund, U., Yngve, A., Sallis, J. F., & Oja, P. (2003). International physical activity questionnaire: 12-country reliability and validity. Medicine and Science in Sports and Exercise, 35(8), 1381-1395.
Croisier J, Forthomme B, Namurois M-H, Vanderthommen M, & Criellaard J-M. (2002). Hamstring muscle strain recurrence and strength performance disorders. The American Journal of Sports Medicine, 30(2), 199–203.
Croisier JL & Crielaard JM. (2000). Hamstring muscle tear with recurrent complaints: An isokinetic profile. Isokinetics and Exercise Science, 8(3), 175-180.
Croisier JL, Ganteaume S, Binet J, Genty M, & Ferret J-M. (2008). Strength imbalances and prevention of hamstring injury in professional soccer players: a prospective study. The American Journal of Sports Medicine, 36(8), 1469–1475.
Croisier JL. (2004). Factors associated with recurrent hamstring injuries. Sports Medicine, 34(10), 681-695.
Dahmane R, Djordjevic S, & Smerdu V. (2006). Adaptive potential of human biceps femoris muscle demonstrated by histochemical, immunohistochemical and mechanomyographical methods. Medical and Biological Engineering and Computing, 44(11), 999-1006.
Dallinga JM, Benjaminse A, & Lemmink KA. (2012). Which screening tools can predict injury to the lower extremities in team sports?: a systematic review. Sports Medicine, 42(9), 791-815.
de Carvalho Froufe Andrade AC, Caserotti P, de Carvalho CM, de Azevedo Abade EA, & da Eira Sampaio AJ. (2013). Reliability of concentric, eccentric and isometric knee extension and flexion when using the REV9000 isokinetic dynamometer. Journal of Human Kinetics, 37, 47-53.
de Ruiter CJ, Kooistra RD, Paalman MI, & de Haan A. (2004). Initial phase of maximal voluntary and electrically stimulated knee extension torque development at different knee angles. Journal of Applied Physiology, 97(5), 1693-1701.
de Ruiter CJ, Van Leeuwen D, Heijblom A, Bobbert MF, & de Haan A. (2006). Fast unilateral isometric knee extension torque development and bilateral jump height. Medicine and Science in Sports and Exercise, 38(10), 1843-1852.
de Ruiter CJ, Vermeulen G, Toussaint HM, & de Haan A. (2007). Isometric knee-extensor torque development and jump height in volleyball players. Medicine and Science in Sports and Exercise, 39(8), 1336-1346.
References
151
De Smet AA & Best TM. (2000). MR imaging of the distribution and location of acute hamstring injuries in athletes. AJR American Journal of Roentgenology, 174(2), 393-399.
Delextrat A, Gregory J, & Cohen D. (2010). The use of the functional H:Q ratio to assess fatigue in soccer. International Journal of Sports Medicine, 31, 192–197.
Duchateau J & Baudry S. (2014). Insights into the neural control of eccentric contractions. Journal of Applied Physiology, 116(11), 1418-1425.
Dudley GA, Harris RT, Duvoisin MR, Hather BM, & Buchanan P. (1990). Effect of voluntary vs. artificial activation on the relationship of muscle torque to speed. Journal of Applied Physiology, 69(6), 2215-2221.
Dvir Z, Eger G, Halperin N, & Shklar A. (1989). Thigh muscle activity and anterior cruciate ligament insufficiency. Clinical Biomechanics, 4(2), 87-91.
Edgerton VR, Smith JL, & Simpson DR. (1975). Muscle fibre type populations of human leg muscles. Histochemichal Journal, 7(3), 259-266.
Ekstrand J, Hägglund M, & Waldén M. (2011a). Injury incidence and injury patterns in professional football: the UEFA injury study. British Journal of Sports Medicine, 45(7), 553-558.
Ekstrand J, Hägglund M, & Waldén M. (2011b). Epidemiology of muscle injuries in professional football (soccer). The American Journal of Sports Medicine, 39(6), 1226-1232.
Elder GC, Bradbury K, & Roberts R. (1982). Variability of fiber type distributions within human muscles. Journal of Applied Physiology, 53(6), 1473-1480.
Elliott MC, Zarins B, Powell JW, & Kenyon CD. (2011). Hamstring muscle strains in professional football players: a 10-year review. The American Journal of Sports Medicine, 39(4), 843-850.
Engebretsen AH, Myklebust G, Holme I, Engebretsen L, & Bahr R. (2010). Intrinsic risk factors for hamstring injuries among male soccer players: a prospective cohort study. The American Journal of Sports Medicine, 38(6), 1147–1153.
Enoka RM. (2002). Neuromechanics of human movement. 3rd ed. Campaign, IL: Human Kinetics.
Ergün M, Işlegen C, & Taşkiran E. (2004). A cross-sectional analysis of sagittal knee laxity and isokinetic muscle strength in soccer players. International Journal of Sports Medicine, 25(8), 594–598.
Erskine RM, Fletcher G, & Folland JP. (2014). The contribution of muscle hypertrophy to strength changes following resistance training. European Journal of Applied Physiology, 114(6), 1239-1249.
Evangelidis PE, Massey GJ, Pain MT, & Folland JP. (2014). Biceps femoris aponeurosis size: A potential risk factor for strain injury? Medicine and Science in Sports and Exercise, (Ahead of print), doi: 10.1249/mss.0000000000000550.
References
152
Fauteck SP & Kandarian SC. (1995). Sensitive detection of myosin heavy chain composition in skeletal muscle under different loading conditions. The American Journal of Physiology, 268, 419-424.
Fiorentino NM & Blemker SS. (2014a). Musculotendon variability influences tissue strains experienced by the biceps femoris long head muscle during high-speed running. Journal of Biomechanics, 47(13), 3325-3333.
Fiorentino NM, Epstein FH, & Blemker SS. (2012). Activation and aponeurosis morphology affect in vivo muscle tissue strains near the myotendinous junction. Journal of Biomechanics, 45(4), 647-652.
Fiorentino NM, Rehorn MR, Chumanov ES, Thelen DG, & Blemker SS. (2014b). Computational models predict larger muscle tissue strains at faster sprinting speeds. Medicine and Science in Sports and Exercise, 46(4), 776-786.
Folland JP & Williams AG. (2007). The adaptations to strength training: morphological and neurological contributions to increased strength. Sports Medicine, 37(2), 145-168.
Folland JP, Buckthorpe MW, & Hannah R. (2014). Human capacity for explosive force production: Neural and contractile determinants, Scandinavian Journal of Medicine and Science in Sports, 24(6), 894-906.
Folland JP, Mc Cauley TM, & Williams AG. (2008). Allometric scaling of strength measurements to body size. European Journal of Applied Physiology. 102(6), 739-745.
Forrester SE, Yeadon MR, King MA, & Pain MTG. (2011). Comparing different approaches for determining joint torque parameters for isovelocity dynamometer measurements. Journal of Biomechanics, 44, 955-961.
Fousekis K, Τsepis E, & Vagenas G. (2010). Lower limb strength in professional soccer players: profile, asymmetry, and training age. Journal of Sports Science and Medicine, 9, 364–373.
Fridén J & Lieber RL. (1992). Structural and mechanical basis of exercise-induced muscle injury. Medicine and Science in Sports and Exercise. 24(5), 521-530.
Fridén J, Sjöström M, & Ekblom B. (1983). Myofibrillar damage following intense eccentric exercise in man. International Journal of Sports Medicine, 4(3), 170-176.
Frishberg BA. (1983). An analysis of overground and treadmill sprinting. Medicine and Science in Sports and Exercise, 15(6), 478-485.
Fukunaga T, Miyatani M, Tachi M, Kouzaki M, Kawakami Y, & Kanehisa H. (2001). Muscle volume is a major determinant of joint torque in humans. Acta Physiologica Scandinavica, 172(4), 249-255.
Fyfe JJ, Opar DA, Williams MD, Shield AJ. (2013). The role of neuromuscular inhibition in hamstring strain injury recurrence. Journal of Electromyography and Kinesiology, 23(3), 523-530.
References
153
Gabbe BJ, Bennell KL, & Finch CF. (2006). Why are older Australian football players at greater risk of hamstring injury? Journal of Science and Medicine in Sport, 9(4), 327–333.
Gabbe BJ, Finch CF, Bennell KL, & Wajswelner H. (2005). Risk factors for hamstring injuries in community level Australian football. British Journal of Sports Medicine, 39, 106–110.
Garrett WE Jr, Califf JC, & Bassett FH 3rd. (1984). Histochemical correlates of hamstring injuries. The American Journal of Sports Medicine, 12(2), 98-103.
Garrett WE Jr, Rich FR, Nikolaou PK, & Vogler JB 3rd. (1989). Computed tomography of hamstring muscle strains. Medicine and Science in Sports Exercise, 21(5), 506-514.
Garrett WE Jr, Safran MR, Seaber AV, Glisson RR, & Ribbeck BM. (1987). Biomechanical comparison of stimulated and nonstimulated skeletal muscle pulled to failure. The American Journal of Sports Medicine, 15(5), 448-454.
Garrett WE Jr. (1990). Muscle strain injuries: clinical and basic aspects. Medicine and Science in Sports Exercise, 22(4), 436-443.
Gleeson NP & Mercer TH. (1992). Reproducibility of isokinetic leg strength and endurance characteristics of adult men and women. European Journal of Applied Physiology, 65(3), 221-228.
Gordon AM, Huxley AF, & Julian FJ. (1966). The variation in isometric tension with sarcomere length in vertebrate muscle fibres. The Journal of Physiology, 184(1), 170-92.
Greco CC, da Silva WL, Camarda SR, & Denadai, BS. (2013). Fatigue and rapid hamstring/quadriceps force capacity in professional soccer players. Clinical Physiology and Functional Imaging, 33(1), 18-23.
Greig M. (2008). The Influence of Soccer-Specific Fatigue on Peak Isokinetic Torque Production of the Knee Flexors and Extensors. The American Journal of Sports Medicine, 36(7), 1403–1409.
Griffin LY, Albohm MJ, Arendt EA, et al. (2006). Understanding and preventing noncontact anterior cruciate ligament injuries: a review of the Hunt Valley II meeting, January 2005. The American Journal of Sports Medicine, 34(9), 1512-1532.
Guex K, Gojanovic B, & Millet GP. (2012). Influence of hip-flexion angle on hamstrings isokinetic activity in sprinters. Journal of Athletic Training, 47(4), 390-395.
Gür H, Gransberg L, vanDyke D, Knutsson E, & Larsson L. (2003). Relationship between in vivo muscle force at different speeds of isokinetic movements and myosin isoform expression in men and women. European Journal of Applied Physiology, 88(6), 487-496.
Hägglund M, Waldén M, & Ekstrand J. (2006). Previous injury as a risk factor for injury in elite football: a prospective study over two consecutive seasons. British Journal of Sports Medicine, 40(9), 767–772.

References
154
Hägglund M, Waldén M, & Ekstrand J. (2013). Risk factors for lower extremity muscle injury in professional soccer: the UEFA injury study. The American journal of sports medicine, 41(2), 327–335.
Hagood S, Solomonow M, Baratta R, Zhou BH, & D'Ambrosia R. (1990). The effect of joint velocity on the contribution of the antagonist musculature to knee stiffness and laxity. The American Journal of Sports Medicine, 18(2), 182-187.
Hallén A & Ekstrand J. (2014). Return to play following muscle injuries in professional footballers. Journal of Sports Sciences, 32(13), 1229-1236.
Handsfield G, Fiorentino N, & Blemker SS. (2010). Variability in Biceps Femoris Long Head Muscle-Tendon Morphology. In: Proceedings of the 34th Annual Meeting of the American Society of Biomechanics, Providence (USA), Brown University, pp.690-691.
Hannah R & Folland JP. (2015). Muscle-tendon unit stiffness does not independently affect voluntary explosive force production or muscle intrinsic contractile properties. Applied Physiology, Nutrition and Metabolism, 40, 1-9.
Hannah R, Minshull C, Smith SL, & Folland JP. (2014). Longer electromechanical delay impairs hamstrings explosive force versus quadriceps. Medicine and Science in Sports & Exercise, 46, 963-972.
Harridge SD, Bottinelli R, Canepari M, Pellegrino MA, Reggiani C, Esbjörnsson M, & Saltin B. (1996). Whole-muscle and single-fibre contractile properties and myosin heavy chain isoforms in humans. European Journal of Applied Physiology, 432(5), 913-920.
Heiderscheit BC, Hoerth DM, Chumanov ES, Swanson SC, Thelen BJ, & Thelen DG (2005). Identifying the time of occurrence of a hamstring strain injury during treadmill running: a case study. Clinical Biomechanics, 20(10), 1072–1078.
Heiderscheit BC, Sherry MA, Silder A, Chumanov ES, Thelen DG. (2010). Hamstring strain injuries: recommendations for diagnosis, rehabilitation, and injury prevention. The Journal of Orthopaedic and Sports Physical Therapy, 40(2), 67-81.
Heiser TM, Weber J, Sullivan G, Clare P, & Jacobs RR. (1984). Prophylaxis and management of hamstring muscle injuries in intercollegiate football players. The American Journal of Sports Medicine, 12(5), 368-370.
Henderson G, Barnes CA, & Portas MD. (2010). Factors associated with increased propensity for hamstring injury in English Premier League soccer players. Journal of Science and Medicine in Sport, 13(4), 397-402.
Herzog W. (1988). The relation between the resultant moments at a joint and the moments measured by an isokinetic dynamometer. Journal of Biomechanics, 21(1), 5-12.
Higashihara A, Nagano Y, & Ono T, (2014). Fukubayashi T. Relationship between the peak time of hamstring stretch and activation during sprinting. European Journal of Sport Science, (Ahead of print), doi: 10.1080/17461391.2014.973913.
References
155
Higashihara A, Ono T, Kubota J, Okuwaki T, & Fukubayashi T. (2010). Functional differences in the activity of the hamstring muscles with increasing running speed. Journal of Sports Sciences, 28(10), 1085-1092.
Hill AV (1938). The heat of shortening and the dynamic constants of muscle. Proceedings of the Royal Society of London Series B, 126, 136-195.
Hopkins WG, Schabort EJ, & Hawley JA. (2001). Reliability of power in physical performance tests. Sports Medicine, 31(3), 211-234.
Huijing PA. (1999). Muscle as a collagen fiber reinforced composite: a review of force transmission in muscle and whole limb. Journal of Biomechanics, 32(4), 329-345.
Iga J, George K, Lees A, & Reilly T. (2009). Cross-sectional investigation of indices of isokinetic leg strength in youth soccer players and untrained individuals. Scandinavian Journal of Medicine & Science in Sports, 19, 714–719.
Ikegawa S, Funato K, Tsunoda N, Kanehisa H, Fukunaga T, & Kawakami Y. (2008). Muscle force per cross-sectional area is inversely related with pennation angle in strength trained athletes. Journal of Strength and Conditioning Research, 22(1), 128-131.
Impellizzeri FM, Bizzini M, Rampinini E, Cereda F, & Maffiuletti NA. (2008). Reliability of isokinetic strength imbalance ratios measured using the Cybex NORM dynamometer. Clinical Physiology and Functional Imaging, 28(2), 113-119.
Inbar O, Kaiser P, & Tesch P. (1981). Relationships between leg muscle fiber type distribution and leg exercise performance. International Journal of Sports Medicine, 2(3), 154-159.
Johansson C, Lorentzon R, Sjöström M, Fagerlund M, & Fugl-Meyer AR. (1987). Sprinters and marathon runners. Does isokinetic knee extensor performance reflect muscle size and structure? Acta Physiologica Scandinavica, 130(4), 663-669.
Johnson MA, Polgar J, Weightman D, & Appleton D. (1973). Data on the distribution of fibre types in thirty-six human muscles. An autopsy study. Journal of the Neurological Sciences, 18(1), 111-129.
Kandel ER, Schwartz JH, Jessell TM. (2000). Principles of Neural Science. 5th ed. McGraw-Hill, New York.
Kanehisa H, Ikegawa S, & Fukunaga T. (1994). Comparison of muscle cross-sectional area and strength between untrained women and men. European Journal of Applied Physiology, 68(2), 148-154.
Katz B. (1939). The relation between force and speed in muscular contraction. The Journal of Physiology, 96(1), 45-64.
Kaufman KR, An KN, Chao EY. (1995). A comparison of intersegmental joint dynamics to isokinetic dynamometer measurements. Journal of Biomechanics, 28(10), 1243-1256.
Kawakami Y, Abe T, & Fukunaga T. (1993). Muscle-fiber pennation angles are greater in hypertrophied than in normal muscles. Journal of Applied Physiology, 74(6), 2740-2744.
References
156
Kawakami Y, Abe T, Kanehisa H, & Fukunaga T. (2006). Human skeletal muscle size and architecture: variability and interdependence. American Journal of Human Biology, 18(6), 845-848.
Kellis E & Baltzopoulos V. (1996). The effects of normalization method on antagonistic activity patterns during eccentric and concentric isokinetic knee extension and flexion. Journal of Electromyography and Kinesiology, 6(4), 235-245.
Kellis E & Baltzopoulos V. (1997). The effects of antagonist moment on the resultant knee joint moment during isokinetic testing of the knee extensors. European Journal of Applied Physiology, 76(3), 253-259.
Kellis E & Baltzopoulos V. (1998). Muscle activation differences between eccentric and concentric isokinetic exercise. Medicine and Science in Sports Exercise, 30(11), 1616-1623.
Kellis E & Katis A. (2007). Biomechanical characteristics and determinants of instep soccer kick. Journal of Sports Science & Medicine, 6(2), 154-165.
Kellis E, Galanis N, Kapetanos G, & Natsis K. (2012). Architectural differences between the hamstring muscles. Journal of Electromyography and Kinesiology, 22(4), 520-526.
Kellis E, Galanis N, Natsis K, & Kapetanos G. (2009). Validity of architectural properties of the hamstring muscles: correlation of ultrasound findings with cadaveric dissection. Journal of Biomechanics, 42(15), 2549-2554.
Kellis E, Galanis N, Natsis K, & Kapetanos G. (2010). Muscle architecture variations along the human semitendinosus and biceps femoris (long head) length. Journal of Electromyography and Kinesiology, 20(6), 1237-1243.
Knapik JJ, Wright JE, Mawdsley RH, & Braun J. (1983). Isometric , isotonic , and isokinetic torque variations in four muscle groups through a range of joint motion. Physical Therapy, 63(6), 938–947.
Kong PW & Burns SF. (2010). Bilateral difference in hamstrings to quadriceps ratio in healthy males and females. Physical Therapy in Sport, 11(1), 12-17.
Kongsgaard M, Reitelseder S, Pedersen TG, et al. (2007). Region specific patellar tendon hypertrophy in humans following resistance training. Acta Physiologica, 191(2), 111-121.
Kooistra RD, de Ruiter CJ, & de Haan A. (2007). Conventionally assessed voluntary activation does not represent relative voluntary torque production. European Journal of Applied Physiology, 100(3), 309-320.
Koulouris G & Connell D. (2003). Evaluation of the hamstring muscle complex following acute injury. Skeletal Radiology, 32(10), 582-589.
Koulouris G & Connell D. (2005). Hamstring muscle complex: an imaging review. Radiographics, 25(3), 571-586.
Kubo K, Ohgo K, Takeishi R, Yoshinaga K, Tsunoda N, Kanehisa H, & Fukunaga T. (2006). Effects of series elasticity on the human knee extension torque-angle relationship in vivo. Research Quarterly for Exercise and Sport, 77(4), 408-416.

References
157
Kumagai K, Abe T, Brechue WF, Ryushi T, Takano S, & Mizuno M. (2000). Sprint performance is related to muscle fascicle length in male 100-m sprinters. Journal of Applied Physiology, 88(3), 811-816.
Kyrolainen H, Komi PV, & Belli A. (1999). Changes in muscle activity with increasing running speed. Journal of Strength and Conditioning Research, 13(4), 400-406.
Lemos RR, Epstein M, & Herzog W. (2008). Modeling of skeletal muscle: the influence of tendon and aponeuroses compliance on the force-length relationship. Medical & Biological Engineering & Computing, 46(1), 23-32.
Lieber RL & Fridén J. (1988) Selective damage of fast glycolytic muscle fibres with eccentric contraction of the rabbit tibialis anterior. Acta Physiologica Scandinavica, 133(4), 587-588.
Lieber RL & Fridén J. (1993). Muscle damage is not a function of muscle force but active muscle strain. Journal of Applied Physiology (1985), 74(2), 520-526.
Lieber RL & Fridén J. (2000). Functional and clinical significance of skeletal muscle architecture. Muscle & Nerve, 23(11), 1647-1666.
Lieber RL. (1993). Skeletal muscle architecture: implications for muscle function and surgical tendon transfer. Journal of Hand Therapy, 6(2), 105-113.
Lovering RM & De Deyne PG. (2004). Contractile function, sarcolemma integrity, and the loss of dystrophin after skeletal muscle eccentric contraction-induced injury. American Journal of Physiology. Cell Physiology, 286(2), C230-238.
Luther PK. (2009). The vertebrate muscle Z-disc: sarcomere anchor for structure and signalling. Journal of Muscle Research and Cell Motility, 30(5-6), 171-185.
Maffiuletti NA, Bizzini M, Desbrosses K, Babault N, & Munzinger U. (2007). Reliability of knee extension and flexion measurements using the Con-Trex isokinetic dynamometer. Clinical Physiology and Functional Imaging, 27(6), 346-353.
Malliaropoulos N, Isinkaye T, Tsitas K, & Maffulli N. (2011). Reinjury after acute posterior thigh muscle injuries in elite track and field athletes. The American Journal of Sports Medicine, 39(2), 304-310.
Malliaropoulos N, Papacostas E, Kiritsi O, Papalada A, Gougoulias N, & Maffulli N. (2010). Posterior thigh muscle injuries in elite track and field athletes. The American Journal of Sports Medicine, 38(9), 1813-1819.
Manini TM, Clark BC, Nalls MA, Goodpaster BH, Ploutz-Snyder LL, & Harris TB. (2007). Reduced physical activity increases intermuscular adipose tissue in healthy young adults. American Journal of Clinical Nutrition, 85(2), 377–384.
Martin BF. (1968). The origins of the hamstring muscles. Journal of Anatomy, 102(Pt2), 345-352.
Masuda K, Kikuhara N, Takahashi H, & Yamanaka K. (2003). The relationship between muscle cross-sectional area and strength in various isokinetic movements among soccer players. Journal of Sports Sciences, 21(10), 851-858.
References
158
Maughan RJ & Nimmo MA. (1984). The influence of variations in muscle fibre composition on muscle strength and cross-sectional area in untrained males. The Journal of Physiology, 351, 299-311.
Maughan RJ, Watson JS, & Weir J. (1983). Strength and cross-sectional area of human skeletal muscle. The Journal of Physiology, 338, 37-49.
Meeuwisse WH, Tyreman H, Hagel B, & Emery C. (2007). A dynamic model of etiology in sport injury: the recursive nature of risk and causation. Clinical Journal of Sport Medicine, 17(3), 215-219.
Metzger JM & Moss RL. (1990). Calcium-sensitive cross-bridge transitions in mammalian fast and slow skeletal muscle fibers. Science, 247, 1088-1090.
Miller SL, Gill J, Webb GR. (2007). The proximal origin of the hamstrings and surrounding anatomy encountered during repair. A cadaveric study. The Journal of Bone and Joint Surgery. American Volume, 89(1), 44-48.
Morgan DL & Allen DG. (1999). Early events in stretch-induced muscle damage. Journal of Applied Physiology (1985), 87(6), 2007-2015.
Morgan DL. (1990). New insights into the behavior of muscle during active lengthening. Biophysical Journal, 57(2), 209-221.
Newman MA, Tarpenning KM, & Marino FE. (2004). Relationships between isokinetic knee strength, single-sprint performance, and repeated-sprint ability in football players. Journal of Strength and Conditioning Research, 18(4), 867-872.
Noonan TJ & Garrett WE Jr. (1992). Injuries at the myotendinous junction. Clinics in Sports Medicine, 11(4), 783-806.
Noonan TJ & Garrett WE Jr. (1999). Muscle strain injury: diagnosis and treatment. The Journal of the American Academy of Orthopaedic Surgeons, 7(4), 262-269.
Novacheck TF. (1998). The biomechanics of running. Gait & Posture. 7(1), 77-95.
Opar DA, Williams MD, & Shield AJ. (2012). Hamstring strain injuries: factors that lead to injury and re-injury. Sports Medicine, 42(3), 209-226.
Opar DA, Williams MD, Timmins RG, Dear NM, & Shield AJ. (2013a). Rate of torque and electromyographic development during anticipated eccentric contraction is lower in previously strained hamstrings. The American Journal of Sports Medicine, 41(1), 116-125.
Opar DA, Williams MD, Timmins RG, Dear NM, & Shield AJ. (2013b). Knee flexor strength and bicep femoris electromyographical activity is lower in previously strained hamstrings. Journal of Electromyography and Kinesiology, 23(3), 696-703.
Orchard J & Seward H. (2002). Epidemiology of injuries in the Australian Football League, seasons 1997-2000. British Journal of Sports Medicine, 36(1), 39-44.
References
159
Orchard J, Marsden J, Lord S, & Garlick D. (1997). Preseason hamstring muscle weakness associated with hamstring muscle injury in Australian footballers. The American Journal of Sports Medicine, 25(1), 81-85.
Orchard JW. (2001). Intrinsic and extrinsic risk factors for muscle strains in Australian football. The American Journal of Sports Medicine, 29(3), 300–303.
Orchard JW. (2012). Hamstrings are most susceptible to injury during the early stance phase of sprinting. British Journal of Sports Medicine, 46(2), 88-89.
Pain MT, Young F, Kim J, & Forrester SE. (2013). The torque-velocity relationship in large human muscles: maximum voluntary versus electrically stimulated behaviour. Journal of Biomechanics, 46(4), 645-650.
Pavol MJ & Grabiner MD. (2000). Knee strength variability between individuals across ranges of motion and hip angles. Medicine and Science in Sports and Exercise, 32(5), 985-992.
Pincivero DM, Lephart SM, & Karunakara RA. (1997). Reliability and precision of isokinetic strength and muscular endurance for the quadriceps and hamstrings. International Journal of Sports Medicine, 18(2), 113-117.
Pinniger GJ, Steele JR, & Groeller H. (2000). Does fatigue induced by repeated dynamic efforts affect hamstring muscle function? Medicine and Science in Sports Exercise, 32(3), 647-653.
Potier TG, Alexander CM, & Seynnes OR. (2009). Effects of eccentric strength training on biceps femoris muscle architecture and knee joint range of movement. European Journal of Applied Physiology, 105(6), 939-944.
Prior M, Guerin M, & Grimmer K. (2009). An evidence-based approach to hamstring strain injury: a systematic review of the literature. Sports Health, 1(2), 154-164.
Proske U & Morgan DL. (2001). Muscle damage from eccentric exercise: mechanism, mechanical signs, adaptation and clinical applications. Journal of Physiology, 537(Pt 2), 333-345.
Proske U, Morgan DL, Brockett CL, & Percival P. (2004). Identifying athletes at risk of hamstring strains and how to protect them. Clinical and Experimental Pharmacology & Physiology, 31(8), 546-550.
Rehorn MR & Blemker SS. (2010) The effects of aponeurosis geometry on strain injury susceptibility explored with a 3D muscle model. Journal of Biomechanics, 43(13), 2574-2581.
Riley PO, Franz J, Dicharry J, Kerrigan DC. (2010). Changes in hip joint muscle-tendon lengths with mode of locomotion. Gait & Posture, 31(2), 279-283.
Sato K, Nimura A, Yamaguchi K, & Akita K. (2012). Anatomical study of the proximal origin of hamstring muscles. Journal of Orthopaedic Science, 17(5), 614-618.

References
160
Schache AG, Dorn TW, Blanch PD, Brown NA, & Pandy MG. (2012). Mechanics of the human hamstring muscles during sprinting. Medicine and Science in Sports Exercise, 44(4), 647-658.
Schache AG, Dorn TW, Williams GP, Brown NA, & Pandy MG. (2014). Lower-limb muscular strategies for increasing running speed. The Journal of Orthopaedic and Sports Physical Therapy, 44(10), 813-824.
Schache AG, Dorn TW, Wrigley TV, Brown NA, & Pandy MG. (2013). Stretch and activation of the human biarticular hamstrings across a range of running speeds. European Journal of Applied Physiology, 113(11), 2813-2828.
Schache AG, Wrigley TV, Baker R, & Pandy MG. (2009). Biomechanical response to hamstring muscle strain injury. Gait & Posture, 29(2), 332-338.
Schantz P, Randall-Fox E, Hutchison W, Tydén A, & Astrand PO. (1983). Muscle fibre type distribution, muscle cross-sectional area and maximal voluntary strength in humans. Acta Physiologica Scandinavica, 117(2), 219-226.
Schuenke M, Schulte E, Schumacher U, Ross LM, Lamperti ED, Voll M. (2010). General anatomy and musculoskeletal system (Thieme Atlas of Anatomy), 1st ed. Thieme.
Schwartz FP, Bottaro M, Celes RS, Brown LE, & Nascimento FA. (2010). The influence of velocity overshoot movement artifact on isokinetic knee extension tests. Journal of Sports Science and Medicine, 9(1), 140-146.
Seynnes OR, Erskine RM, Maganaris CN, Longo S, Simoneau EM, Grosset JF, & Narici MV. (2009). Training-induced changes in structural and mechanical properties of the patellar tendon are related to muscle hypertrophy but not to strength gains. Journal of Applied Physiology, 107(2), 523-530.
Silder A, Heiderscheit BC, Thelen DG, Enright T, & Tuite MJ. (2008). MR observations of long-term musculotendon remodeling following a hamstring strain injury. Skeletal Radiology, 37(12), 1101-1109.
Silder A, Reeder SB, & Thelen DG. (2010). The influence of prior hamstring injury on lengthening muscle tissue mechanics. Journal of Biomechanics, 43(12), 2254-2260.
Slavotinek JP, Verrall GM, & Fon GT. (2002). Hamstring injury in athletes: using MR imaging measurements to compare extent of muscle injury with amount of time lost from competition. AJR. American Journal of Roentgenology, 179(6), 1621-1628.
Small K, McNaughton L, Greig M, & Lovell R. (2010). The effects of multidirectional soccer-specific fatigue on markers of hamstring injury risk. Journal of Science and Medicine in Sport, 13, 120–125.
Small K, McNaughton LR, Greig M, Lohkamp M, & Lovell R. (2009). Soccer fatigue, sprinting and hamstring injury risk. International Journal of Sports Medicine, 30(8), 573-578.

References
161
Sole G, Hamrén J, Milosavljevic S, Nicholson H, & Sullivan SJ. (2007). Test-retest reliability of isokinetic knee extension and flexion. Archive of Physical Medicine and Rehabilitation, 88(5), 626-631.
Staron RS & Hikida RS. (1992). Histochemical, biochemical, and ultrastructural analyses of single human muscle fibers, with special reference to the C-fiber population. The Journal of Histochemistry and Cytochemistry, 40(4), 563-568.
Staron RS, Hagerman FC, Hikida RS, Murray TF, Hostler DP, Crill MT, Ragg KE, & Toma K. (2000). Fiber type composition of the vastus lateralis muscle of young men and women. Journal of Histochemistry & Cytochemistry, 48(5), 623-629.
Sugiura Y, Saito T, Sakuraba K, Sakuma K, & Suzuki E. (2008). Strength deficits identified with concentric action of the hip extensors and eccentric action of the hamstrings predispose to hamstring injury in elite sprinters. Journal of Orthopaedic and Sports Physical Therapy, 38(8), 457-464.
Sutton G. (1984). Hamstrung by hamstring strains: a review of the literature*. The Journal of Orthopaedic and Sports Physical Therapy, 5(4), 184-95.
Thelen DG, Chumanov ES, Best TM, Swanson SC, & Heiderscheit BC. (2005). Simulation of biceps femoris musculotendon mechanics during the swing phase of sprinting. Medicine and Science in Sports and Exercise, 37(11), 1931-1938.
Thorstensson A, Grimby G, & Karlsson J. (1976). Force-velocity relations and fiber composition in human knee extensor muscles. Journal of Applied Physiology, 40(1), 12-16.
Tidball JG & Chan M. (1989). Adhesive strength of single muscle cells to basement membrane at myotendinous junctions. Journal of Applied Physiology, 67(3), 1063-1069.
Tillin NA & Folland JP. (2014). Maximal and explosive strength training elicit distinct neuromuscular adaptations, specific to the training stimulus. European Journal of Applied Physiology, 114(2), 365-374.
Tillin NA, Jimenez-Reyes P, Pain MT, & Folland JP. (2010). Neuromuscular performance of explosive power athletes versus untrained individuals. Medicine and Science in Sports Exercise, 42(4), 781-790.
Tillin NA, Pain MT, & Folland JP. (2011). Short-term unilateral resistance training affects the agonist-antagonist but not the force-agonist activation relationship. Muscle & Nerve, 43(3), 375-384.
Tillin NA, Pain MT, & Folland JP. (2013). Identification of contraction onset during explosive contractions. Response to Thompson et al. "Consistency of rapid muscle force characteristics: influence of muscle contraction onset detection methodology" [J Electromyogr Kinesiol 2012;22(6):893-900]. Journal of Electromyography and Kinesiology, 23(4), 991-994.
Timmins RG, Opar DA, Williams MD, Schache AG, Dear NM, Shield AJ. (2014a). Reduced biceps femoris myoelectrical activity influences eccentric knee flexor weakness after
References
162
repeat sprint running. Scandinavian Journal of Medicine and Science in Sports, (Ahead of print), doi: 10.1111/sms.12171.
Timmins RG, Shield AJ, Williams MD, Lorenzen C, & Opar DA. (2014b). Biceps femoris long-head architecture: a reliability and retrospective injury study. Medicine and Science in Sports and Exercise, (Ahead of print), doi: 10.1249/MSS.0000000000000507
Tourny-Chollet C & Leroy D. (2002). Conventional vs. dynamic hamstring-quadriceps strength ratios: a comparison between players and sedentary subjects. Isokinetics and Exercise Science, 10, 183–192.
Tsaopoulos DE, Baltzopoulos V, Richards PJ, & Maganaris CN. (2011). Mechanical correction of dynamometer moment for the effects of segment motion during isometric knee-extension tests. Journal of Applied Physiology, 111(1), 68-74.
van Beijsterveldt AM, van de Port IG, Vereijken AJ, & Backx FJ. (2013). Risk factors for hamstring injuries in male soccer players: a systematic review of prospective studies. Scandinavian Journal of Medicine and Science in Sports, 23(3), 253-262.
van der Made AD, Wieldraaijer T, Kerkhoffs GM, Kleipool RP, Engebretsen L, van Dijk CN, & Golanó P. (2013). The hamstring muscle complex. Knee Surgery, Sports Traumatology, Arthroscopy. (Ahead of print), doi: 10.1007/s00167-013-2744-0.
Verrall GM, Slavotinek JP, Barnes PG, Fon GT, & Esterman A. (2006). Assessment of physical examination and magnetic resonance imaging findings of hamstring injury as predictors for recurrent injury. The Journal of Orthopaedic and Sports Physical Therapy, 36(4), 215-224.
Verrall GM, Slavotinek JP, Barnes PG, Fon, GT, & Spriggins AJ. (2001). Clinical risk factors for hamstring muscle strain injury: a prospective study with correlation of injury by magnetic resonance imaging. British Journal of Sports Medicine, 35, 435–440.
Viitasalo JT & Komi PV. (1978). Force-time characteristics and fiber composition in human leg extensor muscles. European Journal of Applied Physiology, 40(1), 7-15.
Viitasalo JT & Komi PV. (1981). Effects of fatigue on isometric force- and relaxation-time characteristics in human muscle. Acta Physiologica Scandinavica, 111(1), 87-95.
Wakahara T, Ema R, Miyamoto N, & Kawakami Y. (2015). Increase in vastus lateralis aponeurosis width induced by resistance training: implications for a hypertrophic model of pennate muscle. European Journal of Applied Physiology, 115(2), 309-316.
Ward SR, Eng CM, Smallwood LH, & Lieber RL. (2009). Are current measurements of lower extremity muscle architecture accurate? Clinical Orthopaedics and Related Research, 467(4), 1074-1082.
Westing SH, Cresswell AG, & Thorstensson A. (1991). Muscle activation during maximal voluntary eccentric and concentric knee extension. European Journal of Applied Physiology, 62(2), 104-108.
References
163
Westing SH, Seger JY, & Thorstensson A. (1990). Effects of electrical stimulation on eccentric and concentric torque-velocity relationships during knee extension in man. Acta Physiologica Scandinavica, 140(1), 17-22.
Westing SH, Seger JY, Karlson E, & Ekblom B. (1988). Eccentric and concentric torque-velocity characteristics of the quadriceps femoris in man. European Journal of Applied Physiology, 58(1-2), 100-104.
Witvrouw E, Danneels L, Asselman P, D'Have T, & Cambier D. (2003). Muscle flexibility as a risk factor for developing muscle injuries in male professional soccer players. A prospective study. The American Journal of Sports Medicine, 31(1), 41-46.
Woodley SJ & Mercer SR. (2004). Hamstring strains - Where do they occur ? New Zealand Journal of Physiotherapy, 32(1), 22–28.
Woodley SJ & Mercer SR. (2005). Hamstring muscles: architecture and innervation. Cells, Tissues, Organs, 179(3), 125-141.
Woods C, Hawkins RD, Maltby S, Hulse M, Thomas A, & Hodson A. (2004). The Football Association Medical Research Programme: an audit of injuries in professional football - analysis of hamstring injuries. British Journal of Sports Medicine, 38, 36–41.
Yeow CH. (2013). Hamstrings and quadriceps muscle contributions to energy generation and dissipation at the knee joint during stance, swing and flight phases of level running. The Knee, 20(2), 100-105.
Yeung SS, Suen AM, & Yeung EW. (2009). A prospective cohort study of hamstring injuries in competitive sprinters: preseason muscle imbalance as a possible risk factor. British Journal of Sports Medicine, 43(8), 589-594.
Yu B, Queen RM, Abbey AN, Liu Y, Moorman CT, & Garrett WE. (2008). Hamstring muscle kinematics and activation during overground sprinting. Journal of Biomechanics, 41(15), 3121-3126.
Zebis MK, Andersen LL, Ellingsgaard H, & Aagaard P. (2011). Rapid hamstring/quadriceps force capacity in male vs. female elite soccer players. Journal of Strength and Conditioning Research, 25(7), 1989-1993.