HALF YEAR RESULTS PRESENTATION 2018
52
HALF YEAR RESULTS PRESENTATION 2018 RESULTS FOR THE SIX MONTHS ENDED 31 MAY 2018
Transcript of HALF YEAR RESULTS PRESENTATION 2018

HALF YEAR RESULTS
PRESENTATION 2018RESULTS FOR THE SIX MONTHS ENDED 31 MAY 2018
2
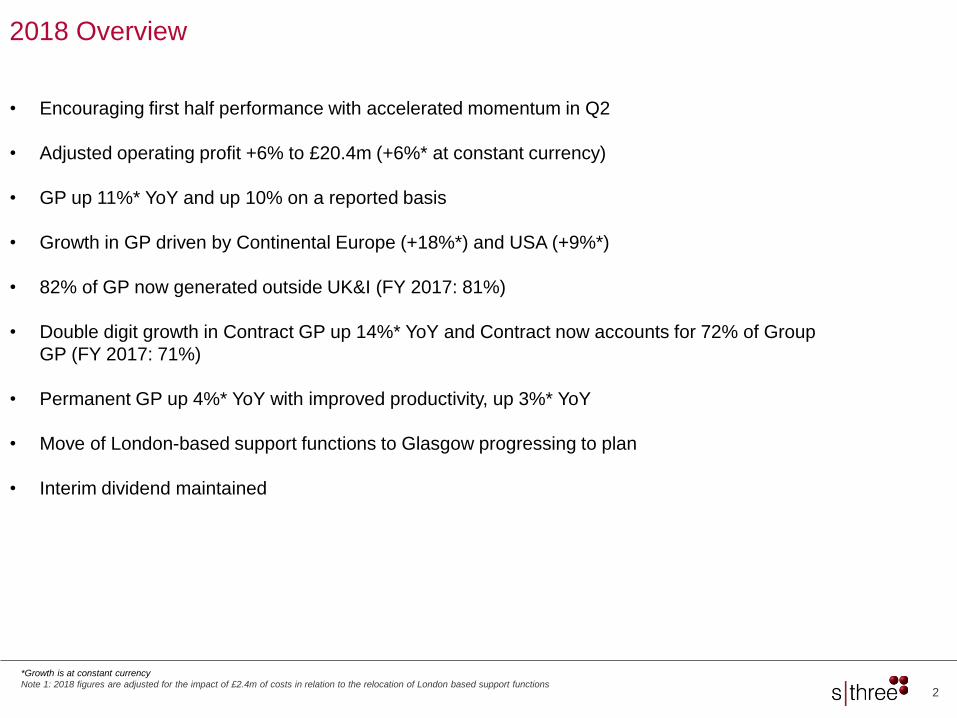
2018 Overview
*Growth is at constant currency
Note 1: 2018 figures are adjusted for the impact of £2.4m of costs in relation to the relocation of London based support functions
• Encouraging first half performance with accelerated momentum in Q2
• Adjusted operating profit +6% to £20.4m (+6%* at constant currency)
• GP up 11%* YoY and up 10% on a reported basis
• Growth in GP driven by Continental Europe (+18%*) and USA (+9%*)
• 82% of GP now generated outside UK&I (FY 2017: 81%)
• Double digit growth in Contract GP up 14%* YoY and Contract now accounts for 72% of Group
GP (FY 2017: 71%)
• Permanent GP up 4%* YoY with improved productivity, up 3%* YoY
• Move of London-based support functions to Glasgow progressing to plan
• Interim dividend maintained

3
FINANCIAL RESULTS
4
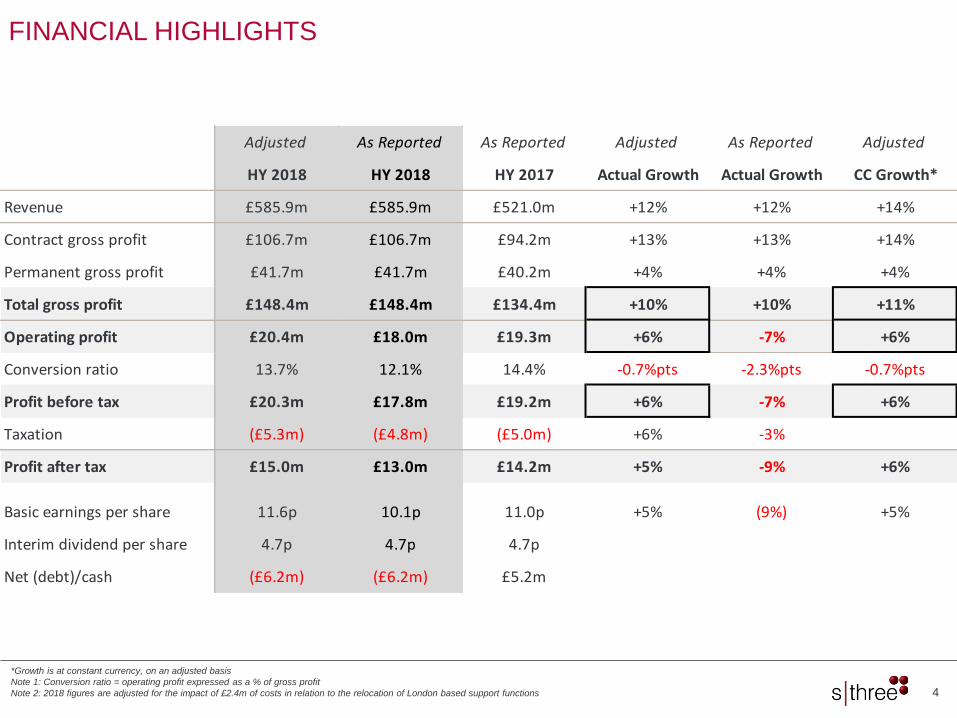
FINANCIAL HIGHLIGHTS
*Growth is at constant currency, on an adjusted basis
Note 1: Conversion ratio = operating profit expressed as a % of gross profit
Note 2: 2018 figures are adjusted for the impact of £2.4m of costs in relation to the relocation of London based support functions
Adjusted As Reported As Reported Adjusted As Reported Adjusted
HY 2018 HY 2018 HY 2017 Actual Growth Actual Growth CC Growth*
Revenue £585.9m £585.9m £521.0m +12% +12% +14%
Contract gross profit £106.7m £106.7m £94.2m +13% +13% +14%
Permanent gross profit £41.7m £41.7m £40.2m +4% +4% +4%
Total gross profit £148.4m £148.4m £134.4m +10% +10% +11%
Operating profit £20.4m £18.0m £19.3m +6% -7% +6%
Conversion ratio 13.7% 12.1% 14.4% -0.7%pts -2.3%pts -0.7%pts
Profit before tax £20.3m £17.8m £19.2m +6% -7% +6%
Taxation (£5.3m) (£4.8m) (£5.0m) +6% -3%
Profit after tax £15.0m £13.0m £14.2m +5% -9% +6%
Basic earnings per share 11.6p 10.1p 11.0p +5% (9%) +5%
Interim dividend per share 4.7p 4.7p 4.7p
Net (debt)/cash (£6.2m) (£6.2m) £5.2m
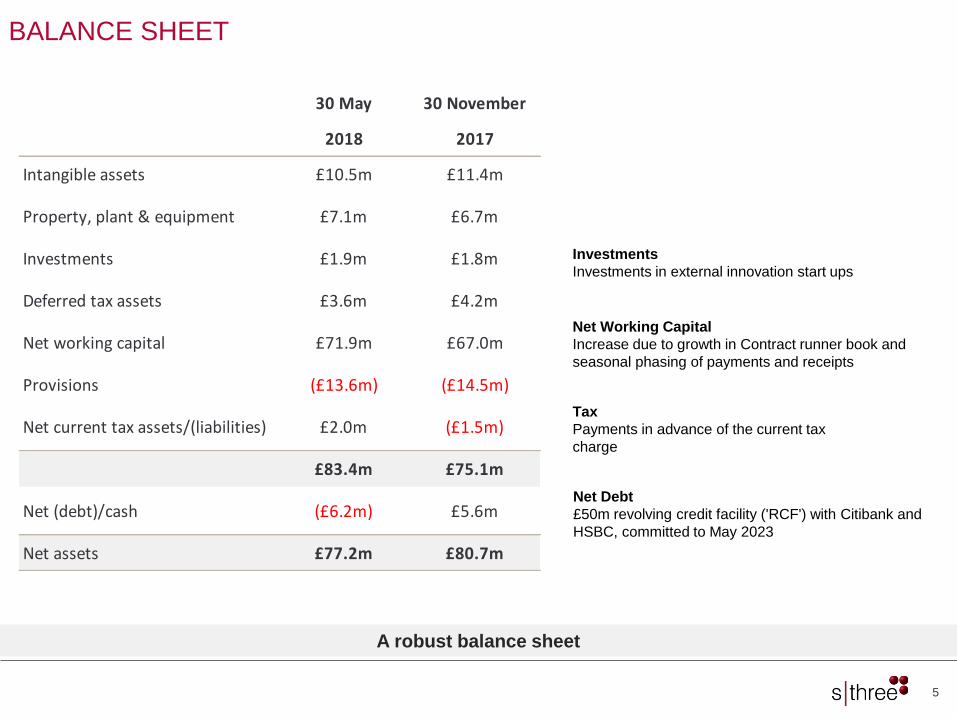
Net Debt
£50m revolving credit facility ('RCF') with Citibank and
HSBC, committed to May 2023
5
BALANCE SHEET
Investments
Investments in external innovation start ups
Tax
Payments in advance of the current tax
charge
Net Working Capital
Increase due to growth in Contract runner book and
seasonal phasing of payments and receipts
A robust balance sheet
30 May 30 November
2018 2017
Intangible assets £10.5m £11.4m
Property, plant & equipment £7.1m £6.7m
Investments £1.9m £1.8m
Deferred tax assets £3.6m £4.2m
Net working capital £71.9m £67.0m
Provisions (£13.6m) (£14.5m)
Net current tax assets/(liabilities) £2.0m (£1.5m)
£83.4m £75.1m
Net (debt)/cash (£6.2m) £5.6m
Net assets £77.2m £80.7m

6
CASH FLOW BRIDGE
YE 2017 Net Cash
Adjusted Operating
profit
Depn and amort
Share awards
charge
Share option settlements
Treasury shares
purchased
Exceptional items
Capex Dividends Taxes, interest & FX
Working capital
HY 2018 net debt
£5.6m
£20.4m
£3.5m£1.6m £0.4m (£1.0m)
(£2.1m)(£3.1m)
(£6.0m)
(£7.5m)
(£18.0m)
(£6.2m)

7
LONDON BASED SUPPORT RELOCATION
Net Cash outflow of c£12m to £13m in
2018 (2017: £1m)
c£4m-£5m annualised benefit
Simple Payback of c3 years
c250 Roles* proposed for relocation
Restructuring costs of c£9m** recognised as exceptional items to date, with £2.4m in H1 2018. Costs of
c£5m - £6m are expected in the second half of 2018
Exceptional Charge £m’s
People and other costs £13m - £14m
Property costs £1m
Total £14m - £15m
Less: Regional Development
Grantc.£2m
Total Exceptional Cost £12m - £13m
*Includes IT, Finance, Marketing and HR
**Restructuring costs of £6.7m recognised as exceptional in 2017 plus £2.4m in H1 2018 gives cumulative restructuring costs of c£9m
CAPEX of c£1m is excluded from the exceptional charge analysis

8
EARNINGS PER SHARE AND DIVIDENDS
Dividends maintained YoY
Note 1: 2018 figures are adjusted for the impact of £2.4m of costs in relation to the relocation of London based support functions, net of tax
Adjusted As Reported As Reported Adjusted As Reported
HY 2018 HY 2018 HY 2017 Actual Growth Actual Growth
Profit after tax £15.0m £13.0m £14.2m +5% -9%
For basic EPS 128.7m 128.7m 128.7m
Dilutive impact of share plans 5.9m 5.9m 4.7m
Fully diluted EPS 134.6m 134.6m 133.4m
Basic 11.6p 10.1p 11.0p +5% -9%
Diluted 11.1p 9.6p 10.6p +5% -9%
DPS Interim Ordinary 4.7p 4.7p 4.7p - -
Weighted
average
number of
shares
EPS

9
FOREIGN EXCHANGE IMPACT
For HY 2018, currency movement versus Sterling had minimal impact on the reported performance.
Movements in exchange rates decreased our reported HY 2018 GP by c£0.7m and OP by £0.1m
Average Closing Average Closing Average Closing
EUR € 1.14 1.14 1.18 1.15 +3.5% +0.7%
USD $ 1.38 1.33 1.25 1.29 -9.9% -3.2%
Gross
Profit
Operating
Profit
Gross
Profit
Operating
Profit
EUR € £846k £236k £698k £208k
USD $ £294k £72k £297k £78k
Six months ended Six months ended YoY Exchange
31 May 2018 31 May 2017 Rate Movement
Six months ended Six months ended
31 May 2018 31 May 2017
Impact of a 1% change

10
OPERATING REVIEW

DIVISION
DIVERSIFICATION
GEOGRAPHICAL
DIVERSIFICATION
SECTOR
DIVERSIFICATION
43%
15%
9%
9%
22%
2%
ICTBanking & FinanceEnergyEngineeringLife SciencesOther
72%
28%18%
21%
5%30%
20%
6%
19%
19%
5%28%
22%
7%
UK&I Benelux
France DACH
USA APAC & ME
45%
13%
9%
10%
21%
2%
71%
29%
Cont
Perm
11
BUSINESS PROFILE
HY 2018 HY 2018 HY 2018
FY 2017FY 2017FY 2017
C Europe
56%
C Europe
52%

CONTRACT
RUNNERS
GROSS
PROFIT PER
DAY RATE
FY10 FY11 FY12 FY13 FY14 FY15 FY16 FY17 HY18
FY10 FY11 FY12 FY13 FY14 FY15 FY16 FY17 HY18
12
KEY PERFORMANCE INDICATORS: CONTRACT
* Growth is at constant currency
Note 1: All numbers are period end
Note 2: Contractors are those on placement with one of the Group’s clients at the end of
the relevant period
Note 3: The average gross profit per day per contractor is calculated by taking the period
end Total Runner Weekly Gross Profit position, divided by the period end number of
active contractors, divided by 5 (assuming a 5 day working week)
Contract
margin %
HY 2018 19.6%
HY 2017 19.6%
+12%
vs
FY16
+8%
vs
FY10
+9%
vs
FY11
+13%
vs
FY12
+31%
vs
FY13
+11%
vs
FY14
+8%
vs
FY15
Flat*
vs
FY16
+4%*
vs
FY10
-2%*
vs
FY11
-5%*
vs
FY12
0%*
vs
FY13
+3%*
vs
FY14
-1%*
vs
FY15
Contract runners have doubled since 2012
+1%
vs
FY17
Flat*
vs
FY17
+11%
vs
HY17

13
CONTRACT RUNNERS – COMPARISON TO PRIOR YEARS
111%
108%
112%
101%
90%
95%
100%
105%
110%
115%
November December January February March April May June July August September October November
2015 2016 2017 2018

PERMANENT
PLACEMENT
VOLUMES
PERMANENT
AVERAGE FEE
FY10 FY11 FY12 FY13 FY14 FY15 FY16 FY17 HY18
FY10 FY11 FY12 FY13 FY14 FY15 FY16 FY17 HY18
14
KEY PERFORMANCE INDICATORS: PERMANENT
Note 3: 2014 data is adjusted due to timing of period ends (an additional 45 placements in Germany)
Note 4: 2013 data is based on a normalised 52 week period
* Growth in constant currency
Note 1: The average permanent placement fee is calculated using the total placement
fees for the relevant period, divided by the number of placements for the period
Note 2: This analysis excludes retained business
-13%
vs
FY16
+13%
vs
FY10
-1%
vs
FY11
-12%
vs
FY12
+3%
vs
FY13
-3%
vs
FY14
+3%*
vs
FY16
+6%*
vs
FY10
+4%*
vs
FY11
0%*
vs
FY12
+1%*
vs
FY13
+3%*
vs
FY14
+1%*
vs
FY15
Placement
volumes down
3% YoY
Average fee
up 5%* YoY
We have seen an improvement in average fee, up 5%* YoY
-11%
vs
FY15
-3%
vs
HY17
+5%*
vs
HY17

15
STRATEGY & OUTLOOK

16
“We bring skilled people togetherto build the future”
Our purpose:

17
To be the #1 STEM talent providerin the best STEM markets
Our vision:

18
Our operating principles:

19
5 year strategy to deliver our vision

Progress against our strategic priorities
Grow and extend regions,
sectors and services• Opened two new offices in Eindhoven (Netherlands) and Washington (USA)
• Group average sales headcount up 10% YoY
Develop and sustain great
customer relationships• Rolling out our new contractor timesheet portal, Workflow
• Unique position to service MSPs
Focus on Contract, drive
Permanent profitability• Contract runners have doubled since 2012, with runners at an all time high
• Continue to invest in a strong permanent offering in key markets such as Germany, USA & Japan
• Permanent productivity up 3%* YoY
• Completed separate management structures for Permanent & Contract business to improve focus and
drive profitability
Generate incremental revenues
through Innovation and M&A• Leverage our existing innovation investments and launch additional ventures incubated within Sthree
• Extensive innovation within the core business
Build infrastructure for
leveraged growth• Move of London-based support functions to Glasgow progressing to plan
Find, retain and develop great
people• Completed first cohort of future female leadership development programme
• Rolled out our operating principles throughout the organisation and leadership principles in progress
20
2018 PROGRESS
* Growth in constant currency

INNOVATION
RentBuy Build
Contractor Timesheets
Expect to spend £3m on “Build” innovation in operating expenses in 2018 (2017: £2m)
Customer proposition New revenue streams
Core efficiency Risk management

22
OUTLOOK
• Trading outlook remains encouraging as we enter the second half
• Continued headcount investment, with particular focus on more resilient Contract market
• Ongoing focus on productivity in Permanent
• Continental Europe particularly well positioned for growth
• On track with the delivery of our five year plan outlined at the Capital Markets Day in November 2017
To be the #1 STEM talent provider in the best STEM markets

23
FINANCIAL CALENDAR
201814 September Q3 Trading Statement
1 November Ex-dividend date for 2018 interim dividend
30 November 2018 Financial Year end
7 December 2018 Interim dividend paid
14 December Trading update for the year ended 30 November 2018
201928 January Annual results for the year ended 30 November 2018

24
SUPPLEMENTARY MATERIAL

DIVISION GEOGRAPHY SECTOR
72%
28%
Cont
Perm
81%72% 72%
43%
19%28% 28%
57%
UK&I C Europe USA APAC & ME
Cont Perm
75%59%
94%
70% 65%
25%41%
6%
30% 35%
ICT Banking &Finance
Energy Engineering Life Sciences
Cont Perm
71%
29%
Cont
Perm
79% 71% 69%51%
21% 29% 31%49%
UK&I C Europe USA APAC & ME
Cont Perm
75%55%
93%72% 64%
25%45%
7%28% 36%
ICT Banking &Finance
Energy Engineering Life Sciences
Cont Perm
25
CONTRACT / PERMANENT GROSS PROFIT ANALYSIS
HY 2018
FY 2017
Continued focus on growth in Contract across all regions and sectors

GEOGRAPHICAL
DIVERSIFICATION
ASIA PACIFIC &
MIDDLE EAST
GROSS PROFIT
GROWTH /
(DECLINE) BY
REGION*
HY 2018 HY 2017
HY 2018 FY 2017
(2%)
22%
2%
18%
9% 8%
UK&I
Benelux
France
Germany
USA
APAC & ME(16%)
8%12%
5%
16%
(4%)
18%
21%
5%30%
20%
6%UK&I
Benelux
France
Germany
USA
APAC & ME
19%
19%
5%28%
22%
7%
26%
49%
25%
Australia
Asia
Middle East
34%
45%
21%
26
GEOGRAPHICAL GROSS PROFIT ANALYSIS
* Growth is at constant currency
UK&I
Benelux
France
Germany
USA
APAC & ME
Australia
Asia
Middle East

SECTORAL
DIVERSIFICATION
GROSS PROFIT
GROWTH /
(DECLINE) BY
SECTOR*
HY 2018 HY 2017
HY 2018 FY 2017
9%
1%
31%
17%
11%
28%ICT
Banking & Finance
Energy
Engineering
Life Sciences
Other
1%
(5%)
7%
1%
6%
9%
45%
13%
9%
10%
21%
ICT
Banking &FinanceEnergy
Engineering
LifeSciencesOther
43%
15%
9%
9%
22%
27
SECTOR GROSS PROFIT ANALYSIS
* Growth is at constant currency
2% 2%

28
GROSS PROFIT PERFORMANCE BY REGION
Note 1: GP Growth is at constant currency
GP Growth YoY YTD 18 Sales FTE HC (SL1-SL5) Growth YoY
Cont Perm Total Cont / Perm Mix Cont Perm Total
Q1 18 -1% -11% -3% Q1 18 +1% -9% -2%
Q2 18 +3% -17% -2% Q2 18 -1% -22% -8%
HY18 +1% -15% -2% HY18 - -16% -5%
Q1 18 +19% +6% +15% Q1 18 +26% +10% +20%
Q2 18 +23% +13% +20% Q2 18 +21% +9% +17%
HY18 +21% +9% +18% HY18 +23% +9% +18%
Q1 18 +10% -18% +1% Q1 18 +16% +16% +16%
Q2 18 +21% +6% +16% Q2 18 +18% +2% +12%
HY18 +16% -5% +9% HY18 +17% +9% +14%
Q1 18 -12% +44% +15% Q1 18 +22% -10% +2%
Q2 18 -14% +18% +1% Q2 18 +6% -8% -3%
HY18 -13% +30% +8% HY18 +14% -9% -1%
Q1 18 +11% +2% +8% Q1 18 +17% +4% +12%
Q2 18 +16% +7% +13% Q2 18 +14% -1% +9%
HY18 +14% +4% +11% HY18 +16% +1% +10%
Cont81%
Perm19%
Cont72%
Perm28%
Cont43%Perm
57%
UK&I
USA
APAC & MENA
18% of Group
20% of Group
6% of group
Cont72%
Perm28%
GROUP
Cont72%
Perm28%
C Europe56% of group

29
GROSS PROFIT PERFORMANCE BY SECTOR
Note 1: GP Growth is at constant currency
GP Growth YoY YTD 18 Sales FTE HC (SL1-SL5) Growth YoY
Cont Perm Total Cont / Perm Mix Cont Perm Total
Q1 18 +6% -1% +5% Q1 18 +16% +2% +12%
Q2 18 +13% +11% +13% Q2 18 +11% +3% +9%
HY18 +10% +5% +9% HY18 +14% +3% +10%
Q1 18 +8% -10% - Q1 18 -4% -9% -7%
Q2 18 +7% -5% +1% Q2 18 +1% -13% -6%
HY18 +7% -7% +1% HY18 -2% -11% -7%
Q1 18 +47% -46% +35% Q1 18 +32% -26% +27%
Q2 18 +27% +54% +28% Q2 18 +31% -25% +26%
HY18 +35% -13% +31% HY18 +31% -26% +27%
Q1 18 +3% +42% +14% Q1 18 +15% +8% +12%
Q2 18 +20% +22% +20% Q2 18 +8% +2% +6%
HY18 +12% +32% +17% HY18 +11% +5% +9%
Q1 18 +10% +7% +9% Q1 18 +25% +15% +21%
Q2 18 +18% +2% +12% Q2 18 +19% - +11%
HY18 +14% +5% +11% HY18 +22% +8% +16%
Cont75%
Perm25%
Cont94%
Perm6%
Cont70%
Perm30%
ICT
ENERGY
ENGINEERING
45% of Group
9% of Group
10% of group
Cont59%
Perm41%
BANKING & FINANCE
13% of group
LIFE SCIENCES
Cont65%
Perm35%
21% of group

30
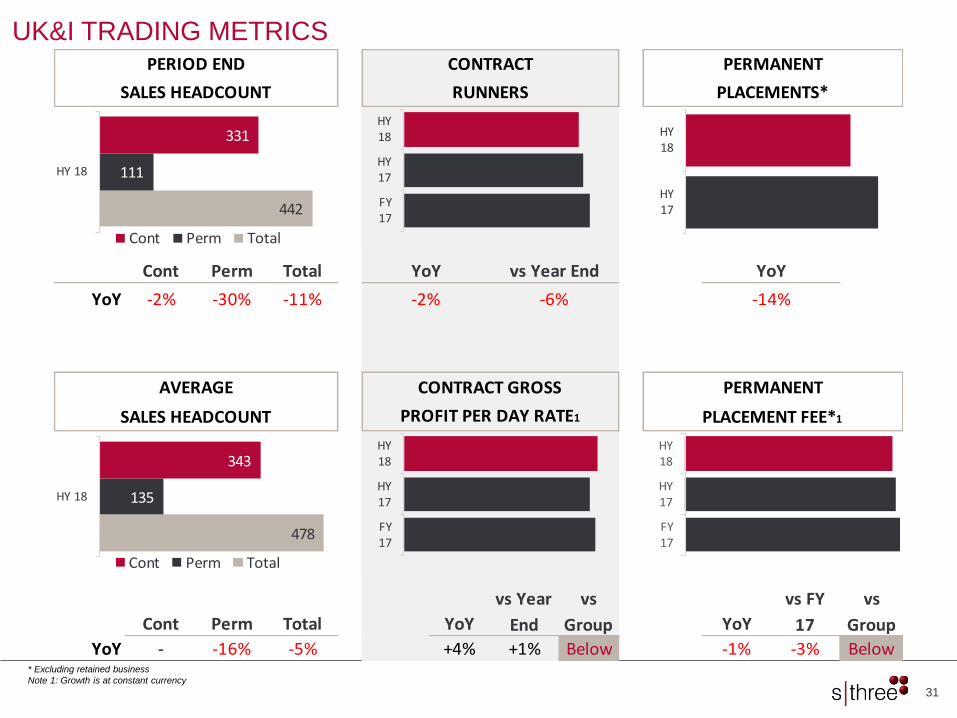
UK&I TRADING METRICS
Note 1: Growth is at constant currency
Note 2: Office count includes corporate function offices
18% of
Group
GP
HY GROSS PROFIT GROWTH YoY
Q1 Q2 H1 MAY 18 8
Contract -1% +3% +1% MAY 17 8
YoY 0
Permanent -11% -17% -15%
NOV 17 8
Total -3% -2% -2% vs Year End 0
OFFICES
DIVISION MIX SECTOR MIX HY 2018 SECTOR MIX FY 2017
Outside HY 2018; inside FY 2017
79%
21%
81%
19%
Cont
Perm 55%
13%
4%
14%
13%
1% ICT
Banking & FinanceEnergy
Engineering
Life Sciences
Other
58%
14%
3%
12%
12%
1%
UK
17%
Ireland1%
31
UK&I TRADING METRICS
* Excluding retained business
Note 1: Growth is at constant currency
Cont Perm Total YoY vs Year End
YoY -2% -30% -11% -2% -6%
YoY - -16% -5% +4% +1% Below -1% -3% Below
YoY
vs FY
17
vs
Group
PERMANENT
SALES HEADCOUNT PROFIT PER DAY RATE1 PLACEMENT FEE*1
Cont Perm Total YoY
vs Year
End
vs
Group
CONTRACT GROSSAVERAGE
-14%
PERIOD END CONTRACT PERMANENT
SALES HEADCOUNT RUNNERS PLACEMENTS*
YoY
442
111
331
HY 18
Cont Perm Total
478
135
343
HY 18
Cont Perm Total
FY17
HY17
HY18
HY17
HY18
FY17
HY17
HY18
FY17
HY17
HY18

32
BENELUX TRADING METRICS
Note 1: Growth is at constant currency
Note 2: Office count includes corporate function offices
21% of
Group
GP
5% 1%
15%HY GROSS PROFIT GROWTH YoY
Q1 Q2 H1 MAY 18 8
Contract +25% +28% +27% MAY 17 6
YoY 2
Permanent -6% +16% +4%
NOV 17 7
Total +18% +26% +22% vs Year End 1
OFFICES
DIVISION MIX SECTOR MIX HY 2018 SECTOR MIX FY 2017
Outside HY 2018; inside FY 2017
81%
19%
82%
18%
Cont
Perm 52%
11%
10%
12%
8%7%
ICT
Banking & FinanceEnergy
Engineering
Life Sciences
Other
49%
13%
12%
12%
8%6%
Bel Lux
Neth

33
BENELUX TRADING METRICS
* Excluding retained business
Note 1: Growth is at constant currency
Cont Perm Total YoY vs Year End
YoY +19% +8% +17% +28% +5%
YoY +19% +5% +15% - -2% Below - +2% Below
-1%
PERIOD END CONTRACT PERMANENT
SALES HEADCOUNT RUNNERS PLACEMENTS*
YoY
AVERAGE
YoY
vs FY
17
vs
Group
PERMANENT
SALES HEADCOUNT PROFIT PER DAY RATE1 PLACEMENT FEE*1
Cont Perm Total YoY
vs Year
End
vs
Group
CONTRACT GROSS
462
106
356
HY 18
Cont Perm Total
443
104
339
HY 18
Cont Perm Total
FY17
HY17
HY18
HY17
HY18
FY17
HY17
HY18
FY17
HY17
HY18
34
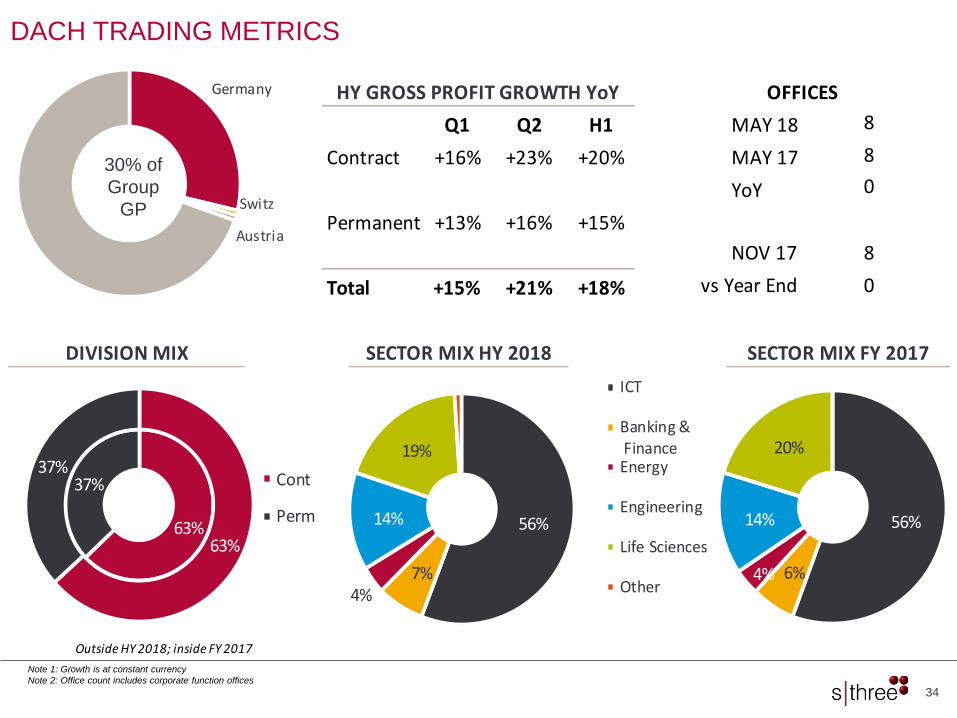
DACH TRADING METRICS
Note 1: Growth is at constant currency
Note 2: Office count includes corporate function offices
30% of
Group
GP
HY GROSS PROFIT GROWTH YoY
Q1 Q2 H1 MAY 18 8
Contract +16% +23% +20% MAY 17 8
YoY 0
Permanent +13% +16% +15%
NOV 17 8
Total +15% +21% +18% vs Year End 0
DIVISION MIX SECTOR MIX HY 2018 SECTOR MIX FY 2017
OFFICES
Outside HY 2018; inside FY 2017
63%
37%
63%
37%Cont
Perm 56%
7%4%
14%
19%
ICT
Banking & FinanceEnergy
Engineering
Life Sciences
Other
56%
6%4%
14%
20%
Germany
Switz
Austria

35
DACH TRADING METRICS
* Excluding retained business
Note 1: Growth is at constant currency
Cont Perm Total YoY vs Year End
YoY +22% +6% +15% +24% +6%
YoY +31% +14% +23% -1% -3% Above +5% +2% Below
PERIOD END CONTRACT PERMANENT
SALES HEADCOUNT RUNNERS PLACEMENTS*
vs
Group
YoY
+6%
vs
Group
AVERAGE CONTRACT GROSS PERMANENT
SALES HEADCOUNT PROFIT PER DAY RATE1 PLACEMENT FEE*1
Cont Perm Total YoY
vs Year
End YoY
vs FY
17
673
270
403
HY 18
Cont Perm Total
687
279
408
HY 18
Cont Perm Total
FY17
HY17
HY18
HY17
HY18
FY17
HY17
HY18
FY17
HY17
HY18

36
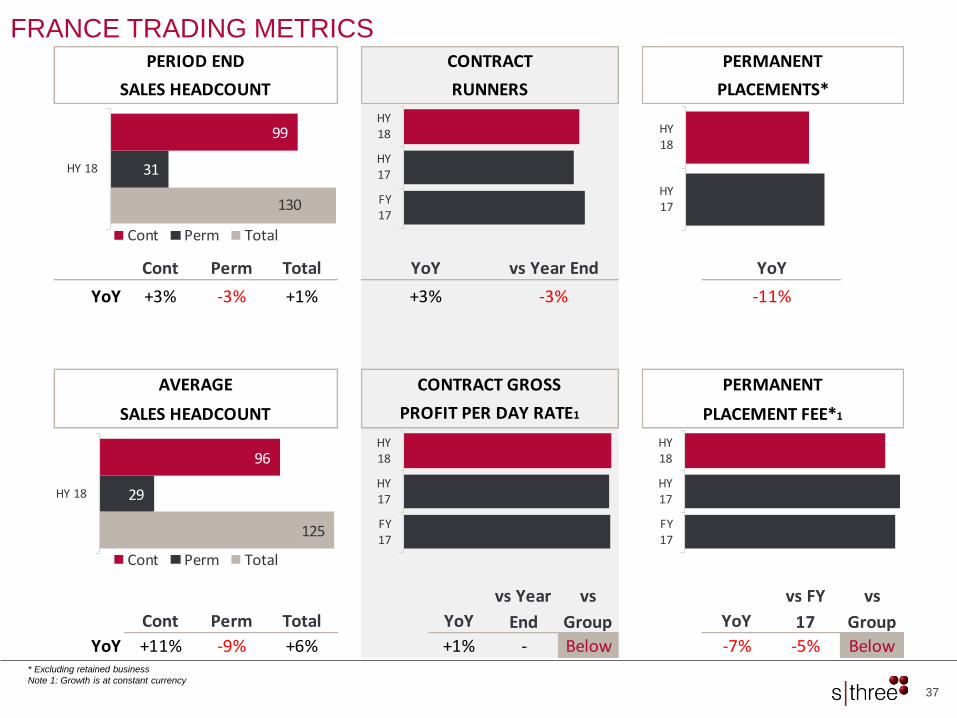
FRANCE TRADING METRICS
Note 1: Growth is at constant currency
Note 2: Office count includes corporate function offices
5% of
Group
GP
HY GROSS PROFIT GROWTH YoY
Q1 Q2 H1 MAY 18 4
Contract +13% +3% +8% MAY 17 2
YoY 2
Permanent -12% -25% -18%
NOV 17 3
Total +7% -3% +2% vs Year End 1
DIVISION MIX SECTOR MIX HY 2018 SECTOR MIX FY 2017
OFFICES
Outside HY 2018; inside FY 2017
76%
24%
80%
20%
Cont
Perm 52%
20%
8%
2%
18%
ICT
Banking & FinanceEnergy
Engineering
Life Sciences
Other
48%
20%
10%
4%
18%
France
37
FRANCE TRADING METRICS
* Excluding retained business
Note 1: Growth is at constant currency
Cont Perm Total YoY vs Year End
YoY +3% -3% +1% +3% -3%
YoY +11% -9% +6% +1% - Below -7% -5% Below
PERIOD END CONTRACT PERMANENT
SALES HEADCOUNT RUNNERS PLACEMENTS*
vs
Group
YoY
-11%
vs
Group
AVERAGE CONTRACT GROSS PERMANENT
SALES HEADCOUNT PROFIT PER DAY RATE1 PLACEMENT FEE*1
Cont Perm Total YoY
vs Year
End YoY
vs FY
17
130
31
99
HY 18
Cont Perm Total
125
29
96
HY 18
Cont Perm Total
FY17
HY17
HY18
HY17
HY18
FY17
HY17
HY18
FY17
HY17
HY18
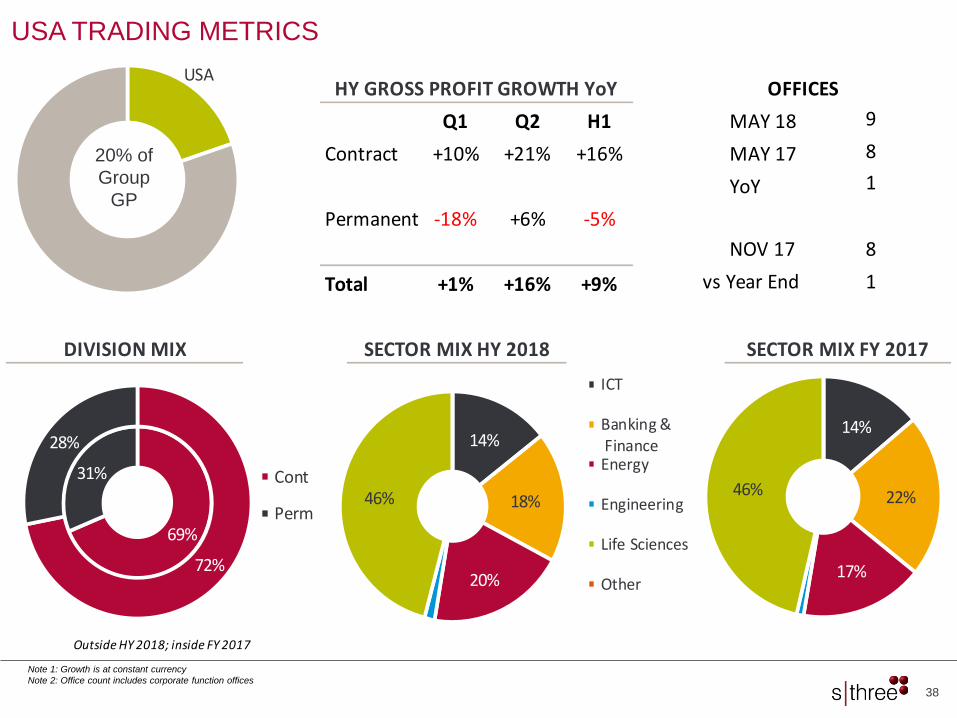
38
USA TRADING METRICS
Note 1: Growth is at constant currency
Note 2: Office count includes corporate function offices
20% of
Group
GP
HY GROSS PROFIT GROWTH YoY
Q1 Q2 H1 MAY 18 9
Contract +10% +21% +16% MAY 17 8
YoY 1
Permanent -18% +6% -5%
NOV 17 8
Total +1% +16% +9% vs Year End 1
DIVISION MIX SECTOR MIX HY 2018 SECTOR MIX FY 2017
OFFICES
Outside HY 2018; inside FY 2017
69%
31%
72%
28%
Cont
Perm
14%
18%
20%
46%
ICT
Banking & FinanceEnergy
Engineering
Life Sciences
Other
14%
22%
17%
46%
USA
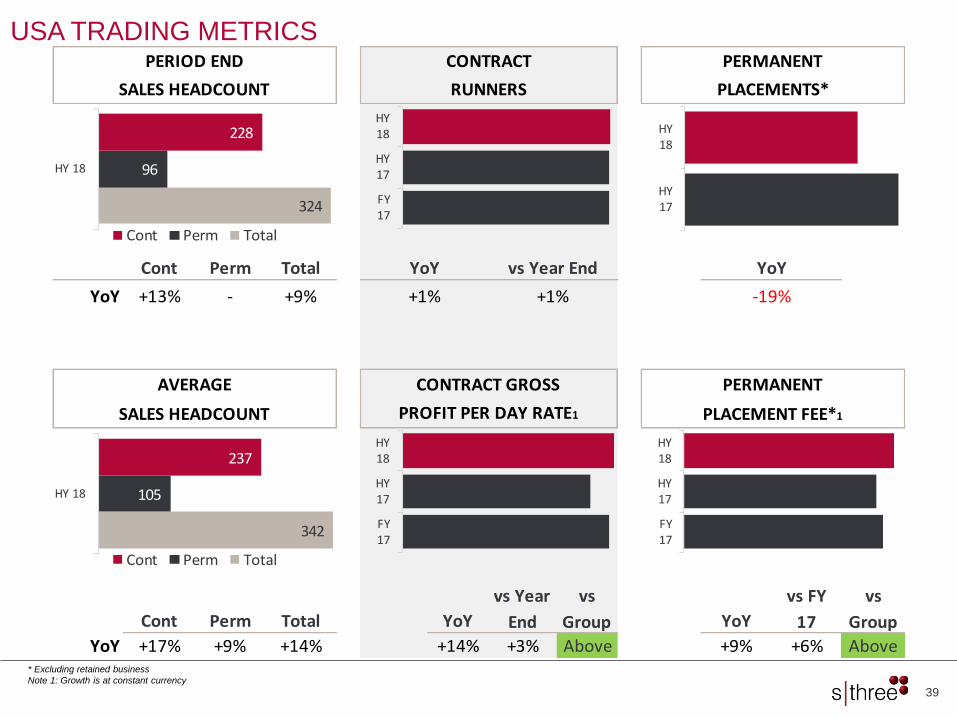
39
USA TRADING METRICS
* Excluding retained business
Note 1: Growth is at constant currency
Cont Perm Total YoY vs Year End
YoY +13% - +9% +1% +1%
YoY +17% +9% +14% +14% +3% Above +9% +6% Above
PERIOD END CONTRACT PERMANENT
SALES HEADCOUNT RUNNERS PLACEMENTS*
vs
Group
YoY
-19%
vs
Group
AVERAGE CONTRACT GROSS PERMANENT
SALES HEADCOUNT PROFIT PER DAY RATE1 PLACEMENT FEE*1
Cont Perm Total YoY
vs Year
End YoY
vs FY
17
324
96
228
HY 18
Cont Perm Total
342
105
237
HY 18
Cont Perm Total
FY17
HY17
HY18
HY17
HY18
FY17
HY17
HY18
FY17
HY17
HY18

40
ASIA PACIFIC & MIDDLE EAST TRADING METRICS
Note 1: Growth is at constant currency
Note 2: Office count includes corporate function offices
6% of
Group
GP
HY GROSS PROFIT GROWTH YoY
Q1 Q2 H1 MAY 18 6
Contract -12% -14% -13% MAY 17 6
YoY 0
Permanent +44% +18% +30%
NOV 17 6
Total +15% +1% +8% vs Year End 0
DIVISION MIX SECTOR MIX HY 2018 SECTOR MIX FY 2017
OFFICES
Outside HY 2018; inside FY 2017
51%49%43%
57%
Cont
Perm
28%
37%
19%
16%
ICT
Banking & FinanceEnergy
Engineering
Life Sciences
Other
28%
38%
20%
14%

41
ASIA PACIFIC & MIDDLE EAST TRADING METRICS
* Excluding retained business
Note 1: Growth is at constant currency
Cont Perm Total YoY vs Year End
YoY +2% -4% -1% +2% +1%
YoY +14% -9% -1% -2% +4% Below +11% +11% Above
PERIOD END CONTRACT PERMANENT
SALES HEADCOUNT RUNNERS PLACEMENTS*
vs
Group
YoY
+23%
vs
Group
AVERAGE CONTRACT GROSS PERMANENT
SALES HEADCOUNT PROFIT PER DAY RATE1 PLACEMENT FEE*1
Cont Perm Total YoY
vs Year
End YoY
vs FY
17
158
95
63
HY 18
Cont Perm Total
158
92
66
HY 18
Cont Perm Total
FY17
HY17
HY18
HY17
HY18
FY17
HY17
HY18
FY17
HY17
HY18
42
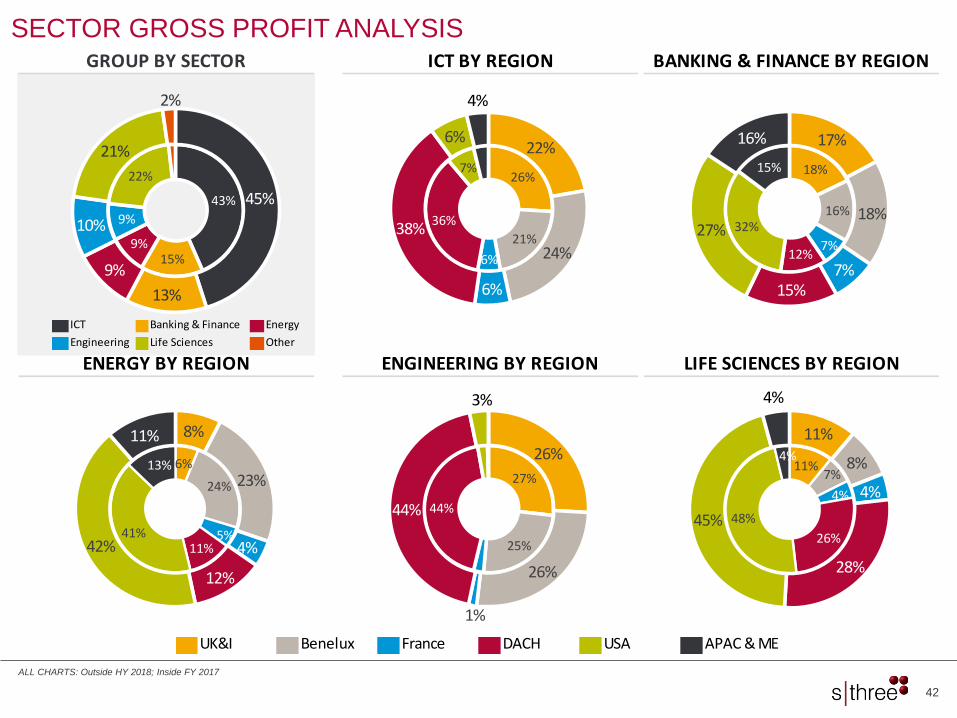
SECTOR GROSS PROFIT ANALYSIS
ICT Banking & Finance Energy
Engineering Life Sciences Other
ALL CHARTS: Outside HY 2018; Inside FY 2017
GROUP BY SECTOR ICT BY REGION BANKING & FINANCE BY REGION
ENERGY BY REGION ENGINEERING BY REGION LIFE SCIENCES BY REGION
43%
15%9%
9%
22%
45%
13%
9%
10%
21%
2%
26%
21%
6%
36%
7%
22%
24%
6%
38%
6%
4%
18%
16%
7%12%
32%
15%
17%
18%
7%15%
27%
16%
11%7%
4%
26%
48%
4%
11%
8%
4%
28%
45%
4%
27%
25%
44%
26%
26%
1%
44%
3%
6%
24%
5%11%
41%
13%
8%
23%
4%
12%
42%
11%
UK&I Benelux France DACH USA APAC & ME
43
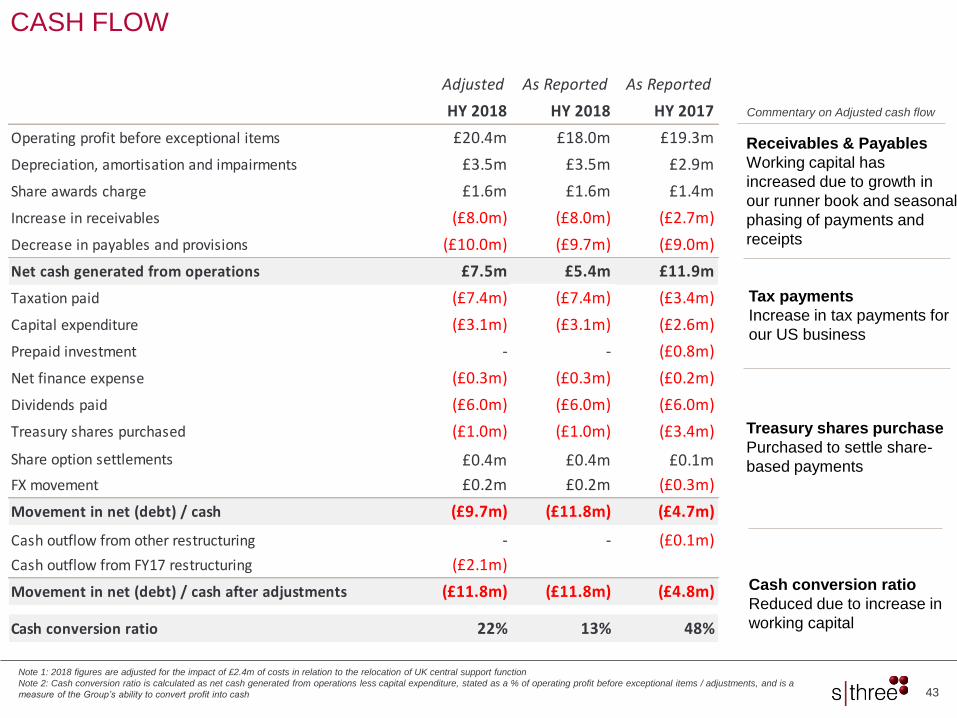
CASH FLOW
Note 1: 2018 figures are adjusted for the impact of £2.4m of costs in relation to the relocation of UK central support function
Note 2: Cash conversion ratio is calculated as net cash generated from operations less capital expenditure, stated as a % of operating profit before exceptional items / adjustments, and is a
measure of the Group’s ability to convert profit into cash
Receivables & Payables
Working capital has
increased due to growth in
our runner book and seasonal
phasing of payments and
receipts
Treasury shares purchase
Purchased to settle share-
based payments
Cash conversion ratio
Reduced due to increase in
working capital
Commentary on Adjusted cash flow
Adjusted As Reported As Reported
HY 2018 HY 2018 HY 2017
Operating profit before exceptional items £20.4m £18.0m £19.3m
Depreciation, amortisation and impairments £3.5m £3.5m £2.9m
Share awards charge £1.6m £1.6m £1.4m
Increase in receivables (£8.0m) (£8.0m) (£2.7m)
Decrease in payables and provisions (£10.0m) (£9.7m) (£9.0m)
Net cash generated from operations £7.5m £5.4m £11.9m
Taxation paid (£7.4m) (£7.4m) (£3.4m)
Capital expenditure (£3.1m) (£3.1m) (£2.6m)
Prepaid investment - - (£0.8m)
Net finance expense (£0.3m) (£0.3m) (£0.2m)
Dividends paid (£6.0m) (£6.0m) (£6.0m)
Treasury shares purchased (£1.0m) (£1.0m) (£3.4m)
Share option settlements £0.4m £0.4m £0.1m
FX movement £0.2m £0.2m (£0.3m)
Movement in net (debt) / cash (£9.7m) (£11.8m) (£4.7m)
Cash outflow from other restructuring - - (£0.1m)
Cash outflow from FY17 restructuring (£2.1m)
Movement in net (debt) / cash after adjustments (£11.8m) (£11.8m) (£4.8m)
Cash conversion ratio 22% 13% 48%
Tax payments
Increase in tax payments for
our US business

FY GP £167.8m £162.4m £189.5m £199.5m £192.8m £218.2m £235.7m £258.7m £287.7m £148.4m
GROSS
PROFIT
CONTRACT
GROSS
MARGIN
£91.6m £72.5m £87.3m £97.1m £91.6m £100.8m £110.5m £119.8m £134.4m £148.4m
£76.2m £89.8m£102.2m £102.4m £101.2m £117.4m £125.2m £138.9m
£153.3m
£0m
£100m
£200m
£300m
£400m
2009 2010 2011 2012 2013 2014 2015 2016 2017 HY 2018
H1 H2
22.1% 21.6% 21.4% 21.5%20.2% 20.0% 19.8% 19.9% 19.8% 19.6%
2009 2010 2011 2012 2013 2014 2015 2016 2017 HY 2018
44
HISTORICAL GROSS PROFIT & GROSS MARGIN
Note 1: 2013 data is based on a normalised 52 week period
Robust Contract margin despite strong growth in Energy

FY OP £18.0m £21.2m £30.0m £25.1m £21.0m £29.8m £41.5m £41.3m £44.9m £20.4m
ADJUSTED
OPERATING
PROFIT
before
exceptional
items
CONVERSION
RATIO
adjusted
operating
profit before
exceptional
items as a %
of gross profit
£11.0m £7.1m £11.0m £9.1m £6.7m £8.4m£14.1m £15.3m £19.3m £20.4m
£7.0m £14.1m
£19.0m£16.0m
£14.3m£21.4m
£27.4m £26.0m£25.6m
£0m
£10m
£20m
£30m
£40m
£50m
2009 2010 2011 2012 2013 2014 2015 2016 2017 2018
H1 H2
11.8
%
9.6%
12.2
%
9.2%
7.1%
8.3%
12.8
%
12.8
%
14.4
%
13.7
%
10.5
%
12.8
%
15.3
%
12.2
%
10.9
%
13.7
%
17.6
%
16.0
%
15.6
%
2009 2010 2011 2012 2013 2014 2015 2016 2017 2018
HY FY
45
HISTORICAL OPERATING PROFIT & CONVERSION RATIO
Note 1: 2018 figures are adjusted for the impact of £2.4m of costs in relation to the relocation of UK central support function
Note 2: 2017 figures are adjusted for the impact of £6.7m of costs in relation to restructuring and relocation of UK central support functions
Note 3: 2016 figures are adjusted for the impact of £3.5m of costs in relation to the restructuring of certain sales businesses and central support functions
Note 4: 2015 figures were adjusted for the impact of £3.1m of costs in relation to restructuring Energy business and the impairment of IT assets
Note 5: 2013, 2014 and 2015 are before exceptional items Note 6: Includes data for IT Job Board up to 2011 Note 7: 2013 data is based on a normalised 52 week period

46
HEADCOUNT
Note 1: Headcount is now based on full time equivalent heads.
Note 2: Sales heads include consultants and sales management
May 10 Nov 10 May 11 Nov 11 May 12 Nov 12 May 13 Nov 13 May 14 Nov 14 May 15 Nov 15 May 16 Nov 16 May 17 Nov 17 May 18
Period End
Total Heads1,638 1,719 1,865 2,109 2,100 2,021 2,125 2,232 2,484 2,483 2,571 2,752 2,712 2,590 2,642 2,866 2,805
Period End
Sales Heads1,181 1,204 1,351 1,610 1,620 1,568 1,667 1,797 2,015 2,016 2,051 2,185 2,142 2,044 2,064 2,257 2,189
474 484 519 564 507 459 477 497 538 541 553 579 550 490 457 470 442
707 720832
1,046 1,1131,109
1,1901,300
1,477 1,475 1,4981,606 1,592
1,554 1,6071,787
1,747
May 10 Nov 10 May 11 Nov 11 May 12 Nov 12 May 13 Nov 13 May 14 Nov 14 May 15 Nov 15 May 16 Nov 16 May 17 Nov 17 May 18
UK Sales Heads Int'l Sales Heads

47
SALES HEADCOUNT
Note 1: Headcount is now based on full time equivalent heads
Note 2: Sales heads include consultants and sales management
May 10 Nov 10 May 11 Nov 11 May 12 Nov 12 May 13 Nov 13 May 14 Nov 14 May 15 Nov 15 May 16 Nov 16 May 17 Nov 17 May 18
Period End
Sales Heads1,181 1,204 1,351 1,610 1,620 1,568 1,667 1,797 2,015 2,016 2,051 2,185 2,142 2,044 2,064 2,257 2,189
481 458 529623 646 683
824 8941,009 1,067 1,124
1,270 1,299 1,280 1,3241,472 1,480
700 746822
987 974 885
843903
1,006 949 927
915 843764 740
785 710
May 10 Nov 10 May 11 Nov 11 May 12 Nov 12 May 13 Nov 13 May 14 Nov 14 May 15 Nov 15 May 16 Nov 16 May 17 Nov 17 May 18
Contract Sales Heads Permanent Sales Heads

79%
6%
2%5%
8%
Payroll Property Advertising IT & Professional Other
15%
85%
Support Services Sales
48
COST BASE ANALYSIS
Note 1: Based on costs for HY 2018
The Group has maintained its flexible cost base
Cost Base Payroll
Costs

SThree Capital
Markets Day
15 November 2017

50
5-year plan to 2022
Notes• 2017 numbers are FY consensus• Nothing in this presentation should be construed as a profit forecast. There is no certainty over profitability or timing of achieving the above and they are dependent upon a variety of assumptions and factors
both SThree specific and otherwise.They assume constant FX rates as of October 2017.

51
Key growth drivers

52
43 OFFICES IN 16 COUNTRIES
USA
Austin
Boston
Chicago
Houston
Minneapolis
New York
San Diego
San Francisco
Washington
USABELGIUM
Antwerp
Brussels
NETHERLANDS
Amsterdam
Eindhoven
Rotterdam
LUXEMBOURG
Luxembourg
FRANCE
Lille
Lyon
Paris
Toulouse
SPAIN
Barcelona
GERMANY
Berlin
Düsseldorf
Frankfurt
Hamburg
Munich
Stuttgart
SWITZERLAND
Zurich
AUSTRIA
Vienna
CONTINENTAL EUROPE
UK
Birmingham
Bristol
Glasgow
London
Leeds
Manchester
IRELAND
Dublin
UK & IRELAND
AUSTRALIA
Sydney
HONG KONG
Hong Kong
SINGAPORE
Singapore
JAPAN
Tokyo
Asia Pac & Middle East
UAE
Dubai