2015 Half-Year Results
37
2015 Half-Year Results Nancy McKinstry Chief Executive Officer and Chairman Kevin Entricken Chief Financial Officer July 29, 2015
-
Upload
wolters-kluwer -
Category
Investor Relations
-
view
736 -
download
0
Transcript of 2015 Half-Year Results

2015
Half-Year Results
Nancy McKinstry
Chief Executive Officer and Chairman
Kevin Entricken
Chief Financial Officer
July 29, 2015
This presentation contains forward-looking statements. These statements may be identified
by words such as "expect", "should", "could", "shall", and similar expressions. Wolters Kluwer
cautions that such forward-looking statements are qualified by certain risks and
uncertainties, that could cause actual results and events to differ materially from what is
contemplated by the forward-looking statements. Factors which could cause actual results to
differ from these forward-looking statements may include, without limitation, general
economic conditions, conditions in the markets in which Wolters Kluwer is engaged, behavior
of customers, suppliers and competitors, technological developments, the implementation
and execution of new ICT systems or outsourcing, legal, tax, and regulatory rules affecting
Wolters Kluwer's businesses, as well as risks related to mergers, acquisitions and divestments.
In addition, financial risks, such as currency movements, interest rate fluctuations, liquidity
and credit risks could influence future results. The foregoing list of factors should not be
construed as exhaustive. Wolters Kluwer disclaims any intention or obligation to publicly
update or revise any forward-looking statements, whether as a result of new information,
future events or otherwise.
Growth rates are cited in constant currencies unless otherwise noted.
Forward-looking Statements
2 2015 Half-Year Results

Introduction
Financial Review
Strategic and Operating Review
Outlook 2015
Appendix
Agenda
3 2015 Half-Year Results

Introduction
4 2015 Half-Year Results
Good first half results
– Organic growth +2% and underlying margin increase
– Diluted adjusted EPS up +5% at constant currencies
Progress on strategic objectives
– Leading high growth positions delivered 7% organic growth
– Digital & services revenues grew 5% organic
– Delivering innovative products; stepping up investment
– Expanded operational excellence programs
– Combining Corporate Legal Services and Financial & Compliance Services
On track to meet full year guidance
– Reiterating guidance
– Introduction of interim dividend aligning more closely with timing of operating cash flow

Introduction
Financial Review
Strategic and Operating Review
Outlook 2015
Appendix
Agenda
5 2015 Half-Year Results

Half-year 2015 results On course to meet full year guidance
(€ million, unless otherwise stated) HY 2015 HY 2014 ∆ ∆ CC ∆ OG
Revenues 2,015 1,716 +17% +3% +2%
Adjusted operating profit 391 313 +25% +5% +4%
Adjusted operating profit margin 19.4% 18.2%
Diluted adjusted EPS €0.79 €0.63 +24% +5%
Adjusted free cash flow 170 136 +25% -1%
Net-debt-to-EBITDA1) ratio 2.1x 2.6x
∆: % Change; ∆ CC: % Change constant currencies (EUR/USD 1.33); ∆ OG: % Organic growth.
1) Based on rolling twelve months’ EBITDA
6 2015 Half-Year Results

(€ million) HY 2015 HY 2014 ∆ ∆ CC ∆ OG
Legal & Regulatory 792 710 +12% +2% 0%
Tax & Accounting 529 454 +17% +3% +3%
Health 465 365 +27% +5% +5%
Financial & Compliance Services 229 187 +22% +5% +5%
Total revenues 2,015 1,716 +17% +3% +2%
HY 2015 Revenues
Revenues by division Organic growth driven by three divisions
7
Legal & Regulatory
39%
Tax & Accounting
26%
Health 23%
F&CS 12%
∆: % Change; ∆ CC: % Change constant currencies (EUR/USD 1.33); ∆ OG: % Organic growth
2015 Half-Year Results

Revenues by region Growth in North America and Asia Pacific outweighed decline in Europe
North America
59%
Europe 33%
AsiaPac & ROW
8%
HY 2015 Revenues
8
∆ OG:
+5% (+1%)
(€ million) HY 2015 HY 2014 ∆ ∆ CC ∆ OG
North America 1,191 921 +29% +6% +5%
Europe 667 666 0% -1% -2%
AsiaPac & ROW 157 129 +22% +6% +6%
Total revenues 2,015 1,716 +17% +3% +2%
∆: % Change; ∆ CC: % Change constant currencies (EUR/USD 1.33); ∆ OG: % Organic growth
Legend:
∆ OG - % Organic Growth HY 2015 (HY 2014)
∆ OG:
-2% (0%)
∆ OG:
+6% (+6%)
2015 Half-Year Results
Digital 71%
Services 13%
Print 16%
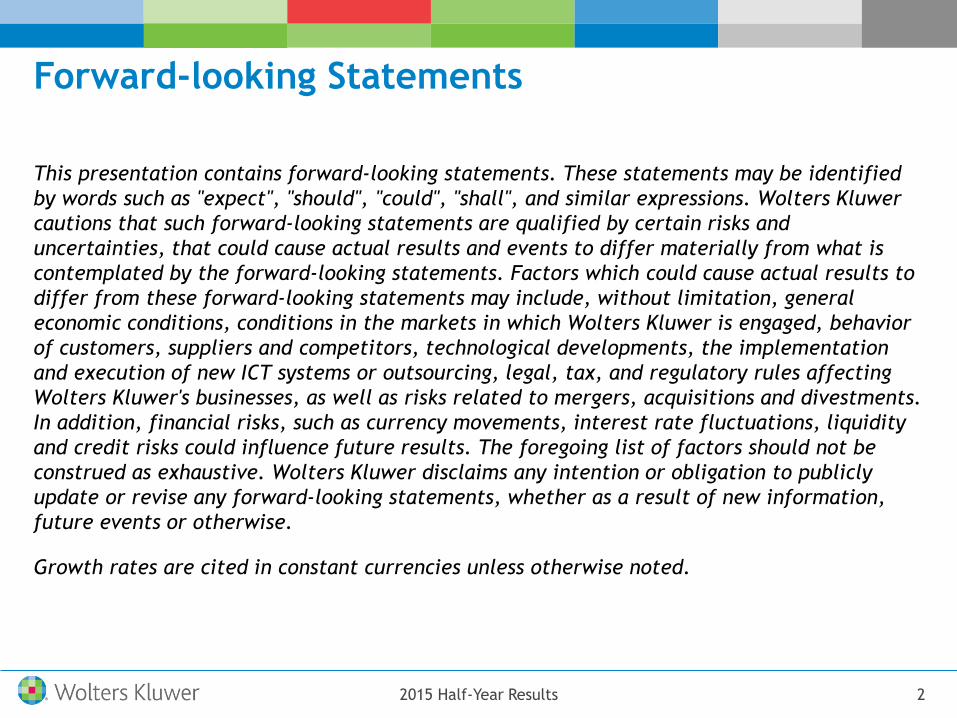
Revenues by media format Digital and services up 5% organically, now 84% of total
(€ million) HY 2015 HY 2014 ∆ ∆ CC ∆ OG
Digital 1,424 1,157 +23% +7% +6%
Services 271 230 +18% 0% +1%
Print 320 329 -3% -10% -9%
Total revenues 2,015 1,716 +17% +3% +2%
HY 2015 Revenues
9
∆: % Change; ∆ CC: % Change constant currencies (EUR/USD 1.33); ∆ OG: % Organic growth. Breakdown by media format reflects updated product classifications
introduced in 2014
2015 Half-Year Results

(€ million) HY 2015 HY 2014 ∆ ∆ CC ∆ OG Margin
HY 2015
Margin
HY 2014
Legal & Regulatory 141 128 +10% -7% -9% 17.8% 18.0%
Tax & Accounting 143 106 +35% +17% +16% 27.0% 23.4%
Health 93 73 +27% +4% +4% 19.9% 19.9%
Financial & Compliance Services 36 28 +31% +11% +11% 15.9% 14.8%
Corporate (22) (22) -1% -4% -4%
Adjusted operating profit 391 313 +25% +5% +4% 19.4% 18.2%
HY 2015 Adjusted Operating Profit
Adjusted operating profit Adjusted operating profit margin increased due to T&A and F&CS
10
Legal & Regulatory
34%
Tax & Accounting
35%
Health 22%
F&CS 9%
∆: % Change; ∆ CC: % Change constant currencies (EUR/USD 1.33); ∆ OG: % Organic growth
* Excluding corporate
2015 Half-Year Results
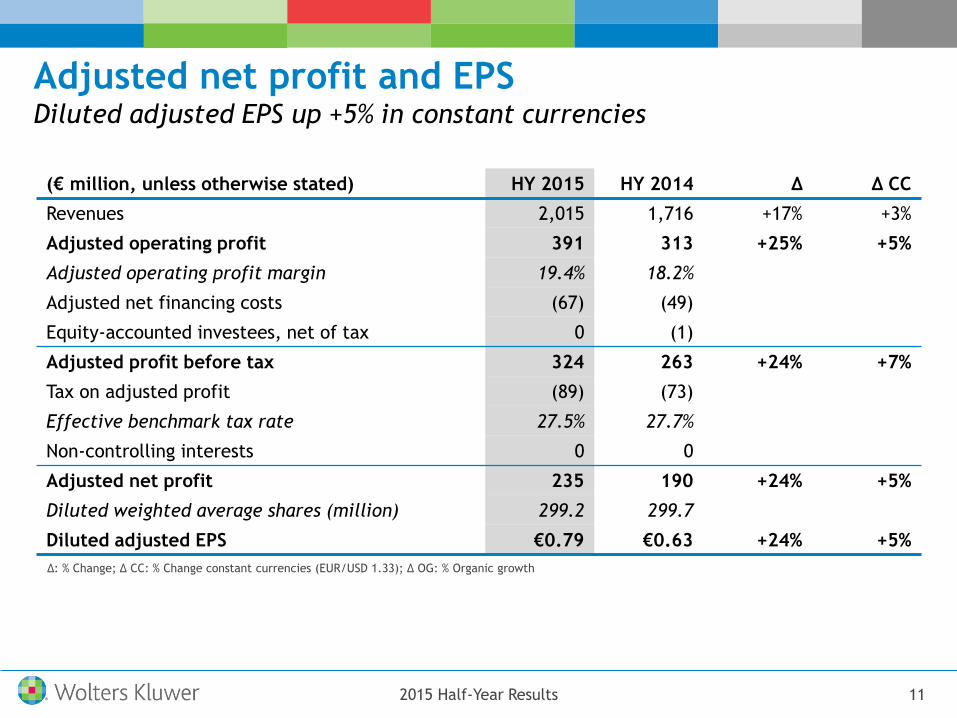
Adjusted net profit and EPS Diluted adjusted EPS up +5% in constant currencies
(€ million, unless otherwise stated) HY 2015 HY 2014 ∆ ∆ CC
Revenues 2,015 1,716 +17% +3%
Adjusted operating profit 391 313 +25% +5%
Adjusted operating profit margin 19.4% 18.2%
Adjusted net financing costs (67) (49)
Equity-accounted investees, net of tax 0 (1)
Adjusted profit before tax 324 263 +24% +7%
Tax on adjusted profit (89) (73)
Effective benchmark tax rate 27.5% 27.7%
Non-controlling interests 0 0
Adjusted net profit 235 190 +24% +5%
Diluted weighted average shares (million) 299.2 299.7
Diluted adjusted EPS €0.79 €0.63 +24% +5%
∆: % Change; ∆ CC: % Change constant currencies (EUR/USD 1.33); ∆ OG: % Organic growth
11 2015 Half-Year Results

IFRS profit and diluted EPS Reported EPS down 19% due to lack of exceptional gains and foreign
exchange loss
(€ million, unless otherwise stated) HY 2015 HY 2014 ∆
Adjusted operating profit 391 313 +25%
Amortization of acquired intangibles (106) (92)
Results on divestments of operations 0 (1)
Acquisition integration costs and other non-benchmark items (4) (6)
Operating profit 281 214 +31%
Financing results1) (69) 25
Share of profit of equity-accounted investees, net of tax 0 (1)
Profit before tax 212 238 -11%
Income tax expense (50) (38)
Effective tax rate 23.4% 15.8%
Profit for the period 162 200 -19%
Non-controlling interests 1 1
Profit for the period to the owners of the Company 163 201 -19%
Diluted EPS €0.55 €0.67 -19%
∆: % Change
1) HY 2015 financing results include employee benefits financing costs of €3 million (HY 2014: €2 million). HY 2014 financing results included a €76 million revaluation
gain on our minority interest in Datacert
12 2015 Half-Year Results

Adjusted free cash flow FCF broadly stable at constant currency
(€ million, unless otherwise stated) HY 2015 HY 2014 ∆ ∆ CC
Adjusted operating profit 391 313 +25% +5%
Depreciation and amortization of other intangibles 78 67
Adjusted EBITDA 469 380 +23% +4%
Capital expenditure (84) (63)
Autonomous movements in working capital (45) (22)
Adjusted operating cash flow 340 295 +15% 0%
Cash conversion ratio 87% 94%
Paid financing costs (82) (110)
Paid corporate income tax (68) (56)
Net change in restructuring provision (4) (4)
Other1) (16) 11
Adjusted free cash flow 170 136 +25% -1%
Springboard, net of tax2) - (2)
Adjusted free cash flow, incl. Springboard 170 134 +23% -3%
∆: % Change; ∆ CC: % Change constant currencies (EUR/USD 1.33)
1) Other includes share-based payments, dividends received, and other items. In addition, in HY 2015, it includes an adjustment to remove a €22 million tax
benefit relating to previously divested assets and a €5 million tax payment relating to last year’s consolidation of platform technology.
2) In 2014, appropriation of Springboard provisions was treated as a non-benchmark item. In 2015, use of Springboard provisions (€1 million) is included in
adjusted free cash flow. Adjusted free cash flow excludes additions to provisions related to acquisitions.
13 2015 Half-Year Results
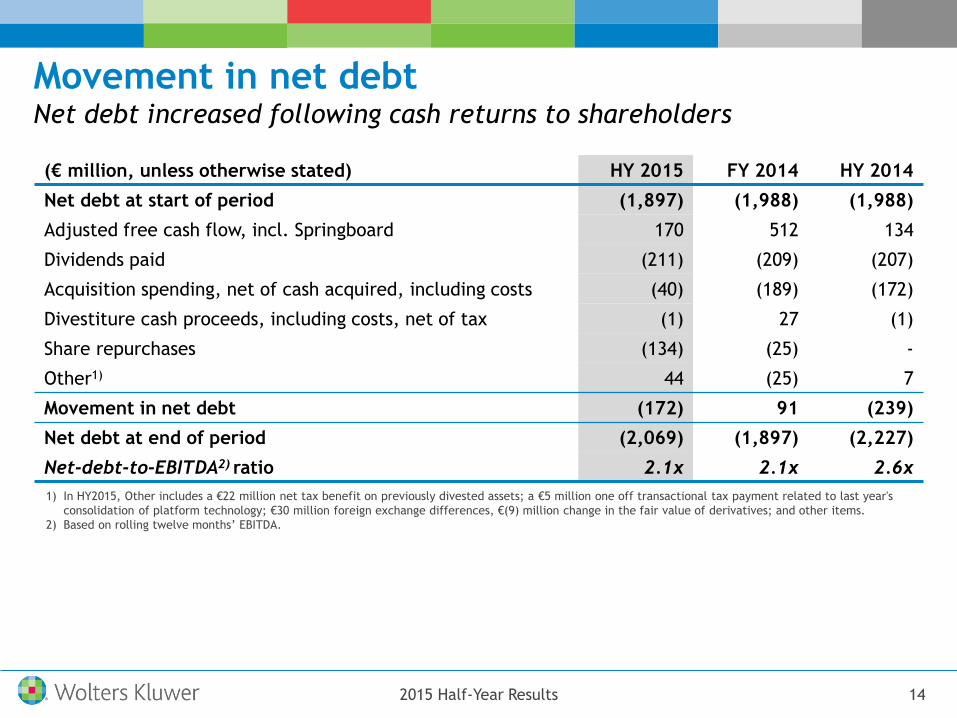
Movement in net debt Net debt increased following cash returns to shareholders
(€ million, unless otherwise stated) HY 2015 FY 2014 HY 2014
Net debt at start of period (1,897) (1,988) (1,988)
Adjusted free cash flow, incl. Springboard 170 512 134
Dividends paid (211) (209) (207)
Acquisition spending, net of cash acquired, including costs (40) (189) (172)
Divestiture cash proceeds, including costs, net of tax (1) 27 (1)
Share repurchases (134) (25) -
Other1) 44 (25) 7
Movement in net debt (172) 91 (239)
Net debt at end of period (2,069) (1,897) (2,227)
Net-debt-to-EBITDA2) ratio 2.1x 2.1x 2.6x
14 2015 Half-Year Results
1) In HY2015, Other includes a €22 million net tax benefit on previously divested assets; a €5 million one off transactional tax payment related to last year's
consolidation of platform technology; €30 million foreign exchange differences, €(9) million change in the fair value of derivatives; and other items.
2) Based on rolling twelve months’ EBITDA.
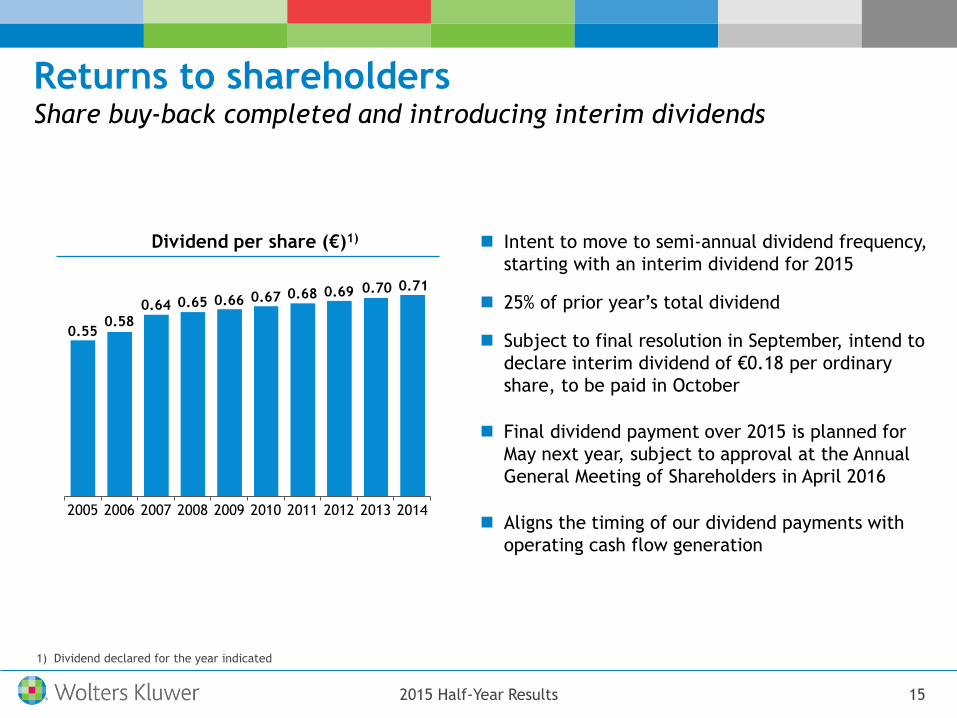
Returns to shareholders Share buy-back completed and introducing interim dividends
15 2015 Half-Year Results
Dividend per share (€)1)
0.55 0.58
0.64 0.65 0.66 0.67 0.68 0.69 0.70 0.71
2005 2006 2007 2008 2009 2010 2011 2012 2013 2014
1) Dividend declared for the year indicated
Intent to move to semi-annual dividend frequency,
starting with an interim dividend for 2015
25% of prior year’s total dividend
Subject to final resolution in September, intend to
declare interim dividend of €0.18 per ordinary
share, to be paid in October
Final dividend payment over 2015 is planned for
May next year, subject to approval at the Annual
General Meeting of Shareholders in April 2016
Aligns the timing of our dividend payments with
operating cash flow generation

Revenues up +2% organically
― Leading, high growth positions +7%
― Digital & services revenues +5%
Adjusted operating profit of €391 million
― Underlying margin increase
Diluted adjusted EPS €0.79, up +5% in constant currencies
Adjusted free cash flow of €170 million
Net-debt-to-EBITDA ratio of 2.1x
Summary On course to meet full year guidance
16 2015 Half-Year Results
Introduction
Financial Review
Strategic and Operating Review
Outlook 2015
Appendix
Agenda
17 2015 Half-Year Results
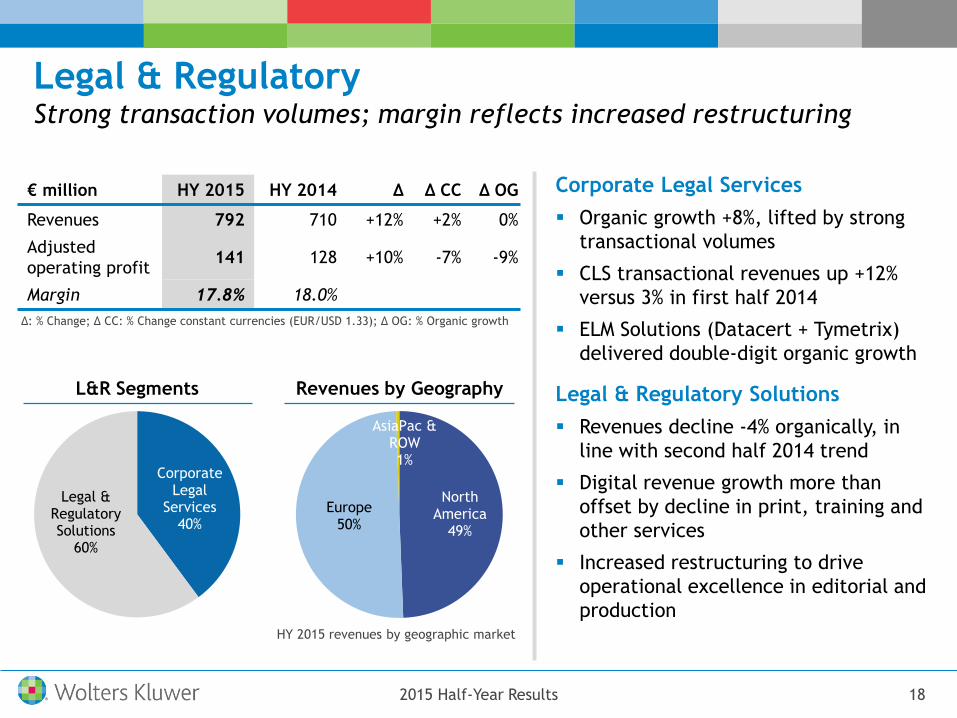
18
Corporate Legal
Services 40%
Legal & Regulatory Solutions
60%
North America
49%
Europe 50%
AsiaPac & ROW 1%
HY 2015 revenues by geographic market
L&R Segments Revenues by Geography
€ million HY 2015 HY 2014 Δ Δ CC Δ OG
Revenues 792 710 +12% +2% 0%
Adjusted
operating profit 141 128 +10% -7% -9%
Margin 17.8% 18.0%
∆: % Change; ∆ CC: % Change constant currencies (EUR/USD 1.33); ∆ OG: % Organic growth
2015 Half-Year Results
Corporate Legal Services
Organic growth +8%, lifted by strong
transactional volumes
CLS transactional revenues up +12%
versus 3% in first half 2014
ELM Solutions (Datacert + Tymetrix)
delivered double-digit organic growth
Legal & Regulatory Solutions
Revenues decline -4% organically, in
line with second half 2014 trend
Digital revenue growth more than
offset by decline in print, training and
other services
Increased restructuring to drive
operational excellence in editorial and
production
Legal & Regulatory Strong transaction volumes; margin reflects increased restructuring
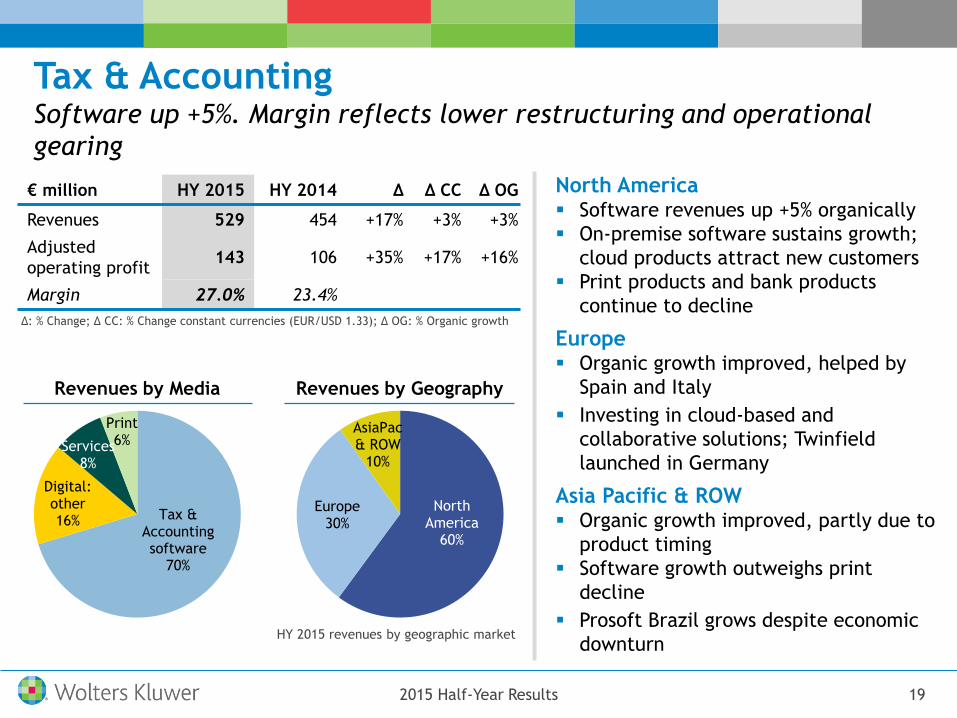
Tax & Accounting software
70%
Digital: other 16%
Services 8%
Print 6%
Tax & Accounting Software up +5%. Margin reflects lower restructuring and operational
gearing
19
North America
60%
Europe 30%
AsiaPac & ROW
10%
Revenues by Media Revenues by Geography
HY 2015 revenues by geographic market
€ million HY 2015 HY 2014 Δ Δ CC Δ OG
Revenues 529 454 +17% +3% +3%
Adjusted
operating profit 143 106 +35% +17% +16%
Margin 27.0% 23.4%
∆: % Change; ∆ CC: % Change constant currencies (EUR/USD 1.33); ∆ OG: % Organic growth
2015 Half-Year Results
North America Software revenues up +5% organically
On-premise software sustains growth;
cloud products attract new customers
Print products and bank products
continue to decline
Europe Organic growth improved, helped by
Spain and Italy
Investing in cloud-based and
collaborative solutions; Twinfield
launched in Germany
Asia Pacific & ROW Organic growth improved, partly due to
product timing
Software growth outweighs print
decline
Prosoft Brazil grows despite economic
downturn
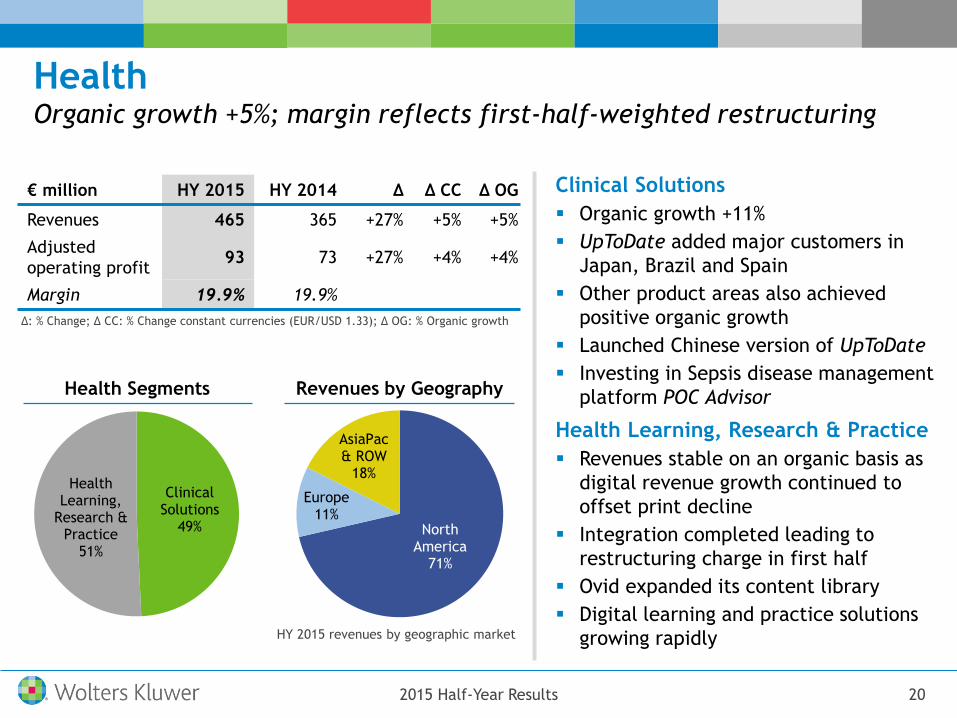
Health Organic growth +5%; margin reflects first-half-weighted restructuring
20
Clinical Solutions
49%
Health Learning,
Research & Practice
51%
North America
71%
Europe 11%
AsiaPac & ROW
18%
Health Segments Revenues by Geography
HY 2015 revenues by geographic market
€ million HY 2015 HY 2014 Δ Δ CC Δ OG
Revenues 465 365 +27% +5% +5%
Adjusted
operating profit 93 73 +27% +4% +4%
Margin 19.9% 19.9%
∆: % Change; ∆ CC: % Change constant currencies (EUR/USD 1.33); ∆ OG: % Organic growth
2015 Half-Year Results
Clinical Solutions
Organic growth +11%
UpToDate added major customers in
Japan, Brazil and Spain
Other product areas also achieved
positive organic growth
Launched Chinese version of UpToDate
Investing in Sepsis disease management
platform POC Advisor
Health Learning, Research & Practice
Revenues stable on an organic basis as
digital revenue growth continued to
offset print decline
Integration completed leading to
restructuring charge in first half
Ovid expanded its content library
Digital learning and practice solutions
growing rapidly
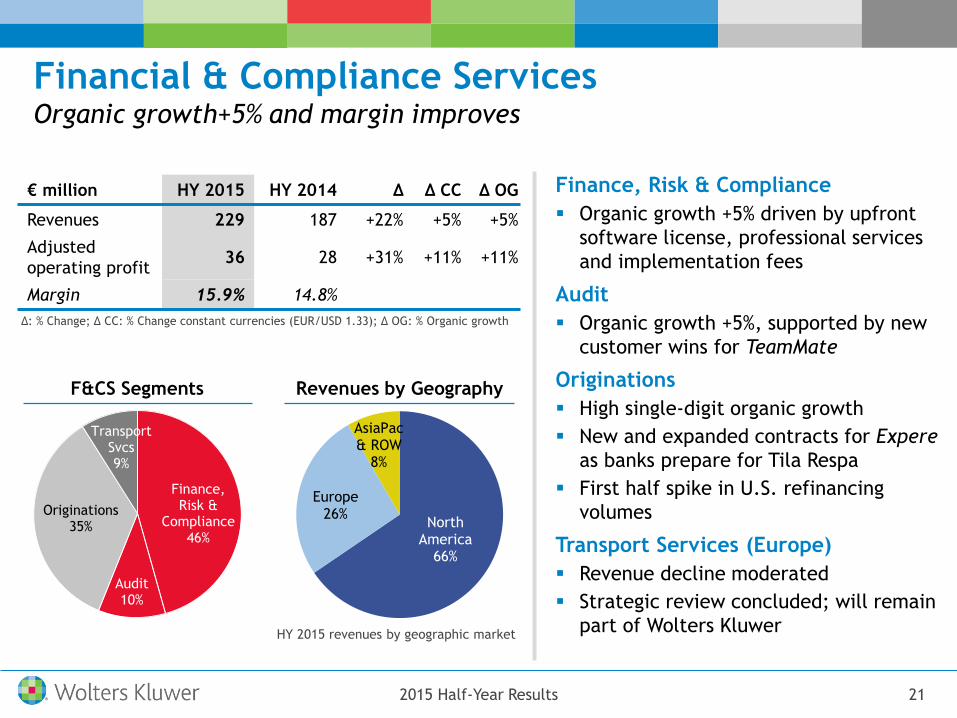
Financial & Compliance Services Organic growth+5% and margin improves
21
Originations 35%
Finance, Risk &
Compliance 46%
Audit 10%
Transport Svcs 9%
North America
66%
Europe 26%
AsiaPac & ROW
8%
F&CS Segments Revenues by Geography
HY 2015 revenues by geographic market
€ million HY 2015 HY 2014 Δ Δ CC Δ OG
Revenues 229 187 +22% +5% +5%
Adjusted
operating profit 36 28 +31% +11% +11%
Margin 15.9% 14.8%
∆: % Change; ∆ CC: % Change constant currencies (EUR/USD 1.33); ∆ OG: % Organic growth
2015 Half-Year Results
Finance, Risk & Compliance
Organic growth +5% driven by upfront
software license, professional services
and implementation fees
Audit
Organic growth +5%, supported by new
customer wins for TeamMate
Originations
High single-digit organic growth
New and expanded contracts for Expere
as banks prepare for Tila Respa
First half spike in U.S. refinancing
volumes
Transport Services (Europe)
Revenue decline moderated
Strategic review concluded; will remain
part of Wolters Kluwer
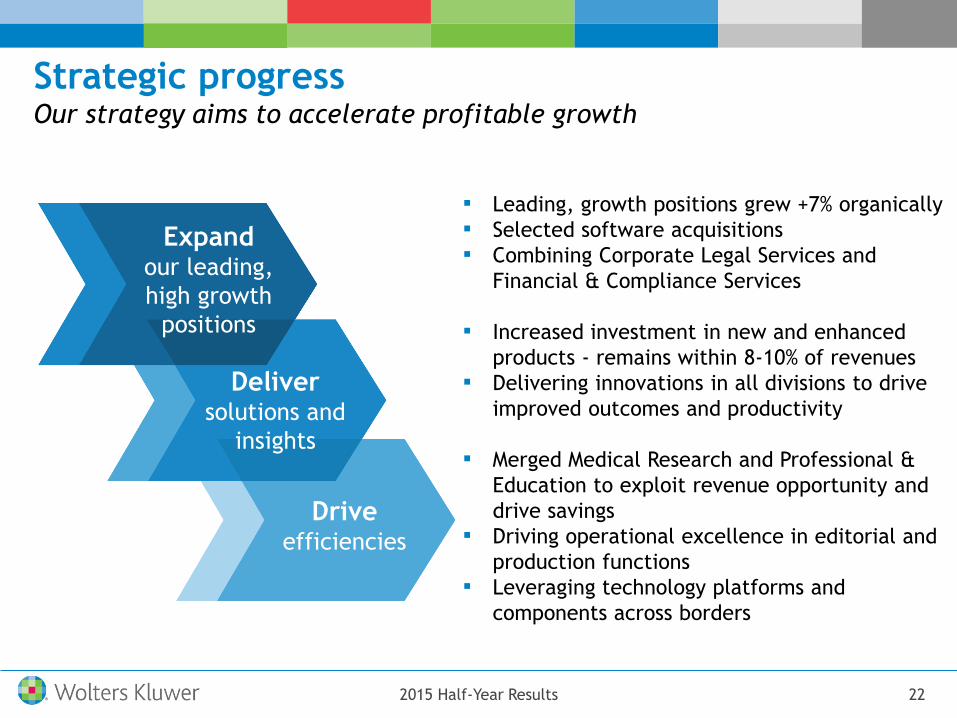
Strategic progress Our strategy aims to accelerate profitable growth
22
▪ Leading, growth positions grew +7% organically
▪ Selected software acquisitions
▪ Combining Corporate Legal Services and
Financial & Compliance Services
▪ Increased investment in new and enhanced
products - remains within 8-10% of revenues
▪ Delivering innovations in all divisions to drive
improved outcomes and productivity
▪ Merged Medical Research and Professional &
Education to exploit revenue opportunity and
drive savings
▪ Driving operational excellence in editorial and
production functions
▪ Leveraging technology platforms and
components across borders
Expand
our leading,
high growth
positions
Deliver
solutions and
insights
Drive
efficiencies
2015 Half-Year Results

1. Expand our leading, high growth positions Our leading, high growth positions in total grew +7% organically
Health
Tax & Accounting
Legal & Regulatory
Financial & Compliance
Services
40%
70%
49%
56% Finance, Risk &
Compliance and Audit1)
+8%
+5%
+11%
+5%
Clinical Solutions
Tax & Accounting Software
Corporate Legal Services
1) Includes the Finance, Risk & Compliance and Audit units within the F&CS division
23
Total
organic
growth:
+7%
Wolters Kluwer Revenue HY 2015
Leading, high growth units within divisions (52% of total revenues)
Divisions: Organic Growth: % of division:
2015 Half-Year Results

2. Deliver solutions and insights Improve our customers’ productivity and outcomes
Tailored to
customer needs
Increases mobility and
productivity
Driving improved
outcomes
24
CCH iFirm Practice Manager
Cloud-based practice
management solution for tax
and accounting firms
TILA-RESPA
Loan origination and
documentation software
enhanced to be TILA-RESPA
compliant
2015 Half-Year Results
Expere® ComplianceOne®
UpToDate Clinical Consultant
UpToDate clinical decision
support with 3,100 topics in
Chinese and integrated with
Medicom (drug information)
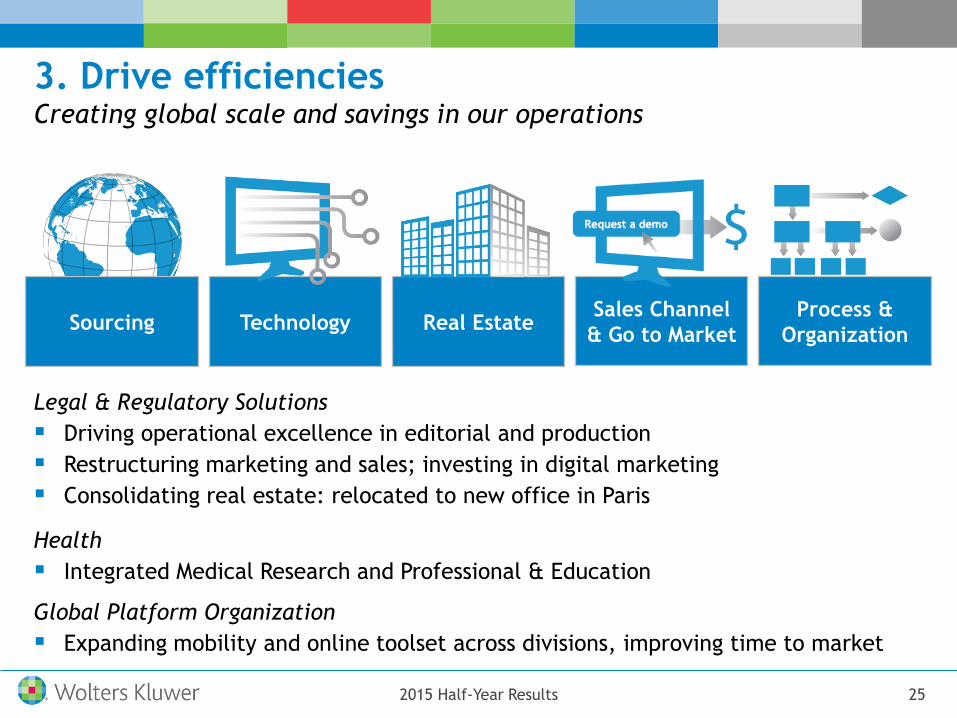
3. Drive efficiencies Creating global scale and savings in our operations
25
Sourcing Technology Real Estate Sales Channel
& Go to Market
Process &
Organization
Legal & Regulatory Solutions
Driving operational excellence in editorial and production
Restructuring marketing and sales; investing in digital marketing
Consolidating real estate: relocated to new office in Paris
Health
Integrated Medical Research and Professional & Education
Global Platform Organization
Expanding mobility and online toolset across divisions, improving time to market
2015 Half-Year Results

Introduction
Financial Review
Strategic and Operating Review
Outlook 2015
Appendix
Agenda
26 2015 Half-Year Results

Divisional Outlook 2015
27
Legal & Regulatory
Corporate Legal Services to see organic growth, albeit at a more
moderate pace in the second half
Continued revenue decline in Legal & Regulatory Solutions
Margins constrained by cost inflation, restructuring and investments
Tax & Accounting
Revenue growth similar to 2014, with growth in software solutions
more than offsetting decline in print and bank products
Margin expected to improve even with increased product
investments
Health
Steady revenue growth, driven by robust growth in Clinical Solutions
Health Learning, Research & Practice likely to see growth in digital
offset by continued decline in print
Margins to rise despite increased investments and restructuring
Financial & Compliance
Services
Positive organic growth driven by Finance, Risk & Compliance and
Audit units, with challenging comparables in the second half
In Originations, outlook for mortgage volumes remains mixed, but
new U.S. lending regulations are providing opportunities for growth
2015 Half-Year Results

Guidance 2015
Performance indicators FY 2015 Guidance
Adjusted operating profit margin 21.0%–21.5%
Adjusted free cash flow €500-€525 million
Return on invested capital ≥ 8%
Diluted adjusted EPS Mid-single-digit growth
Guidance for adjusted free cash flow and diluted adjusted EPS is in constant currencies (EUR/USD 1.33). Guidance for EPS growth reflects the
announced share repurchases. Adjusted operating profit margin and ROIC are in reported currency
28 2015 Half-Year Results

Q&A
Nancy McKinstry
Chief Executive Officer and Chairman
Kevin Entricken
Chief Financial Officer
Appendix
Nancy McKinstry
Chief Executive Officer and Chairman
Kevin Entricken
Chief Financial Officer
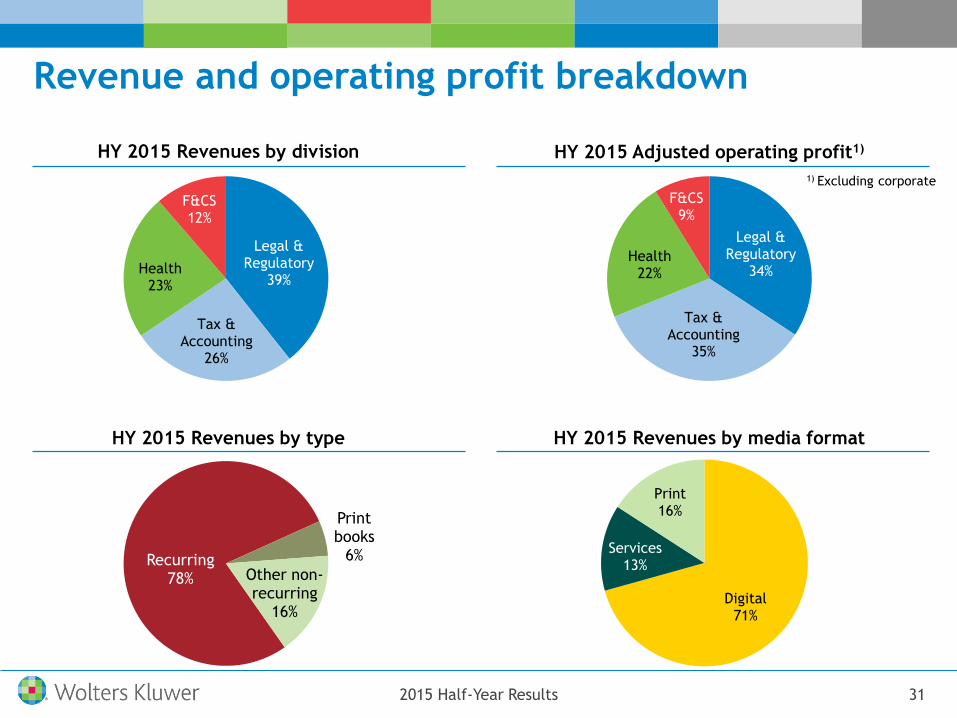
Legal & Regulatory
39%
Tax & Accounting
26%
Health 23%
F&CS 12%
Revenue and operating profit breakdown
HY 2015 Revenues by division
1) Excluding corporate
HY 2015 Adjusted operating profit1)
HY 2015 Revenues by type
Digital 71%
Services 13%
Print 16%
HY 2015 Revenues by media format
Legal & Regulatory
34%
Tax & Accounting
35%
Health 22%
F&CS 9%
31
Recurring 78%
Print books
6%
Other non-recurring
16%
2015 Half-Year Results

Recurring 78%
Print books
6%
Other non-recurring
16%
Revenues by type
(€ million) HY 2015 HY 2014 ∆ ∆ CC ∆ OG
Digital and services subscriptions 1,250 1,022 +22% +7% +5%
Print subscriptions 159 172 -8% -12% -10%
Other recurring 162 140 +16% -2% -3%
Recurring revenues 1,571 1,334 +18% +4% +3%
Print books 112 114 -1% -11% -10%
CLS transactional 139 101 +39% +14% +12%
FS transactional 21 17 +24% +1% +1%
Other non-recurring 172 150 +14% +2% +3%
Total revenues 2,015 1,716 +17% +3% +2%
HY 2015 Revenues
32
∆: % Change; ∆ CC: % Change constant currencies (EUR/USD 1.33); ∆ OG: % Organic growth. Breakdown by revenue type reflects updated product classifications
introduced in 2014
2015 Half-Year Results

Reconciliation: Adjusted net financing costs to
financing results
33
(€ million) HY 2015 HY 2014
Adjusted net financing costs (67) (49)
Employee benefits financing component (2) (2)
Revaluation gain on minority interest in Datacert - 76
Financing results (69) 25
2015 Half-Year Results

(€ million, unless otherwise stated) June 30, 2015 Dec. 31, 2014 June 30, 2014
Goodwill and intangible assets 5,398 5,172 4,840
Equity-accounted investees and financial assets 31 32 42
Other non-current assets 229 216 212
Non-current assets 5,658 5,420 5,094
Cash and cash equivalents 510 535 280
Other current assets 1,263 1,412 1,060
Deferred income (1,362) (1,375) (1,152)
Short-term borrowings and bank overdrafts (286) (125) (192)
Other current liabilities (723) (924) (663)
Working capital (598) (477) (667)
Capital employed 5,060 4,943 4,427
Total equity 2,203 2,121 1,611
Long-term debt 2,308 2,304 2,310
Other non-current liabilities 549 518 506
Total financing 5,060 4,943 4,427
Closing rate EUR/USD 1.12 1.21 1.36
Balance Sheet
34 2015 Half-Year Results

Debt maturity profile
35
510
284
1 12 3
750
247
696
396
203
HY 2015 2015 2016 2017 2018 2019 2020 2021 2022 2023 2024 2025 >2025
Debt Maturity Profile (€ million)
Cash & cash
equivalents +
€13 million collateral
posted
13
2015 Half-Year Results

Currency
36
Average rates
Impact
revenue
Impact
adjusted
operating
profit
1 Euro HY 2015 HY 2014 HY 2015 HY 2015
U.S. Dollar 1.12 1.37 231 60
British Pound 0.73 0.82 7 1
Canadian Dollar 1.38 1.51 3 1
Australian Dollar 1.43 1.50 1 0
Brazilian Real, Russian Ruble and other 2 0
Total impact (€ million) 244 62
By division:
Legal & Regulatory 72 22
Tax & Accounting 60 19
Health 80 17
Financial &
Compliance Services 32 5
Total 244 62
2015 Half-Year Results

Sensitivity to U.S. Dollar
37
Impact of a 1% weakening of the U.S. Dollar against the Euro
(€ million) 2014
Revenues (21)
Adjusted operating profit (6)
Adjusted net profit (3)
Adjusted FCF (4)
Diluted adjusted EPS (Euro) (0.01)
Does not include the impact of other currency exposures
Does not include the impact of exchange rate movements on year-end valuation of intercompany balances
2015 Half-Year Results