HALF YEAR RESULTS PRESENTATION 2017
47
FULL YEAR RESULS PRESENTATION 2016 RESULTS FOR THE YEAR ENDED 30 NOVEMBER 2016 HALF YEAR RESULTS PRESENTATION 2017 RESULTS FOR THE SIX MONTHS ENDED 31 MAY 2017
Transcript of HALF YEAR RESULTS PRESENTATION 2017

FULL YEAR RESULS PRESENTATION 2016
RESULTS FOR THE YEAR ENDED 30 NOVEMBER 2016
HALF YEAR RESULTSPRESENTATION 2017
RESULTS FOR THE SIX MONTHS ENDED 31 MAY 2017

2
2017 Overview
• Encouraging first half performance with accelerated momentum in Q2
• Adjusted operating profit +26% to £19.3m (+5%* at constant currency and +8%* excluding innovation spend)
• GP up 2%* YoY and up 12% on a reported basis
• 80% of GP now generated outside UK&I (FY 2016: 75%)
• Contract GP up 8%* YoY against strong comparatives (+11%* YoY in H1 2016)
• Contract now accounts for 70% of Group GP (FY 2016: 67%)
• Permanent productivity improved by 8%* YoY, with GP down 10%* YoY
• USA our second largest region for the first time (22% of Group GP)
• Adjusted basic EPS up 29% YoY
• Net cash £5.2m (H1 2016: net debt £4.4m)
• Interim dividend maintained
* Growth is at constant currency
H1 2017 YTD Innovation spend £0.6m

3
FINANCIAL RESULTS

4
FINANCIAL HIGHLIGHTS
*Growth is at constant currency, on an adjusted basis
Note 1: Conversion ratio = operating profit expressed as a % of gross profit
Note 2: 2016 figures are adjusted for the impact of £2.3m of costs in relation to the restructuring of certain sales businesses and central support functions
As Reported Adjusted As Reported Adjusted Adjusted
HY 2017 HY 2016 HY 2016 Actual Growth CC Growth*
Revenue £521.0m £443.5m £443.5m +17% +7%
Contract gross profit £94.2m £79.7m £79.7m +18% +8%
Permanent gross profit £40.2m £40.1m £40.1m - -10%
Total gross profit £134.4m £119.8m £119.8m +12% +2%
Operating profit £19.3m £15.3m £13.0m +26% +5%
Conversion ratio 14.4% 12.8% 10.9% +1.6%pts +0.3%pts
Net finance expense (£0.2m) (£0.2m) (£0.2m)
Profit before tax £19.2m £15.1m £12.8m +27% +5%
Taxation (£5.0m) (£4.1m) (£3.5m)
Profit after tax £14.2m £11.0m £9.3m +29% +6%
Basic earnings per share 11.0p 8.6p 7.3p +29% +6%
Interim dividend per share 4.7p 4.7p 4.7p - -
Net cash £5.2m (£4.4m) (£4.4m)

5
BALANCE SHEET
Robust Balance Sheet
£50m revolving credit facility with HSBC and Citibank, which is committed to 2019
A seasonal reduction in net cash
30 May 30 November
2017 2016
Intangible assets £11.6m £11.6m
Property, plant & equipment £6.7m £7.1m
Investments £0.7m £0.7m
Deferred tax assets £2.7m £2.5m
Net working capital £51.2m £50.3m
Provisions (£5.3m) (£5.8m)
Net current tax liabilities (£2.5m) (£0.7m)
£65.1m £65.7m
Net cash £5.2m £10.0m
Net assets £70.3m £75.7m

6
CASH FLOW BRIDGE
Seasonal outflow of working capital, along with treasury share purchases, lead to a net cash outflow
YE 2016 Net
Cash
Operating
profit
Depn and
amort
Share
awards
Share
transactions
Exceptional
/ adjusted
items
Foreign
exchange
Treasury
shares
purchased
Capex &
Prepaid
investment
Taxes and
interest
Dividends Working
capital
HY 2017 net
cash
£10.0m
£19.3m£2.9m
£1.4m£0.1m
(£0.1m)
(£0.3m)
(£3.4m)
(£3.4m)
(£3.6m)
(£6.0m)
(£11.7m)
£5.2m

7
EARNINGS PER SHARE AND DIVIDENDS
Note 1: 2016 figures are adjusted for the impact of £2.3m of costs in relation to the restricting of certain sales businesses and central support function
Adjusted EPS up 29% and dividends maintained YoY
As Reported Adjusted As Reported Adjusted As Reported
HY 2017 HY 2016 HY 2016 Actual Growth Actual Growth
Profit after tax £14.2m £11.0m £9.3m +29% +53%
For basic EPS 128.7m 128.5m 128.5m - -
Dilutive impact of share plans 4.7m 5.0m 5.0m
Fully diluted EPS 133.4m 133.5m 133.5m - -
Basic 11.0p 8.6p 7.3p +29% +51%
Diluted 10.6p 8.2p 7.0p +29% +51%
DPS Interim Ordinary 4.7p 4.7p 4.7p - -
Weighted
average
number of
shares
EPS

8
FOREIGN EXCHANGE IMPACT
For HY 2017, currency movements versus Sterling provided a strong tailwind for the reported performance of the Group with the highest impact coming from Eurozone countries. The exchange rate
movements increased our HY 2017 reported GP and operating profit by circa £12.7m and £3.3m, respectively.
Average Closing Average Closing Average Closing
EUR € 1.18 1.15 1.32 1.31 +10.7% +12.8%
USD $ 1.25 1.29 1.45 1.46 +13.4% +12.0%
Gross
Profit
Operating
Profit
Gross
Profit
Operating
Profit
EUR € £698k £208k £591k £191k
USD $ £297k £78k £220k £9k
Six months ended Six months ended YoY Exchange
31 May 2017 31 May 2016 Rate Movement
Six months ended Six months ended
31 May 2017 31 May 2016
Impact of a 1% change

9
OPERATING REVIEW

10
2017 PRIORITIES
* Growth is at constant currency
Progress
Strategic investment inContract
• Record contract runners at half-year end
• Fourteenth consecutive quarter of GP growth
• Contract now 70% of GP (FY 2016: 67%)
• Contract represents 64% of sales headcount (FY 2016: 63%), our highest ever
Drive recovery in Permanent productivity
• Successful focus on improving productivity, up 8%* YoY
• Restructure of Permanent business operating model to focus on higher yielding markets and lower
cost delivery
Broaden capabilities in high growth US markets
• GP up 16%* YoY with Contract up 17%* and Permanent up 14%*
• Double digit growth achieved across all sectors except Banking & Finance
• Our second largest region, representing 22% of our Group GP
Accelerate sector diversification in key STEM growth markets
• Strong performances from Life Sciences, Energy, Engineering and ICT (predominantly Continental
Europe)
• Exciting ICT opportunities outside UK and Europe
Build scale and critical mass in global network
• Growth driven by increased returns from existing locations
• New office opened in Vienna
Focus on costs and efficiencies to improve operational gearing
• On going review of support infrastructure and tight control of costs
• Improving productivity per sales head (Contract and Permanent), up 9%* YoY

DIVISION
DIVERSIFICATION
GEOGRAPHICAL
DIVERSIFICATION
SECTOR
DIVERSIFICATION
70%
30%
Cont
Perm
67%
33%
Cont
Perm
20%
51%
22%
7%
25%
49%
20%
6%
UK&IC EuropeUSAAPAC & ME
44%
15%
9%
9%
21%
2%
45%
16%
8%
9%
21%
1%
ICT
Banking & Finance
Energy
Engineering
Life Sciences
Other
11
BUSINESS PROFILE
HY 2017 HY 2017 HY 2017
FY 2016FY 2016FY 2016

12
CONTRACT / PERMANENT GROSS PROFIT ANALYSIS
HY 2017
FY 2016
Continued focus on growth in Contract across all regions and sectors
DIVISION GEOGRAPHY SECTOR
70%
30%
Cont
Perm
79%70% 68%
53%
21%30% 32%
47%
UK&I C Europe USA APAC & ME
Cont Perm
74%
55%
92%
72%64%
26%
45%
8%
28%36%
ICT Banking &
Finance
Energy Engineering Life Sciences
Cont Perm
67%
33%
Cont
Perm
77%66% 67%
39%
23%34% 33%
61%
UK&I C Europe USA APAC & ME
Cont Perm
73%
52%
92%
65% 60%
27%
48%
8%
35% 40%
ICT Banking &
Finance
Energy Engineering Life Sciences
Cont Perm

CONTRACT
RUNNERS
GROSS
PROFIT PER
DAY RATE
4,157 4,359 4,692 5,1225,791
7,5738,412
9,078 9,249
FY09 FY10 FY11 FY12 FY13 FY14 FY15 FY16 HY17
FY09 FY10 FY11 FY12 FY13 FY14 FY15 FY16 HY17
13
KEY PERFORMANCE INDICATORS: CONTRACT
* Growth is at constant currency
Note 1: All numbers are period end
Note 2: Contractors are those on placement with one of the Group’s clients at the end of
the relevant period
Note 3: The average gross profit per day per contractor is calculated by taking the period
end Total Runner Weekly Gross Profit position, divided by the period end number of
active contractors, divided by 5 (assuming a 5 day working week)
Contract margin %
HY 2017 19.6%HY 2016 19.8%
+5% vs
FY09
+8% vs
FY10
+9% vs
FY11
+13% vs
FY12
+31% vs
FY13
+11% vs
FY14
+8% vs
FY15
-1%* vs
FY09
+4%* vs
FY10
-2%* vs
FY11
-5%* vs
FY12
0%* vs
FY13
+3%* vs
FY14
-1%* vs
FY15
Contract runners up 81% vs 2012
+2% vs
FY16
+12% vs
HY16
-3%* vs
FY16
-3%* vs
HY16

14
CONTRACT RUNNERS – COMPARISON TO PRIOR YEARS
A record number of runners, with a strong seasonal recovery
Note 1: Growth in 2014 was largely driven by strong penetration of a buoyant Energy market
112%
131%
111%
108%103%
90%
95%
100%
105%
110%
115%
120%
125%
130%
135%
November December January February March April May June July August September October November
2013 2014 2015 2016 2017

PERMANENT
PLACEMENT
VOLUMES
PERMANENT
AVERAGE FEE
6,0606,551
7,434 7,343
6,429 6,601 6,4085,731
2,443
FY09 FY10 FY11 FY12 FY13 FY14 FY15 FY16 HY17
FY09 FY10 FY11 FY12 FY13 FY14 FY15 FY16 HY17
15
KEY PERFORMANCE INDICATORS: PERMANENT
* Growth is at constant currency
Note 1: 2013 data is based on a normalised 52 week period
Note 2: 2014 data is adjusted due to timing of period ends (an additional 45 placements in
Germany)
Note 3: The average permanent placement fee is calculated using the total placement
fees for the relevant period, divided by the number of placements for the period
Note 4: This analysis excludes retained business
+8% vs
FY09
+13% vs
FY10
-1% vs
FY11
-12% vs
FY12
+3% vs
FY13
-3% vs
FY14
+1%* vs
FY09
+6%* vs
FY10
+4%* vs
FY11
0%* vs
FY12
+1%* vs
FY13
+3%* vs
FY14
+1%* vs
FY15
Placement volumes down 16% YoY
Average fee up 3%* YoY
Permanent focus is on productivity and moving up the food chain.The decrease is broadly in line with the 17% decrease in Permanent average headcount.
-11% vs
FY15
-16% vs
HY16
+1%* vs
FY16
+3%* vs
HY16

16
GEOGRAPHICAL GROSS PROFIT ANALYSIS
* Growth is at constant currency
GEOGRAPHICAL
DIVERSIFICATION
ASIA PACIFIC &
MIDDLE EAST
GROSS PROFIT
GROWTH /
(DECLINE) BY
REGION*
HY 2017 HY 2016
HY 2017 FY 2016
(16%)
8%12%
5%
16%
(4%)
UK&I
Benelux
France
Germany
USA
APAC & ME
(5%)
15%
7%
22%
6%
(15%)
20%
19%
5%27%
22%
7%UK&I
Benelux
France
Germany
USA
APAC & ME
25%
17%
5%27%
20%
6%
34%
43%
23%
Australia
Asia
Middle East
32%
48%
20%

17
SECTOR GROSS PROFIT ANALYSIS
* Growth is at constant currency
SECTORAL
DIVERSIFICATION
GROSS PROFIT
GROWTH /
(DECLINE) BY
SECTOR*
HY 2017 HY 2016
HY 2017 FY 2016
1%
(5%)
7%
1%
6%
9%
ICT
Banking & Finance
Energy
Engineering
Life Sciences
Other
18%
(5%)
(31%)
10%12% 11%
44%
15%
9%
9%
21%
ICT
Banking &
FinanceEnergy
Engineering
Life
SciencesOther
45%
16%
8%
9%
21%
1%2%

18
INNOVATION
• Helps to future-proof the company and generate new revenue streams
• Innovation system & governance structure set up
• Invested $2m in three third party start-ups:
• Contractor platform targeting healthcare recruitment and other large vertical markets• Bot messaging platform• HR tech / recruitment incubator
• Currently rolling out a new video CV platform for candidates
• Talent platform to go live in Q3, addressing Permanent & Contract requirements
• Expect to spend circa £2m on Innovation operating expenses this year (H1: £0.6m)
• We will provide a deeper dive into our Innovation agenda at the Capital Markets Day on 15 November 2017

19
OUTLOOK
• Encouraged by the improvement in momentum across the business in the period
• Continuing to build further momentum in the more resilient Contract market • 70% of Group GP (2012: 50%)• 64% of sales headcount (2012: 44%)• 81% increase in Contract runners since 2012
• Ongoing focus on productivity in Permanent
• FX tailwind expected to be less material from H2
• Heightened level of political and economic uncertainty expected to remain a feature
• Sectorally and geographically diverse and agile, with 80% of Group GP generated outside of the UK
* Growth is at constant currency

20
FINANCIAL CALENDAR
201715 September Q3 Interim Management Statement
2 November Ex-dividend date for 2017 interim dividend
15 November Capital markets day
30 November 2017 Financial Year end
8 December 2017 Interim dividend paid
15 December Trading update for the year ended 30 November 2017
201829 January Annual results for the year ended 30 November 2017

21
SUPPLEMENTARY MATERIAL

22
GROSS PROFIT PERFORMANCE BY REGION
Note 1: GP Growth is at constant currency
Contract GP up 8%* YoY against strong prior year comparatives (H1 2016 up 11%* YoY)
GP Growth YoY YTD 17 Sales FTE HC (SL1-SL5) Growth YoY
Cont Perm Total Cont / Perm Mix Cont Perm Total
Q1 17 -13% -37% -19% Q1 17 -12% -27% -18%
Q2 17 -14% -11% -14% Q2 17 -15% -22% -17%
HY17 -14% -25% -16% HY17 -14% -24% -17%
Q1 17 +17% -11% +7% Q1 17 +15% -9% +5%
Q2 17 +15% -8% +7% Q2 17 +20% -9% +8%
HY17 +16% -9% +7% HY17 +17% -9% +6%
Q1 17 +11% +16% +12% Q1 17 -17% -28% -21%
Q2 17 +23% +13% +20% Q2 17 -19% -17% -18%
HY17 +17% +14% +16% HY17 -18% -23% -20%
Q1 17 +11% -30% -14% Q1 17 -4% -22% -17%
Q2 17 +54% -22% +5% Q2 17 -12% -19% -17%
HY17 +31% -26% -4% HY17 -8% -21% -17%
Q1 17 +7% -14% - Q1 17 -1% -18% -8%
Q2 17 +9% -6% +4% Q2 17 - -15% -6%
HY17 +8% -10% +2% HY17 - -17% -7%
Cont79%
Perm21%
Cont68%
Perm32%
Cont53%
Perm47%
UK&I
USA
APAC & MENA
20% of
Group
22% of
Group
7% of
group
Cont70%
Perm30%
GROUP
Cont70%
Perm30%
C Europe51% of
group

23
GROSS PROFIT PERFORMANCE BY SECTOR
Note 1: GP Growth is at constant currency
Growth across all sectors with the exception of Banking and Finance
GP Growth YoY YTD 17 Sales FTE HC (SL1-SL5) Growth YoY
Cont Perm Total Cont / Perm Mix Cont Perm Total
Q1 17 +7% -10% +2% Q1 17 - -14% -5%
Q2 17 +3% -6% +1% Q2 17 - -14% -5%
HY17 +5% -8% +1% HY17 +0% -14% -5%
Q1 17 -5% -12% -8% Q1 17 -1% -20% -11%
Q2 17 +3% -6% -1% Q2 17 -9% -18% -14%
HY17 -1% -9% -5% HY17 -5% -19% -13%
Q1 17 +22% -34% -1% Q1 17 +6% -28% -10%
Q2 17 +14% -17% +3% Q2 17 +15% -17% +1%
HY17 +17% -26% +1% HY17 +10% -23% -5%
Q1 17 +17% -13% +4% Q1 17 +3% -17% -7%
Q2 17 +12% - +7% Q2 17 +2% -9% -3%
HY17 +15% -7% +6% HY17 +3% -13% -5%
Q1 17 +7% -14% - Q1 17 -1% -18% -8%
Q2 17 +9% -6% +4% Q2 17 - -15% -6%
HY17 +8% -10% +2% HY17 - -17% -7%
Cont74%
Perm26%
Cont72%
Perm28%
Cont64%
Perm36%
ICT
ENGINEERING
LIFE SCIENCES
44% of
Group
9% of
Group
21% of
group
Cont70%
Perm30%
GROUP
Cont55%
Perm45%
BANKING &
FINANCE15% of
group

24
GROSS PROFIT PERFORMANCE BY REGION 2016
Note 1: GP Growth is at constant currency
GP Growth YoY YTD 16 Sales FTE HC (SL1-SL5) Growth YoY
Cont Perm Total Cont / Perm Mix Cont Perm Total
Q1 16 -1% +2% - Q1 16 +5% -10% -1%
Q2 16 - -31% -9% Q2 16 +9% -15% -
HY16 -1% -17% -5% HY16 +7% -12% -1%
Q1 16 +17% +25% +20% Q1 16 +14% +1% +8%
Q2 16 +20% +8% +16% Q2 16 +13% +4% +9%
HY16 +19% +16% +18% HY16 +13% +3% +9%
Q1 16 +20% +2% +14% Q1 16 +61% -1% +32%
Q2 16 +10% -15% - Q2 16 +53% -18% +20%
HY16 +15% -8% +6% HY16 +57% -9% +26%
Q1 16 +3% -21% -13% Q1 16 -4% -24% -19%
Q2 16 +3% -27% -18% Q2 16 +6% -15% -9%
HY16 +3% -24% -15% HY16 +1% -20% -14%
Q1 16 +11% +9% +10% Q1 16 +16% -6% +6%
Q2 16 +10% -12% +2% Q2 16 +17% -7% +6%
HY16 +11% -2% +6% HY16 +17% -7% +6%
Cont76%
Perm24%
Cont67%
Perm33%
Cont39%Perm
61%
UK&I
USA
APAC & MENA
27% of
Group
19% of
Group
6% of
group
Cont67%
Perm33%
GROUP
Cont65%
Perm35%
C Europe48% of
group

25
GROSS PROFIT PERFORMANCE BY SECTOR 2016
Note 1: GP Growth is at constant currency
GP Growth YoY YTD 16 Sales FTE HC (SL1-SL5) Growth YoY
Cont Perm Total Cont / Perm Mix Cont Perm Total
Q1 16 +21% +17% +20% Q1 16 +24% +13% +20%
Q2 16 +20% +6% +15% Q2 16 +23% +9% +18%
HY16 +20% +11% +18% HY16 +24% +11% +19%
Q1 16 +12% - +6% Q1 16 +11% -5% +1%
Q2 16 -3% -24% -14% Q2 16 +14% -3% +4%
HY16 +4% -14% -5% HY16 +12% -4% +3%
Q1 16 - +77% +21% Q1 16 +6% - +3%
Q2 16 +7% -10% +1% Q2 16 +10% -13% -1%
HY16 +4% +22% +10% HY16 +8% -6% +1%
Q1 16 +9% +35% +19% Q1 16 +38% +19% +28%
Q2 16 +11% +1% +7% Q2 16 +34% +6% +19%
HY16 +10% +16% +12% HY16 +36% +13% +23%
Q1 16 +11% +9% +10% Q1 16 +16% -6% +6%
Q2 16 +10% -12% +2% Q2 16 +17% -7% +6%
HY16 +11% -2% +6% HY16 +17% -7% +6%
Cont72%
Perm28%
Cont63%
Perm37%
Cont59%Perm
41%
ICT
ENGINEERING
LIFE SCIENCES
45% of
Group
9% of
Group
20% of
group
Cont67%
Perm33%
GROUP
Cont53%
Perm47%
BANKING &
FINANCE16% of
group

26
UK&I TRADING METRICS
Note 1: Growth is at constant currency
Note 2: Office count includes corporate function offices
20% of Group
GP
HY GROSS PROFIT GROWTH YoY
Q1 Q2 H1 MAY 17 8
Contract -13% -14% -14% MAY 16 13
YoY -5
Permanent -37% -11% -25%
NOV 16 10
Total -19% -14% -16% vs Year End -2
OFFICES
DIVISION MIX SECTOR MIX HY 2017 SECTOR MIX FY 2016
Outside HY 2017; inside FY 2016
77%
23%
79%
21%
Cont
Perm59%
14%
12%
11%
2% ICT
Banking &
FinanceEnergy
Engineering
Life Sciences
Other
60%15%
3%
10%
10%
2%
UK
Ireland
2%

27
UK&I TRADING METRICS
* Excluding retained business
1 At constant currency
Cont Perm Total YoY vs Year End
YoY -16% -19% -17% -6% -6%
YoY -14% -24% -17% -5% -4% Below +2% +1% Below
YoY
vs FY
16
vs
Group
PERMANENT
SALES HEADCOUNT PROFIT PER DAY RATE1 PLACEMENT FEE*1
Cont Perm Total YoY
vs Year
End
vs
Group
CONTRACT GROSS
vs Year
End -8% -4% -7%
AVERAGE
-29%
PERIOD END CONTRACT PERMANENT
SALES HEADCOUNT RUNNERS PLACEMENTS*
YoY
495
159
336
HY 17
Cont Perm Total
503
160
343
HY 17
Cont Perm Total
2,663
2,680
2,515
FY
16
HY
16
HY
17
751
534
HY
16
HY
17
FY
16
HY
16
HY
17
FY
16
HY
16
HY
17

28
BENELUX TRADING METRICS
Note 1: Growth is at constant currency
Note 2: Office count includes corporate function offices
19% of Group
GP
HY GROSS PROFIT GROWTH YoY
Q1 Q2 H1 MAY 17 6
Contract +16% +19% +18% MAY 16 7
YoY -1
Permanent -18% -18% -18%
NOV 16 6
Total +6% +10% +8% vs Year End 0
OFFICES
DIVISION MIX SECTOR MIX HY 2017 SECTOR MIX FY 2016
Outside HY 2017; inside FY 2016
74%
26%
79%
21%
Cont
Perm 50%
13%
12%
11%
7%7%
ICT
Banking &
FinanceEnergy
Engineering
Life Sciences
Other
50%
13%
11%
12%
6%8%
Bel Lux
Neth

29
BENELUX TRADING METRICS
* Excluding retained business
1 At constant currency
Cont Perm Total YoY vs Year End
YoY +25% -23% +8% +26% +6%
YoY +20% -22% +5% -3% -2% Below +5% +3% Below
-22%
PERIOD END CONTRACT PERMANENT
SALES HEADCOUNT RUNNERS PLACEMENTS*
YoY
vs Year
End +16% -15% +6%
AVERAGE
YoY
vs FY
16
vs
Group
PERMANENT
SALES HEADCOUNT PROFIT PER DAY RATE1 PLACEMENT FEE*1
Cont Perm Total YoY
vs Year
End
vs
Group
CONTRACT GROSS
397
99
298
HY 17
Cont Perm Total
384
100
285
HY 17
Cont Perm Total
1,970
1,657
2,084
FY
16
HY
16
HY
17
526
411
HY
16
HY
17
FY
16
HY
16
HY
17
FY
16
HY
16
HY
17

30
GERMANY TRADING METRICS
Note 1: Growth is at constant currency
Note 2: Office count includes corporate function offices
27% of Group
GP
HY GROSS PROFIT GROWTH YoY
Q1 Q2 H1 MAY 17 8
Contract +16% +10% +13% MAY 16 8
YoY 0
Permanent -7% -5% -6%
NOV 16 8
Total +6% +4% +5% vs Year End 0
DIVISION MIX SECTOR MIX HY 2017 SECTOR MIX FY 2016
OFFICES
Outside HY 2017; inside FY 2016
60%
40%
62%
38%Cont
Perm57%
6%
3%
14%
20%
ICT
Banking &
FinanceEnergy
Engineering
Life Sciences
Other
52%
7%4%
14%
23%
Germany
Switz

31
GERMANY TRADING METRICS
* Excluding retained business
1 At constant currency
Cont Perm Total YoY vs Year End
YoY +15% +3% +9% +12% +0%
YoY +11% -2% +5% -2% -1% Above -2% -2% Below
CONTRACT PERMANENT
SALES HEADCOUNT RUNNERS PLACEMENTS*
vs Year
End +6% +3% +5%
PERIOD END
vs
Group
AVERAGE CONTRACT GROSS PERMANENT
SALES HEADCOUNT PROFIT PER DAY RATE1 PLACEMENT FEE*1
Cont Perm Total YoY
vs Year
End YoY
vs FY
16
vs
Group
YoY
-10%
585
255
330
HY 17
Cont Perm Total
558
245
313
HY 17
Cont Perm Total
1,971
1,755
1,974
FY
16
HY
16
HY
17
869
786
HY
16
HY
17
FY
16
HY
16
HY
17
FY
16
HY
16
HY
17

32
FRANCE TRADING METRICS
Note 1: Growth is at constant currency
Note 2: Office count includes corporate function offices
5% of Group
GP
HY GROSS PROFIT GROWTH YoY
Q1 Q2 H1 MAY 17 2
Contract +21% +20% +21% MAY 16 1
YoY 1
Permanent -16% +5% -7%
NOV 16 1
Total +9% +16% +12% vs Year End 1
Outside HY 2017; inside FY 2016
DIVISION MIX SECTOR MIX HY 2017 SECTOR MIX FY 2016
OFFICES
72%
28%
76%
24%
Cont
Perm 49%
21%
9%
4%
17%
ICT
Banking &
FinanceEnergy
Engineering
Life Sciences
Other
50%
19%
8%
7%
16%
France

33
FRANCE TRADING METRICS
* Excluding retained business
1 At constant currency
Cont Perm Total YoY vs Year End
YoY +45% -13% +25% +19% +1%
YoY +35% -15% +17% +5% +5% Below +9% +5% Below
CONTRACT PERMANENT
SALES HEADCOUNT RUNNERS PLACEMENTS*
vs Year
End +23% -9% +13%
PERIOD END
vs
Group
AVERAGE CONTRACT GROSS PERMANENT
SALES HEADCOUNT PROFIT PER DAY RATE1 PLACEMENT FEE*1
Cont Perm Total YoY
vs Year
End YoY
vs FY
16
vs
Group
YoY
-35%
129
32
97
HY 17
Cont Perm Total
118
32
86
HY 17
Cont Perm Total
631
536
640
FY
16
HY
16
HY
17
139
91
HY
16
HY
17
FY
16
HY
16
HY
17
FY
16
HY
16
HY
17

34
USA TRADING METRICS
Note 1: Growth is at constant currency
Note 2: Office count includes corporate function offices
22% of Group
GP
HY GROSS PROFIT GROWTH YoY
Q1 Q2 H1 MAY 17 8
Contract +11% +23% +17% MAY 16 8
YoY 0
Permanent +16% +13% +14%
NOV 16 8
Total +12% +20% +16% vs Year End 0
DIVISION MIX SECTOR MIX HY 2017 SECTOR MIX FY 2016
OFFICES
Outside HY 2017; inside FY 2016
67%
33%
68%
32%
Cont
Perm
14%
23%
14%
48%
ICT
Banking &
FinanceEnergy
Engineering
Life Sciences
Other
15%
25%
11%
49%
USA

35
USA TRADING METRICS
Cont Perm Total YoY vs Year End
YoY -15% -13% -14% +23% +14%
YoY -18% -23% -20% -10% -12% Above -5% -10% Above
YoY
vs FY
16
vs
GroupCont Perm Total YoY
vs Year
End
vs
Group
AVERAGE CONTRACT GROSS PERMANENT
SALES HEADCOUNT PROFIT PER DAY RATE1 PLACEMENT FEE*1
YoY
+22%
vs Year
End -4% -1% -3%
PERIOD END CONTRACT PERMANENT
SALES HEADCOUNT RUNNERS PLACEMENTS*
299
97
202
HY 17
Cont Perm Total
300
97
203
HY 17
Cont Perm Total
1,363
1,262
1,549
FY
16
HY
16
HY
17
321
392
HY
16
HY
17
FY
16
HY
16
HY
17
FY
16
HY
16
HY
17
* Excluding retained business
1 At constant currency

HY GROSS PROFIT GROWTH YoY
Q1 Q2 H1 MAY 17 6
Contract +11% +54% +31% MAY 16 6
YoY 0
Permanent -30% -22% -26%
NOV 16 6
Total -14% +5% -4% vs Year End 0
Outside HY 2017; inside FY 2016
DIVISION MIX SECTOR MIX HY 2017 SECTOR MIX FY 2016
OFFICES
39%
61%53%
47%Cont
Perm
29%
37%
21%
13%
ICT
Banking &
FinanceEnergy
Engineering
Life Sciences
Other
29%
36%
17%
2% 16%
Australia
Singapore
Japan
Hong Kong
MENA
2%1%
1%1%
2%
36
ASIA PACIFIC & MIDDLE EAST TRADING METRICS
Note 1: Growth is at constant currency
Note 2: Office count includes corporate function offices
7% of Group
GP

37
ASIA PACIFIC & MIDDLE EAST TRADING METRICS
Cont Perm Total YoY vs Year End
YoY -9% -21% -17% +25% +1%
YoY -8% -21% -17% -7% -5% Below -3% -2% Above
YoY
vs FY
16
vs
GroupCont Perm Total YoY
vs Year
End
vs
Group
AVERAGE CONTRACT GROSS PERMANENT
SALES HEADCOUNT PROFIT PER DAY RATE1 PLACEMENT FEE*1
YoY
-25%
vs Year
End +5% -5% -1%
PERIOD END CONTRACT PERMANENT
SALES HEADCOUNT RUNNERS PLACEMENTS*
161
99
62
HY 17
Cont Perm Total
159
101
58
HY 17
Cont Perm Total
480
391
487
FY
16
HY
16
HY
17
305
229
HY
16
HY
17
FY
16
HY
16
HY
17
FY
16
HY
16
HY
17
* Excluding retained business
1 At constant currency

38
SECTOR GROSS PROFIT ANALYSISICT BY REGION BANKING & FINANCE BY REGION
GROUP BY SECTOR
ENGINEERING BY REGION LIFE SCIENCES BY REGION
ALL CHARTS: Outside HY 2017; Inside FY 2016
45%
16%
8%
9%
21%
44%
15%
9%
9%
21%
2%
ICT
Banking & Finance
Energy
Engineering
Life Sciences
Other
33%
19%6%
32%
6%27%
21%
6%
35%
7%4%
23%
14%
6%11%
31%
15%
19%
15%
7%
11%
33%
15%
12%5%
29%
45%
5%
10%
6%
4%
26%
50%
4%
27%
23%
44%
28%
23%
2%
44%
2%
UK&I Benelux France DACH USA APAC & ME

39
ENERGY - GROUP
* Growth is at constant currency
Note 1: Mix by division, region and stream is based on gross profit
An improved performance in Energy with GP up 7%* YoY, driven by onshore fracking
Cont Perm Total
Q1 17 -10% +1% -8%
Q2 17 +29% -35% +23%
HY 17 +9% -15% +7%
Cont Perm Total
Q1 17 -13% -48% -17%
Q2 17 -6% +2% -6%
HY 17 -9% -32% -12%
% of Group Gross Profit YoY Growth Contract Runners
Average Sales Headcount YoY Growth
Outside HY 2017; Inside FY 2016
Mix by Region Mix by Stream Mix by Division
Outside HY 2017; Inside FY 2016 Outside HY 2017; Inside FY 2016 Outside HY 2017; Inside FY 2016
8%
9%
92%
8%
92%
8%
Cont
Perm
10%
46%29%
15%
5%
42%
37%
16% UK&I
C Europe
USA
APAC & ME
24%
15%
40%
21%29%
20%20%
31%
Upstream
Midstream
Downstream
Power &
Renewables
1,0
78
1,0
34
92
0
96
4
1,0
06
1,0
46
1,1
16
1,3
42
Q3
2015
Q4
2015
Q1
2016
Q2
2016
Q3
2016
Q4
2016
Q1
2017
Q2
2017

FY GP £213.6m £167.8m £162.4m £189.5m £199.5m £192.8m £218.2m £235.7m £258.7m
GROSS
PROFIT
CONTRACT
GROSS
MARGIN
£99.7m £91.6m £72.5m £87.3m £97.1m £91.6m £100.8m £110.5m £119.8m £134.4m
£113.9m£76.2m
£89.8m£102.2m £102.4m £101.2m
£117.4m£125.2m
£138.9m
£0m
£50m
£100m
£150m
£200m
£250m
£300m
2008 2009 2010 2011 2012 2013 2014 2015 2016 HY 2017
H1 H2
21.5% 22.1% 21.6% 21.4% 21.5%20.2% 20.0% 19.8% 19.9% 19.6%
2008 2009 2010 2011 2012 2013 2014 2015 2016 HY 2017
40
HISTORICAL GROSS PROFIT & GROSS MARGIN
Note 1: 2013 data is based on a normalised 52 week period
Our strongest HY performance for GP
Contract gross margin % remained relatively flat despite difficult trading conditions

FY OP
ADJUSTED
OPERATING
PROFIT
before
exceptional
items
CONVERSION
RATIO
adjusted
operating
profit before
exceptional
items as a %
of gross profit
£24.4m
£11.0m £7.1m £11.0m £9.1m £6.7m £8.4m£14.1m £15.3m £19.3m
£32.4m
£7.0m £14.1m
£19.0m£16.0m
£14.3m£21.4m
£27.4m £26.0m
£0m
£10m
£20m
£30m
£40m
£50m
£60m
2008 2009 2010 2011 2012 2013 2014 2015 2016 2017
H1 H2
23
.8%
11
.8%
9.6
%
12
.2%
9.2
%
7.1
%
8.3
%
12
.8%
12
.8%
14
.4%
25
.9%
10
.5%
12
.8%
15
.3%
12
.2%
10
.9%
13
.7%
17
.6%
16
.0%
2008 2009 2010 2011 2012 2013 2014 2015 2016 2017
HY FY
£56.8m £18.0m £21.2m £30.0m £25.1m £21.0m £29.8m £41.5m £41.3m
41
HISTORICAL OPERATING PROFIT & CONVERSION RATIO
Note 1: Includes data for IT Job Board up to 2011
Note 2: 2013 data is based on a normalised 52 week period
Note 3: 2013, 2014 and 2015 are before exceptional items
Note 4: 2015 figures were adjusted for the impact of £3.1m of costs in relation to restructuring Energy business and the impairment of IT assets
Note 5: 2016 figures are adjusted for the impact of £3.5m of costs in relation to the restricting of certain sales businesses and central support function

42
HEADCOUNT
Note 1: Headcount is now based on full time equivalent heads. This is a change from prior years.
Note 2: Sales heads include consultants and sales management
May 09 Nov 09 May 10 Nov 10 May 11 Nov 11 May 12 Nov 12 May 13 Nov 13 May 14 Nov 14 May 15 Nov 15 May 16 Nov 16 May 17
Period End
Total Heads1,511 1,461 1,638 1,719 1,865 2,109 2,100 2,021 2,125 2,232 2,484 2,483 2,571 2,752 2,712 2,590 2,642
Period End
Sales Heads1,111 1,051 1,181 1,204 1,351 1,610 1,620 1,568 1,667 1,797 2,015 2,016 2,051 2,185 2,142 2,044 2,064
524 459 474 484 519 564 507 459 477 497 538 541 553 579 550 490 457
587592
707 720832
1,046 1,1131,109
1,1901,300
1,477 1,475 1,4981,606 1,592
1,554 1,607
May 09 Nov 09 May 10 Nov 10 May 11 Nov 11 May 12 Nov 12 May 13 Nov 13 May 14 Nov 14 May 15 Nov 15 May 16 Nov 16 May-17
UK Sales Heads Int'l Sales Heads

43
SALES HEADCOUNT
Note 1: Headcount is now based on full time equivalent heads
Note 2: Sales heads include consultants and sales management
May 09 Nov 09 May 10 Nov 10 May 11 Nov 11 May 12 Nov 12 May 13 Nov 13 May 14 Nov 14 May 15 Nov 15 May 16 Nov 16 May 17
Period End
Sales Heads1,111 1,051 1,181 1,204 1,351 1,610 1,620 1,568 1,667 1,797 2,015 2,016 2,051 2,185 2,142 2,044 2,064
461 436 481 458 529623 646 683
824 8941,009 1,067 1,124
1,270 1,299 1,280 1,324
650615
700 746
822
987 974 885
843903
1,006 949927
915 843764 740
May 09 Nov 09 May 10 Nov 10 May 11 Nov 11 May 12 Nov 12 May 13 Nov 13 May 14 Nov 14 May 15 Nov 15 May 16 Nov 16 May 17
Contract Sales Heads Permanent Sales Heads

44
CASH FLOW
Note 1: Cash conversion ratio is calculated as net cash generated from operations less capital expenditure, stated as a % of operating profit before exceptional items / adjustments, and is a
measure of the Group’s ability to convert profit into cash
Note 2: 2016 figures are adjusted for the impact of £2.3m of costs in relation to the restricting of certain sales businesses and central support function
Seasonal working capital outflow
Purchased to settle share-based payments
Strong cash conversion
As Reported Adjusted As Reported
HY 2017 HY 2016 HY 2016
Operating profit before exceptional items £19.3m £15.3m £13.0m
Depreciation, amortisation and impairments £2.9m £2.8m £2.8m
Share awards charge and other non cash items £1.4m £1.7m £1.7m
Increase in receivables (£2.7m) (£1.9m) (£1.9m)
Decrease in payables and provisions (£9.0m) (£13.4m) (£11.8m)
Net cash generated from operations £11.9m £4.5m £3.8m
Taxation paid (£3.4m) (£2.4m) (£2.4m)
Capital expenditure (£2.6m) (£4.0m) (£4.0m)
Prepaid investment (£0.8m) - -
Net finance expense (£0.2m) (£0.2m) (£0.2m)
Dividends paid (£6.0m) (£6.0m) (£6.0m)
Treasury shares purchased (£3.4m) (£4.6m) (£4.6m)
Tracker shares and share option related transactions £0.1m £0.6m £0.6m
FX movement (£0.3m) £2.8m £2.8m
Movement in net (debt) / cash (£4.7m) (£9.3m) (£10.0m)
Cash outflow from previously recognised exceptional items (£0.1m) (£0.6m) (£0.6m)
Cash outflow from 2015 and 2016 restructuring - (£0.7m) -
Movement in net (debt) / cash after adjustments (£4.8m) (£10.6m) (£10.6m)
Cash conversion ratio 48% 3% (2%)

79%
6%
2%6%
7%
Payroll Property Advertising IT & Professional Other
16%
84%
Support Services Sales
45
COST BASE ANALYSIS
Note 1: Based on costs for FY 2016
The Group has maintained its flexible cost base
Cost Base
Payroll Costs
46
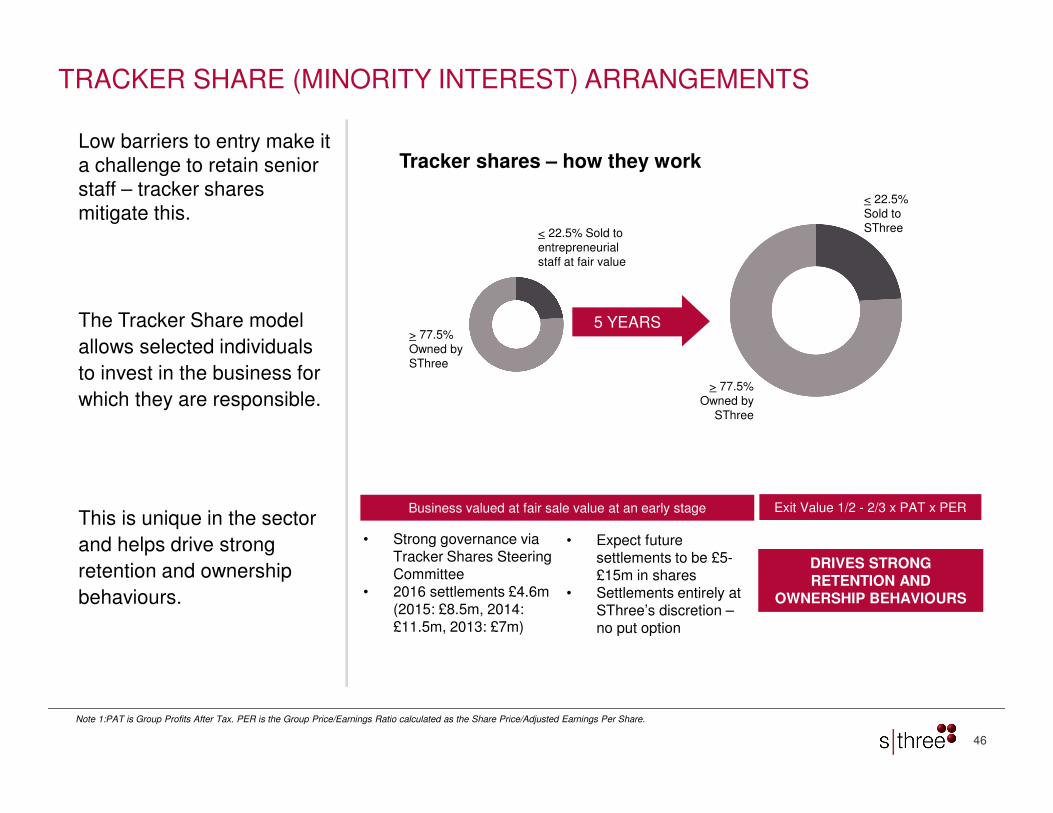
TRACKER SHARE (MINORITY INTEREST) ARRANGEMENTS
Low barriers to entry make it a challenge to retain senior staff – tracker shares mitigate this.
The Tracker Share model
allows selected individuals
to invest in the business for
which they are responsible.
This is unique in the sector
and helps drive strong
retention and ownership
behaviours.
Tracker shares – how they work
> 77.5% Owned by SThree
< 22.5% Sold toentrepreneurialstaff at fair value
< 22.5% Sold toSThree
> 77.5% Owned by
SThree
5 YEARS
• Strong governance via Tracker Shares Steering Committee
• 2016 settlements £4.6m (2015: £8.5m, 2014: £11.5m, 2013: £7m)
• Expect future settlements to be £5-£15m in shares
• Settlements entirely at SThree’s discretion –no put option
DRIVES STRONG RETENTION AND
OWNERSHIP BEHAVIOURS
Exit Value 1/2 - 2/3 x PAT x PERBusiness valued at fair sale value at an early stage
Note 1:PAT is Group Profits After Tax. PER is the Group Price/Earnings Ratio calculated as the Share Price/Adjusted Earnings Per Share.

47
39 OFFICES IN 16 COUNTRIES
BELGIUMAntwerpBrussels
FRANCEParisLyon
GERMANYBerlinDüsseldorfFrankfurtMunichHamburgStuttgart
AUSTRIAVienna
LUXEMOURGLuxembourg City
NETHERLANDSAmsterdamRotterdam
SWITZERLANDZurich
USAAustinBostonChicagoHoustonMinneapolisNew YorkSan DiegoSan Francisco
UAEDubai
HONG KONGHong Kong
MALAYSIAKuala Lumpur
SINGAPORESingapore
AUSTRALIASydney
JAPANTokyo
UKBristolBirminghamGlasgowLondonLeedsManchester
IRELANDDublin
Note 1: Austria office opened 1st June 2017