Half year report 2017€¦ · Sioen in brief Sioen has the entire production process under one...
60
Half year report 2017
-
Upload
nguyennguyet -
Category
Documents
-
view
213 -
download
0
Transcript of Half year report 2017€¦ · Sioen in brief Sioen has the entire production process under one...

Half year report 2017


Table of content
Sioen in brief 5
Corporate information 7
Group structure 8
Report of the Board of Directors 10
1. Comments on the consolidated financial statements 10
2. Events after reporting date 11
3. Developments by division 11
4. Balance sheet and cash flow statement 12
5. Outlook for 2017 12
Financial overview 14
1. Interim consolidated financial statements for the six months ended in 30 June 2017 14
1.1. Consolidated statement of financial position 14
1.2. Consolidated income statement 16
1.3. Consolidated statement of cash flows 21
1.4. Consolidated statement of changes in equity 22
2. Notes to the consolidated financial statements 24
2.1. Application of new and revised International Financial Reporting Standards (IFRs) 24
2.2. Reporting entity 26
2.3. Statement of compliance with IFRs 26
2.4. Significant accounting policies 26
2.5. Seasonality of interim operations 27
2.6. Significant events and transactions 27
2.7. Assessment criteria in the application of the valuation rules 27
2.8. Segment information 28
2.9. Exchange rates 30
2.10. Income taxes relating to continuing operations 31
2.11. Discontinued operations 32
2.12. Debt and equity securities 33
2.13. Dividends 33
2.14. Property, plant and equipment 33
2.15. Inventories 34
2.16. Provisions 36
2.17. Borrowings 38
2.18. Obligations under finance leases 39
2.19. Share capital & shareholder structure 39
2.20. Financial instruments 40
2.21. Related party transactions 41
2.22. Acquisitions and disposal of subsidiaries 42
2.23. Events after reporting date 54
2.24. Contigent assets and liabilities 54
2.25. Financial risk management 54
2.26. Staff 55
2.27. Approval of interim financial statements 56
Definitions 57
Reconciliations 58
- Half year report 2017 3

SIOEN INDUSTRIES

Sioen in brief
Sioen has the entire production process under one roof, from the yarn, raw fabric and pigment pastes, to the coating and production of professional apparel.
As a leader in our industry we pride ourselves on our ability to find imaginative solutions to the challenges and ever-changing concerns and demands of our customers, the marketplace and all our stakeholders.
4 302Skilled people make your product.
56We have 56 companies (legal entities).
23Our plants are situated in 23 countries.
237.7Million € net sales in H1 2017 (+ 31.8%).
34.6Million € recurring EBITDA in H1 2017 (+ 7.2%).
12.1Million € Group profit in H1 2017 (- 13.2%).
- Half year report 2017 5


Corporate information
Declaration regarding the information given in this report for the 6 months ended 30 June 2017
The undersigned declare that:
- The half year accounts, prepared in accordance with the applicable standards for annual financial statements, give a true and fair view of the net assets, financial condition and results of Sioen Industries and the companies included in the consolidation.
- The half year report gives a true and fair overview of the development and results of the company and the position of Sioen Industries and the companies included in the consolidation, and a description of the principal risks and uncertainties that they face.
M.J.S. Consulting BVBA, represented by Mrs. M. Sioen, CEO Asceca Consulting BVBA, represented by Mr. G. Asselman, CFO
The full financial report is available from 25 August 2017
in the ‘Investors’ section of our website www.sioen.com.
Management statement
Obligations to provide periodic information under the Transparency Directive effective from 1 January 2008.
- Half year report 2017 7

Sioen Industries NV | Shared service center
Coating Apparel Chemicals Other
Sioen Industries NV (1)
Spinning, weaving, direct coating, online coating, Belgium
99.9% Sioen NVBelgium
100.0% European Master Batch NVProduction pastes, inks, varnishes, Belgium
100.0% Roltrans Tegelen BV (4)
The Netherlands (real estate)
100.0% Saint Frères SASDirect coating, France
10.5% Confection Tunisienne de Sécurité SARLTunisia
89.5% Richard SASPaste production, France
99.9% Roltrans Group America Inc.USA (real estate)
100.0%
100.0% Sioen Shanghai (2)
Direct coating sales office, ChinaSioen Ireland (3)
Ireland100.0% Le Comptoir Zouloo SAS
Sales office, France100.0% Roland Planen GmbH i.L.
Germany (dormant)100.0%
100.0% Sioen Fabrics SATransfer coating, Calendering, Belgium
100.0% Mullion Survival Technology Ltd.Sales office, UK
UV Curable Systems BVBA (7)
Radiation curing primers, inks and varnishes Belgium
100.0% Roland Real Estate Sp.z.o.oPoland (real estate)
100.0%
100.0% Siofab SATransfer coating, Portugal
95.0% PT. Sioen IndonesiaIndonesia
5.0% Roland Ukrain llc.Ukraine (dormant)
14.5% 85.5%
100.0% Pennel Automotive SASFrance
95.0% PT. Sungin TexIndonesia
5.0%
100.0% Coatex NVProcessing of coated fabrics and films, Belgium
Sioen France SASSales office, France
99.8%
100.0% Saint Frères Confection SASHeavy-duty manufacturing, France
99.7% Sioen Tunisie SARLSales office, Tunisia
100.0% Sioen Felt & Filtration SAFelt and filter production, Belgium
99.9% Sioen Zaghouan SATunisia
0.1%
100.0% Dynatex NV (5)
Direct coating, Belgium5.0% Siorom SRL
Romania95.0%
(1) Merger Holding company Sioen Industries (Shared Service Center) and Belgian direct coating companies at July 1st 2009(2) Official name: Sioen Coated Fabrics (Shanghai) Trading Co. Ltd. (3) Official name: Gairmeidi Caomhnaithe Dhun na nGall Teoranta (4) Respectively through Monal SA and Roltrans Group BV (5) Acquisition in 2015 - still 10.5% to acquire by means of deferred payments(6) Acquisition in 2016 - still 10.0% to acquire by means of deferred payment(7) New acquisition in 2017(8) New acquisition in 2017, via holding companies Jade Equity Ltd., Emerald Bond Ltd. and Jade Mezzanine Ltd.(9) Former Verseidag Ballistic Protection OY, name change with effect as from 9 August 2017
100.0% Manifattura Fontana S.p.A. (6)
Geotextile non-wovens, ItalySioen Nederland BVThe Netherlands
100.0%
52.0% Fontana International GmbHGeotextile non-wovens sales office, Austria
48.0% Sioen Asia Pacific PTE. Ltd.Singapore
100.0%
100.0% Dimension-Polyant GmbHSailcloth, Germany
Sioen Myanmar Ltd.Myanmar
99.0%
Dimension-Polyant Inc.Sailcloth, USA
100.0% 5.0% PT. Sioen Semarang AsiaSemarang
95.0%
Dimension-Polyant Sailcloth PTY Ltd.Sailcloth, Australia
100.0% Ursuk OYFinland
100.0%
Dimension-Polyant (UK) Ltd.Sailcloth, UK
100.0% Kiinteistö Oy Turun Teijonkatu 3Finland (real estate)
100.0%
Dimension-Polyant SASSailcloth, France
100.0% SG Balticum ASEstonia
100.0%
100.0% James Dewhurst Ltd. (8)
Open construction laid scrims, UKArctic Diving ABSweden
100.0%
Dewtex Inc. (7)
Open construction laid scrims, USA100.0% Sioen Ballistics OY (7)(9)
Finland100.0%
James Dewhurst Trustees Ltd. (7)
UK (dormant)100.0%
Group structure
- Half year report 2017 8

Sioen Industries NV | Shared service center
Coating Apparel Chemicals Other
Sioen Industries NV (1)
Spinning, weaving, direct coating, online coating, Belgium
99.9% Sioen NVBelgium
100.0% European Master Batch NVProduction pastes, inks, varnishes, Belgium
100.0% Roltrans Tegelen BV (4)
The Netherlands (real estate)
100.0% Saint Frères SASDirect coating, France
10.5% Confection Tunisienne de Sécurité SARLTunisia
89.5% Richard SASPaste production, France
99.9% Roltrans Group America Inc.USA (real estate)
100.0%
100.0% Sioen Shanghai (2)
Direct coating sales office, ChinaSioen Ireland (3)
Ireland100.0% Le Comptoir Zouloo SAS
Sales office, France100.0% Roland Planen GmbH i.L.
Germany (dormant)100.0%
100.0% Sioen Fabrics SATransfer coating, Calendering, Belgium
100.0% Mullion Survival Technology Ltd.Sales office, UK
UV Curable Systems BVBA (7)
Radiation curing primers, inks and varnishes Belgium
100.0% Roland Real Estate Sp.z.o.oPoland (real estate)
100.0%
100.0% Siofab SATransfer coating, Portugal
95.0% PT. Sioen IndonesiaIndonesia
5.0% Roland Ukrain llc.Ukraine (dormant)
14.5% 85.5%
100.0% Pennel Automotive SASFrance
95.0% PT. Sungin TexIndonesia
5.0%
100.0% Coatex NVProcessing of coated fabrics and films, Belgium
Sioen France SASSales office, France
99.8%
100.0% Saint Frères Confection SASHeavy-duty manufacturing, France
99.7% Sioen Tunisie SARLSales office, Tunisia
100.0% Sioen Felt & Filtration SAFelt and filter production, Belgium
99.9% Sioen Zaghouan SATunisia
0.1%
100.0% Dynatex NV (5)
Direct coating, Belgium5.0% Siorom SRL
Romania95.0%
(1) Merger Holding company Sioen Industries (Shared Service Center) and Belgian direct coating companies at July 1st 2009(2) Official name: Sioen Coated Fabrics (Shanghai) Trading Co. Ltd. (3) Official name: Gairmeidi Caomhnaithe Dhun na nGall Teoranta (4) Respectively through Monal SA and Roltrans Group BV (5) Acquisition in 2015 - still 10.5% to acquire by means of deferred payments(6) Acquisition in 2016 - still 10.0% to acquire by means of deferred payment(7) New acquisition in 2017(8) New acquisition in 2017, via holding companies Jade Equity Ltd., Emerald Bond Ltd. and Jade Mezzanine Ltd.(9) Former Verseidag Ballistic Protection OY, name change with effect as from 9 August 2017
100.0% Manifattura Fontana S.p.A. (6)
Geotextile non-wovens, ItalySioen Nederland BVThe Netherlands
100.0%
52.0% Fontana International GmbHGeotextile non-wovens sales office, Austria
48.0% Sioen Asia Pacific PTE. Ltd.Singapore
100.0%
100.0% Dimension-Polyant GmbHSailcloth, Germany
Sioen Myanmar Ltd.Myanmar
99.0%
Dimension-Polyant Inc.Sailcloth, USA
100.0% 5.0% PT. Sioen Semarang AsiaSemarang
95.0%
Dimension-Polyant Sailcloth PTY Ltd.Sailcloth, Australia
100.0% Ursuk OYFinland
100.0%
Dimension-Polyant (UK) Ltd.Sailcloth, UK
100.0% Kiinteistö Oy Turun Teijonkatu 3Finland (real estate)
100.0%
Dimension-Polyant SASSailcloth, France
100.0% SG Balticum ASEstonia
100.0%
100.0% James Dewhurst Ltd. (8)
Open construction laid scrims, UKArctic Diving ABSweden
100.0%
Dewtex Inc. (7)
Open construction laid scrims, USA100.0% Sioen Ballistics OY (7)(9)
Finland100.0%
James Dewhurst Trustees Ltd. (7)
UK (dormant)100.0%
- Half year report 2017 9

Report of the Board of Directors
1. Comments on the consolidated financial statements
Net sales (overall growth of 31.8%, organic growth of 4.4%):
At the end of the first half of 2017 Sioen realized a growth in consolidated sales with 31.8% to EUR 237.7 million compared to EUR 180.3 million over the same period in 2016. This sales figure includes the sales of the recently acquired companies;
- Fontana, accounted for as of 1 April 2016
- Dimension-Polyant, accounted for as of 1 August 2016
- Ursuit, accounted for as of 31 December 2016
- Verseidag Ballistic Protection, accounted for as of 1 January 2017
- UCS, accounted for as of 1 January 2017
- James Dewhurst Group, accounted for as of 1 June 2017
Excluding the above mentioned recent acquisitions the Sioen Industries Group realized an organic growth of 4.4% compared to the same period previous year. All acquisitions are well on track and perform in line with expectations.
Gross margin:
The consolidated gross margin (material margin) has evolved from 53.59% at the end of the first half of 2016 to 49.54% in the first half of the year.
A change driven by various factors such as; price pressure from raw material prices which accounts for 2.7% of the 4% change and a substantial change in sales mix resulting from the acquired companies.
Operating result:
The operating result has evolved from EUR 26.1 million at the end of the first half of 2016 to EUR 23.1 million at the end of the first half of 2017 or a decrease with 11.5%.
Financial result:
Financial result of the Group amounted to EUR -4.4 million over the first half of 2017 against EUR -4.7 million in the first half of 2016.
Income tax:
Income tax amounts to EUR 6.5 million over the first half of 2017 against EUR 7.5 million over the first half of 2016.
Profit (loss) for the period from continuing operations:
The company recorded EUR 12.1 million profit over the first half of 2017 against EUR 14.0 million over the first half of 2016 or a decrease with 13.6%.
Recurring EBITDA:
The EBITDA with the exception of the one off expenses (expenses related to the acquired companies and the reorganization of the Indonesian plants) amounts to EUR 34.6 million or a growth of 7.2% compared to last year.
Net cash flow:
The net cash flow amounts to EUR 22.1 million over the first half of 2017 against EUR 19.4 million over the first half of 2016, or an increase with 13.9%.
- Half year report 2017 10

2. Events after reporting date
No subsequent events occurred which could have a significant impact on the consolidated financial statements of the Group, for the period ended 30 June 2017.
3. Developments by division
Coating division
The coating division specializes in technical textiles. This division is fully vertically integrated. Starting point is the extrusion of technical yarns and staple fibers (polyester) followed in a second stage by the production of woven fabrics, non-woven technical fabrics and reinforcement scrims most of them to be coated, through dedicated coating processes, with various polymers (PVC, PU, silicons, etc.). The Group is the only player in the world with full competency in various coating technologies, each with its own specific products and markets.
In the first half of 2017, the coating division achieved external sales of EUR 151.8 million versus EUR 112.3 million over the same period last year. Market demand remains strong in all product lines. Excluding the acquisitions, this division realized an organic growth rate of 7.2% compared to last year. Including the newly acquired activity the growth rate in this division is 35.2%.
Apparel division
This division stands for ‘professional protective garments’. The apparel division is an innovative producer of a wide range of high-quality professional protective garments that meet all European standards. Sioen Apparel is active in various sectors where attention to safety is a priority. Attention to customer needs, strong quality consciousness and continuing research and development, combined with technically advanced products, are the basis of the successful development of this division.
In the first half of 2017, the apparel division achieved external sales of EUR 62.7 million versus EUR 45.9 million over the same period last year or a growth rate of 36.7% including acquisitions. Excluding the acquisitions this division suffers a slight decline in organic sales of 1.9% and thus a total acquisition growth rate of 38.6%. Profitability of the division is temporarily impacted by the reorganization of the production plants in Asia.
Chemicals division
Sioen Chemicals is the expert in coloring, dispersing pigments and additives in pigment pastes, liquids, concentrates and inks for a wide range of applications. Our customers operate in the fields of wall- and floorcovering, sealants, adhesives, paints, plasters, technical textiles up to automotive, paper, agriculture, food and many other industry segments. Sioen Chemicals offers high quality standard and tailor made customer solutions and is well reputed for its customized pigment pastes, inks and varnishes.
In the first half of 2017, the chemicals division achieved external sales of EUR 23.2 million versus EUR 22.1 million over the same period last year, or a sales growth rate of 5.0% (3.1% organic growth and 1.8% growth through acquisitions).
Division Other
This division consists of the real estate activities.
- Half year report 2017 11

4. Balance sheet and cash flow statement
Working capital, expressed as a percentage of net sales, decreased from 31.0% as per 30 June 2016 to 29.9% as per 30 June 2017. In Euro however, due to the acquired companies, it has increased to EUR 142.1 million or an increase of about EUR 30.3 million.
The net financial debt position increased from EUR 79.4 million at the end of last year, to EUR 145.9 million at the end of June 2017.
5. Outlook for 2017
Without geopolitical landslides we expect the underlying trend of the first semester to continue into the second semester.
In the second half of 2017 the Sioen Industries Group will continue to put emphasis on:
- the further integration of the acquired companies
- the mitigation of the impact of raw material price increases
- the start of capacity extension projects in Italy and Belgium
Sioen core values:
- strong focus on R&D and innovation
- diversified product portfolio, tailored to the customer’s needs
- cost efficiency
- Half year report 2017 12


Financial overview
1. Interim consolidated financial statements for the six months ended 30 June 2017
1.1. Consolidated statement of financial position | In thousands of euros
Assets Note 30 June 2017 31 December 2016
Unaudited Audited
Non-current assets
Intangible assets 25 897 11 519
Goodwill 72 163 39 372
Property, plant and equipment 115 759 110 412
Investment property 5 375 5 425
Interests in associates 86 286
Other long term assets 465 1 600
Deferred tax assets 6 238 4 002
Total non-current assets 225 983 172 616
Current assets
Inventories 2.15 129 445 114 473
Trade receivables 76 951 57 273
Other receivables 7 014 4 966
Other financial assets 14
Cash and cash equivalents 1.3 19 189 16 596
Derivatives fair value 954 1 400
Deferred charges and accrued income 2 353 1 082
Total current assets 235 920 195 790
Total assets 461 903 368 406
- Half year report 2017 14

Equity & liabilities Note 30 June 2017 31 December 2016
Unaudited Audited
Equity
Share capital 46 000 46 000
Retained earnings 153 287 151 708
Other reserves -9 141 -8 522
Equity attributable to the owners of the company 1.4 190 146 189 186
Non-controlling interest 0 0
Total equity 1.4 190 146 189 186
Non-current liabilities
Borrowings 64 424 66 531
Provisions 2.16 1 157 2 231
Retirement benefit obligations 4 473 4 743
Deferred tax liabilities 23 233 18 457
Obligations under finance leases 4 576 4 911
Other amounts payable 3 120
Total non-current liabilities 97 866 96 993
Current liabilities
Trade and other payables 38 205 31 135
Borrowings 95 380 23 655
Provisions 2.16 100 190
Retirement benefit obligations 53 61
Current income tax liabilities 6 128 3 031
Social debts 17 097 11 402
Other amounts payable 4 928 5 383
Obligations under finance leases 763 735
Derivatives fair value 1 764 1 225
Accrued charges and deferred income 9 473 5 410
Total current liabilities 173 891 82 227
Total equity and liabilities 461 903 368 406
- Half year report 2017 15

1.2. Consolidated income statement
1.2.1. By function | In thousands of euros
NoteSix months ended
30 June 2017Six months ended
30 June 2016 (1)
Unaudited Unaudited
Net sales 2.8 237 653 180 255
Cost of sales - 183 299 - 131 714
Manufacturing contribution 54 354 48 541
Sales and marketing expenses - 12 738 - 9 739
Research and development expenses - 4 915 - 3 839
Administrative expenses - 17 907 - 11 793
Financial income 674 585
Financial charges - 5 078 - 5 290
Other income 3 705 2 725
Other expenses 626 236
Profit (loss) before taxes 18 721 21 425
Income tax 2.10 - 6 545 - 7 456
Profit (loss) after taxes 12 176 13 969
Share in the results of associates - 114
Profit (loss) for the period from continuing operations 12 063 13 969
Profit (loss) for the period from discontinued operations 2.11 - 66
Group profit (loss) 12 063 13 903
Group profit (loss) attributable to shareholders of Sioen Industries 12 063 13 903
Group profit (loss) attributable to minority interests 0 0
EBIT 23 125 26 185
EBITDA 33 055 31 683
Recurring EBIT 23 499 26 247
Recurring EBITDA 34 560 32 235
Net cash flow 22 107 19 402
Definitions and reconciliations for non-GAAP measures can be found on pages 57 & 58 of this half year report.(1) As a consequence of the European Securities and Markets Authority (ESMA)’s guidelines on the use of Alternative Performance Measures (APMs), the presentation of the 30 June 2016 figures has been adjusted to be comparable with the presentation of the 30 June 2017 figures.
- Half year report 2017 16

Earnings per share | amounts in euro
Six months ended 30 June 2017
Six months ended 30 June 2016
Basic earnings per share
Net earnings for the period 12 062 638 13 903 332
Net earnings from continuing operations 12 062 638 13 969 099
Net earnings from discontinued operations -65 767
Weighted average ordinary shares outstanding 19 779 933 19 779 933
Basic earnings per share 0.61 0.70
Basic earnings per share from continuing operations 0.61 0.71
Diluted earnings per share
Net earnings for the period 12 062 638 13 903 332
Net earnings from continuing operations 12 062 638 13 969 099
Net earnings from discontinued operations -65 767
Weighted average ordinary shares outstanding 19 779 933 19 779 933
Diluted earnings per share 0.61 0.70
Diluted earnings per share from continuing operations 0.61 0.71
- Half year report 2017 17

1.2.2. By nature | In thousands of euros
NoteSix months ended
30 June 2017Six months ended
30 June 2016 (1)
Unaudited Unaudited
Net sales 2.8 237 653 180 255
Changes in stocks and WIP (work in progress) - 848 9 099
Other operating income (2) 3 722 2 730
Raw materials and consumables used -119 075 -92 757
Gross margin 49.54% 53.59%
Services and other goods -35 271 -27 359
Remuneration, social security and pensions -49 749 -37 477
Depreciations 2.8 -10 337 -7 323
Write off inventories and receivables - 713 1 175
Provisions for liabilities and charges 1 120 650
Other operating charges (3) -3 377 -2 863
Operating result 23 125 26 129
Financial result -4 404 -4 704
Financial income 674 585
Financial charges -5 078 -5 290
Profit (loss) before taxes 18 721 21 425
Income tax 2.10 -6 545 -7 456
Profit (loss) after taxes 12 176 13 969
Share in the results of associates - 114
Profit (loss) for the period from continuing operations 12 063 13 969
Profit (loss) for the period from discontinued operations 2.11 - 66
Group profit (loss) 12 063 13 903
Group profit (loss) attributable to shareholders of Sioen Industries 12 063 13 903
Group profit (loss) attributable to non-controlling interest 0 0
EBIT 23 125 26 185EBITDA 33 055 31 683Recurring EBIT 23 499 26 247Recurring EBITDA 34 560 32 235Net cash flow 22 107 19 402
Definitions and reconciliations for non-GAAP measures can be found on pages 57 & 58 of this annual report.(1) As a consequence of the European Securities and Markets Authority (ESMA)’s guidelines on the use of Alternative Performance Measures (APMs), the presentation of the 30 June 2016 figures has been adjusted to be comparable with the presentation of the 30 June 2017 figures.(2) Other operating income mainly consists of exemption withholding tax, rental income, transport recharges, indemnities, R&D subventions and gains on sale of assets. In the consolidated income statement by function (1.2.1), transport recharges are not included in ‘Other income’, but spread by function.(3) Other operating charges cover a number of general expenses, mostly non-profit related taxes such as property tax, ‘taxe foncière’ in France and similar. In the consolidated income statement by function (1.2.1), taxes on tangible assets are not included in ‘Other expenses’, but spread by function. On the other hand, provisions for liabilities and charges are included in ‘Other expenses’, while they are shown separately here.
- Half year report 2017 18
1.2.3. Consolidated statement of total comprehensive income | In thousands of euros
NoteSix months ended
30 June 2017Six months ended
30 June 2017
Unaudited Unaudited
Group profit (loss) 1.2.1 12 063 13 903
Exchange differences on translating foreign operationsExchange difference arising during the period 1.4 -1 114 -559Cash flow hedgesGains (losses) arising during the period 1.4 688 -2 364Income tax -234 803
Net other comprehensive income (loss) potentially to be reclassified to profit or loss in subsequent periods
-659 -2 119
Remeasurement of defined benefit obligationGains (losses) arising during the period 1.4 61 -55Income tax -20 18
Net other comprehensive income (loss) not to be reclassified to profit or loss in subsequent periods
40 -36
Other comprehensive income (loss) after tax impact -619 -2 156
Total comprehensive income (loss) for the period 11 444 11 747
Attributable to shareholders of Sioen Industries 11 444 11 747Attributable to non-controlling interests 0 0
- Half year report 2017 19

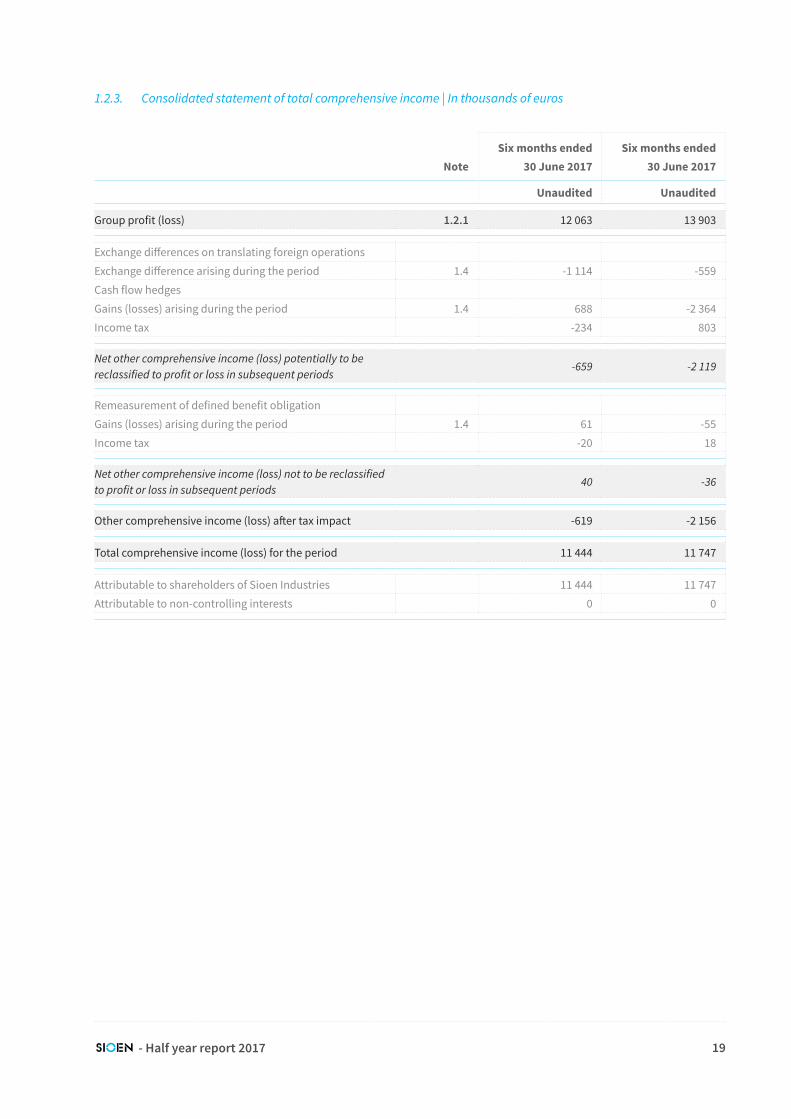
1.3. Consolidated statement of cash flows | In thousands of euros
NoteSix months ended
30 June 2017Six months ended
30 June 2016Unaudited Unaudited
Group profit (loss) 1.2.1 12 063 13 903
Income tax (1) 6 545 7 577 Financial charges (1) 5 078 5 290 Financial income (1) -674 -585 Share in the result of associates 114
Operating result (1) 23 125 26 185
Depreciation and amortisation of non-current assets 10 337 7 323Write off inventories and receivables 713 -1 175Provisions -1 120 -650Movements in working capital:
Inventories -4 113 -13 262
Trade receivables -8 824 -10 781
Other long term assets, other receivables & deferred charges and accrued income
-1 709 158
Trade and other payables 1 854 1 747
Current income tax liabilities, social debts, other amounts payable & accrued charges and deferred income
6 705 5 722
Amounts written off inventories and receivables 427 165
Cash flow from operating activities 27 395 15 432
Income taxes paid -4 049 -2 346
Net cash flow from operating activities 23 346 13 086
Interest received 49 198
Other financial assets (deposits) -14 19 030
Acquisitions/sale of subsidiaries -27 713 -3 305
Investments in intangible and property, plant and equipment -4 671 -3 872
Disposal and sale of intangible and property, plant and equipment 321 31
Net cash flow from investing activities -32 028 12 082
Net cash flow before financing activities -8 682 25 168
Interest paid -782 -1 429
Disbursed dividend -10 483 -9 494
Increase/(decrease) borrowings 26 007 -38 806
Increase/(decrease) obligations under finance leases -308 -747
Other -722 -18 286 (2)
Currency result -1 165 -3 210
Net cash flow from financing activities 12 548 -71 972
Impact of cumulative translation adjustments and hedging -1 273 -147
Change in cash and cash equivalents 2 593 -46 951
Cash and cash equivalents at the beginning of the year 16 596 89 261
Cash and cash equivalents at the end of the year 1.1 19 189 42 310
(1) Including discontinued operations(2) Cash settlement of interest rate collar, see also paragraph 2.20. Financial instruments.
- Half year report 2017 21
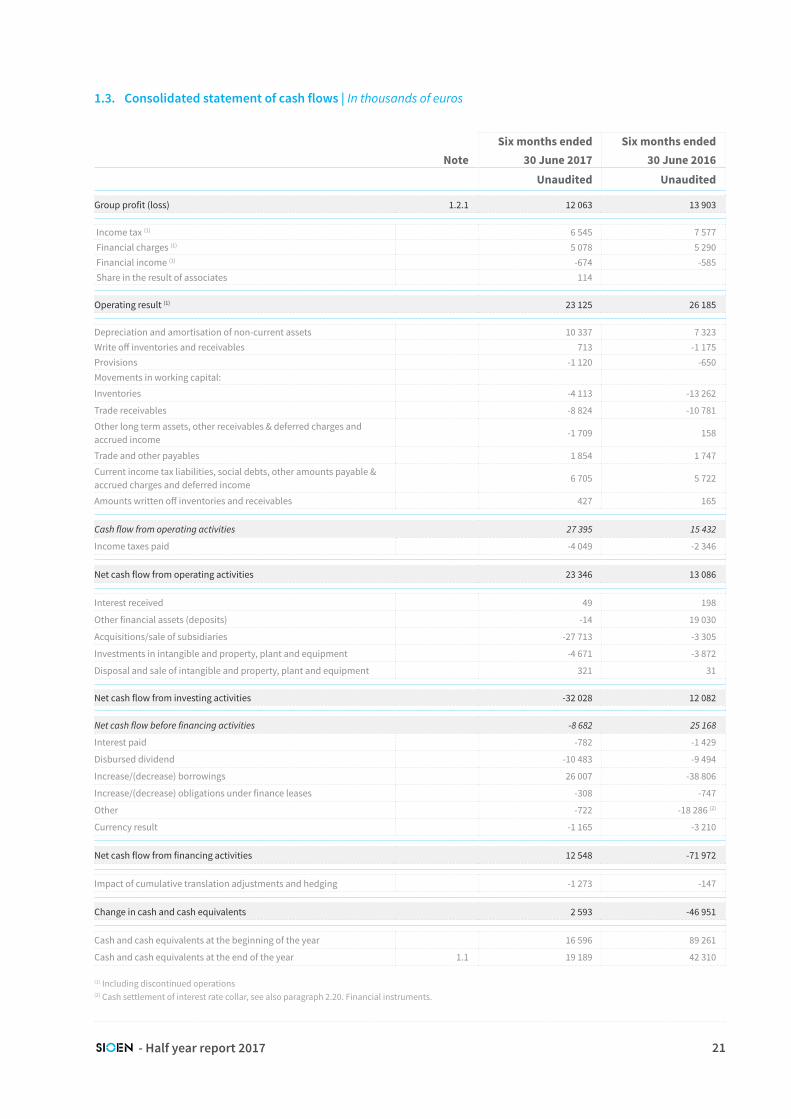
1.4. Consolidated statement of changes in equity | In thousands of eurosSh
are
capi
tal
Rese
rves
Other reserves
Equi
ty b
efor
e no
n-
cont
rolli
ng in
tere
st
Non
-con
trol
ling
in
tere
st
Equi
ty
Not
e
Fore
ign
curr
ency
tr
ansl
atio
n re
serv
e
Reva
luat
ion
surp
lus
Pens
ion
rese
rves
Trea
sury
shar
es
Hed
ging
rese
rves
Balance at 1 January 2017
46 000 151 708 2 344 76 -334 -10 609 189 186 189 186 1.1
Group profit (loss) 12 063 12 063 12 063 1.2.1
Hedging 688 688 688 1.2.3
Currency translation adjustments
-1 114 -1 114 -1 114 1.2.3
Remeasurement of defined benefit obligation
61 61 61 1.2.3
Deferred tax -20 -234 -254 -254
Total comprehensive income for the period
12 063 -1 114 40 454 11 444 11 444 1.2.3
Payment of dividends -10 483 -10 483 -10 483
Purchase of treasury sharesElimination of treasury shares purchased
Balance at 30 June 2017 46 000 153 287 1 230 76 -294 -10 154 190 146 190 146 1.1
- Half year report 2017 22

Shar
e ca
pita
l
Rese
rves
Other reserves
Equi
ty b
efor
e no
n-
cont
rolli
ng in
tere
st
Non
-con
trol
ling
in
tere
st
Equi
ty
Not
e
Fore
ign
curr
ency
tr
ansl
atio
n re
serv
e
Reva
luat
ion
surp
lus
Pens
ion
rese
rves
Trea
sury
shar
es
Hed
ging
rese
rves
Balance at 1 January 2016
46 000 135 825 2 294 76 -174 -581 -9 483 173 957 173 957
Group profit (loss) 13 903 13 903 13 903 1.2.1
Hedging -2 364 -2 364 -2 364 1.2.3
Currency translation adjustments
-559 -559 -559 1.2.3
Remeasurement of defined benefit obligation
-55 -55 -55 1.2.3
Deferred tax 18 803 822 822
Total comprehensive income for the period
13 903 -559 -36 -1 560 11 747 11 747
Payment of dividends -9 494 -9 494 -9 494
Elimination of treasury shares purchased
-581 581
Balance at 30 June 2016 46 000 139 653 1 735 76 -211 -11 043 176 211 176 211
- Half year report 2017 23
2. Notes to the consolidated financial statements
2.1. Application of new and revised International Financial Reporting Standards (IFRSs)
In the current year, the Group has adopted all of the new and revised Standards and Interpretations issued by the International Accounting Standards Board (the IASB) and the International Financial Reporting Interpretations Committee (the IFRIC) of the IASB that are relevant to its operations and effective for annual reporting periods beginning on 1 January 2017, all of which were endorsed by the European Union.
Standards and interpretations applicable for the annual period beginning on 1 January 2017
- Annual improvements to IFRS Standards 2014-2016 Cycle: Amendments to IFRS 12 (applicable for annual periods beginning on or after 1 January 2017, but not yet endorsed by the EU)
- Amendments to IAS 7 Statement of Cash Flows - Disclosure
Initiative (applicable for annual periods beginning on or after 1 January 2017, but not yet endorsed by the EU)
- Amendments to IAS 12 Income Taxes - Recognition of
Deferred Tax Assets for Unrealised Losses (applicable for annual periods beginning on or after 1 January 2017, but not yet endorsed by the EU)
The mandatory application of all amendments to or improvements of standards and interpretations listed above did not give rise to any major effects on the Group’s financial position and financial performance.
Standards and interpretations published, but not yet applicable for the annual period beginning on 1 January 2017
- Annual improvements to IFRS Standards 2014-2016 Cycle: Amendments to IFRS 1 and IAS 28 (applicable for annual periods beginning on or after 1 January 2018, but not yet endorsed in the EU)
- IFRS 9 Financial Instruments and subsequent amendments (applicable for annual periods beginning on or after 1 January 2018)
- IFRS 15 Revenue from Contracts with Customers
(applicable for annual periods beginning on or after 1 January 2018)
- IFRS 16 Leases (applicable for annual periods beginning on or after 1 January 2019, but not yet endorsed in the EU)
- Amendments to IAS 40 Transfers of Investment Property
(applicable for annual periods beginning on or after 1 January 2018, but not yet endorsed in the EU)
- IFRIC 22 Foreign Currency Transactions and Advance
Consideration (applicable for annual periods beginning on or after 1 January 2018, but not yet endorsed in the EU)
- IFRIC 23 Uncertainty over Income Tax Treatments (applicable for annual periods beginning on or after 1 January 2019, but not yet endorsed in the EU)
- Half year report 2017 24

IFRS 15 Revenue from contracts with customers
IFRS 15 is the new revenue standard and will supersede all current revenue recognition requirements under IFRS. It consists of a five-step model to account for revenue arising from contracts with customers.
During 2017 the company started a detailed assessment of the impact of IFRS 15. Based on a top-down risk assessment the impact of this new standard is expected to be very limited for the Sioen Industries Group, as the Sioen Industries Group is an industrial group whose performance obligations according to IFRS 15 are mainly limited to the delivery of goods. As such there is no major impact expected compared to the current IAS 18 standard on revenues.
For the IFRS 15 top-down assessment we have made a distinction between the following revenue streams: industry/distributors, retail and business to government/tenders across the different divisions. For each of these different revenue streams we have identified some IFRS 15 attention points (like rebates & discounts, considerations payables to retailers, customer specific contracts, …).
For rebates & discounts (which are mainly applicable to our industry/distributor and retail revenue streams) the allocation to the correct reporting period is assured by the set-up of our software applications. Even within the business to government/tenders revenue stream the impact of IFRS 15 is very limited as the performance obligation in a tender is in most cases also limited to the one-time delivery of goods. There are some multi-year governmental contracts, which will be further analyzed in the second half year of 2017 on a case-by-case basis for IFRS 15 impact, but also here no significant impact on the Group’s consolidated financial result or position.
It is expected that the other standards and interpretations, not yet applicable, will have no significant impact on the Group’s consolidated financial result or position.
- Half year report 2017 25

2.2. Reporting entity
The consolidated interim financial statements of Sioen Industries NV (the ‘Company’) include the financial statements of the Company and its subsidiaries (together referred to as the ‘Group’).
The consolidated interim financial statements give a general overview of the Group’s activities and the results obtained. They give an accurate picture of the entity’s financial position, financial performance and cash flow, and are drawn up on a going concern basis.
The consolidated interim financial statements are stated in thousands of euros, unless stated otherwise, as the euro is the currency of the primary economic environment in which the Group is active. The financial statements of foreign participations are converted in accordance with the principles described in the section ‘Foreign currencies’ of the annual report 2016.
2.3. Statement of compliance with IFRs
These interim consolidated financial statements are for the six months ended 30 June 2017. They have been prepared in accordance with International Accounting Standard (IAS) 34 Interim Financial Reporting.
The interim consolidated financial statements do not include all of the information required in annual financial statements in accordance with IFRS, and should be read in conjunction with the consolidated financial statements of the Group for the year ended 31 December 2016.
2.4. Significant accounting policies
These consolidated interim financial statements have been prepared in accordance with the accounting policies adopted in the last annual financial statements for the year ended 31 December 2016.
The accounting policies have been applied consistently throughout the Group for the purposes of preparation of these consolidated interim financial statements.
- Half year report 2017 26

2.5. Seasonality of interim operations
The consolidated income statement of the Group reflects the seasonal nature of the activities, more than half of the annual results are generated in the first half of the year. Future results will depend on developments in the market for technical textiles. Adverse changes in the economic environment, customer investment cycles, major developments in production and market acceptance of new applications in this market can influence this market and as a consequence the results of the Group.
2.6. Significant events and transactions
The Group’s management believes that the Group is well positioned in the current economic circumstances.
Overall, the Group is in a strong position and has sufficient capital and liquidity to service its operating activities and debt. The Group’s objectives and policies for managing capital, credit risk and liquidity risk are described in its recent annual financial statements.
2.7. Assessment criteria in the application of the valuation rules
In the application of the valuation rules, in certain cases an accounting assessment must be made. This assessment is done by making the most accurate assessment possible of uncertain future evolutions. The management determines its assessment on the basis of different realistically assessed parameters, such as future market expectations, sector growth rates, industry studies, economic realities, budgets and multi-year plans, expected profitability studies, etc. The most important elements within the Group that are subject to this are: impairments, provisions and deferred tax items.
Impairment test for the six months ended 30 June 2017
In order to provide the stakeholders with in-depth knowledge as to the financial strength of the Group, we reassessed the recoverable amount of goodwill for each of the cash-generating units.
Key assumptions related to all divisions of the Group, as described in our annual report of 2016, are still valid and review based on the latest developments did not result in any adverse changes. There are no impairment indicators during the first half of the year.
- Half year report 2017 27
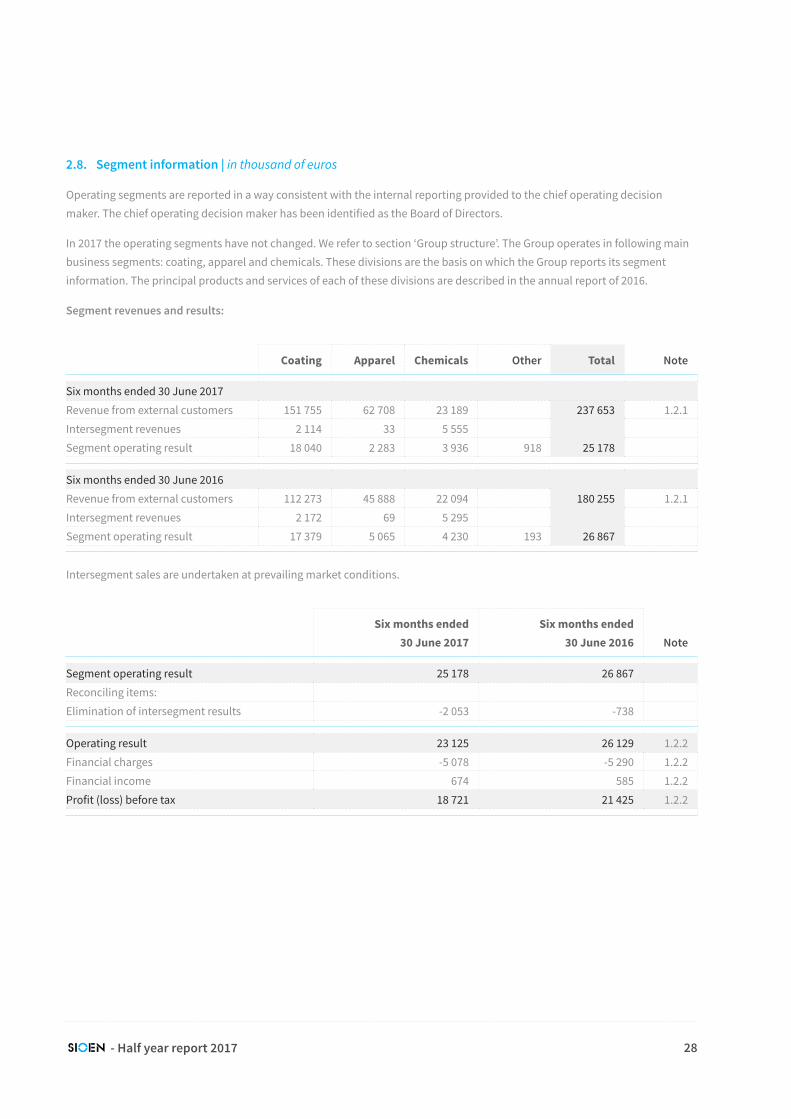
2.8. Segment information | in thousand of euros
Operating segments are reported in a way consistent with the internal reporting provided to the chief operating decision maker. The chief operating decision maker has been identified as the Board of Directors.
In 2017 the operating segments have not changed. We refer to section ‘Group structure’. The Group operates in following main business segments: coating, apparel and chemicals. These divisions are the basis on which the Group reports its segment information. The principal products and services of each of these divisions are described in the annual report of 2016.
Segment revenues and results:
Coating Apparel Chemicals Other Total Note
Six months ended 30 June 2017Revenue from external customers 151 755 62 708 23 189 237 653 1.2.1Intersegment revenues 2 114 33 5 555Segment operating result 18 040 2 283 3 936 918 25 178
Six months ended 30 June 2016Revenue from external customers 112 273 45 888 22 094 180 255 1.2.1Intersegment revenues 2 172 69 5 295Segment operating result 17 379 5 065 4 230 193 26 867
Intersegment sales are undertaken at prevailing market conditions.
Six months ended 30 June 2017
Six months ended 30 June 2016 Note
Segment operating result 25 178 26 867Reconciling items:Elimination of intersegment results -2 053 -738
Operating result 23 125 26 129 1.2.2Financial charges -5 078 -5 290 1.2.2Financial income 674 585 1.2.2Profit (loss) before tax 18 721 21 425 1.2.2
- Half year report 2017 28

Segment assets and liabilities:
Coating Apparel Chemicals OtherUnallocated/eliminations
Total Note
Six months ended 30 June 2017Segment assets 301 478 125 475 33 659 6 576 -5 284 461 903 1.1Segment liabilities 256 516 100 727 21 108 39 241 -145 834 271 758 1.1
Year ended 31 December 2016Segment assets 228 030 112 560 28 810 6 977 -7 971 368 406 1.1Segment liabilities 167 799 86 654 16 786 40 551 -132 570 179 227 1.1
The segment liabilities, including the centrally contracted financial debt, have been allocated according the capital employed by the segment. The assets and liabilities of the head office (Group) have been allocated to the segments as good as possible. Unallocated assets or liabilities are head office assets/liabilities which have not been allocated to the segments.
Information about major customers:
There is no reliance on a limited number of customers and there are no revenues from transactions with a single external customer amounting to 10% or more of the total Group revenues.
Other segment information:
Coating Apparel Chemicals Other Head office Total Note
Six months ended 30 June 2017Depreciation and amortisation
6 977 2 349 490 92 429 10 337 1.2.2
Additions to non-current assets
34 923 11 550 156 695 47 324
Six months ended 30 June 2016Depreciation and amortisation
5 234 772 721 92 531 7 350 1.2.2
Additions to non-current assets
2 848 590 193 546 4 177
- Half year report 2017 29

2.9. Exchange rates
Code Rate 30 June 2017 31 December 2016 30 June 2016
EUR average 1.0000 1.0000 1.0000closing 1.0000 1.0000 1.0000
USD average 1.0934 1.1032 1.1142closing 1.1412 1.0541 1.1102
GBP average 0.8612 0.8227 0.7850closing 0.8793 0.8561 0.8265
RMB average 7.4934 7.3416 7.2955closing 7.7387 7.3201 7.3757
PLN average 4.2474 4.3745 4.3785closing 4.2258 4.4103 4.4362
TND average 2.5875 2.3824 2.3051closing 2.7754 2.4301 2.4380
UAH average 29.1206 28.4010 28.5063closing 29.5247 28.5470 27.5103
AUD average 1.4420 1.4852closing 1.4851 1.4596
SEK average 9.5960 9.4715closing 9.6395 9.5529
- Half year report 2017 30

2.10. Income taxes relating to continuing operations | in thousands of euros
Note Six months ended
30 June 2017 Six months ended
30 June 2016
Profit (loss) before taxes 1.2.1 18 721 21 425
Income tax expense calculated at theoretical tax rate (1) 5 975 31.9% 7 155 33.4%
Tax impact of:effect of expenses that are not deductible in determining taxable profit (2) 319 1.7% 464 2.2%
effect of revenue under favourable tax regime (3) - 182 -1.0% - 41 -0.2%
withholding taxes 149 0.8% 154 0.7%movement on deferred tax assets not recognized
- 218 -1.2% - 39 -0.2%
tax assets recognized on previously not recognized losses
- 40 -0.2%
adjustments recognized in current year in relation to the tax of prior years
54 0.3% 4 0.0%
notional interest deduction - 123 -0.7% - 152 -0.7%changes in tax rate - 49 -0.2%new valuation allowance on previously recognized deferred tax assets
571 3.1%
Income tax expense recognized in profit or loss
1.2.1 6 545 35.0% 7 456 34.8%
(1) Weighted average tax rate(2) Mainly disallowed expenses in Belgium(3) Corporate income tax rates of 10% or lower are considered as favourable tax regimes
- Half year report 2017 31
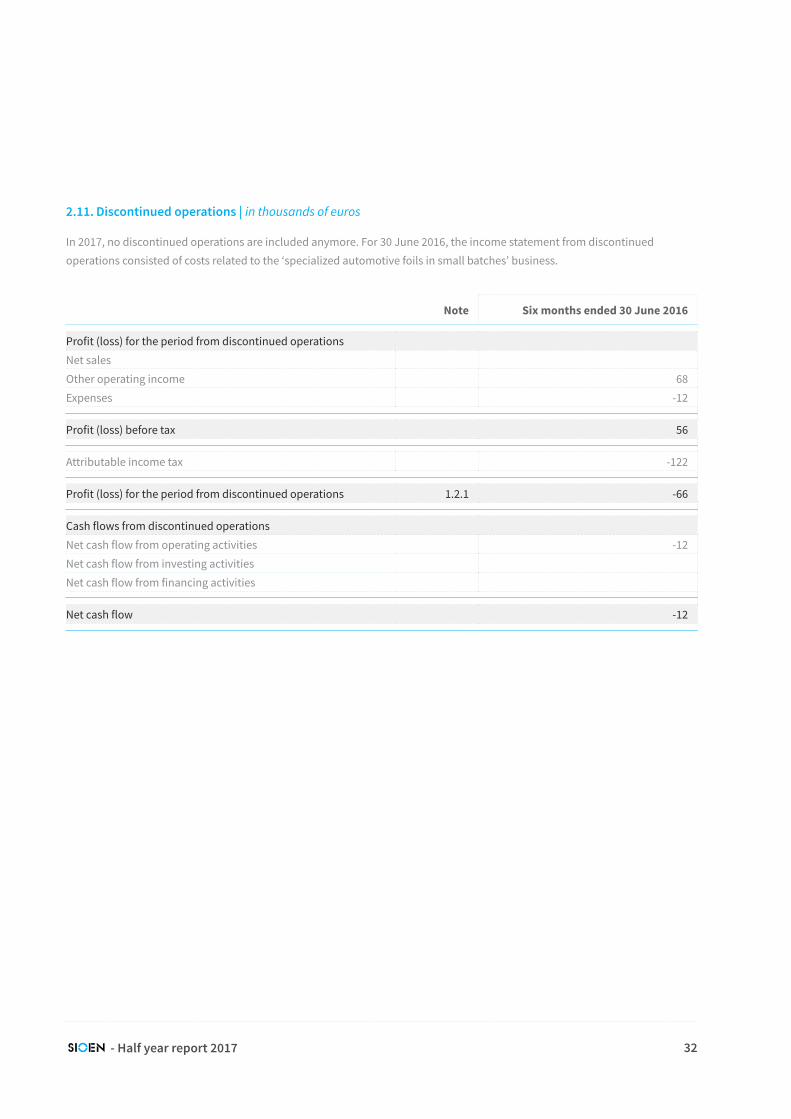
2.11. Discontinued operations | in thousands of euros
In 2017, no discontinued operations are included anymore. For 30 June 2016, the income statement from discontinued operations consisted of costs related to the ‘specialized automotive foils in small batches’ business.
Note Six months ended 30 June 2016
Profit (loss) for the period from discontinued operationsNet salesOther operating income 68Expenses -12
Profit (loss) before tax 56
Attributable income tax -122
Profit (loss) for the period from discontinued operations 1.2.1 -66
Cash flows from discontinued operationsNet cash flow from operating activities -12Net cash flow from investing activitiesNet cash flow from financing activities
Net cash flow -12
- Half year report 2017 32

2.12. Debt and equity securities
There were no insurances, repurchases and repayments of equity securities for the six months ended 30 June 2017.
2.13. Dividends
The Board of Directors does not propose to pay an interim dividend for the six months ended 30 June 2017.
2.14. Property, plant and equipment
During the reporting period, the Group invested for approximately EUR 4.7 million on assets compared to EUR 3.7 million over the same period ended 30 June 2016. Investments in 2017 and 2016 mainly related to machinery in the coating division.
The net value of assets sold and disposed in 2017 was minor, compared to a net value of EUR 0.2 million over the same period of last year.
An impairment analysis has been done at the end of June 2017 (see ‘impairment test’ review).
At 30 June 2017, the Group had contractual commitments for the acquisition of property, plant & equipment for a total amount of EUR 6.0 million.
- Half year report 2017 33

2.15. Inventories | in thousands of euros
Gross inventory Note 30 June 2017 31 December 2016
Raw materials 34 765 21 248Consumables 577 251Work in progress 7 129 5 406Finished goods 89 519 88 063Goods in transit 3 712 5 035
135 702 120 003
Amounts written off Note 30 June 2017 31 December 2016
Amounts written off raw materials -3 063 -2 527Amounts written off consumablesAmounts written off work in progressAmounts written off finished goods -3 194 -3 003Amounts written off goods in transit
-6 257 -5 530
Net inventory Note 30 June 2017 31 December 2016
Raw materials 31 702 18 721Consumables 577 251Work in progress 7 129 5 406Finished goods 86 325 85 060Goods in transit 3 712 5 035
1.1 129 445 114 473
- Half year report 2017 34

Amounts written of inventory 31 December 2016 Writedown Reversal
Exchange rate
differences
(Other) movements
or adjustments 30 June 2017
5 530 985 -162 -96 6 257
Amounts written of inventory 31 December 2015 Writedown Reversal
Exchange rate
differences
(Other) movements
or adjustments 31 December 2016
6 726 578 -1 806 32 5 530
Gross inventories (excl. write-off) increased by EUR 15.7 million or 13.1%, mainly due to the acquisitions.
Obsolescence reserves on inventories increased compared to 31 December 2016 and amount to EUR 6.3 million at the end of the reporting period compared with EUR 5.5 million at the end of 2016. Obsolescence reserves are recorded on the basis of a detailed aging and rotation analysis per unit.
- Half year report 2017 35

2.16. Provisions | in thousands of euros
31 D
ecem
ber 2
016
Addi
tiona
l pro
visi
on
reco
gniz
ed
Redu
ctio
ns a
risi
ng
from
pay
men
ts
Reve
rsal
Exch
ange
rate
di
ffere
nces
Acqu
ired
vi
a bu
sine
ss
com
bina
tion
30 J
une
2017
Not
e
Provisions for environmental issues
269 -27 243
Provisions for other liabilities and charges
2 152 11 -1 104 -44 1 015
Total provisions 2 421 11 -1 131 -44 1 257
More than one year Within one year
Provisions for environmental issues
188 54
Provisions for other liabilities and charges
969 46
Total provisions 1 157 100 1.1
- Half year report 2017 36

31 D
ecem
ber 2
015
Addi
tiona
l pro
visi
on
reco
gniz
ed
Redu
ctio
ns a
risi
ng
from
pay
men
ts
Reve
rsal
Exch
ange
rate
di
ffere
nces
Acqu
ired
vi
a bu
sine
ss
com
bina
tion
31 D
ecem
ber 2
016
Not
e
Provisions for environmental issues
353 81 -164 -1 269
Provisions for other liabilities and charges
2 063 1 095 -521 -504 2 16 2 152
Total provisions 2 416 1 176 -685 -506 2 16 2 421
More than one year Within one year
Provisions for environmental issues
188 81
Provisions for other liabilities and charges
2 043 109
Total provisions 2 231 190 1.1
The carrying amount of the provisions reflects the net present value of future liabilities discounted at the weighted average cost of capital, applicable for the operating unit.
The provisions for environmental issues consist of a provision relating to the sanitation of land in the coating division. The risks were identified during the periodical environmental check-up of the sites.
The provisions for other liabilities and charges mainly relate to a provision for property taxes.
The most significant movement in 2017 is the reduction arising from the payment of restructuring provisions.
- Half year report 2017 37

2.17. Borrowings
Long-term
The Sioen Industries Group is financed by two long term bank loans:
- A EUR 50.0 million bullet loan which is due on 20 April 2026 with a fixed interest rate.
- A EUR 15.5 million instalment loan, which has to be repaid via twenty bi-annual instalments (10 year loan with last instalment on 29 March 2026) with a EURIBOR based variable interest rate. The non-current part of this loan at 30 June 2017 is EUR 12.4 million.
Next to those, Manifattura Fontana SPA in Italy (acquired in 2016) holds multiple external loan agreements which expire gradually in the coming years. The Group intends to phase out these local loans. On 30 June 2017, the long term part of these local loans was EUR 2.0 million.
The Group is subject to financial covenants on its EUR 50 million and EUR 15.5 million bank loans: the total net leverage (ratio of the Net Financial Debt at the end of a period to the EBITDA on continuing operations over that period) may not exceed 3.50. In case there would be a breach of the financial covenants, a twelve month remediation period is applicable. Apart from these financial covenants, no other material covenants apply, except for general terms and conditions applicable to general finance agreements in Belgium.
Short-term
As per 30 June 2017, short-term loans amounted to EUR 95.4 million:
- Straight loans in USD and EUR amounted to USD 1.7 million and EUR 90.0 million respectively, with a weighted average interest rate of 0.39%.
- Manifattura Fontana SPA in Italy (see also above paragraph on long term loans) has a EUR 0.5 million short term credit facility (backed by trade receivables) and a EUR 0.4 million short term portion of long term debts
- The Ursuit Group in Finland (also acquired in 2016) has EUR 1.4 million short term loans
- The current part of the EUR 15.5 million instalment loan: EUR 1.55 million
As per 31 December 2016, short-term loans amounted to EUR 23.7 million:
- Straight loans in USD and EUR amounted to USD 0.9 million and EUR 17.0 million respectively, with a weighted average interest rate of 0.39%.
- Manifattura Fontana SPA in Italy had a EUR 2.0 million short term credit facility (backed by trade receivables) and a EUR 1.1 million short term portion of long term debts
- The Ursuit Group in Finland has EUR 1.1 million short term loans
- The current part of the EUR 15.5 million instalment loan: EUR 1.55 million
- Half year report 2017 38

2.18. Obligations under finance leases
There were no new commitments for the acquisition of intangibles and property, plant and equipment at the end of the reporting period.
2.19. Share capital & shareholder structure
On 30 June 2017, the share capital amounted to EUR 46 million, represented by 19 779 933 shares.
Ownership of the Company's shares was as follows:
Notifying partyDate of
notificationNumber
of shares
% of total number
of shares
Sihold NV (1) and companies/parties under the influence of the family Sioen
7 March 2014 12 906 212 65.25%
Total 1.2.1 12 906 212 65.25%
(1) Sihold NV is controlled by Sicorp NV, which is controlled in turn by the Dutch foundation Stichting Administratiekantoor Midapa. This foundation is controlled by Mrs. Sioen.
There were no movements in the issued capital of the Company in either current or the prior interim reporting periods.
- Half year report 2017 39

2.20. Financial instruments | in thousands of euros
30 June 2017 31 December 2016Fair value hierarchy
Nominal value Fair value Nominal value Fair value
FX derivatives 6 826 (1) - 297 30 947 (1) 394 2Interest rate swaps 65 500 - 513 65 500 - 219 2
Nominal value (1) Fair value Nominal value (1) Fair value
Finance leases 5 338 6 282 6 690 3Bank loans 159 803 159 750 90 122 3
Total 165 142 166 032 96 812
Financial risk management
The Group manages a portfolio of derivatives to hedge against risks relating to exchange rate and interest rate positions arising as a result of operating and financial activities. It is the Group’s policy to avoid engaging in speculative transactions or transactions with a leverage effect and not to hold derivatives for trading purposes.
Fair value
Financial instruments are recognized at fair value. The fair value is determined based on one of the following levels of the fair value hierarchy:
- Level 1: measurement is based on quoted market prices in active markets
- Level 2: measurement is based on (externally) observable information, either directly or indirectly
- Level 3: measurement is based either fully or partially on not (externally) observable information
Non-derivative financial liabilities
The fair value of non-derivate financial liabilities is calculated based on commonly-used valuation techniques (i.e. net present value of future principal amounts and interest charges discounted at market rate). These are based on
market inputs from reliable financial information providers. Fair values determined by reference to prices provided by reliable financial information providers are periodically checked for consistency against other pricing sources.
Interest risk management
On 21 April 2011, the Group entered into a cash flow hedge to hedge, within certain limits, the interest rate risk on highly probable future debt to be issued in March 2016 for a term of 10 years, for a principal amount of EUR 50 million. For this purpose, the Group entered into a forward starting interest rate collar for a nominal amount of EUR 50 million. A collar is a derivative financial instrument by which the buyer of the instrument receives / executes payments at the end of the reference period in which the interest rate evolves out of the agreed upon borders (upper and lower border / tunnel. The forward starting interest rate collar was settled in cash on 14 March 2016 (EUR 18.1 million, which represents the fair value of the forward starting interest rate collar on that date). The effective part of the loss on the derivative will be amortized to profit or loss over the term of the hedged debt (ie. over a term of 10 years).
- Half year report 2017 40

The fair value of the forward starting collar as of 31 December 2015 was EUR -15.4 million and changed to EUR -18.1 million (gross of tax) on the settlement date (14 March 2016).
The effective part of the total change in fair value of the derivative until the settlement date (14 March 2016), of EUR 1.7 million (net of tax), was recognized in other comprehensive income (cash flow hedge reserve). On the settlement date the total effective part of the loss on the derivative (recognized in other comprehensive income) was EUR 11.2 million (net of taxes):
- EUR 17.0 million gross of taxes
- EUR - 5.8 million tax effect
The amount gross of taxes will be expensed via financial charges over the term of the hedged debt (i.e. over a 10 year period starting from 20 April 2016, the starting date of the new EUR 50 million loan). The amount of financial charges which was transferred from other comprehensive income to profit and loss during the first half of 2017 was EUR 0.7 million (cost).
To hedge its interest rate risks and to take advantage of the current market interest rates, the group entered into new interest rate derivatives together with the new loan agreements:
- Interest Rate Swap (IRS) on the new EUR 50 million bullet loan to change the contractual fixed interest rate to a variable interest rate with a floor of 0% and a cap of 2.5%
- Interest Rate Swap (IRS) on the new EUR 15.5 million instalment loan to change the contractual variable interest rate to a fixed interest rate. The nominal amount of the IRS is decreasing in line with the loan agreement.
At 30 June 2017, the fair value of these interest rate swaps was EUR -513 307 (fair value through profit & loss). This fair value is determined by Sioen on a quarterly basis, based on market value reports delivered by the issuing financial institute.
2.21. Related party transactions | in thousands of euros
Nature of transaction Six months ended 30 June 2017 Six months ended 30 June 2016
Inch Sale 250 144Verba Purchase 59
These transactions consist of commercial transactions and are done on an ‘at arm’s length’ basis.
Other transactions with related parties, other than Directors, are not included given, the negligible amount (under EUR 25 000).
- Half year report 2017 41

2.22. Acquisitions and disposal of subsidiaries | in thousands of euros
2017
Verseidag Ballistic Protection
On 19 December 2016, the Group announced the acquisition of Verseidag Ballistic Protection OY, a Finnish manufacturer of ballistic protection.
Sioen Industries acquired 100% of the shares in Verseidag Ballistic Protection OY.
Operating under the motto “Life-saving design” Verseidag Ballistic Protection is a fully integrated manufacturer of armour products (a full range of vests, both overt and covert, tactical vests, EOD suits and shields). Verseidag Ballistic Protection OY has manufacturing facilities in Finland and sales forces in Finland, Germany and the UK. The key to their success and good reputation is based on continuous product development, adoption of the highest quality standards and customized solutions. Through this acquisition Sioen Armour Technology and Verseidag Ballistic Protection will become one of the leading companies on the European market offering a wide range of ballistic solutions to their customers.
The agreed upon pricing formula contained a specific clause regarding the financial position as at 31 December 2016. Depending on the outcome, the transaction could be reconsidered. As a consequence, the Verseidag figures are included in the figures of the Sioen Group as from 1 January 2017 onwards.
- Half year report 2017 42

The following table summarizes the consideration paid and the amounts of assets and liabilities at the acquisition date:
Verseidag Ballistic Protection
Intangible assets 2 836
Property, plant and equipment 215
Total non-current assets 3 051
Inventories 4 023
Trade receivables 3 478
Other current assets 181
Cash and cash equivalents 54
Total current assets 7 736
Borrowings 333
Deferred tax liabilities 633
Total non-current liabilities 966
Trade and other payables 1 780
Borrowings 337
Other current liabilities 766
Total current liabilities 2 884
Total net assets acquired 6 937
Consideration (paid in cash) 18 000
Total acquisition cost 18 000
Goodwill 11 063
Direct costs attributable to the acquisition amount to EUR 36 thousand at the end of June 2017. They have been included in the line item services and other goods in the income statement by nature and in administrative expenses in the income statement by function. Accounting for the acquisition is not yet complete.
Until June 2017, Verseidag has contributed 6 months of net sales and EBITDA: EUR 11.5 million to the total net sales of the Group, contributing to the net result (EUR 1.8 million EBITDA).
- Half year report 2017 43

2017
UCS
On 9 January 2017, the Group announced the acquisition of U.V. Curable Systems BVBA, a company active in the development, production and sale of radiation curing primers, inks and varnishes for industrial applications. Radiation curing is a process of chemical ‘drying’ under the influence of light. This is a promising and future oriented technology as the markets evolve more and more to inks, primers and varnishes without solvents.
Sioen Industries acquired 100% of the shares in U.V. Curable Systems BVBA.
The final share purchase agreement was signed on 9 January 2017 (date on which effective control was transferred). As a consequence, the UCS figures are included in the figures of the Sioen Group as from 1 January 2017 onwards.
- Half year report 2017 44

The following table summarizes the consideration paid and the amounts of assets and liabilities at the acquisition date:
UCS
Intangible assets 1 161
Property, plant and equipment 29
Total non-current assets 1 191
Inventories 191
Trade receivables 114
Other current assets 5
Cash and cash equivalents 38
Total current assets 346
Borrowings 15
Deferred tax liabilities 395
Total non-current liabilities 409
Trade and other payables 88
Borrowings 131
Other current liabilities 16
Total current liabilities 236
Total net assets acquired 892
Upfront consideration (paid in cash) 642
Fair value variable deferred consideration 250
Total acquisition cost 892
Accounting for the acquisition is complete.
Until June 2017, UCS has contributed 6 months of net sales and EBITDA: EUR 0.4 million to the total net sales of the Group, contributing to the net result (EUR 0.1 million EBITDA).
- Half year report 2017 45

2017
James Dewhurst Group
On 23 May 2017, the Group announced the acquisition of the James Dewhurst Group. James Dewhurst is a leading manufacturer of technical textiles and Europe’s largest producer of open construction laid scrims with production facilities both in the UK and the US.
Sioen Industries acquired 100% of the shares of the James Dewhurst Group. The activities of the James Dewhurst Group are concentrated in two operating companies: James Dewhurst Ltd. in the UK and Dewtex in the US(1).
James Dewhurst Group has successfully developed a proprietary manufacturing technology that allowed it to establish a market leading position in the supply of open construction laid scrims. With this acquisition Veranneman Technical Textiles, a division of Sioen Industries, reinforces its position in the market of the reinforcement textiles and completes its product range. The new configuration can offer a full range of woven, laid and laminate scrims and fabrics.
The James Dewhurst Group figures are included in the figures of the Sioen Group as from 1 June 2017 onwards.
(1) Sioen Industries holds the shares in James Dewhurst Ltd. via holding companies Jade Equity Ltd., Emerald Bond Ltd. and Jade Mezzanine Ltd. There is also one dormant subsidiary: James Dewhurst Trustees Ltd.
- Half year report 2017 46

The following table summarizes the consideration paid and the amounts of assets and liabilities (before fair value assessments) at the acquisition date:
James Dewhurst Group
Property, plant and equipment 9 450
Deferred tax assets 454
Total non-current assets 9 905
Inventories 7 313
Trade receivables 7 747
Other current assets 639
Cash and cash equivalents 1 170
Total current assets 16 869
Borrowings 40 662
Total non-current liabilities 40 662
Trade and other payables 3 661
Borrowings 2 205
Other current liabilities 1 616
Total current liabilities 7 482
Total net assets acquired -21 370
Consideration (paid in cash) 9 702
Total acquisition cost 9 702
Goodwill before purchase price allocation 31 072
Direct costs attributable to the acquisition amount to EUR 0.3 million at the end of June 2017. They have been included in the line item services and other goods in the income statement by nature and in administrative expenses in the income statement by function. Accounting for the acquisition is not yet complete.
Until June 2017, James Dewhurst has contributed 1 month of net sales and EBITDA: EUR 4.2 million to the total net sales of the Group, contributing to the net result (EUR 0.5 million EBITDA).
If the acquisition had taken place at the beginning of the year, the total net sales would have been EUR 24.2 million and the EBITDA for the period would have been EUR 3.9 million.
Disposals
There were no disposals during the first half of 2017.
- Half year report 2017 47

2016
Fontana
On 4 March 2016, Sioen announced the acquistion of Manifattura Fontana S.p.A., an Italian producer of geotextile non-wovens, serving the European civil engineering market.
In a first phase, Sioen Industries Group acquired 90% of the shares. The other 10% of shares are under escrow and will be acquired by means of a variable deferred cash consideration in 2021, which is capped at EUR 1.5 million. As the transfer of 10% of the shares is irrevocable, a 100% participation in Manifattura Fontana S.p.A. was recognized in the consolidated figures. The variable deferred cash consideration is reflected as a liability in the consolidated statement of financial position.
The acquisition is consistent with the Group strategy, aimed at technology driven, sustainable and profitable growth:
It opens a new and promising market: geosynthetics. This market is driven by the growing global demand for improved infrastructure.
It provides the Group with improved access to (for the Group) new geographical markets.
It contributes to Sioen Industries Group, being an integrated solutions provider for technical textiles, and reinforces its system of vertical integration, where each activity reinforces the other.
It enables the Group to realize growth in turnover and margin.
The final share purchase agreement was signed on 1 April 2016 (date on which effective control was transferred). As a consequence, the Fontana figures are included in the figures of the Sioen Group as from 1 April 2016 onwards.
Manifattura Fontana S.p.A. has a 48% participation in Fontana International GmbH (located in Austria). The remaining 52% of the shares of Fontana International (previously owned by different minority shareholders) were also purchased in the framework of this transaction. As a consequence, Sioen Industries obtained a 100% participation in Fontana International.
We considered the purchases of the shares of Manifattura Fontana and Fontana International as one business (hereafter called ‘Fontana’).
- Half year report 2017 48

The following table summarizes the consideration paid and the amounts of assets and liabilities at the acquisition date:
Fontana
Intangible assets 2 399
Property, plant and equipment 7 348
Other long term assets 298
Total non-current assets 10 044
Inventories 1 706
Trade receivables 3 885
Other current assets 619
Cash and cash equivalents 1 027
Total current assets 7 236
Borrowings 4 323
Provisions 16
Retirement benefit obligation 855
Deferred tax liabilities 1 021
Total non-current liabilities 6 215
Trade and other payables 2 632
Borrowings 2 485
Other current liabilities 601
Total current liabilities 5 719
Total net assets acquired 5 347
Upfront consideration (paid in cash) 4 128
Fair value variable deferred consideration 1 219
Total acquisition cost 5 347
Direct costs attributable to the acquisition amounted to EUR 0.1 million at the end of June 2016. They have been included in the line item services and other goods in the income statement by nature and in administrative expenses in the income statement by function. Accounting for the acquisition was not yet complete at 30 June 2016.
Until June 2016, Fontana had contributed 3 months of net sales and EBITDA: EUR 4.7 million to the total net sales of the Group, contributing to the net result (EUR 0.3 million EBITDA).
If the acquisition had taken place at the beginning of the year, the total net sales would have been EUR 8.3 million and the EBITDA as per 30 June 2016 would have been EUR 0.4 million.
- Half year report 2017 49
2016
Dimension-Polyant
On 28 July 2016, the Group announced the acquisition of Dimension-Polyant, the world market leader in sail cloth.
Sioen Industries acquired 100% of the shares in Dimension-Polyant GmbH. Dimension-Polyant GmbH has 4 fully owned subsidiaries:
- Dimension-Polyant Inc. (US)
- Dimension-Polyant Sailcloth PTY Ltd. (Australia)
- Dimension-Polyant SAS (France)
- Dimension-Polyant (UK) Ltd. (UK)
Dimension-Polyant, established in 1966, is the world market leader in sailcloth manufacturing with a global market share of more than 40%. Being the only vertically integrated manufacturer in the world (weaving, finishing and laminating), the company is in a unique position to deliver solid growth in its core business while continuing to expand in the field of diversified technical fabrics. Sioen Industries and Dimension-Polyant have complementary technologies and will, by sharing know-how, create future synergies.
As per 30 June 2016, the Sioen Group did not have control over this company yet, as a consequence, the Dimension-Polyant Group figures have not been recognized in the June 2016 consolidated financial statements of the Sioen Group. The Dimension-Polyant Group figures were included in the figures of the Sioen Group as from 1 August 2016 onwards.
- Half year report 2017 50

The following table summarizes the consideration paid and the amounts of assets and liabilities at the acquisition date:
Dimension-Polyant
Intangible assets 5 189Property, plant and equipment 24 216Other long term assets 14
Total non-current assets 29 418
Inventories 13 376Trade receivables 4 495Other current assets -2 737Cash and cash equivalents 4 455
Total current assets 19 590
Retirement benefit obligation 915Deferred tax liabilities 6 107
Total non-current liabilities 7 022
Trade and other payables 2 402Other current liabilities 2 724
Total current liabilities 5 126
Total net assets acquired 36 860
Consideration (paid in cash) 39 528Total acquisition cost 39 528Goodwill 2 668
- Half year report 2017 51

2016
Ursuit
On 7 December 2016, the Group announced the acquisition of the Ursuit Group, a Finnish manufacturer of dry suits for diving, fishing and professional use in an extreme environment.
Sioen Industries acquired 100% of the shares in Ursuk OY. Ursuk OY has 4 fully owned subsidiaries:
- Kiinteistö Oy Turun Teijonkatu 3 (Finland)
- SG Balticum AS (Estonia)
- SG Investments OÜ (Estonia)
- Arctic Diving AB (Sweden)
and 2 equity accounted companies:
- Tampereen sukelluskeskus OY (Finland)
- Oulun sukelluskeskus OY (Finland. In view of the limited organisational structure of this company, Sioen decided to consolidate this company via the equity method. The impact on the consolidated financial statements is immaterial.)
Ursuk OY (operating under the brand name Ursuit) is active in the development, design, production, marketing and distribution of state of the art dry suits for diving, fishing and professional use in an extreme environment. Ursuit has, amongst those professional users, an outstanding reputation for quality and durability. Their drive and passion for quality and technical advanced solutions have earned them a place amongst the market leaders in this field.
This agreement offers Sioen the opportunity to enter the Scandinavian market with a professional and experienced team to promote the Sioen portfolio of products.
As per 30 June 2016, the Sioen Group did not have control over this company yet, as a consequence, the Ursuit Group figures have not been recognized in the June 2016 consolidated financial statements of the Sioen Group. The Ursuit figures were included in the figures of the Sioen Group as from 31 December 2016 onwards (statement of the financial position as per 31 December 2016 included, no impact on the income statement of 2016).
- Half year report 2017 52

The following table summarizes the consideration paid and the amounts of assets and liabilities at the acquisition date:
Ursuit
Intangible assets 12 399Goodwill 350Property, plant and equipment 4 328Interests in associates 63Other long term assets 78
Total non-current assets 17 218
Inventories 3 487Trade receivables 2 485Other current assets 239Cash and cash equivalents 817
Total current assets 7 028
Borrowings 1 210Other non-current liabilities 117Deferred tax liabilities 2 748
Total non-current liabilities 4 076
Trade and other payables 592Borrowings 1 106Other current liabilities 1 091
Total current liabilities 2 790
Total net assets acquired 17 380
Consideration (paid in cash) 25 855Total acquisition cost 25 855Goodwill 8 475
Direct costs attributable to the acquisition amount to EUR 47 thousand at the end of June 2017. They have been included in the line item services and other goods in the income statement by nature and in administrative expenses in the income statement by function.
Disposals
There were no disposals during the first half of 2016.
- Half year report 2017 53

2.23. Events after reporting date
No subsequent events occurred which could have a significant impact on the consolidated financial statements of the Group, for the period ended 30 June 2017.
2.24. Contigent assets and liabilities
There were no significant changes in the contingencies of the Company and its subsidiaries from those described above and those disclosed in the consolidated financial statements of the Group for the year ended 31 December 2016.
2.25. Financial risk management
The Group is exposed to risks related to interest rate, exchange rate and market price fluctuations, having an impact on the Group’s assets and liabilities. The goal of the Group’s financial risk management is to limit the impact of these risks related to its operational and financial activities.
The financial risk management objectives and policies are consistent with those disclosed in
the consolidated financial statements as at and for the year ended 31 December 2016.
- Half year report 2017 54

2.26. Staff
Country 30 June 2017 31 December 2016
Indonesia 1 032 1 090Belgium 904 892Myanmar 695 256Tunisia 448 438Romania 316 300UK 197 9France 174 169US 112 38Germany 110 106Finland 110 71Estonia 95 102Italy 49 44Portugal 16 16China 14 14Ireland 14 14Austria 4 3Australia 3 5The Netherlands 3 4Dubai 3 4Spain 1 1Sweden 1 1Ukraine 1 1
Total 4 302 3 578
Blue collar 3 336 2 400White collar 966 1 178
Total 4 302 3 578
- Half year report 2017 55

2.27. Approval of interim financial statements
These interim consolidated financial statements have been approved for issue by the Board of Directors on 25 August 2017.
We hereby confirm, to the best of our knowledge, that the consolidated interim financial statements give a true and fair view of the financial position of the Group as at 30 June 2017, as well as of the financial performance and cash flows for the said period, fully in compliance with the accounting standards adopted for use in the EU for interim financial statements (EU adopted IAS 34, Interim Financial Reporting);
M.J.S. Consulting BVBA, represented by Mrs. M. Sioen, CEO Asceca Consulting BVBA, represented by Mr. G. Asselman, CFO
- Half year report 2017 56

Gross margin % (Net sales ± changes in stocks and WIP – raw materials and consumables used)/Net sales
EBITDA Earnings Before Interest, Taxes, Depreciation and Amortization = Operating result + depreciation + amortization + write off inventories and receivables + provisions for liabilities and charges
EBIT Earnings Before Interest and Taxes = Operating result
Recurring EBIT EBIT without non-recurring result
Recurring EBITDA EBITDA without non-recurring result
EBT Earnings Before Taxes
EAT Earnings After Taxes
NOPAT EBIT - Taxes
EVA NOPAT - cost of capital at start of the period
ROCE NOPAT/Capital employed of the period
Net cash flow Profit (loss) after taxes + depreciation + amortization + write off inventories and receivables + provisions for liabilities and charges
Free operating CF Funds from operating activities - funds from investing activities
Working capital Interests in associates + current assets (minus other financial assets, cash and cash equivalents) – non-financial debt up to one year - accrued charges and deferred income
Capital employed Working capital + intangible assets + goodwill + property, plant and equipment + investment property
Alternative performance measures (APM’s, non-GAAP measures) do not have a standardized meaning prescribed by GAAP and therefore may not be comparable to similar measures presented by other entities.
Definitions
- Half year report 2017 57

Total
Restructuring components
included in ‘Remuneration,
social security and pensions’
Restructuring components
included in ‘Provisions for
liabilities and charges’
Acquisition costs Recurring
Six months ended 30 June 2017
(Recurring) EBIT 23 125 1 078 -1 131 427 23 499
Depreciations 10 337 10 337
Write off inventories and receivables 713 713
Provisions for liabilities and charges -1 120 1 131 11
(Recurring) EBITDA 33 055 1 078 427 34 560
Six months ended 30 June 2016
(Recurring) EBIT 26 185 552 -490 26 247
Depreciations 7 323 7 323
Write off inventories and receivables -1 175 -1 175
Provisions for liabilities and charges -650 490 -160
(Recurring) EBITDA 31 683 552 32 235
Reconciliations
- Half year report 2017 58


SIOEN Fabriekstraat 23B-8850 Ardooie BelgiumBTW BE 0441.642.780RPR Gent, division Brugge
Get social:
www.sioen.com