Half-year report 2010 - BinckBank · Half-year report 2010 BinckBank well on course ... Other...
28
Half-year report 2010 BinckBank well on course • Adjusted net profit in FY10 Q2 € 20.9 million (adjusted EPS FY10 Q2 €0.28) • Adjusted net profit in FY10 H1 € 39.8 million (adjusted EPS FY10 H1 €0.54) • Interim dividend of €0.24 over the first six months of 2010 • Number of transactions returns to 2.5 million in FY10 Q2 • Launch of ProTrader: The trading platform for highly active investors
-
Upload
truongkhuong -
Category
Documents
-
view
218 -
download
0
Transcript of Half-year report 2010 - BinckBank · Half-year report 2010 BinckBank well on course ... Other...
Half-year report 2010BinckBank well on course
• Adjusted net profi t in FY10 Q2 € 20.9 million (adjusted EPS FY10 Q2 €0.28)• Adjusted net profi t in FY10 H1 € 39.8 million (adjusted EPS FY10 H1 €0.54)• Interim dividend of €0.24 over the fi rst six months of 2010• Number of transactions returns to 2.5 million in FY10 Q2• Launch of ProTrader: The trading platform for highly active investors
2H
alf-ye
ar re
po
rt 20
10
Contents
Key figures half-year comparison • • • • • • • • • • • • • • • • • • • • • • • • • • • • • • • • • • • • • • • • • • • • • • • • 3
Key figures quarterly comparison • • • • • • • • • • • • • • • • • • • • • • • • • • • • • • • • • • • • • • • • • • • • • • • • 4
Report of the executive board
Chairman’s message • • • • • • • • • • • • • • • • • • • • • • • • • • • • • • • • • • • • • • • • • • • • • • • • • • • • • 5
Review of the consolidated result in the first half of 2010 • • • • • • • • • • • • • • • • • • • • • • • • • • • • • 6
Review business unit Retail • • • • • • • • • • • • • • • • • • • • • • • • • • • • • • • • • • • • • • • • • • • • • • • 9
Review business unit Professional Services • • • • • • • • • • • • • • • • • • • • • • • • • • • • • • • • • • • • • 11
Financial position and risk management • • • • • • • • • • • • • • • • • • • • • • • • • • • • • • • • • • • • • • • 12
Statement in accordance with article 5:25d of the ‘Wft’ Financial Supervision Act • • • • • • • • • • • • 13
Events after balance sheet date and outlook • • • • • • • • • • • • • • • • • • • • • • • • • • • • • • • • • • • • 14
Interim financial information 2010
I Consolidated statement of financial position • • • • • • • • • • • • • • • • • • • • • • • • • • • • • • • • • 15
II Consolidated income statement • • • • • • • • • • • • • • • • • • • • • • • • • • • • • • • • • • • • • • • • • • 16
III Consolidated statement of comprehensive income • • • • • • • • • • • • • • • • • • • • • • • • • • • • • • 17
IV Condensed consolidated cash flow statement • • • • • • • • • • • • • • • • • • • • • • • • • • • • • • • • • 17
V Consolidated statement of changes in equity • • • • • • • • • • • • • • • • • • • • • • • • • • • • • • • • • 18
VI Selected notes • • • • • • • • • • • • • • • • • • • • • • • • • • • • • • • • • • • • • • • • • • • • • • • • • • • • • 19
Review report • • • • • • • • • • • • • • • • • • • • • • • • • • • • • • • • • • • • • • • • • • • • • • • • • • • • • • • • • • • 25
Key share data BinckBank N.V. • • • • • • • • • • • • • • • • • • • • • • • • • • • • • • • • • • • • • • • • • • • • • • • • 26
Further information BinckBank N.V. • • • • • • • • • • • • • • • • • • • • • • • • • • • • • • • • • • • • • • • • • • • • • 27
This document is a translation of the Dutch original and is provided as a courtesy only. In the event of any
disparity, the Dutch version shall prevail. No rights may be derived from the translated document.
3H
alf-ye
ar re
po
rt 20
10
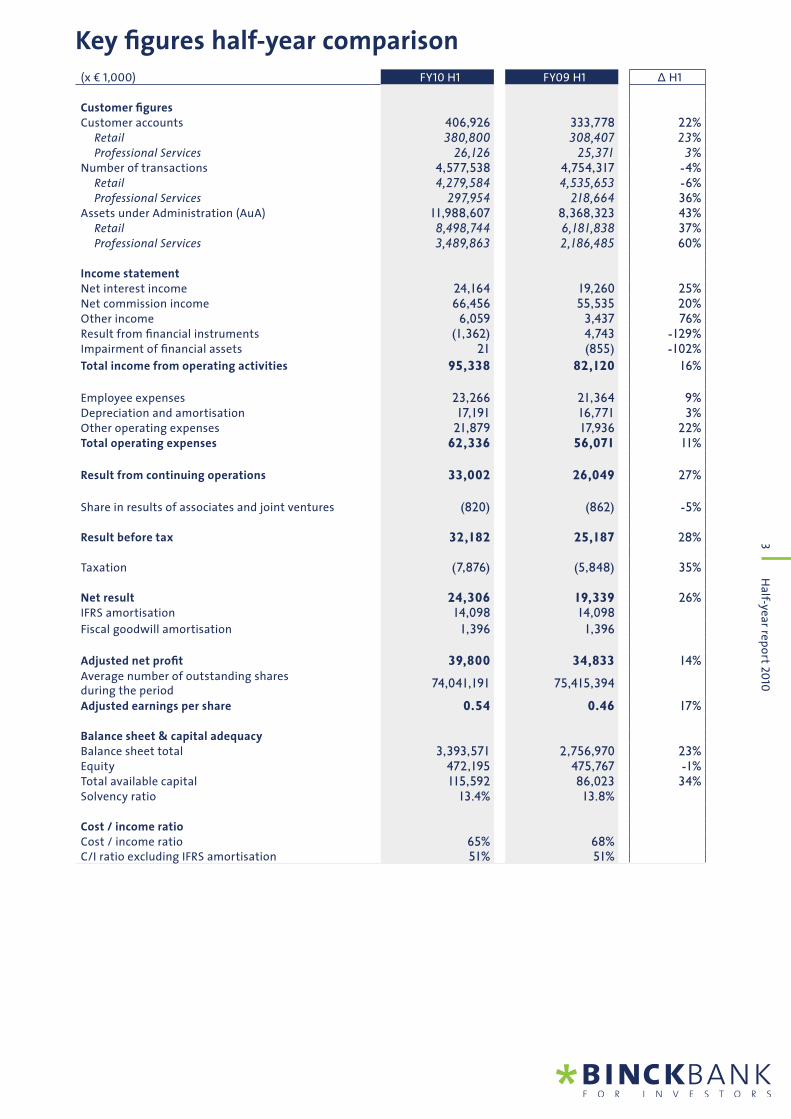
Key fi gures half-year comparison(x € 1,000) FY10 H1 FY09 H1 ∆ H1
Customer fi guresCustomer accounts 406,926 333,778 22%
Retail 380,800 308,407 23%Professional Services 26,126 25,371 3%
Number of transactions 4,577,538 4,754,317 -4%Retail 4,279,584 4,535,653 -6%Professional Services 297,954 218,664 36%
Assets under Administration (AuA) 11,988,607 8,368,323 43%Retail 8,498,744 6,181,838 37%Professional Services 3,489,863 2,186,485 60%
Income statementNet interest income 24,164 19,260 25%Net commission income 66,456 55,535 20%Other income 6,059 3,437 76%Result from fi nancial instruments (1,362) 4,743 -129%Impairment of fi nancial assets 21 (855) -102%
Total income from operating activities 95,338 82,120 16%
Employee expenses 23,266 21,364 9%Depreciation and amortisation 17,191 16,771 3%Other operating expenses 21,879 17,936 22%Total operating expenses 62,336 56,071 11%
Result from continuing operations 33,002 26,049 27%
Share in results of associates and joint ventures (820) (862) -5%
Result before tax 32,182 25,187 28%
Taxation (7,876) (5,848) 35%
Net result 24,306 19,339 26%IFRS amortisation 14,098 14,098 Fiscal goodwill amortisation 1,396 1,396
Adjusted net profi t 39,800 34,833 14%Average number of outstanding sharesduring the period
74,041,191 75,415,394
Adjusted earnings per share 0.54 0.46 17%
Balance sheet & capital adequacyBalance sheet total 3,393,571 2,756,970 23%Equity 472,195 475,767 -1%Total available capital 115,592 86,023 34%Solvency ratio 13.4% 13.8%
Cost / income ratioCost / income ratio 65% 68%C/I ratio excluding IFRS amortisation 51% 51%
4H
alf-ye
ar re
po
rt 20
10
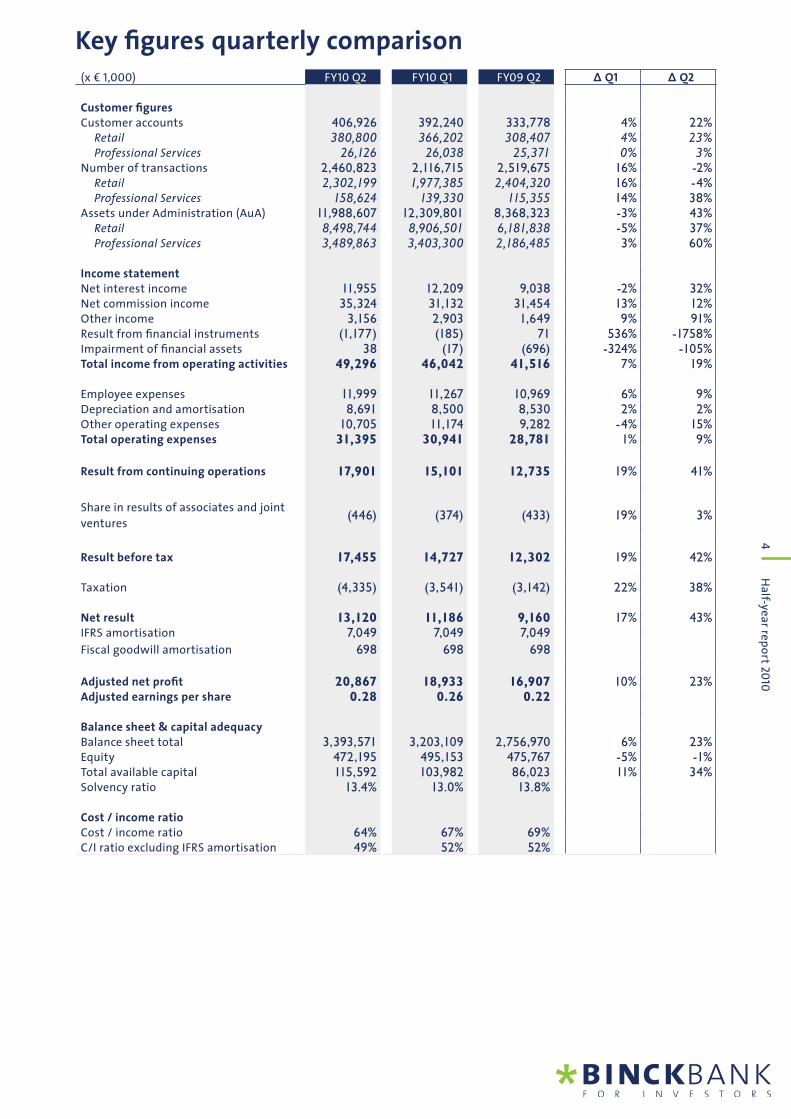
Key fi gures quarterly comparison(x € 1,000) FY10 Q2 FY10 Q1 FY09 Q2 ∆ Q1 ∆ Q2
Customer fi guresCustomer accounts 406,926 392,240 333,778 4% 22%
Retail 380,800 366,202 308,407 4% 23%Professional Services 26,126 26,038 25,371 0% 3%
Number of transactions 2,460,823 2,116,715 2,519,675 16% -2%Retail 2,302,199 1,977,385 2,404,320 16% -4%Professional Services 158,624 139,330 115,355 14% 38%
Assets under Administration (AuA) 11,988,607 12,309,801 8,368,323 -3% 43%Retail 8,498,744 8,906,501 6,181,838 -5% 37%Professional Services 3,489,863 3,403,300 2,186,485 3% 60%
Income statementNet interest income 11,955 12,209 9,038 -2% 32%Net commission income 35,324 31,132 31,454 13% 12%Other income 3,156 2,903 1,649 9% 91%Result from fi nancial instruments (1,177) (185) 71 536% -1758%Impairment of fi nancial assets 38 (17) (696) -324% -105%Total income from operating activities 49,296 46,042 41,516 7% 19%
Employee expenses 11,999 11,267 10,969 6% 9%Depreciation and amortisation 8,691 8,500 8,530 2% 2%Other operating expenses 10,705 11,174 9,282 -4% 15%Total operating expenses 31,395 30,941 28,781 1% 9%
Result from continuing operations 17,901 15,101 12,735 19% 41%
Share in results of associates and joint
ventures (446) (374) (433) 19% 3%
Result before tax 17,455 14,727 12,302 19% 42%
Taxation (4,335) (3,541) (3,142) 22% 38%
Net result 13,120 11,186 9,160 17% 43%IFRS amortisation 7,049 7,049 7,049
Fiscal goodwill amortisation 698 698 698
Adjusted net profi t 20,867 18,933 16,907 10% 23%Adjusted earnings per share 0.28 0.26 0.22
Balance sheet & capital adequacyBalance sheet total 3,393,571 3,203,109 2,756,970 6% 23%Equity 472,195 495,153 475,767 -5% -1%Total available capital 115,592 103,982 86,023 11% 34%Solvency ratio 13.4% 13.0% 13.8%
Cost / income ratioCost / income ratio 64% 67% 69%C/I ratio excluding IFRS amortisation 49% 52% 52%
5H
alf-ye
ar re
po
rt 20
10
Report of the executive boardChairman’s message
Dear readers,
We are happy to present our report on the fi rst six months of 2010, in which we both
achieved a fi ne fi nancial result and took important steps in the further development of
our business. For our private clients, we have introduced a number of new services and
improved our existing services. Furthermore, in early April we reduced the prices charged
to Binck clients in the Netherlands, thus strengthening BinckBank’s position as the price
leader compared to the large banks. We also announced that we signed a letter of intent
with SNS Bank for the outsourcing of execution and administration of the securities
transactions of their customers. In May Petercam Nederland chose the Professional
Services business unit to provide execution and administration of securities transactions
for their clients. Shortly after the second quarter, we announced a joint venture initiative
with Delta Lloyd in the area of pensions, and that ABN AMRO took a shareholding in TOM.
The adjusted net profi t over the fi rst half year came to €39.8 million, 14% higher than in the same period in the previous
year. All our operations contributed to the increase in profi t: both the result on interest and commission and other income
increased in comparison to the fi rst six months of 2009. Our clients executed more than 4.5 million transactions, resulting
in net commission income of €66.5 million in the fi rst half of 2010. This was substantially higher than in the same period in
2009 (+20%). Interest income came to over €24.2 million and was thus signifi cantly higher (+25%) than in the same period
last year. Other income rose 76% to €6.1 million. The debt crisis in the PIIGS countries and the associated uncertainty led us
to restructure our investment portfolio and to drastically reduce our exposure to Spain and Ireland. The adjusted earnings
per share in the fi rst half of 2010 came to €0.54. In the second quarter, the adjusted net profi t came to €20.9 million (€0.28
per share) against €18.9 million (€0.26 per share) in the fi rst quarter. BinckBank will distribute an interim dividend of €0.24
per share.
Clear positioning through innovation and lower prices
BinckBank is maintaining its focus on expanding and optimising the services it provides to investors. In the Netherlands,
we recently launched ProTrader, which allows highly active investors to construct their own dealing room with advanced
analytical tools entirely to their own design. We also reduced our fees for the Binck label in the Netherlands. The minimum
commission for option orders has been abolished, and the basic commission for other orders has been substantially
reduced. The reduced commissions and the introduction of ProTrader are designed to appeal to very active investors.
In France, our product range has been expanded further with the addition of BinckTrader, news feeds from Dow Jones,
Cercle Finance and Boursier.com, and technical analysis tools from Zonebourse, a well-known French provider. After
approval by the Lower House of the Dutch Parliament of the Dutch Premium Pension Institutions Act [Wet Introductie
Premiepensioeninstellingen] on 1 July 2010, we announced our initiative to enter this market in collaboration with Delta
Lloyd under the name of BeFrank.
Outlook
Although we are positive on furhter growth and the future of BinckBank, BinckBank depends to a signifi cant extent on
developments in the fi nancial markets and investor sentiment. For this reason, BinckBank will not issue any fi nancial
forecast. In the second half of 2010 we will introduce new products and improve our existing products, for both the Binck
and the Alex labels. We are confi dent regarding the potential for achieving our medium-term targets.
Amsterdam, 22 July 2010
Koen Beentjes,
Chairman of the Board, BinckBank
6H
alf-ye
ar re
po
rt 20
10
Review of the consolidated result in the fi rst half of 2010 (FY10 H1)
Adjusted net profi t in the fi rst half of 2010
In the fi rst half of 2010, the adjusted net profi t amounted to €39.8 million. Compared to the same period
in the previous year, the adjusted net profi t was up 14% (FY09 H1: €34.8 million). The adjusted net earnings
per share were up 17% on the same period in the previous year at €0.54. The net profi t is adjusted for IFRS
amortisation and the additional tax benefi t on the difference between commercial and fi scal amortisation
of intangible assets and goodwill acquired on the purchase of Alex.
In the second quarter of this year, BinckBank realised adjusted net profi t of €20.9 million. This is an increase
of 10% compared to FY10 Q1, and an increase of 23% compared to the same period last year. The adjusted net
earnings per share came to €0.28.
BinckBank is distributing an interim dividend of €0.24 per share, which is 14% higher than in 2009 (interim
dividend 2009: €0.21). Holders of shares in BinckBank N.V. will receive their dividend, after deduction of
dividend tax, on Monday, 2 August 2010. BinckBank N.V. shares will be quoted ex-interim dividend from
Tuesday, 27 July 2010.
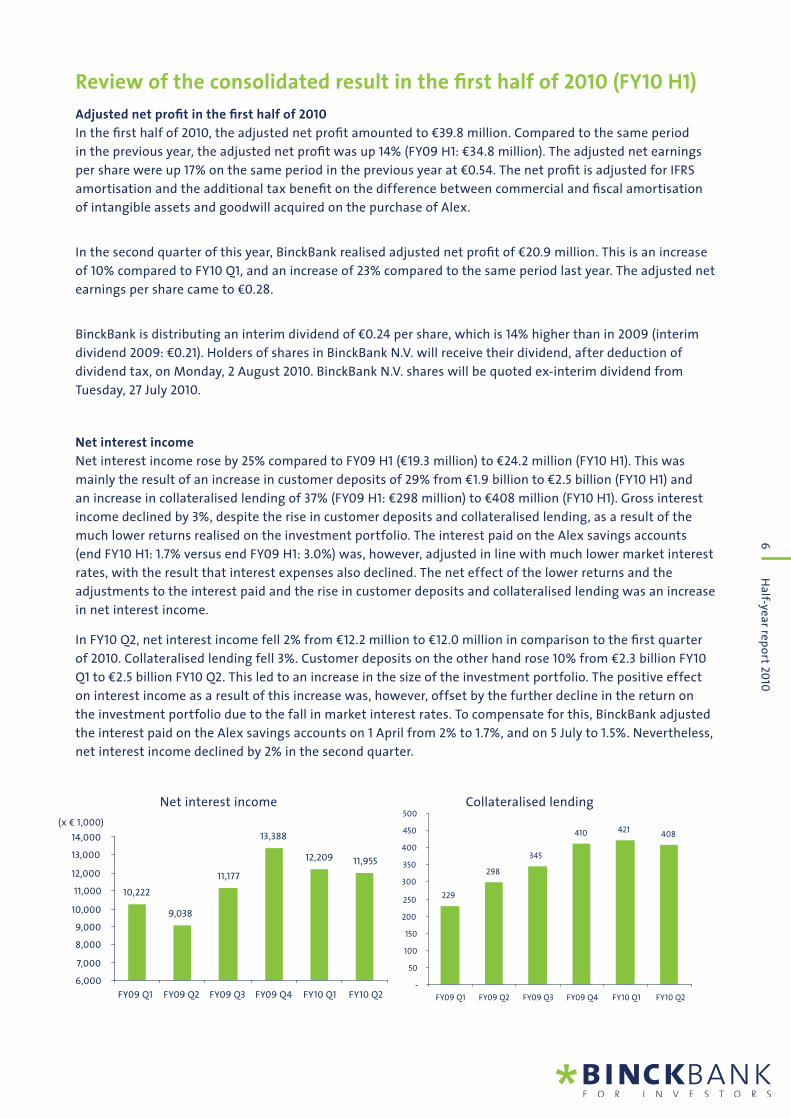
Net interest income
Net interest income rose by 25% compared to FY09 H1 (€19.3 million) to €24.2 million (FY10 H1). This was
mainly the result of an increase in customer deposits of 29% from €1.9 billion to €2.5 billion (FY10 H1) and
an increase in collateralised lending of 37% (FY09 H1: €298 million) to €408 million (FY10 H1). Gross interest
income declined by 3%, despite the rise in customer deposits and collateralised lending, as a result of the
much lower returns realised on the investment portfolio. The interest paid on the Alex savings accounts
(end FY10 H1: 1.7% versus end FY09 H1: 3.0%) was, however, adjusted in line with much lower market interest
rates, with the result that interest expenses also declined. The net effect of the lower returns and the
adjustments to the interest paid and the rise in customer deposits and collateralised lending was an increase
in net interest income.
In FY10 Q2, net interest income fell 2% from €12.2 million to €12.0 million in comparison to the fi rst quarter
of 2010. Collateralised lending fell 3%. Customer deposits on the other hand rose 10% from €2.3 billion FY10
Q1 to €2.5 billion FY10 Q2. This led to an increase in the size of the investment portfolio. The positive effect
on interest income as a result of this increase was, however, offset by the further decline in the return on
the investment portfolio due to the fall in market interest rates. To compensate for this, BinckBank adjusted
the interest paid on the Alex savings accounts on 1 April from 2% to 1.7%, and on 5 July to 1.5%. Nevertheless,
net interest income declined by 2% in the second quarter.
229
298
345
410 421408
-
50
100
150
200
250
300
350
400
450
500
FY09 Q1 FY09 Q2 FY09 Q3 FY09 Q4 FY10 Q1 FY10 Q2
x € million
Net interest income Collateralised lending
9,038
11,177
13,388
12,209 11,955
10,222
6,000
7,000
8,000
9,000
10,000
11,000
12,000
13,000
14,000
FY09 Q1 FY09 Q2 FY09 Q3 FY09 Q4 FY10 Q1 FY10 Q2
(x € 1,000)
7H
alf-ye
ar re
po
rt 20
10
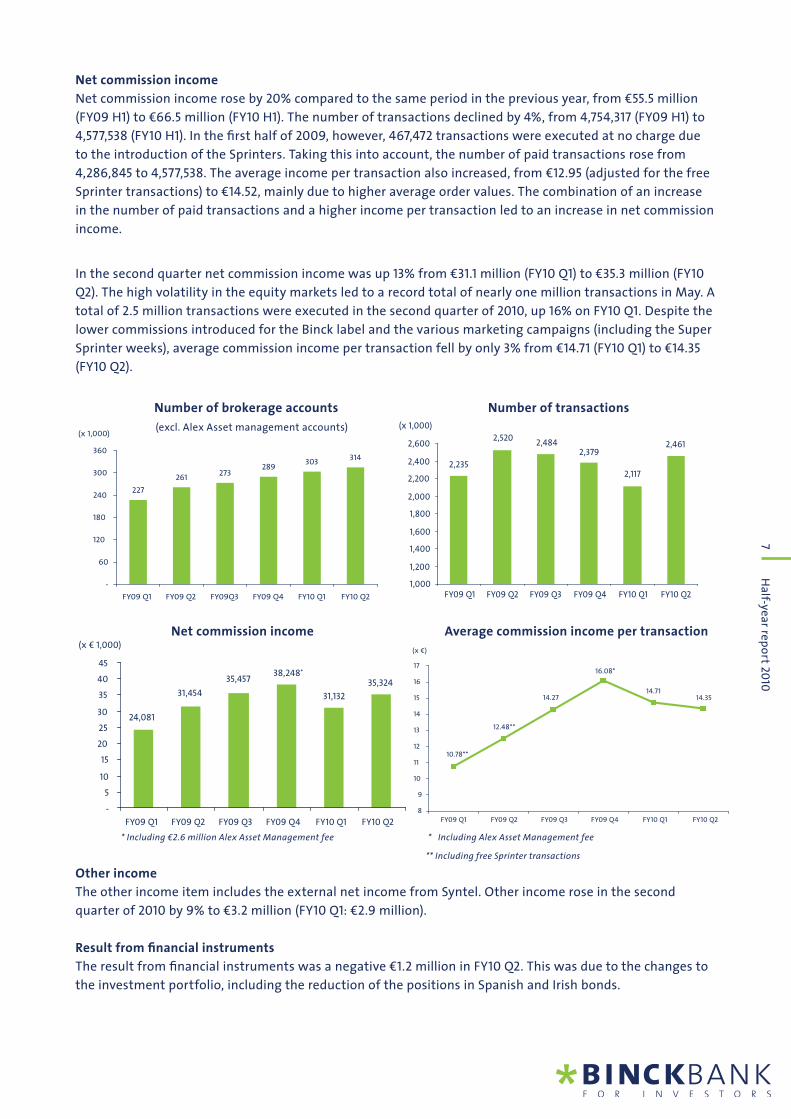
Net commission income
Net commission income rose by 20% compared to the same period in the previous year, from €55.5 million
(FY09 H1) to €66.5 million (FY10 H1). The number of transactions declined by 4%, from 4,754,317 (FY09 H1) to
4,577,538 (FY10 H1). In the fi rst half of 2009, however, 467,472 transactions were executed at no charge due
to the introduction of the Sprinters. Taking this into account, the number of paid transactions rose from
4,286,845 to 4,577,538. The average income per transaction also increased, from €12.95 (adjusted for the free
Sprinter transactions) to €14.52, mainly due to higher average order values. The combination of an increase
in the number of paid transactions and a higher income per transaction led to an increase in net commission
income.
In the second quarter net commission income was up 13% from €31.1 million (FY10 Q1) to €35.3 million (FY10
Q2). The high volatility in the equity markets led to a record total of nearly one million transactions in May. A
total of 2.5 million transactions were executed in the second quarter of 2010, up 16% on FY10 Q1. Despite the
lower commissions introduced for the Binck label and the various marketing campaigns (including the Super
Sprinter weeks), average commission income per transaction fell by only 3% from €14.71 (FY10 Q1) to €14.35
(FY10 Q2).
Number of brokerage accounts Number of transactions
(excl. Alex Asset management accounts)
227
261273
289303
314
-
60
120
180
240
300
360
FY09 Q1 FY09 Q2 FY09Q3 FY09 Q4 FY10 Q1 FY10 Q2
(x 1,000)
Net commission income Average commission income per transaction
* Including €2.6 million Alex Asset Management fee * Including Alex Asset Management fee
** Including free Sprinter transactions
Other income
The other income item includes the external net income from Syntel. Other income rose in the second
quarter of 2010 by 9% to €3.2 million (FY10 Q1: €2.9 million).
Result from fi nancial instruments
The result from fi nancial instruments was a negative €1.2 million in FY10 Q2. This was due to the changes to
the investment portfolio, including the reduction of the positions in Spanish and Irish bonds.
2,461
2,117
2,379
2,235
2,5202,484
1,000
1,200
1,400
1,600
1,800
2,000
2,200
2,400
2,600
FY09 Q1 FY09 Q2 FY09 Q3 FY09 Q4 FY10 Q1 FY10 Q2
(x 1,000)
14.35
12.48**
16.08*
14.27
10.78**
14.71
8
9
10
11
12
13
14
15
16
17
(x €)
FY09 Q1 FY09 Q2 FY09 Q3 FY09 Q4 FY10 Q1 FY10 Q2
24,081
38,248*
31,132
35,32431,454
35,457
-
5
10
15
20
25
30
35
40
45
FY09 Q1 FY09 Q2 FY09 Q3 FY09 Q4 FY10 Q1 FY10 Q2
(x € 1,000)
8H
alf-ye
ar re
po
rt 20
10
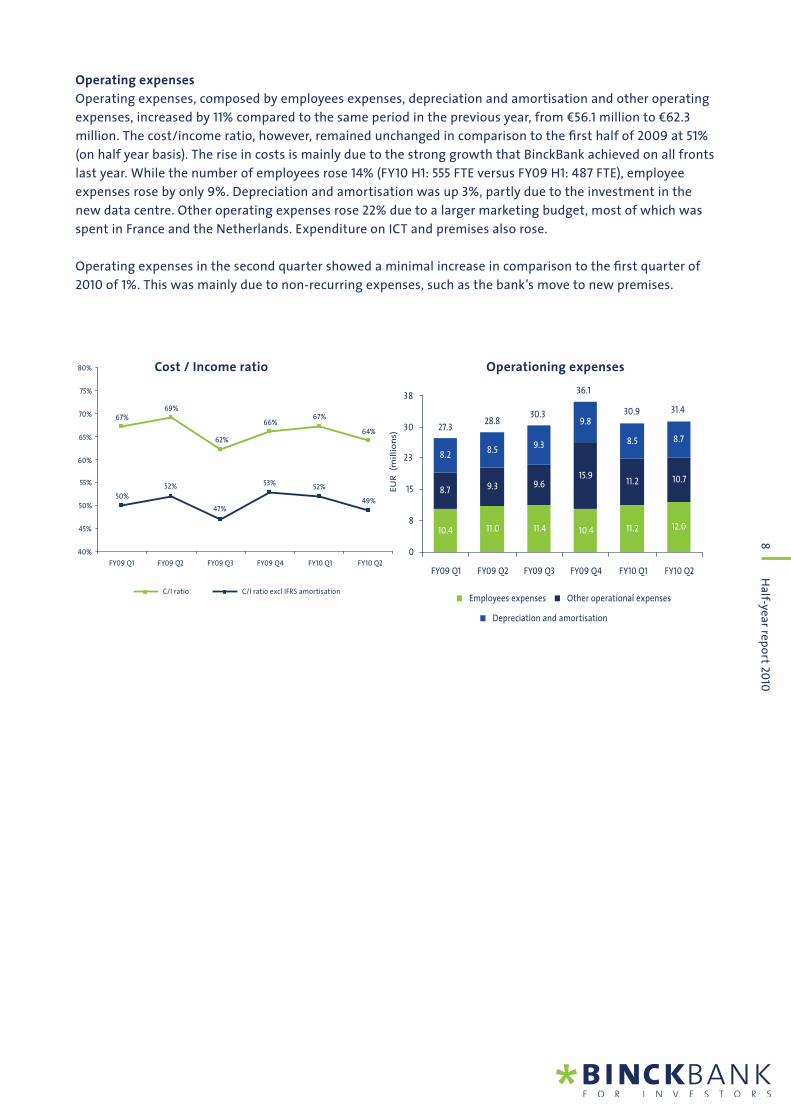
Operating expenses
Operating expenses, composed by employees expenses, depreciation and amortisation and other operating
expenses, increased by 11% compared to the same period in the previous year, from €56.1 million to €62.3
million. The cost/income ratio, however, remained unchanged in comparison to the fi rst half of 2009 at 51%
(on half year basis). The rise in costs is mainly due to the strong growth that BinckBank achieved on all fronts
last year. While the number of employees rose 14% (FY10 H1: 555 FTE versus FY09 H1: 487 FTE), employee
expenses rose by only 9%. Depreciation and amortisation was up 3%, partly due to the investment in the
new data centre. Other operating expenses rose 22% due to a larger marketing budget, most of which was
spent in France and the Netherlands. Expenditure on ICT and premises also rose.
Operating expenses in the second quarter showed a minimal increase in comparison to the fi rst quarter of
2010 of 1%. This was mainly due to non-recurring expenses, such as the bank’s move to new premises.
Cost / Income ratio Operationing expenses
64%
49%
67% 67%66%
69%
62%
50%
52%
47%
53%52%
40%
45%
50%
55%
60%
65%
70%
75%
80%
FY09 Q1 FY09 Q2 FY09 Q3 FY09 Q4 FY10 Q1 FY10 Q2
C/I ratio C/I ratio excl IFRS amortisation
12.0
10.7
8.7
10.4 11.0 11.4 10.4 11.2
8.7 9.3 9.615.9
11.2
9.38.5
8.2
9.8
8.5
0
8
15
23
30 27.328.8
30.3
36.1
30.9 31.4
38
FY09 Q1 FY09 Q2 FY09 Q3 FY09 Q4 FY10 Q1 FY10 Q2
EU
R
(mil
lio
ns)
Employees expenses Other operational expenses
Depreciation and amortisation
9H
alf-ye
ar re
po
rt 20
10
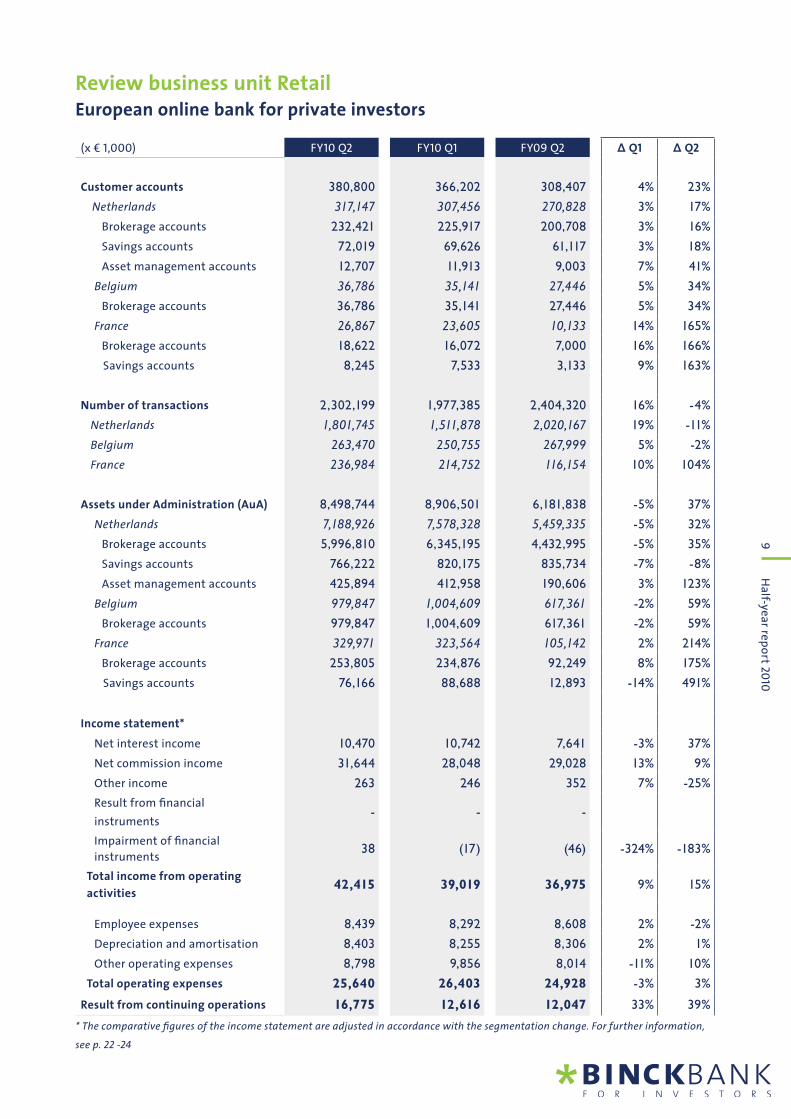
Review business unit RetailEuropean online bank for private investors
(x € 1,000) FY10 Q2 FY10 Q1 FY09 Q2 ∆ Q1 ∆ Q2
Customer accounts 380,800 366,202 308,407 4% 23%
Netherlands 317,147 307,456 270,828 3% 17%
Brokerage accounts 232,421 225,917 200,708 3% 16%
Savings accounts 72,019 69,626 61,117 3% 18%
Asset management accounts 12,707 11,913 9,003 7% 41%
Belgium 36,786 35,141 27,446 5% 34%
Brokerage accounts 36,786 35,141 27,446 5% 34%
France 26,867 23,605 10,133 14% 165%
Brokerage accounts 18,622 16,072 7,000 16% 166%
Savings accounts 8,245 7,533 3,133 9% 163%
Number of transactions 2,302,199 1,977,385 2,404,320 16% -4%
Netherlands 1,801,745 1,511,878 2,020,167 19% -11%
Belgium 263,470 250,755 267,999 5% -2%
France 236,984 214,752 116,154 10% 104%
Assets under Administration (AuA) 8,498,744 8,906,501 6,181,838 -5% 37%
Netherlands 7,188,926 7,578,328 5,459,335 -5% 32%
Brokerage accounts 5,996,810 6,345,195 4,432,995 -5% 35%
Savings accounts 766,222 820,175 835,734 -7% -8%
Asset management accounts 425,894 412,958 190,606 3% 123%
Belgium 979,847 1,004,609 617,361 -2% 59%
Brokerage accounts 979,847 1,004,609 617,361 -2% 59%
France 329,971 323,564 105,142 2% 214%
Brokerage accounts 253,805 234,876 92,249 8% 175%
Savings accounts 76,166 88,688 12,893 -14% 491%
Income statement*
Net interest income 10,470 10,742 7,641 -3% 37%
Net commission income 31,644 28,048 29,028 13% 9%
Other income 263 246 352 7% -25%
Result from fi nancial
instruments - - -
Impairment of fi nancial
instruments 38 (17) (46) -324% -183%
Total income from operating
activities 42,415 39,019 36,975 9% 15%
Employee expenses 8,439 8,292 8,608 2% -2%
Depreciation and amortisation 8,403 8,255 8,306 2% 1%
Other operating expenses 8,798 9,856 8,014 -11% 10%
Total operating expenses 25,640 26,403 24,928 -3% 3%
Result from continuing operations 16,775 12,616 12,047 33% 39%
* The comparative fi gures of the income statement are adjusted in accordance with the segmentation change. For further information,
see p. 22 -24
10H
alf-ye
ar re
po
rt 20
10
Retail business unit
The Retail business unit provides online brokerage services for private investors from the Netherlands,
Belgium and France. It provides these services in the Netherlands under the Alex and Binck labels and in the
other countries under the Binck label only.
Netherlands
The number of accounts in the Netherlands increased by 3% to 317,147 and the number of transactions by
19% to 1.8 million in the second quarter. Assets under management by Alex Asset Management rose by 3%,
while the total assets under administration in the Netherlands declined by 5%. The commissions for Binck
were reduced on 6 April. Initial analysis suggests that the negative effect of the reduction on the results
is limited, since price elasticity is greater than expected. Especially the number of option transactions was
much higher than expected. Lastly, Binck was awarded the title of ‘Best Broker’ by IEX Netprofi ler for the
third consecutive occasion.
Belgium
BinckBank realised a 5% increase in the number of transactions compared to the fi rst quarter of 2010. The
number of accounts in Belgium also rose by 5% to 36,786 as at the end of FY10 Q2. The average number
of transactions per account per year of 29 shows that BinckBank has been successful in attracting active
Belgian investors. Generally speaking, the average number of transactions in Belgium was much lower.
France
We have further expanded our services to our French clients with the addition of news feeds from Dow
Jones, Cercle Finance and Boursier.com to our website. The addition of the technical analysis tools of
Zonebourse, a well-known French provider, earlier this year was welcomed by our French investors. Together
with the introduction of BinckTrader at the end of March and the launch of the highly popular SRD product
later this year, our services will be further tailored to meet the needs of French investors. During the second
quarter, 3,262 accounts were opened in France, bringing the total number of accounts to 26,867, of which
18,622 are brokerage accounts. In May, Binck was also named as Best Choice in two out of three categories
in a very extensive and highly respected survey by La Tribune and the French consumers association (Testé
pour vous), and received a special mention for its transparency.
11H
alf-ye
ar re
po
rt 20
10
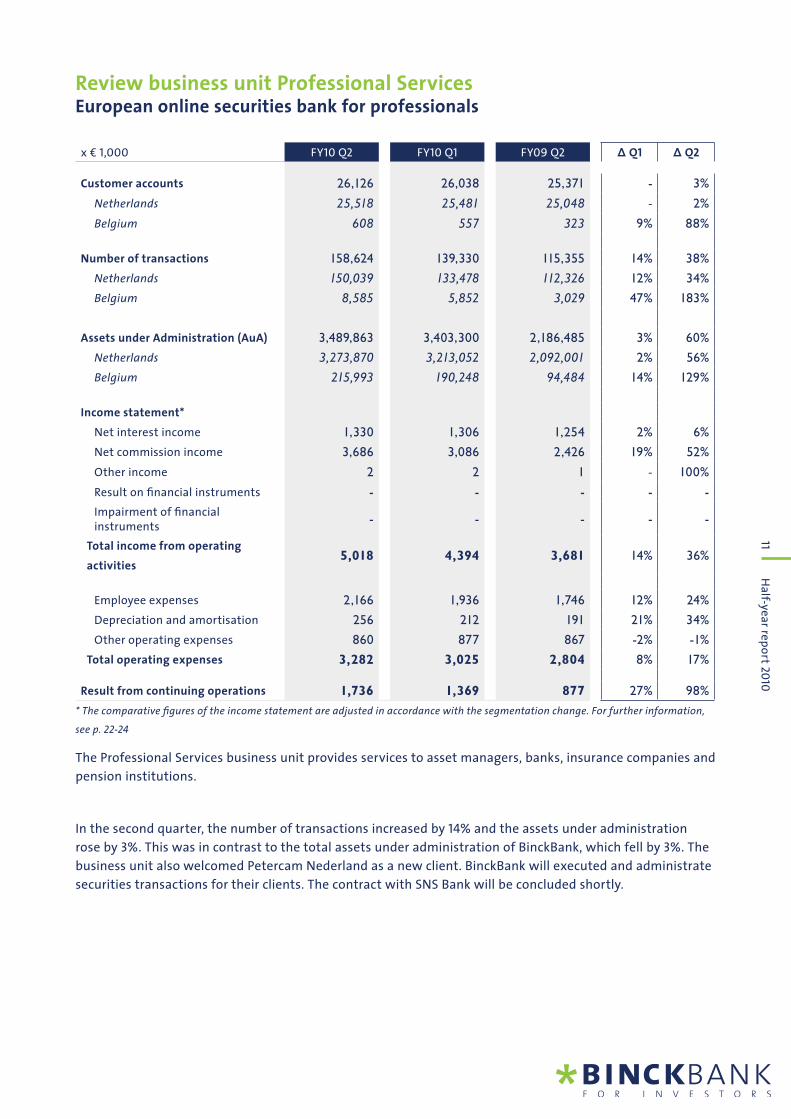
Review business unit Professional ServicesEuropean online securities bank for professionals
x € 1,000 FY10 Q2 FY10 Q1 FY09 Q2 ∆ Q1 ∆ Q2
Customer accounts 26,126 26,038 25,371 - 3%
Netherlands 25,518 25,481 25,048 - 2%
Belgium 608 557 323 9% 88%
Number of transactions 158,624 139,330 115,355 14% 38%
Netherlands 150,039 133,478 112,326 12% 34%
Belgium 8,585 5,852 3,029 47% 183%
Assets under Administration (AuA) 3,489,863 3,403,300 2,186,485 3% 60%
Netherlands 3,273,870 3,213,052 2,092,001 2% 56%
Belgium 215,993 190,248 94,484 14% 129%
Income statement*
Net interest income 1,330 1,306 1,254 2% 6%
Net commission income 3,686 3,086 2,426 19% 52%
Other income 2 2 1 - 100%
Result on fi nancial instruments - - - - -
Impairment of fi nancial instruments
- - - - -
Total income from operating
activities 5,018 4,394 3,681 14% 36%
Employee expenses 2,166 1,936 1,746 12% 24%
Depreciation and amortisation 256 212 191 21% 34%
Other operating expenses 860 877 867 -2% -1%
Total operating expenses 3,282 3,025 2,804 8% 17%
Result from continuing operations 1,736 1,369 877 27% 98%
* The comparative fi gures of the income statement are adjusted in accordance with the segmentation change. For further information,
see p. 22-24
The Professional Services business unit provides services to asset managers, banks, insurance companies and
pension institutions.
In the second quarter, the number of transactions increased by 14% and the assets under administration
rose by 3%. This was in contrast to the total assets under administration of BinckBank, which fell by 3%. The
business unit also welcomed Petercam Nederland as a new client. BinckBank will executed and administrate
securities transactions for their clients. The contract with SNS Bank will be concluded shortly.
12H
alf-ye
ar re
po
rt 20
10
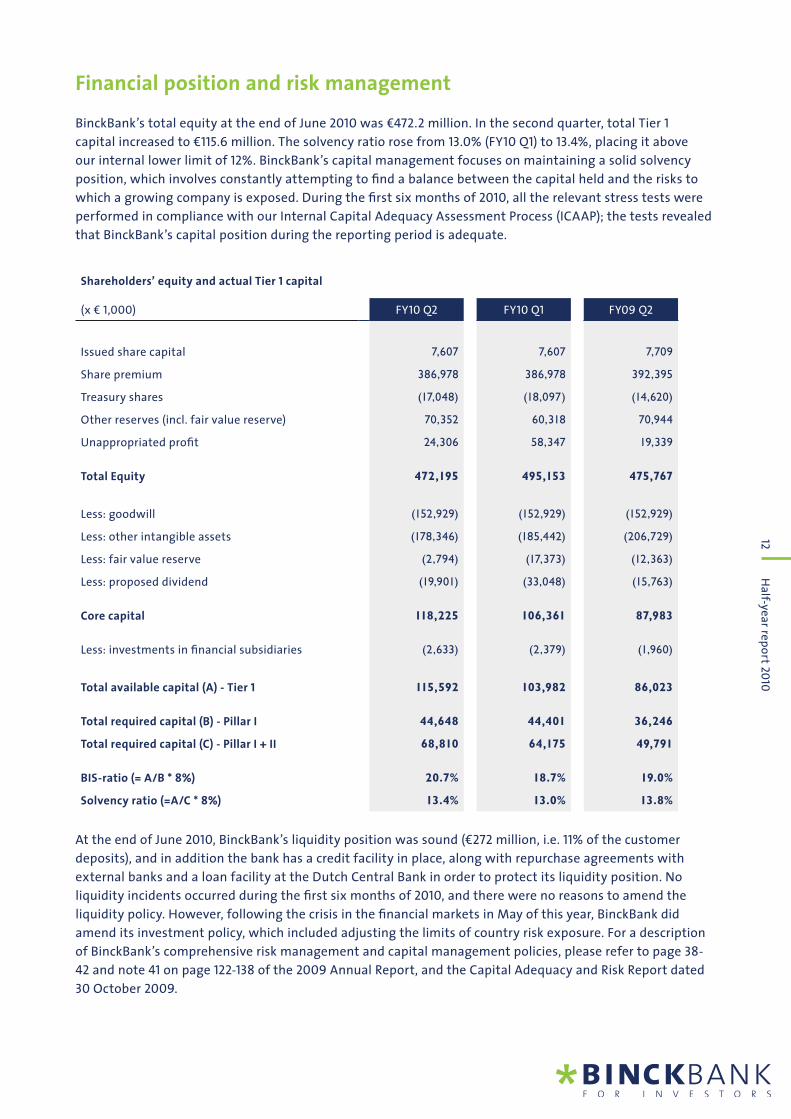
Financial position and risk management
BinckBank’s total equity at the end of June 2010 was €472.2 million. In the second quarter, total Tier 1
capital increased to €115.6 million. The solvency ratio rose from 13.0% (FY10 Q1) to 13.4%, placing it above
our internal lower limit of 12%. BinckBank’s capital management focuses on maintaining a solid solvency
position, which involves constantly attempting to fi nd a balance between the capital held and the risks to
which a growing company is exposed. During the fi rst six months of 2010, all the relevant stress tests were
performed in compliance with our Internal Capital Adequacy Assessment Process (ICAAP); the tests revealed
that BinckBank’s capital position during the reporting period is adequate.
Shareholders’ equity and actual Tier 1 capital
(x € 1,000) FY10 Q2 FY10 Q1 FY09 Q2
Issued share capital 7,607 7,607 7,709
Share premium 386,978 386,978 392,395
Treasury shares (17,048) (18,097) (14,620)
Other reserves (incl. fair value reserve) 70,352 60,318 70,944
Unappropriated profi t 24,306 58,347 19,339
Total Equity 472,195 495,153 475,767
Less: goodwill (152,929) (152,929) (152,929)
Less: other intangible assets (178,346) (185,442) (206,729)
Less: fair value reserve (2,794) (17,373) (12,363)
Less: proposed dividend (19,901) (33,048) (15,763)
Core capital 118,225 106,361 87,983
Less: investments in fi nancial subsidiaries (2,633) (2,379) (1,960)
Total available capital (A) - Tier 1 115,592 103,982 86,023
Total required capital (B) - Pillar I 44,648 44,401 36,246
Total required capital (C) - Pillar I + II 68,810 64,175 49,791
BIS-ratio (= A/B * 8%) 20.7% 18.7% 19.0%
Solvency ratio (=A/C * 8%) 13.4% 13.0% 13.8%
At the end of June 2010, BinckBank’s liquidity position was sound (€272 million, i.e. 11% of the customer
deposits), and in addition the bank has a credit facility in place, along with repurchase agreements with
external banks and a loan facility at the Dutch Central Bank in order to protect its liquidity position. No
liquidity incidents occurred during the fi rst six months of 2010, and there were no reasons to amend the
liquidity policy. However, following the crisis in the fi nancial markets in May of this year, BinckBank did
amend its investment policy, which included adjusting the limits of country risk exposure. For a description
of BinckBank’s comprehensive risk management and capital management policies, please refer to page 38-
42 and note 41 on page 122-138 of the 2009 Annual Report, and the Capital Adequacy and Risk Report dated
30 October 2009.
13H
alf-ye
ar re
po
rt 20
10
Statement in accordance with article 5:25d of the ‘Wft’ Financial Supervision Act
The board hereby states that, as far as it is aware;
1) the half-year report included on pages 2 to 14 is a true and fair view of the state of affairs on
the accounting date, of the general course of affairs during the six months of the BinckBank
N.V. fi nancial year, and of any associated companies whose details are included in its half-year
results, and of the expected course of affairs whereby, in so far as there are no major concerns
to the contrary, particular attention is paid to the conditions on which growth in turnover and
profi tability are dependent; and
2) the fi nancial statements half-year 2010 which are included on pages 16 to 23 is a true and fair
view of the assets, liabilities, fi nancial position and profi ts of BinckBank N.V. and the companies
included in the consolidates fi gures.
Amsterdam, 22 July 2010
Koen Beentjes (Chairman of the board)
Evert Kooistra (Board member and CFO)
Pieter Aartsen (Board member)
Nick Bortot (Board member)
14H
alf-ye
ar re
po
rt 20
10
Events after balance sheet date and outlook
We announced the formation of BeFrank, our 50/50 joint venture with Delta Lloyd, on 6 July. BeFrank is a
joint venture in the sector of group defi ned contribution pension schemes (second pillar). BeFrank will break
open the pensions market as a new provider with low costs and outstanding services, offering employees
full information online regarding their pension accrual, their costs and the pension they can purchase when
they retire. Via Professional Services, with this joint venture we will serve the fi rst pension institution, in
addition to banks and insurers. BeFrank is a long-term initiative, and is expected to contribute to profi ts
from 2014.
BinckBank repurchased 1,568,928 of its shares on 9 July. The total number of shares in BinckBank N.V. in issue
as at 10 July 2010 was therefore 74,500,000.
On 13 July 2010, TOM announced that they welcomed ABN AMRO as a shareholder. We see this as
confi rmation of our confi dence in the future of TOM.
Outlook
Although we are positive on furhter growth and the future of BinckBank, BinckBank depends to a signifi cant
extent on developments in the fi nancial markets and investor sentiment. For this reason, BinckBank will
not issue any fi nancial forecast. In the second half of 2010 we will introduce new products and improve
our existing products, for both the Binck and the Alex labels. We are confi dent regarding the potential for
achieving our medium-term targets.
15H
alf-ye
ar re
po
rt 20
10
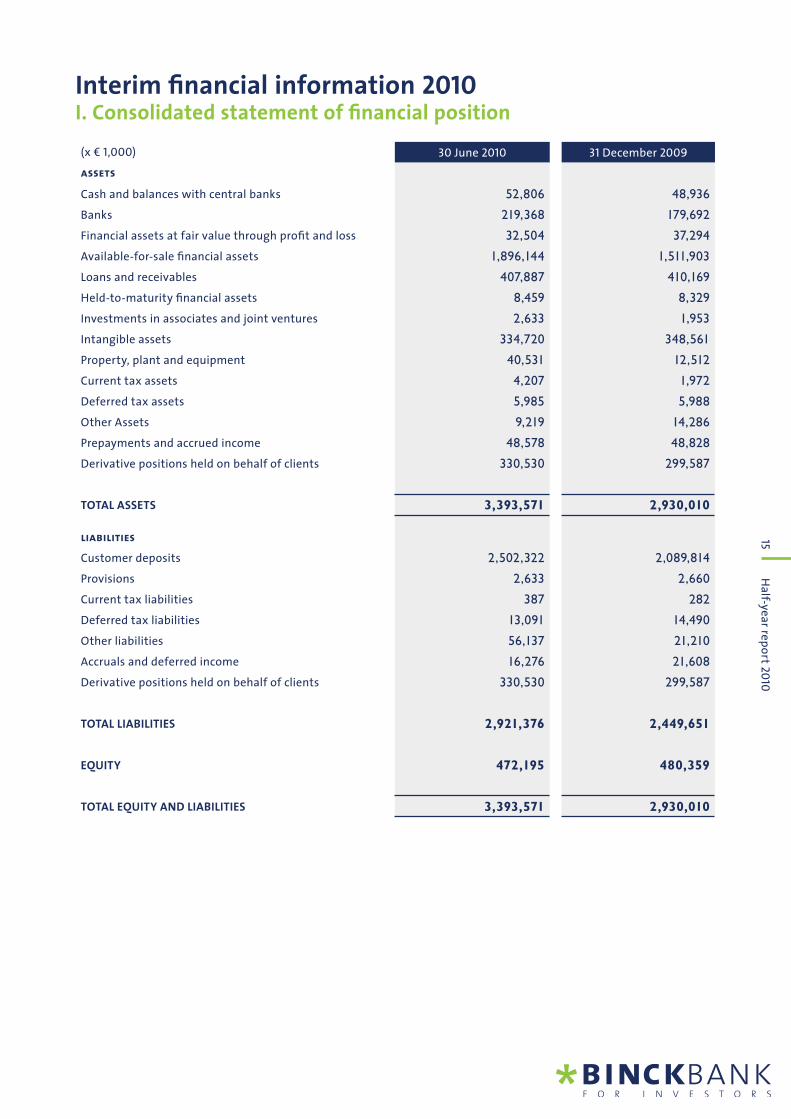
Interim fi nancial information 2010I. Consolidated statement of fi nancial position
(x € 1,000) 30 June 2010 31 December 2009
assets
Cash and balances with central banks 52,806 48,936
Banks 219,368 179,692
Financial assets at fair value through profi t and loss 32,504 37,294
Available-for-sale fi nancial assets 1,896,144 1,511,903
Loans and receivables 407,887 410,169
Held-to-maturity fi nancial assets 8,459 8,329
Investments in associates and joint ventures 2,633 1,953
Intangible assets 334,720 348,561
Property, plant and equipment 40,531 12,512
Current tax assets 4,207 1,972
Deferred tax assets 5,985 5,988
Other Assets 9,219 14,286
Prepayments and accrued income 48,578 48,828
Derivative positions held on behalf of clients 330,530 299,587
TOTAL ASSETS 3,393,571 2,930,010
liabilities
Customer deposits 2,502,322 2,089,814
Provisions 2,633 2,660
Current tax liabilities 387 282
Deferred tax liabilities 13,091 14,490
Other liabilities 56,137 21,210
Accruals and deferred income 16,276 21,608
Derivative positions held on behalf of clients 330,530 299,587
TOTAL LIABILITIES 2,921,376 2,449,651
EQUITY 472,195 480,359
TOTAL EQUITY AND LIABILITIES 3,393,571 2,930,010
16H
alf-ye
ar re
po
rt 20
10
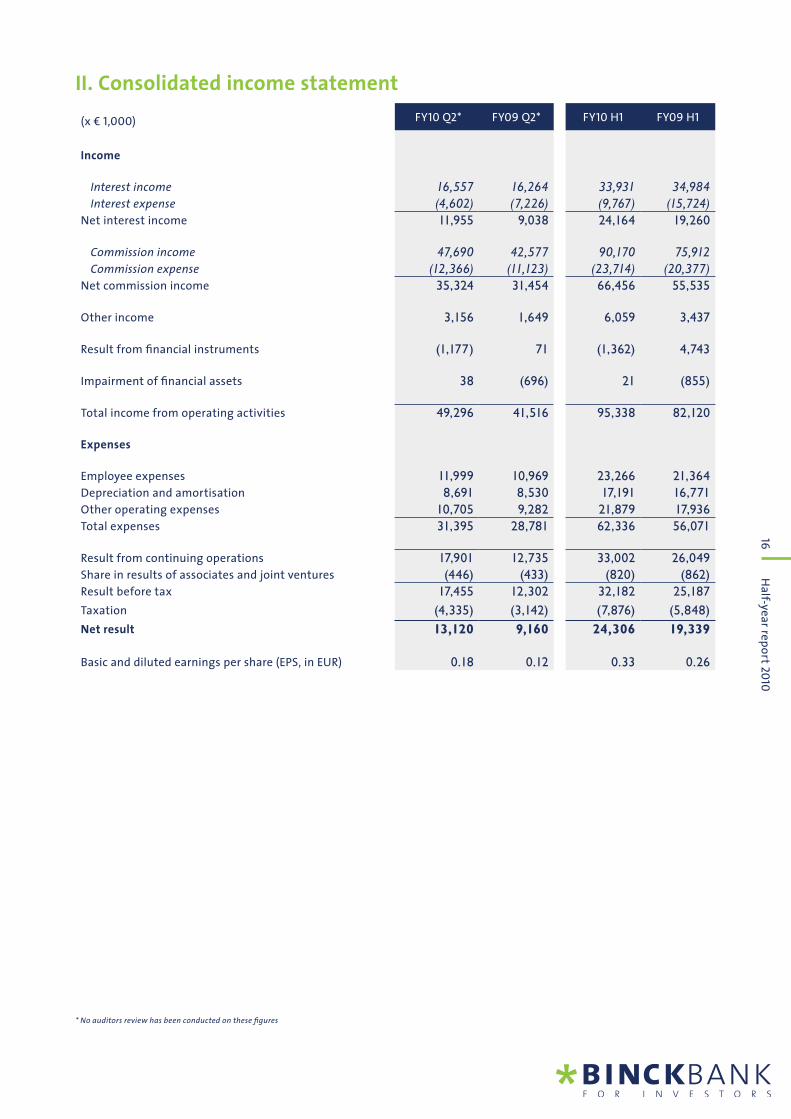
II. Consolidated income statement
(x € 1,000) FY10 Q2* FY09 Q2* FY10 H1 FY09 H1
Income
Interest income 16,557 16,264 33,931 34,984
Interest expense (4,602) (7,226) (9,767) (15,724)
Net interest income 11,955 9,038 24,164 19,260
Commission income 47,690 42,577 90,170 75,912
Commission expense (12,366) (11,123) (23,714) (20,377)
Net commission income 35,324 31,454 66,456 55,535
Other income 3,156 1,649 6,059 3,437
Result from fi nancial instruments (1,177) 71 (1,362) 4,743
Impairment of fi nancial assets 38 (696) 21 (855)
Total income from operating activities 49,296 41,516 95,338 82,120
Expenses
Employee expenses 11,999 10,969 23,266 21,364
Depreciation and amortisation 8,691 8,530 17,191 16,771
Other operating expenses 10,705 9,282 21,879 17,936
Total expenses 31,395 28,781 62,336 56,071
Result from continuing operations 17,901 12,735 33,002 26,049
Share in results of associates and joint ventures (446) (433) (820) (862)
Result before tax 17,455 12,302 32,182 25,187
Taxation (4,335) (3,142) (7,876) (5,848)
Net result 13,120 9,160 24,306 19,339
Basic and diluted earnings per share (EPS, in EUR) 0.18 0.12 0.33 0.26
* No auditors review has been conducted on these fi gures
17H
alf-ye
ar re
po
rt 20
10
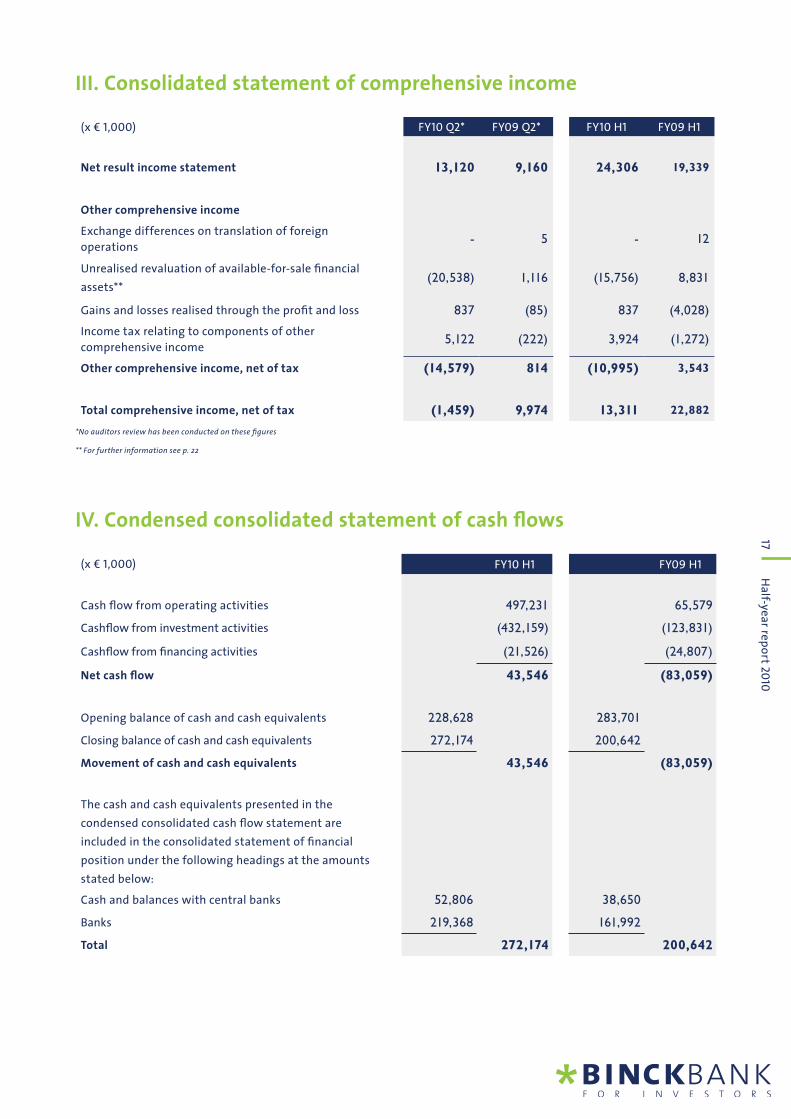
*
(x € 1,000) FY10 H1 FY09 H1
Cash fl ow from operating activities 497,231 65,579
Cashfl ow from investment activities (432,159) (123,831)
Cashfl ow from fi nancing activities (21,526) (24,807)
Net cash fl ow 43,546 (83,059)
Opening balance of cash and cash equivalents 228,628 283,701
Closing balance of cash and cash equivalents 272,174 200,642
Movement of cash and cash equivalents 43,546 (83,059)
The cash and cash equivalents presented in the
condensed consolidated cash fl ow statement are
included in the consolidated statement of fi nancial
position under the following headings at the amounts
stated below:
Cash and balances with central banks 52,806 38,650
Banks 219,368 161,992
Total 272,174 200,642
III. Consolidated statement of comprehensive income
(x € 1,000) FY10 Q2* FY09 Q2* FY10 H1 FY09 H1
Net result income statement 13,120 9,160 24,306 19,339
Other comprehensive income
Exchange differences on translation of foreign
operations - 5 - 12
Unrealised revaluation of available-for-sale fi nancial
assets** (20,538) 1,116 (15,756) 8,831
Gains and losses realised through the profi t and loss 837 (85) 837 (4,028)
Income tax relating to components of other
comprehensive income 5,122 (222) 3,924 (1,272)
Other comprehensive income, net of tax (14,579) 814 (10,995) 3,543
Total comprehensive income, net of tax (1,459) 9,974 13,311 22,882
*No auditors review has been conducted on these fi gures
** For further information see p. 22
IV. Condensed consolidated statement of cash fl ows
18H
alf-ye
ar re
po
rt 20
10
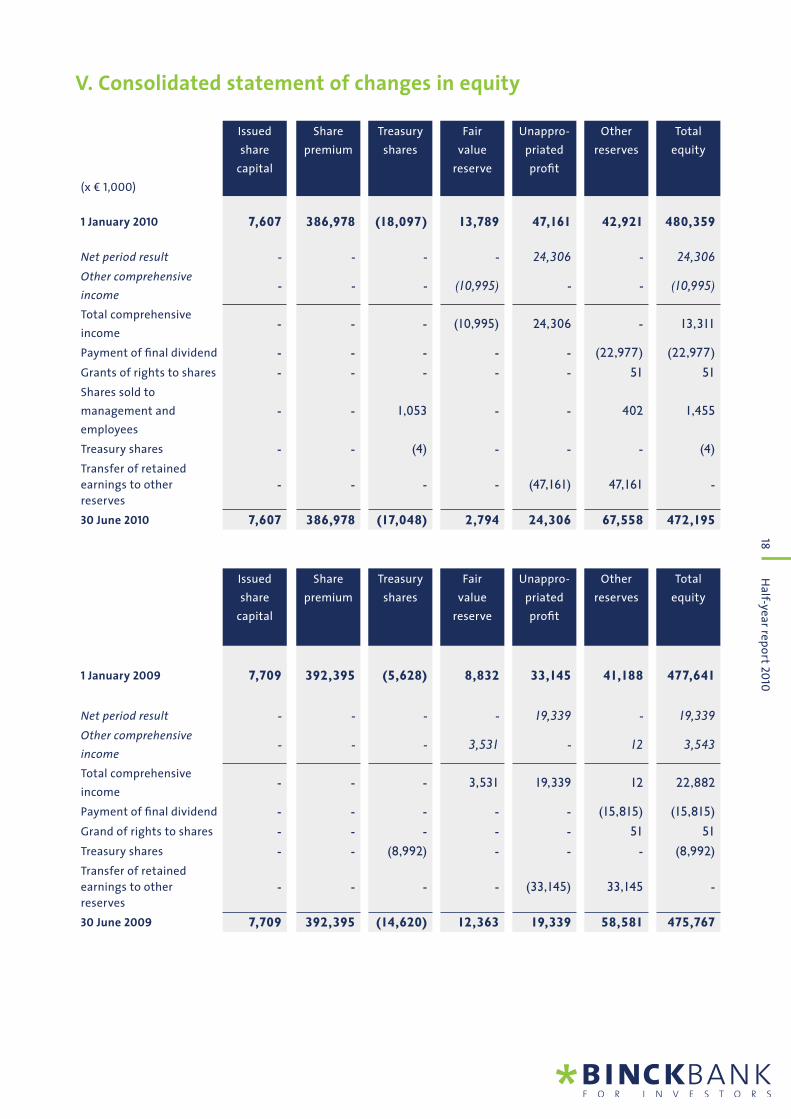
V. Consolidated statement of changes in equity
Issued
share
capital
Share
premium
Treasury
shares
Fair
value
reserve
Unappro-
priated
profi t
Other
reserves
Total
equity
(x € 1,000)
1 January 2010 7,607 386,978 (18,097) 13,789 47,161 42,921 480,359
Net period result - - - - 24,306 - 24,306
Other comprehensive
income - - - (10,995) - - (10,995)
Total comprehensive
income - - - (10,995) 24,306 - 13,311
Payment of fi nal dividend - - - - - (22,977) (22,977)
Grants of rights to shares - - - - - 51 51
Shares sold to
management and
employees
- - 1,053 - - 402 1,455
Treasury shares - - (4) - - - (4)
Transfer of retained
earnings to other
reserves
- - - - (47,161) 47,161 -
30 June 2010 7,607 386,978 (17,048) 2,794 24,306 67,558 472,195
Issued
share
capital
Share
premium
Treasury
shares
Fair
value
reserve
Unappro-
priated
profi t
Other
reserves
Total
equity
1 January 2009 7,709 392,395 (5,628) 8,832 33,145 41,188 477,641
Net period result - - - - 19,339 - 19,339
Other comprehensive
income - - - 3,531 - 12 3,543
Total comprehensive
income - - - 3,531 19,339 12 22,882
Payment of fi nal dividend - - - - - (15,815) (15,815)
Grand of rights to shares - - - - - 51 51
Treasury shares - - (8,992) - - - (8,992)
Transfer of retained
earnings to other
reserves
- - - - (33,145) 33,145 -
30 June 2009 7,709 392,395 (14,620) 12,363 19,339 58,581 475,767
19H
alf-ye
ar re
po
rt 20
10
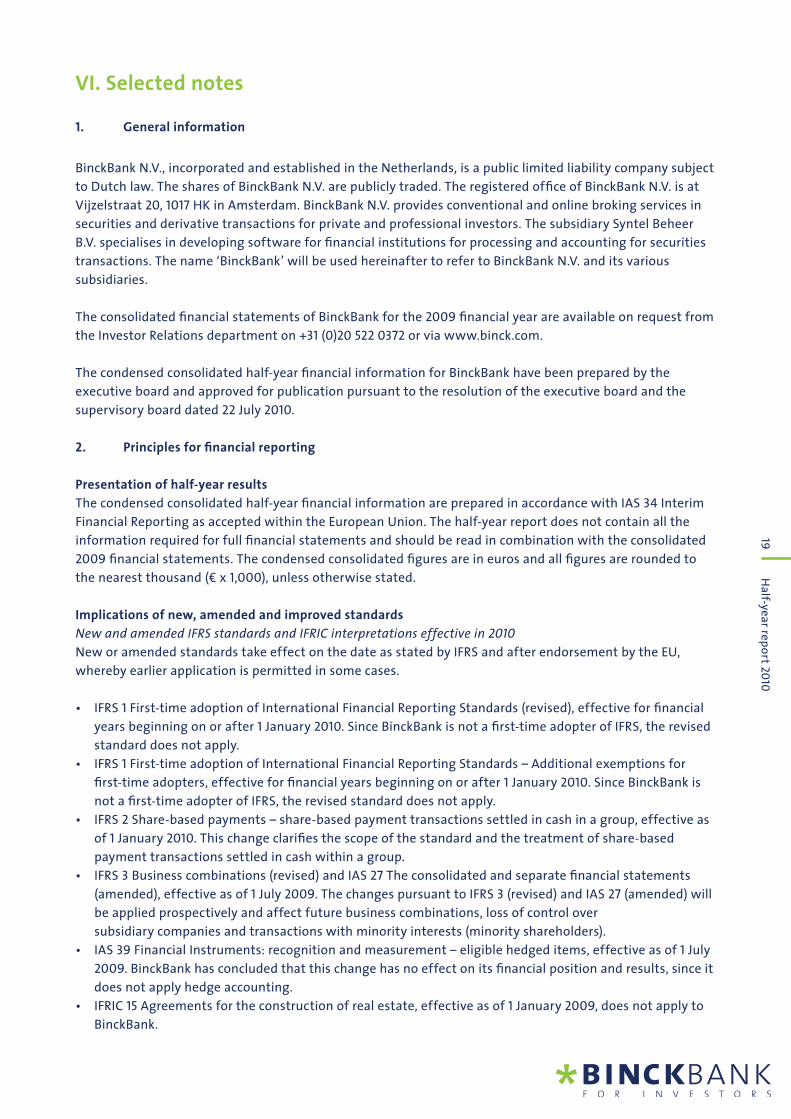
VI. Selected notes
1. General information
BinckBank N.V., incorporated and established in the Netherlands, is a public limited liability company subject
to Dutch law. The shares of BinckBank N.V. are publicly traded. The registered offi ce of BinckBank N.V. is at
Vijzelstraat 20, 1017 HK in Amsterdam. BinckBank N.V. provides conventional and online broking services in
securities and derivative transactions for private and professional investors. The subsidiary Syntel Beheer
B.V. specialises in developing software for fi nancial institutions for processing and accounting for securities
transactions. The name ‘BinckBank’ will be used hereinafter to refer to BinckBank N.V. and its various
subsidiaries.
The consolidated fi nancial statements of BinckBank for the 2009 fi nancial year are available on request from
the Investor Relations department on +31 (0)20 522 0372 or via www.binck.com.
The condensed consolidated half-year fi nancial information for BinckBank have been prepared by the
executive board and approved for publication pursuant to the resolution of the executive board and the
supervisory board dated 22 July 2010.
2. Principles for fi nancial reporting
Presentation of half-year results
The condensed consolidated half-year fi nancial information are prepared in accordance with IAS 34 Interim
Financial Reporting as accepted within the European Union. The half-year report does not contain all the
information required for full fi nancial statements and should be read in combination with the consolidated
2009 fi nancial statements. The condensed consolidated fi gures are in euros and all fi gures are rounded to
the nearest thousand (€ x 1,000), unless otherwise stated.
Implications of new, amended and improved standards
New and amended IFRS standards and IFRIC interpretations effective in 2010
New or amended standards take effect on the date as stated by IFRS and after endorsement by the EU,
whereby earlier application is permitted in some cases.
• IFRS 1 First-time adoption of International Financial Reporting Standards (revised), effective for fi nancial
years beginning on or after 1 January 2010. Since BinckBank is not a fi rst-time adopter of IFRS, the revised
standard does not apply.
• IFRS 1 First-time adoption of International Financial Reporting Standards – Additional exemptions for
fi rst-time adopters, effective for fi nancial years beginning on or after 1 January 2010. Since BinckBank is
not a fi rst-time adopter of IFRS, the revised standard does not apply.
• IFRS 2 Share-based payments – share-based payment transactions settled in cash in a group, effective as
of 1 January 2010. This change clarifi es the scope of the standard and the treatment of share-based
payment transactions settled in cash within a group.
• IFRS 3 Business combinations (revised) and IAS 27 The consolidated and separate fi nancial statements
(amended), effective as of 1 July 2009. The changes pursuant to IFRS 3 (revised) and IAS 27 (amended) will
be applied prospectively and affect future business combinations, loss of control over
subsidiary companies and transactions with minority interests (minority shareholders).
• IAS 39 Financial Instruments: recognition and measurement – eligible hedged items, effective as of 1 July
2009. BinckBank has concluded that this change has no effect on its fi nancial position and results, since it
does not apply hedge accounting.
• IFRIC 15 Agreements for the construction of real estate, effective as of 1 January 2009, does not apply to
BinckBank.
20
Ha
lf-yea
r rep
ort 2
010
• IFRIC 16 Hedges of a net investment in a foreign operation, effective as of 1 July 2009, does not apply to
BinckBank.
• IFRIC 17 Distributions of non-cash assets, effective as of 1 July 2009, does not apply to BinckBank.
• IFRIC 18 Transfer of assets from customers, effective for transactions after 1 July 2009, does not apply to
BinckBank.
• Improvements to IFRS standards (published in April 2009): this is a collection of minor amendments to a
number of IFRS standards which will not lead to any material adjustments.
Improvements are only applied to the extent they are ratifi ed by the EU.
The following standards, amendments of standards and interpretations that have not yet taken effect or
have not yet been endorsed by the European Union have not yet been applied by BinckBank:
• IFRS 9 Financial instruments, effective as of 1 January 2013. BinckBank does not expect to apply this
standard before 1 January 2013 and is currently studying and evaluating its effects.
• IAS 24 Related party disclosures (revised), effective as of 1 January 2011. BinckBank does not expect to
apply this standard before 1 January 2011 and is currently studying and evaluating its effects.
• IAS 32 Financial Instruments: presentation – Classifi cation of rights issues, effective for fi nancial years
beginning on or after 1 February 2010. BinckBank has concluded that this change has no effect on its
fi nancial position and results, since it has not issued any rights in foreign currency.
• IFRIC 14 requirements relating to minimum funding of an asset arising from a defi ned benefi t pension
plan, effective for fi nancial years beginning on or after 1 January 2011. BinckBank has concluded that this
change has no effect on its fi nancial position and results, since it does not operate a defi ned benefi t
pension plan.
• IFRIC 19 Extinguishing fi nancial liabilities with equity instruments, effective for fi nancial years beginning
on or after 1 July 2010, does not apply to BinckBank.
Recognition and measurement of assets, equity and liabilities
The condensed consolidated half-year fi nancial information are prepared in accordance with the principles
applied in the consolidated annual fi nancial statements on 31 December 2009, with the exception of new
activities and the application of new standards and interpretations as shown below.
Lease contracts
Lease contracts whereby the risks and benefi ts relating to the right of ownership are held to a signifi cant
extent by the lessor are designated as operating leases. Lease payments made in the capacity of lessee
in relation to operating leases are applied to the result during the lease period, after deduction of any
premiums received from the lessor. BinckBank has not entered into any fi nancial lease contracts of material
signifi cance, either as lessor or as lessee.
Property, plant and equipment
Real estate for own use is carried at historical cost less cumulative depreciation and impairment losses. All
other assets recognised in the balance sheet as operating assets are carried at historical cost less cumulative
depreciation and any impairment losses.
Real estate and operating assets are subject to straight-line depreciation on the basis of useful life, taking
account of the residual value. The expected useful lives are:
Real estate (own use) 50 years
Computer hardware 5 years
Fixtures, fi ttings and equipment 5-10 years
Other plant and equipment 5 years
If an asset consists of various ‘components’ with different useful lives and/or different residual values,
21
Ha
lf-yea
r rep
ort 2
010
the asset is divided into these components and depreciation is applied separately. Useful life and residual
value are assessed annually. If it emerges that the estimated values differ from previous estimates, the
values are adjusted. If the carrying amount of an asset is higher than the estimated recoverable amount,
an impairment is recognised and charged to the income statement. Results on the sale of real estate and
operating assets, being the difference between the sale proceeds and the carrying amount, are recognised in
the income statement in the period in which the sale occurred. Repair and maintenance costs are charged to
the income statement in the period to which they relate. The costs of signifi cant renovations are capitalised
if it is likely that additional future benefi ts will be realised from the existing asset. Signifi cant renovations
are written off on the basis of the remaining useful life of the asset concerned.
3. Notes to the consolidated condensed half year fi nancial information
Associates and joint ventures
An additional capital investment of €1.5 million was made in the joint venture TOM Holding B.V. during the
period 1 January 2010 to 30 June 2010.
Intangible assets
The various categories of intangible assets are tested annually or more frequently if events or changes in
circumstances indicate that the carrying amount, less applicable annual amortisation, may be impaired. In
the fi rst instance, the test is made on the basis of a comparison of the indicators mentioned in IAS 36.12 and
additional indicators identifi ed by BinckBank with the assumptions on which the valuation of the identifi ed
immaterial assets was based at the time of the acquisition. If the test reveals an indication of impairment,
BinckBank performs a full calculation of the recoverable amount of the cash-generating units.
During the period 1 January 2010 to 30 June 2010 the intangible assets were assessed for impairment on the
basis of the above-mentioned indicators. There was no indication of any impairment.
Property, plant and equipment
In the period 1 January 2010 to 30 June 2010 BinckBank acquired property, plant and equipment with a value
of €30,271,000. This sum includes the purchase, conversion work and installations for BinckBank’s new head
offi ce. In addition to the initial investment of €24,700,000, BinckBank expects to spend a total of €8,300,000
on converting and equipping the head offi ce building. Depreciation will be applied from the date of delivery
of the building, which is scheduled for the third quarter of 2010.
The investment in the head offi ce includes prepayments for leasehold (operating lease) amounting to
€10,040,000, with a term until 15 April 2056 which are also included in this item. Amortisation of leasehold
will take place over the remaining term.
Deferred tax liabilities
The movement in this item is primarily the result of deferred tax on the movement in the unrealised results
on fi nancial assets available for sale and the difference between the commercial and fi scal amortisation of
the intangible assets relating to the acquisition of Alex.
Treasury shares
The long-term bonus scheme for the executive board and other employees was settled in May 2010, after
approval by the general meeting of shareholders. 120,495 shares were issued to the executive board and
other employees at a price of €12.08. In the period 1 January 2010 to 30 June 2010 BinckBank repurchased 425
shares at an average price of €10.15. On 30 June 2010 BinckBank held a total of 1,950,439 treasury shares at an
average price of €8.74.
22
Ha
lf-yea
r rep
ort 2
010
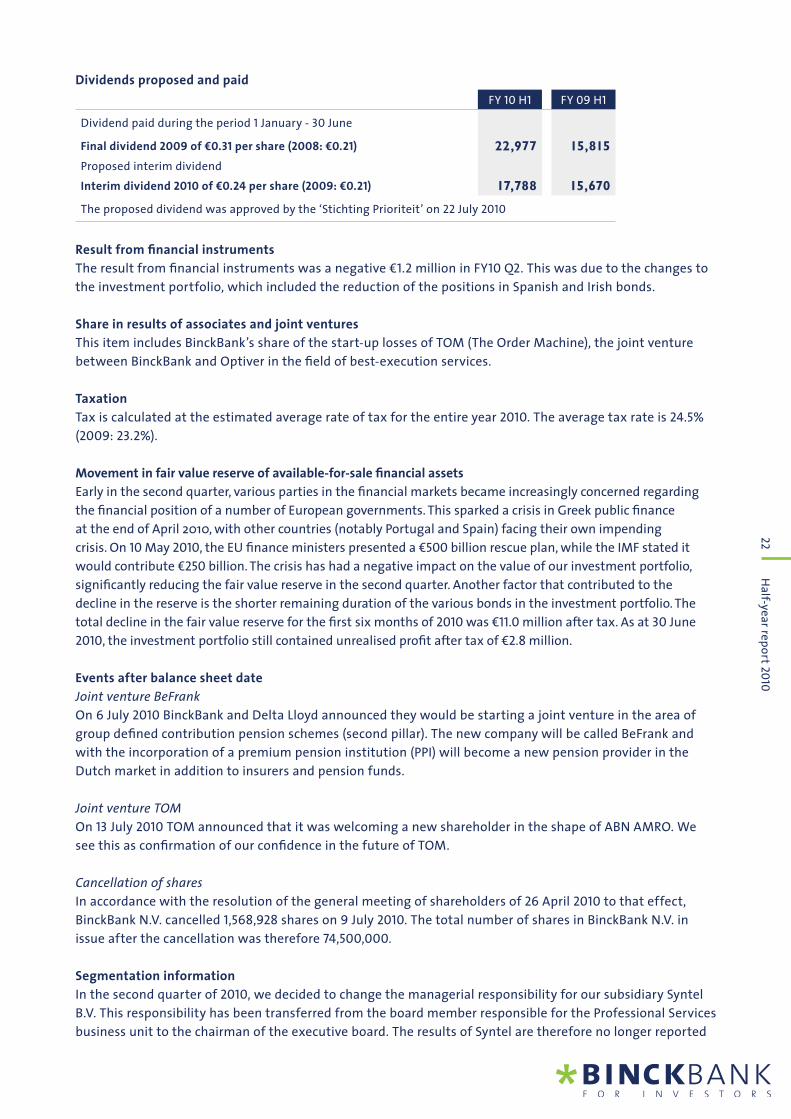
Dividends proposed and paid
FY 10 H1 FY 09 H1
Dividend paid during the period 1 January - 30 June
Final dividend 2009 of €0.31 per share (2008: €0.21) 22,977 15,815
Proposed interim dividend
Interim dividend 2010 of €0.24 per share (2009: €0.21) 17,788 15,670
The proposed dividend was approved by the ‘Stichting Prioriteit’ on 22 July 2010
Result from fi nancial instruments
The result from fi nancial instruments was a negative €1.2 million in FY10 Q2. This was due to the changes to
the investment portfolio, which included the reduction of the positions in Spanish and Irish bonds.
Share in results of associates and joint ventures
This item includes BinckBank’s share of the start-up losses of TOM (The Order Machine), the joint venture
between BinckBank and Optiver in the fi eld of best-execution services.
Taxation
Tax is calculated at the estimated average rate of tax for the entire year 2010. The average tax rate is 24.5%
(2009: 23.2%).
Movement in fair value reserve of available-for-sale fi nancial assets
Early in the second quarter, various parties in the fi nancial markets became increasingly concerned regarding
the fi nancial position of a number of European governments. This sparked a crisis in Greek public fi nance
at the end of April 2010, with other countries (notably Portugal and Spain) facing their own impending
crisis. On 10 May 2010, the EU fi nance ministers presented a €500 billion rescue plan, while the IMF stated it
would contribute €250 billion. The crisis has had a negative impact on the value of our investment portfolio,
signifi cantly reducing the fair value reserve in the second quarter. Another factor that contributed to the
decline in the reserve is the shorter remaining duration of the various bonds in the investment portfolio. The
total decline in the fair value reserve for the fi rst six months of 2010 was €11.0 million after tax. As at 30 June
2010, the investment portfolio still contained unrealised profi t after tax of €2.8 million.
Events after balance sheet date
Joint venture BeFrank
On 6 July 2010 BinckBank and Delta Lloyd announced they would be starting a joint venture in the area of
group defi ned contribution pension schemes (second pillar). The new company will be called BeFrank and
with the incorporation of a premium pension institution (PPI) will become a new pension provider in the
Dutch market in addition to insurers and pension funds.
Joint venture TOM
On 13 July 2010 TOM announced that it was welcoming a new shareholder in the shape of ABN AMRO. We
see this as confi rmation of our confi dence in the future of TOM.
Cancellation of shares
In accordance with the resolution of the general meeting of shareholders of 26 April 2010 to that effect,
BinckBank N.V. cancelled 1,568,928 shares on 9 July 2010. The total number of shares in BinckBank N.V. in
issue after the cancellation was therefore 74,500,000.
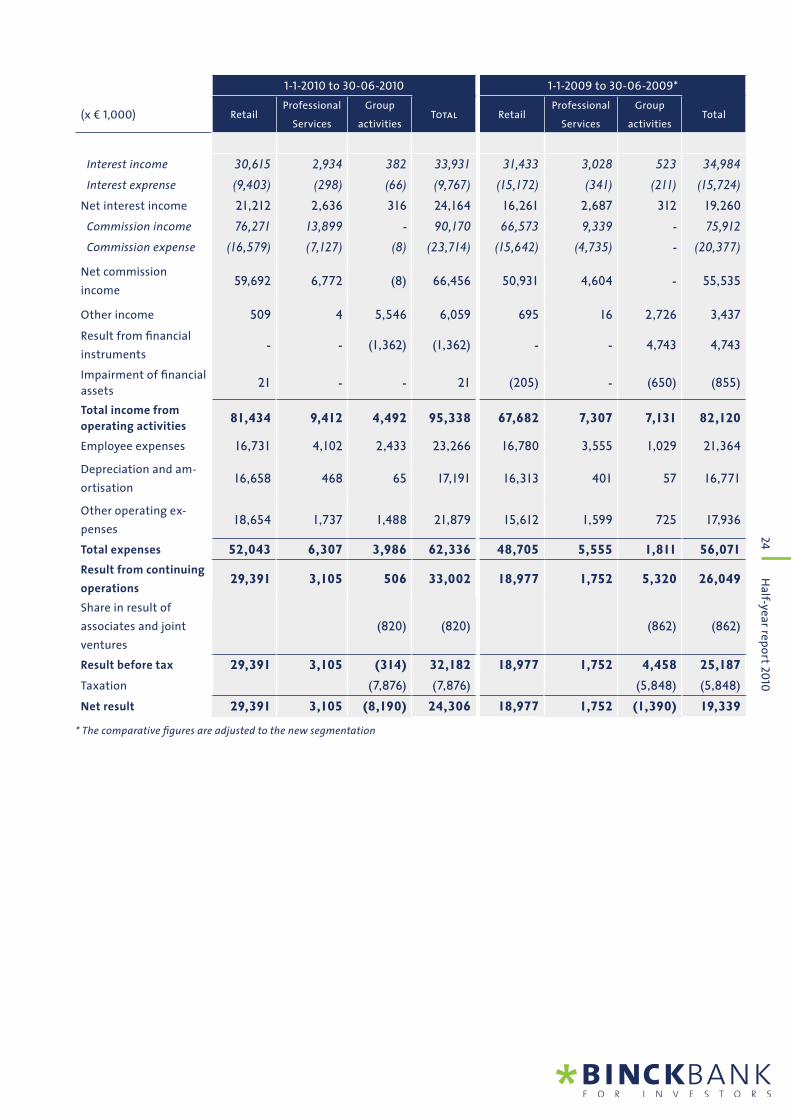
Segmentation information
In the second quarter of 2010, we decided to change the managerial responsibility for our subsidiary Syntel
B.V. This responsibility has been transferred from the board member responsible for the Professional Services
business unit to the chairman of the executive board. The results of Syntel are therefore no longer reported
23
Ha
lf-yea
r rep
ort 2
010
in the Professional Services business segment, but are included in the group activities. Furthermore, in order
to improve the quality of the management information, the allocation ratios of the indirect costs have been
reviewed. The new segmentation refl ects the revised managerial responsibilities. The comparative fi gures
have been adjusted accordingly.
A segment is a clearly distinct unit of BinckBank that provides services with a risk or return profi le that is
different from the other segments (business segment), or which provides services to a particular economic
market (market segment) that has a different risk and return profi le to that of other segments. In terms of
organisation, the operations of BinckBank are divided into two primary business segments. The executive
board determines the performance targets, and authorises and monitors the budgets prepared for these
business units. The management of the business unit is responsible for setting the business units’ policy,
in accordance with the strategy and performance targets formulated by the executive board. The business
segments are:
• Retail
• Professional Services
The Retail business unit operates as an (internet) broker for the private client market. The Professional
Services business unit provides brokerage services in securities and derivatives transactions on behalf
of professional investors in the Netherlands and abroad, including the provision of the majority of the
related administration. All directly attributable income and expenses are recognised within the Retail and
Professional Services business segments, together with the attributed costs of the group activities.
The item Group activities includes the business units directly managed by the executive board and for which
the income and expenses are not included in one of the other segments. This includes central Treasury
results, including results on sales in the investment portfolio, external activities of the IT department,
which include the subsidiary company Syntel B.V. and extraordinary expenses, for example in relation to the
Deposit Guarantee Scheme.
The same accounting policies are used for a business segment as those described for the consolidated
balance sheet and income statement of BinckBank. The prices used for transactions between business
segments are the prices that would occur under normal market conditions (‘at arm’s length’).
24
Ha
lf-yea
r rep
ort 2
010
1-1-2010 to 30-06-2010 1-1-2009 to 30-06-2009*
(x € 1,000) RetailProfessional
Services
Group
activitiesTotal Retail
Professional
Services
Group
activitiesTotal
Interest income 30,615 2,934 382 33,931 31,433 3,028 523 34,984
Interest exprense (9,403) (298) (66) (9,767) (15,172) (341) (211) (15,724)
Net interest income 21,212 2,636 316 24,164 16,261 2,687 312 19,260
Commission income 76,271 13,899 - 90,170 66,573 9,339 - 75,912
Commission expense (16,579) (7,127) (8) (23,714) (15,642) (4,735) - (20,377)
Net commission
income 59,692 6,772 (8) 66,456 50,931 4,604 - 55,535
Other income 509 4 5,546 6,059 695 16 2,726 3,437
Result from fi nancial
instruments - - (1,362) (1,362) - - 4,743 4,743
Impairment of fi nancial
assets 21 - - 21 (205) - (650) (855)
Total income from
operating activities 81,434 9,412 4,492 95,338 67,682 7,307 7,131 82,120
Employee expenses 16,731 4,102 2,433 23,266 16,780 3,555 1,029 21,364
Depreciation and am-
ortisation 16,658 468 65 17,191 16,313 401 57 16,771
Other operating ex-
penses 18,654 1,737 1,488 21,879 15,612 1,599 725 17,936
Total expenses 52,043 6,307 3,986 62,336 48,705 5,555 1,811 56,071
Result from continuing
operations 29,391 3,105 506 33,002 18,977 1,752 5,320 26,049
Share in result of
associates and joint
ventures
(820) (820) (862) (862)
Result before tax 29,391 3,105 (314) 32,182 18,977 1,752 4,458 25,187
Taxation (7,876) (7,876) (5,848) (5,848)
Net result 29,391 3,105 (8,190) 24,306 18,977 1,752 (1,390) 19,339
* The comparative fi gures are adjusted to the new segmentation

25
Ha
lf-yea
r rep
ort 2
010
Review report
To: the Management Board and Supervisory Board of BinckBank N.V.
Introduction
We have reviewed the condensed consolidated interim fi nancial information as set out in the half-year
report 2010 on pages 15 to 24, of BinckBank N.V., Amsterdam, which comprises the consolidated balance
sheet as at 30 June 2010, the consolidated income statement, consolidated comprehensive income
statement, condensed consolidated cash fl ow statement and consolidated statement of changes in equity
for the six month period then ended and the selected explanatory notes. The Management Board of the
company is responsible for the preparation and presentation of this condensed consolidated interim
fi nancial information in accordance with IAS 34, ‘Interim Financial Reporting’ as adopted by the European
Union.
Our responsibility is to express a conclusion on this condensed consolidated interim fi nancial information
based on our review.
Scope
We conducted our review in accordance with Dutch law including standard 2410, ‘Review of Interim Financial
Information Performed by the Independent Auditor of the Entity’. A review of interim fi nancial information
consists of making inquiries, primarily of persons responsible for fi nancial and accounting matters, and
applying analytical and other review procedures. A review is substantially less in scope than an audit
conducted in accordance with auditing standards and consequently does not enable us to obtain assurance
that we would become aware of all signifi cant matters that might be identifi ed in an audit. Accordingly, we
do not express an audit opinion.
Conclusion
Based on our review, nothing has come to our attention that causes us to believe that the accompanying
condensed consolidated interim fi nancial information for the six months period ended 30 June 2010 is not
prepared, in all material respects, in accordance with IAS 34, ‘Interim Financial Reporting’, as adopted by the
European Union.
Amsterdam, 22 July 2010
Ernst & Young Accountants LLP
Signed by N.G.D. Warmer
26
Ha
lf-yea
r rep
ort 2
010
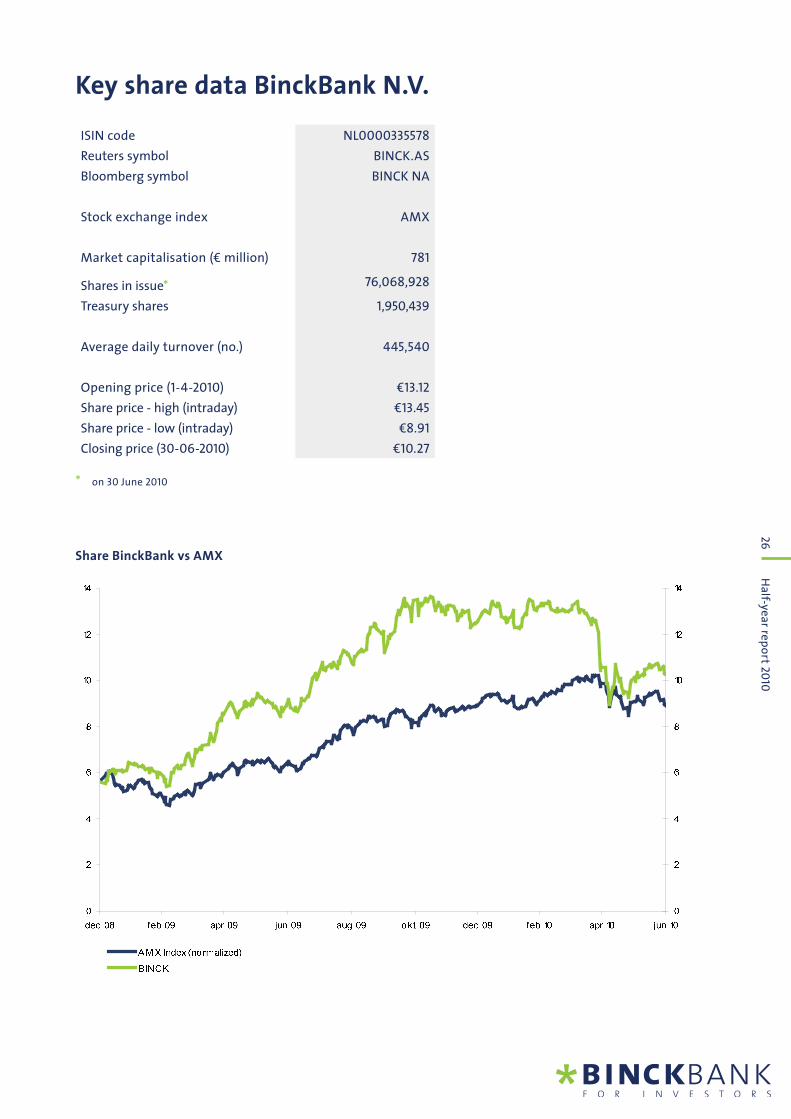
Key share data BinckBank N.V.
Share BinckBank vs AMX
ISIN code NL0000335578
Reuters symbol BINCK.AS
Bloomberg symbol BINCK NA
Stock exchange index AMX
Market capitalisation (€ million) 781
Shares in issue* 76,068,928
Treasury shares 1,950,439
Average daily turnover (no.) 445,540
Opening price (1-4-2010) €13.12
Share price - high (intraday) €13.45
Share price - low (intraday) €8.91
Closing price (30-06-2010) €10.27
* on 30 June 2010
0
2
4
6
8
10
12
14
dec-08 feb-09 apr-09 jun-09 aug-09 okt-09 dec-09 feb-10 apr-10 jun-100
2
4
6
8
10
12
14
AM X Index (normalized)
BINCK
27
Ha
lf-yea
r rep
ort 2
010
Further information BinckBank N.V.
BinckBank is an online bank for investors and is ranked among the top fi ve in Europe. As an online broker,
BinckBank offers its clients fast and low-cost access to all major fi nancial markets worldwide. Moreover, as
an asset management bank, BinckBank provides support to its clients in the management of their capital
through online asset management services and online savings accounts. In addition to fast and low-cost order
execution, BinckBank also provides services to professional clients in the fi eld of the administrative processing
of securities and cash transactions by means of an outsourcing agreement (BPO), or the licensing of the related
software. The company has offi ces in the Netherlands, Belgium, France and Spain.
Today, 26 July 2010, an audio webcast will be held at 10.00 a.m. The presentation is available on
www.binck.com under Pressroom > Publications. In addition, as from Wednesday, 28 July 2010, the transcript of
the audio webcast will be available on www.binck.com under Investor Relations.
Important dates in 2010*:
- Ex interim dividend 27 July 2010
- Record date interim dividend 29 July 2010
- Payment of interim dividend 2 August 2010
- Third-quarter results 25 October 2010
* Dates subject to change
Investor relations:
Anneke Hoijtink
Telephone: +31 (0)20 - 522 0372 / +31 (0)6 201 98 337
BinckBank N.V.
Vijzelstraat 20
1017 HK Amsterdam
The Netherlands
www.binck.com

BinckBankVijzelstraat 20
1017 HK Amsterdam
Postbus 15536
1001 NA Amsterdam
t +31 (0)20 522 03 72
f +31 (0)20 320 41 76
e [email protected] i www.binck.com