Aluminium Utensils and Cookware by K.M.C Aluminium Industries, Coimbatore
2017HALF-YEAR FINANCIAL REPORT AS AT 30 JUNE

12
3
Profile 1
Management report 5Highlights 5
Business activity 8
Operating Result from Activity 12
Operating profi t and net profi t 13
Financial structure at 30 June 2017 13
2017 outlook 13
Financial statements 14Consolidated income statement 14
Consolidated statement of comprehensive income 14
Consolidated balance sheet 15
Consolidated cash fl ow statement 16
Consolidated statement of changes in equity 17
Notes to the condensed consolidated financial statements 18
Statutory auditors’ report on the half-yearly fi nancial information 32
Statement by the person responsible for the interim fi nancial report 33

GROUPE SEB - HALF-YEAR FINANCIAL REPORT AS AT 30 JUNE 1
Profile
_________ALL-CLAD_________
ARNO_________ASIAVINA_________
CALOR_________
CLOCK_________
EMSA_________ESTERAS_________
HEPP_________
IMUSA_________
KAISER_________
KRUPS_________
LAGOSTINA_________
MAHARAJA WHITELINE_________
MIRRO_________MOULINEX_________
OBH NORDICA_________
PANEX_________ROCHEDO_________ROWENTA_________SAMURAI_________SCHAERER_________
SEB_________
SILIT_________
SUPOR_________
TEFAL_________
T-FAL_________
UMCO_________WEAREVER_________
WMF_________
An unrivalled
brand portfolio
The world reference in Small Domestic Equipment, Groupe SEB pursues a multi-specialist strategy with top-ranking positions in
small electrical appliances and a strong global leadership in cookware.
Its mission is making consumers’ everyday lives easier and more enjoyable and contributing to better living all around the world.
Operating in nearly 150 countries, Groupe SEB has built strong
positions across continents through a product offering, both global and
local, addressing consumer expectations throughout the world.
This offering is enhanced by an exceptional brand portfolio.
The Group’s success is rooted in its long-term vision committed to
achieving the right balance between growth and competitiveness in
order to create value for all its stakeholders.
AN EXTENSIVE PRODUCT OFFERING
■ Cookware: frying pans, saucepans, pressure cookers, bakeware, kitchen utensils and accessories…
■ Small electrical appliances:
■ Electrical cooking: deep fryers, rice cookers, electrical pressure cookers, tabletop cooking
appliances, waffl e makers, meat grills, toasters, multicookers…
■ Preparation: kitchen machines, mixers, beaters, blenders, cooking food processors, coffee makers
(fi lter and pod), espresso machines, electrical kettles, home beer-tapping machines, soy milk makers…
■ Linen care: steam irons and generators, garment steamers…
■ Personal care: hair care equipment, depilators, bathroom scales…
■ Home care: canister vacuum cleaners with or without dust bag, stick vacuum cleaners, fans, heaters,
air treatment appliances …
■ Professional equipment: automatic coffee machines, hotel equipment…
PRESENCE ACROSS THE ENTIRE VALUE CHAIN, FROM PRODUCTION TO DISTRIBUTION
■ 40 production plants worldwide, which
manufacture around 70% of products sold
■ Multichannel distribution: mass retail, specialist
retailers, traditional stores, proprietary stores
(Group retail) and e-commerce
■ Top ranking positions in over 25 countries
■ 32,900 employees in 150 countries
(31 December 2016)
■ A strategy focusing on ethical, socially fair and
ecologically responsible long-term development
DEVELOPMENT UNDERPINNED BY INNOVATION
■ +€150 million invested annually
■ +1,300 people in the innovation community
■ +1,000 active patents
GROUPE SEB - HALF-YEAR FINANCIAL REPORT AS AT 30 JUNE2
1 Profile
AT 30 JUNE 2017
GROUPE SEB CONSOLIDATED RESULTS
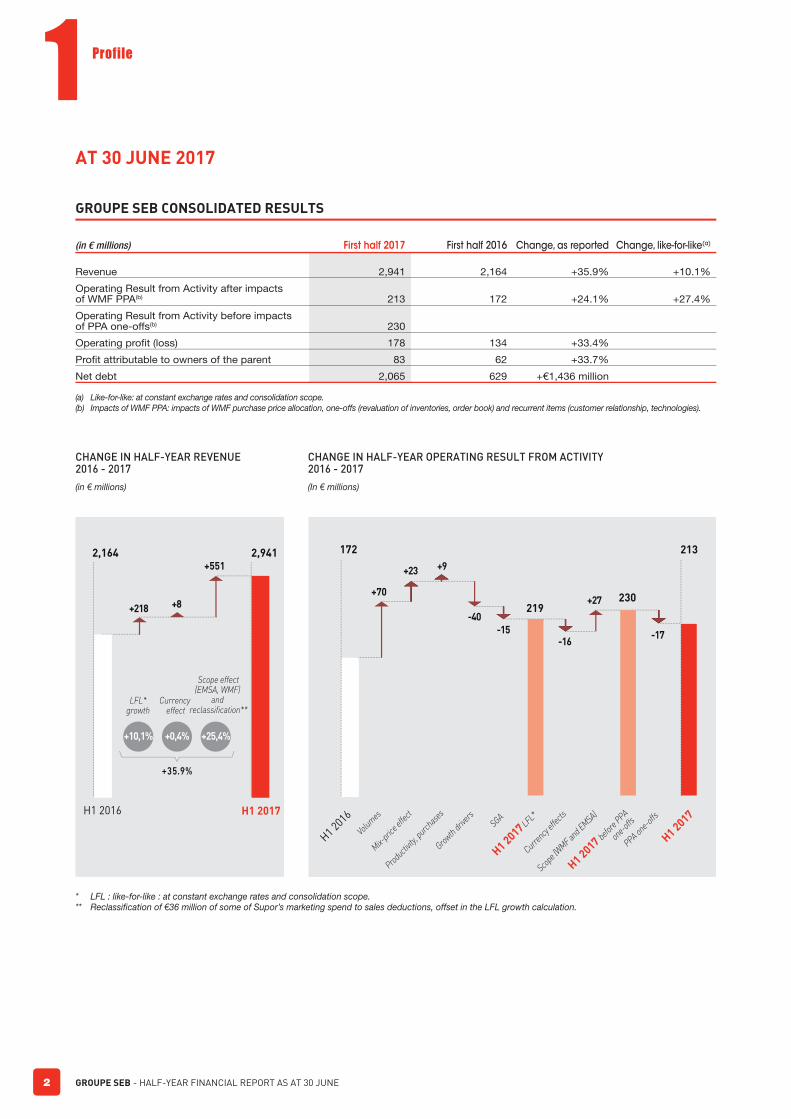
(in € millions) First half 2017 First half 2016 Change, as reported Change, like-for-like(a)
Revenue 2,941 2,164 +35.9% +10.1%
Operating Result from Activity after impacts of WMF PPA(b) 213 172 +24.1% +27.4%
Operating Result from Activity before impacts of PPA one-offs(b) 230
Operating profi t (loss) 178 134 +33.4%
Profi t attributable to owners of the parent 83 62 +33.7%
Net debt 2,065 629 +€1,436 million
(a) Like-for-like: at constant exchange rates and consolidation scope.
(b) Impacts of WMF PPA: impacts of WMF purchase price allocation, one-offs (revaluation of inventories, order book) and recurrent items (customer relationship, technologies).
CHANGE IN HALF-YEAR REVENUE 2016 - 2017
(in € millions)
Scope effect(EMSA, WMF)
and reclassification**
+25,4%
LFL*growth
+10,1%
Currency effect
+0,4%
+218 +8
+551
+35.9%
H1 2016 H1 2017
2,9412,164
CHANGE IN HALF-YEAR OPERATING RESULT FROM ACTIVITY2016 - 2017
(In € millions)
+70
+23 +9
+27
-40
-15-16
-17
172
219230
213
H1 201
6
H1 2017
Volum
es
Produc
tivity,
purch
ases
Growth
driver
s
Mix-pri
ce eff
ect
Curren
cy eff
ects
PPA one-o
ffsSGA
H1 2017 LFL*
Scope (
WMF and E
MSA)
H1 2017
befor
e PPA
one-o
ffs
* LFL : like-for-like : at constant exchange rates and consolidation scope.** Reclassifi cation of €36 million of some of Supor’s marketing spend to sales deductions, offset in the LFL growth calculation.
GROUPE SEB - HALF-YEAR FINANCIAL REPORT AS AT 30 JUNE 3
Profile
1
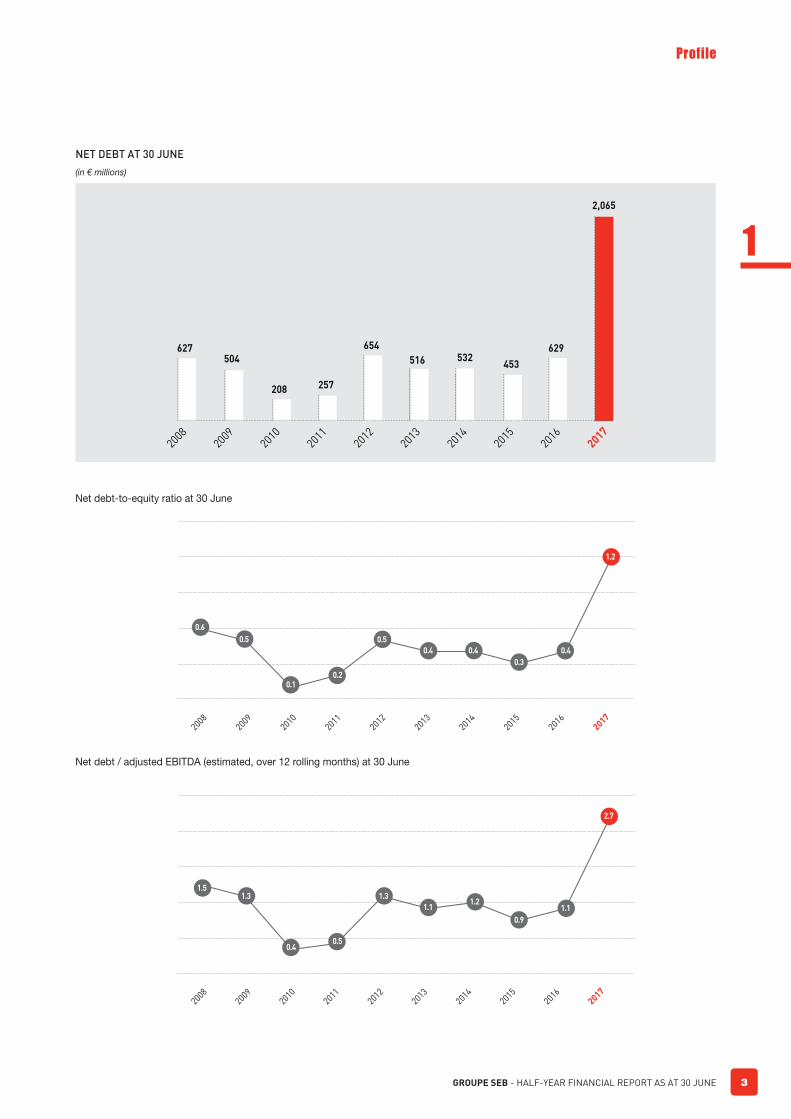
NET DEBT AT 30 JUNE
(in € millions)20
08
2009
2010
2011
2012
2013
2014
2015
2016
2017
627 504
208 257
654
516 532 453
629
2,065
Net debt-to-equity ratio at 30 June
2008
2009
2010
2011
2012
2013
2014
2015
2016
2017
0.6
0.5
0.10.2
0.5
0.4 0.4
0.3
0.4
1.2
Net debt / adjusted EBITDA (estimated, over 12 rolling months) at 30 June
2008
2009
2010
2011
2012
2013
2014
2015
2016
2017
1.51.3
0.40.5
1.3
1.11.2
0.9
1.1
2.7

GROUPE SEB - HALF-YEAR FINANCIAL REPORT AS AT 30 JUNE4
1 Profile
CHANGE IN DEBT OVER 6 MONTHS
(in € millions)
Cash generated by operations: €91m
Debt en
d- 2016
Debt en
d- June 2
017
Cash flo
w
Tax an
d finan
cial ex
pense
Investm
ents
WCR
Other ope
ration
al
Dividen
ds
2,019
-275
+71+87 -43
+69+101 +10 +26
2,065
Currencie
s
Other non
opera
tional
CHANGE IN WORKING CAPITAL REQUIREMENT BY HALF-YEAR
(as a % of revenue)
dec-1
2june-
13dec
-13
june-14
dec-1
4june-
15dec
-15
june-16
dec-1
6ju
ne-17
17
18
19
20
21
22
23
24
25 24.9
21.1
22.7
20.2
22.4
21.1 21.0
19.0
18.4
17.9
SHARE PRICE
(to 20 July 2017)
CAC 40 (rebased)Volumes SEB
€ Number of shares
Dec.
16
Jan.
17
Feb.
17
March
17
April
17
May 17
June
17
0
50,000
100,000
150,000
200,000
250,000
300,000
0
20
40
60
80
100
120
140
160
180+23.9%
+6.5%

GROUPE SEB - HALF-YEAR FINANCIAL REPORT AS AT 30 JUNE 5
Management report
2
2. Management report
HIGHLIGHTS
GENERAL ENVIRONMENT
The general environment in the fi rst half was broadly favourable,
opening the door to strong growth in some countries (China, Germany,
Central Europe, Russia, Turkey, etc.) whereas some regions or
countries faced a more complicated or tensed context. Accordingly:
■ while eurozone economies remained broadly positive with
consumption pretty solid, and even buoyant in certain countries
(Germany, Spain, Portugal, France, for example), the situation is
more unpredictable in the UK. The weakening of the pound sterling
surrounding the Brexit vote has triggered higher infl ation primarily by
making imports more expensive, with small household appliances
being widely affected. With consumer price hikes negatively
impacting household purchasing power, demand is slowing and
there is limited visibility as to how this will unfold;
■ in the US, against a background of a sluggish yet fast changing
consumer market due to the exponential rise of e-commerce,
traditional brick-and-mortar retailing is going through an
unprecedented crisis with a series of consequences, ranging
from tighter inventory management or inventory run-downs to the
collapse of certain chains, and including major restructurings and
store closures. This situation complicates and signifi cantly slows
business with these retailer clients;
■ the progressive improvement in the macro-economic environment
in Brazil is hampered by the deep ongoing political crisis in the
country, which is slowing the introduction of fundamental reforms.
The recent upheaval weakened again the Real in the second quarter
resulting in higher infl ation, dragging down the Brazilian economy as
well as business and household confi dence, with negative demand-
side effects;
■ in India, the withdrawal of larger denomination notes at end-2016
led to a marked fall in consumption, which remained depressed
since then. The debate surrounding the Goods and Service Tax,
which creates a single VAT tax across the 29 states, and its
subsequent passage on 1 July did not help demand much over
the past number of months. For small electrical appliances, the
GST rate will be set at 28% and the application of this tax, with all
its technical implications, will most likely disrupt business.
In this environment, the Small Domestic Equipment market remained
in an uptrend, although with mixed performances across regions and
product categories. Its growth is increasingly driven by e-commerce,
which is changing the ground rules in retailing and putting additional
pressure on the competitive and promotional climate.
Currencies
In first half 2017, the currency environment was broadly more
positive than in previous years, with much less impact on the Group’s
performance. The fl uctuations − based on average exchange rates −
nevertheless varied signifi cantly across currencies.
The half-on-half depreciations against the euro included, on the back
of Brexit, the pound sterling (-12%), yuan (-3%), Turkish lira (-18%),
Ukrainian hryvnia (-8%), Mexican peso (-7%), Argentinian peso (-11%).
Conversely, a certain number of currencies strengthened against the
euro, including the dollar, all so slightly (+3%), the real which, although
under pressure in the second quarter, is on average well up on fi rst
half 2016 (+20%), the rouble (+19%), the South Korean won (+5%) and
the Colombian peso (+7%). The yen and the Polish zloty have, for their
part, been pretty much unchanged on second half 2016.
It should be noted that the Group’s two “short” currencies (in which
it has more costs than revenue due to its purchasing structure), the
dollar and the yuan, underwent contrasting moves over the period.
Given the inherent volatility of exchange rates, the Group hedged
certain currencies, in order to limit shocks on its performance or
spread the impact over time. In parallel, it has a nimble pricing policy,
passing on price increases to offset the adverse effects on local
profi tability of a weakening currency, and trimming the market price
when the currency strengthens again to protect its business and its
competitive positioning.
In fi rst half 2017, exchange rate fl uctuations had an €8 million positive
effect on Group revenue (compared with a -€92 million effect in fi rst
half 2016) and a -€16 million effect on Operating Result from Activity
(-€61 million at 30 June 2016).
Cost of raw materials and transport
2016 and fi rst half 2017 saw an overall increase in metal prices,
resulting in price levels at end-June that were signifi cantly higher than
the average in fi rst half 2016. Aluminium, which had an average price
of $1,550/t in fi rst half 2016 closed end-June 2017 at $1,880/t. Copper
prices also rose over the months to $5,750/t at end-June from an
average price of $4,700/t in fi rst half 2016. The situation is somewhat
different for nickel (a component of certain stainless steels): from an
average of $8,700/t in fi rst half 2016, it rose to $11,500/t at end-2016
before falling back to $9,750/t at end-June. To smooth the effects of
the sometimes sudden fl uctuations in metal prices, the Group makes
use of partial hedging arrangements for its requirements (for aluminium

GROUPE SEB - HALF-YEAR FINANCIAL REPORT AS AT 30 JUNE6
2 Management report
and nickel). This provides protection from sharp price increases, but
entails a certain inertia when prices fall. The hedges arranged in 2016
thus protected the Group from the direct impact of raw material price
increases in the fi rst half.
In parallel, having dropped below $30 a barrel in early 2016, oil prices
recovered in the course of the year , trading between $50 and $54 a
barrel for the fi rst two months of 2017 before trending down again. The
average cost of a barrel over the half was around $46/t, compared with
$41/t in fi rst half 2016. At the same time, the price of plastic materials
rose on the international market, particularly polypropylene.
In addition, while road haulage costs remained unchanged, the same
is not true for maritime freight (Asia Pacifi c/Europe/Americas), which
hit historic lows in 2016, resulting in rates being revised upwards.
CHANGES IN THE COMPOSITION OF THE BOARD OF DIRECTORS
On 11 May 2017, the General Meeting of SEB S.A. approved the
reorganisation of the Board of Directors, resulting in:
■ a reduction in size and a reworking of Board membership in
order to integrate one Employee Shareholder Director and one
Employee Director while achieving the gender balance (46%) and
independence (33%) targets. Further to the General Meeting of
11 May 2017, the Board of Directors has now 13 members and will
comprise 14 members following the appointment of an Employee
Director by the Group Works Council within six months of the
General Meeting;
■ the reappointment to the Board of Directors for a four year term of
Yseulys Costes and of FFP Invest – represented by Bertrand Finet;
■ the ratifi cation of the co-option of Delphine Bertrand for a one-year
term to succeed Tristan Boiteux, who resigned;
■ the appointment of Brigitte Forestier as director to represent
employee shareholders, for a four-year term;
■ the resignation of Bruno Bich, Tristan Boiteux, Pascal Girardot and
Christian Peugeot.
INTEGRATION OF WMF
This acquisition of WMF was fi nalized on 30 November 2016. Starting
the integration of WMF was thus a priority in the fi rst half, which took
the form of a comprehensive approach coordinated by a combined
integration committee, made up of Groupe SEB and WMF employees.
The process is built around 22 projects including 10 to bind WMF to
Groupe SEB and 12 involving value creation. It will run over the next
18 months but the fi rst action plans have already been decided and
undertaken in a excellent spirit of cooperation between the teams.
In terms of organisation, the WMF management team was
strengthened and the Group mobilised in-house experts to contribute
to and optimise the progress of the project . The Consumer business
was structured as a Business Unit, with a strengthening of strategic
marketing and the creation of a Business Development function. It
went through a sales reorganisation with, on one hand, the sales teams
in Germany - Austria - Switzerland reporting to the Chief Executive
Offi cer of WMF and, on the other hand, the taking over of business
operations by Groupe SEB subsidiaries in seven other countries. The
professional business – Coffee and catering equipment – continues
to be managed through a separate organisation.
Beyond organisational, structural aspects, the immediate alignment of
the key functions was critical. From a Human Resources perspective,
the immediate focus was on the building ties and cooperation between
Groupe SEB’s and WMF’s teams, on aligning HR management
(training, mobility, talent management, etc.) and variable compensation
systems for senior management. With respect to Finance, the primary
focus was on harmonising accounting policies, putting in place Group
processes and reporting systems and centralising certain corporate
functions such as treasury, and tax or internal audit. In parallel, work
began from the outset on harmonising IT systems, which represents
a key challenge in the binding process of WMF to Groupe SEB and
will take a few years.
In the context of the value creation projects, synergies were initiated
in procurement, supply chain and industry along with concrete actions
designed to kick off the acceleration in professional coffee and the
development of the Consumer business.
ACQUISITION OF SWIZZZ PROZZZ
Groupe SEB fi nalised the acquisition of the Swiss company Swizzz
Prozzz, which specialises in mini hand choppers with high-performance
multi-blade systems. Previously, Swizzz Prozzz products have been
licensed via various kitchen utensil and gadget brands, enjoying great
success with proforma annual revenue of around €10 million. Through
this acquisition, Groupe SEB pursues its development in kitchen
utensils and accessories with simple, easy-to-use and affordable
products, which are very complementary to its existing ranges.
SUCCESSFUL NEW SEVEN-YEAR €500 MILLION BOND ISSUE
In May 2017, Groupe SEB successfully issued a seven-year
€500 million bond (maturing on 31 May 2024), with a 1.50% coupon.
This issue was 4 times over-subscribed by a diversifi ed investor base.
It enables Groupe SEB to further strengthen its debt architecture by
securing its mid-term fi nancing, extending the average maturity of its
debt and ensuring attractive fi nancing conditions.
GROUPE SEB - HALF-YEAR FINANCIAL REPORT AS AT 30 JUNE 7
Management report
2
CREATION IN ECULLY, FRANCE, OF AN INNOVATION HUB FOR THE SMALL ELECTRICAL APPLIANCE BUSINESS
Following on from the creation of the Products and Innovation
department in September 2015, the Group has decided to gather at
its global headquarters site in Écully, France, the electrical cooking
marketing and research teams, currently based at Selongey, with these
of home and personal care. The aim is to optimise the innovation
process by gaining agility and cross-fertilisation approach. The teams
will be gradually transferred over, beginning in summer 2017.
PURSUIT OF THE INDUSTRIAL AND LOGISTIC REORGANISATION IN BRAZIL
In order to restore its competitiveness in Brazil, the Group initiated in
November 2016 the transfer of its small electrical appliance production
from the historic Mooca plant in the heart of São Paulo to a newly built
industrial and logistical site in Itatiaia (State of Rio de Janeiro). This
project was completed 2 months ahead of schedule. The ramp- up of
the facility is in line with expectations.
In February 2017, Groupe SEB Brazil announced its decision to
also transfer the manufacturing of cookware, carried out at the São
Bernardo site (São Paulo metropolitan area), to the new site at Itatiaia.
The transfer started in July.
AWARDS FOR GROUPE SEB
Groupe SEB also received a wide variety of awards:
Groupe SEB wins the CSR Grand Prix for Responsible Consumption Industries awarded by ESSEC Business School
On 1 February 2017, Groupe SEB was awarded the Corporate Social
Responsibility Grand Prix for Responsible Consumption Industries by
ESSEC Business School. The prize was launched by ESSEC’s Chair
in Consumer Products in partnership with the French Ministry for the
Economy, Industry and Digital. In that category, the jury recognised
the Group’s commitment to ensuring its products can be repaired for
ten years. And the CSR Grand Prix was awarded to the Group for the
overall quality of the projects featured in its entries.
Thierry de La Tour d’Artaise chosen as “Financier of the Year” 2016
As part of the awards organised by ANDESE − Association Nationale
des Docteurs ès Sciences Économiques et en Sciences de Gestion −
and weekly fi nancial newspaper Investir, Thierry de La Tour d’Artaise
was chosen as “Financier of the Year 2016”. This award was given
to him on 18 April by François Villeroy de Galhau, Governor of the
Bank of France. Established in 1984, the Financier of the Year award
honours the person judged to have made the greatest contribution
to the fi nance business in France during the previous year. A jury
comprising over 300 members of the fi nancial community in France
selects the winner from a panel of fi ve nominees.
Innovation prize at the 2017 digital transformation awards
The second edition of the Digital Transformation Awards saw
Groupe SEB win one of the four innovation prizes, together with
SNCF, FDJ and Nantes Métropole Habitat. Organised by the trade
journal Solutions Numériques, the awards recognise companies that
have used digital technology to reinvent themselves and transform
their organisation, their products or their business model, boosting
growth and gaining a customer or internal benefi t. Groupe SEB has
made a name for itself by creating connected products and combating
planned obsolescence, which is to consumers’ disadvantage, by
extending product warranties and supplying spare parts produced
by 3D printers.
First prize in Cristal des Achats 2017
Groupe SEB Purchasing department has won fi rst prize in the French
National Procurement Council’s “Cristal des Achats” 2017 awards
which recognise best purchasing practices. Hervé Montaigu, Vice-
president Purchasing, and Perrine Baylin, Purchasing Performance
Manager, received the award during the Purchasing University event
on 15 May. The award was for the “Purchasing Maturity Grid” created
using OPS tools during a workshop attended by 12 purchasers from
France, Germany and China. The grid enables the Group’s purchasing
teams to rate themselves according to various criteria, defi ne an
annual progress plan in their key areas, discover best practices and
successes and see how they measure up.
Award for Best Financial department
At the 7th Trophées Leaders de la Finance awards organised by
Décideurs Magazine and Leaders League on 20 April in Paris, Vincent
Léonard, Senior Executive Vice President, Finance, was presented
with the award for the Best Financial department of an International
Group. The awards were presented at a gala dinner attended by
700 fi nance professionals from companies, banks and specialised
brokerage and consultancy fi rms. This award acknowledges a year of
record performances and intensive external growth activity.
Club des Trente award for the best financial deal in 2016
On 31 May, the Club des Trente, which brings together the CFOs of
the leading French groups, gave the award for best fi nancial deal, in
the merger and acquisition category, to Thierry de La Tour d’Artaise.
It recognises Groupe SEB for the acquisition of WMF in Germany.
The award enables Club des Trente to highlight how fi nance and the
fi nancial markets can serve ambitious industrial strategies that are
compatible with sustainable development goals. The jury, chaired by
Vincent Descours (CFO of Louis Delahaize Group), saw this acquisition
as a future business school case study. In fact, this deal, which was
welcomed by the stock market, combines geographic and business
complementarity: Groupe SEB thus becomes the leader in cookware
in Germany and a global leader in professional coffee machines.
GROUPE SEB - HALF-YEAR FINANCIAL REPORT AS AT 30 JUNE8
2 Management report
Groupe SEB recognised for the excellence of its investor relations
Chosen from amongst over 1,500 companies, Groupe SEB was
celebrated at the Europe’s Most Honoured Companies Awards,
rewarding excellence in its investor relations, from the General
Management, the Financial department as well as the Investor
Relations department. This award, granted by a jury of financial
analysts and portfolio managers, was given to Vincent Léonard, who
represented Groupe SEB at a ceremony in the London stock market
on 26 June.
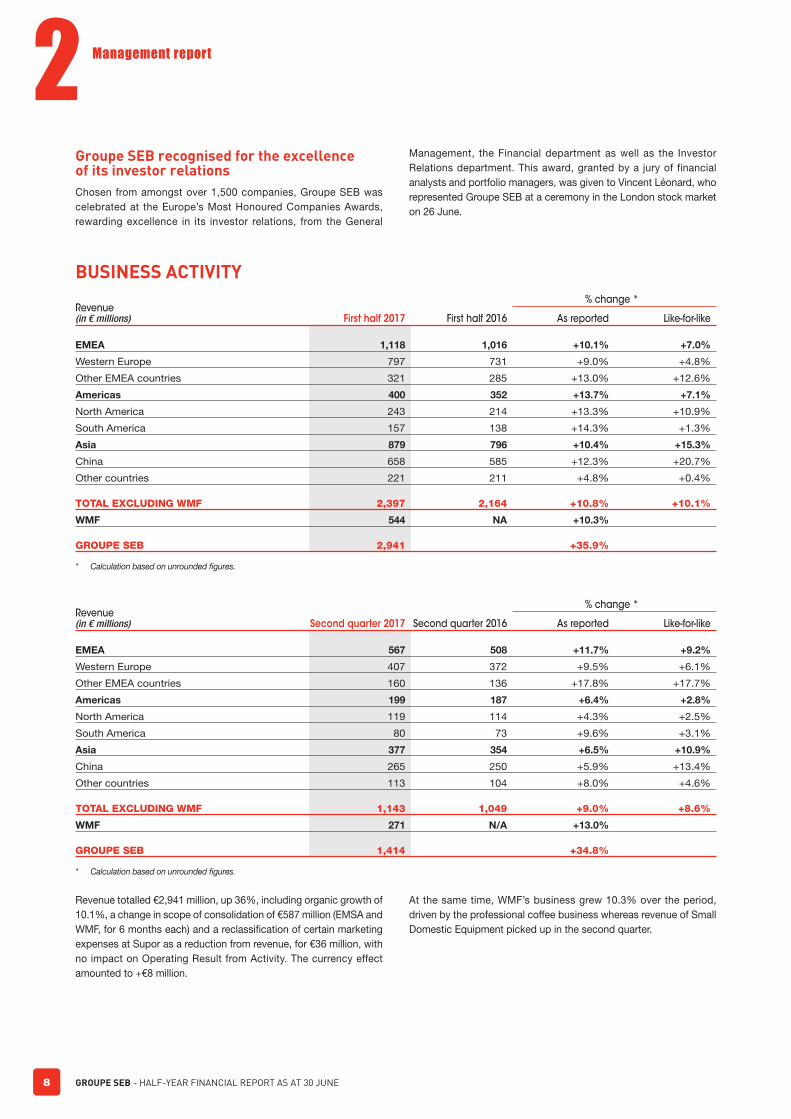
BUSINESS ACTIVITY
Revenue(in € millions) First half 2017 First half 2016
% change *
As reported Like-for-like
EMEA 1,118 1,016 +10.1% +7.0%
Western Europe 797 731 +9.0% +4.8%
Other EMEA countries 321 285 +13.0% +12.6%
Americas 400 352 +13.7% +7.1%
North America 243 214 +13.3% +10.9%
South America 157 138 +14.3% +1.3%
Asia 879 796 +10.4% +15.3%
China 658 585 +12.3% +20.7%
Other countries 221 211 +4.8% +0.4%
TOTAL EXCLUDING WMF 2,397 2,164 +10.8% +10.1%
WMF 544 NA +10.3%
GROUPE SEB 2,941 +35.9%
* Calculation based on unrounded figures.
Revenue(in € millions) Second quarter 2017 Second quarter 2016
% change *
As reported Like-for-like
EMEA 567 508 +11.7% +9.2%
Western Europe 407 372 +9.5% +6.1%
Other EMEA countries 160 136 +17.8% +17.7%
Americas 199 187 +6.4% +2.8%
North America 119 114 +4.3% +2.5%
South America 80 73 +9.6% +3.1%
Asia 377 354 +6.5% +10.9%
China 265 250 +5.9% +13.4%
Other countries 113 104 +8.0% +4.6%
TOTAL EXCLUDING WMF 1,143 1,049 +9.0% +8.6%
WMF 271 N/A +13.0%
GROUPE SEB 1,414 +34.8%
* Calculation based on unrounded figures.
Revenue totalled €2,941 million, up 36%, including organic growth of
10.1%, a change in scope of consolidation of €587 million (EMSA and
WMF, for 6 months each) and a reclassifi cation of certain marketing
expenses at Supor as a reduction from revenue, for €36 million, with
no impact on Operating Result from Activity. The currency effect
amounted to +€8 million.
At the same time, WMF’s business grew 10.3% over the period,
driven by the professional coffee business whereas revenue of Small
Domestic Equipment picked up in the second quarter.
GROUPE SEB - HALF-YEAR FINANCIAL REPORT AS AT 30 JUNE 9
Management report
2
PRODUCT PERFORMANCE
Cookware
In the fi rst half, the Group achieved a sustained sales growth, nurtured
by the core business, the effect of loyalty programmes being neutral
overall despite important differences in some countries. The fl agship
products were frying pans and saucepans with fi xed handles as well
as kitchen utensils and accessories, which, beyond vigorous organic
growth in many countries, benefi ted from the contribution of the newly
consolidated EMSA and WMF. Revenue was more or less stable in
Ingenio cookware (removable handles) due to the non-renewal of
certain promotions carried out in 2016, as well as in pressure cookers.
Geographically, the revenue momentum is built on a wide range of
markets, aside from a number of countries in decline. It is particularly
the case in France, where the marked decline stems from an
unfavourable basis of comparison in 2016, due to major loyalty
programmes , as well as from a more complex market situation. In
the US, against a background of sluggish demand, the core T-fal
brand was penalized by serious diffi culties at several retail chains
and a more intense competitive environment. Looking past the
complicated climate in Brazil, our revenue continues to suffer from a
lack of competitiveness compared with highly aggressive competitors.
The industrial and logistics reorganisation underway should enable the
Group to return to growth and win back market share.
Conversely, in almost all other countries, the Group performed well,
particularly in China, where Supor is growing fast, primarily driven
by frying pans, sets, kitchen utensils and accessories (thermo mugs
in particular), woks, pressure cookers, etc. Also of note are the solid
performances in Germany, Central Europe, Russia, Turkey, South
Korea, Mexico and Colombia, driven by the product dynamic (Titanium
coating, expansion of Ingenio), special commercial deals with certain
clients – including loyalty programmes – and intensifi ed marketing
activation in the outlets and online.
Kitchen Electrics
In fi rst half 2017, kitchen electrics constituted another cornerstone of
the Group’s growth. In electrical cooking, the double-digit increase
in revenue on a like-for-like basis was due to a combination of
factors: rice cookers (mainly in China) and electric pressure cookers /
multicookers; grills and barbecues, with a new strong surge in Optigrill,
which continues to expand internationally; breakfast and informal meal
appliances (toasters, waffl e makers, sandwich makers, ovens, etc.),
spurred on by the expansion of the Krups brand to the United States
and a specifi c contract with a South Korean client for ovens. On the
other hand, the market for deep fryers is more complicated.
In food preparation, revenue is also up due to the spike in blenders, in
a number of major markets including China (rapid increase in demand
for high-speed blenders, as an alternative to soy milk makers) and
Mexico. Moreover, heating blenders continue to see sharply higher
volumes. In kitchen machines , the situation is more mixed, with the
market experiencing a downturn in Europe (due to the rise in cooking
food processors, with Cuisine Companion / Prep & Cook being a
fl agship product) contrasting with a strong performance by Planetaria
in Brazil. On the other hand, there continues to be a fall-off in revenue
from shredders (Fresh Express) and soy milk makers in China.
In beverage preparation, the solid growth is due to all coffee
segments: fi lter coffee makers, sales of which particularly benefi ted
from the Krups relaunch in the US; full-automatic espresso machines,
which are consolidating their progress, particularly in Germany, Central
Europe and France, leading to a strengthening of our positions; pod-
coffee machines, underpinned by a strong recovery for Dolce Gusto
in Europe following a mixed 2016, and a surge in sales of Nespresso
coffee makers, thanks to the establishment of a new partnership in
Switzerland and Austria. Revenue from kettles was, however, down,
despite strong momentum in Japan, as a result of a normalisation of
sales in China following an exceptional 2016. Lastly, sales of beer-
tapping systems (Beertender, The SUB), which had benefi ted from a
packed sports calendar last year, remained in an uptrend at end-June.
Linen and home care
Following a lacklustre 2016, Group revenue in linen care saw
resounding growth in the fi rst half. In ironing, although steam irons
declined, primarily due to non-renewal of a 2016 TV- shopping
promotion in the US, steam generators enjoyed a signifi cant recovery
following the launch of new models, backed by a major marketing
campaign. The best performers were, however, garment steamers with
sales that almost doubled thanks, above all, to the rapid ramp-up in
China, accelerated growth in Japan and tangible progress in the US.
It should, moreover, be mentioned that the Group enjoyed very strong
momentum in Brazil in semi-automatic washing machines.
Home care was, by far, the Group’s leading category this half-year,
with organic sales growth of over 40%. In fact, all vacuum cleaner
families contributed to this powerful dynamic, which resulted in a
strengthening of our positions in many markets. The Group’s lead in
connection with the introduction of the Eco-design directive continues
to put it ahead of the competition. The performance is particularly
noteworthy for bagless models, which have grown globally . The roll-
out of Clean & Steam in Europe, along with the retail launch of the Air
Force 360 multi-function upright vacuum cleaner - currently mainly in
France and Italy - are very promising.
In home comfort, fan sales rose slightly, on the back of very
favourable weather conditions in Brazil and Europe, partly offset by
lower sales in Colombia, where weather conditions were penalising . In
air treatment, the trend remains very positive, driven by strong growth
in air purifi ers in China.
Personal care
In personal care, fi rst half revenue growth was due to hair removal,
with strong performances in Turkey and a loyalty programme in France,
well-being and male beauty care appliances, with new models of
electric hair clippers, offering enhanced functionality, being added.
Sales of hair-care appliances were, on the other hand, down despite
further improvements in hair dryers, hair straighteners and curlers,
primarily in Russia and Turkey.
GROUPE SEB - HALF-YEAR FINANCIAL REPORT AS AT 30 JUNE10
2 Management report
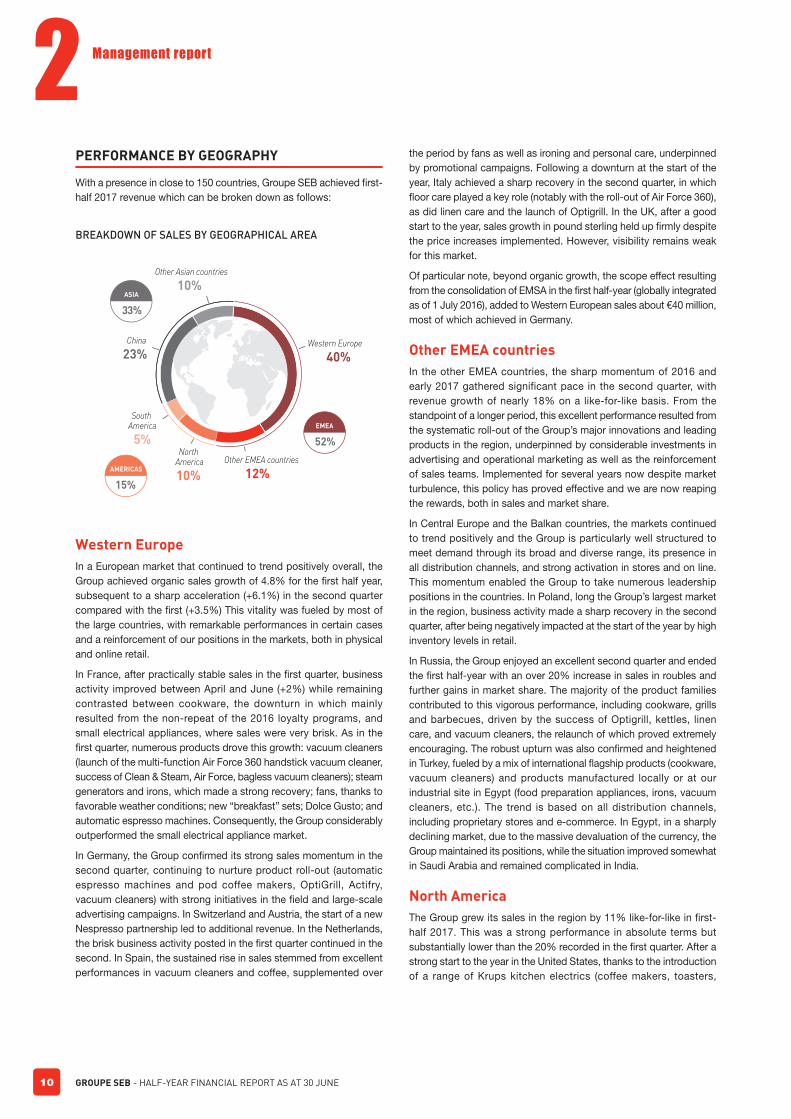
PERFORMANCE BY GEOGRAPHY
With a presence in close to 150 countries, Groupe SEB achieved fi rst-
half 2017 revenue which can be broken down as follows:
BREAKDOWN OF SALES BY GEOGRAPHICAL AREA
Other EMEA countries
12%
South America
5%North
America
10%
China
23%
Other Asian countries
10%
Western Europe
40%
EMEA
52%
AMERICAS
15%
ASIA
33 %
Western Europe
In a European market that continued to trend positively overall, the
Group achieved organic sales growth of 4.8% for the fi rst half year,
subsequent to a sharp acceleration (+6.1%) in the second quarter
compared with the fi rst (+3.5%) This vitality was fueled by most of
the large countries, with remarkable performances in certain cases
and a reinforcement of our positions in the markets, both in physical
and online retail.
In France, after practically stable sales in the fi rst quarter, business
activity improved between April and June (+2%) while remaining
contrasted between cookware, the downturn in which mainly
resulted from the non-repeat of the 2016 loyalty programs, and
small electrical appliances, where sales were very brisk. As in the
fi rst quarter, numerous products drove this growth: vacuum cleaners
(launch of the multi-function Air Force 360 handstick vacuum cleaner,
success of Clean & Steam, Air Force, bagless vacuum cleaners); steam
generators and irons, which made a strong recovery; fans, thanks to
favorable weather conditions; new “breakfast” sets; Dolce Gusto; and
automatic espresso machines. Consequently, the Group considerably
outperformed the small electrical appliance market.
In Germany, the Group confi rmed its strong sales momentum in the
second quarter, continuing to nurture product roll-out (automatic
espresso machines and pod coffee makers, OptiGrill, Actifry,
vacuum cleaners) with strong initiatives in the fi eld and large-scale
advertising campaigns. In Switzerland and Austria, the start of a new
Nespresso partnership led to additional revenue. In the Netherlands,
the brisk business activity posted in the fi rst quarter continued in the
second. In Spain, the sustained rise in sales stemmed from excellent
performances in vacuum cleaners and coffee, supplemented over
the period by fans as well as ironing and personal care, underpinned
by promotional campaigns. Following a downturn at the start of the
year, Italy achieved a sharp recovery in the second quarter, in which
fl oor care played a key role (notably with the roll-out of Air Force 360),
as did linen care and the launch of Optigrill. In the UK, after a good
start to the year, sales growth in pound sterling held up fi rmly despite
the price increases implemented. However, visibility remains weak
for this market.
Of particular note, beyond organic growth, the scope effect resulting
from the consolidation of EMSA in the fi rst half-year (globally integrated
as of 1 July 2016), added to Western European sales about €40 million,
most of which achieved in Germany.
Other EMEA countries
In the other EMEA countries, the sharp momentum of 2016 and
early 2017 gathered significant pace in the second quarter, with
revenue growth of nearly 18% on a like-for-like basis. From the
standpoint of a longer period, this excellent performance resulted from
the systematic roll-out of the Group’s major innovations and leading
products in the region, underpinned by considerable investments in
advertising and operational marketing as well as the reinforcement
of sales teams. Implemented for several years now despite market
turbulence, this policy has proved effective and we are now reaping
the rewards, both in sales and market share.
In Central Europe and the Balkan countries, the markets continued
to trend positively and the Group is particularly well structured to
meet demand through its broad and diverse range, its presence in
all distribution channels, and strong activation in stores and on line.
This momentum enabled the Group to take numerous leadership
positions in the countries. In Poland, long the Group’s largest market
in the region, business activity made a sharp recovery in the second
quarter, after being negatively impacted at the start of the year by high
inventory levels in retail.
In Russia, the Group enjoyed an excellent second quarter and ended
the fi rst half-year with an over 20% increase in sales in roubles and
further gains in market share. The majority of the product families
contributed to this vigorous performance, including cookware, grills
and barbecues, driven by the success of Optigrill, kettles, linen
care, and vacuum cleaners, the relaunch of which proved extremely
encouraging. The robust upturn was also confi rmed and heightened
in Turkey, fueled by a mix of international fl agship products (cookware,
vacuum cleaners) and products manufactured locally or at our
industrial site in Egypt (food preparation appliances, irons, vacuum
cleaners, etc.). The trend is based on all distribution channels,
including proprietary stores and e-commerce. In Egypt, in a sharply
declining market, due to the massive devaluation of the currency, the
Group maintained its positions, while the situation improved somewhat
in Saudi Arabia and remained complicated in India.
North America
The Group grew its sales in the region by 11% like-for-like in fi rst-
half 2017. This was a strong performance in absolute terms but
substantially lower than the 20% recorded in the fi rst quarter. After a
strong start to the year in the United States, thanks to the introduction
of a range of Krups kitchen electrics (coffee makers, toasters,

GROUPE SEB - HALF-YEAR FINANCIAL REPORT AS AT 30 JUNE 11
Management report
2
sandwich makers) in over 2,000 mass-retail stores and e-commerce,
the second quarter saw the initiation of the ramp-up in resale, which
proved slower than expected. In cookware, activity was contrasted:
diffi cult in the core business for T-fal, it trended positively for Imusa
and was solid in the premium segment for All-Clad, which by the
way continues its development in small electrical appliances. As
regards ironing, Rowenta suffered somewhat in irons but made further
progress in garment steamers. Generally speaking, the US market is
signifi cantly affected by the fi nancial diffi culties of several physical
retail and telesales banners, whose business has been adversely
impacted by the rise of e-commerce. This development has led in
particular to destocking, limited orders or store closings.
In Canada, the first-half recovery in sales was mainly driven by
cookware and linen care, together with great performances by Actifry
and OptiGrill, especially in the fi rst few months of the year. In Mexico,
organic sales growth of over 30% at end-June refl ects a signifi cant
acceleration in the last three months, underpinned by core-business
mainstays – cookware, ironing and, more recently, blenders – as well
as by a new loyalty program with Soriana.
South America
First-half sales grew by over 14%, boosted by the sharp appreciation
of the real and by the strengthening of the Colombian peso compared
with fi rst-half 2016. On a like-for-like basis, fi rst-half growth came out
at a little over 1%, following 3% growth in the second quarter.
In Brazil, in what continues to be a complex overall environment, with
lackluster consumption and a highly competitive and promotion-driven
market, the Group reported a slight revenue increase despite the
negative effect on volumes of price hikes implemented since the start
of the year. Business activity remained diffi cult in cookware but trended
more favorably in small electrical appliances. However, performances
were contrasted from one product family to the next, with a double-
digit increase in fan sales, which benefi ted from favorable weather and
new products; buoyant sales of semi-automatic washing machines
(refl ected in increased market share) and food processors, thanks
to strong in-store activation; and a major pick-up for Dolce Gusto.
In contrast, ironing sales were down. Moreover, the transfer of small
electrical appliance production to the newly constructed Itatiaia site
was completed 2 months ahead of schedule and the transfer of
cookware production has started.
In Colombia, the like-for-like revenue decrease can be attributed to
fans, sales of which were negatively impacted by weather conditions
– a result that strong growth in cookware and blenders failed to offset.
Lastly, business momentum remained strong in Argentina.
China
The Group posted an excellent fi rst half in China, achieving organic
growth of over 20%, still largely driven by online sales. In a competitive
and promotion-driven market that nevertheless remains highly
promising, Supor’s momentum continued to be fueled by its pillars,
namely cookware (frying pans, saucepans, woks, sets, kitchen utensils
and thermos mugs) and small electrical appliances such as rice
cookers, electric pressure cookers, kettles and high-speed blenders.
In addition, the Group confi rms its inroads in non kitchen electrical
appliances, especially in air purifi ers and garment steamers. Business
activity is also boosted by innovation, which nurtures Supor’s entire
product offering, enhances differentiation from the competition, and
has been helping to strengthen our positions in the market since
the start of the year. In-store execution and intensifi ed development
of online content and advertising campaigns, in close coordination
with retailers, also remain key success factors, which we roll out
continuously to stimulate sales.
It should be recalled that, to better reflect the nature of certain
expenditure and ensure complete accounting consistency amid
Group entities, a change in the accounting presentation has been
implemented, whereby €36 million in marketing spend was reclassifi ed
and directly deducted from fi rst-half sales, with no impact on Operating
Result from Activity.
Other Asian countries
Group sales were up slightly at end-June on a like-for-like basis,
refl ecting a sharp recovery in business activity in the second quarter,
despite the persistence of contrasted market situations. The main
drivers of this growth were Japan and South Korea, while elsewhere
activity varied greatly from one country to the next.
In Japan, sales growth accelerated in the second quarter, driven
by the same products as in the fi rst few months of the year, with
strong momentum in cookware (fi xed and removable handles), brisk
growth in kitchen utensils (notably thermo mugs and vacuum fl asks),
continued headway in garment steamers, and confi rmed success
for kettles, materialized by strengthened positions in the market.
The Group’s proprietary stores, totaling 28 at end-June following
several new openings, made a substantial contribution to business
growth. In South Korea, the Group stepped up growth in the second
quarter thanks to cookware, food preparation (particularly blenders)
and haircare appliances, as well as a special promotional campaign
on ovens with a retailer. The Group also posted a good half-year in
Australia, mainly due to cookware and the launch of the Cook4Me
(Cookeo) multicooker.
In the other countries in South-East Asia, after a diffi cult start to the
year, the situation improved slightly, but suffered in Hong Kong and
Singapore from high comparatives in 2016 (non-recurring loyalty
programs and special campaigns). While business momentum
remains positive in Malaysia and is trending slightly better in Thailand,
it nevertheless remains disappointing in Vietnam.
GROUPE SEB - HALF-YEAR FINANCIAL REPORT AS AT 30 JUNE12
2 Management report
OPERATING RESULT FROM ACTIVITY
Operating Result from Activity (ORfA) in first-half 2017 came to
€213 million. The total notably includes:
■ Group ORfA, excluding WMF, of €200 million, up 16.4% on end-
June 2016 and 27% on a like-for-like basis;
■ WMF ORfA of €30 million, for an estimated increase of 50% on
fi rst-half 2016;
■ a -€17 million non-recurring impact from the WMF purchase price
allocation (revaluation of inventories and order book ). The net
contribution of WMF to Group ORfA thus came out at €13 million.
Excluding these fi rst consolidation entries, ORfA totaled €230 million
in fi rst-half 2017. The currency effect was -€16 million, compared with
-€61 million in the fi rst six months of 2016.
Organic growth in ORfA can be broken down as follows:
■ a positive volume effect of €70 million resulting from organic sales
growth;
■ a positive mix-price effect of €23 million, much lower than in
previous years, reflecting a less inflationary price environment
overall;
■ practically stable purchasing costs, despite the rise in commodities
prices, and favorable industrial absorption and productivity gains,
for €9 million;
■ a €40 million increase in investments in growth drivers: in innovation
as well as in advertising and marketing, with strong activation in
several major markets (including China, United States, Germany,
France, South Korea and Turkey);
■ a €15 million increase in commercial and administrative costs.
As a reminder, given the seasonal nature of the Group’s business,
fi rst-half ORf A is not representative of the fi nancial year as a whole
and cannot be extrapolated.
WMF
WMF sales in fi rst-half 2017 came out at €544 million, up 10.3%
on first-half 2016. The total was divided almost evenly between
Professional Business (professional coffee and hotel equipment) and
Small Domestic Equipment.
In the professional segment, sales growth of 20% was fueled by strong
momentum in automatic coffee machines (+27%), attributable to:
■ robust development in the core business in Germany, Central
Europe and Asia-Pacifi c with existing customers but also with new
“accounts”;
■ the highly positive effect of the contracts signed in 2016 with
Canadian and Japanese customers. With the majority of the
machines having been delivered in the first half-year, this
contribution will in all likelihood have a lower positive effect from
the third quarter on.
Sales were down in hotel equipment, notably due to internal
reorganis ations and the harmonis ation of IT systems.
The Consumer business (Small Domestic Equipment) made a
signifi cant pick-up in the second quarter, leading to a stable situation
at 30 June. The downturn in Germany, focused on cookware and
stemming from the impact of the supply chain reorganis ation carried
out in 2016, was almost entirely offset by the progress made elsewhere:
solid growth in Asia-Pacifi c, boosted by a cookware loyalty program in
Taiwan and strong headway in China and South Korea; development of
online sales; and a strong increase in small electrical appliance sales,
the leading product being the Kult X Mix&Go blender. In addition, the
traffi c in WMF stores in Germany was satisfactory over the period.
GROUPE SEB - HALF-YEAR FINANCIAL REPORT AS AT 30 JUNE 13
Management report
2
2017 OUTLOOK
OPERATING PROFIT AND NET PROFIT
At €178 million, compared with €134 million at 30 June 2016,
Operating profi t, in addition to the contribution of WMF and EMSA,
includes various items, the variation in which merits some attention.
The anticipated cost of discretionary and non-discretionary profi t
sharing came to €11 million, compared with €14 million in first-
half 2016. Other operating income and expense, at -€24 million, is in
line with the fi gure in fi rst-half 2016. The total includes restructuring
costs in Brazil (the closing of the Mooca site and the transfer of
production to the new Itatiaia site), spendings incurred by the creation
in Lyon of the Innovation Hub for the Small electrical appliance
business, and provisions for expenses involved in the integration of
WMF and the regrouping of Groupe SEB entities and WMF in several
countries.
Net financial expense came out at -€44 million, compared with
-€26 million at 30 June 2016. The change refl ects the refi nancing, at
highly attractive conditions, of the acquisition of WMF as well as the
€12 increase in the fair value of the optional part of the convertible
bond issued last November.
Lastly, after taxes at a rate of 23.5% (24% in fi rst-half 2016) and
the elimination of non-controlling interests in the results, for a total
€19 million, net profi t totaled €83.3 million in the fi rst half-year, for an
increase of nearly 34 %.
FINANCIAL STRUCTURE AT 30 JUNE 2017
At 30 June 2017, equity stood at €1,739 million, down €97 million on
31 December 2016, primarily due to negative currency adjustments
on the yuan, the US dollar and the Brazilian real.
Tangible fi xed assets increased by €110 million on end-2016 owing to
the valuation of the brands and the reassessment of other intangible
assets, ultimately leading to a revaluation of goodwill of €180 million.
At 30 June 2017, net financial debt amounted to €2,065 million,
compared with €2,019 million at end-December 2016. This change
takes account of a cash fl ow generation of €91 million, related to the
increase in cash fl ow and a further improvement in the working capital
requirement, which stood at 17.9% of sales compared with 19% at
the end of fi rst-half 2016. It also includes non-operating items such
as dividends paid (€101 million), the acquisition of Swizzz Prozzz, and
cash outfl ows linked to the restructurings under way.
At 30 June 2017, the gearing ratio stood at 119% and the estimated
year-on-year adjusted debt-to-EBITDA ratio at 2.7.
The strong performance in the fi rst half of the year provides a robust
platform for the coming months, but the Group must nevertheless
remain cautious regarding macro-economic uncertainties and potential
market turbulence.
In this context, and given the very high quality second half-year in 2016,
the Group aims for 2017 at an organic sales growth exceeding 7%
and, on the basis of current exchange rates, an increase in published
revenue by more than 30%. Under these circumstances, the Operating
Result from Activity, excluding one-off impacts of WMF purchase price
allocation, should grow by at least 30%. The Group also confi rms that
the consolidation of WMF is expected to have an accretive impact of
more than 20% before the impact of the purchase price allocation on
net earnings per share from 2017 onwards.

GROUPE SEB - HALF-YEAR FINANCIAL REPORT AS AT 30 JUNE14
3 Financial statements
3. Financial statementsCondensed consolidated financial statements for the first six months ended 30 June 2017
CONSOLIDATED INCOME STATEMENT
CONSOLIDATED STATEMENT OF COMPREHENSIVE INCOME
(in € millions)30/06/2017
6 months30/06/2016
6 months31/12/2016
12 months
Profi t for the period 102.3 82.5 290.8
Echange differences on translating foreign operations (99.9) (45.9) (32.3)
Gains (losses) on cash fl ow hedges (19.8) (16.1) (16.8)
Remeasure ment of employee benefi t obligations, net of tax(a) (b) 11.8 (12.4) (17.4)
Other comprehensive income (expense) (107.9) (74.4) (66.5)
COMPREHENSIVE INCOME (5.6) 8.1 224.3
Non-controlling interests (11.3) (13.6) (22.0)
COMPREHENSIVE INCOME ATTRIBUTABLE TO OWNERS OF THE PARENT (16.9) (5.5) 202.3
(a) Items that will not be reclassifi ed to profi t or loss.
(b) ncluding impact of deferred taxes in the amount of €5.8 million at 30/06/2017.
(in € millions)30/06/2017
6 months30/06/2016
6 months31/12/201612 months
Revenue (Note 3) 2,941,2 2,163.8 4,999.7
Operating expenses (Note 4) (2,727.8) (1,991.9) (4,494.5)
OPERATING RESULT FROM ACTIVITY 213.4 171.9 505.2
Statutory and discretionary employee profi t-sharing (Note 5) (10.7) (13.9) (36.7)
RECURRING OPERATING PROFIT 202.7 158.0 468.5
Other operating income and expense (Note 6) (24.4) (24.3) (42.2)
OPERATING PROFIT 178.3 133.7 426.3
Finance costs (Note 7) (17.2) (17.1) (29.8)
Other fi nancial income and expense (Note 7) (27.4) (8.1) (28.2)
Share of profi ts of associates
PROFIT BEFORE TAX 133.7 108.5 368.3
Income taxes (Note 8) (31.4) (26.0) (77.7)
PROFIT FOR THE PERIOD 102.3 82.5 290.8
Non-controlling interests (19.0) (20.2) (32.2)
PROFIT ATTRIBUTABLE TO OWNERS OF THE PARENT 83.3 62.3 258.6
PROFIT ATTRIBUTABLE TO OWNERS OF THE PARENT PER SHARE (IN UNITS)
Basic earnings per share 1.68 1.27 5.20
Diluted earnings per share 1.66 1.25 5.15
The accompanying Notes 1 to 16 are an integral part of these Consolidated Financial Statement.

GROUPE SEB - HALF-YEAR FINANCIAL REPORT AS AT 30 JUNE 15
Financial statements
3
CONSOLIDATED BALANCE SHEET
Assets(in € millions) 30/06/2017 30/06/2016 31/12/2016
Goodwill 1,436.8 528.3 1,847.0
Other intangible assets 1,242.3 486.9 720.0
Property, plant and equipment 805.2 642.6 807.7
Investments in associates 11.1
Other investments 27.0 43.6 18.0
Other non-current fi nancial assets 15.5 46.3 13.3
Deferred tax assets 50.4 67.9 71.1
Other non-current assets 14.6 14.3 13.3
Long-term derivative instruments 5.5 3.9 0.5
NON-CURRENT ASSETS 3,597.3 1,833.8 3,502.0
Inventories 1,129.4 838.1 1,076.3
Trade receivables 759.5 688.1 1,060.1
Other receivables 104.1 85.2 100.6
Current tax assets 53.1 42.0 59.6
Short-term derivative instruments 32.0 31.1 50.6
Other fi nancial investments (Note 12) 259.7 137.6 204.6
Cash and cash equivalents (Note 12) 657.1 322.3 414.5
CURRENT ASSETS 2,994.9 2,144.4 2,966.3
TOTAL ASSETS 6,592.2 3,978.2 6,468.3
Equity and liabilities(in € millions) 30/06/2017 30/06/2016 31/12/2016
Share capital 50.2 50.2 50.2
Reserves and retained earnings 1,581.8 1,508.0 1,677.6
Treasury stock (Note 9) (56.2) (75.7) (56.8)
Equity attributable to owners of the parent 1,575.8 1,482.5 1,671.0
Non-controlling interests 162.9 143.6 165.2
EQUITY 1,738.7 1,626.1 1,836.2
Deferred tax assets 205.6 44.2 111.4
Long-term provisions (Note 11) 386.6 212.0 378.7
Long-term borrowings (Note 12) 2,071.1 744.5 1,553.6
Other non-current liabilities 47.9 43.6 45.7
Long-term derivative instruments 24.2 4.9 10.5
NON-CURRENT LIABILITIES 2,735.4 1,049.2 2,099.9
Short-term provisions (Note 11) 97.6 60.6 102.5
Trade payables 748.2 602.9 911.7
Other current liabilities 304.1 225.0 380.0
Current tax liabilities 45.2 51.0 42.3
Current derivative instruments 30.7 29.2 23.0
Short-term borrowings (Note 12) 892.3 334.2 1,072.7
CURRENT LIABILITIES 2,118.1 1,302.9 2,532.2
TOTAL EQUITY AND LIABILITIES 6,592.2 3,978.2 6,468.3
The accompanying Notes 1 to 16 are an integral part of these Consolidated Financial Statement.

GROUPE SEB - HALF-YEAR FINANCIAL REPORT AS AT 30 JUNE16
3 Financial statements
CONSOLIDATED CASH FLOW STATEMENT
(in € millions)30/06/2017
6 months30/06/2016
6 months31/12/2016
12 months
PROFIT ATTRIBUTABLE TO OWNERS OF THE PARENT 83.3 62.3 258.6
Depreciation, amortisation and impairment losses 84.7 59.9 122.9
Change in provisions 12.7 5.0 2.9
Unrealised gains and losses on fi nancial instruments 8.4 (6.9) 6.9
Income and expenses related to stock option payment plans 9.1 6.7 13.1
Gains and losses on disposals of assets 1.5 1.1
Other 0.1
Non-controlling interests 19.0 20.2 32.2
Current and deferred taxes 34.7 31.8 78.5
Finance costs 17.1 16.9 36.1
CASH FLOW * 270.6 195.9 552.3
Change in inventories and work in progress (97.8) (11.4) (0.5)
Change in trade receivables 282.5 205.9 39.1
Change in trade payables (141.9) (88.1) 87.0
Change in other receivables and payables (83.9) (42.8) 23.0
Income taxes paid (56.6) (36.1) (88.7)
Net interest paid (14.4) (16.9) (36.1)
NET CASH FROM OPERATING ACTIVITIES 158.5 206.5 575.9
Proceeds from disposals of assets 11.8 2.7 6.6
Purchases of property, plant and equipment (73.1) (93.4) (162.4)
Purchases of software and other intangible assets (16.6) (13.7) (19.0)
Purchases of fi nancial assets (80.4) 92.3 20.5
Acquisitions of subsidiaries, net of cash acquired 1.4 (57.9) (1,695.2)
Effect of other changes in scope of consolidation
NET CASH USED BY INVESTING ACTIVITIES (156.9) (70.0) (1,849.5)
Change in long-term borrowings 519.6 32.2 846.6
Change in short-term borrowings (178.0) (293.0) 395.4
Issue of share capital
Transactions between owners (1.1) (196.1) (196.1)
Change in treasury stock (1.2) (7.3) (2.7)
Dividends paid, including to non-controlling interests (101.0) (92.1) (92.0)
NET CASH USED BY FINANCING ACTIVITIES 238.3 (556.3) 951.2
Effect of changes in foreign exchange rates 2.7 (28.7) (33.9)
NET INCREASE (DECREASE) IN CASH AND CASH EQUIVALENTS 242.6 (448.5) (356.4)
Cash and cash equivalents at beginning of period 414.5 770.8 770.8
Cash and cash equivalents at end of period 657.1 322.3 414.5
* Before net fi nance costs and income taxes paid.
GROUPE SEB - HALF-YEAR FINANCIAL REPORT AS AT 30 JUNE 17
Financial statements
3
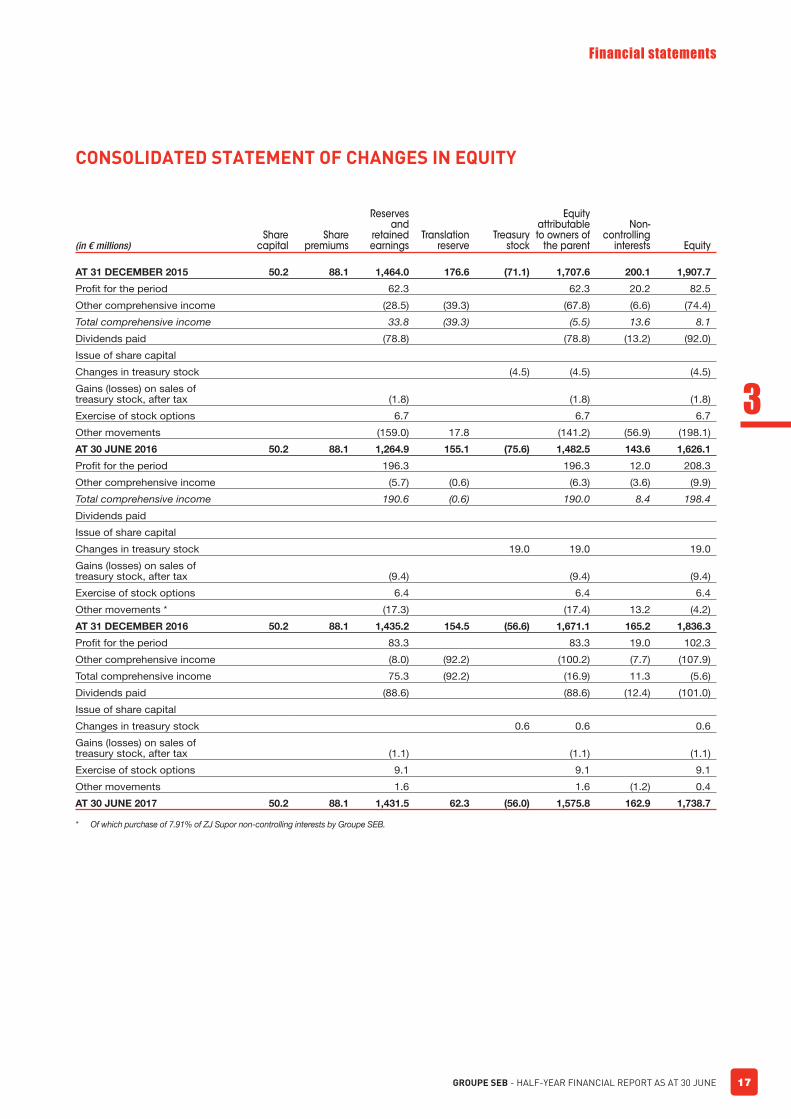
CONSOLIDATED STATEMENT OF CHANGES IN EQUITY
(in € millions)Share
capitalShare
premiums
Reserves and
retained earnings
Translation reserve
Treasury stock
Equity attributable to owners of
the parent
Non-controlling
interests Equity
AT 31 DECEMBER 2015 50.2 88.1 1,464.0 176.6 (71.1) 1,707.6 200.1 1,907.7
Profi t for the period 62.3 62.3 20.2 82.5
Other comprehensive income (28.5) (39.3) (67.8) (6.6) (74.4)
Total comprehensive income 33.8 (39.3) (5.5) 13.6 8.1
Dividends paid (78.8) (78.8) (13.2) (92.0)
Issue of share capital
Changes in treasury stock (4.5) (4.5) (4.5)
Gains (losses) on sales of treasury stock, after tax (1.8) (1.8) (1.8)
Exercise of stock options 6.7 6.7 6.7
Other movements (159.0) 17.8 (141.2) (56.9) (198.1)
AT 30 JUNE 2016 50.2 88.1 1,264.9 155.1 (75.6) 1,482.5 143.6 1,626.1
Profi t for the period 196.3 196.3 12.0 208.3
Other comprehensive income (5.7) (0.6) (6.3) (3.6) (9.9)
Total comprehensive income 190.6 (0.6) 190.0 8.4 198.4
Dividends paid
Issue of share capital
Changes in treasury stock 19.0 19.0 19.0
Gains (losses) on sales of treasury stock, after tax (9.4) (9.4) (9.4)
Exercise of stock options 6.4 6.4 6.4
Other movements * (17.3) (17.4) 13.2 (4.2)
AT 31 DECEMBER 2016 50.2 88.1 1,435.2 154.5 (56.6) 1,671.1 165.2 1,836.3
Profi t for the period 83.3 83.3 19.0 102.3
Other comprehensive income (8.0) (92.2) (100.2) (7.7) (107.9)
Total comprehensive income 75.3 (92.2) (16.9) 11.3 (5.6)
Dividends paid (88.6) (88.6) (12.4) (101.0)
Issue of share capital
Changes in treasury stock 0.6 0.6 0.6
Gains (losses) on sales of treasury stock, after tax (1.1) (1.1) (1.1)
Exercise of stock options 9.1 9.1 9.1
Other movements 1.6 1.6 (1.2) 0.4
AT 30 JUNE 2017 50.2 88.1 1,431.5 62.3 (56.0) 1,575.8 162.9 1,738.7
* Of which purchase of 7.91% of ZJ Supor non-controlling interests by Groupe SEB.
GROUPE SEB - HALF-YEAR FINANCIAL REPORT AS AT 30 JUNE18
3 Financial statements
NOTES TO THE CONDENSED CONSOLIDATED FINANCIAL STATEMENTS
RESULTS FOR THE SIX MONTHS ENDED 30 JUNE 2017, IN € MILLIONS
Groupe SEB, composed of SEB S.A. and its subsidiaries, is the world
reference in the design, manufacture and marketing of cookware and
small domestic appliances: non-stick frying pans and saucepans,
pressure cookers, irons and steam generators, coffee machines,
kettles and food processors in particular.
SEB S.A. has its registered office at Chemin du Moulin Carron,
Campus Seb, Écully (69130), France. The company is listed on Eurolist
Euronext Paris (ISIN code: FR0000121709 SK).
The condensed consolidated fi nancial statements for the fi rst half
of 2017 were approved by the Board of Directors on 24 July 2017.
Note 1 Summary of significant accounting policies
The condensed interim consolidated fi nancial statements for the six
months ended 30 June 2017 have been prepared in accordance with
IAS 34 – Interim Financial Reporting.
The condensed fi nancial statements do not include all the disclosures
required in a full set of annual fi nancial statements under IFRS, and should
therefore be read in conjunction with the Group’s consolidated fi nancial
statements for the year ended 31 December 2016, which are included
in the Registration Document that was fi led with the French Financial
Markets Authority (AMF) on 20 April 2017. The Registration Document
can be downloaded from the Group’s website (www.groupeseb.com) and
the AMF website (www.amf-france.org), and is available on request from
the Group’s registered offi ce at the address shown above.
The condensed interim consolidated fi nancial statements have been
prepared in accordance with the IFRSs, IASs and related interpretations
adopted by the European Union and applicable at 30 June 2017,
which can be found on the European Commission’s website
(http://ec.europa.eu/internal_market/accounting/ias/index_fr.htm).
The accounting policies applied to prepare these fi nancial statements
are unchanged compared with those used to prepare the 2016 annual
consolidated fi nancial statements, except for income tax expense
and non-discretionary and discretionary employee profi t-sharing,
which are calculated on the basis of full-year projections (see Note
8 – Income taxes, and Note 5 – Statutory and discretionary employee
profi t-sharing). In addition, the comparability of the interim and annual
fi nancial statements may be affected by the seasonal nature of the
Group’s activities, which results in higher sales in the second half of
the year.
The Group decided against early adoption of the standards and
interpretations for which application was optional at 30 June 2017.
IFRS 15 “Revenue from Contracts with Customers” and IFRS 9
“Financial Instruments” were published in May and July 2014
respectively and have an application date of 1 January 2018. However,
it does not expect the application of these new texts to have a material
impact on the fi nancial statements.
Note 2 Changes in the scope of consolidation
WMF
On 20 May 2016, Groupe SEB signed an agreement with KKR to
acquire the German group WMF, the global leader in professional
coffee machines and the leader in cookware in Germany. This deal
was subject to clearance by the relevant competition authorities,
in particular at European level. This clearance was obtained
on 22 November 2016 and the acquisition of WMF finalized on
30 November 2016. Given that the date of acquisition was very
close to the year-end, the Group decided to use the balance sheet
as at 31 December 2016 as the opening balance sheet due to the
operational diffi culties in preparing reliable fi nancial statements within
a short period of time and the fact that one month of income statement
is not material at Group level.
Founded in 1853, the WMF group has three major business lines:
professional coffee machines, Small Domestic Equipment (cookware
and small electrical appliances) and catering equipment. Over the
years, it has built up strong positions:
■ in the professional coffee segment, in which it is the global leader
with 28% market share, way ahead of the no. 2;
■ in cookware, WMF is the uncontested leader in Germany with 20%
market share.
Through this structuring acquisition, Groupe SEB:
■ acquires a strong global leadership position in the highly attractive
professional coffee machines market, which is fast growing, highly
profi table and a signifi cant source of recurring income from the
service activities;
■ considerably strengthens its position in the cookware segment
by becoming the no. 1 in Germany with in particular a high-end
stainless steel product offering;
■ speeds up its development in the strategic cookware articles and
accessories segment, following on from the acquisition of EMSA,
generating revenue of in excess of €350 million;
■ expands its trademark portfolio with the addition of new established
trademark including the iconic WMF, but also Schaerer, Silit, Kaiser
and Hepp;
GROUPE SEB - HALF-YEAR FINANCIAL REPORT AS AT 30 JUNE 19
Financial statements
3
■ gains access to a network of 200 direct outlets in Germany, a strong
source of brand awareness and sales.
In addition, this acquisition will generate signifi cant synergies. In terms of
revenue, this will enable the international roll-out of the WMF trademark
and products through the Groupe SEB network as well as add Group
products to the WMF trademark. Furthermore, the integration of WMF
provides an opportunity to ramp up productivity. Full-year synergies are
estimated at around €40 million by 2020.
WMF has eight production plants worldwide: four in Germany, one in
Switzerland, one in the Czech Republic, one in China and one in India.
It uses multi-channel distribution, including an extensive network of its
own stores. It has 6,000 employees in 16 countries, including around
4,600 in Germany.
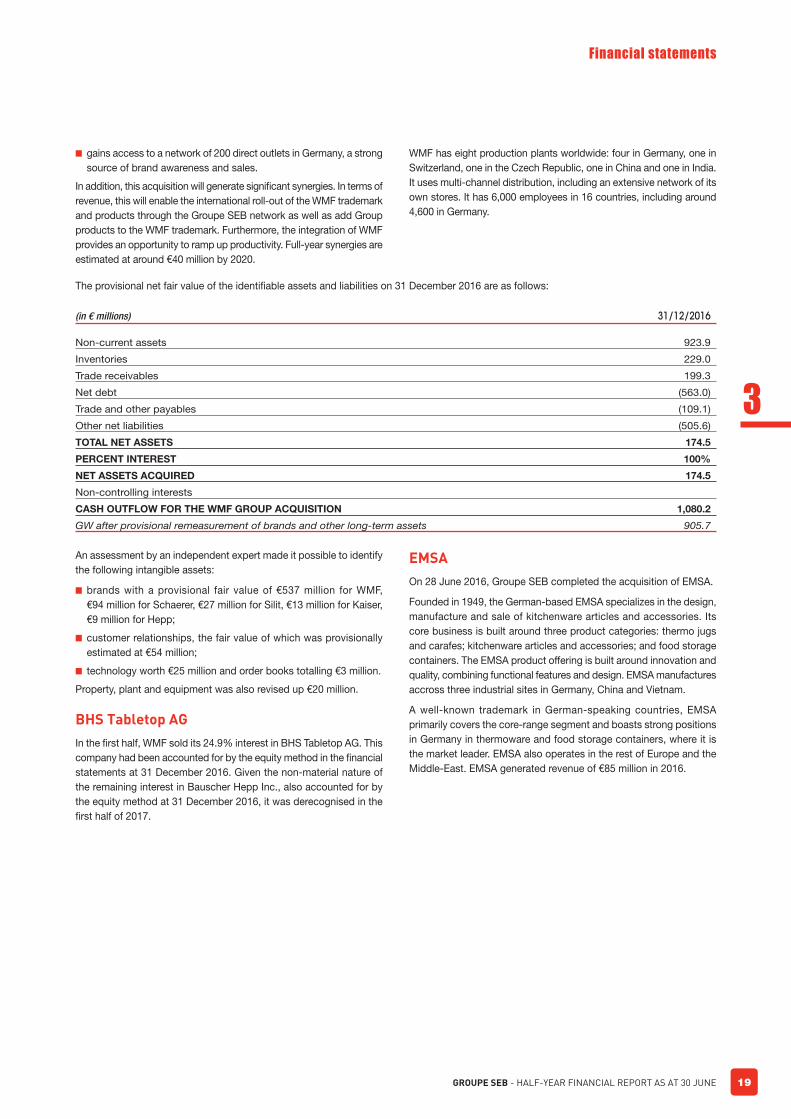
The provisional net fair value of the identifi able assets and liabilities on 31 December 2016 are as follows:
(in € millions) 31/12/2016
Non-current assets 923.9
Inventories 229.0
Trade receivables 199.3
Net debt (563.0)
Trade and other payables (109.1)
Other net liabilities (505.6)
TOTAL NET ASSETS 174.5
PERCENT INTEREST 100%
NET ASSETS ACQUIRED 174.5
Non-controlling interests
CASH OUTFLOW FOR THE WMF GROUP ACQUISITION 1,080.2
GW after provisional remeasurement of brands and other long-term assets 905.7
An assessment by an independent expert made it possible to identify
the following intangible assets:
■ brands with a provisional fair value of €537 million for WMF,
€94 million for Schaerer, €27 million for Silit, €13 million for Kaiser,
€9 million for Hepp;
■ customer relationships, the fair value of which was provisionally
estimated at €54 million;
■ technology worth €25 million and order books totalling €3 million.
Property, plant and equipment was also revised up €20 million.
BHS Tabletop AG
In the fi rst half, WMF sold its 24.9% interest in BHS Tabletop AG. This
company had been accounted for by the equity method in the fi nancial
statements at 31 December 2016. Given the non-material nature of
the remaining interest in Bauscher Hepp Inc., also accounted for by
the equity method at 31 December 2016, it was derecognised in the
fi rst half of 2017.
EMSA
On 28 June 2016, Groupe SEB completed the acquisition of EMSA.
Founded in 1949, the German-based EMSA specializes in the design,
manufacture and sale of kitchenware articles and accessories. Its
core business is built around three product categories: thermo jugs
and carafes; kitchenware articles and accessories; and food storage
containers. The EMSA product offering is built around innovation and
quality, combining functional features and design. EMSA manufactures
accross three industrial sites in Germany, China and Vietnam.
A well-known trademark in German-speaking countries, EMSA
primarily covers the core-range segment and boasts strong positions
in Germany in thermoware and food storage containers, where it is
the market leader. EMSA also operates in the rest of Europe and the
Middle-East. EMSA generated revenue of €85 million in 2016.
GROUPE SEB - HALF-YEAR FINANCIAL REPORT AS AT 30 JUNE20
3 Financial statements
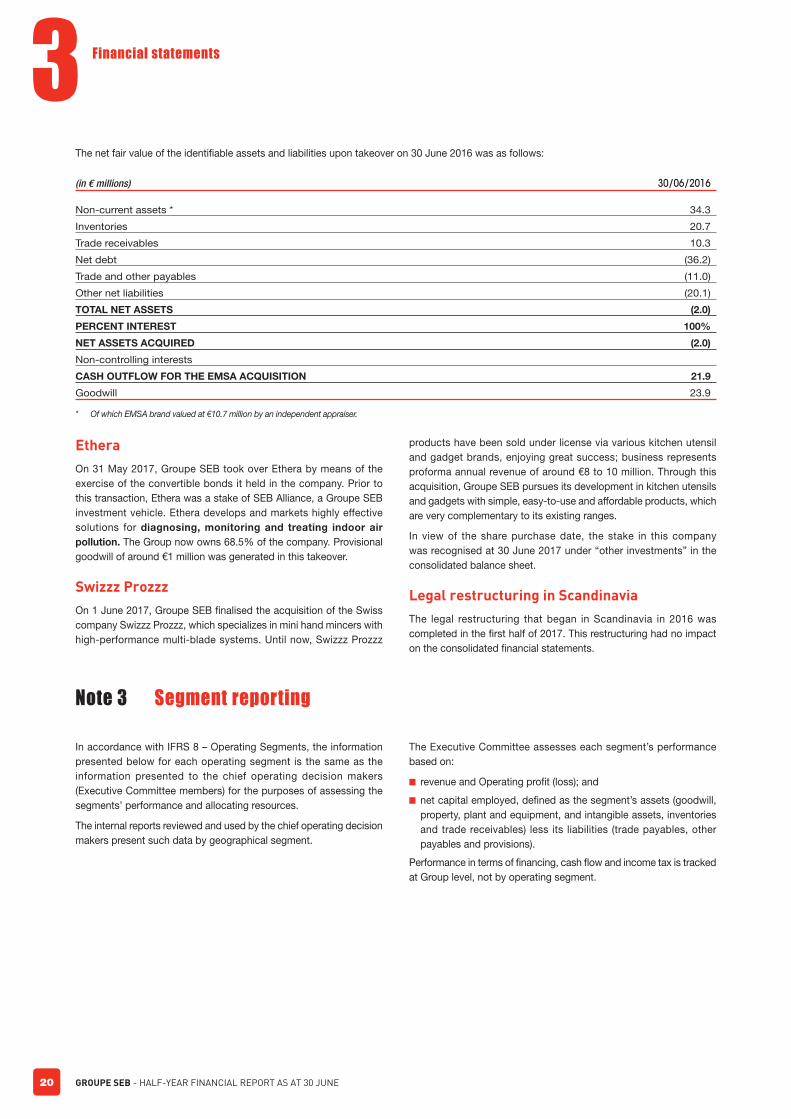
The net fair value of the identifi able assets and liabilities upon takeover on 30 June 2016 was as follows:
(in € millions) 30/06/2016
Non-current assets * 34.3
Inventories 20.7
Trade receivables 10.3
Net debt (36.2)
Trade and other payables (11.0)
Other net liabilities (20.1)
TOTAL NET ASSETS (2.0)
PERCENT INTEREST 100%
NET ASSETS ACQUIRED (2.0)
Non-controlling interests
CASH OUTFLOW FOR THE EMSA ACQUISITION 21.9
Goodwill 23.9
* Of which EMSA brand valued at €10.7 million by an independent appraiser.
Ethera
On 31 May 2017, Groupe SEB took over Ethera by means of the
exercise of the convertible bonds it held in the company. Prior to
this transaction, Ethera was a stake of SEB Alliance, a Groupe SEB
investment vehicle. Ethera develops and markets highly effective
solutions for diagnosing, monitoring and treating indoor air pollution. The Group now owns 68.5% of the company. Provisional
goodwill of around €1 million was generated in this takeover.
Swizzz Prozzz
On 1 June 2017, Groupe SEB fi nalised the acquisition of the Swiss
company Swizzz Prozzz, which specializes in mini hand mincers with
high-performance multi-blade systems. Until now, Swizzz Prozzz
products have been sold under license via various kitchen utensil
and gadget brands, enjoying great success; business represents
proforma annual revenue of around €8 to 10 million. Through this
acquisition, Groupe SEB pursues its development in kitchen utensils
and gadgets with simple, easy-to-use and affordable products, which
are very complementary to its existing ranges.
In view of the share purchase date, the stake in this company
was recognised at 30 June 2017 under “other investments” in the
consolidated balance sheet.
Legal restructuring in Scandinavia
The legal restructuring that began in Scandinavia in 2016 was
completed in the fi rst half of 2017. This restructuring had no impact
on the consolidated fi nancial statements.
Note 3 Segment reporting
In accordance with IFRS 8 – Operating Segments, the information
presented below for each operating segment is the same as the
information presented to the chief operating decision makers
(Executive Committee members) for the purposes of assessing the
segments’ performance and allocating resources.
The internal reports reviewed and used by the chief operating decision
makers present such data by geographical segment.
The Executive Committee assesses each segment’s performance
based on:
■ revenue and Operating profi t (loss); and
■ net capital employed, defi ned as the segment’s assets (goodwill,
property, plant and equipment, and intangible assets, inventories
and trade receivables) less its liabilities (trade payables, other
payables and provisions).
Performance in terms of fi nancing, cash fl ow and income tax is tracked
at Group level, not by operating segment.
GROUPE SEB - HALF-YEAR FINANCIAL REPORT AS AT 30 JUNE 21
Financial statements
3
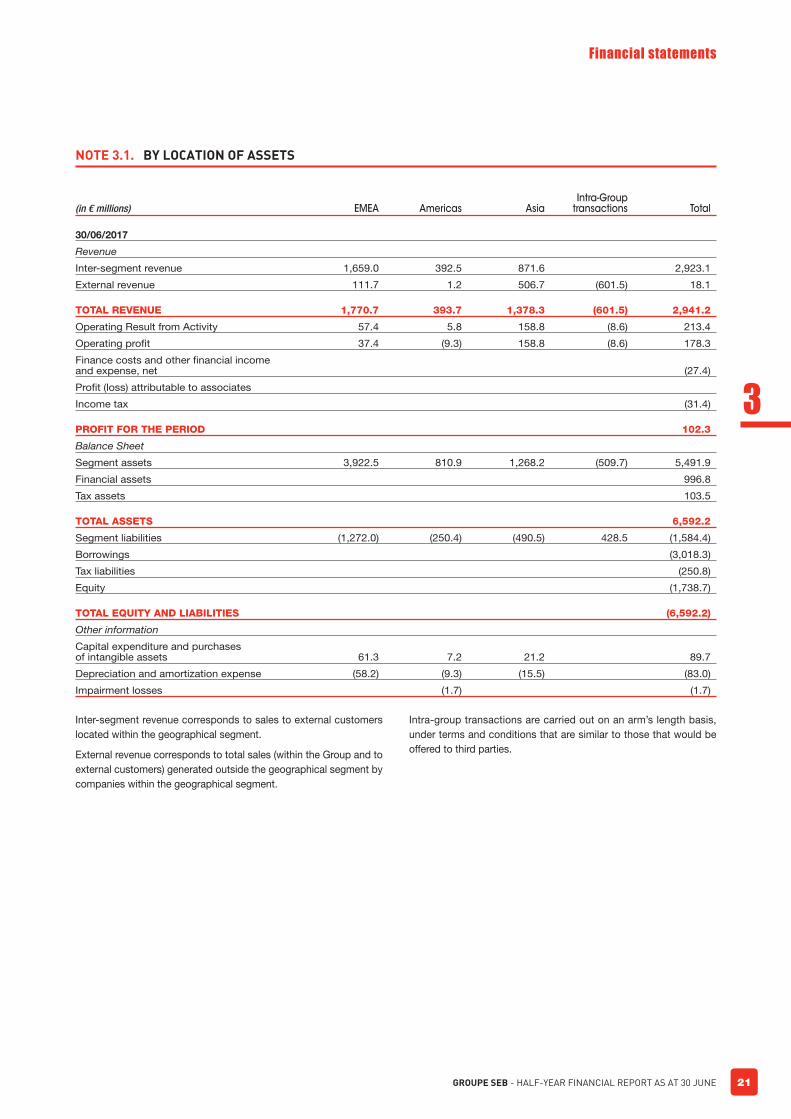
NOTE 3.1. BY LOCATION OF ASSETS
(in € millions) EMEA Americas AsiaIntra-Group
transactions Total
30/06/2017
Revenue
Inter-segment revenue 1,659.0 392.5 871.6 2,923.1
External revenue 111.7 1.2 506.7 (601.5) 18.1
TOTAL REVENUE 1,770.7 393.7 1,378.3 (601.5) 2,941.2
Operating Result from Activity 57.4 5.8 158.8 (8.6) 213.4
Operating profi t 37.4 (9.3) 158.8 (8.6) 178.3
Finance costs and other fi nancial income and expense, net (27.4)
Profi t (loss) attributable to associates
Income tax (31.4)
PROFIT FOR THE PERIOD 102.3
Balance Sheet
Segment assets 3,922.5 810.9 1,268.2 (509.7) 5,491.9
Financial assets 996.8
Tax assets 103.5
TOTAL ASSETS 6,592.2
Segment liabilities (1,272.0) (250.4) (490.5) 428.5 (1,584.4)
Borrowings (3,018.3)
Tax liabilities (250.8)
Equity (1,738.7)
TOTAL EQUITY AND LIABILITIES (6,592.2)
Other information
Capital expenditure and purchases of intangible assets 61.3 7.2 21.2 89.7
Depreciation and amortization expense (58.2) (9.3) (15.5) (83.0)
Impairment losses (1.7) (1.7)
Inter-segment revenue corresponds to sales to external customers
located within the geographical segment.
External revenue corresponds to total sales (within the Group and to
external customers) generated outside the geographical segment by
companies within the geographical segment.
Intra-group transactions are carried out on an arm’s length basis,
under terms and conditions that are similar to those that would be
offered to third parties.
GROUPE SEB - HALF-YEAR FINANCIAL REPORT AS AT 30 JUNE22
3 Financial statements
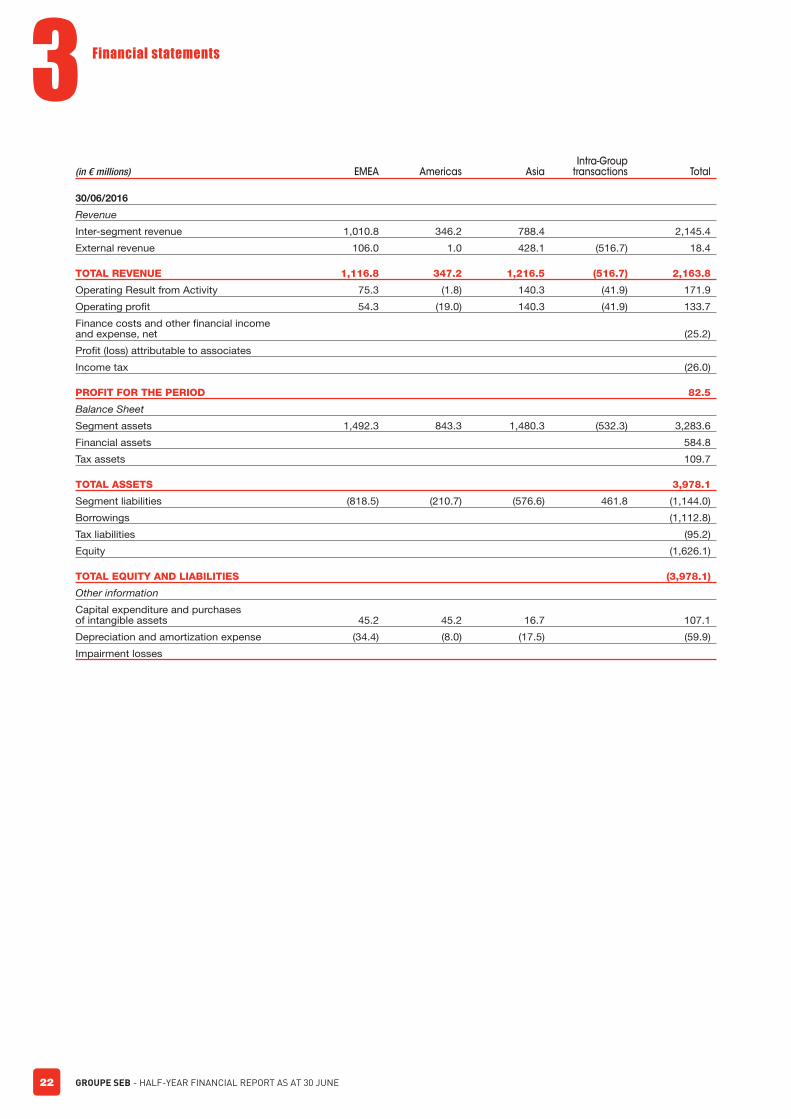
(in € millions) EMEA Americas AsiaIntra-Group
transactions Total
30/06/2016
Revenue
Inter-segment revenue 1,010.8 346.2 788.4 2,145.4
External revenue 106.0 1.0 428.1 (516.7) 18.4
TOTAL REVENUE 1,116.8 347.2 1,216.5 (516.7) 2,163.8
Operating Result from Activity 75.3 (1.8) 140.3 (41.9) 171.9
Operating profi t 54.3 (19.0) 140.3 (41.9) 133.7
Finance costs and other fi nancial income and expense, net (25.2)
Profi t (loss) attributable to associates
Income tax (26.0)
PROFIT FOR THE PERIOD 82.5
Balance Sheet
Segment assets 1,492.3 843.3 1,480.3 (532.3) 3,283.6
Financial assets 584.8
Tax assets 109.7
TOTAL ASSETS 3,978.1
Segment liabilities (818.5) (210.7) (576.6) 461.8 (1,144.0)
Borrowings (1,112.8)
Tax liabilities (95.2)
Equity (1,626.1)
TOTAL EQUITY AND LIABILITIES (3,978.1)
Other information
Capital expenditure and purchases of intangible assets 45.2 45.2 16.7 107.1
Depreciation and amortization expense (34.4) (8.0) (17.5) (59.9)
Impairment losses
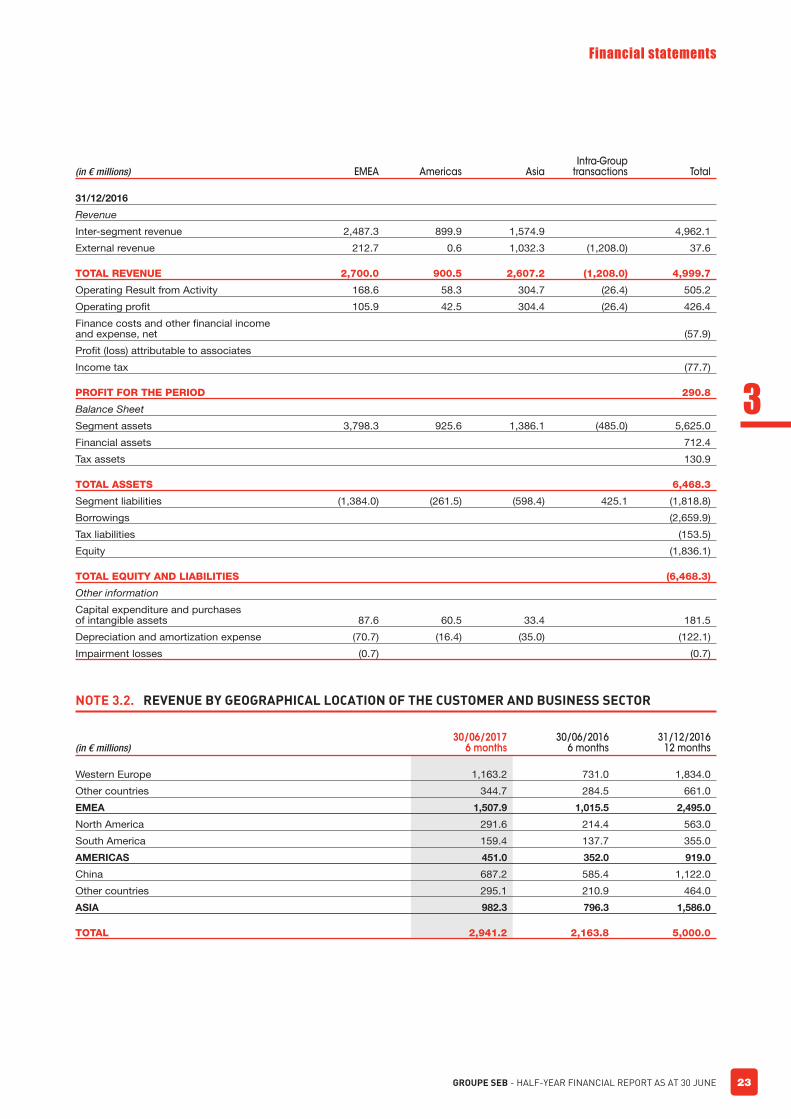
GROUPE SEB - HALF-YEAR FINANCIAL REPORT AS AT 30 JUNE 23
Financial statements
3
(in € millions) EMEA Americas AsiaIntra-Group
transactions Total
31/12/2016
Revenue
Inter-segment revenue 2,487.3 899.9 1,574.9 4,962.1
External revenue 212.7 0.6 1,032.3 (1,208.0) 37.6
TOTAL REVENUE 2,700.0 900.5 2,607.2 (1,208.0) 4,999.7
Operating Result from Activity 168.6 58.3 304.7 (26.4) 505.2
Operating profi t 105.9 42.5 304.4 (26.4) 426.4
Finance costs and other fi nancial income and expense, net (57.9)
Profi t (loss) attributable to associates
Income tax (77.7)
PROFIT FOR THE PERIOD 290.8
Balance Sheet
Segment assets 3,798.3 925.6 1,386.1 (485.0) 5,625.0
Financial assets 712.4
Tax assets 130.9
TOTAL ASSETS 6,468.3
Segment liabilities (1,384.0) (261.5) (598.4) 425.1 (1,818.8)
Borrowings (2,659.9)
Tax liabilities (153.5)
Equity (1,836.1)
TOTAL EQUITY AND LIABILITIES (6,468.3)
Other information
Capital expenditure and purchases of intangible assets 87.6 60.5 33.4 181.5
Depreciation and amortization expense (70.7) (16.4) (35.0) (122.1)
Impairment losses (0.7) (0.7)
NOTE 3.2. REVENUE BY GEOGRAPHICAL LOCATION OF THE CUSTOMER AND BUSINESS SECTOR
(in € millions)30/06/2017
6 months30/06/2016
6 months31/12/2016
12 months
Western Europe 1,163.2 731.0 1,834.0
Other countries 344.7 284.5 661.0
EMEA 1,507.9 1,015.5 2,495.0
North America 291.6 214.4 563.0
South America 159.4 137.7 355.0
AMERICAS 451.0 352.0 919.0
China 687.2 585.4 1,122.0
Other countries 295.1 210.9 464.0
ASIA 982.3 796.3 1,586.0
TOTAL 2,941.2 2,163.8 5,000.0
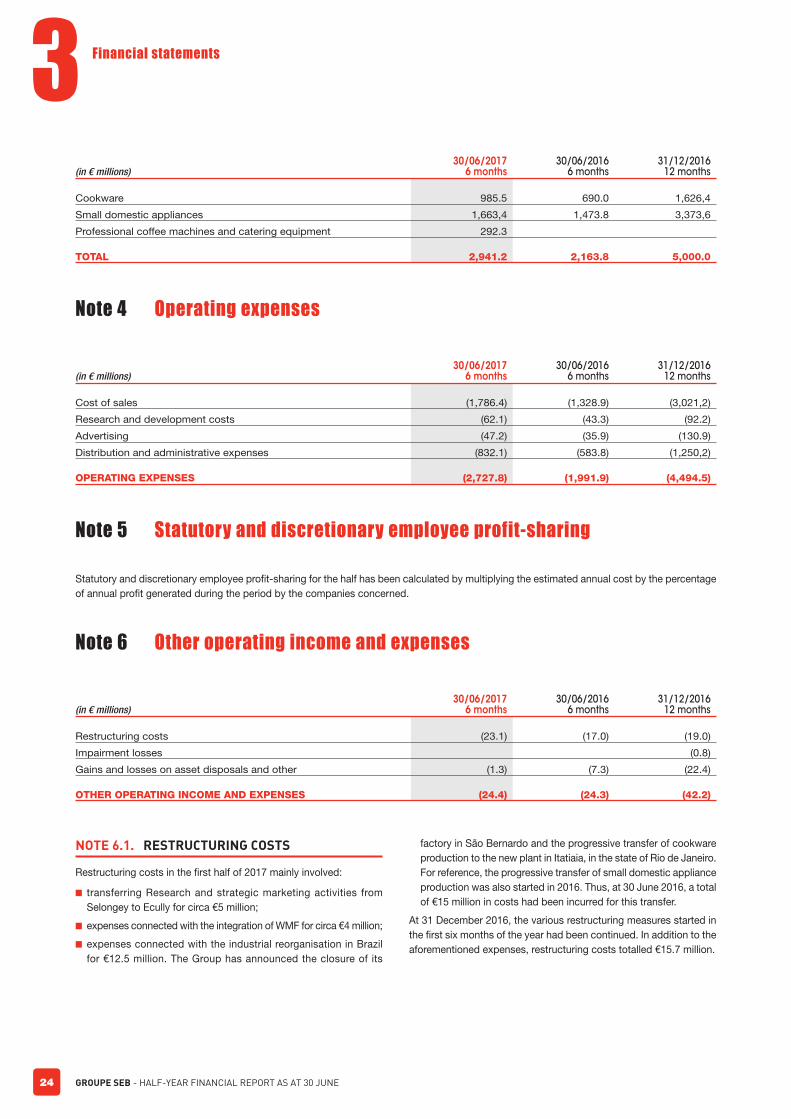
GROUPE SEB - HALF-YEAR FINANCIAL REPORT AS AT 30 JUNE24
3 Financial statements
(in € millions)30/06/2017
6 months30/06/2016
6 months31/12/2016
12 months
Cookware 985.5 690.0 1,626,4
Small domestic appliances 1,663,4 1,473.8 3,373,6
Professional coffee machines and catering equipment 292.3
TOTAL 2,941.2 2,163.8 5,000.0
Note 4 Operating expenses
(in € millions)30/06/2017
6 months30/06/2016
6 months31/12/2016
12 months
Cost of sales (1,786.4) (1,328.9) (3,021,2)
Research and development costs (62.1) (43.3) (92.2)
Advertising (47.2) (35.9) (130.9)
Distribution and administrative expenses (832.1) (583.8) (1,250,2)
OPERATING EXPENSES (2,727.8) (1,991.9) (4,494.5)
Note 5 Statutory and discretionary employee profit-sharing
Statutory and discretionary employee profi t-sharing for the half has been calculated by multiplying the estimated annual cost by the percentage
of annual profi t generated during the period by the companies concerned.
Note 6 Other operating income and expenses
(in € millions)30/06/2017
6 months30/06/2016
6 months31/12/2016
12 months
Restructuring costs (23.1) (17.0) (19.0)
Impairment losses (0.8)
Gains and losses on asset disposals and other (1.3) (7.3) (22.4)
OTHER OPERATING INCOME AND EXPENSES (24.4) (24.3) (42.2)
NOTE 6.1. RESTRUCTURING COSTS
Restructuring costs in the fi rst half of 2017 mainly involved:
■ transferring Research and strategic marketing activities from
Selongey to Ecully for circa €5 million;
■ expenses connected with the integration of WMF for circa €4 million;
■ expenses connected with the industrial reorganisation in Brazil
for €12.5 million. The Group has announced the closure of its
factory in São Bernardo and the progressive transfer of cookware
production to the new plant in Itatiaia, in the state of Rio de Janeiro.
For reference, the progressive transfer of small domestic appliance
production was also started in 2016. Thus, at 30 June 2016, a total
of €15 million in costs had been incurred for this transfer.
At 31 December 2016, the various restructuring measures started in
the fi rst six months of the year had been continued. In addition to the
aforementioned expenses, restructuring costs totalled €15.7 million.

GROUPE SEB - HALF-YEAR FINANCIAL REPORT AS AT 30 JUNE 25
Financial statements
3
NOTE 6.2. IMPAIRMENT LOSSES
Due to the seasonal nature of the business, impairment tests are
conducted at the fi nancial year-end. The carrying amounts of brands
and goodwill were reviewed at 30 June 2017 to detect any signs of
impairment.
No indications of impairment of these assets were identifi ed.
NOTE 6.3. GAINS AND LOSSES ON ASSET
DISPOSALS AND OTHER
At 30 June 2017, this item was mainly comprised of acquisition costs
during the period.
At 30 June 2016, the Group had mainly recognised acquisition costs
of around €3 million relating to external growth transactions for the
period. These costs, incurred in connection with the acquisition of
WMF and EMSA, had amounted to circa €15 million at 31 December
2016. Furthermore, at 31 December 2016, a €6 million expense had
been recognized for the customs dispute in Turkey detailed in Note
14 Claims and litigation.
Note 7 Finance costs and other financial income and expense
(in € millions)30/06/2017
6 months30/06/2016
6 months31/12/2016
12 months
FINANCE COSTS (17.2) (17.1) (29.8)
Interest cost on long-term employee benefi t obligations (1.6) (1.5) (3.9)
Exchange gains and losses and fi nancial instruments (8.5) (2.6) (8.9)
Other (17.3) (4.0) (15.4)
OTHER FINANCIAL INCOME AND EXPENSES (27.4) (8.1) (28.2)
The interest costs on long-term employee benefi ts represents the
difference between the annual discounting of commitments and
the expected return on the corresponding fi nancial assets held in a
hedging contract for these commitments, as well as the discounting
charges for other long-term liabilities and provisions.
Exchange gains and losses on manufacturing and sales transactions
denominated in foreign currencies are included in Operating Result from
Activity. Gains and losses on borrowings in foreign currencies and related
hedges are reported under “Other fi nancial income and expenses”.
Income and expenses from financial instruments correspond to
amortization of the time value of hedging instruments, and derivative
instruments for which the hedging relationship has not been documented.
In 2017, the line Other mainly relates to the €11.7 million change in the
fair value of the option component of the ORNAE convertible bonds.
Note 8 Income tax expense
Income tax expense for the half was calculated by multiplying
consolidated pre-tax profi t by the estimated average effective tax
rate for the year. The calculation was performed separately for each
consolidated tax entity.
The following table provides a reconciliation between the effective tax
rate of 23.5% and the statutory French tax rate of 34.43%:
(in %)30/06/2017
6 months30/06/2016
6 months31/12/2016
12 months
STATUTORY FRENCH TAX RATE 34.4 34.4 34.4
Effect of difference in tax rates(a) (12.9) (12.5) (14.2)
Unrecognised and relieved tax loss carryforwards(b) 3.3 1.7 3.8
Prior period tax loss carryforwards recognized and utilized during the period (4.0) (4.3) (7.3)
Other(c) 2.7 4.7 4.4
EFFECTIVE TAX RATE 23.5 24.0 21.1
(a) The effect of different tax rates varies depending on France’s contribution to consolidated profi t.
(b) Unrecognised tax loss carryforwards concerned South American and Asian subsidiaries which are individually immaterial.
(c) The “Other” item mainly includes taxes on distributed earnings and dividends and provisions for tax audits.

GROUPE SEB - HALF-YEAR FINANCIAL REPORT AS AT 30 JUNE26
3 Financial statements
Note 9 Treasury shares
At 30 June 2017, the company’s share capital was made up of
50,169,049 shares with a par value of €1 each.
In the fi rst half of 2017, the Group bought back 146,316 shares at a
weighted average price of €133.96 per share and sold 211,293 shares
on the market at an average price of €87.23.
At 30 June 2017, the Group held 557,133 treasury shares, acquired at
an average price of €100.85 per share (990,288 shares at 30 June 2016
and 622,110 shares at 31 December 2016, acquired at an average
price of €76.41 and €91.23, respectively).
Share Capital held in treasury changed as follows:
(in number of shares)First half 2017
6 months
Transactions
First half 20166 months
Full year 201612 months
SHARES HELD IN TREASURY AT 1 JANUARY 622,110 1,074,453 1,074,453
Purchases of shares
Buyback plan 45,286 170,000 218,633
Liquidity contract 101,030 192,304 326,956
Sales
Shares sold on the market (101,853) (189,593) (328,034)
Shares allocated on exercise of stock options and under the performance share and employee share ownership plans (109,440) (256,876) (669,898)
Shares cancelled during the period
SHARES HELD IN TREASURY AT PERIOD-END 557,133 990,288 622,110
Note 10 Employee benefits
At 30 June 2017, the Group updated the discount rate used to
calculate pension liabilities in France and Germany, the two countries
accounting for over 90% of the Group’s total liability.
A rate of 1.5% was used at 30 June 2017 for these two countries,
instead of 1% at 31 December 2016. The higher rate is refl ected
in a reduction in provisions for pension benefi ts of €17.6 million at
30 June 2017.
Note 11 Other provisions
(in € millions)
30/06/2017 30/06/2016 31/12/2016
non-current current non-current current non-current current
Pension and other post-employment benefi t obligations 285.8 18.3 159.7 7.7 305.8 20.2
Product warranties 8.8 35.5 5.3 21.5 7.5 35.9
Claims and litigation and other contingencies 83.8 20.4 35.2 14.2 61.6 27.5
Restructuring provision 8.2 23.4 11.8 17.2 3.8 18.9
TOTAL 386.6 97.6 212.0 60.6 378.7 102.5
Provisions are classifi ed as current or non-current according to whether the obligation is expected to be settled within or beyond one year.
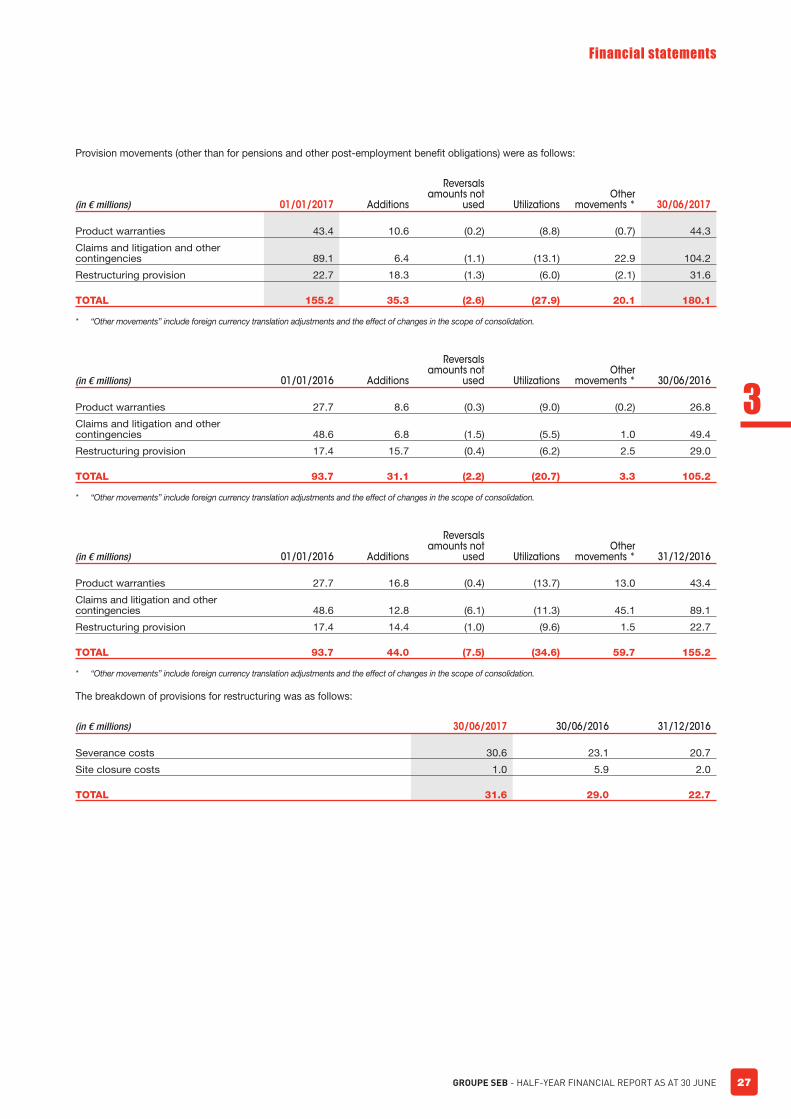
GROUPE SEB - HALF-YEAR FINANCIAL REPORT AS AT 30 JUNE 27
Financial statements
3
Provision movements (other than for pensions and other post-employment benefi t obligations) were as follows:
(in € millions) 01/01/2017 Additions
Reversals amounts not
used UtilizationsOther
movements * 30/06/2017
Product warranties 43.4 10.6 (0.2) (8.8) (0.7) 44.3
Claims and litigation and other contingencies 89.1 6.4 (1.1) (13.1) 22.9 104.2
Restructuring provision 22.7 18.3 (1.3) (6.0) (2.1) 31.6
TOTAL 155.2 35.3 (2.6) (27.9) 20.1 180.1
* “Other movements” include foreign currency translation adjustments and the effect of changes in the scope of consolidation.
(in € millions) 01/01/2016 Additions
Reversals amounts not
used UtilizationsOther
movements * 30/06/2016
Product warranties 27.7 8.6 (0.3) (9.0) (0.2) 26.8
Claims and litigation and other contingencies 48.6 6.8 (1.5) (5.5) 1.0 49.4
Restructuring provision 17.4 15.7 (0.4) (6.2) 2.5 29.0
TOTAL 93.7 31.1 (2.2) (20.7) 3.3 105.2
* “Other movements” include foreign currency translation adjustments and the effect of changes in the scope of consolidation.
(in € millions) 01/01/2016 Additions
Reversals amounts not
used UtilizationsOther
movements * 31/12/2016
Product warranties 27.7 16.8 (0.4) (13.7) 13.0 43.4
Claims and litigation and other contingencies 48.6 12.8 (6.1) (11.3) 45.1 89.1
Restructuring provision 17.4 14.4 (1.0) (9.6) 1.5 22.7
TOTAL 93.7 44.0 (7.5) (34.6) 59.7 155.2
* “Other movements” include foreign currency translation adjustments and the effect of changes in the scope of consolidation.
The breakdown of provisions for restructuring was as follows:
(in € millions) 30/06/2017 30/06/2016 31/12/2016
Severance costs 30.6 23.1 20.7
Site closure costs 1.0 5.9 2.0
TOTAL 31.6 29.0 22.7
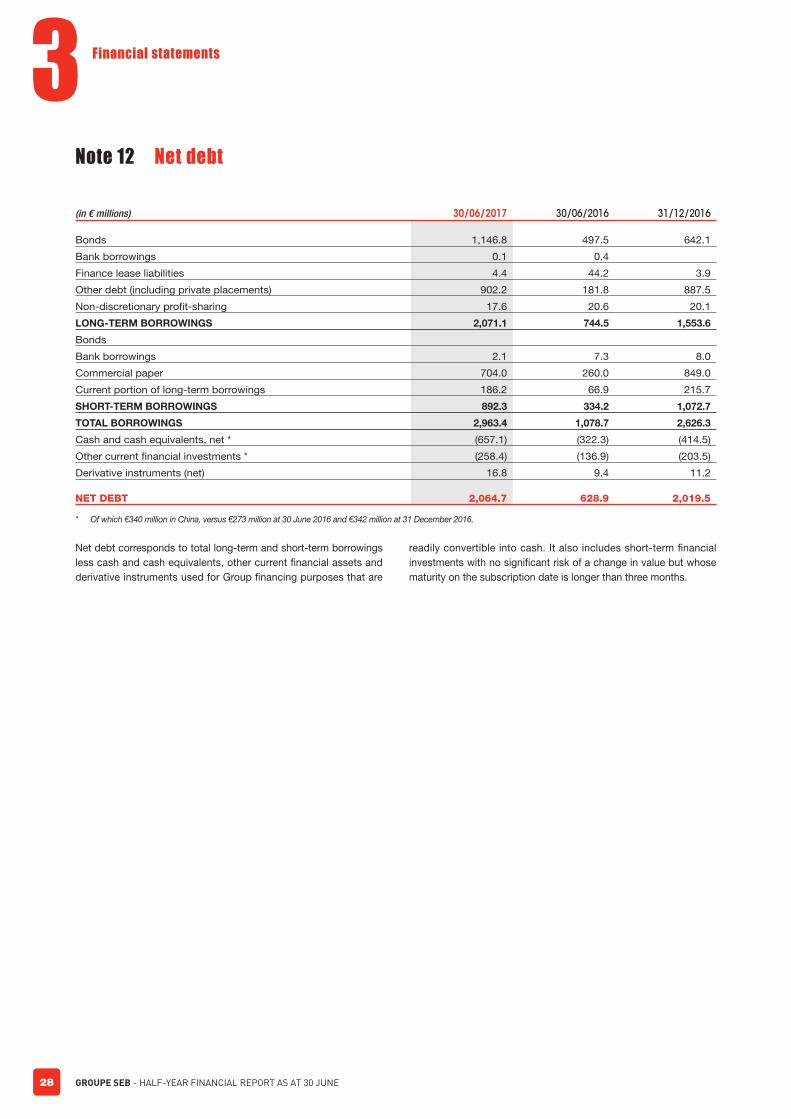
GROUPE SEB - HALF-YEAR FINANCIAL REPORT AS AT 30 JUNE28
3 Financial statements
Note 12 Net debt
(in € millions) 30/06/2017 30/06/2016 31/12/2016
Bonds 1,146.8 497.5 642.1
Bank borrowings 0.1 0.4
Finance lease liabilities 4.4 44.2 3.9
Other debt (including private placements) 902.2 181.8 887.5
Non-discretionary profi t-sharing 17.6 20.6 20.1
LONG-TERM BORROWINGS 2,071.1 744.5 1,553.6
Bonds
Bank borrowings 2.1 7.3 8.0
Commercial paper 704.0 260.0 849.0
Current portion of long-term borrowings 186.2 66.9 215.7
SHORT-TERM BORROWINGS 892.3 334.2 1,072.7
TOTAL BORROWINGS 2,963.4 1,078.7 2,626.3
Cash and cash equivalents, net * (657.1) (322.3) (414.5)
Other current fi nancial investments * (258.4) (136.9) (203.5)
Derivative instruments (net) 16.8 9.4 11.2
NET DEBT 2,064.7 628.9 2,019.5
* Of which €340 million in China, versus €273 million at 30 June 2016 and €342 million at 31 December 2016.
Net debt corresponds to total long-term and short-term borrowings
less cash and cash equivalents, other current fi nancial assets and
derivative instruments used for Group fi nancing purposes that are
readily convertible into cash. It also includes short-term fi nancial
investments with no signifi cant risk of a change in value but whose
maturity on the subscription date is longer than three months.

GROUPE SEB - HALF-YEAR FINANCIAL REPORT AS AT 30 JUNE 29
Financial statements
3
Note 13 Fair value of financial instruments
NOTE 13.1. FINANCIAL INSTRUMENTS
(in € millions)
30/06/2017 Financial instruments by category
Carrying amount Fair value
At fair value through
profi t or loss (excluding
derivatives)
Assets available
for saleLoans and
receivablesHeld to
maturityDerivative
instruments
Assets
Investments in non-consolidated companies 17.4 17.4 17.4
Other non-current fi nancial assets 15.5 15.5 15.5
Other non-current assets * 4.6 4.6 4.6
Trade receivables 759.5 759.5 759.5
Other current receivables, excl. prepaid expenses * 8.6 8.6 8.6
Derivative instruments 37.5 37.5 37.5
Other fi nancial assets 258.4 258.4 258.4
Cash and cash equivalents 657.1 657.1 657.1
TOTAL FINANCIAL ASSETS 1,758.6 1,758.6 915.5 17.4 788.2 37.5
Liabilities
Long-term borrowings 2,071.1 2,129.8 2,129.8
Other non-current liabilities * 2.9 2.9 2.9
Trade payables 748.2 748.2 748.2
Other current liabilities * 50.1 50.1 50.1
Derivative instruments 54.8 54.8 54.8
Short-term borrowings 892.3 892.8 892.8
TOTAL FINANCIAL LIABILITIES 3,819.4 3,878.6 3,823.8 54.8
* Excluding accrued taxes and employee benefi t expenses.

GROUPE SEB - HALF-YEAR FINANCIAL REPORT AS AT 30 JUNE30
3 Financial statements
(in € millions)
30/06/2016 Financial instruments by category
Carrying amount Fair value
At fair value through
profi t or loss (excluding
derivatives)
Assets available
for saleLoans and
receivablesHeld to
maturityDerivative
instruments
Assets
Investments in non-consolidated companies 16.0 16.0 16.0
Other non-current fi nancial assets(b) 46.3 46.3 46.3
Other non-current assets(a) 2.3 2.3 2.3
Trade receivables 688.1 688.1 688.1
Other current receivables, excl. prepaid expenses(a) 4.4 4.4 4.4
Derivative instruments 35.0 35.0 35.0
Other fi nancial assets 137.6 137.6 137.6
Cash and cash equivalents 322.3 322.3 322.3
TOTAL FINANCIAL ASSETS 1,252.0 1,252.0 459.9 16.0 741.1 35.0
Liabilities
Long-term borrowings 744.5 781.6 781.6
Other non-current liabilities(a) 2.6 2.6 2.6
Trade payables 602.9 602.9 602.9
Other current liabilities(a) 32.3 32.3 32.3
Derivative instruments 34.1 34.1 34.1
Short-term borrowings 334.2 334.2 334.2
TOTAL FINANCIAL LIABILITIES 1,750.6 1,787.7 1,753.6 34.1
(a) Excluding accrued taxes and employee benefi t expenses.
(b) Of which €36 million for the EMSA current account.
Financial assets consist of shares in subsidiaries and affi liates as well
as operating receivables (excluding tax and social security claims),
debt securities and other cash equivalents classifi ed as current assets.
The fair value of trade and other receivables (classifi ed as held-to-
maturity investments) is equivalent to their carrying amount, in view
of their short maturities.
Non-current fi nancial assets consist mainly of investments in non-
consolidated companies, certain receivables related to those
investments and receivables due beyond one year.
Financial assets that are not quoted in an active market are recognized
in the balance sheet at cost, which is representative of their fair value.
Financial liabilities include borrowings and other fi nancing, including
bank overdrafts, and operating liabilities (excluding accrued taxes and
employee benefi t expense).
Borrowings that are not quoted in an active market are measured
by the discounted cash fl ows method, applied separately to each
individual facility, based on market rates observed at the period-end
for similar facilities and the average spread obtained by the Group
for its own issues.
NOTE 13.2. INFORMATION ON FINANCIAL ASSETS
AND LIABILITIES MEASURED AT FAIR
VALUE
In accordance with the amended IFRS 7, fair value measurements are
classifi ed using the following fair value hierarchy:
■ level 1: instrument quoted in active markets;
■ level 2: valuation techniques for which all signifi cant inputs are
based on observable market data;
■ level 3: valuation techniques for which any signifi cant input is not
based on observable market data.
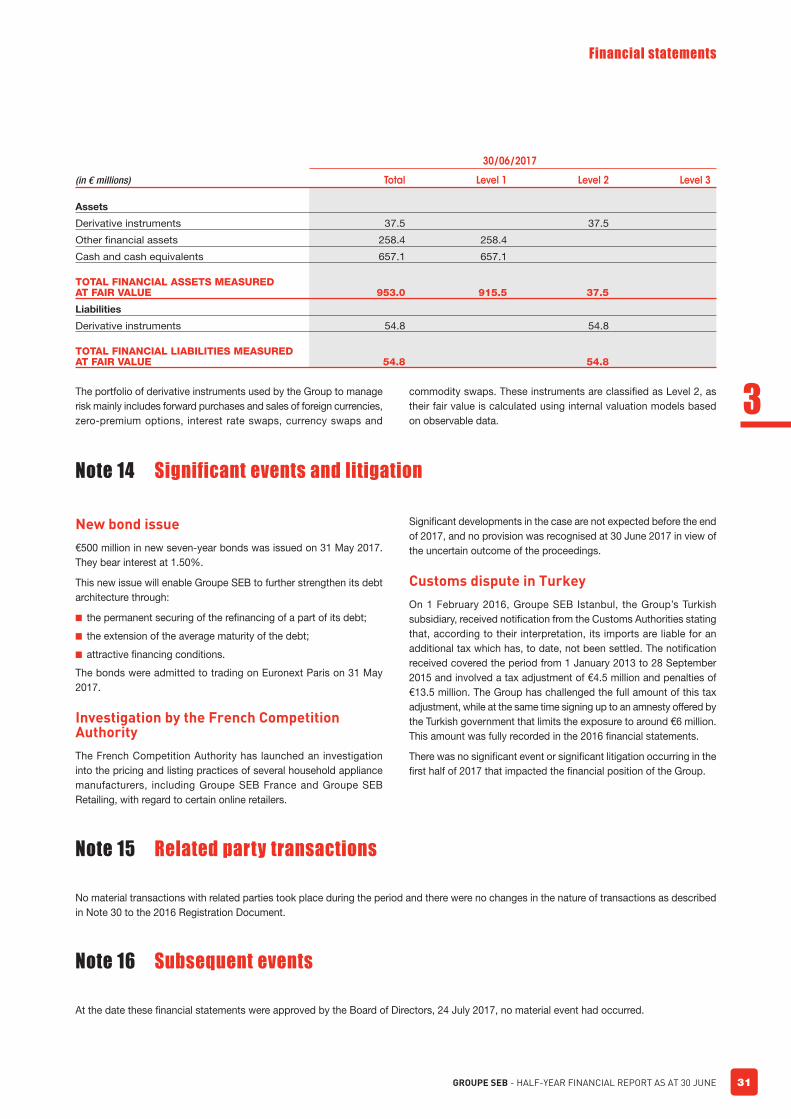
GROUPE SEB - HALF-YEAR FINANCIAL REPORT AS AT 30 JUNE 31
Financial statements
3
(in € millions)
30/06/2017
Total Level 1 Level 2 Level 3
Assets
Derivative instruments 37.5 37.5
Other fi nancial assets 258.4 258.4
Cash and cash equivalents 657.1 657.1
TOTAL FINANCIAL ASSETS MEASURED AT FAIR VALUE 953.0 915.5 37.5
Liabilities
Derivative instruments 54.8 54.8
TOTAL FINANCIAL LIABILITIES MEASURED AT FAIR VALUE 54.8 54.8
The portfolio of derivative instruments used by the Group to manage
risk mainly includes forward purchases and sales of foreign currencies,
zero-premium options, interest rate swaps, currency swaps and
commodity swaps. These instruments are classifi ed as Level 2, as
their fair value is calculated using internal valuation models based
on observable data.
Note 14 Significant events and litigation
New bond issue
€500 million in new seven-year bonds was issued on 31 May 2017.
They bear interest at 1.50%.
This new issue will enable Groupe SEB to further strengthen its debt
architecture through:
■ the permanent securing of the refi nancing of a part of its debt;
■ the extension of the average maturity of the debt;
■ attractive fi nancing conditions.
The bonds were admitted to trading on Euronext Paris on 31 May
2017.
Investigation by the French Competition Authority
The French Competition Authority has launched an investigation
into the pricing and listing practices of several household appliance
manufacturers, including Groupe SEB France and Groupe SEB
Retailing, with regard to certain online retailers.
Signifi cant developments in the case are not expected before the end
of 2017, and no provision was recognised at 30 June 2017 in view of
the uncertain outcome of the proceedings.
Customs dispute in Turkey
On 1 February 2016, Groupe SEB Istanbul, the Group’s Turkish
subsidiary, received notifi cation from the Customs Authorities stating
that, according to their interpretation, its imports are liable for an
additional tax which has, to date, not been settled. The notifi cation
received covered the period from 1 January 2013 to 28 September
2015 and involved a tax adjustment of €4.5 million and penalties of
€13.5 million. The Group has challenged the full amount of this tax
adjustment, while at the same time signing up to an amnesty offered by
the Turkish government that limits the exposure to around €6 million.
This amount was fully recorded in the 2016 fi nancial statements.
There was no signifi cant event or signifi cant litigation occurring in the
fi rst half of 2017 that impacted the fi nancial position of the Group.
Note 15 Related party transactions
No material transactions with related parties took place during the period and there were no changes in the nature of transactions as described
in Note 30 to the 2016 Registration Document.
Note 16 Subsequent events
At the date these fi nancial statements were approved by the Board of Directors, 24 July 2017, no material event had occurred.

GROUPE SEB - HALF-YEAR FINANCIAL REPORT AS AT 30 JUNE32
3 Financial statements
STATUTORY AUDITORS’ REPORT ON THE HALF-YEARLY FINANCIAL INFORMATION
For the period from 1 J anuary 2017 to 30 J une 2017
To the shareholders,
In compliance with the assignment entrusted to us by General Meeting and in accordance with the requirements of Article L. 451-1-2 III of the
French Monetary and Financial Code (Code monétaire et financier), we hereby report to you on:
■ the review of the accompanying condensed half-yearly consolidated fi nancial statements of SEB, for the period from 1 January 2017 to
30 June 2017;
■ the verifi cation of the information presented in the half-yearly management report.
These condensed half-yearly consolidated fi nancial statements are the responsibility of the Board of Directors. Our role is to express a conclusion
on these fi nancial statements based on our review.
CONCLUSION ON THE FINANCIAL STATEMENTS
We conducted our review in accordance with professional standards applicable in France. A review of interim fi nancial information consists of
making inquiries, primarily of persons responsible for fi nancial and accounting matters, and applying analytical and other review procedures. A
review is substantially less in scope than an audit conducted in accordance with professional standards applicable in France and consequently
does not enable us to obtain assurance that we would become aware of all signifi cant matters that might be identifi ed in an audit. Accordingly,
we do not express an audit opinion.
Based on our review, nothing has come to our attention that causes us to believe that the accompanying condensed half-yearly consolidated
fi nancial statements are not prepared, in all material respects, in accordance with IAS 34 – standard of the IFRSs as adopted by the European
Union applicable to interim fi nancial information.
SPECIFIC VERIFICATION
We have also verifi ed the information presented in the half-yearly management report on the condensed half-yearly consolidated fi nancial
statements subject to our review.
We have no matters to report as to its fair presentation and consistency with the condensed half-yearly consolidated fi nancial statements.
Courbevoie and Lyon, on the 26 July 2017
The Statutory auditors French original signed by
PricewaterhouseCoopers Audit Mazars
Nicolas Brunetaud Thierry Colin
This is a free translation into English of the Statutory auditors’ report issued in French and is provided solely for the convenience of English
speaking users. This report should be read in conjunction and construed in accordance with French law and professional auditing standards
applicable in France.
GROUPE SEB - HALF-YEAR FINANCIAL REPORT AS AT 30 JUNE 33
Financial statements
3
STATEMENT BY THE PERSON RESPONSIBLE FOR THE INTERIM FINANCIAL REPORT
I hereby certify that, to my knowledge,
■ the condensed fi nancial statements for the six months ended have been prepared in accordance with the applicable accounting standards
and give a true and fair view of the assets and liabilities, fi nancial position and results of the company and of those companies within the
scope of consolidation;
■ the interim management report includes a fair review of the signifi cant events of the past six months, their impact on the interim fi nancial
statements and the main related party transactions for the period, as well as a description of the main risks and uncertainties in the second
half of the year.
Écully, 31 July 2017
Chairman and CEO
Thierry de La Tour d’Artaise

GROUPE SEB - HALF-YEAR FINANCIAL REPORT AS AT 30 JUNE34


Groupe SEBCampus SEB – 112 chemin du Moulin Carron69130 Ecully – France+33 (0)4 72 18 18 18
2017www.groupeseb.com