Guiding Deep Brain Stimulation Interventions by Fusing Multimodal Uncertainty Regions
8
Guiding Deep Brain Stimulation Interventions by Fusing Multimodal Uncertainty Regions Alexander Bock * Scientific Visualization Group Link ¨ oping University Norbert Lang † St. Barbara Hospital Hamm Gianpaolo Evangelista ‡ Sound Technology Group Link ¨ oping University Ralph Lehrke § St. Barbara Hospital Hamm Timo Ropinski ¶ Scientific Visualization Group Link ¨ oping University ABSTRACT Deep Brain Stimulation (DBS) is a surgical intervention that is known to reduce or eliminate the symptoms of common movement disorders, such as Parkinson’s disease, dystonia, or tremor. Dur- ing the intervention the surgeon places electrodes inside of the pa- tient’s brain to stimulate specific regions. Since these regions span only a couple of millimeters, and electrode misplacement has severe consequences, reliable and accurate navigation is of great impor- tance. Usually the surgeon relies on fused CT and MRI data sets, as well as direct feedback from the patient. More recently Microelec- trode Recordings (MER), which support navigation by measuring the electric field of the patient’s brain, are also used. We propose a visualization system that fuses the different modalities: imaging data, MER and patient checks, as well as the related uncertainties, in an intuitive way to present placement-related information in a consistent view with the goal of supporting the surgeon in the final placement of the stimulating electrode. We will describe the design considerations for our system, the technical realization, present the outcome of the proposed system, and provide an evaluation. Index Terms: I.3.7 [Three-Dimensional Graphics and Realism]— 1 I NTRODUCTION Due to advances in medicine, society is now facing the problems of an aging population suffering from an increasing occurrence of age-related diseases. One group of frequently occurring age-related diseases are movement disorders such as Parkinson’s Disease (PD), dystonia, or tremors that greatly affect the patients’ quality of life. As both symptoms affecting motor skills, and the psychological consequences of these diseases have a great impact on everyday life, successful treatment strategies are of increasing importance. Deep Brain Stimulation (DBS) is a well-established procedure for reducing the symptoms of these diseases [10, 2] and capable of improving the overall quality of life in the cases where medication is not a viable option. To conduct a DBS, electrodes are implanted into specific regions of the brain and then emit electrical signals to stimulate these regions. In the case of PD the most effective tar- get areas for electrode placement are the subthalamic nuclei (STN) with sizes of a few millimeters [27] and are located in both hemi- spheres. As misplaced stimulation electrodes can have severe side effects, including speech difficulties, increased tremor, or long term memory problems [1], accurate electrode placement is crucial [31]. Nowadays the access path to the target region is planned using mag- netic resonance imaging (MRI). However, in addition to the low signal-to-noise ratio, a major downside of this imaging modality is * [email protected] † [email protected] ‡ [email protected] § [email protected] ¶ [email protected] that the STN is not be visible in every patient [36]. Therefore, sur- geons often use an atlas-based approach to locate the STN within the MRI data, a procedure which is prone to registration errors, is not patient specific, and lacks visual assessment. To further verify the electrode placement, the patient performs simple tasks during the operation that are monitored by the surgical staff and are used to localize the electrode’s position. Depending on the location of the electrode, a different region of the brain is stimulated, result- ing in measurable responses from the patient. These responses can be cognitive, e. g., memory impairment, or motor-related, e. g., in- creased tremor or speech impairment. To further reduce the uncer- tainty of the electrode placement intra-operative x-ray scans can be performed to confirm the electrode placement. In recent years Microelectrode Recording (MER) has emerged as an additional technique allowing the surgeon to better locate the target region for DBS intra-operatively [17]. MER measures the electrical field of the brain during the surgery by inserting elec- trodes into the access path. The measured information is presented to the surgical staff by showing the amplitude in the time domain for each electrode, from which the expert can differentiate func- tional regions of the brain. In order to allow for an intuitive and accurate placement of the electrodes, it is important that the sur- geon has access to all these modalities in a unified manner. Within this paper we propose an interactive visualization system to support the surgeon during a DBS placement procedure. From the surgeon’s point of view it is of great importance to obtain sys- tem support when identifying the optimal placement location for the emitting electrode, such that higher accuracy and precision can be achieved. Therefore the system should support the surgeon’s mental registration between the different modalities and combine the uncertainties in a quantitative way so that confidence in the dis- played data is increased.We address these technical objectives, by proposing a visualization system which provides two views enhanc- ing the final placement of the electrode, by employing two separate fusion techniques. In the first view, we combine the structural and functional information about the target region gathered from differ- ent sources, such as pre-operative scans, x-ray scans, MER, patient checks, and present them to the surgeon in order to guide them to the optimal placement location. The view fuses this data with the structural information surrounding the intended target region in a multimodal visualization. This enables a mental registration of the measured data with the imaging modalities and, thereby, provides context that the surgeon can draw upon during the placement deci- sion. In the second view we fuse the information about the occur- ring uncertainty and provide an information visualization approach to present the data in a quantitative way. The original data and de- rived information is presented as profile plots allowing the surgeon to see the optimal placement position at one glance and, thus, en- able a more effective placement of the electrode. In the remainder of this paper we will briefly explain the DBS process, derive uncertainty regions for the measurements, and show how to display them in a unified approach.
Transcript of Guiding Deep Brain Stimulation Interventions by Fusing Multimodal Uncertainty Regions
Guiding Deep Brain Stimulation Interventionsby Fusing Multimodal Uncertainty Regions
Alexander Bock∗Scientific
Visualization GroupLinkoping University
Norbert Lang†
St. Barbara HospitalHamm
Gianpaolo Evangelista‡
Sound TechnologyGroup
Linkoping University
Ralph Lehrke§
St. Barbara HospitalHamm
Timo Ropinski¶Scientific
Visualization GroupLinkoping University
ABSTRACT
Deep Brain Stimulation (DBS) is a surgical intervention that isknown to reduce or eliminate the symptoms of common movementdisorders, such as Parkinson’s disease, dystonia, or tremor. Dur-ing the intervention the surgeon places electrodes inside of the pa-tient’s brain to stimulate specific regions. Since these regions spanonly a couple of millimeters, and electrode misplacement has severeconsequences, reliable and accurate navigation is of great impor-tance. Usually the surgeon relies on fused CT and MRI data sets, aswell as direct feedback from the patient. More recently Microelec-trode Recordings (MER), which support navigation by measuringthe electric field of the patient’s brain, are also used. We proposea visualization system that fuses the different modalities: imagingdata, MER and patient checks, as well as the related uncertainties,in an intuitive way to present placement-related information in aconsistent view with the goal of supporting the surgeon in the finalplacement of the stimulating electrode. We will describe the designconsiderations for our system, the technical realization, present theoutcome of the proposed system, and provide an evaluation.
Index Terms: I.3.7 [Three-Dimensional Graphics and Realism]—
1 INTRODUCTION
Due to advances in medicine, society is now facing the problemsof an aging population suffering from an increasing occurrence ofage-related diseases. One group of frequently occurring age-relateddiseases are movement disorders such as Parkinson’s Disease (PD),dystonia, or tremors that greatly affect the patients’ quality of life.As both symptoms affecting motor skills, and the psychologicalconsequences of these diseases have a great impact on everydaylife, successful treatment strategies are of increasing importance.
Deep Brain Stimulation (DBS) is a well-established procedurefor reducing the symptoms of these diseases [10, 2] and capable ofimproving the overall quality of life in the cases where medicationis not a viable option. To conduct a DBS, electrodes are implantedinto specific regions of the brain and then emit electrical signals tostimulate these regions. In the case of PD the most effective tar-get areas for electrode placement are the subthalamic nuclei (STN)with sizes of a few millimeters [27] and are located in both hemi-spheres. As misplaced stimulation electrodes can have severe sideeffects, including speech difficulties, increased tremor, or long termmemory problems [1], accurate electrode placement is crucial [31].Nowadays the access path to the target region is planned using mag-netic resonance imaging (MRI). However, in addition to the lowsignal-to-noise ratio, a major downside of this imaging modality is
∗[email protected]†[email protected]‡[email protected]§[email protected]¶[email protected]
that the STN is not be visible in every patient [36]. Therefore, sur-geons often use an atlas-based approach to locate the STN withinthe MRI data, a procedure which is prone to registration errors, isnot patient specific, and lacks visual assessment. To further verifythe electrode placement, the patient performs simple tasks duringthe operation that are monitored by the surgical staff and are usedto localize the electrode’s position. Depending on the location ofthe electrode, a different region of the brain is stimulated, result-ing in measurable responses from the patient. These responses canbe cognitive, e. g., memory impairment, or motor-related, e. g., in-creased tremor or speech impairment. To further reduce the uncer-tainty of the electrode placement intra-operative x-ray scans can beperformed to confirm the electrode placement.
In recent years Microelectrode Recording (MER) has emergedas an additional technique allowing the surgeon to better locate thetarget region for DBS intra-operatively [17]. MER measures theelectrical field of the brain during the surgery by inserting elec-trodes into the access path. The measured information is presentedto the surgical staff by showing the amplitude in the time domainfor each electrode, from which the expert can differentiate func-tional regions of the brain. In order to allow for an intuitive andaccurate placement of the electrodes, it is important that the sur-geon has access to all these modalities in a unified manner.
Within this paper we propose an interactive visualization systemto support the surgeon during a DBS placement procedure. Fromthe surgeon’s point of view it is of great importance to obtain sys-tem support when identifying the optimal placement location forthe emitting electrode, such that higher accuracy and precision canbe achieved. Therefore the system should support the surgeon’smental registration between the different modalities and combinethe uncertainties in a quantitative way so that confidence in the dis-played data is increased.We address these technical objectives, byproposing a visualization system which provides two views enhanc-ing the final placement of the electrode, by employing two separatefusion techniques. In the first view, we combine the structural andfunctional information about the target region gathered from differ-ent sources, such as pre-operative scans, x-ray scans, MER, patientchecks, and present them to the surgeon in order to guide them tothe optimal placement location. The view fuses this data with thestructural information surrounding the intended target region in amultimodal visualization. This enables a mental registration of themeasured data with the imaging modalities and, thereby, providescontext that the surgeon can draw upon during the placement deci-sion. In the second view we fuse the information about the occur-ring uncertainty and provide an information visualization approachto present the data in a quantitative way. The original data and de-rived information is presented as profile plots allowing the surgeonto see the optimal placement position at one glance and, thus, en-able a more effective placement of the electrode.
In the remainder of this paper we will briefly explain the DBSprocess, derive uncertainty regions for the measurements, and showhow to display them in a unified approach.

(a) Thalamus (b) Zona incerta
(c) Nucleus subthalamicus (d) Substantia nigra
Figure 1: The MER discharge pattern changes depending on thefunctional region of the brain. The level of background activity andsingle-cell activity varies when entering or leaving specific regionsand can be used to identify these region [3, 14].
2 RELATED WORK
An important step in the DBS intervention consists of the, usuallymanual, trajectory planning. There has been a lot of work on (semi-)automatic trajectory planning in recent years. Gemmar et al. de-termine the mid-sagittal plane and the localization of the anteriorcommissures (AC) and the posterior commissures (PC) [9]. Theirmethod is based on a region-growing based segmentation algorithmand requires a nonlinear anisotropic filtering kernel. The entrypoint is varied while, for each trajectory, a cost function is eval-uated and the system operator selects the best trajectory. Bruneberget al. facilitated a segmentation of the STN and determined theoptimal trajectory by avoiding ventricles, gyri, and blood vessels,which need to be segmented beforehand [5]. Khlebnikov et al. sug-gested a system to find optimal access paths by interpreting tumorsas light sources and determining the cost-function based on lighttransport [15]. A visualization system for the pre-operative plan-ning was provided by Beyer et al., who proposed a multi-volumerenderer employing cut-away views to allow for visual access tothe brain structures of interest [4]. Furthermore, they included askull peeling algorithm, which we have also incorporated into oursystem. Serra et al. created a neurosurgery planning tool for tu-mor resections, that uses a virtual workbench to increase user im-mersion and which provides additional 3D interaction tools [33].Watanabe et al. developed a computer assisted surgery tool to treatcortical lesions, and used a curvilinear reformatting to allow directaccess to the data [39]. More recently, Rieder et al. proposed a plan-ning tool for neurosurgical tumor treatment, that uses a cylindricalcut for a better view of the target region [28]. Additionally, theyintroduce a distance ring to denote the relative depth of a specificregion of interest. Furthermore, the same authors introduce visu-alization techniques to enhance the perception of structures whenusing multimodal rendering setups [29].
In the area of MER data integration Miocinovic et al. provide asystem for a guided DBS electrode implantation in non-human [23]as well as in human primates [22]. They utilitize metaphors for vi-sualizing region information but base the information on a 3D atlasonly instead of using the MER signal. They also do not employpatient checks for feedback. In contrast, we provide a unified guid-ance system based on multi-modal measurements. Furthermore,their main focus is MER-based region detection for generating anatlas of the brain. D’Haese et al. presented a system for use in hu-man surgery but focus on the comparison between MER selectedtargets and atlas-based target selection [7]. They also do not in-corporate the patient test information into their system, which isrequired for a sufficient level of accuracy and confidence. Sperkaet al. also presented a system to improve the planning phase forstereotaxic surgery [35]. Lastly, the use of fMRI data together withother modalities was investigated in the context of stereotactic in-terventions on macaques [25].
Figure 3: Screenshots of our system during the three phases as de-scribed in Section 3.1. The planning phase (Section 3.2 in the topleft, recording phase (Section 3.3) on the right, and the placementphase (Section 3.4) on the lower left.
3 SYSTEM OVERVIEW
The main goal of the designed system is to support the surgeon byreducing cognitive load by fusing the available modalities and thusfacilitating mental registration [37]. The current situation in theoperating theater is that the methods for inspecting the structuralmodalities, such as MRI, CT, and biplanar x-ray scans, are fairlyadvanced and widely used. However, the systems for recording andanalyzing the MER signals and patient checks are decoupled fromthe other modalities. This forces the operating team to performtasks serially, which prolongs the tiring procedure for the patient.By integrating the temporal data of the recording in the spatial con-text of the scans, the surgeon is relieved of the burden of mentalregistration and can perform the operation faster and with greaterconfidence.
The second method through which we support the electrodeplacement is to present all collected data in a unified way, and showit in such a way that the optimal placement location is immediatelyvisible and the surgeon is guided towards it. The collected dataconsists of information about the intended target region, the MERrecording, patient checks, and their associated uncertainties.
The traditional use of a planning system and an MER system sideby side allows for the mental coregistration of MER signals, but thisrequires high levels of concentration fromt the surgeon. The situ-ation is made worse because up to five parallel trajectories mayberecorded at the same time. Correlation of the MER signal of interestwith the corresponding trajectory (for example anterior, posteriorlateral central or medial) becomes a confusing task for the surgeon.The simple and intuitive display of a significant MER signal withinthe space of the planned trajectory is therefore a new feature withdirect clinical benefit.
3.1 DBS Intervention ProcedureBefore describing our system, we will first give a high-leveloverview of the DBS intervention procedure as it is specified insurgery guidelines [12]. With respect to the steps in this procedurea DBS intervention can be divided into roughly three subsequentphases: planning, in which the intended target region is selected,recording, in which the MER signal is obtained, and placement,in which the emitting electrode is inserted, the patient checks areperformed, and the placement is evaluated (see also Figure 2).
As accuracy is of uttermost importance when performing DBSinterventions, the patient is mounted into a stereotaxic frame thatis rigidly fixed to the patient’s skull. This frame has sockets thathold and precisely guide the equipment used during the interven-tion. Due to the known geometry of the stereotaxic frame, it servesas the basis for the coordinate transformation from imaging data tothe patient. An important property of the frame is that it is visible inboth CT and MRI scans, and can thereby serve as one of the land-

Figure 2: The workflow of the proposed DBS intervention system can be divided into three phases: planning, recording and placement. Tosupport each of these phases, we employ dedicated views that are arranged in a multiple view setup as shows in Figure 3. External componentsinteracting with our visualization system are shown for each phase.
marks used in the registration process. In the planning phase thesurgeon plans the access path based on the pre-operatively acquiredT1- and T2- weighted MRI scans. In most cases, however, the tar-get region is not directly visible on either of the MRI scans and thesurgeon has to rely on experience and patient-neutral heuristics tolocate the target area. This step introduces some uncertainty, of anunknown scale, into the position of the intended target region.
In addition to the MRI scans, a pre-operative CT scan, and or-thogonal reference x-ray scans (see Figure 4) are acquired. Fol-lowing the scans the access path is drilled, the MER electrodesare inserted, and the recording is started. During the recordingphase the electrodes are moved forward towards the intended tar-get region while they continuously record the discharge pattern ofthe surrounding tissue. One member of the surgical team observesthe signal, analyzes it, and informs the surgeon about the findings.We describe the developed visualization techniques supporting therecording phase in Section 3.3.
After the recording the MER electrodes are removed, the emit-ting electrode is inserted, and, in the placement phase, the electrodeplacement is performed. Upon reaching the target depth, the elec-trodes are activated and start emitting. Changing the position of theelectrode, the surgeon tests the patient’s higher brain functions inorder to narrow down the optimal electrode location. This is donebased on expert knowledge of the relative positions of functionalbrain regions. To monitor and verify this process and the elec-trode’s actual position, orthogonal x-ray scans are obtained. We de-scribe the visualization techniques developed to support the place-ment phase within Section 3.4. This part of the surgery is very tiringfor the conscious patient. The operation time varies between 6 to10 hours and success may be limited by the ability of the patient tocooperate. Thus, speeding up the testing phase using an integratedplanning/MER visualization tool is highly desireable.
3.2 Planning Phase
The goal of the planning phase is to identify the desired target re-gion based on pre-operative scans, and to plan a trajectory reachingthat target region while minimizing the distance to critical struc-tures. There are a number of highly specialized tools available toperform this task, and there is also active research in the field of au-tomatic trajectory planning [34]. Since our focus is on other partsof the procedure, we implemented a basic planning tool, capableof importing the data from more sophisticated tools. The surgeonselects the intended target location and the burr hole position ona slice representation of the MRI scan. The resulting access pathbetween the two selected points is shown in a 3D multimodal visu-alization of the pre-operative scans (see Figure 5). As the 3D viewcontains all contextual information relevant during each phase ofthe DBS intervention procedure, it is used within all phases andprovides continuity through the phases of the system.
3.2.1 Contextual View
The contextual view is the common element that is present in allthree phases of our system. It is based on a multimodal visualizationof the pre-operatively acquired CT and MRI scans. To improve spa-tial comprehension, the three modalities are not fused completelybut vertically separated such that, for each layer, the modality ofhighest interest is visible (see Figure 5). At the lowest layer werender the T1-weighted MRI with a transfer function that shows thewhole head of the patient. The spin-lattice time was chosen sinceit allows for an easier classification of the skin and the relativelystable gradients allow for adequate shading. This part communi-cates the orientation of the patient intuitively and thereby reducesdangerous left-right mismatches by the surgical staff. The lowerlayer is capped with a slice view that provides the surgeon withdirect access to structural information embedded within the spa-tial context. The skull is partly shown in the middle layer, basedon the CT scan, to serve as a smooth transition between the lowerlayer and the brain. To obtain an occlusion-free view of the brain,we employ a skull stripping approach, described in Section 4, at thehighest layer. As MRI has a fairly low signal-to-noise ratio [13], wedecided to employ depth darkening [19] instead of gradient-basedshading as it increases the depth perception of the brain’s structures.The depth of the intended target region is visible as a yellow bandsurrounding the skull and serves as another depth cue.
We present the access path to the surgeon by removing the struc-tures around the previously determined trajectory [40, 28]. Theremoved area is cylinder-shaped and possesses a variable, user-defined radius To increase the amount of information the surgeongains from the cylinder walls, the same transfer function as usedin the slice representations is applied here. More importantly, thisincreased access path allows more information to be shown, and re-main visible, in a spatial context. As described in the next section,we can include glyphs within the removed area to provide informa-tion about attributes along the trajectory.
3.3 Recording PhaseThe recording phase is the next step during a DBS intervention.While advancing the electrodes towards the target region, each de-tects the signals from the surrounding tissue and transmits them tothe controlling device. To obtain knowledge about the current re-gion, the received signals are constantly analyzed and classified.
Methods exist to automatically detect the region. The analysisand computation of these metrics, however, is not in the main fo-cus of this paper so it is not elaborated on in detail. Instead, anyof the following variants can be chosen and a comparative studymight be the focus of future work. One possible set of metrics con-sist of the firing rate, burst index, pause ratio, and the pause index,which were introduced by Haese et al. [7]. They also found outthat these metrics are useful to map the signals to specific brainregions. These values are computed using a denoised signal andapplying a non-linear energy operator as presented by Maragos et
al. [20] and a spike detection with a subsequent thresholding pre-sented by Mukhopadhyay et al. [24]. Several other approaches forthis technique exist and these make no systematical difference forour system.
3.3.1 Additions to the Contextual View
The contextual view as employed in the recording phase is, in mostparts, identical to the one used in the planning phase. As this phaseof the intervention process requires additional information, how-ever, the view differs in some ways. First, since the current depthof the MER electrodes is known, we can compute and display a rep-resentation of the electrodes. As the extent of the electrodes is verysmall compared to the whole head, and we are only interested inthe general position and orientation of the electrodes, just a singlerepresentative proxy electrode is rendered.
Using the MER signal analysis, we can classify depth values bytheir functional areas. Doing this continuously for every point alongthe access path would introduce a lot of visual clutter that would notgive additional insight. Therefore we classify and summarize seg-ments along the trajectory that we can classify up to an acceptablecertainty. For each classified segment we display a glyph, repre-sentation, which we refer to as a bead, in the center of the canal.Each bead is rendered as a shaded sphere with a specific color. Thisvisual metaphor has been proposed before [23, 7] and provides con-textual and functional information. The bead’s color correlates withthe classified region. A black bead is created if there has been asignificant distance without a reliable classification. These inter-mediate beads are important to maintain the analogy, i.e., the spa-tial relationship, of a bead string. Different shades of red are usedfor areas that lie outside of the desired target area. It is importantto present this information to the surgeon as they can deduce moreinformation from the changes between different areas. The firstchoice for a color would be different shades of gray, since it doesnot draw as much attention. But since the canal wall is gray andthe human visual system is not well adapted to differentiate graytones, we chose red as the hue for these regions. As soon as theanalysis of the spike signals indicates that the MER electrodes arein the target region, green beads are rendered that draw attentionto those structures. Furthermore, this color coding resembles thetraffic light color scheme proposed by Rieder et al. [30], which in-tuitively assigns green to good areas, while red is assigned to badareas. To further reduce visual clutter only one bead is rendered forall electrodes. This is a viable simplification as the different func-tional regions of the brain are oriented such that either all electrodesdetect the same signal (either type of tissue or undefined) or a sub-set of electrodes detects a regional signal and the others detect anundefined signal.
Even with the application of the depth darkening shading tech-
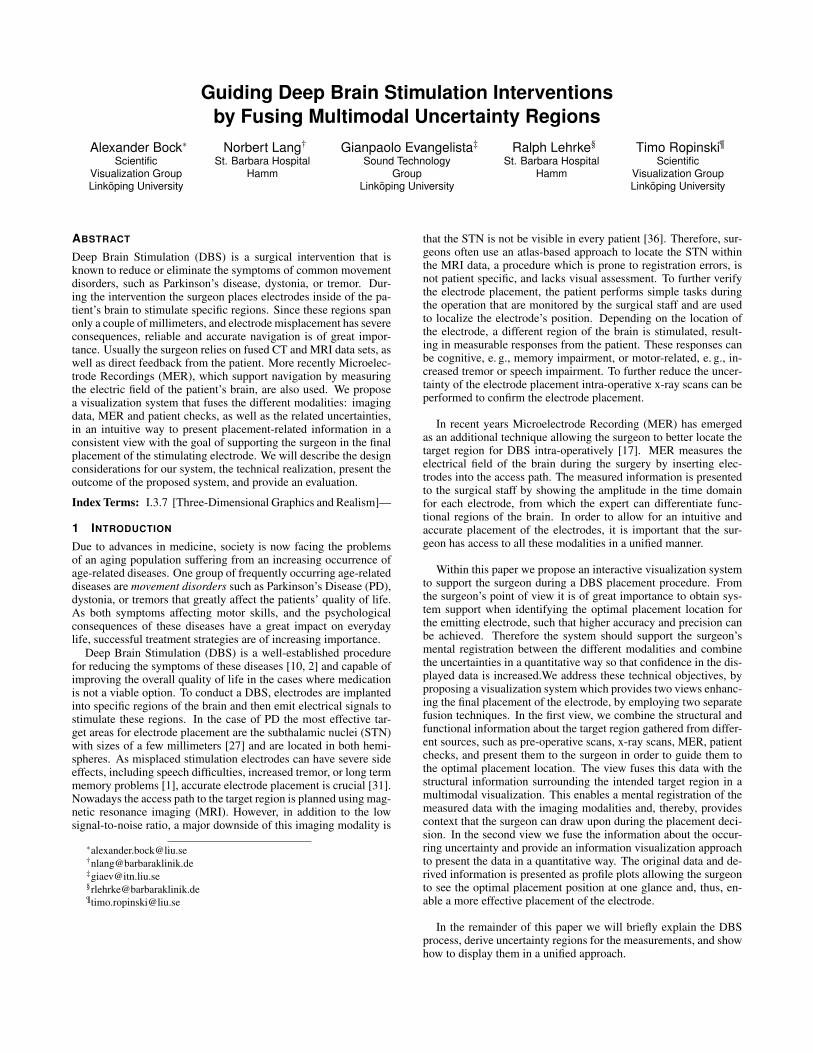
(a) Anterior-Posterior (b) Dorsal-Ventral
Figure 4: Two x-ray images are created to calibrate the patient’s po-sition in the operating room using the perspective distortion of thereference plates. Subsequent x-ray images are used to verify theelectrodes position inside the head and estimate the uncertainty ofthe segmentation.
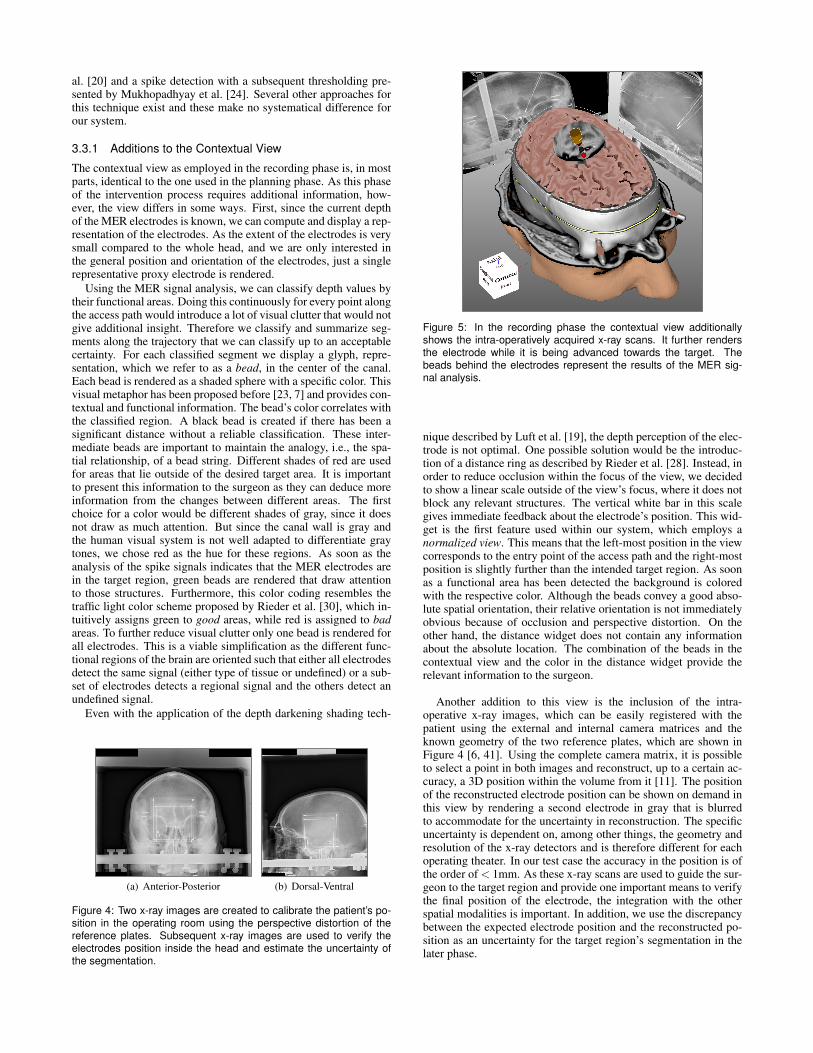
Figure 5: In the recording phase the contextual view additionallyshows the intra-operatively acquired x-ray scans. It further rendersthe electrode while it is being advanced towards the target. Thebeads behind the electrodes represent the results of the MER sig-nal analysis.
nique described by Luft et al. [19], the depth perception of the elec-trode is not optimal. One possible solution would be the introduc-tion of a distance ring as described by Rieder et al. [28]. Instead, inorder to reduce occlusion within the focus of the view, we decidedto show a linear scale outside of the view’s focus, where it does notblock any relevant structures. The vertical white bar in this scalegives immediate feedback about the electrode’s position. This wid-get is the first feature used within our system, which employs anormalized view. This means that the left-most position in the viewcorresponds to the entry point of the access path and the right-mostposition is slightly further than the intended target region. As soonas a functional area has been detected the background is coloredwith the respective color. Although the beads convey a good abso-lute spatial orientation, their relative orientation is not immediatelyobvious because of occlusion and perspective distortion. On theother hand, the distance widget does not contain any informationabout the absolute location. The combination of the beads in thecontextual view and the color in the distance widget provide therelevant information to the surgeon.
Another addition to this view is the inclusion of the intra-operative x-ray images, which can be easily registered with thepatient using the external and internal camera matrices and theknown geometry of the two reference plates, which are shown inFigure 4 [6, 41]. Using the complete camera matrix, it is possibleto select a point in both images and reconstruct, up to a certain ac-curacy, a 3D position within the volume from it [11]. The positionof the reconstructed electrode position can be shown on demand inthis view by rendering a second electrode in gray that is blurredto accommodate for the uncertainty in reconstruction. The specificuncertainty is dependent on, among other things, the geometry andresolution of the x-ray detectors and is therefore different for eachoperating theater. In our test case the accuracy in the position is ofthe order of < 1mm. As these x-ray scans are used to guide the sur-geon to the target region and provide one important means to verifythe final position of the electrode, the integration with the otherspatial modalities is important. In addition, we use the discrepancybetween the expected electrode position and the reconstructed po-sition as an uncertainty for the target region’s segmentation in thelater phase.

3.3.2 2D Temporal Audio Visualization
In this view we present the raw data collected by the MER elec-trodes in real time. This signal is usually inspected by the surgeonas an audio signal. One graph is shown for each electrode, whichshows the electric potential difference plotted over time. The scal-ing factor of the ordinate can be manually adjusted using a slider toaccount for patient and equipment specific differences. The identi-fying names for each electrode are shown on the left hand side nextto the graphs.
Since surgeons are generally more interested in the distributionof spikes than the background noise, we visually enhance spikessuch that they are the immediate focus of attention. This visual en-hancement is done by defining a threshold value below which allvalues are de-emphasized, a darker color being chosen, and abovewhich the values are emphasized with a brighter color. There isan exponential transition in the area around the threshold to reduceany unwanted attention that would otherwise result from a discon-tinuity. This threshold value can be varied by the user to includea wider or narrower range of values in the focus area. The colorscheme matches the color on the electrode representations and atthe same time intensifies the perceptual distance between the colorsused for the thresholded area and the spikes.
To further facilitate linking between all views containing a rep-resentation of the MER signal, the surgeon can select electrodeswhich are then highlighted in all views (see Figure 6). A problemwith current systems is that the surgeon must maintain a mentalmodel relating the horizontal oscilloscope graphs with the geomet-ric orientation of the electrodes in the patient’s head. By creating alinked view between those two representations, we reduce the men-tal burden on the surgeon without preventing him access to any ofthe information.
3.3.3 3D Spatiotemporal Audio Visualization
It is important to bridge the gap between the MER signal, definedover the time domain, and the structual data, contained in the imag-ing data. We achieve this by employing an audio visualizationthat directly combines the spatial information of the electrodes withtheir temporal electric signal. Each electrode shows its electric sig-nal as concentric discs around the centerline. The discs start at theback end of the electrode with a radius that scales linearly with theabsolute value of the amplitude. As soon as the next measurementis registered the discs move away from the electrode and a new discis inserted at the back end. This way the signal originates from theelectrode and moves away from it over time. Considering the abso-lute value of the amplitude is sufficient as the spikes are distributedsymmetrically and surgeons are not interested in whether the spikesoccur because of a negative potential difference or a positive one.The discs are distorted since they are drawn in perspective. This isnot a serious problem because, on the one hand the actual amplitude
Figure 6: The MER signal in the time domain is shown using anoscillograph-like representation in which time is on the horizontal axisand the electric potential difference on the vertical. The visual per-ception of the signal is enhanced by de-emphasizing the backgroundnoise and guiding the attention to the more important spikes. Thesignal of the currently selected electrodes is highlighted.
Figure 7: Combining the spatial orientation and layout of the record-ing electrodes with the temporal signal relieves the surgeon of theburden to keep this association in mind. To enhance the perceptionof the spikes, only the values above a certain threshold are shown inthis view so that they are visible pre-attentively. The inset shows theresult for one electrode without thresholding.
of the signal is not as important as the spike frequency and, on theother, the 2D signal is presented to the surgeon as a backup as well.
Creating a disc for every measurement point would clutter thewhole view (see inset in Figure 7). Therefore we apply the samethresholding technique as described in the previous section, but dis-card all signals below the threshold completely.
3.4 Placement PhaseIn the placement phase the surgeon needs to consider all acquiredinformation to determine the optimal position of the stimulatingelectrode. This decision is based on three different factors that areall affected by varying uncertainties:
First, the surgeon’s experience and knowledge in selecting andsegmenting the intended target region during the planning phase.The segmentation is uncertain as, for example, the brain shifts fromits scanned position during the operation. There exist techniques toreduce this uncertainty and we estimate it by measuring the differ-ence between the expected electrode position and the reconstructedposition based on the x-ray images. Second, the results of the MERrecording and the area along the trajectory. The uncertainty for thisstep is highly dependent on both the algorithm used to analyze theMER signal and the electrode configuration. The third factor isacquired when the stimulating electrode is inserted and activated.The surgical staff will test different brain functions of the patient.Since it is well-known which areas affect which capabilities whilestimulated, the surgeon can further narrow down the location of theoptimal target region. In our example we use two brain functions,the ability to recall events from long-term memory and an increasein tremor of the patient’s hand. Each of the functions is tested sepa-rately along the access path and, based on the surgeon’s experienceand a patient-neutral heuristic, it is possible to deduce the target re-gion’s position relative to the measurement point. The level of un-certainty for this information is relatively constant and in the samerange as the extent of the electrodes,< 1.5mm for our setup. Foreach decision factor we independently measure the probability, anduncertainty, of the target region’s position along the access path.
The contextual view introduced above is shown to maintain thesurgeon’s mental registration. Since the whole trajectory has beenmeasured in the previous phase, however, all beads and all infor-mation previously acquired in the canal tube is presented indepen-dently of the electrode position.
3.4.1 Target CloseupThe localization procedure must not only communicate the elec-trode’s position with respect to anatomical structures, but also withregard to the intended target region. An optimal placement of thestimulation electrode should be in the intersection of the potentialtarget regions obtained from the different measurements. We sup-port this in-detail navigation aspect by providing a 3D visualization,

Figure 8: The target closeup visualization shows the potential tar-get regions (speech tests=blue, movement tests=purple). The spa-tial context provided by the MRI signal is color coded using the red-green MER region mapping. The stimulation electrode changes itscolor when it is entering the intersection of the potential target area.This view gives qualitative access to all uncertainty data fused withstructural data in one glance.
which we refer to as the target closeup, that shows the electrode em-bedded in the potential target regions together with the intended tar-get region. To relate these potential target regions to the electrodeand embed them into the spatial context, we additionally displaythe pre-operative MRI scans as a view-dependent projection on theback faces of the target closeup’s bounding box. The rendering ofthe datasets has been made optional as, while it can provide valu-able information regarding the intersection between the electrodeand structures of interest, it can also occlude the potential targetregions. The same orientation overlay, which is also used in theother 3D representations, is used in the electrode closeup to allow aseamless embedding of this view.
We have to deal with three different types of potential target re-gions, where the type of a region depends on the way it has beenacquired. First, the planned region, which has been manually de-fined through segmentation by the surgeon on the basis of the pre-operative MRI scans. Therefore, we can apply volume rendering toshow the result of this planning process. The second type is derivedfrom the MER signal and has considerable uncertainty. This is pro-jected onto the back planes of the detail view with the color codingthat we have also used for visualizing the original MER signal. Asafety margin is displayed to account for the occurring uncertaintysources. The third type of potential target region is derived from thepatient tests performed when placing the stimulating electrode andmust, therefore, be interactively changeable. The region is shown asan ellipsoid in 3D assembled by connecting several check points. Inthe example, shown in Figure 8, we depict the ellipsoid generatedfrom multiple speech tests in yellow, while the ellipsoid obtainedfrom the movement tests is depicted in blue. The safety marginsare depicted by using transparency, as it allows them to be commu-nicated intuitively while still maintaining a moderate level of occlu-sion. The width of the safety margins is dependent on experienceand the electrode configuration that is used in the intervention.
Similarly to the contextual view, we make it possible for the sur-geon to show the approximate location of the electrode as recon-structed from the x-ray scans. This is of particular interest in thisview, as it shows the deviation of the actual position from the pre-dicted electrode position, due to brain shift and bending of the nee-dle. The uncertainty of the reconstruction is shown by blurring therendering of the electrode to fill the size of the uncertain region.
Finally, we emphasize the intersection of the displayed target re-gions as this intersection is the region where an optimal electrodeplacement would occur. We compute this intersection interactively
Figure 9: The placement guide gives a quantitative overview of mea-sured data for potential target regions. The top figure is a combina-tion of all data values, where as the lower figures present detailedinformation by showing either all values or pairwise combinations.These combinations enable the surgeon to gain further insight intothe measurements in certain situations, for example, when a mea-surement proves unreliable during the procedure.
and display it volumetrically with a green hue, the same as is usedfor the green-to-red MER mapping. Thus, the surgeon can verifythe overlap and decide in which region to place the electrode. Fur-thermore, through the extent of the red region, the surgeon gets in-formation about the mismatch between the pre-operative planningand the MER recordings. To further guide the surgeon during theelectrode placement, we additionally change the color of the elec-trode when it penetrates the computed interaction of the potentialtarget regions.
3.4.2 Placement GuideIn addition to the spatial context, as described in the previous sec-tion, we also present the potential target regions quantitatively ina view we call the placement guide. This view is centered on theintended target region with the access path depth on the abscissaand the likelihood of the actual target region on the ordinate. Byshowing the quantitative data in a line plot, the surgeon immedi-ately sees in which areas most of the measurements agree and isguided towards that position. As we have multiple decision valuesfor each depth value, we can combine them in different ways. Inour example we chose a weighted sum, but the combination func-tion can be freely changed according to future research. The val-ues for uncertainty are combined in the same way and are renderedas transparent areas surrounding the line. Transparency has beenshown to be a good way to convey uncertainty in other contexts [8].With this representation the size of the transparent area immediatelyshows how uncertain a specific value is. This lets the surgeon seethe whole set of information at one time and decide on an optimalplacement position. All combined views use spline-based smooth-ing on the curves, which can be disabled by the user. This is done sothat the surgeon is not distracted by abrupt changes in the data val-ues which would otherwise draw unwanted attention . The currentposition of the electrode is shown as a bar in each of the views.
The top figure in Figure 9 shows the combined data of all valuesand is of central interest for the surgeon. It provides an overview ofall measured data and guides the surgeon to the most likely, thehighest, position. The curve is assembled while the stimulatingelectrode is being advanced and the patient checks are performed.Since the combined curve hides possible outliers and gives no feed-back on the underlying values, the composition of each samplepoint can be examined in the top right as a bar plot that shows theprobability and uncertainty for each decision factor separately. Allbars are justified to the left, with their width directly relating to themeasured value. As with the line plot, a transparent box shows thearea of uncertain values. One bar is rendered for each source of

measurements. So in our case (see Figure 9) there is one bar forthe segmentation, MER, and one for each of the two patient checks.Including a line alongside the combined data for each of the deci-sion factors would clutter the view and would distract the surgeontoo much, which is why we chose to add the bar plot representation.There is,however, an optional view showing those decision factorsseparately. Furthermore, it is possible to view all pairwise com-binations of factors. Showing these auxiliary views, the surgeoncan detect outliers and unexpected behavior immediately withoutdistracting him from the main view. Toggling of these auxiliaryviews can become important in an operation when the surgeon, forexample, notices that the patient checks of this particular patientare not as reliable as expected or detects a flaw in the segmenta-tion. Furthermore, it can be useful to inspect the data as if one ofthe measurements is not considered. This inspection might lead tofinding that one of the measurements is not reliable.
4 IMPLEMENTATION
In this section we describe selected implementation details of oursystem.Multivolume raycasting. For the contextual view we need to ren-der registered multimodal datasets and at the same time integratethe electrodes and beads into the rendering. For the rendering weexploit GPU-based volume raycasting as presented by Kruger andWestermann [16]. We include the geometric information of objectsinto this raycasting scheme by modifying the exit points such thatthe raycasting process ends at those objects [32]. The objects arerendered in a separate pass and the results are blended to obtainthe final rendering result. To achieve interactive multivolume ray-casting we employ a modified version of the region based scenedescription as presented by Lindholm et al. [18].Skull stripping. We implemented the skull stripping algorithm aspresented by Beyer et al. [4]. Although a complete segmentationwould provide better results, we want to avoid the necessary userinteraction. The basis for this method is opacity peeling [26] whichis, in our case, performed on the conditional ray-casting results.Depending on a user-selected parameter, the accumulated valuesare reset as soon as the early ray-termination criterion is reached.The skull stripping employed in our system uses registered CT andMRI scans to determine the boundary between the brain and theouter layers. Thus, the values accumulated along a ray can be re-set when the rays leaves the bone structures and the ray traversalthrough the brain starts. This method requires no user interactionand provides good and stable results.
5 EVALUATION
As computer-aided surgery systems are combining an increasingnumber of types of information from different sources, it is impor-tant that the interfaces reduce the cognitive load required to use thesystem [38, 21]. To evaluate the practicability of the proposed sys-tem we have conducted a qualitative user-study with five neurosur-geons, all of whom have extensive experience in the field and per-form DBS interventions on a regular basis. The study has been de-signed with respect to the guidelines for evaluating computer-aidedsurgery systems, which have been proposed by Martelli et al. [21].The neurosurgeons were shown a showcase demonstration of thesystem going through all three phases (planning, recording, andplacement). A demonstration was chosen, as a pre-study showedthat the complexity of usage, in the current form, would result ina biased evaluation. The data for this demonstration was recordedand reconstructed from a real intervention. After the demonstra-tion the neurosurgeons answered a questionnaire consisting of eightstatements and questions, as well as a text field for arbitrary com-ments. Each of these statements and questions had a positive anda negative reply with no opportunity to abstain. The following ta-ble shows all statements and questions together with the number of
positive answers:The user is not disturbed by images, colors, or animationwhile interacting with the system
4
The result of any action done by the user is clearly andimmediately visualized
4
The tools provided by the system are easy to use 3System data is understandable and clearly visualized 4The actions’ succession proposed by the system is logicalfrom the user’s point of view
5
The system’s features are compatible with all the user’s ex-pectations
4
Would you like to use this system during an intervention inaddition to the old system?
5
Is the fusion of MER signals with image data useful forincreasing the accuracy?
3
Discussion. Overall, the feedback from the neurosurgeons was verypositive. The least satisfied expert agreed with only five statementswhereas the most satisfied expert agreed to all. On average theexperts agreed to 6.5 statements if we assume an equal weightingof the statements. The relatively bad score of only three positiveanswers to the last question seems to be the strongest drawback tothe method, but considering that all of the experts would use oursystem in the operation room makes it a good result. One expertemphasized especially the ”correlations between target region andthe neurophysiological data” as an important aspect of the system.Only two neurosurgeons did not see the benefits of incorporatingthe fused views, while they still liked the overlapping view of thedifferent probable target regions. The third question confirmed theexpected usability result from the pre-study.
6 CONCLUSIONS AND FUTURE WORK
In this paper we have presented a visualization system that hasbeen designed to support neurosurgeons during DBS interventionsby fusing measurement data, along with their uncertainties, withstructural modalities to facilitate mental registration. This multi-modal information is presented to the surgeon during the interven-tion both in the context of the rendered imaging data, as well asa separate view showing the combination of these measurements.As the MER and patient checks are performed during DBS inter-ventions to improve the localization of the stimulation electrode,we feed back the results of these checks into our system. Whendisplaying and intersecting the potential target regions we take intoaccount the different degrees of uncertainty that result from theiracquisition process. This uncertainty-aware information fusion inimage space, as well as in a profile plot, enables the surgeon to bet-ter assess the electrode placement and detect the optimal electrodeplacement. To estimate the clinical impact of the presented systemwe performed a qualitative evaluation with five neurosurgeons whoregularly perform DBS interventions. The results indicate that thepresented visualization approaches are of great interest and have thepotential to improve DBS interventions.
In the future we would like to further improve the presented sys-tem based on the feedback we have received from the surgeons dur-ing our evaluation. We would especially like to reduce the learningcurve currently necessary. Furthermore, it would be beneficial toevaluate its effectiveness in the operation theater. However, a fullevaluation requires a lot of effort as it would require the system tobe certified for usage in the operation theater. While the current sys-tem considers most modalities, the integration of DTI could also beconsidered in the future. Another source of information we wouldlike to include is the region of the brain that is affected by the stim-ulation signal, the volume of tissue activated. This would simulatethe region in the brain that would be influenced by the current elec-trode position and could thereby function as a prediction as well asa verification tool. While we have currently focused on the record-ing and placement phases of the DBS intervention, we would also

like to extend the system for long term horizontal studies of elec-trode placements. A major part of this horizontal study would bethe ability to compare the measured accuracy with the outcome ofthe intervention. As no extensive statistics about the long term ef-fects of varying placement positions and the applied electric fieldsexist, this could be valuable information for further improving DBSinterventions in the future.
ACKNOWLEDGEMENTS
We thank all reviewers for their fruitful comments and Matt Cooperfor proof reading. This work was partly supported by grantsfrom the Excellence Center at Linkping and Lund in InformationTechnology (ELLIIT) and the Swedish e-Science Research Centre(SeRC), as well as VR grant 2011-4113. The presented conceptshave been realized using the Voreen framework (www.voreen.org).
REFERENCES
[1] M. Astrom, E. Tripoliti, M. I. Hariz, et al. Patient-Specific Model-Based Investigation of Speech Intelligibility and Movement duringDeep Brain Stimulation. Stereotactic and functional neurosurgery,88(4):224–233, 2010.
[2] A. L. Benabid, S. Chabardes, J. Mitrofanis, and P. Pollak. Deep brainstimulation of the subthalamic nucleus for the treatment of Parkinson’sdisease. Lancet neurology, 8(1):67–81, 2009.
[3] A. Benazzouz, S. Breit, A. Koudsie, and P. Pollak. IntraoperativeMicrorecordings of the Subthalamic Nucleus in Parkinson ’ s Disease.Movement Disorders, 17(3):145–149, 2002.
[4] J. Beyer, M. Hadwiger, S. Wolfsberger, and K. Buhler. High-qualitymultimodal volume rendering for preoperative planning of neurosur-gical interventions. IEEE TVCG, 13(6):1696–703, 2007.
[5] E. J. L. Brunenberg, A. Vilanova, V. Visser-Vandewalle, et al. Auto-matic Trajectory Planning for Deep Brain Stimulation : A FeasibilityStudy. MICCAI, 10(1):584–592, 2007.
[6] B. Caprile and V. Torre. Using vanishing points for camera calibration.Journal of Computer Vision, 4(2):127–139, 1990.
[7] P. D’Haese, E. Cetinkaya, P. Konrad, et al. Computer-aided placementof deep brain stimulators: from planning to intraoperative guidance.IEEE Transactions on Medical Imaging, 24(11):1469–1478, 2005.
[8] S. Djurcilov, K. Kim, P. Lermusiaux, and A. Pang. Visualizing scalarvolumetric data with uncertainty. Computers and Graphics, 2002.
[9] P. Gemmar, O. Gronz, K. Fisch, et al. Automated Target Location AndTrajectory Selection For Stereotactic Planning In Deep Brain Stimu-lation. Biosignal, 2008.
[10] G.-M. Hariz, M. Lindberg, and A. T. Bergenheim. Impact of thalamicdeep brain stimulation on disability and health-related quality of lifein patients with essential tremor. Journal of Neurology, Neurosurgeryand Psychiatry, 72:47–52, 2002.
[11] R. I. Hartley and A. Zisserman. Multiple View Geometry in ComputerVision. Cambridge University Press, second edition, 2004.
[12] S. Hemm and K. Wardell. Stereotactic implantation of deep brainstimulation electrodes: a review of technical systems, methods andemerging tools. Medical & biological engineering & computing,48(7):611–24, 2010.
[13] K. Herrmann, S. Schmidt, A. Kretz, R. Haenold, I. Krumbein, M. Met-zler, C. Gaser, O. Witte, and J. Reichenbach. Possibilities and limi-tations for high resolution small animal mri on a clinical whole-body3t scanner. Magnetic Resonance Materials in Physics, Biology andMedicine, 25(3):233–244, 2012.
[14] W. D. Hutchison, R. J. Allan, H. Opitz, et al. NeurophysiologicalIdentification of the Subchaiarnic Xucleus in Surgery for Parkinson ’s Disease. Annals of Neurology, pages 622–628, 1998.
[15] R. Khlebnikov, B. Kainz, J. Muehl, and D. Schmalstieg. Crepuscularrays for tumor accessibility planning. IEEE TVCG, 2011.
[16] J. Kruger and R. Westermann. Acceleration Techniques for GPU-based Volume Rendering. In IEEE Visualization, 2003.
[17] F. Lenz, J. Dostrvsky, H. Kwan, et al. Methods for microstimula-tion and recording of single neurons and evoked potentials in the hu-man central nervous system. Journal of neurosurgery, 68(4):630–634,1988.
[18] S. Lindholm, P. Ljung, M. Hadwiger, and A. Ynnerman. Fused Multi-Volume DVR using Binary Space Partitioning. Computer GraphicsForum, 28(3):847–854, 2009.
[19] T. Luft, C. Colditz, and O. Deussen. Image enhancement by unsharpmasking the depth buffer. ACM Transactions on Graphics, 25:1206–1213, 2006.
[20] P. Maragos, J. F. Kaiser, and T. F. Quatieri. On Amplitude and Fre-quency Demodulation Using Energy Operators. IEEE Transactionson Signal Processing, 41(4):1532–1550, 1993.
[21] S. Martelli, L. Nofrini, P. Vendruscolo, and A. Visani. Criteria ofinterface evaluation for computer assisted surgery systems. Journal ofMedical Informatics, 72(1-3):35–45, 2003.
[22] S. Miocinovic, A. M. Noecker, C. B. Maks, C. R. Butson, and C. C.McIntyre. Cicerone: stereotactic neurophysiological recording anddeep brain stimulation electrode placement software system. ActaNeurochir Suppl, 2007.
[23] S. Miocinovic, J. Zhang, W. Xu, et al. Stereotactic neurosurgical plan-ning, recording, and visualization for deep brain stimulation in non-human primates. Journal of neuroscience methods, 162(1-2):32–41,2007.
[24] S. Mukhopadhyay and G. C. Ray. A new interpretation of nonlin-ear energy operator and its efficacy in spike detection. IEEE TBME,45(2):180–7, 1998.
[25] S. Ohayon and D. Y. Tsao. MR-guided stereotactic navigation. Jour-nal of neuroscience methods, 204(2):389–97, 2012.
[26] C. Rezk-Salama and A. Kolb. Opacity peeling for direct volume ren-dering. Computer Graphics Forum, 25(3), 2006.
[27] E. Richter, T. Hogue, W. Halliday, et al. Determining the position andsize of the subthalamic nucleus based on magnetic resonance imag-ing results in patients with advanced Parkinson disease. Journal ofneurosurgery, 100(3):541–546, 2004.
[28] C. Rieder, F. Ritter, M. Raspe, and H.-O. Peitgen. Interactive Visu-alization of Multimodal Volume Data for Neurosurgical Tumor Treat-ment. Computer Graphics Forum, 27(3), 2008.
[29] C. Rieder, M. Schwier, H. K. Hahn, and H.-O. Peitgen. High-QualityMultimodal Volume Visualization of Intracerebral Pathological Tis-sue. Visual Computing for Biomedicine, 2008.
[30] C. Rieder, A. Weihusen, C. Schumann, et al. Visual Support for In-teractive Post-Interventional Assessment of Radiofrequency AblationTherapy. Computer Graphics Forum, 29(3), 2010.
[31] M. C. Rodriguez-Oroz, J. A. Obeso, A. E. Lang, et al. Bilateral deepbrain stimulation in Parkinson’s disease: a multicentre study with 4years follow-up. Brain, 128(Pt 10):2240–9, 2005.
[32] H. Scharsach. Advanced GPU Raycasting. In Central European Sem-inar on Computer Graphics, 2005.
[33] L. Serra, R. A. Kockro, C. G. Guan, et al. Multimodal Volume-basedTumor Neurosurgery Planning in the Virtual Workbench. MICCAI,1998.
[34] R. R. Shamir, I. Tamir, E. Dabool, et al. A method for planning safetrajectories in image-guided keyhole neurosurgery. MICCAI, 13(Pt3):457–64, 2010.
[35] D. J. Sperka and J. Ditterich. Splash: a software tool for stereotacticplanning of recording chamber placement and electrode trajectories.Frontiers in neuroinformatics, 5:1, 2011.
[36] P. Starr, C. Christine, P. Theodosopoulos, et al. Implantation of deepbrain stimulators into the subthalamic nucleus: technical approach andmagnetic resonance imaging-verified lead locations. Journal of neu-rosurgery, 97(2):370–87, 2002.
[37] M. Tory. Mental registration of 2d and 3d visualizations (an empiricalstudy). IEEE Visualization, 2003.
[38] H. Visarius, J. Gong, C. Scheer, et al. Man-Machine Interfaces inComputer Assisted Surgery. Computer Aided Surgery, 2(2):102–107,1997.
[39] L. D. S. Watanabe. Development of a Visualization and ManipulationToolkit for 3D Medical Image.
[40] D. Weiskopf, K. Engel, and T. Ertl. Volume Clipping via Per-FragmentOperations in Texture-Based Volume Visualization. In IEEE Visual-ization, volume Cli, 2002.
[41] Y. Zheng and Y. Liu. Camera calibration using one perspective viewof two arbitrary coplanar circles. Optical Engineering, 47(6), 2008.
![Endrich News Oktober 2017 dt+engl · Type C 2.5 W PERFORMANCE TYPE FUSING POWER [ FUSING TIME. ] ANCE FUSING PERFORMANCE FUSING PERFORMANCE Please note that this device](https://static.fdocuments.us/doc/165x107/5f68c7cca7d617432e4d41da/endrich-news-oktober-2017-dtengl-type-c-25-w-performance-type-fusing-power-fusing.jpg)


![Initiation Fusing[1]](https://static.fdocuments.us/doc/165x107/577ce0e11a28ab9e78b44e50/initiation-fusing1.jpg)