
GUIDELINE ON THE INSTALLATION OF EMBEDDED GENERATION …
43
Embedded Generation: AMEU report Page 1 of 43 5 October 2013 October 2013 GUIDELINE ON THE INSTALLATION OF EMBEDDED GENERATION AND THE IMPACT IT MAY HAVE ON THE REVENUE OF MUNICIPALITIES The Association of Municipal Electricity Utilities (Southern Africa) PO Box 868 FERNDALE 2160 Tel (011) 061 5000 Fax 086 688 7005 E-mail [email protected] Web www.ameu.co.za
Transcript of GUIDELINE ON THE INSTALLATION OF EMBEDDED GENERATION …
Embedded Generation: AMEU report Page 1 of 43 5 October 2013
October 2013
GUIDELINE ON THE INSTALLATION OF EMBEDDED GENERATION AND THE IMPACT IT MAY HAVE ON THE REVENUE OF MUNICIPALITIES
The Association of Municipal Electricity Utilities (Southern
Africa) PO Box 868 FERNDALE 2160 Tel (011) 061 5000 Fax 086 688 7005 E-mail [email protected] Web www.ameu.co.za

Embedded Generation: AMEU report Page 2 of 43 5 October 2013
TABLE OF CONTENTS 1. Introduction ................................................................................................................. 3 2. Abbreviations used in this document .......................................................................... 5 3. Purpose of the document ........................................................................................... 5 4. Background ................................................................................................................ 5 5. Aspects that need to be considered to allow the connection of EMBEDDED GENERATORS ................................................................................................................. 6 6. Potential financial impact of EG on municipalities .....................................................12 7. Conclusions ...............................................................................................................19 8. References ................................................................................................................20
9. Appendix A ................................................................................................................22
Embedded Generation: AMEU report Page 3 of 43 5 October 2013
1. INTRODUCTION On 8 November 2012 the AMEU executive committee requested a work group to compile a position paper on the impact that embedded generation would have on the revenue from sales of electricity on municipalities. This document serves as response to the request. The following persons were requested to contribute towards this document:
o Gerrit Teunissen General Manager, City power E-mail: [email protected] Tel: 011 490 7550/083 379 4121
o Andrew Janisch Project Manager, Sustainable Energy Africa E-mail: [email protected] Tel: 021 702 3622/ 084 995 8130
o Brian Jones Manager: Green Energy, City of Cape Town E-mail: [email protected] Tel: (021) 446 2015/ 084 219 4024
o Stephen Delport Chief Engineer: Metering, Vending and Tariffs. Ekurhuleni Metro E-mail: [email protected] Tel: 011 999 5263/ 074 585 5011
o Paul Vermeulen Manager SCADA and Load Management, City Power E-mail: [email protected] Tel: 011 490-7211/ 083 278 3903
o Shirley Salvoldi Corporate Specialist (Retail Electricity Pricing), Eskom Distribution Division E-mail: [email protected] Tel: 011 800-3058/ 083 604 1211
o Leshan Moodliar Tariff Engineer, eThekwini Metro E-mail: [email protected] Tel: 031 311 9286/ 082 926 5588
o Tyronne Ferndale Nelson Mandela Bay Municipality E-mail: [email protected] Tel: 041 392 4318/ 079 490 0077
o Dr Fritjof Boerstler GIZ-Advisor on Renewable Energy, SALGA E-mail: Tel: [email protected] 012 369 8115/ 079 923 1018
o Derek Morgan eThekwini Energy Office [email protected] Tel +27 31 311 1139 Fax: +27 31 311 1089
o Dr Daniel Marais MAC Consulting

Embedded Generation: AMEU report Page 5 of 43 5 October 2013
2. ABBREVIATIONS USED IN THIS DOCUMENT
2.1. "NERSA" – means the National Energy Regulator of South Africa
2.2. "IDM programme" – means the Integrated Demand Management programme.
2.3. "PV" – means photovoltaic cells.
2.4. "SSEG" – means small scale embedded generation.
2.5. "EG" – Embedded generation.
2.6. "NRS 097- 1" – means the grid code for systems larger than 100kW.
2.7. "NRS 097- 2" – means the grid code for systems up to 100kW.
2.8. "DST 34-1665" – means Distribution Standard for the Interconnection of Embedded Generation
(DSiEG): Installations 100kW – 1. MW
2.9. "DORA" – means the Division of Revenue Act
2.10. "RE" – means renewable energy.
2.11. "PFMA" – means Public Financial Management Act.
2.12. "MFMA" – means Municipal Financial Management Act.
2.13. "PPA" – means Power Purchase Agreement.
2.14. "IPP" – means an Independent Power Producer.
3. PURPOSE OF THE DOCUMENT The exposition of the impact that distributed (embedded) generation facilities would have on the current financial position of municipalities needs to be presented within the appropriate operating framework. For that purpose this document will provide the following:
A brief discussion of the operational aspects that need to be considered for the proper connection of embedded generation capacity to the distribution grid;
A detailed explanation of the proposed approach to assessing the financial impact that the introduction of such EG capacity would have on municipalities;
References to consult for further reading;
A case study to illustrate the rigorous simulation of a variety of EG and electricity saving initiatives on a metropolitan municipality
The background to the issue of affordability to accommodate EG on a distribution grid is presented in the next section, after which the deliverables listed above will follow in sequence.
4. BACKGROUND Municipalities and Eskom are being inundated with applications from all types of customers to allow them to install some kind of grid connected embedded generation. These applications typically include the following distributed generation alternatives:
photovoltaic arrays
gas powered generators that are utilised in co-generation or tri-generation arrangements
landfill or bio-gas generation
wind turbines
peak filling battery inverter systems
etc.
The reasons for developing these alternative energy sources are often cited as a method to deal with the constrained power generation of Eskom. The initiatives are also supported by Eskom in the way of reimbursing owners of embedded generators for providing alternative electrical energy resources, especially during peak consumption periods. Although the IDM programme of Eskom has suffered a

Embedded Generation: AMEU report Page 6 of 43 5 October 2013
financing setback with the recent reduced price escalation allowed to Eskom, the programme has been approved by NERSA. The goal of the IDM programme is to stimulate the introduction of renewable energy in order to supplement constrained electricity production capacity. EG owners can use their production capacity to either:
reduce their load requirement from the grid – no export to the grid
supplement own consumption requirements – intermittent export to the grid
wheel electricity as a third party generator – constant export to the grid
EG export to the grid may be compensated for in terms of a feed-in tariff which can vary from zero to the appropriate level, or alternatively the grid may be used as energy “bank” whereby the EG producer would earn credits for own requirements at times when the EG source cannot be used, e.g. PV during night time. In addition the IDM programme has had approval from NERSA to fund renewable energy to offset own consumption and customers are requesting the option of getting credits for energy exported onto the grid. The “banking” of electrical energy is a useful concept while the EG excess production to be absorbed in the grid is small compared to the total distribution demand. In areas where the constraint is rather due to the limitations of the local distribution network, e.g. housing estates located in areas which are reticulated for single dwelling or for agriculture supply, developers often resort to the use of peak filling inverter systems in order to supply the estates.
In general, the higher the penetration of EG in the area of supply the lower the revenue and surplus of the distributor will be. This is mainly due to the degree of sufficiency of energy supply by EG operators for own consumption. A drop in revenue, and more importantly, a reduction in surplus, can place distributors in a difficult situation when the need arises to access capital markets at reasonable costs. While it is essential for distributors to make investments in their distribution systems – investments that can enable and assist EG opportunities, as well as to ensure continued system reliability for all customers, the financing of such investments will come under pressure.
Besides the difficulty to access funds for assets maintenance, update and expansion, distributors will find it increasingly difficult to cover fixed expenses. It is important to point out that even when customers begin to generate a portion or even all of their electricity, the distributor continues to incur fixed expenses in order to provide back-up electricity service when the EG facilities aren’t operating, or aren’t meeting their full requirement.
The question concerning the maximum EG penetration that can be tolerated in the distributor’s area of supply, under specific business model conditions will be addressed in this document.
5. ASPECTS THAT NEED TO BE CONSIDERED TO ALLOW THE CONNECTION OF EMBEDDED GENERATORS
Although a distinction is often made between large and small EG resources and that the conditions for and
rules of connection to the grid may differ somewhat it is generally accepted that the following aspects need
to be considered:
Administrative issues – registration, data submission, etc.
Safety – during installation, disconnection of islands, access to circuit breakers, etc.
Security of the grid – system and operational protection
Quality of supply – impact on voltage, thermal loading, harmonics and losses
Commercial issues – metering, tariffs, etc.
Regulatory issues – legislation, etc.
These aspects will be addressed briefly below.
5.1. Safety of staff working on the network

Embedded Generation: AMEU report Page 7 of 43 5 October 2013
Embedded generation may offset own consumption but may also feed the electricity into the
electricity reticulation network. This constitutes an uncontrolled point of supply to which a network
or section of a network would be subjected. The safety of staff working on the grid could be at risk
and cannot be compromised. Thus it would be of extreme importance that embedded generation
be clearly indicated on network diagrams and on equipment in the field. Operators, electricians,
and artisan assistants need to be made aware of, and trained to be on lookout for such instances.
All embedded generators would need to comply with the codes and national standards (NRS 097-
2-1, DST 34-1665, SANS 10142-1 and Occupational Health and Safety Act). Contracts with self-
generating customers need to ensure that all the relevant conditions are complied with. Enforcement of embedded generation policies is essential.
EG-systems connected to the grid must be able to disconnect in the event that grid supply is
interrupted, in order to protect technicians who need to repair the grid. Most anti-islanding
methods typically shut PV-generation down to avoid power flowing back into the grid. However, in
certain instances, homeowners and small businesses may want to have the PV-system provide
power as a back-up supply during grid outages. Such back-up supply would require the
integration of storage and proper measures to prevent the energizing of the grid. It has to made
clear to such self-generating customers what the conditions are under which they can depend on
own supply during grid outages.
However, it is also important not to overestimate the dangers of islanding. In some countries this
has led to legislation demanding very costly, or overly sensitive anti-islanding methods. From a
technical point of view, including effective and reliable anti-islanding methods can be included in
the inverter electronics, which makes the PV-systems simpler to install and less costly.
Maintenance procedures need to be updated and technicians need to double-check voltages,
earthing, bonding, etc. before any work can commence.
5.2. Grid security and quality of supply
A number of anti-islanding methods have been developed and legislation differs in almost every
country. Theoretical studies show that islanding can only happen under very special and unlikely
circumstances, even when basic safety methods are implemented. These basic methods involve
the monitoring of grid voltage and frequency. A control unit would, under significant change of
either grid voltage or frequency, stop the PV-unit from generating electricity. These parameters
can be monitored very easily and at relatively low costs through sensing circuits in the inverter
electronics. Some countries such as the Netherlands, Germany, Switzerland and Austria have
tried this approach and report very good success.
Power conditioning protection systems that can disconnect the EG if the voltage at the point of
supply rises above the limit, are a key requirement.
Where grid connections between systems have relatively unstable quality, and where power cuts
are common, the accepted voltage and frequency fluctuations need to be adjusted to
accommodate these parameters. On this basis, national legislation and recommended cost-
effective methods need to be developed for South Africa.
Compliance of the EG in terms of the Grid Code and NRS 097-2-1 must be proved or assured by
the self-generating customer. One of the conditions for the connection agreement would be that
the customer understands and accepts the need for compliance. If the EG is found to be non-
compliant, the utility or distributor may retain the right to disconnect the customer. A signed

Embedded Generation: AMEU report Page 8 of 43 5 October 2013
certificate of compliance would ideally be required; in this regard it may be advisable to allow only
approved electricians to sign these certificates.
The NRS 097-2-3 (final WG review) should eventually provide the guidelines for compliance to all
the technical aspects of EG connection to the grid. Any costs associated with protecting the grid
may be for the cost of the generator.
5.3. Administrative issues
It is important that EG customers comply with all municipal bylaws and for that purpose it would be
beneficial to register all embedded generators. This has also been captured by NERSA in their
September 2011 communique as a requirement for the connection of embedded generators to the
grid.
It may also be a requirement from the municipality to register changes to building plans, e.g. when
PV panels need to be installed on the roofs of buildings.
The requirements from NERSA will most likely only be in terms of licensing EG installations with
capacity larger than 100 kW.
It is very important that a comprehensive Connection and Use of System Agreement be compiled
and signed by both the embedded generator and the municipality that covers all aspects of the
embedded generation. This should include, but not be limited to, financial terms such as the tariff
that will be payable by the generator, the technical terms such as safety, quality of supply,
scheduling, the maximum export capacity and the legal conditions that would apply under a
breach of contract.
Note: It seems that most embedded generators are never reported to the grid operator.
Enforcement of this requirement could be difficult.
5.4. Commercial issues
The energy produced by an independent generator would in most cases be incremental to existing
capacity. The purchase of this energy can either be by the municipality, Eskom or another
customer through a wheeling agreement.
Procurement of energy must be done in terms of the Electricity Regulation Act and the New Generation Regulations. Long term procurement has to comply with the New Generation Regulations governed by the Department of Energy, but shorter term procurement can happen subject to NERSA and PFMA or MFMA approval. Purchase by the municipality
If any EG capacity is sold to the municipality, this reduces what they would have paid Eskom for
the same energy, and provided it is at a rate equal to or lower than Eskom’s energy charges, the
municipality’s revenue would not be impacted. This aspect will be further investigated in section 6
on the potential financial impact that EG may have on municipalities.
The contracting period and amounts will be subject to the MFMA processes and NERSA approval
of the PPA.
Purchase by Eskom

Embedded Generation: AMEU report Page 9 of 43 5 October 2013
If the EG capacity is sold to Eskom, it would reduce the amount of energy that municipalities
would require from Eskom. Although the EG energy will flow directly into the municipality network,
and will in most cases be used by municipality customers, it would be owned by Eskom.
This may lead to complexity in terms of the obligation to supply specific areas by municipality
distributors. One business model that deals with the complexity allows this energy to be sold on to
the municipality at the normal Eskom energy charges, excluding losses (as the municipality’s
network is being used). If this energy is to be produced by a co-generator, the same energy would
need to be added back to the co-generator at the standard municipal rates. In this scenario the
municipality could benefit as the energy added back by Eskom is at a lower rate than the standard
Eskom tariffs.
Wheeling of energy
The term “wheeling of energy” is used when the energy which is produced at one point, is resold
at another, but transferred over a third party grid. Wheeling of energy is allowed in terms of
NERSA regulatory rules for the third party transportation of energy. Provided that the charges
associated with the delivery of energy plus all administrative charges, subsidies and surcharges
are raised, there should be no loss of revenue to the municipality for wheeling. Wheeling charges
can also be a source of revenue for municipalities.
The aforementioned NERSA rules do, however, allow that the purchasers of the wheeled energy
do not have to contribute to affordability related subsidies, which can be a cause for concern for
municipalities and this would be a direct loss of revenue.
Net-metering
The common business model adopted internationally is to compensate a self-generating customer
who feeds excess electricity into the grid by means of a feed-in tariff. However, it is also possible
that customers would request that, rather than being paid a feed-in tariff, they be credited with the
value of the excess energy produced. They could then, at a later stage when their EG production
capacity is constrained (typically night-time for PV-system owners) draw from the grid the amount
of energy equivalent to the value “banked”. As will be indicated in section 6, this approach is
feasible when the banked values are based on a tariff less than that which the customer would
pay for electricity delivered from the grid. The typical tariff would be the Eskom energy charge and
it may be combined with a fixed charge per kW EG capacity to the self-generating customer.
However, the customer is compensated, either by payment or in kind, bi-directional metering
would have to be installed to be able to measure the exported energy.
Tariffs that could apply
Current sales tariffs of municipalities often have charges which are meant to capture fixed
expenses, but all converted into a c/kWh charge.
The ideal tariff would be one where all fixed expenses are combined into a fixed charge, while the
energy charges remain variable. For customers with embedded generation this could be become
a necessity (refer to Eskom’s Genflex tariff proposal to NERSA).
There are, however challenges with raising contribution to subsidies and surcharges where energy
does not flow onto the grid i.e. cannot be measured. Mechanisms on how to manage this could
include higher rates and taxes where there is generation, measuring the generator production at
source and raising surcharges on this.
Embedded Generation: AMEU report Page 10 of 43 5 October 2013
Note that energy efficiency initiatives have the same effect as embedded generation, i.e.
customers become more energy efficient and require less energy from the municipality. The
question arises whether surcharges or taxes should also be imposed on energy efficient
appliances and lighting. This would appear to be unfair to consumers and encourages negative
behaviour with regards to energy.
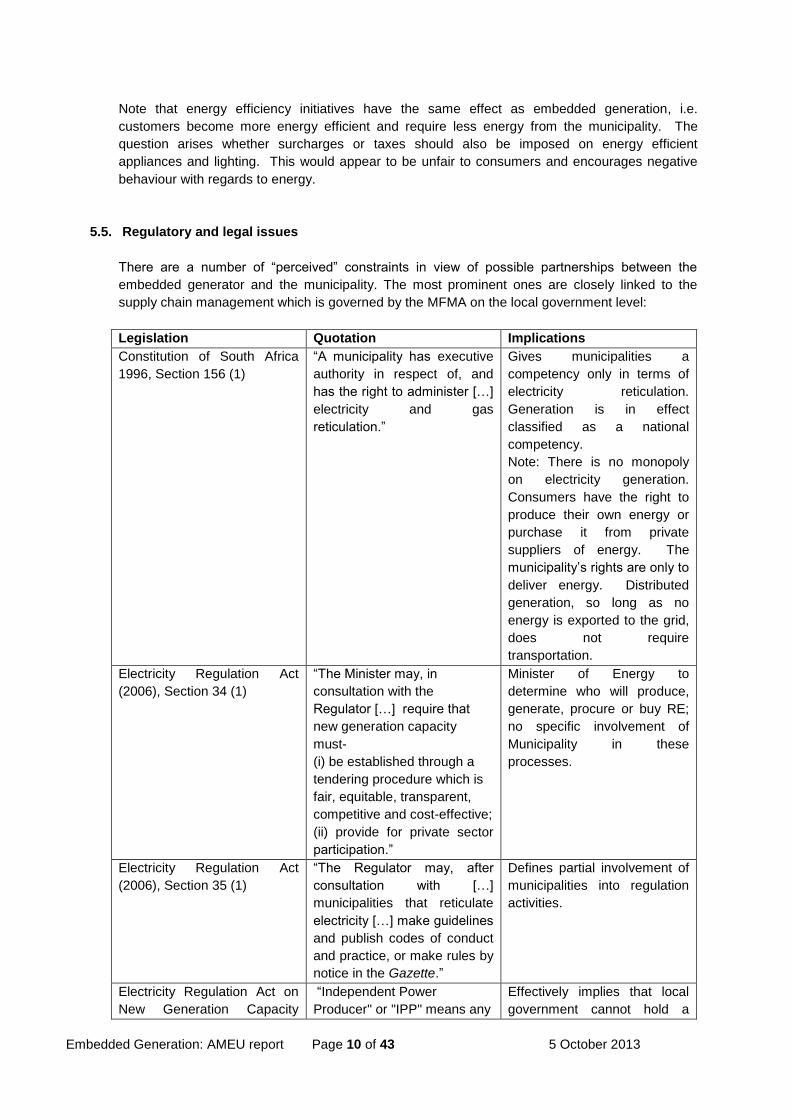
5.5. Regulatory and legal issues
There are a number of “perceived” constraints in view of possible partnerships between the
embedded generator and the municipality. The most prominent ones are closely linked to the
supply chain management which is governed by the MFMA on the local government level:
Legislation Quotation Implications
Constitution of South Africa
1996, Section 156 (1)
“A municipality has executive
authority in respect of, and
has the right to administer […]
electricity and gas
reticulation.”
Gives municipalities a
competency only in terms of
electricity reticulation.
Generation is in effect
classified as a national
competency.
Note: There is no monopoly
on electricity generation.
Consumers have the right to
produce their own energy or
purchase it from private
suppliers of energy. The
municipality’s rights are only to
deliver energy. Distributed
generation, so long as no
energy is exported to the grid,
does not require
transportation.
Electricity Regulation Act
(2006), Section 34 (1)
“The Minister may, in
consultation with the
Regulator […] require that
new generation capacity
must-
(i) be established through a
tendering procedure which is
fair, equitable, transparent,
competitive and cost-effective;
(ii) provide for private sector
participation.”
Minister of Energy to
determine who will produce,
generate, procure or buy RE;
no specific involvement of
Municipality in these
processes.
Electricity Regulation Act
(2006), Section 35 (1)
“The Regulator may, after
consultation with […]
municipalities that reticulate
electricity […] make guidelines
and publish codes of conduct
and practice, or make rules by
notice in the Gazette.”
Defines partial involvement of
municipalities into regulation
activities.
Electricity Regulation Act on
New Generation Capacity
“Independent Power
Producer" or "IPP" means any
Effectively implies that local
government cannot hold a

Embedded Generation: AMEU report Page 11 of 43 5 October 2013
(2009), Definition IPP undertaking by any person or
entity, in which the
government of South Africa
does not hold a controlling
ownership
interest (whether direct or
indirect) […]”
direct or indirect controlling
interest in an IPP.
Municipal Finance
Management Act (2003),
Section 33 (1)
“A municipality may enter into
a contract which will impose
financial obligations on the
municipality beyond a
financial year, but if the
contract will impose financial
obligations on the municipality
beyond the three years
covered in the annual budget
for that financial year, it may
do so only if …(broad
restrictions included)”
Requirements for 3 year
contract exemption might be
difficult to fulfil, especially by
smaller municipalities
(category B).
Municipal Finance
Management Act (2003),
Section 151
“Except as expressly provided
for in this Part, nothing in this
Chapter limits or affects -
(a) the rights of any creditor or
other person having a claim
against a municipality;
(b) any person’s access to
ordinary legal process in
accordance with the common
law
and relevant legislation; or
(c) the rights of a municipality
or municipal entity, or of the
parties to a contract with a
municipality or municipal
entity, to alternative dispute
resolution mechanisms, notice
procedures and other
remedies, processes or
procedures.”
Entrenches the core right of
every municipality to govern
its affairs at its own initiative.
Municipal Systems Act 2000,
Section 85 (1)
“A municipality may [...]
establish a part of the
municipality as an internal
municipal service district to
facilitate the provision of a
municipal service in that part
of the municipality.”
Gives a right to municipality to
exercise the authority vested
in it by the Constitution by
means of a private company
established by the
municipality.
Municipal Structures Act
1998, Section 84 (1)
“A district municipality has the
following functions and
powers: [...] Bulk supply of
electricity that affects a
significant proportion of
municipalities in the district.”
Bulk supply of electricity is
contradictory with the
reticulation of electricity set in
the Constitution of South
Africa 1996 Section 156 (1).
Bulk supply of electricity
meaning transmission,
Embedded Generation: AMEU report Page 12 of 43 5 October 2013
distribution and where
applicable, generation
electricity.
Note: in a joint cooperation under the South African-German Energy Programme (SAGEN) the German
International Cooperation (GIZ) and the South African Local Government Association (SALGA) are
working towards clarifying and facilitating the necessary procedures needed for enabling distributed
generation. As a first step a needs analysis study has been conducted to identify the constraints and to
develop mitigating efforts.
6. POTENTIAL FINANCIAL IMPACT OF EG ON MUNICIPALITIES In this section a simplified view of a workable business model is derived with the goal to capture most of
the commercial aspects mentioned in section 5. Rather than putting forward a rigorous simulation of all the
potential outcomes possible with the introduction of EG and the connection to a distribution grid, a simple
generic model is derived which can be used by any municipality to assess the impact that EG would have
on their financial position. In order to appreciate the mechanistic nature of the model a number of financial
terms, definitions and assumptions need to be highlighted. The model will then be presented with an
example worked up to illustrate its use. Finally the implications of the results will be discussed.
6.1. Useful financial terminology
The concept of a financial contribution is commonly understood as constituting the net variable
revenue, i.e. the difference between variable income and variable expenses. In any financial
structure the contribution, so defined, needs to be of sufficient magnitude to fund the fixed
expenses and the surplus (profit).
The fixed expenses that distributors incur can broadly be defined to cover the operating overheads
and financing costs, where the operating overheads may include personnel salaries, administrative
expenses, depreciation and amortisation, repairs and maintenance costs and general expenses.
Bad debts may be included if so desired – in the later example to illustrate the use of the model,
bad debts are included. It is argued that the bad debt liability is part and parcel of the finances of
the distributor as going concern and that it receives valuable management attention in the course
of business. For this reason it is preferable to include bad debts under the operating overheads.
In this instance the surplus is taken to be a pre-tax amount. It is generally estimated as the
difference between sales revenue and bulk purchase expenses.
It is recognised that bulk purchase costs generally include variable components, as well as semi-
variable and fixed components. The variable components are energy charges, plus subsidies and
levies, all of which are related to energy throughput and measured per kWh consumed. The fixed
charges relate to administrative and service charges and are not related to throughput, but due to
the fact of engagement between the distributor and the supplier (in this instance Eskom). The
network and demand charges are normally measure per kVA capacity and can be defined to be
semi-variable since there is often a significant (annual) lag in adjustment of the magnitudes.
In this exposition, however, the total bulk purchase expense is considered to be “variable”. This is
an approximation of reality but suits the purpose of the model as being indicative only of the true
financial impact. Similarly, the total sales revenue is taken as “variable” even though it often
contains a fixed service tariff, variable energy tariffs and also maximum demand tariffs that can be

Embedded Generation: AMEU report Page 13 of 43 5 October 2013
defined as semi-variable. The approximation of the calculated contribution is appropriate if the
period used to express magnitudes of the variables is measured over a long period of time – after
all, in the ultimate long run everything becomes variable. For the purpose of this model the period
of measurement is taken to be a year, combined with the understanding that the energy and
demand charges in the bulk purchase expense largely overshadow the fixed expenses. A similar
case can be propounded for the variability of the sales revenue over a one year period.
Grants, other income and demand-side management levies that often contribute to the total
revenue of distributors are ignored in this model. It may be argued that these revenue streams
only act as cash sources to fund the financing charges. Although it would contribute to nature of
the business of electricity distribution and reticulation, and is reflected in the income statement, it is
not dependent on the sale operation per se.
6.2. Other parameters to consider
The model requires the estimation of an average price of current sales, i.e. sales before the
introduction of EG. It is defined as the total annual sales revenue divided by the total amount of
energy sold and can be expressed in R/kWh. Similarly, an average bulk purchase cost can be
estimated from the total annual bulk purchase cost divided by the amount of energy purchased.
The difference between purchased and sold amount of energy constitutes total losses. It will also
be useful to reflect the losses in terms of technical and non-technical in nature. For the purpose of
the model the technical and non-technical loss rates need to be provided as (dimensionless)
percentages only. Besides the view on current technical losses that may be reduced with the
introduction of distributed EG, it is also necessary to state a technical loss magnitude for the EG
resources. It is expected that the technical losses of the EG will increase with market penetration
while the current technical losses will decline. The combined effect is simulated in the model.
The model further requires the use of a feed-in tariff for EG which will be measured in R/kWh units,
as well as a fixed tariff which can be measured in the units of R/kW installed capacity (say R/kW
panel for PV-installations).
In order to determine the impact of excess EG production that needs to be accommodated in the
grid, it is necessary to define one more parameter, i.e. one which reflects the proportion of the
excess EG capacity absorbed in the grid to the amount demanded by customers who are not self-
generating, or self-generating customers that cannot supply the own needs in full.
6.3. Model design
The design of the model is based on the “purchase by municipality” scenario discussed in section
5.4. Although it is derived from this scenario it can easily be adjusted to reflect the equivalent
“purchase by Eskom” scenario.
Although the potential revenue reduction due to the introduction of EG is often stated as the main
concern of municipalities, in this model the contribution is the main driver towards profitability. The
ultimate measure is the surplus that a distributor/municipality can generate from the contribution.
As soon as the surplus is depleted, the deficiency in contribution will result in the enterprise not
being able to fund fixed expenses. This will lead to bankruptcy unless the municipality is propped
up financially by external institutions. Self-sustainability is therefore reflected in the capability to
generate a sufficiently large contribution.
For the purpose of design four entities are taken as being related, i.e. the (i) utility that usually
supplies the energy which the (ii) distributor “transmits” to the customers with (iii) EG capacity and
Embedded Generation: AMEU report Page 14 of 43 5 October 2013
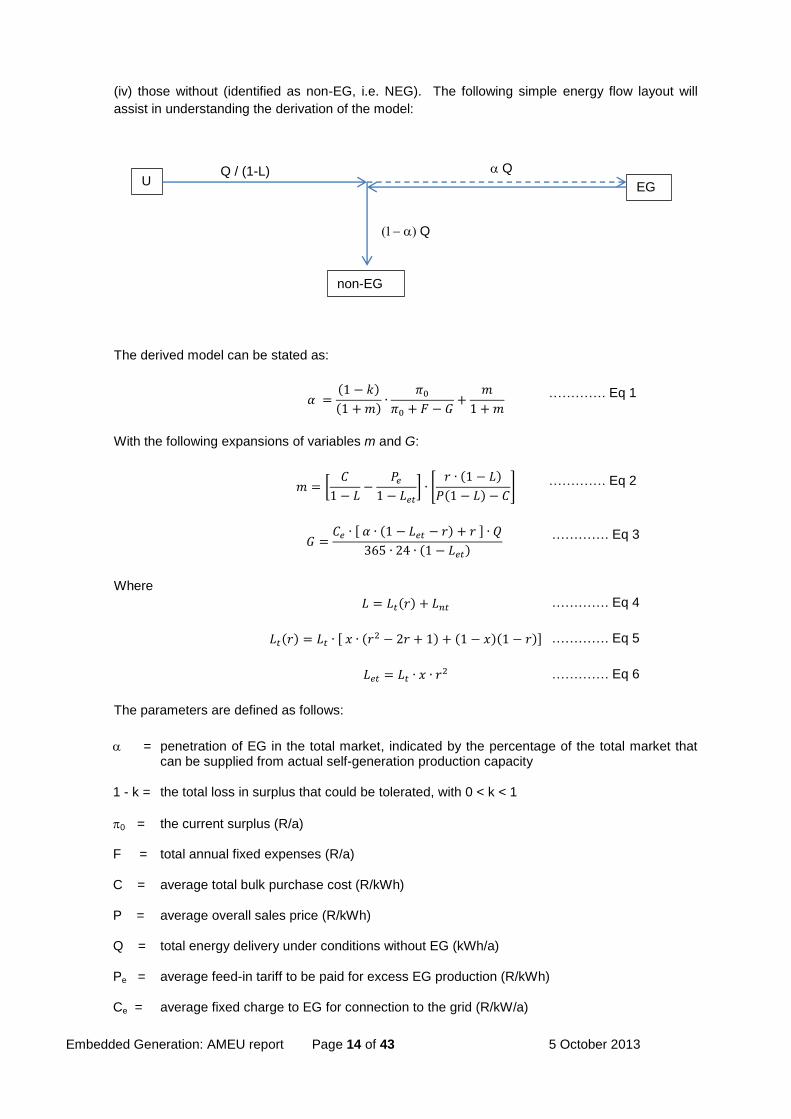
(iv) those without (identified as non-EG, i.e. NEG). The following simple energy flow layout will
assist in understanding the derivation of the model:
The derived model can be stated as:
( )
( )
With the following expansions of variables m and G:
[
] [ ( )
( ) ]
[ ( ) ]
( )
Where
( )
( ) [ ( ) ( )( )]
The parameters are defined as follows:
= penetration of EG in the total market, indicated by the percentage of the total market that can be supplied from actual self-generation production capacity
1 - k = the total loss in surplus that could be tolerated, with 0 < k < 1
0 = the current surplus (R/a) F = total annual fixed expenses (R/a) C = average total bulk purchase cost (R/kWh) P = average overall sales price (R/kWh) Q = total energy delivery under conditions without EG (kWh/a) Pe = average feed-in tariff to be paid for excess EG production (R/kWh) Ce = average fixed charge to EG for connection to the grid (R/kW/a)
…………. Eq 1
…………. Eq 2
…………. Eq 3
…………. Eq 4
…………. Eq 5
…………. Eq 6
U EG
non-EG
Q
Q
Q / (1-L)

Embedded Generation: AMEU report Page 15 of 43 5 October 2013
L = total losses (% of bulk purchase) Lt = overall technical losses under conditions without EG (% of bulk purchase) Lnt = overall non-technical losses under conditions without EG (% of bulk purchase) Let = technical losses from supply by EG (% of excess EG production absorbed by the grid) x = variable fraction of overall technical losses r = the ratio of excess EG production absorbed in the grid to the total demand by non-EG
consumers Lt(r) = overall technical losses under conditions with EG (% of bulk purchase) Equation 1 is structured to indicate the proportion of total current energy supply that can be
supplied by EG producers for own use. This can be seen as the “maximum penetration” of EG in
the current market that can be tolerated at the proposed feed-in tariff and fixed charge on total
installed EG capacity. In this form it is required to provide the loss in (current) surplus that may be
tolerated by the municipality, eg. if a loss of 25% can be tolerated, then (1 – k) = 0.25
If so preferred, equation 1 can be rewritten to allow the loss in surplus to be the dependent
variable:
( ) [ ( ) ]
In this instance it would be required to take a view on the EG penetration level that would apply, eg.
at an assumed penetration level of 15%, it is necessary to set = 0.15
For the convenience of the reader, this model has been coded in MS Excel and will be provided on
a CD with the report. It can also be obtained from Dr DJ Marais at [email protected] or Mr
Gerrit Teunissen at [email protected].
It would be required to allow iterative calculations in Excel by ticking the box “Enable iterative
calculation” in the File >> Options >> Formulas dialog box.
The interested reader can obtain the derivation of the model (equations 1 through 7) from Dr DJ
Marais at [email protected]
6.4. Example to illustrate the use of the model
The following information would be required as input to the model:
Total energy demand, including the demand of self-generating customers, measured in
kWh per annum
Total sales revenue derived from delivery on the total demand estimated above, measured
in R per annum
Total bulk purchase cost, measured in R per annum
Total bulk purchase energy amount, measured in kWh per annum
The current fixed expenses, measured in R per annum
The total technical losses of the distribution system, as a percentage
The total non-technical losses associated with the distribution business, as a percentage
…………. Eq 7

Embedded Generation: AMEU report Page 16 of 43 5 October 2013
Note that this information can be obtained quite easily from the distributor’s financial and
management accounts.
It is also required to have a view on the following information which relates to the introduction of
EG to the grid:
Total loss in surplus that can be tolerated by the municipality, as a percentage
The variable component of technical losses, which typically ranges from two-thirds to three-
quarters of the total technical losses
The proportion of the non-EG demand that would be supplied by excess EG production
which is fed back into the grid
The feed-in tariff that could be offered to EG producers
The average fixed charge that would apply to EG producers
The case of City Power is selected here to illustrate the use of the model. The purpose is to
determine the maximum EG penetration levels that can be allowed at certain given financial and
operating conditions.
The following information items were collected from their FY2013/14 budget:
Total energy demand:
Q = 11 421 953 273 kWh/a
Total sales revenue of R13 276 318 285, from which the average sales price is determined
to be:
P = 13 276 318 285 / 11 421 953 273 = R1,162 per kWh
Total bulk purchase cost of R 9 608 989 845 for the year
Total bulk purchase energy amount of 13 225 402 889 kWh/a, from which the average bulk
purchase cost is estimated to be:
C = R 0,727 per kWh
The current fixed expenses are R 3 266 747 000 for the year:
F = R 3 266 747 000
The current surplus level is estimated to be:
0 = 13 276 318 285 – 9 608 989 845 – 3 266 747 000 = R400 581 440
The total technical losses of the distribution system is generally assumed to be:
Lt = 9%
The total non-technical losses associated with the distribution business is estimated to be:
Lnt = 4,6%
The following views would apply:
Total loss in surplus that can be tolerated by the municipality is assumed to be 100%, i.e.
(1 – k) = 1,00
This will indicate the absolute maximum EG penetration that could be allowed before City
Power runs into the situation where fixed costs cannot be paid anymore.
The variable component of technical losses is assumed to be two-thirds of the total
technical losses, i.e.
x = 0,667
The proportion of the non-EG demand that would be supplied by excess EG production
which is fed back into the grid is assumed to be 10%, i.e.
r = 0,10
The feed-in tariff allowed is assumed to be the same as the average cost of the bulk
purchase, i.e.
Pe = C = R 0,727 per kWh
No fixed charge is applied, i.e.
Ce = R 0,00/kW installed per year.
Embedded Generation: AMEU report Page 17 of 43 5 October 2013
This yields the worst case scenario for City Power.
If these values are plugged into the model to estimate the parameters Let, Lt(r), L, G and m from
equations 2 to 6, the maximum allowed EG penetration () can be estimated from equation 1.
Note that G is also dependent on ; the values for G and thus need to estimated iteratively.
Once the iterative calculation reaches equilibrium, it is found that City Power can allow 13,5% of
the current market capacity in its area of supply to be eliminated by the installation of EG for own
use.
As a sensitivity, one could require a fixed EG charge to apply, such that Ce = R1 606/kW/a, which
amounts to R4,40/kW/day. This fixed income would equate to the total expected expenditure on
repair & maintenance for the year and will thus reduce the total fixed expenses to be funded from
the contribution by that amount. The maximum EG penetration that can then be allowed in this
case would be 15,2% of current market capacity.
As a further sensitivity, one could assume all of the above conditions and adjust the feed-in tariff to
zero, i.e. Pe = R 0,00/kWh. This scenario will yields a maximum allowable EG penetration of
31,0%.
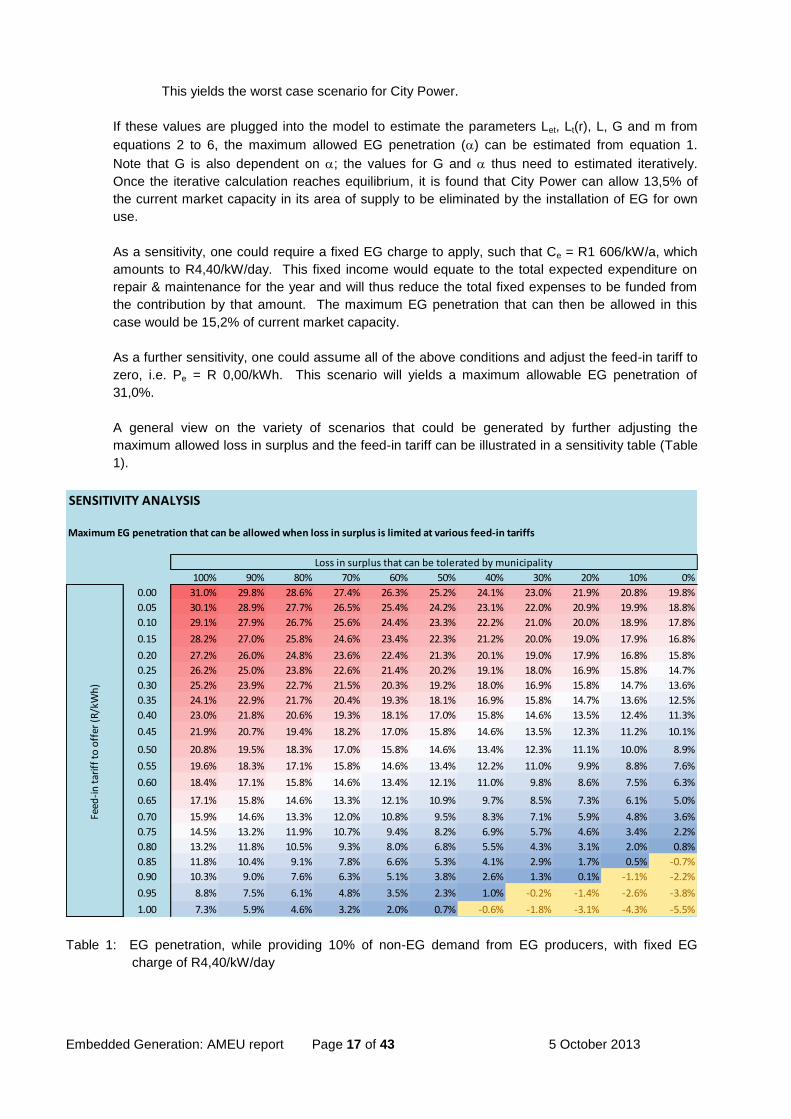
A general view on the variety of scenarios that could be generated by further adjusting the
maximum allowed loss in surplus and the feed-in tariff can be illustrated in a sensitivity table (Table
1).
Table 1: EG penetration, while providing 10% of non-EG demand from EG producers, with fixed EG
charge of R4,40/kW/day
SENSITIVITY ANALYSIS
Maximum EG penetration that can be allowed when loss in surplus is limited at various feed-in tariffs
100% 90% 80% 70% 60% 50% 40% 30% 20% 10% 0%
0.00 31.0% 29.8% 28.6% 27.4% 26.3% 25.2% 24.1% 23.0% 21.9% 20.8% 19.8%
0.05 30.1% 28.9% 27.7% 26.5% 25.4% 24.2% 23.1% 22.0% 20.9% 19.9% 18.8%
0.10 29.1% 27.9% 26.7% 25.6% 24.4% 23.3% 22.2% 21.0% 20.0% 18.9% 17.8%
0.15 28.2% 27.0% 25.8% 24.6% 23.4% 22.3% 21.2% 20.0% 19.0% 17.9% 16.8%
0.20 27.2% 26.0% 24.8% 23.6% 22.4% 21.3% 20.1% 19.0% 17.9% 16.8% 15.8%
0.25 26.2% 25.0% 23.8% 22.6% 21.4% 20.2% 19.1% 18.0% 16.9% 15.8% 14.7%
0.30 25.2% 23.9% 22.7% 21.5% 20.3% 19.2% 18.0% 16.9% 15.8% 14.7% 13.6%
0.35 24.1% 22.9% 21.7% 20.4% 19.3% 18.1% 16.9% 15.8% 14.7% 13.6% 12.5%
0.40 23.0% 21.8% 20.6% 19.3% 18.1% 17.0% 15.8% 14.6% 13.5% 12.4% 11.3%
0.45 21.9% 20.7% 19.4% 18.2% 17.0% 15.8% 14.6% 13.5% 12.3% 11.2% 10.1%
0.50 20.8% 19.5% 18.3% 17.0% 15.8% 14.6% 13.4% 12.3% 11.1% 10.0% 8.9%
0.55 19.6% 18.3% 17.1% 15.8% 14.6% 13.4% 12.2% 11.0% 9.9% 8.8% 7.6%
0.60 18.4% 17.1% 15.8% 14.6% 13.4% 12.1% 11.0% 9.8% 8.6% 7.5% 6.3%
0.65 17.1% 15.8% 14.6% 13.3% 12.1% 10.9% 9.7% 8.5% 7.3% 6.1% 5.0%
0.70 15.9% 14.6% 13.3% 12.0% 10.8% 9.5% 8.3% 7.1% 5.9% 4.8% 3.6%
0.75 14.5% 13.2% 11.9% 10.7% 9.4% 8.2% 6.9% 5.7% 4.6% 3.4% 2.2%
0.80 13.2% 11.8% 10.5% 9.3% 8.0% 6.8% 5.5% 4.3% 3.1% 2.0% 0.8%
0.85 11.8% 10.4% 9.1% 7.8% 6.6% 5.3% 4.1% 2.9% 1.7% 0.5% -0.7%
0.90 10.3% 9.0% 7.6% 6.3% 5.1% 3.8% 2.6% 1.3% 0.1% -1.1% -2.2%
0.95 8.8% 7.5% 6.1% 4.8% 3.5% 2.3% 1.0% -0.2% -1.4% -2.6% -3.8%
1.00 7.3% 5.9% 4.6% 3.2% 2.0% 0.7% -0.6% -1.8% -3.1% -4.3% -5.5%
Loss in surplus that can be tolerated by municipality
Feed
-in
tar
iff
to o
ffer
(R
/kW
h)
Embedded Generation: AMEU report Page 18 of 43 5 October 2013
Naturally, negative values for the EG penetration would be meaningless and these are indicated in
yellow. These values would indicate infeasible scenarios where the fixed expenses cannot be
funded from contributions while maintaining the required surplus levels.
From Table 1 it is possible to find the 15,2% maximum EG penetration that can be allowed
mentioned above. In the column indicating the allowed surplus loss of 100%, and the row
indicating a feed-in tariff of 70c/kWh, it is found that the maximum EG penetration would be 15,9%.
Similarly, in the 100% column and the row indicating a feed-in tariff of 75c/kWh, the maximum EG
penetration is found to be 14,5%. The value actually used for Pe was 72,7c/kWh, which falls
between 70c/kWh and 75c/kWh. The estimated value of 15,2% would thus be obtained from
interpolating between the 14,5% and 15,9% read from the table.
Note that similar tables can be obtained from the Excel model that accompanies this guideline
report by simply changing the input conditions.
6.5. Further implications of example results
As indicated above, the model was derived for the case reflecting the purchase of EG capacity by
the municipality. If the EG capacity would be purchased by the utility supplier (Eskom), and the
excess EG production sold on to the distributor at marginal value (energy charge only), it can be
interpreted as a determinant of the Pe-value for the distributor.
In City Power’s case it would have amounted to a Pe of R0,44/kWh to R0,45/kWh, which would
have been less than the initially assumed average bulk purchase tariff of R0,727/kWh. From Table
1, assuming an allowed total loss of surplus, the maximum EG penetration would have increased
from 15,2% to 21,9% at a feed-in tariff of R0,45/kWh. If the feed-in tariff is maintained at
R0,45/kWh, the maximum allowable EG penetration of ~15% can be obtained at an allowed loss in
surplus of ~45% (interpolated between the columns for 40% and 50% in the table). Thus, by
reducing the feed-in tariff, one can obtain a similar EG penetration limit while the surplus loss is
reduced from 100% to about 45%.
It should be noted that the impact of energy saving devices can also be addressed in the above
model. In such cases, there is no feed-in of excess production to be expected (r = 0), no feed-in
tariff or EG fixed charges would apply (Pe = 0, Ce = 0).
From a given (assumed) maximum penetration of the potential market demand (which excludes
energy saving devices), the implied losses can be determined by using equation 7 rather than
equation 1 above, as these two equations express the same identity, just in different formats.
6.6. Supplementing the model
Even though the above model is based on averages and assumptions concerning the variability of
sales revenue and bulk purchase costs, it can already provide a reasonable proxy of what can be
expected from the introduction of EG in the supply areas of distributors. It utilises a delayed time
dimension and yields results that could drive broad strategic decision-making.
However, the model is not meant to be used when evaluating specific operational or financial
investment decisions, eg. price negotiations with EG producers. In such cases it would be prudent
to work up cash flow cases as provided by Trollip (2012) and SEA in appendix A. Such models are
of a simulation type and can be made quite rigorous, reflecting the real scenario at hand. Very
short unit time dimensions can also be employed in such cases, i.e. one can typically determine
the impact rigorously over periods ranging from days to years.

Embedded Generation: AMEU report Page 19 of 43 5 October 2013
7. CONCLUSIONS
As the price of electricity escalates in South Africa while supply constraints remain, it becomes lucrative for
customers to implement energy saving and self-generating capacity. This will result, not only in a reduction
of the footprint of supply by distributors, but will also require the accommodation of excess electricity
produced by such self-generating customers. The fact that embedded generation cannot necessarily be
offered at a consistent level (PV installations) complicates the situation for the distributors as the grid facility
cannot be reduced if customers need to draw from and supply to the distribution system.
Safety is of paramount importance when connecting distributed generation capacity to the grid and
compliance to various codes will have to be enforced.
Security and the quality of grid supply cannot be compromised by connecting EG to allow feeding in of
excess production and need to be monitored diligently.
A variety of “perceived” constraints in view of possible partnerships between the embedded generator and
the municipality are governed by the MFMA on the local government level. The distributor needs to
consider a host of legislative aspects that would regulate the incorporation of EG in the current distribution
system management.
The commercial aspects relating to the introduction of EG into the distribution system culminates in the
financial impact it would have on the profitability of municipalities. Strategic decisions by distributors and
municipalities will be driven by the business impact that EG would have on operations and the financial
situation. For that purpose it is required that an assessment of the potential financial impact be made
available to guide the focus when negotiating prices with EG owners and designing business models for
the future which will ensure the quality and availability of the distribution networks. A simplified model has
been provided whereby municipalities can assess their own vulnerability.
A variety of tariff models can be accommodated, ranging from the “banking” of energy value to a simple
feed-in tariff for excess EG production. The introduction of a fixed tariff relating to the installed EG capacity
has also been addressed.
This provides a means of quantifying the portion of surplus lost through embedded generation and energy
efficiency measures within a municipality. The calculation could be audited by an independent third party,
following on which a request for a financial allocation (in line with the calculated figure) could be made to
National Treasury. Equivalent financial support could thus be provided to the affected municipality through,
for example, the National Treasury led 'Cities Support Programme'. Allocations could also be made directly
through the Division of Revenue Act (DORA) on an annual basis, in order to compensate municipalities for
lost revenue.
National Treasury is supporting a programme of 'environmental fiscal reform' in South Africa, and is also
concerned about the cost of new coal-fired powers stations in South Africa, and thus may be in favour of
such an approach.
By adopting this overall method, municipalities can support embedded generation, overall electricity system
health and economic growth, while being provided equivalent financial assistance for infrastructure
development and other key programmes.
Embedded Generation: AMEU report Page 20 of 43 5 October 2013
8. REFERENCES
The following references may further benefit the reader:
8.1 Fowler P (2013), Technical aspects of grid integration of renewable energy, presentation made on
behalf of AMEU at GIZ-SALGA Workshop held at SALGA HQ, Menlyn Park, Pretoria on 25 July
2013. Presentation obtainable from Peter Fowles at: [email protected]
8.2 Van Zyl SJ (2011), Eskom Standard: Distribution standard for the Interconnection of embedded
generation, Doc Ref 34-1765, originally published in March 2008, revised in March 2011,
http://www.eskom.co.za/content/DistributionStandardInterconnectionEmbeddedGeneration.pdf,
accessed on 17/7/2013.
8.3 Abrahams Y, et al. (2013) Smart electricity planning, published by The Electricity Governance
Initiative of South Africa, http://irp2.files.wordpress.com/2013/05/smartelectricityplanningreport-
06052013.pdf, accessed on 17/7/2013.
8.4 Jenkins N, et.al. (2000) Embedded generation, IEE Power and Energy Series 31.
8.5 Trollip H, et.al. (2012) Potential impact on municipal revenue of small scale own generation and
energy efficiency, submitted to the South African Economic Regulators Conference held in Pretoria
on 21-22 August 2012, http://www.nersa.org.za/SAERC/Documents/SAERC/Hiltop%20Trollip.pdf,
accessed on 21/08/2013.
8.6 Wikipedia article on feed-in tariffs, http://en.wikipedia.org/wiki/Feed-in_tariff, accessed on
21/08/2013.
8.7 The South African Grid Code (2008), The Network Code, Version 7.0, March 2008, obtainable from:
http://www.nersa.org.za/Admin/Document/Editor/file/Electricity/Compliance%20Monitoring/SAGC%2
0Network%20Version%207_March%202008.pdf, accessed 21/08/2013.
8.8 RSA Grid Code Secretariat (2012), Grid Connection Code for Renewable Power Plants (RPPs)
Connected to the Transmission System (TS) or the Distribution System (DS) in South Africa, Version
2.6, November 2012, obtainable from:
http://www.nersa.org.za/Admin/Document/Editor/file/Electricity/TechnicalStandards/South%20African
%20Grid%20Code%20Requirements%20for%20Renewable%20Power%20Plants%20-
%20Vesion%202%206.pdf, accessed 21/08/2013.
8.9 Standard Conditions for Embedded Generation within Municipal Boundaries, obtainable from:
http://www.greenbusinessguide.co.za/wp-content/uploads/2011/01/RFD-Embedded-Generation.pdf,
accessed 21/08/2013.
8.10 The City of Cape Town Electricity Services (2011), Electrical Requirements for Embedded
Generation (EG), http://www.sapvia.co.za/wp-content/uploads/2011/10/ElectricalRrequirements-for-
Embedded-Generation-29-07-11.pdf, accessed 21/08/2013.
8.11 Eskom Standardization Section (2010), NRS 097-2-1:2010 Grid Interconnection of Embedded
Generation, ed.1, ISBN 978-0-626-25101-7, http://www.solarwholesale.co.za/NRS%20097-2-1.pdf,
accessed 21/08/2013.
8.12 Salvoldi S et.al. (2012), Small scale embedded generation (SSEG) grid connection – Eskom
experience and input,
Embedded Generation: AMEU report Page 21 of 43 5 October 2013
http://www.cityenergy.org.za/files/resources/generation_workshop/Embedded%20Generation%20Es
kom%20Experience%20and%20Inputs.pdf, accessed 21/08/2013.
8.13 The SABS (2012), SANS 10142-1:2012, The Wiring of Premises, ed.1.8, ISBN 978-0-626-26767-4,
https://www.sabs.co.za/content/uploads/files/SANS10142-1%28Amdt8%29.pdf, accessed
21/08/2013.
8.14 Eskom (2012), Small Scale Renewable energy Standards and Specifications,
http://www.eskomidm.co.za/docs/renewable_energy/20120531_Standards_and_Specs.pdf,
accessed 21/08/2013.
Embedded Generation: AMEU report Page 22 of 43 5 October 2013
9. APPENDIX A
Case Study: Impact of localised Energy Efficiency
(EE) and Renewable Energy (RE) on City Power finances
over the next 10 years
Prepared by
with funding from
September 2013 DRAFT
10. CONTENTS Executive Summary ................................................................................................. 24 Overview of issue ..................................................................................................... 26 Technology uptake ................................................................................................... 27
Market for RE and EE Technology and uptake projections ............................................................... 28
Financial cases for interventions by technology ........................................................................... 28
Impact of RE and EE on City Power Finances ......................................................... 36 Business as Usual .............................................................................................................................. 36
Sub-scenarios of BAU .................................................................................................................... 39

Embedded Generation: AMEU report Page 23 of 43 5 October 2013
Load Shifting Scenarios ..................................................................................................................... 40
Load shifting scenario 1: PV users ..................................................................................................... 41
Load shifting scenario 2: ToU tariff causing all customers to load shift ........................................... 41
Conclusions ............................................................................................................. 41
Embedded Generation: AMEU report Page 24 of 43 5 October 2013
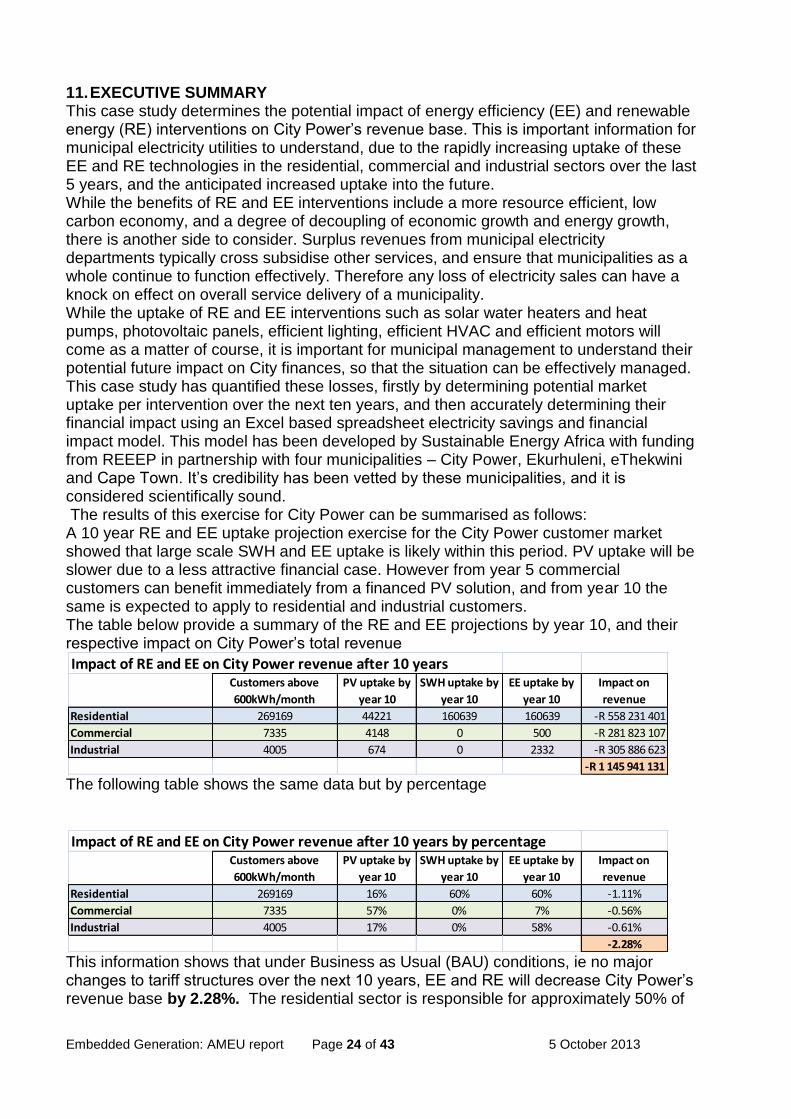
11. EXECUTIVE SUMMARY This case study determines the potential impact of energy efficiency (EE) and renewable energy (RE) interventions on City Power’s revenue base. This is important information for municipal electricity utilities to understand, due to the rapidly increasing uptake of these EE and RE technologies in the residential, commercial and industrial sectors over the last 5 years, and the anticipated increased uptake into the future. While the benefits of RE and EE interventions include a more resource efficient, low carbon economy, and a degree of decoupling of economic growth and energy growth, there is another side to consider. Surplus revenues from municipal electricity departments typically cross subsidise other services, and ensure that municipalities as a whole continue to function effectively. Therefore any loss of electricity sales can have a knock on effect on overall service delivery of a municipality. While the uptake of RE and EE interventions such as solar water heaters and heat pumps, photovoltaic panels, efficient lighting, efficient HVAC and efficient motors will come as a matter of course, it is important for municipal management to understand their potential future impact on City finances, so that the situation can be effectively managed. This case study has quantified these losses, firstly by determining potential market uptake per intervention over the next ten years, and then accurately determining their financial impact using an Excel based spreadsheet electricity savings and financial impact model. This model has been developed by Sustainable Energy Africa with funding from REEEP in partnership with four municipalities – City Power, Ekurhuleni, eThekwini and Cape Town. It’s credibility has been vetted by these municipalities, and it is considered scientifically sound. The results of this exercise for City Power can be summarised as follows: A 10 year RE and EE uptake projection exercise for the City Power customer market showed that large scale SWH and EE uptake is likely within this period. PV uptake will be slower due to a less attractive financial case. However from year 5 commercial customers can benefit immediately from a financed PV solution, and from year 10 the same is expected to apply to residential and industrial customers. The table below provide a summary of the RE and EE projections by year 10, and their respective impact on City Power’s total revenue
The following table shows the same data but by percentage
This information shows that under Business as Usual (BAU) conditions, ie no major changes to tariff structures over the next 10 years, EE and RE will decrease City Power’s revenue base by 2.28%. The residential sector is responsible for approximately 50% of
Impact of RE and EE on City Power revenue after 10 yearsCustomers above
600kWh/month
PV uptake by
year 10
SWH uptake by
year 10
EE uptake by
year 10
Impact on
revenue
Residential 269169 44221 160639 160639 -R 558 231 401
Commercial 7335 4148 0 500 -R 281 823 107
Industrial 4005 674 0 2332 -R 305 886 623
-R 1 145 941 131
Impact of RE and EE on City Power revenue after 10 years by percentageCustomers above
600kWh/month
PV uptake by
year 10
SWH uptake by
year 10
EE uptake by
year 10
Impact on
revenue
Residential 269169 16% 60% 60% -1.11%
Commercial 7335 57% 0% 7% -0.56%
Industrial 4005 17% 0% 58% -0.61%
-2.28%

Embedded Generation: AMEU report Page 25 of 43 5 October 2013
the losses, while the commercial and industrial sectors account for approximately 25% each. This is a substantial figure, and municipal management will need to come up with strategies to absorb the loss. A sensitivity analysis using was performed on these figures which indicated that the losses could be as low as 1.5% if the projected uptake of PV and SWHs is halved, or as much as 3.6% if the projected uptake of these components is doubled. A 0% increase in electricity sales into the future increases the revenue impact to 3.1%. The case study also shows that losses can be managed through strategies such as implementing fixed daily charge for grid connected PV systems with an accompanying decreased energy charge, or by implementing a residential Time of Use (ToU) tariff. This case study shows that the potential future impact of RE and EE on municipal finances is significant, and will continue to grow with time. Clearly management strategies will need to be developed into the future to accommodate these losses.
It should be noted that the tool developed to calculate the impact of RE and EE on municipal finances is freely available from Sustainable Energy Africa. It can be easily modified to apply to municipalities other than those already modelled. For more information please contact us by email at [email protected] or at 021-7023622.
Sustainable Energy Africa is a not-for-profit organization supporting cities and other institutions with sustainable energy transitions
Embedded Generation: AMEU report Page 26 of 43 5 October 2013
12. OVERVIEW OF ISSUE Over the past 5 years, the market for energy efficient products in the lighting, water heating, HVAC, electric motor, variable speed drive and power factor correction products has increased significantly. At the same time there has been a marked increased interest from residential and commercial sector in installing rooftop photovoltaic panels (PV) for own use. This increase in uptake has been a result of
1. rapidly increasing electricity prices due to Eskom’s new build programme for two more
coal fired power stations – Kusile and Medupi.
2. Eskom’s increased efforts to implement demand side management (DSM) to assist in
relieving the pressure from the grid. This has been implemented through several financial
incentive schemes to encourage uptake of EE products in the residential, commercial and
industrial sectors.
3. Increased awareness raised through electricity savings campaigns run by Eskom, local and
national government.
These factors, coupled with a slower economy, have made a marked impact on levels of electricity use in South Africa. For the first time in 2012/3, annual electricity usage for the country dropped, and several Metro electricity departments have reported a drop in electricity sales over the last 1 to 4 years. Also for the first time, analysts are seeing that economic growth is increasing within the context of this lack of electricity growth, implying a degree of decoupling of these two indicators which in the past were joined at the hip. While this situation must be viewed positively from a sustainable development perspective due to a more efficient economy, reduced impact on natural resources and a low carbon growth path, there is another condition to consider: In South African cities, the distribution of electricity to customers is a function of local government, and to a smaller degree Eskom. Local government finances have been set up in such a way that surplus income from their electricity service (and to a smaller degree their water service) is needed to balance the municipal books. Figure 1 below indicates this graphically for a typical municipality. The red line is the rates account, which does not cover the costs of running the municipality’s other functions. Electricity and water effectively cross subsidise these. Many of these functions are linked to poverty alleviation and social upliftment and include: health clinics, housing, refuse removal, waste water removal, public lighting, roads and public recreation areas.

Embedded Generation: AMEU report Page 27 of 43 5 October 2013
Figure 1
Furthermore, informal settlements are growing in South African Cities, and there is increasing pressure for local government to provide safe electricity to these communities at subsidised rates.
The question which arises then is: If electricity revenue drops as a result of increased uptake levels of RE and EE in the residential, commercial and industrial sectors, while there is an increased demand for subsidised low income electrification into the future, what will the overall impact be on service delivery within a municipality? This report sets out to answer this question using City Power as a case study 13. TECHNOLOGY UPTAKE In order to understand the potential uptake of RE and EE technology in the City Power distribution area, the market size and the financial case for each of the interventions needs to be considered. For market size, we will use a summary assessment of current
-1,000
-800
-600
-400
-200
-
200
400
600
800
2010 2011 2012 2013 2014 2015 2016 2017 2018 2019
R m
illio
ns
Annual financial surplus/shortfall per service
Water
Electricity
What happens when
electricity revenue drops such that city
books can’t balance?
Low income electrified
Med income (elec)
Hi income (elec)
Household growth projectionsShowing the potential growth in the
informal sector if current trends continue
Low income unelectrified(informal)
Embedded Generation: AMEU report Page 28 of 43 5 October 2013
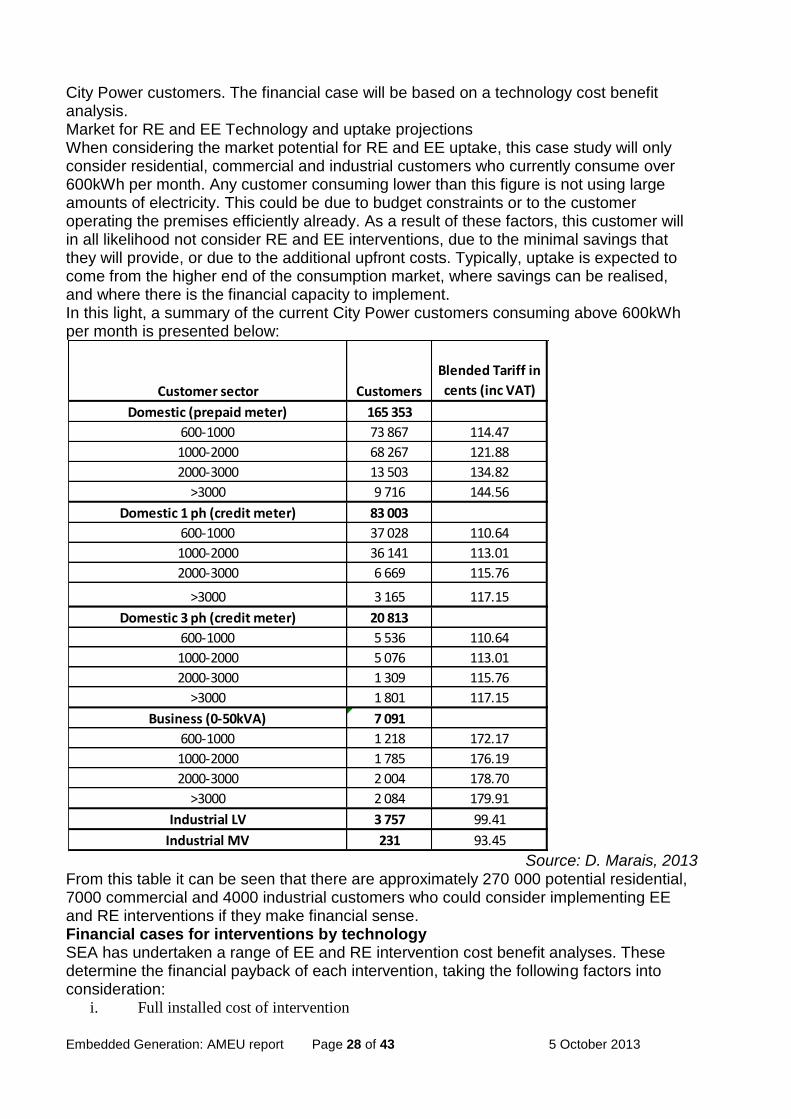
City Power customers. The financial case will be based on a technology cost benefit analysis. Market for RE and EE Technology and uptake projections When considering the market potential for RE and EE uptake, this case study will only consider residential, commercial and industrial customers who currently consume over 600kWh per month. Any customer consuming lower than this figure is not using large amounts of electricity. This could be due to budget constraints or to the customer operating the premises efficiently already. As a result of these factors, this customer will in all likelihood not consider RE and EE interventions, due to the minimal savings that they will provide, or due to the additional upfront costs. Typically, uptake is expected to come from the higher end of the consumption market, where savings can be realised, and where there is the financial capacity to implement. In this light, a summary of the current City Power customers consuming above 600kWh per month is presented below:
Source: D. Marais, 2013
From this table it can be seen that there are approximately 270 000 potential residential, 7000 commercial and 4000 industrial customers who could consider implementing EE and RE interventions if they make financial sense. Financial cases for interventions by technology SEA has undertaken a range of EE and RE intervention cost benefit analyses. These determine the financial payback of each intervention, taking the following factors into consideration:
i. Full installed cost of intervention
Customer sector Customers
Blended Tariff in
cents (inc VAT)
Domestic (prepaid meter) 165 353
600-1000 73 867 114.47
1000-2000 68 267 121.88
2000-3000 13 503 134.82
>3000 9 716 144.56
Domestic 1 ph (credit meter) 83 003
600-1000 37 028 110.64
1000-2000 36 141 113.01
2000-3000 6 669 115.76
>3000 3 165 117.15
Domestic 3 ph (credit meter) 20 813
600-1000 5 536 110.64
1000-2000 5 076 113.01
2000-3000 1 309 115.76
>3000 1 801 117.15
Business (0-50kVA) 7 091
600-1000 1 218 172.17
1000-2000 1 785 176.19
2000-3000 2 004 178.70
>3000 2 084 179.91
Industrial LV 3 757 99.41
Industrial MV 231 93.45
Embedded Generation: AMEU report Page 29 of 43 5 October 2013
ii. Current tariff specific to sector (residential, commercial, industrial)
iii. Tariff increase of 8% per year
iv. Financial attractiveness of the intervention to the end user based on
a. Cash up front repayment
b. bond repayment (8.5% interest over 10 years)
c. retail bank loans (18% over 5 yrs)
An intervention which should enjoy market uptake is assumed to be either i. one which pays back in under 3 years or
ii. one which can be financed to achieve net savings within the first few years of installation
ie monthly finance repayment costs are equal to or less than energy savings from the
intervention
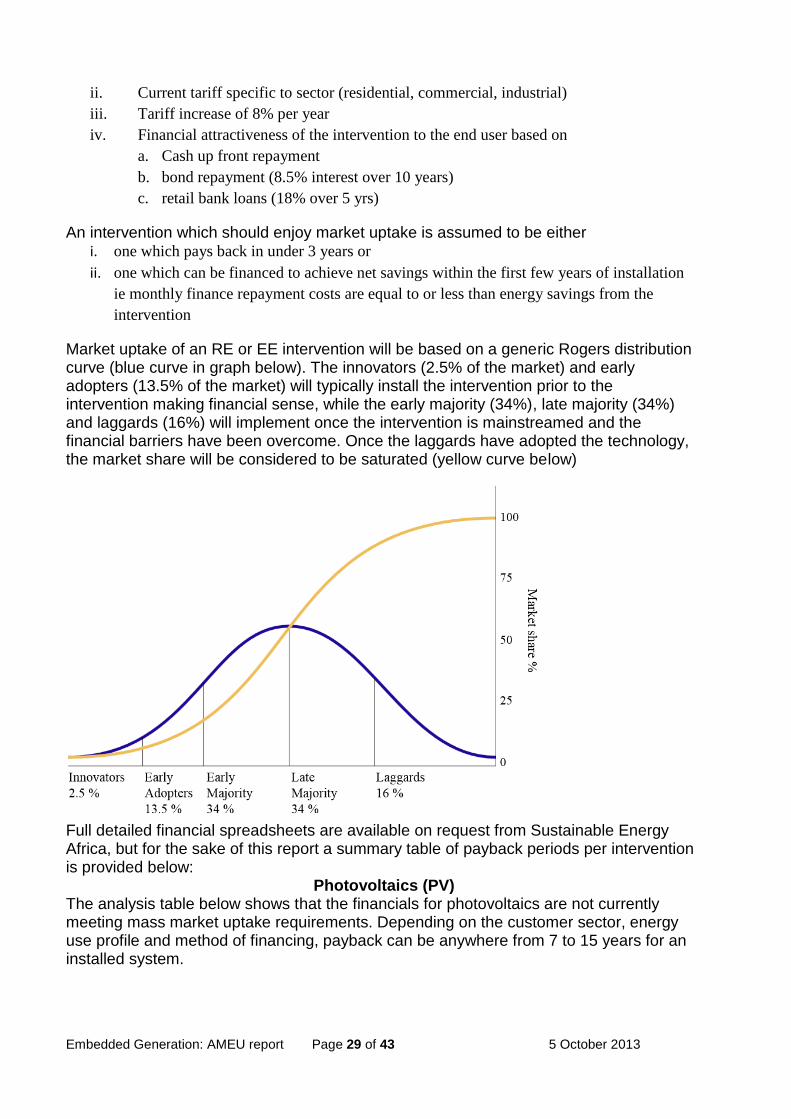
Market uptake of an RE or EE intervention will be based on a generic Rogers distribution curve (blue curve in graph below). The innovators (2.5% of the market) and early adopters (13.5% of the market) will typically install the intervention prior to the intervention making financial sense, while the early majority (34%), late majority (34%) and laggards (16%) will implement once the intervention is mainstreamed and the financial barriers have been overcome. Once the laggards have adopted the technology, the market share will be considered to be saturated (yellow curve below)
Full detailed financial spreadsheets are available on request from Sustainable Energy Africa, but for the sake of this report a summary table of payback periods per intervention is provided below:
Photovoltaics (PV) The analysis table below shows that the financials for photovoltaics are not currently meeting mass market uptake requirements. Depending on the customer sector, energy use profile and method of financing, payback can be anywhere from 7 to 15 years for an installed system.

Embedded Generation: AMEU report Page 30 of 43 5 October 2013
However, these figures are not indicative of how potentially close mass PV uptake in the market is. Creating attractive financing solutions such as placing the capital cost of the intervention onto a home loan (the 8.5% over 10 years scenario) can bring the annual loan repayment very close to the annual energy saved amount. It is also useful to project the financial attractiveness over the next 5 and 10 year window periods. These results are presented in the tables below:
Customer sector Customers 18% loan over 5 yrs
8.5% loan over 10
years Cash up front
Domestic (prepaid meter) 165 353
600-1000 73 867 14 13 10
1000-2000 68 267 13 13 9
2000-3000 13 503 12 12 9
>3000 9 716 12 11 8
Domestic 1 ph (credit meter) 83 003
600-1000 37 028 14 14 10
1000-2000 36 141 14 13 10
2000-3000 6 669 13 13 10
>3000 3 165 13 13 10
Domestic 3 ph (credit meter) 20 813
600-1000 5 536 14 14 10
1000-2000 5 076 14 13 10
2000-3000 1 309 13 13 10
>3000 1 801 13 13 10
Business (0-50kVA) 7 091
600-1000 1 218 10 8 7
1000-2000 1 785 10 8 7
2000-3000 2 004 10 8 7
>3000 2 084 10 8 7
Industrial LV 3 757 15 15 11
Industrial MV 231 15 15 11
Year in which intervention total savings exceed total costs
Install now
Embedded Generation: AMEU report Page 31 of 43 5 October 2013
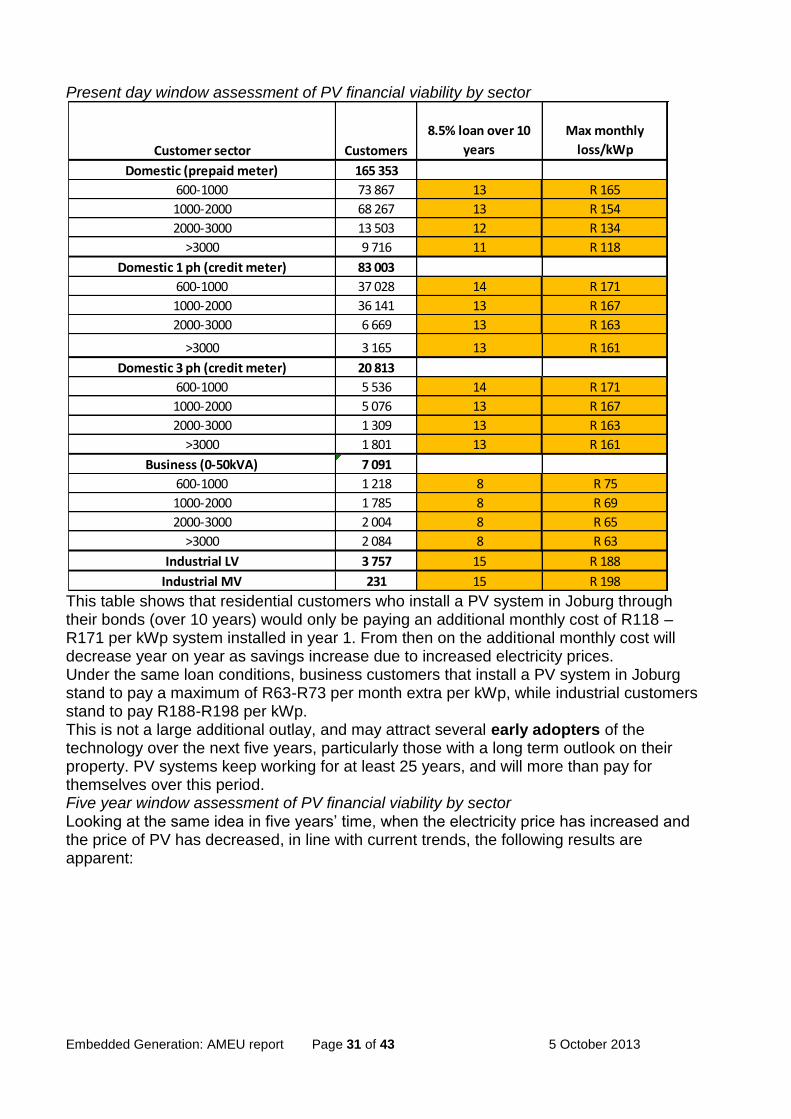
Present day window assessment of PV financial viability by sector
This table shows that residential customers who install a PV system in Joburg through their bonds (over 10 years) would only be paying an additional monthly cost of R118 – R171 per kWp system installed in year 1. From then on the additional monthly cost will decrease year on year as savings increase due to increased electricity prices. Under the same loan conditions, business customers that install a PV system in Joburg stand to pay a maximum of R63-R73 per month extra per kWp, while industrial customers stand to pay R188-R198 per kWp. This is not a large additional outlay, and may attract several early adopters of the technology over the next five years, particularly those with a long term outlook on their property. PV systems keep working for at least 25 years, and will more than pay for themselves over this period. Five year window assessment of PV financial viability by sector Looking at the same idea in five years’ time, when the electricity price has increased and the price of PV has decreased, in line with current trends, the following results are apparent:
Customer sector Customers
8.5% loan over 10
years
Max monthly
loss/kWp
Domestic (prepaid meter) 165 353
600-1000 73 867 13 R 165
1000-2000 68 267 13 R 154
2000-3000 13 503 12 R 134
>3000 9 716 11 R 118
Domestic 1 ph (credit meter) 83 003
600-1000 37 028 14 R 171
1000-2000 36 141 13 R 167
2000-3000 6 669 13 R 163
>3000 3 165 13 R 161
Domestic 3 ph (credit meter) 20 813
600-1000 5 536 14 R 171
1000-2000 5 076 13 R 167
2000-3000 1 309 13 R 163
>3000 1 801 13 R 161
Business (0-50kVA) 7 091
600-1000 1 218 8 R 75
1000-2000 1 785 8 R 69
2000-3000 2 004 8 R 65
>3000 2 084 8 R 63
Industrial LV 3 757 15 R 188
Industrial MV 231 15 R 198
Embedded Generation: AMEU report Page 32 of 43 5 October 2013
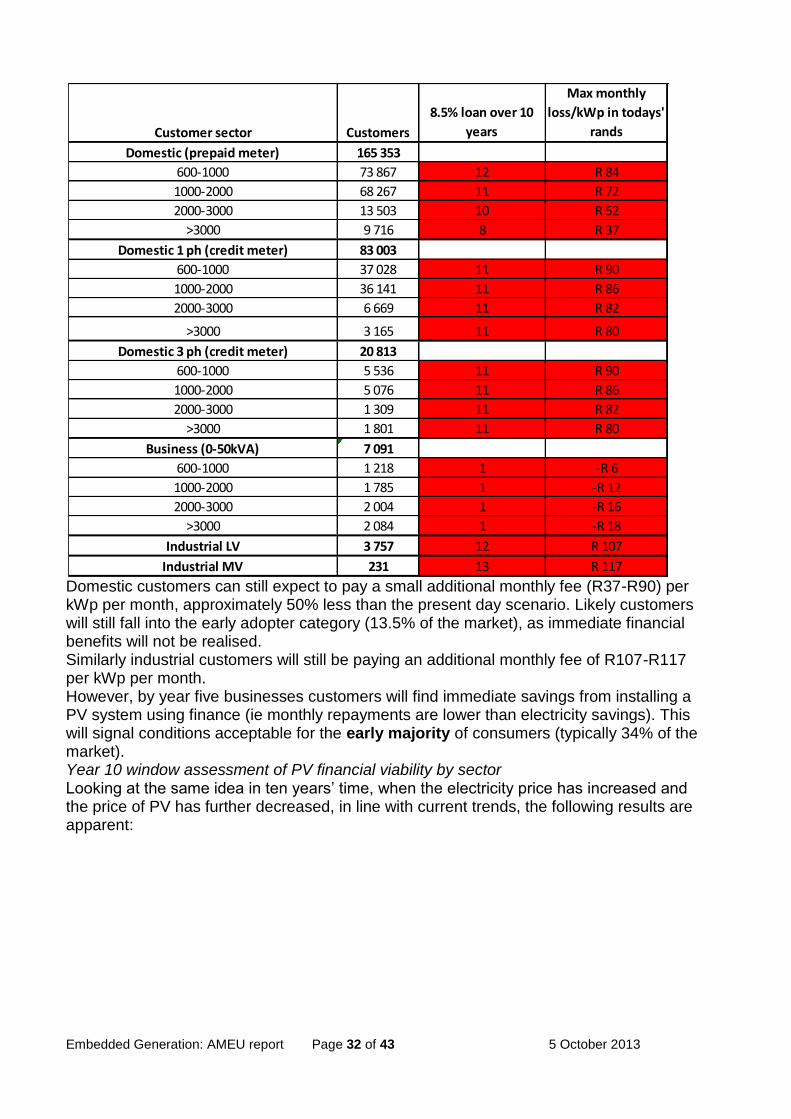
Domestic customers can still expect to pay a small additional monthly fee (R37-R90) per kWp per month, approximately 50% less than the present day scenario. Likely customers will still fall into the early adopter category (13.5% of the market), as immediate financial benefits will not be realised. Similarly industrial customers will still be paying an additional monthly fee of R107-R117 per kWp per month. However, by year five businesses customers will find immediate savings from installing a PV system using finance (ie monthly repayments are lower than electricity savings). This will signal conditions acceptable for the early majority of consumers (typically 34% of the market). Year 10 window assessment of PV financial viability by sector Looking at the same idea in ten years’ time, when the electricity price has increased and the price of PV has further decreased, in line with current trends, the following results are apparent:
Customer sector Customers
8.5% loan over 10
years
Max monthly
loss/kWp in todays'
rands
Domestic (prepaid meter) 165 353
600-1000 73 867 12 R 84
1000-2000 68 267 11 R 72
2000-3000 13 503 10 R 52
>3000 9 716 8 R 37
Domestic 1 ph (credit meter) 83 003
600-1000 37 028 11 R 90
1000-2000 36 141 11 R 86
2000-3000 6 669 11 R 82
>3000 3 165 11 R 80
Domestic 3 ph (credit meter) 20 813
600-1000 5 536 11 R 90
1000-2000 5 076 11 R 86
2000-3000 1 309 11 R 82
>3000 1 801 11 R 80
Business (0-50kVA) 7 091
600-1000 1 218 1 -R 6
1000-2000 1 785 1 -R 12
2000-3000 2 004 1 -R 16
>3000 2 084 1 -R 18
Industrial LV 3 757 12 R 107
Industrial MV 231 13 R 117

Embedded Generation: AMEU report Page 33 of 43 5 October 2013
By year 10 domestic and industrial customers are right on the borderline of financial viability, and should mark the beginning of the early majority phase of market uptake (34%). Business customers will have been viable financially for 5 years, and with an even more attractive financial proposition should be well into the late majority phase of the market (34%) by year 10. Based on these calculations, the following PV market uptake is projected for Joburg over the next 10 years:
Approximately 45000 PV systems in the residential market
Approximately 4000 PV systems in the commercial market
Approximately 670 PV systems in the industrial market
Customer sector Customers
8.5% loan over 10
years
Max monthly
loss/kWp in todays'
rands
Domestic (prepaid meter) 165 353
600-1000 73 867 6 R 26
1000-2000 68 267 4 R 14
2000-3000 13 503 1 -R 6
>3000 9 716 1 -R 21
Domestic 1 ph (credit meter) 83 003
600-1000 37 028 5 R 32
1000-2000 36 141 5 R 28
2000-3000 6 669 5 R 24
>3000 3 165 5 R 22
Domestic 3 ph (credit meter) 20 813
600-1000 5 536 5 R 32
1000-2000 5 076 5 R 28
2000-3000 1 309 5 R 24
>3000 1 801 5 R 22
Business (0-50kVA) 7 091
600-1000 1 218 1 -R 64
1000-2000 1 785 1 -R 70
2000-3000 2 004 1 -R 74
>3000 2 084 1 -R 76
Industrial LV 3 757 10 R 49
Industrial MV 231 11 R 58
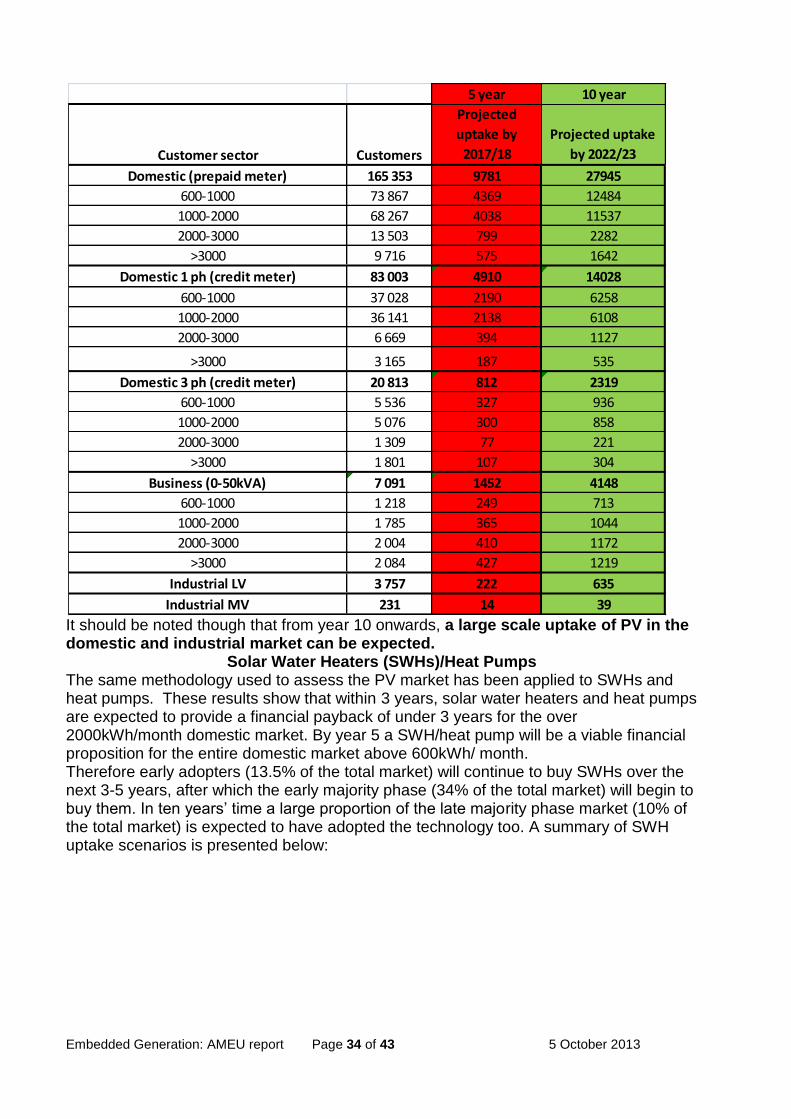
Embedded Generation: AMEU report Page 34 of 43 5 October 2013
It should be noted though that from year 10 onwards, a large scale uptake of PV in the domestic and industrial market can be expected.
Solar Water Heaters (SWHs)/Heat Pumps The same methodology used to assess the PV market has been applied to SWHs and heat pumps. These results show that within 3 years, solar water heaters and heat pumps are expected to provide a financial payback of under 3 years for the over 2000kWh/month domestic market. By year 5 a SWH/heat pump will be a viable financial proposition for the entire domestic market above 600kWh/ month. Therefore early adopters (13.5% of the total market) will continue to buy SWHs over the next 3-5 years, after which the early majority phase (34% of the total market) will begin to buy them. In ten years’ time a large proportion of the late majority phase market (10% of the total market) is expected to have adopted the technology too. A summary of SWH uptake scenarios is presented below:
5 year 10 year
Customer sector Customers
Projected
uptake by
2017/18
Projected uptake
by 2022/23
Domestic (prepaid meter) 165 353 9781 27945
600-1000 73 867 4369 12484
1000-2000 68 267 4038 11537
2000-3000 13 503 799 2282
>3000 9 716 575 1642
Domestic 1 ph (credit meter) 83 003 4910 14028
600-1000 37 028 2190 6258
1000-2000 36 141 2138 6108
2000-3000 6 669 394 1127
>3000 3 165 187 535
Domestic 3 ph (credit meter) 20 813 812 2319
600-1000 5 536 327 936
1000-2000 5 076 300 858
2000-3000 1 309 77 221
>3000 1 801 107 304
Business (0-50kVA) 7 091 1452 4148
600-1000 1 218 249 713
1000-2000 1 785 365 1044
2000-3000 2 004 410 1172
>3000 2 084 427 1219
Industrial LV 3 757 222 635
Industrial MV 231 14 39
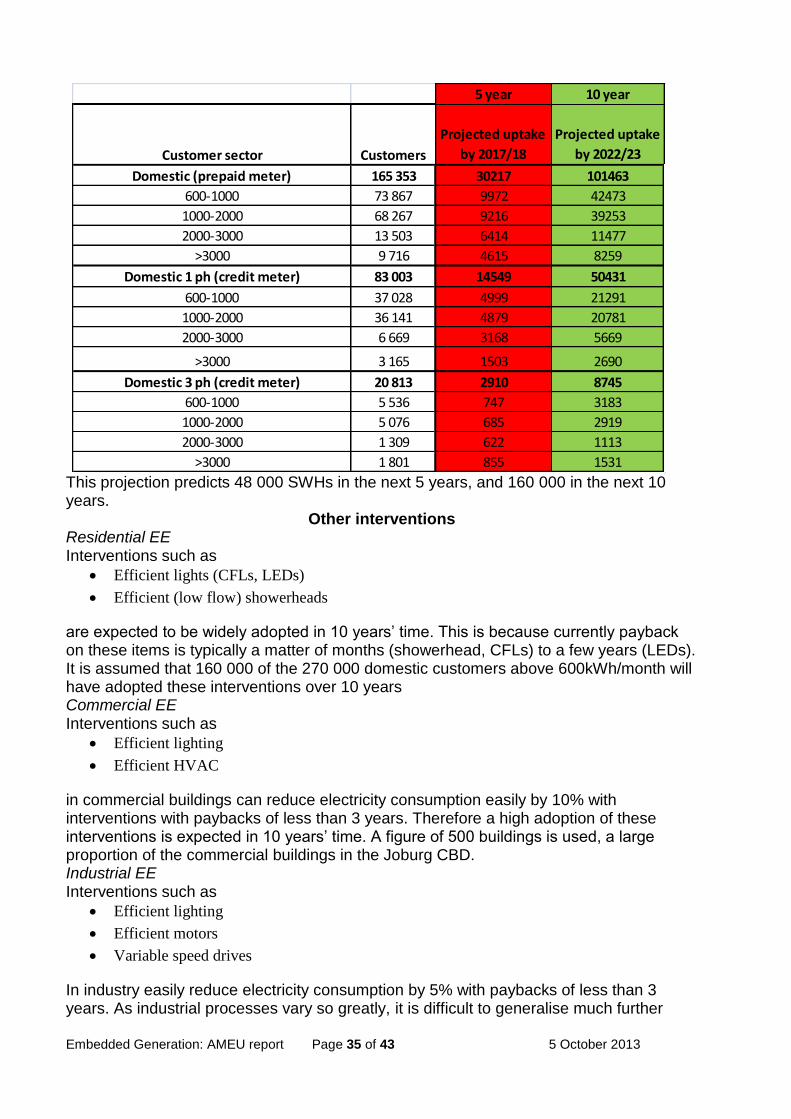
Embedded Generation: AMEU report Page 35 of 43 5 October 2013
This projection predicts 48 000 SWHs in the next 5 years, and 160 000 in the next 10 years.
Other interventions Residential EE Interventions such as
Efficient lights (CFLs, LEDs)
Efficient (low flow) showerheads
are expected to be widely adopted in 10 years’ time. This is because currently payback on these items is typically a matter of months (showerhead, CFLs) to a few years (LEDs). It is assumed that 160 000 of the 270 000 domestic customers above 600kWh/month will have adopted these interventions over 10 years Commercial EE Interventions such as
Efficient lighting
Efficient HVAC
in commercial buildings can reduce electricity consumption easily by 10% with interventions with paybacks of less than 3 years. Therefore a high adoption of these interventions is expected in 10 years’ time. A figure of 500 buildings is used, a large proportion of the commercial buildings in the Joburg CBD. Industrial EE Interventions such as
Efficient lighting
Efficient motors
Variable speed drives
In industry easily reduce electricity consumption by 5% with paybacks of less than 3 years. As industrial processes vary so greatly, it is difficult to generalise much further
5 year 10 year
Customer sector Customers
Projected uptake
by 2017/18
Projected uptake
by 2022/23
Domestic (prepaid meter) 165 353 30217 101463
600-1000 73 867 9972 42473
1000-2000 68 267 9216 39253
2000-3000 13 503 6414 11477
>3000 9 716 4615 8259
Domestic 1 ph (credit meter) 83 003 14549 50431
600-1000 37 028 4999 21291
1000-2000 36 141 4879 20781
2000-3000 6 669 3168 5669
>3000 3 165 1503 2690
Domestic 3 ph (credit meter) 20 813 2910 8745
600-1000 5 536 747 3183
1000-2000 5 076 685 2919
2000-3000 1 309 622 1113
>3000 1 801 855 1531
Embedded Generation: AMEU report Page 36 of 43 5 October 2013
than this. It is expected that 25% of industry will implement these interventions over the next 10 years. 14. IMPACT OF RE AND EE ON CITY POWER FINANCES Using the RE and EE uptake projections presented in the previous section, their impact on City Power finances has been calculated over the next 10 years. The model used to calculate this has been developed by Sustainable Energy Africa with funding from REEEP, and is freely available to any municipality who wishes to use it. It should be noted that while this model has been set up for City Power, it is simple to change the inputs to match the requirements of another municipality. The model is designed to be a thorough analysis of the impact of RE and EE on city finances, and incorporates the following:
i. Weekend and weekday load profiles for winter and summer
ii. RE and EE impact on overall load profile over particular hours of the day
for weekdays and weekends over summer and winter
iii. Financial impact of RE and EE based on cost of lost sales to customers and
gain from reduced purchases from Eskom. Current City Power customer
tariffs and Eskom Megaflex tariffs were used for the calculation
iv. Net metering has been included – any additional PV generation which is
fed into the grid is accounted for and purchased at Megaflex rates by City
Power. It is then considered to be sold on at City Power tariffs
v. Load shifting due to
PV installation
Time of Use tariffs
The outputs of the model indicate the impact on overall income of the interventions as
a figure in Rands,
a percentage of total revenue and
a percentage of operational revenue only (Eskom repayments removed).
The total revenue percentage drop is of interest as this will indicate the impact on the ability of
City Power to pay a 10% surplus to the City of Joburg rates account. The impact on operational
revenue is also of interest, as City Power’s ability to manage its network could be affected.
The revenue impact model can be easily edited to simulate many different tariff, growth,
technology uptake, load shifting and net metering scenarios. However, a business as usual
scenario will be presented here, as the most likely way forward for the distribution utility.
Business as Usual This scenario assumes that the current City Power tariff structure remains unchanged into the future, with growth in line with Eskom increases and operational cost increases . The key assumptions around this scenario are
PV, SWH and EE penetration rates linked to uptake scenarios developed for this report
Purchase of excess PV energy at Megaflex rates (net metering)
0% growth in sales up to 2017, 5% growth in sales from 2017 on
6% operational growth rate annually for City Power, Eskom electricity increases of
20%, 15%, 15%, 15%, 15% and then 6% for the last 5 years
The results of the Business as Usual (BAU) scenario are presented by sector below in windows of 3, 5 and 10 years from now.

Embedded Generation: AMEU report Page 37 of 43 5 October 2013
In year 3, a small total revenue loss of .35% can be expected from the projected EE and RE uptake. Nearly 50% of the losses will be realised in the residential market, and approximately 25% each from the commercial and industrial market. This breakdown of revenue loss allocation remains consistent for years 5 and 10. It should be noted that even though the projected uptake of PV compared to SWHs is significantly lower in the residential market (1 PV system for every 4 SWH systems), the overall financial impact is similar to that of the SWHs. This is due to loss of City Power sales occurring in the middle of the day for PV, when City Power stands to make a surplus on electricity sales, while the SWHs typically result in a loss of sales over peak period, when City Power stands to make very little surplus, or in winter runs at a loss.
Total Revenue
Operational Revenue
Loss
%loss of total
revenue % loss of op revenue
Residential (prepaid) -R 26 352 914 -0.12% -0.40%
PV -R 10 370 765 -0.05% -0.16%
SWHs -R 10 352 332 -0.05% -0.16%
Other ee -R 5 629 817 -0.03% -0.09%
Residential (credit) -R 11 914 508 -0.05% -0.18%
PV -R 4 398 922 -0.02% -0.07%
SWHs -R 4 820 047 -0.02% -0.07%
Other ee -R 2 695 539 -0.01% -0.04%
Commercial -R 17 307 044 -0.08% -0.26%
PV -R 3 798 276 -0.02% -0.06%
EE -R 13 508 769 -0.06% -0.21%
Industrial -R 20 581 405 -0.09% -0.31%
PV -R 12 952 214 -0.06% -0.20%
EE -R 7 629 192 -0.04% -0.12%
TOTAL -R 76 155 872 -0.35% -1.16%
Year 3R 21 673 141 713
R 6 544 578 041

Embedded Generation: AMEU report Page 38 of 43 5 October 2013
In 5 years time, overall revenue losses will have grown to 1.03%, which equates to a 3.81% drop in projected operational income for City Power
By year 10, a projected loss of 2.27% of City Power revenue is expected based on the projected uptake figures for EE and RE. This equates to an 8.41% loss in operational income. It should be noted that by year 10 it is expected that PV will be a much more
Total Revenue
Operational Revenue
Loss
%loss of total
revenue % loss of op revenue
Residential (prepaid) -R 103 335 105 -0.35% -1.28%
PV -R 39 310 014 -0.13% -0.49%
SWHs -R 41 201 766 -0.14% -0.51%
Other ee -R 22 823 325 -0.08% -0.28%
Residential (credit) -R 45 997 926 -0.15% -0.57%
PV -R 16 654 105 -0.06% -0.21%
SWHs -R 18 636 065 -0.06% -0.23%
Other ee -R 10 707 756 -0.04% -0.13%
Commercial -R 73 708 116 -0.25% -0.91%
PV -R 16 181 709 -0.05% -0.20%
EE -R 57 526 407 -0.19% -0.71%
Industrial -R 84 447 145 -0.28% -1.05%
PV -R 52 729 361 -0.18% -0.65%
EE -R 31 717 784 -0.11% -0.39%
TOTAL -R 307 488 293 -1.03% -3.81%
Year 5R 29 848 706 804
R 8 063 574 605
Total Revenue
Operational Revenue
Loss
%loss of total
revenue % loss of op revenue
Residential (prepaid) -R 385 289 009 -0.77% -2.84%
PV -R 133 716 985 -0.27% -0.98%
SWHs -R 164 307 004 -0.33% -1.21%
Other ee -R 87 265 020 -0.17% -0.64%
Residential (credit) -R 172 942 392 -0.34% -1.27%
PV -R 57 573 207 -0.11% -0.42%
SWHs -R 74 428 062 -0.15% -0.55%
Other ee -R 40 941 123 -0.08% -0.30%
Commercial -R 281 823 107 -0.56% -2.07%
PV -R 61 870 793 -0.12% -0.46%
EE -R 219 952 314 -0.44% -1.62%
Industrial -R 305 886 623 -0.61% -2.25%
PV -R 201 610 799 -0.40% -1.48%
EE -R 104 275 824 -0.21% -0.77%
TOTAL -R 1 145 941 131 -2.28% -8.43%
Year 10R 50 296 805 956
R 13 587 592 147
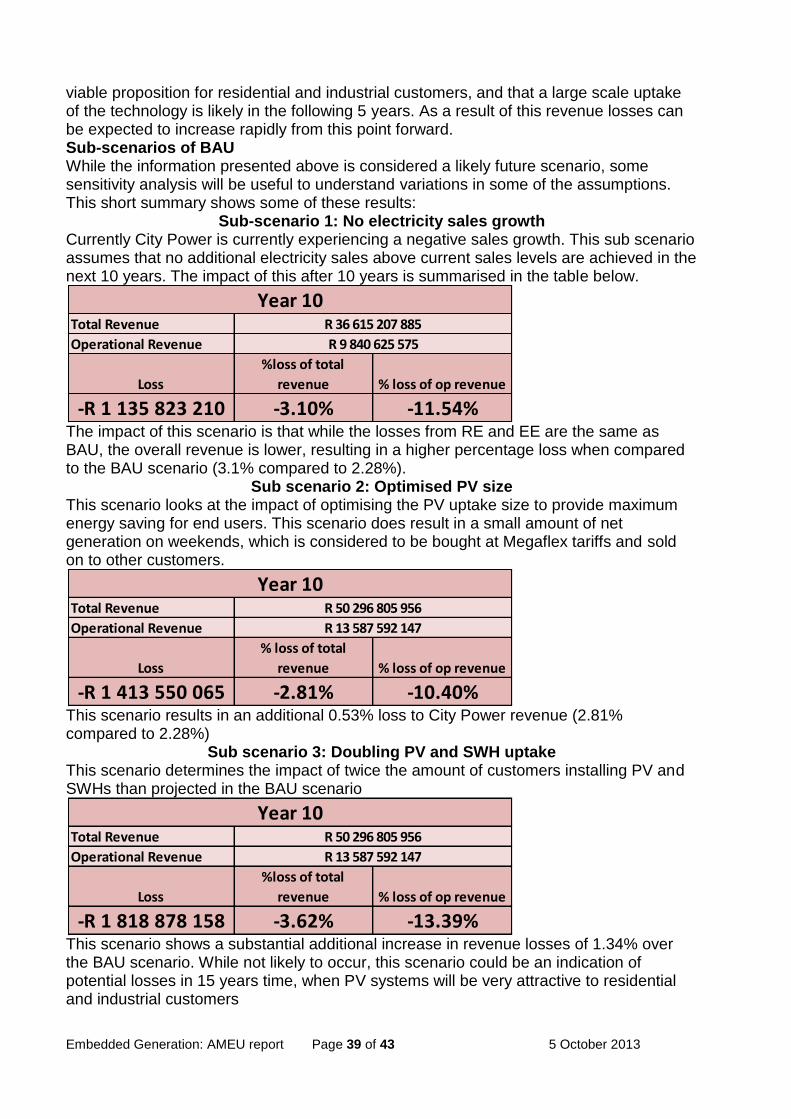
Embedded Generation: AMEU report Page 39 of 43 5 October 2013
viable proposition for residential and industrial customers, and that a large scale uptake of the technology is likely in the following 5 years. As a result of this revenue losses can be expected to increase rapidly from this point forward. Sub-scenarios of BAU While the information presented above is considered a likely future scenario, some sensitivity analysis will be useful to understand variations in some of the assumptions. This short summary shows some of these results:
Sub-scenario 1: No electricity sales growth Currently City Power is currently experiencing a negative sales growth. This sub scenario assumes that no additional electricity sales above current sales levels are achieved in the next 10 years. The impact of this after 10 years is summarised in the table below.
The impact of this scenario is that while the losses from RE and EE are the same as BAU, the overall revenue is lower, resulting in a higher percentage loss when compared to the BAU scenario (3.1% compared to 2.28%).
Sub scenario 2: Optimised PV size This scenario looks at the impact of optimising the PV uptake size to provide maximum energy saving for end users. This scenario does result in a small amount of net generation on weekends, which is considered to be bought at Megaflex tariffs and sold on to other customers.
This scenario results in an additional 0.53% loss to City Power revenue (2.81% compared to 2.28%)
Sub scenario 3: Doubling PV and SWH uptake This scenario determines the impact of twice the amount of customers installing PV and SWHs than projected in the BAU scenario
This scenario shows a substantial additional increase in revenue losses of 1.34% over the BAU scenario. While not likely to occur, this scenario could be an indication of potential losses in 15 years time, when PV systems will be very attractive to residential and industrial customers
Total Revenue
Operational Revenue
Loss
%loss of total
revenue % loss of op revenue
-R 1 135 823 210 -3.10% -11.54%
Year 10R 36 615 207 885
R 9 840 625 575
Total Revenue
Operational Revenue
Loss
% loss of total
revenue % loss of op revenue
-R 1 413 550 065 -2.81% -10.40%
R 13 587 592 147
Year 10R 50 296 805 956
Total Revenue
Operational Revenue
Loss
%loss of total
revenue % loss of op revenue
-R 1 818 878 158 -3.62% -13.39%
R 13 587 592 147
Year 10R 50 296 805 956

Embedded Generation: AMEU report Page 40 of 43 5 October 2013
Sub scenario 5: Halving PV and SWH uptake This scenario looks at a more conservative market uptake than that projected in the BAU.
This scenario shows a revenue loss reduction of 0.7% when compared to BAU
Sub scenario 6: Implementing a service charge for PV installations This scenario looks at the impact of City Power imposing a service charge of R5/kWp on any customer who installs a PV system, coupled with a lower energy charge. This is based on the tariff which is currently proposed by the City of Cape Town (88c/kWh). The result shown here was only calculated for residential customers, but can also be applied to commercial and industrial customers. This is merely being presented as an indication of the revenue loss mitigation potential of such a tariff
This shows that implementing a service charge can negate the losses experienced from a PV installation. The setting of the service charge and energy charge figure would need to be fine tuned so as not to overburden the PV customer. These indicative figures merely go to show that the impact of PV can be managed with an alternative tariff approach. Load Shifting Scenarios These scenarios look at the impact of residential electricity customers who shift their load from peak times to other times of the day. This is often a conscious decision by the customer, which can be driven by two key factors.
Optimising PV panel generation for own use. A customer who has installed a PV system
would like to make full use of the electricity generated, and not lose it to the grid or lose
the excess electricity entirely. Therefore it makes sense for them to shift their electricity
usage to the middle of the day when the PV generation is at its highest.
A residential Time of Use tariff. This will have the effect of motivating money conscious
customers to shift their electricity loads from expensive peak periods to less expensive
standard and off peak periods
Interestingly, research shows that these conditions will not necessarily cause all customers to shift. Customer shifts due to ToU tariffs can range from as low as 2% and as high as 50%1. Research based on load shifting through PV installation shows a typical
1 Demand Side Response in the domestic sector- a literature review of major trials, Final Report. Undertaken by Frontier
Economics and Sustainability First. August 2012
Total Revenue
Operational Revenue
Loss
%loss of total
revenue % loss of op revenue
-R 793 902 003 -1.58% -5.84%
R 13 587 592 147
Year 10R 50 296 805 956
Surplus
% gain in total
revenue
% gain in operational
revenue
Residential (prepaid) R 216 906 947 0.431% 1.596%
Residential (credit) R 138 136 188 0.275% 1.017%
Total R 355 043 135 0.706% 2.613%
Year 10
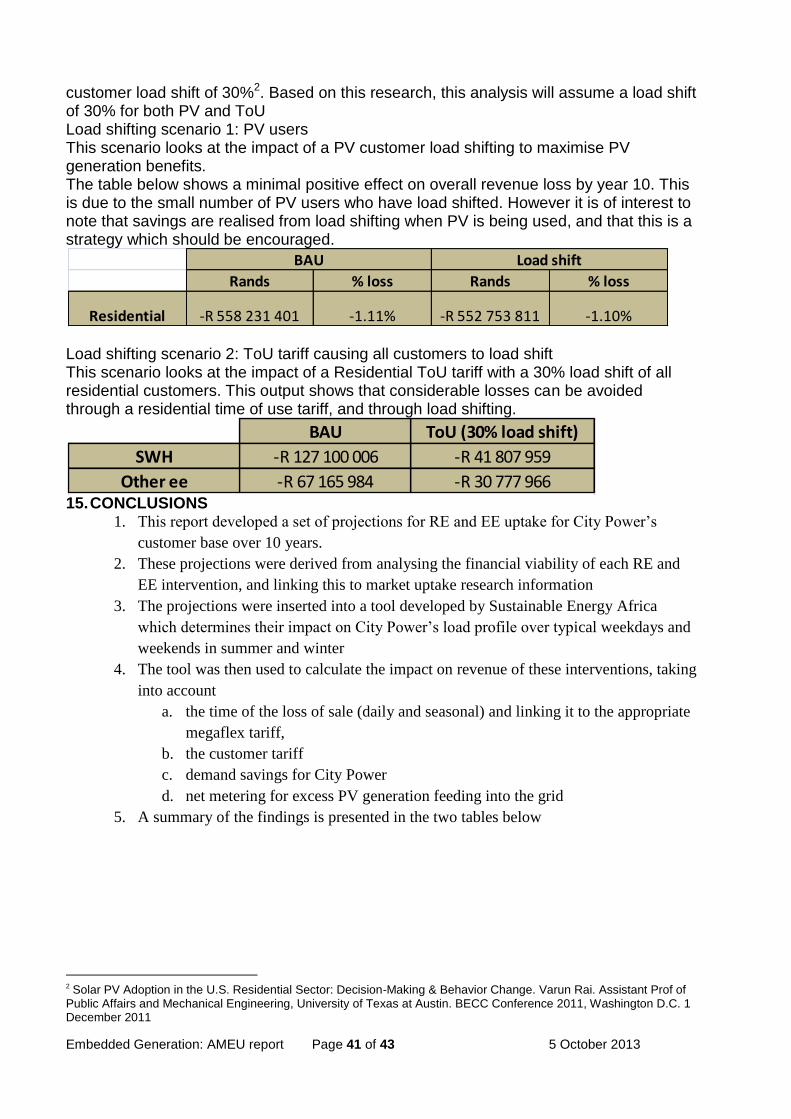
Embedded Generation: AMEU report Page 41 of 43 5 October 2013
customer load shift of 30%2. Based on this research, this analysis will assume a load shift of 30% for both PV and ToU Load shifting scenario 1: PV users This scenario looks at the impact of a PV customer load shifting to maximise PV generation benefits. The table below shows a minimal positive effect on overall revenue loss by year 10. This is due to the small number of PV users who have load shifted. However it is of interest to note that savings are realised from load shifting when PV is being used, and that this is a strategy which should be encouraged.
Load shifting scenario 2: ToU tariff causing all customers to load shift This scenario looks at the impact of a Residential ToU tariff with a 30% load shift of all residential customers. This output shows that considerable losses can be avoided through a residential time of use tariff, and through load shifting.
15. CONCLUSIONS
1. This report developed a set of projections for RE and EE uptake for City Power’s
customer base over 10 years.
2. These projections were derived from analysing the financial viability of each RE and
EE intervention, and linking this to market uptake research information
3. The projections were inserted into a tool developed by Sustainable Energy Africa
which determines their impact on City Power’s load profile over typical weekdays and
weekends in summer and winter
4. The tool was then used to calculate the impact on revenue of these interventions, taking
into account
a. the time of the loss of sale (daily and seasonal) and linking it to the appropriate
megaflex tariff,
b. the customer tariff
c. demand savings for City Power
d. net metering for excess PV generation feeding into the grid
5. A summary of the findings is presented in the two tables below
2 Solar PV Adoption in the U.S. Residential Sector: Decision-Making & Behavior Change. Varun Rai. Assistant Prof of
Public Affairs and Mechanical Engineering, University of Texas at Austin. BECC Conference 2011, Washington D.C. 1 December 2011
Rands % loss Rands % loss
Residential -R 558 231 401 -1.11% -R 552 753 811 -1.10%
BAU Load shift
BAU ToU (30% load shift)
SWH -R 127 100 006 -R 41 807 959
Other ee -R 67 165 984 -R 30 777 966
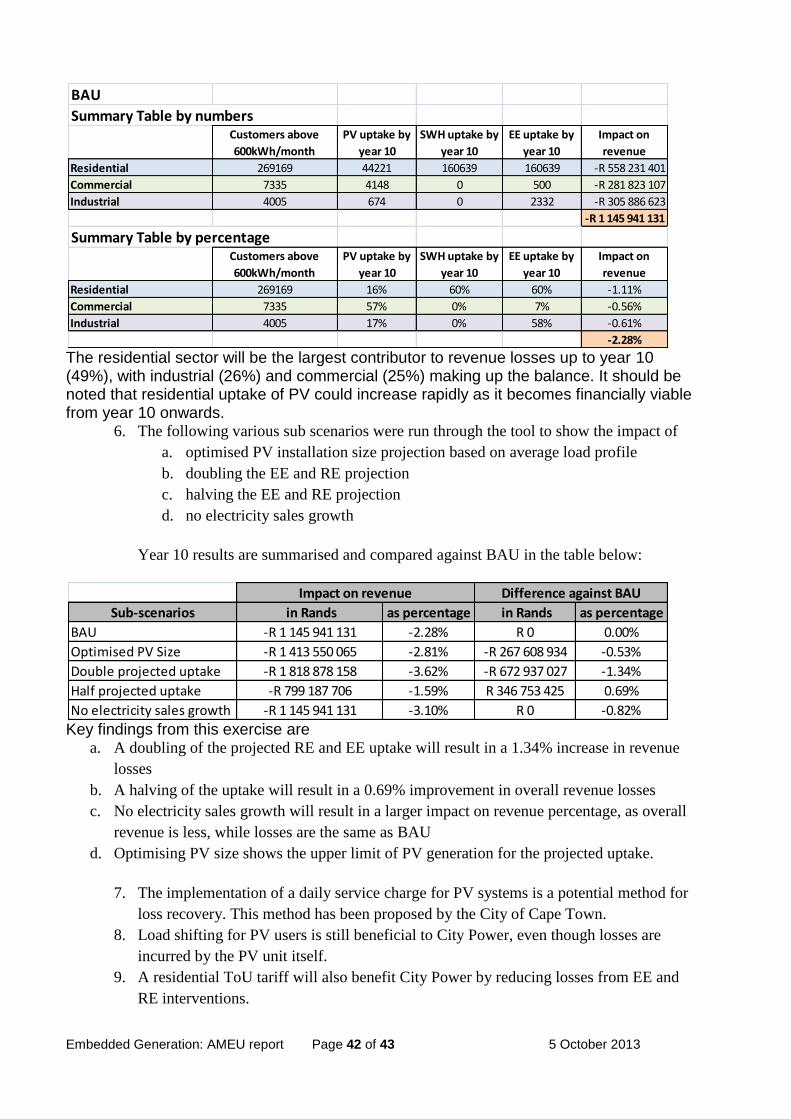
Embedded Generation: AMEU report Page 42 of 43 5 October 2013
The residential sector will be the largest contributor to revenue losses up to year 10 (49%), with industrial (26%) and commercial (25%) making up the balance. It should be noted that residential uptake of PV could increase rapidly as it becomes financially viable from year 10 onwards.
6. The following various sub scenarios were run through the tool to show the impact of
a. optimised PV installation size projection based on average load profile
b. doubling the EE and RE projection
c. halving the EE and RE projection
d. no electricity sales growth
Year 10 results are summarised and compared against BAU in the table below:
Key findings from this exercise are
a. A doubling of the projected RE and EE uptake will result in a 1.34% increase in revenue
losses
b. A halving of the uptake will result in a 0.69% improvement in overall revenue losses
c. No electricity sales growth will result in a larger impact on revenue percentage, as overall
revenue is less, while losses are the same as BAU
d. Optimising PV size shows the upper limit of PV generation for the projected uptake.
7. The implementation of a daily service charge for PV systems is a potential method for
loss recovery. This method has been proposed by the City of Cape Town.
8. Load shifting for PV users is still beneficial to City Power, even though losses are
incurred by the PV unit itself.
9. A residential ToU tariff will also benefit City Power by reducing losses from EE and
RE interventions.
BAU
Summary Table by numbersCustomers above
600kWh/month
PV uptake by
year 10
SWH uptake by
year 10
EE uptake by
year 10
Impact on
revenue
Residential 269169 44221 160639 160639 -R 558 231 401
Commercial 7335 4148 0 500 -R 281 823 107
Industrial 4005 674 0 2332 -R 305 886 623
-R 1 145 941 131
Summary Table by percentageCustomers above
600kWh/month
PV uptake by
year 10
SWH uptake by
year 10
EE uptake by
year 10
Impact on
revenue
Residential 269169 16% 60% 60% -1.11%
Commercial 7335 57% 0% 7% -0.56%
Industrial 4005 17% 0% 58% -0.61%
-2.28%
Sub-scenarios in Rands as percentage in Rands as percentage
BAU -R 1 145 941 131 -2.28% R 0 0.00%
Optimised PV Size -R 1 413 550 065 -2.81% -R 267 608 934 -0.53%
Double projected uptake -R 1 818 878 158 -3.62% -R 672 937 027 -1.34%
Half projected uptake -R 799 187 706 -1.59% R 346 753 425 0.69%
No electricity sales growth -R 1 145 941 131 -3.10% R 0 -0.82%
Impact on revenue Difference against BAU

Embedded Generation: AMEU report Page 43 of 43 5 October 2013
In summary then, it is reasonable to expect that EE and RE interventions will result in an increasing revenue drop year by year, culminating in a drop of 2.8% for City Power in 10 years time. These losses could be absorbed internally by City Power, or be passed on to the City of Joburg – ultimately a management decision. Either way, the amount is fairly substantial, and will have an impact on service delivery into the future. Two potential strategies to make up for some of the losses are to implement a daily service charge for grid connected PV systems, or to implement a residential time of use tariff. This case study shows that City Power, and indeed most municipalities in South Africa, will need to plan for the impact of EE and RE into the future, and develop strategies on how best to manage it. It should be noted that the tool developed to calculate the impact of RE and EE on municipal finances is freely available from Sustainable Energy Africa. Please contact us by email at [email protected] or at 021-7023622.