GuardCap UCITS Funds plc 31.12.2015 completed · GuardCap UCITS Funds Plc 5 Investment Manager’s...
47
GuardCap UCITS Funds Plc Annual report and audited financial statements For the financial period from 5 December 2014 to 31 December 2015 (An umbrella fund constituted as an investment company with variable capital under the laws of Ireland with segregated liability between sub- funds and authorised by the Central Bank (Supervision and Enforcement) Act 2013 (Section 48(1)) (Undertakings for Collective Investment in Transferable Securities) Regulations 2015.
Transcript of GuardCap UCITS Funds plc 31.12.2015 completed · GuardCap UCITS Funds Plc 5 Investment Manager’s...

GuardCap UCITS Funds Plc Annual report and audited financial statements For the financial period from 5 December 2014 to 31 December 2015 (An umbrella fund constituted as an investment company with variable capital under the laws of Ireland with segregated liability between sub-funds and authorised by the Central Bank (Supervision and Enforcement) Act 2013 (Section 48(1)) (Undertakings for Collective Investment in Transferable Securities) Regulations 2015.

GuardCap UCITS Funds Plc
1
Annual report and audited financial statements Contents Page Directors and other information 2 Investment Manager’s Report 3 – 13 Directors’ Report 14 – 16 Report of the Custodian 17 Independent Auditor’s Report 18 – 19 Schedule of Investments 20 – 21 Statement of Financial Position 22 Statement of Comprehensive Income 23 Statement of Changes in Net Assets Attributable to Holders of Redeemable Shares 24 Statement of Cash Flows 25 Notes forming part of the Financial Statements 26 – 45 Supplementary Unaudited Information 46

GuardCap UCITS Funds Plc
2
Directors and other information
Directors Victoria Parry* (appointed on 14 November 2014) Brian Moore* (appointed on 14 November 2014) Steve Bates (appointed on 14 November 2014) Michael Boyd (appointed on 14 November 2014) Philip Lovegrove (resigned on 14 November 2014) Shay Lydon (resigned on 14 November 2014) Company Secretary Matsack Trust Limited 70 Sir John Rogerson’s Quay Dublin 2 Ireland Registered Office 70 Sir John Rogerson’s Quay Dublin 2 Ireland Investment Manager and GuardCap Asset Management Limited Promoter 6th Floor
11 Charles II Street
St James's
London
SW1Y 4NS
United Kingdom Custodian RBC Investor Services Bank S.A., Dublin Branch 4th Floor One George’s Quay Plaza George’s Quay Dublin 2 Ireland Administrator RBC Investor Services Ireland Limited 4th Floor One George’s Quay Plaza George’s Quay Dublin 2 Ireland Legal Advisers Matheson 70 Sir John Rogerson’s Quay Dublin 2 Ireland Independent Auditors KPMG 1 Harbourmaster Place IFSC Dublin 1 Ireland
* Independent and non-executive Directors.

GuardCap UCITS Funds Plc
3
Investment Manager’s Report for the financial period from 5 December 2014 to 31 December 2015 Philosophy Through investment in a small number of high quality, sustainable growth companies, the Investment Manager aims to achieve above market returns at below benchmark risk over the long-term. The Investment Manager believes that sustainable growth in the earnings of these companies will drive returns from their shares provided they are not overvalued when purchased. In addition, the quality of the businesses will help to protect their shares during periods of economic and stock market turmoil. The Investment Manager uses an intensive, confidence-building research process to identify, analyse and constantly monitor the 20 to 25 companies in the portfolio. Portfolio turnover for the year was low at 5% in keeping with the Investment Manager’s 5 to 10 year investment horizon. Performance Between inception on 10 December 2014 and 31 December 2015, the GuardCap Global Equity (UCITS) Fund USD I Share Class has returned +8.81% in US$, versus a return for the MSCI World Index (Net Dividends Re-invested) of -0.14%. For the year to 31 December 2015, it has returned +8.96% versus the benchmark return of -0.87%. Portfolio Companies Company Business Growth drivers Quality profile Alphabet Google develops world
class web-based services/software and provides them free of charge to consumers and businesses in order to drive advertising revenue. Key assets with >1bn users each include Google Search, Maps, Chrome, YouTube, Google Play and Android.
Benefits from the huge secular trend away from advertising/brand building on traditional media channels (such as TV and print) to digital.
High ROIC of 25%+ reflects the uniqueness of the business and its barriers to entry (ownership of premier online platform assets).
Balance sheet is very strong. Cash generation is good but lumpy as CAPEX on data centres and land is not linear.
Assa Abloy The global leader in door opening solutions for homes, workplaces and retail outlets. Has the leading brands, the largest installed base and is leader in all major markets including the USA and China (10% of sales).
Urbanization, higher security requirements and technological development are the key drivers. Emerging markets are 25% of sales and driven by urbanisation. Mature markets driven by technology advances. The aftermarket accounts for 67% of sales, providing greater stability.
Regular bolt-on acquisitions keeps ROIC around 10%.
Balance sheet satisfactory with Net debt/FCF of >3.
Good cash conversion has been driven by strong working capital focus.

GuardCap UCITS Funds Plc
4
Investment Manager’s Report for the financial period from 5 December 2014 to 31 December 2015 (continued) Portfolio Companies (continued) Automatic Data
Provides a range of HR solutions, via a software and service-based delivery model, which its >600k businesses of all sizes can use to recruit, staff, pay, manage and retain employees. Recurring revenue due to long-term client relationships (av.12 years). Number 1 in US and Europe in HR outsourcing.
Outsourcing pressures have intensified: evolving workforce demographics; intensifying compliance burden (eg Affordable Care Act); attracting, developing and retaining talent; integrate, simplify and unify. $90bn global HCM market growing at 7% per annum.
Solid ROIC of 17% is held in check by regular acquisitions.
Balance sheet is very strong. Strong credit rating (AA) important for client trust in handling their money. Cash generation is excellent and recessionary performance resilient.
CME Group Offers the widest range of global benchmark products across all major asset classes: exchange-traded and OTC. Brings buyers and sellers together on the Globex electronic trading platform and open outcry and charges a transaction fee. Provides clearing and settlement services, regulatory reporting solutions and market data services.
Key differentiators are: liquidity and price transparency; most diverse product line; safety and soundness of CME’s markets; superior trading technology and distribution. Increased volatility requires greater degrees of hedging and use of derivatives. Volumes have grown 14% per annum over the last 40 years.
Poor ROIC due to large amounts of goodwill as CME is a merger of 3 large businesses.
Balance sheet is strong, cash generation is excellent and recessionary performance is resilient.
Cognizant Tech.
Global provider of IT, consulting, and business process services. Helps clients build more efficient operations, provide solution to business and technology problems, and help drive technology-based innovation and growth. Operates a global delivery model. Spun-off from Dun & Bradstreet in 1996.
Indian outsourcing market has grown double-digits through the cycle. Cognizant’s addressable market has doubled over the last 2 years due to a push into BPO, infrastructure and social, mobility, analytics and cloud. Client penetration levels remain low.
ROIC halved in 2014 (to 23%) following the largest acquisition in the company’s history (TriZetto). Company invests excess margin back into the business.
Very strong balance sheet: net cash.

GuardCap UCITS Funds Plc
5
Investment Manager’s Report for the financial period from 5 December 2014 to 31 December 2015 (continued) Portfolio Companies (continued) Colgate Global oral care market
leader for toothpaste, toothbrushes and mouthwash. Also offers personal hygiene and pet nutrition products.
Company holds dominant market shares in most developed and developing markets. In the US, it shares the market equally with P&G. Consumption of oral care is low in developing versus developed.
Oral care should remain unpenetrated by own brand.
High ROIC of 20%+ reflects its strong competitive position and barriers to entry including relationships with dentists and vets and exceptional distribution.
Balance sheet has been managed conservatively and consistently.
Cash generation is excellent for an FMCG and cash conversion has been driven by strong working capital focus.
Dassault Syst.
Provides software to support and enhance companies’ innovation processes. World leader of the global Product Lifecycle Management market (3D design, simulation, digital manufacturing and business process management) with 30% share. More than 70% recurring software revenue and strong partnerships with global industry leaders.
>$30bn addressable market. Growing by: adding new industries in consumer, tech, finance, natural resources and life sciences (25% of rev to >30% by 2019); adding new users in marketing and sales; and adding high growth countries (12% in 2014); expanding market by 15% using mobile/cloud to appeal to SMEs.
ROIC of 8% has been reduced by recent large acquisitions but it should recover quickly.
Balance sheet is very strong. Cash generation is excellent and recessionary performance is resilient.
Essilor The world’s leading ophthalmic optics company with 39% market share in a fragmented market. Essilor invests more innovation €s than all the industry players combined. Supply chain is a competitive advantage. Brands include Varilux, Transitions and Crizal. Sells in over 120 countries and employs 58,000. Strong employee shareholder culture.
Core lens market growth is 3-4% per annum driven by Emerging Markets, ageing population and increasing number of unmet visual needs. Including sunglasses and online, Essilor estimate their market to total €27bn growing at 6-7% per annum.
13% ROIC diluted by a number of bolt-on acquisitions.
Balance sheet has traditionally been managed very conservatively.
GuardCap UCITS Funds Plc
6
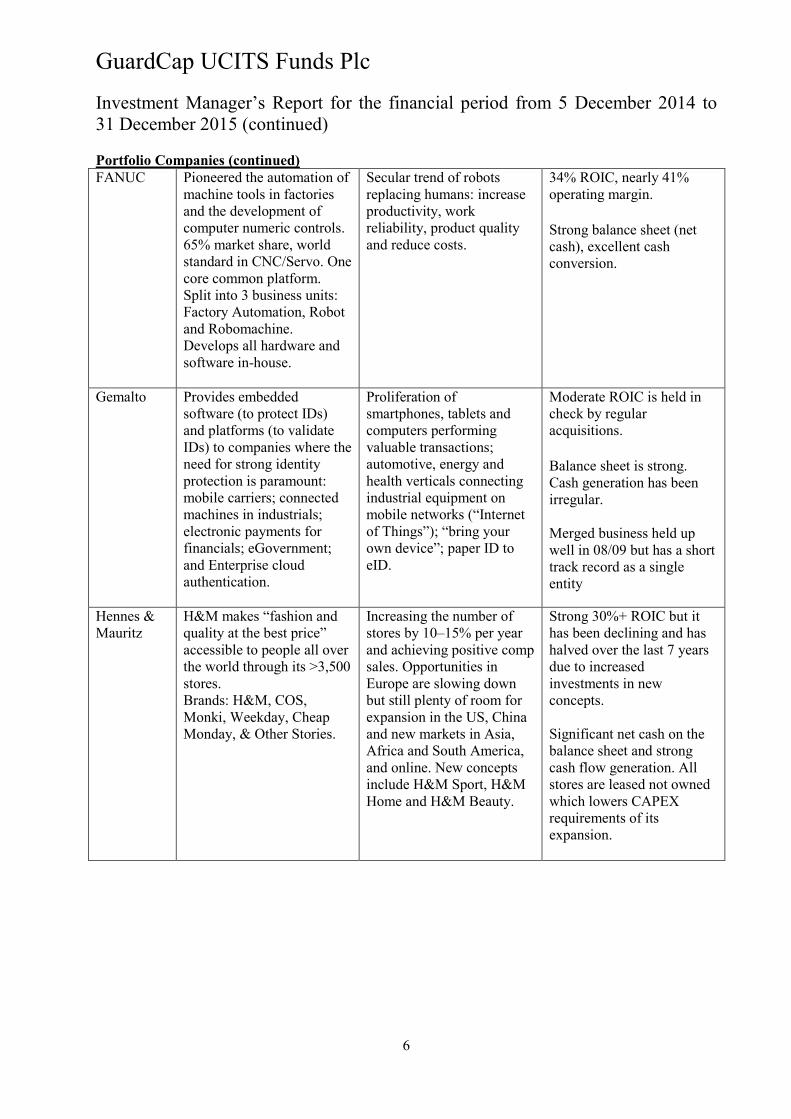
Investment Manager’s Report for the financial period from 5 December 2014 to 31 December 2015 (continued) Portfolio Companies (continued) FANUC Pioneered the automation of
machine tools in factories and the development of computer numeric controls. 65% market share, world standard in CNC/Servo. One core common platform. Split into 3 business units: Factory Automation, Robot and Robomachine. Develops all hardware and software in-house.
Secular trend of robots replacing humans: increase productivity, work reliability, product quality and reduce costs.
34% ROIC, nearly 41% operating margin.
Strong balance sheet (net cash), excellent cash conversion.
Gemalto Provides embedded software (to protect IDs) and platforms (to validate IDs) to companies where the need for strong identity protection is paramount: mobile carriers; connected machines in industrials; electronic payments for financials; eGovernment; and Enterprise cloud authentication.
Proliferation of smartphones, tablets and computers performing valuable transactions; automotive, energy and health verticals connecting industrial equipment on mobile networks (“Internet of Things”); “bring your own device”; paper ID to eID.
Moderate ROIC is held in check by regular acquisitions.
Balance sheet is strong. Cash generation has been irregular. Merged business held up well in 08/09 but has a short track record as a single entity
Hennes & Mauritz
H&M makes “fashion and quality at the best price” accessible to people all over the world through its >3,500 stores. Brands: H&M, COS, Monki, Weekday, Cheap Monday, & Other Stories.
Increasing the number of stores by 10–15% per year and achieving positive comp sales. Opportunities in Europe are slowing down but still plenty of room for expansion in the US, China and new markets in Asia, Africa and South America, and online. New concepts include H&M Sport, H&M Home and H&M Beauty.
Strong 30%+ ROIC but it has been declining and has halved over the last 7 years due to increased investments in new concepts. Significant net cash on the balance sheet and strong cash flow generation. All stores are leased not owned which lowers CAPEX requirements of its expansion.

GuardCap UCITS Funds Plc
7
Investment Manager’s Report for the financial period from 5 December 2014 to 31 December 2015 (continued) Portfolio Companies (continued) Intertek Provides testing and
certification services that ensure that customers’ products meet quality, health, environmental, safety, and social accountability standards. It holds extensive global accreditations, recognitions, agreements, and knowledge of and expertise in overcoming regulatory, market, and supply chain hurdles in many industries.
New product innovation, increasing end-user quality expectations, supply chain changes, quality, safety and environmental standards, growth of developing economies, global trade, industry consolidation and internationalisation of client base.
Decent ROIC of 13% but has been under pressure due to bolt-on acquisitions.
Balance sheet is satisfactory with Net Debt/FCF of 3.5. Cash generation is solid. Resilience in recessions is good.
LVMH LVMH was founded in 1987 with the merger of Louis Vuitton and Moet Hennessy. It is a leader at the top end of the global luxury market with ~11% market share. The company has five segments; fashion & leather, wines & spirits, perfume and cosmetics, watches and jewellery and selective retailing.
Demand for LVMH products is driven by increasing consumption (both in developed and developing markets) and the “desirability” of the most premium brands.
ROIC has been reasonably constant at 9-10% over the last five years. This to expand over the next five years as goodwill gets diluted as % of assets. Modest net debt position.
MasterCard A technology company in the global payments industry born into privilege (set up by the banks). Connects consumers, financial institutions, merchants, governments and businesses, enabling them to use electronic forms of payment. Acts as a franchisor, processor and adviser. Does not issue cards or extend credit. The business is highly defensible with a hard to replicate network.
Benefits from the ongoing secular shift from cash to card-based and electronic payments (85% of global transactions are still with cash or cheques, 95-99% in India and China).
Other drivers include growth in PCE and big data initiatives.
Exceptional ROIC (>70%). High incremental margins. Balance sheet is conservatively managed (net cash). Low capex requirements, strong free cash flow generation.

GuardCap UCITS Funds Plc
8
Investment Manager’s Report for the financial period from 5 December 2014 to 31 December 2015 (continued) Portfolio Companies (continued) Mead Johnson
Mead Johnson is the number two infant formula producer in the world and is the only one of the major infant formula manufacturers that operates as a standalone company. It has over one hundred years’ experience in infant formula manufacturing and industry leading expertise in immunology, which it uses to develop products for infants with allergies.
The infant formula market is projected to grow at 7% per year. This is predominantly due to increased demand for infant formulas and growing up milks as middle classes continue to emerge in the developing world. Mead should be able to grow at or above market rate owing to its high exposure to fast growing markets (China 32% of sales, Latin America 20% of sales)
Generates an industry leading ROIC which has been consistently above 40% since it listed. Balance sheet is in a good position with Net Debt/Free Cash Flow of <1x.
Moody’s An entrenched industry standard with stable market share in key ratings business. Diversification of business through Moody’s Analytics (30%+ of sales, research, data and software for financial risk analysis) boosts recurring credentials. Regulatory winner. Core market segments total ~$18 bn.
Top line drivers: GDP growth drives issuance, disintermediation, analytics, and pricing (3-4% pa). Additional secular drivers include stress testing and offshore services (banks look to reduce costs).
Mid 30% ROIC. Capex-light model. Strong free cash flow generator.
Nestle Founded in 1866, Nestle is one of the largest food and beverage companies in the world. Resilience due to breath of portfolio (20 categories) sold in over 190 countries. Brands include Nescafe, Nespresso, Milo, Nestea, Gerber, Perrier, Maggi, Buitoni, KitKat, and Purina. Nutrition, health and wellness with a strong focus on R&D.
Organic growth averaged mid-single digits over the past 10+ years. Growth driven by: core pillars of coffee, petcare, milks and infant nutrition; Emerging Markets (44% of sales); and diverse channel.
ROIC is a key management focus. ROIC has fallen following acquisitions, but then consistently recovered.
The company has historically run with debt, but very manageable given consistency of cash flows. Cash conversion improved in 2012 and 2013 due to a focus on working capital management.
GuardCap UCITS Funds Plc
9
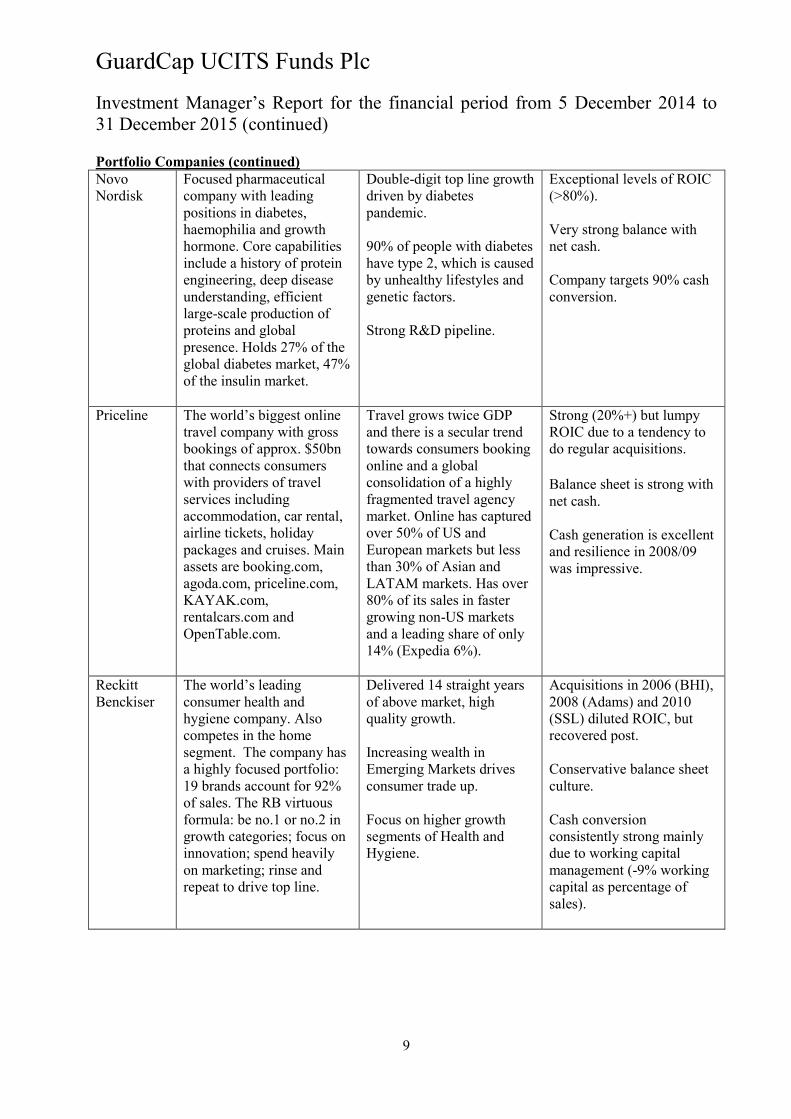
Investment Manager’s Report for the financial period from 5 December 2014 to 31 December 2015 (continued) Portfolio Companies (continued) Novo Nordisk
Focused pharmaceutical company with leading positions in diabetes, haemophilia and growth hormone. Core capabilities include a history of protein engineering, deep disease understanding, efficient large-scale production of proteins and global presence. Holds 27% of the global diabetes market, 47% of the insulin market.
Double-digit top line growth driven by diabetes pandemic. 90% of people with diabetes have type 2, which is caused by unhealthy lifestyles and genetic factors. Strong R&D pipeline.
Exceptional levels of ROIC (>80%). Very strong balance with net cash. Company targets 90% cash conversion.
Priceline The world’s biggest online travel company with gross bookings of approx. $50bn that connects consumers with providers of travel services including accommodation, car rental, airline tickets, holiday packages and cruises. Main assets are booking.com, agoda.com, priceline.com, KAYAK.com, rentalcars.com and OpenTable.com.
Travel grows twice GDP and there is a secular trend towards consumers booking online and a global consolidation of a highly fragmented travel agency market. Online has captured over 50% of US and European markets but less than 30% of Asian and LATAM markets. Has over 80% of its sales in faster growing non-US markets and a leading share of only 14% (Expedia 6%).
Strong (20%+) but lumpy ROIC due to a tendency to do regular acquisitions.
Balance sheet is strong with net cash. Cash generation is excellent and resilience in 2008/09 was impressive.
Reckitt Benckiser
The world’s leading consumer health and hygiene company. Also competes in the home segment. The company has a highly focused portfolio: 19 brands account for 92% of sales. The RB virtuous formula: be no.1 or no.2 in growth categories; focus on innovation; spend heavily on marketing; rinse and repeat to drive top line.
Delivered 14 straight years of above market, high quality growth. Increasing wealth in Emerging Markets drives consumer trade up. Focus on higher growth segments of Health and Hygiene.
Acquisitions in 2006 (BHI), 2008 (Adams) and 2010 (SSL) diluted ROIC, but recovered post. Conservative balance sheet culture. Cash conversion consistently strong mainly due to working capital management (-9% working capital as percentage of sales).

GuardCap UCITS Funds Plc
10
Investment Manager’s Report for the financial period from 5 December 2014 to 31 December 2015 (continued) Portfolio Companies (continued) Stryker One of the world’s leading
medical technology companies. The company is well diversified split into 3 segments: Reconstructive (hip, knee implants, trauma); Medical and Surgery (instruments, endoscopic cameras and beds); and Neurotechnology and Spine.
34 consecutive years of sales growth. Benefits from ageing Demographics and people want to lead more active and satisfying lives. Beneficiary of the ACA.
Strong ROIC (19%), though down from highs due to recent acquisitions. Balance Sheet has historically been managed very conservatively. Management now looking at a more efficient capital structure. Cash conversion regularly 80-100%
Tiffany Global leader in the highly fragmented luxury jewellery market with around 300 stores. It has approximately 9-12% of the high end jewellery market in the US and less elsewhere. Cartier is the next biggest competitor.
Five key industry drivers: internationalisation and consolidation; growth of branded products; a reconfigured channel landscape; hybrid consumption; and fast fashion. Branded jewellery was 10% in 2003 and now is close to 20% of the market. McKinsey expects 30-40% by 2020. A trusted brand, excellent design and strong finances are key advantages.
Decent ROIC but the need to hold sizeable inventories and have expensively decorated stores will keep it modest. Balance sheet is fine with Net debt/FCF of approximately 1.
Ulta Beauty Founded in 1990, Ulta is the largest specialty beauty retailer in the US. Operates in an attractive industry, has a winning concept (one-stop shop for prestige, mass and salon products and salon services), unit runway (797 stores, potential for 1,200+) and supply chain and CRM initiatives. Relies on vendors to innovate as newness is a significant driver of business.
Attractive category driven by ageing population, higher beauty consumption and all-natural product trend. Store growth in a sweet spot in terms of average age and back-filling. Market share gains through improved marketing, supply chain and merchandising.
Consistently impressive ROIC (20%+). No debt since 2008.

GuardCap UCITS Funds Plc
11
Investment Manager’s Report for the financial period from 5 December 2014 to 31 December 2015 (continued) Portfolio Companies (continued) United Health
UnitedHealth Group is the biggest healthcare insurer in the US. It provides health insurance benefits to over 46 million individuals predominantly through employer and government programmes.
Optum, its health services platform focuses on improving care management and delivery through its three divisions; Optum Health, Optum Rx and Optum Insight.
Management is targeting 13-16% long earnings growth. Should be able to drive this through 1) Growth in the Optum Business 2) Growth in the government business (both Medicare Advantage and Medicaid)
ROIC currently low double digits. Expect some improvement as growing contribution of Optum contributes to margin expansion. Net Debt/FCF has risen to >2x as a result of Catamaran acquisition but expect the balance sheet to deleverage to a net cash position by 2019.
YUM! Brands
Has over 40,000 restaurants in over 125 countries. Key brands include KFC (opened in 1952), Pizza Hut (1958) and Taco Bell (1962). 80% of restaurants are franchised and licensed resulting in fees and income of nearly $2 bln. A majority of the owned stores are in China; the region accounts for 52% of sales. Company announced the spin-off of the China business in late 2015.
The growth opportunity is new unit development in emerging markets: YUM! has 57 restaurants per 1 million people in the US and only 2 in its top 10 emerging markets, 5 per million in China. YUM has a very strong competitive position in China due to its first mover advantage.
Franchise model drives ROIC consistently over 20%. ROIC was hit in 2013 due to the Little Sheep acquisition, but improved to 27% in 2014. Net debt/FCF has hovered around the 2 year mark for the last few years, but moved towards 3 years in the last few years.

GuardCap UCITS Funds Plc
12
Investment Manager’s Report for the financial period from 5 December 2014 to 31 December 2015 (continued) Stock level Attribution for the financial period to 31 December 2015 Top 5 Stock Average
Portfolio Weight
Portfolio Total
Return
Total Effect
Commentary
Alphabet 6.08% 46.612 2.34% Strong organic revenue growth, consistent expense control, new CFO, improved corporate disclosure.
Ulta Salon Cosmetics
4.41% 44.712 1.76% Double-digit same-store-sales growth throughout 2015. FY guidance raised every quarter. New distribution centre successfully opened. Attractive industry, winning concept, store growth runway.
Novo Nordisk
3.91% 39.545 1.71% Overhang removed following positive FDA interim analysis of Tresiba cardiovascular data. Strong pipeline and full schedule of outcome studies.
UnitedHealth Group
5.49% 18.258 0.99% Market beating quarterly numbers driven by strength in Public and Senior, services (Optum) and lower than expected medical cost ratio.
Cognizant 6.40% 13.976 0.98% Beneficiary of the shift to digital. Consistent mid-teens organic grower in 2015 boosted by investments in digital capabilities.
Bottom 5 Stock Average
Portfolio Weight
Portfolio Total
Return
Total Effect
Commentary
Gemalto 3.87% -26.612 -1.19% SIM business impacted by Softcard contract loss and weak macro. Lack of leverage at Payments and Identity. Investor scepticism over 2017 company forecasts.
Tiffany 3.06% -27.229 -1.06% Strong USD negatively impacted tourist spend (25% of sales) in the US. Lapping tough comparisons. Lower input prices yet to feed through materially.
H&M 3.00% -11.862 -0.29% Gross margin under pressure as USD dollar strength impacts purchasing costs.
Colgate-Palmolive
3.22% -1.565 -0.02% Strong USD negatively impacted sales and gross margin.
Mead Johnson
0.64% 5.594 0.04% China weakness due to irrational pricing and channel disruption.

GuardCap UCITS Funds Plc
13
Investment Manager’s Report for the financial period from 5 December 2014 to 31 December 2015 (continued) Significant transactions During the financial period the only significant transaction in the portfolio was the addition of Mead Johnson, which represented approximately 4% position of the net asset value. Mead Johnson is a global leader in paediatric nutrition, with a scientific history that goes back over a hundred years. It develops, manufactures and markets products to meet a wide range of nutritional needs for infants, children and expectant mothers. Its Enfa family of brands is the worlds’ leading paediatric nutrition brand. Mead Johnson is an exceptionally high quality business, it has consistently generated an industry leading return on invested capital of >40% since its listing in 2009. Its competitive advantage lies in its trusted brand name, its scientific expertise and its singular focus on paediatric nutrition. Economic growth is expected to support the growth of the paediatric nutrition industry over the long term, particularly in emerging markets where US and European brands are more desirable. The category is expected to be driven by an increase in women in the work place, growing middle classes and a subsequent increase in spend on premium nutrition. The market, which is currently worth about $50bn is predicted to grow at 7% per year. With its high exposure to faster growing markets (China is 32% of sales and Latin America is 20%) Mead Johnson is well positioned to grow at or above this level. Portfolio outlook The portfolio is in excellent shape: growth prospects remain strong with revenue and EPS forecast to increase at 9% and 12% per annum respectively over the next 5 years; quality metrics are strong with net cash on the balance sheet, broad diversification, robust cash flow metrics and good corporate governance; and projected returns remain reasonable.

GuardCap UCITS Funds Plc
14
Directors’ Report The Board of Directors (the “Board”) present the audited financial statements of GuardCap UCITS Funds Plc (the “Company”) for the financial period from 5 December 2014 to 31 December 2015. Statement of Directors’ Responsibilities in respect of the financial statements The Directors are responsible for preparing the Directors' Report and financial statements in accordance with applicable law and regulations. Company law requires the Directors to prepare financial statements for each financial year. Under the law, the Directors have elected to prepare the financial statements in accordance with International Financial Reporting Standards (“IFRS”) as adopted by the European Union (“EU”) and applicable law. Under company law the Directors must not approve the financial statements unless they are satisfied that they give a true and fair view of the assets, liabilities and financial position of the Company and of its changes in net assets attributable to holders of redeemable participating shares for that period. In preparing the financial statements, the Directors are required to: select suitable accounting policies and then apply them consistently; make judgements and estimates that are reasonable and prudent; prepare the financial statements on the going concern basis unless it is inappropriate to presume
that the Company will continue in business; and state whether applicable accounting standards have been followed, subject to any material
departures disclosed and explained in the financial statements. The financial statements have been prepared in accordance with IFRS as adopted by the EU.
The Directors are responsible for keeping adequate accounting records which disclose with reasonable accuracy at any time the assets, liabilities, financial position and profit and loss of the Company and enable them to ensure that the financial statements comply with the Companies Act 2014 and the Central Bank (Supervision and Enforcement) Act 2013 (Section 48(1)) (Undertakings for Collective Investment in Transferable Securities) Regulations, 2015. The Directors have a general responsibility for taking such steps as are reasonably open to them to safeguard the assets of the Company. In this regard, they have entrusted the assets of the Company to RBC Investor Services Bank S.A., Dublin Branch who have been appointed as Custodian to the Company pursuant to the terms of a Custodian Agreement. The Directors have a general responsibility for taking such steps as are reasonably open to them to prevent and detect fraud and other irregularities. The Directors are also responsible for preparing a Directors’ Report that complies with the requirements of the Companies Act 2014. Date of Incorporation The Company has obtained the approval of the Central Bank for the establishment of the following sub-funds: GuardCap Global Equity Fund, which launched on 5 December 2014; and GuardCap Emerging Markets Equity Fund which has not yet launched. The initial investment in GuardCap Global Equity Fund (the “Fund”) was made on 10 December 2014.
GuardCap UCITS Funds Plc
15
Directors’ report (continued) Principal activities The primary investment objective of the Company is to seek long-term capital growth and it aims to achieve this as follows: GuardCap Global Equity Fund The investment objective of this Fund is to seek long-term growth of capital with lower than market volatility by investing primarily in equity and similar securities issued by high quality companies listed on recognised markets in countries which are members of the Organisation for Economic Co-operation and Development (“OECD”). Risk Management Objectives and Policies A risk management policy statement has been agreed with the Investment Manager and this sets out the rules and limits that are to be applied to investments. The risk management and compliance units within the Investment Manager, which are independent of the portfolio managers, monitor and report on the operation of these procedures. An analysis of the financial risk management objectives and policies of the Company and how these are managed is set out in Note 4 to the financial statements. Review of Business and Future Developments A comprehensive overview of the Company’s trading activities is detailed in the Investment Manager’s Report for the Fund. Results and dividends The Statement of Financial Position and Statement of Comprehensive Income for the financial period ended 31 December 2015 are set out on pages 22 to 23. No dividends were paid by the Company during the financial period. Accounting records To ensure that adequate accounting records are kept in accordance with Section 281 of the Companies Act, 2014, the Directors of the Company have employed a service organisation, RBC Investor Services Ireland Limited (“the Administrator”). The accounting records are located at the offices of the Administrator as stated on page 2. Connected Parties The Central Bank of Ireland UCITS Regulation 41(1) - “Dealings by promoter, manager, trustee, investment adviser and group companies” states in paragraph 1 that, inter alia, any transaction carried out with a UCITS by a promoter, custodian, investment manager and/or associated or group companies of these (“Connected Parties”) must be carried out as if negotiated at arm's length. Transactions must be in the best interests of the shareholders. The Board of the Company are satisfied that: (i) there are arrangements in place, to ensure that the obligations set out in paragraph 1 of the Central Bank of Ireland UCITS Regulation 41(1) are applied to all transactions with Connected Parties; and (ii) transactions with Connected Parties entered into during the financial period complied with the obligations set out in paragraph 1 of the Central Bank of Ireland UCITS Regulation 41(1).


GuardCap UCITS Funds Plc
20
Schedule of Investments As at 31 December 2015 GuardCap Global Equity Fund Quantity/ Valuation % net Description Face value Currency in USD assets 1) INVESTMENTS A) TRANSFERABLE SECURITIES ADMITTED TO AN OFFICIAL STOCK EXCHANGE LISTING 1) LISTED SECURITIES : SHARES DENMARK Novo Nordisk A/S 27,516 DKK 1,602,142 2.90 1,602,142 2.90 FRANCE Dassault Systemes 15,951 EUR 1,278,667 2.32 Essilor International SA 12,594 EUR 1,574,491 2.85 LVMH Moet Hennessy Louis Vuitton SE 10,747 EUR 1,692,175 3.06 4,545,333 8.23 GREAT BRITAIN Intertek Group Plc 63,151 GBP 2,585,397 4.68 Reckitt Benckiser Group Plc 22,146 GBP 2,050,667 3.71 4,636,064 8.39 JAPAN FANUC Corp 11,070 JPY 1,941,474 3.52 1,941,474 3.52 NETHERLANDS Gemalto NV 28,303 EUR 1,699,854 3.08 1,699,854 3.08 SWEDEN Assa Abloy AB 49,017 SEK 1,033,331 1.87 Hennes & Mauritz AB 41,158 SEK 1,472,576 2.67 2,505,907 4.54 SWITZERLAND Nestle SA 23,456 CHF 1,745,852 3.16 1,745,852 3.16

GuardCap UCITS Funds Plc
21
Schedule of Investments (continued) As at 31 December 2015 GuardCap Global Equity Fund (continued) Quantity/ Valuation % net Description Face value Currency in USD assets A) TRANSFERABLE SECURITIES ADMITTED TO AN OFFICIAL STOCK EXCHANGE LISTING (continued) 1) LISTED SECURITIES : SHARES (continued) UNITED STATES OF AMERICA Alphabet Inc 4,960 USD 3,858,930 6.99 Automatic Data Processing Inc 20,239 USD 1,714,648 3.10 CME Group Inc 17,117 USD 1,550,800 2.81 Cognizant Technology Solutions Corp 55,047 USD 3,303,920 5.98 Colgate-Palmolive Co 23,854 USD 1,589,153 2.88 MasterCard Inc 30,158 USD 2,936,183 5.32 Mead Johnson Nutrition Co 29,789 USD 2,351,842 4.26 Moody's Corp 22,349 USD 2,242,499 4.06 Priceline Group Inc 2,140 USD 2,728,393 4.94 Stryker Corp 31,130 USD 2,893,222 5.24 Tiffany & Co 20,824 USD 1,588,663 2.88 Ulta Salon Cosmetics & Fragrance Inc 14,028 USD 2,595,180 4.70 UnitedHealth Group Inc 23,570 USD 2,772,775 5.02 Yum! Brands Inc 31,533 USD 2,303,486 4.17 34,429,694 62.35 TOTAL LISTED SECURITIES : SHARES 53,106,320 96.17 TOTAL TRANSFERABLE SECURITIES ADMITTED TO AN OFFICIAL STOCK EXCHANGE LISTING 53,106,320 96.17 TOTAL FINANCIAL ASSETS AT FAIR VALUE THROUGH PROFIT OR LOSS 53,106,320 96.17 CASH AND CASH EQUIVALENTS 2,117,735 3.83 OTHER NET LIABILITIES (177) - TOTAL NET ASSETS ATTRIBUTABLE TO HOLDERS OF REDEEMABLE PARTICIPATING SHARES 55,223,878 100.00
GuardCap UCITS Funds Plc
23
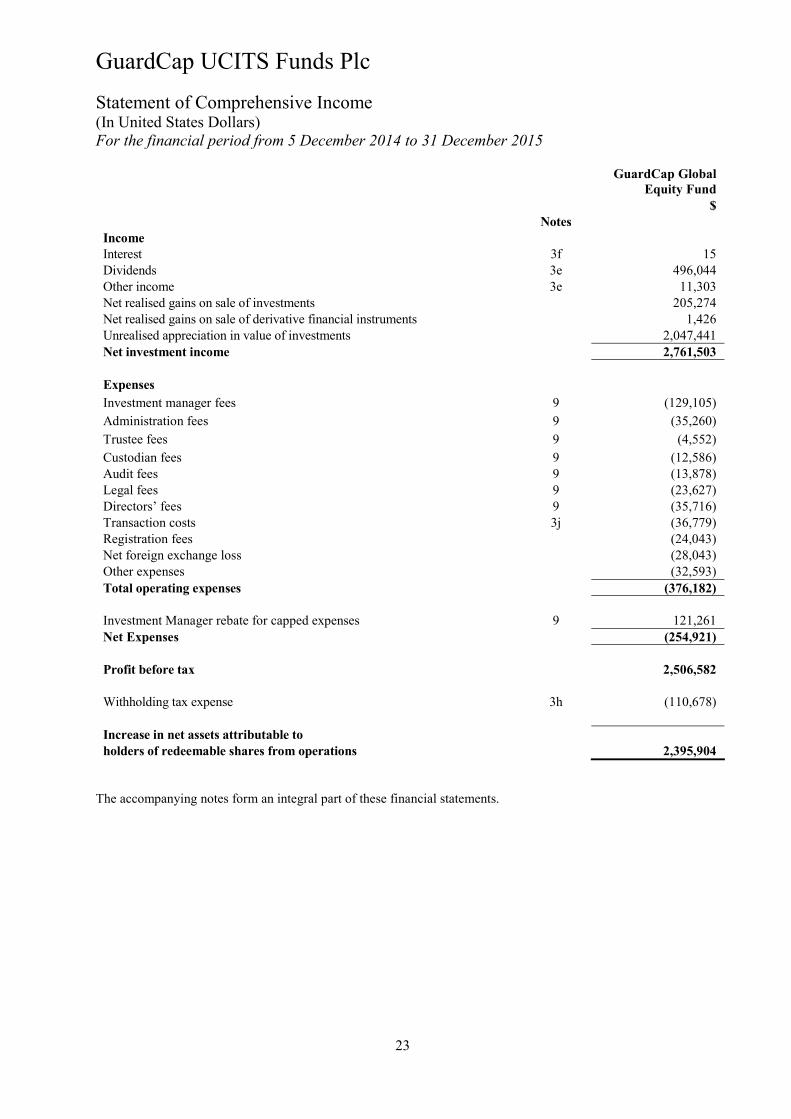
Statement of Comprehensive Income (In United States Dollars) For the financial period from 5 December 2014 to 31 December 2015
GuardCap Global
Equity Fund $ Notes Income Interest 3f 15 Dividends 3e 496,044 Other income 3e 11,303 Net realised gains on sale of investments 205,274 Net realised gains on sale of derivative financial instruments 1,426 Unrealised appreciation in value of investments 2,047,441 Net investment income 2,761,503 Expenses Investment manager fees 9 (129,105) Administration fees 9 (35,260) Trustee fees 9 (4,552) Custodian fees 9 (12,586) Audit fees 9 (13,878) Legal fees 9 (23,627) Directors’ fees 9 (35,716) Transaction costs 3j (36,779) Registration fees (24,043) Net foreign exchange loss (28,043) Other expenses (32,593) Total operating expenses (376,182) Investment Manager rebate for capped expenses 9 121,261 Net Expenses (254,921) Profit before tax 2,506,582 Withholding tax expense 3h (110,678) Increase in net assets attributable to holders of redeemable shares from operations 2,395,904
The accompanying notes form an integral part of these financial statements.
GuardCap UCITS Funds Plc
24
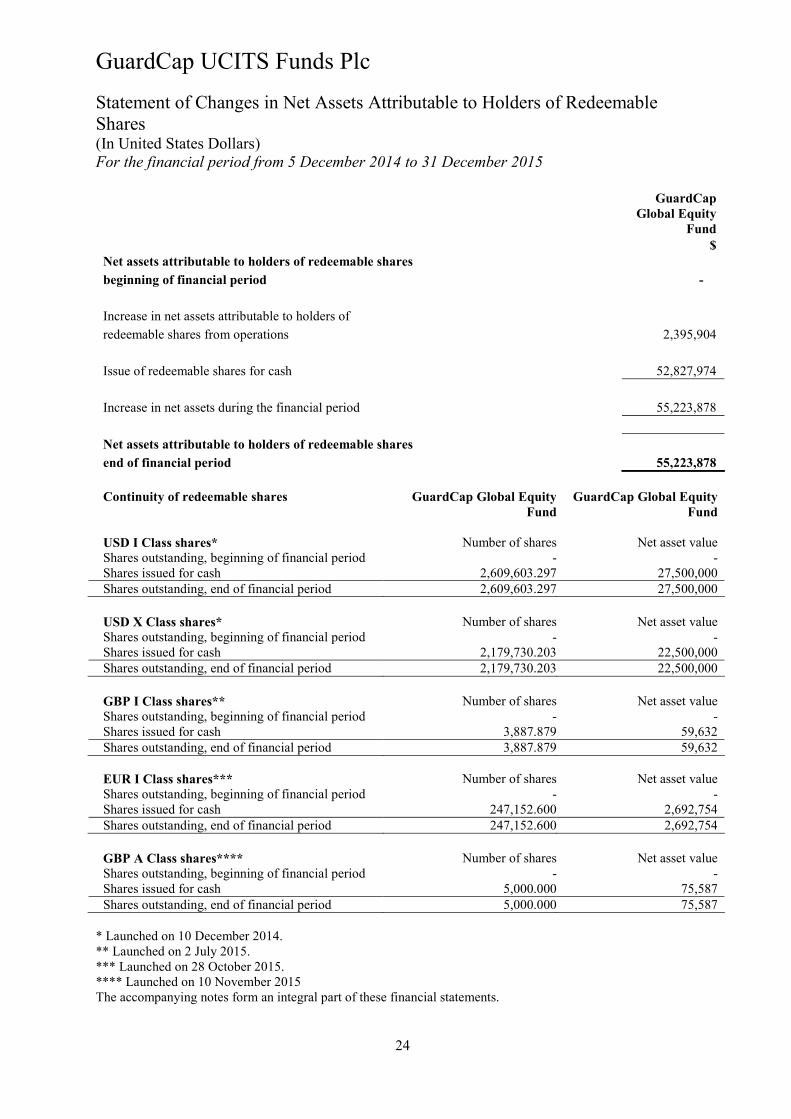
Statement of Changes in Net Assets Attributable to Holders of Redeemable Shares (In United States Dollars) For the financial period from 5 December 2014 to 31 December 2015
GuardCap Global Equity
Fund $ Net assets attributable to holders of redeemable shares beginning of financial period - Increase in net assets attributable to holders of redeemable shares from operations 2,395,904 Issue of redeemable shares for cash 52,827,974 Increase in net assets during the financial period 55,223,878 Net assets attributable to holders of redeemable shares end of financial period 55,223,878
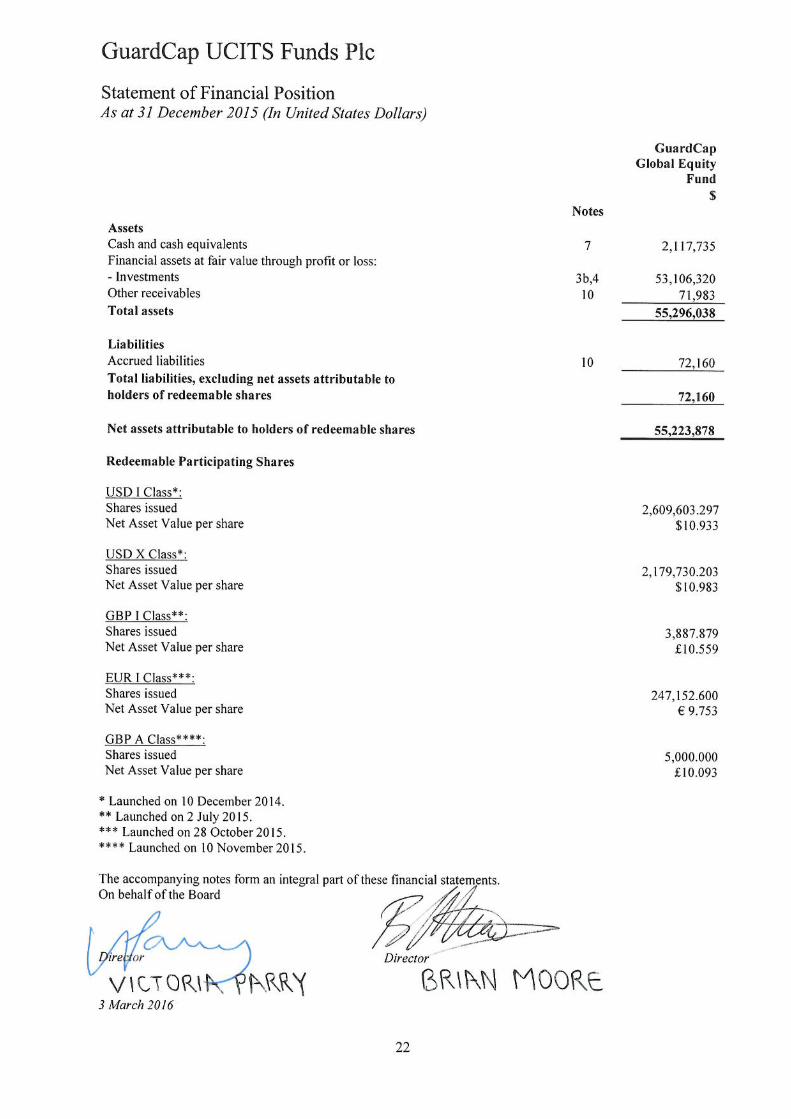
Continuity of redeemable shares GuardCap Global Equity
FundGuardCap Global Equity
Fund USD I Class shares* Number of shares Net asset value Shares outstanding, beginning of financial period - - Shares issued for cash 2,609,603.297 27,500,000 Shares outstanding, end of financial period 2,609,603.297 27,500,000 USD X Class shares* Number of shares Net asset value Shares outstanding, beginning of financial period - - Shares issued for cash 2,179,730.203 22,500,000 Shares outstanding, end of financial period 2,179,730.203 22,500,000 GBP I Class shares** Number of shares Net asset value Shares outstanding, beginning of financial period - - Shares issued for cash 3,887.879 59,632 Shares outstanding, end of financial period 3,887.879 59,632 EUR I Class shares*** Number of shares Net asset value Shares outstanding, beginning of financial period - - Shares issued for cash 247,152.600 2,692,754 Shares outstanding, end of financial period 247,152.600 2,692,754 GBP A Class shares**** Number of shares Net asset value Shares outstanding, beginning of financial period - - Shares issued for cash 5,000.000 75,587 Shares outstanding, end of financial period 5,000.000 75,587
* Launched on 10 December 2014. ** Launched on 2 July 2015. *** Launched on 28 October 2015. **** Launched on 10 November 2015 The accompanying notes form an integral part of these financial statements.

GuardCap UCITS Funds Plc
25
Statement of Cash Flows (In United States Dollars) For the financial period from 5 December 2014 to 31 December 2015
GuardCap Global Equity
Fund $ Cash flows from operating activities Change in net assets attributable to holders of redeemable shares resulting from operations 2,395,904 Cash flows from operating activities Net investment in financial assets and liabilities at fair value through profit or loss (53,106,320) Increase in other receivables (71,983) Increase in other accrued expenses 72,160 Net cash from operating activities (53,106,143) Financing activities Issue of redeemable shares for cash 52,827,974 Cash flow from financing activities 52,827,974 Net increase in cash 2,117,735 Cash and cash equivalents, beginning of financial period - Cash and cash equivalents, end of financial period 2,117,735 Supplemental disclosure of cash flow information: Interest received 15 Dividends received 434,021 Interest paid (193) The accompanying notes form an integral part of these financial statements.

GuardCap UCITS Funds Plc Notes to Financial Statements For the financial period from 5 December 2014 to 31 December 2015
26
1. Reporting entity
GuardCap UCITS Funds Plc (“the Company”) is an open-ended investment company with variable capital incorporated in Ireland on 31 October 2014 under the laws of Ireland as a public limited company pursuant to the Companies Act 2014 under registration number 552001. The Company has been authorised by the Central Bank of Ireland (the ‘Central Bank’) as an Undertaking for Collective Investment in Transferable Securities (‘UCITS’) under the Central Bank (Supervision and Enforcement) Act 2013 (Section 48(1)) (Undertakings for Collective Investment in Transferable Securities) Regulations 2015 (“UCITS Regulations”) and has been established as an umbrella fund with segregated liability between funds and will comply with the Central Bank’s UCITS Regulations. The Company’s principal objective is to invest in transferable securities and other liquid assets listed or traded on recognised markets and, to the limited extent specified in the relevant Supplement, in units or shares of other investment funds, all in accordance with the UCITS Regulations operating on the principle of risk spreading. The Company has obtained the approval of the Central Bank for the establishment of the following sub-funds: GuardCap Global Equity Fund, which launched on 5 December 2014; and GuardCap Emerging Markets Equity Fund which has not yet launched. The initial investment in GuardCap Global Equity Fund (the “Fund”) was made on 10 December 2014.
GuardCap Global Equity Fund The investment objective of this Fund is to seek long-term growth of capital with lower than market volatility by investing primarily in equity and similar securities issued by high quality companies listed on recognised markets in countries which are members of the Organisation for Economic Co-operation and Development (“OECD”). This Fund will invest primarily in equity and similar securities listed on recognised markets in the OECD, and, in particular, the United States and Western European OECD countries.
GuardCap Emerging Markets Equity Fund The investment objective of this Fund is to seek long-term growth of capital with lower than market volatility by investing primarily in equity and similar securities issued by high quality companies listed on recognised markets of emerging market countries. This Fund will invest primarily in equity and similar securities listed on recognised markets of emerging market countries. Securities similar to equity securities include convertible bonds, convertible preferred stock and depositary receipts. Convertible bonds enable the holder to convert their investment in the bonds into the issuer’s common stock at a pre-agreed price and convertible preferred stocks enable the holder to convert their investment in the preferred stock into the issuer’s common stock at a pre-agreed rate. Convertible bonds and convertible preferred stocks embed options and may therefore be leveraged. Depositary receipts generally evidence an ownership interest in a corresponding foreign security on deposit with a financial institution.

GuardCap UCITS Funds Plc Notes to Financial Statements For the financial period from 5 December 2014 to 31 December 2015 (continued)
27
2. Basis of preparation
(a) Statement of compliance The financial statements for the financial period from 5 December 2014 to 31 December 2015 are prepared in accordance with IFRS as adopted by the EU and in accordance with the requirements of the Companies Act 2014 (the “Acts”).
The accounting policies set out below have, unless otherwise stated, been applied to these financial statements.
(b) Basis of measurement
These financial statements have been prepared on the historical cost basis except for financial instruments at fair value through profit or loss, which are measured at fair value.
All references to net assets, or net asset value (“NAV”) throughout this document refer to net assets attributable to holders of redeemable participating shares unless otherwise stated.
(c) Functional and presentation currency The financial statements are presented in United States Dollars (“USD”) which is also the functional currency.
(d) Use of estimates and judgements The preparation of the financial statements in conformity with IFRSs requires management to make judgements, estimates and assumptions that affect the application of accounting policies and the reported amount of assets, liabilities, income and expenses. Actual results may differ from these estimates. Estimates and underlying assumptions are reviewed on an ongoing basis. Revisions to accounting estimates are recognised in the year in which the estimates are revised and in any future years affected. There were no estimates used in measuring the fair value of investments during the financial period from 5 December 2014 to 31 December 2015.
3. Significant accounting policies
(a) New standards and interpretations not yet adopted
The final version of IFRS 9, Financial Instruments, was issued by the IASB in July, 2014, and will replace IAS 39 Financial Instruments: Recognition and Measurement. IFRS 9 introduces a model for classification and measurement, a single, forward-looking ‘expected loss’ impairment model and a substantially reformed approach to hedge accounting. The new single principle-based approach for determining the classification of financial assets is driven by cash flow characteristics and the business model in which an asset is held. The new model also results in a single impairment model being applied to all financial instruments, which will require more timely recognition of expected credit losses.
IFRS 9 is effective for annual periods beginning on or after January 1, 2018, but is available for early adoption. The Company is in the process of assessing the impact of IFRS 9.

GuardCap UCITS Funds Plc Notes to Financial Statements For the financial period from 5 December 2014 to 31 December 2015 (continued)
28
3. Significant accounting policies (continued)
(a) New standards and interpretations not yet adopted (continued)
In December 2014, the IASB issued Investment Entities: Applying the Consolidation Exception (Amendments to IFRS 10, IFRS 12 and IAS 28), effective for annual periods beginning on or after 1 January 2016. This amendment requires an investment entity to measure all investment entity subsidiaries at fair value through profit or loss, regardless of whether they provide investment related services. This amendment is not expected to have an impact on the presentation of the Company’s financial statements.
(b) Financial instruments
(i) Classification The Company classifies its investments into the financial assets and financial liabilities at fair value through profit or loss (“FVTPL”) as follows: FVTPL: Held for trading (“HFT”): derivative financial instruments, securities sold short and
securities acquired for the purpose of selling in the near term, or for which there is evidence of short-term profit taking are considered to be HFT.
Designated upon initial recognition as FVTPL: all other investments in equity and debt securities.
Amortised cost: Loans and receivables: cash, balances due from brokers and other receivables. Other liabilities – balances due to brokers, redeemable units and other payables.
(ii) Recognition The Company recognises financial instruments at fair value upon initial recognition, plus transaction costs in the case of financial instruments not measured at FVTPL. Purchases and sales of financial instruments are recognised at their trade date. Under the amortised cost method, financial assets and liabilities reflect the amount required to be received or paid, discounted, when appropriate, at the contract’s effective interest rate. Amortised cost substantially equals the fair value of these financial instruments due to their short term nature. The Company’s obligation for net assets attributable to shareholders is presented at the redemption amount, which approximates fair value. (iii) Impairment A financial asset not classified at fair value through profit or loss is assessed at each reporting date to determine whether there is objective evidence of impairment. A financial asset or a group of financial assets is ‘impaired’ if there is objective evidence of impairment as a result of one or more events that occurred after the initial recognition of the asset(s) and that loss event(s) had an impact on the estimated future cash flows of that asset(s) that can be estimated reliably.

GuardCap UCITS Funds Plc Notes to Financial Statements For the financial period from 5 December 2014 to 31 December 2015 (continued)
29
3. Significant accounting policies (continued)
(b) Financial instruments (continued) (iii) Impairment (continued) Objective evidence that financial assets are impaired includes significant financial difficulty of the borrower or issuer, default or delinquency by a borrower, restructuring of the amount due on terms that the Company would not otherwise consider, indications that a borrower or issuer will enter bankruptcy, or adverse changes in the payment status of the borrowers. An impairment loss in respect of a financial asset measured at amortised cost is calculated as the difference between its carrying amount and the present value of the estimated future cash flows discounted and the asset’s original effective interest rate. Losses are recognised in profit or loss and reflected in an allowance account against receivables. Interest on the impaired asset continues to be recognised if an event occurring after the impairment was recognised causes the amount of impairment loss to decrease, then the decrease in impairment loss is reversed through profit or loss. (iv) Derecognition The Company derecognises a financial asset when the contractual rights to the cash flows from the financial asset expire or the Company transfers the financial asset and the transfer qualifies for derecognition in accordance with IAS 39 Financial Instruments: Recognition and Measurement. The Company derecognises a financial liability when the obligation specified in the contract is discharged, cancelled or expires. Assets held for trading that are sold are derecognised and corresponding receivables from the buyer for the payment are recognised as of the date the Company commits to sell the assets. The Company uses the first in first out method to determine the gain or loss on derecognition.
(c) Redeemable participating shares The Fund has five classes of redeemable participating shares in issue as at 31 December 2015: USD I Class shares, USD X Class shares, GBP I Class shares, EUR I Class shares and GBP A class shares (collectively the “Shares”). These Shares provide investors with the right to require redemption at a value proportionate to the investor’s share in the Fund’s NAV at each redemption date and also in the event of the Fund’s liquidation. The Shares are classified as financial liabilities and are measured at the present value of the redemption amounts.
(d) Fair value measurement
Fair value is the price that would be received on the sale of an asset or paid to retire a liability in an orderly transaction between market participants at the measurement date. When available, the Company measures the fair value of a financial instrument using the last traded market price in an active market for that instrument. A market is regarded as active if quoted prices are readily and regularly available and represent actual and regularly occurring market transactions on an arm’s length and orderly basis. Securities, including debt and equity securities, that are listed upon a recognised public stock exchange are valued at last traded market prices for both financial assets and liabilities.
GuardCap UCITS Funds Plc Notes to Financial Statements For the financial period from 5 December 2014 to 31 December 2015 (continued)
30
3. Significant accounting policies (continued) (d) Fair value measurement (continued)
In circumstances where the last traded price is not available for any reason, or such prices are deemed to not represent fair value, the value thereof shall be the probable realisation value which must be estimated in good faith by such competent person as may be appointed by the Directors and approved for the purpose by the Custodian.
Investment funds are valued at the closing NAV per unit reported by the Administrators of such funds. If a market for a financial instrument is not active, or a security is not listed upon a recognised stock exchange, the Fund establishes fair value using valuation techniques. Valuation techniques include using recent arm’s length transactions between knowledgeable, willing parties, referring to the current fair value of other instruments that are substantially the same, discounted cash flow analyses and other models. The selected technique makes maximum use of market inputs, relies as little as possible on estimates specific to such Fund, incorporates all factors that market participants would consider in setting a price and is consistent with accepted methodologies for pricing financial instruments. Inputs to valuation techniques reasonably represent market expectations and measures of risk-return factors inherent in the financial instruments.
(e) Income recognition
Total income/(loss) includes dividends, interest, net realised gains/(losses) on sale of investments, changes in unrealised appreciation/(depreciation) in value of investments, net realised gains/(losses) on derivative financial instruments, change in unrealised appreciation/(depreciation) on derivative financial instruments, and foreign exchange gains/(losses) on cash. Dividend income is recognised on the ex-dividend date. The interest represents the coupon interest received by the Fund, accounted for on an accrual basis. The Fund does not amortise premiums paid or discounts received on the purchase of fixed income securities, except for zero coupon fixed income securities which are amortised on a straight line basis over the term to maturity. Net realised gains/(losses) on sale of investments and change in unrealised appreciation/(depreciation) in investments are determined on an average cost basis. All other FVTPL investments: dividend income, interest income for distribution purposes, net realised gains/(losses) on sale of investments, and change in unrealised appreciation/(depreciation) in value of investments.
(f) Interest income and interest expense
Interest income and interest expense are recognised on an accruals basis using the effective interest method in line with the contractual terms. The effective interest rate is the rate that exactly discounts the estimated future cash payments or receipts, without consideration of future credit losses, over the expected life of the financial instrument or through to the next market based repricing date to the net carrying amount of the financial instrument on initial recognition.
GuardCap UCITS Funds Plc Notes to Financial Statements For the financial period from 5 December 2014 to 31 December 2015 (continued)
31
3. Significant accounting policies (continued) (g) Foreign currency
Assets and liabilities denominated in currencies other than USD, the functional currency, are translated into USD at prevailing exchange rates at each financial period end. Transactions during the financial period are translated into USD at the rate of exchange prevailing on the date of the transaction. Foreign currency differences arising on transactions and the restatement of the year end assets and liabilities, are recognised in the Statement of Comprehensive Income as net foreign exchange gain/(loss), except for those arising on financial instruments at fair value through profit or loss, which are recognised as a component of net gain/(loss) from financial instruments at fair value through profit or loss.
(h) Income tax Dividend and interest income received by the Fund might be subject to withholding tax imposed in the country of origin. Income that is subject to such tax is recognised gross of the taxes and the corresponding withholding tax is recognised as tax expense in the Statement of Comprehensive Income.
(i) Cash and cash equivalents Cash and cash equivalents include balances held with the Custodian including overnight deposits and other liabilities due to the Custodian. Cash equivalents are short-term highly liquid investments that are readily convertible to known amounts of cash and are subject to an insignificant risk of changes in value.
(j) Transaction costs
Transaction costs include fees and commissions paid to agents, advisers, brokers and dealers, levies by regulatory agencies and security exchanges, and transfer taxes and duties. Transaction costs do not include debt premiums or discounts, financing costs or internal administrative or holding costs.
Transaction costs on purchases and sales of equities are included in net gains (losses) on financial assets and liabilities at fair value through profit or loss in the Statement of Comprehensive Income.
(l) Offsetting financial instruments
Financial assets and liabilities may be offset and the net amount reported in the Statement of Financial Position when there is a legally enforceable right to set-off the recognised amounts and there is an intention to settle on a net basis, or realise the assets and settle the liability simultaneously. There were no netting agreements in place for financial period ended 31 December 2015.
GuardCap UCITS Funds Plc Notes to Financial Statements For the financial period from 5 December 2014 to 31 December 2015 (continued)
32
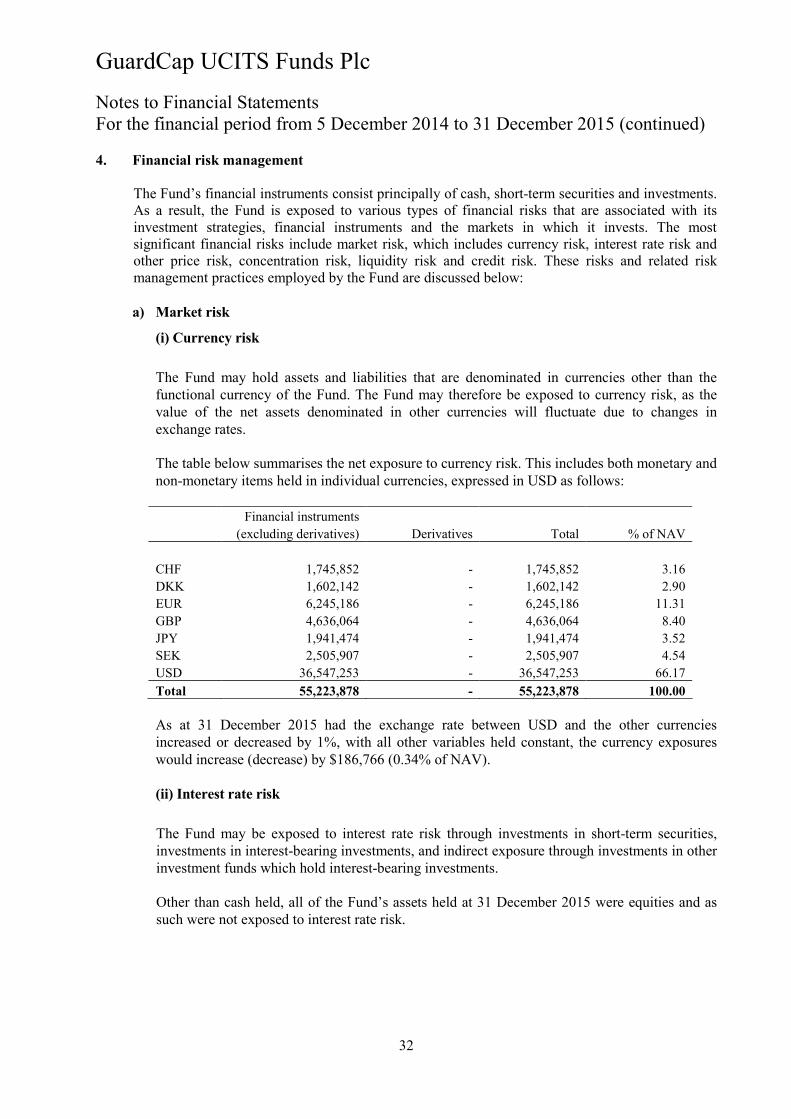
4. Financial risk management The Fund’s financial instruments consist principally of cash, short-term securities and investments. As a result, the Fund is exposed to various types of financial risks that are associated with its investment strategies, financial instruments and the markets in which it invests. The most significant financial risks include market risk, which includes currency risk, interest rate risk and other price risk, concentration risk, liquidity risk and credit risk. These risks and related risk management practices employed by the Fund are discussed below:
a) Market risk
(i) Currency risk
The Fund may hold assets and liabilities that are denominated in currencies other than the
functional currency of the Fund. The Fund may therefore be exposed to currency risk, as the value of the net assets denominated in other currencies will fluctuate due to changes in exchange rates. The table below summarises the net exposure to currency risk. This includes both monetary and non-monetary items held in individual currencies, expressed in USD as follows:
Financial instruments (excluding derivatives) Derivatives Total % of NAV
CHF 1,745,852 - 1,745,852 3.16 DKK 1,602,142 - 1,602,142 2.90 EUR 6,245,186 - 6,245,186 11.31 GBP 4,636,064 - 4,636,064 8.40 JPY 1,941,474 - 1,941,474 3.52 SEK 2,505,907 - 2,505,907 4.54 USD 36,547,253 - 36,547,253 66.17 Total 55,223,878 - 55,223,878 100.00
As at 31 December 2015 had the exchange rate between USD and the other currencies increased or decreased by 1%, with all other variables held constant, the currency exposures would increase (decrease) by $186,766 (0.34% of NAV).
(ii) Interest rate risk
The Fund may be exposed to interest rate risk through investments in short-term securities, investments in interest-bearing investments, and indirect exposure through investments in other investment funds which hold interest-bearing investments. Other than cash held, all of the Fund’s assets held at 31 December 2015 were equities and as such were not exposed to interest rate risk.

GuardCap UCITS Funds Plc Notes to Financial Statements For the financial period from 5 December 2014 to 31 December 2015 (continued)
33
4. Financial risk management (continued)
a) Market risk (continued) (iii) Other price risk
Other price risk is the risk that the fair value of a financial instrument will fluctuate as a result of changes in prices. The investments of the Fund are subject to price fluctuations and the risks inherent in financial markets. The Investment Manager moderates this risk through a careful selection of securities and derivatives within specified limits as outlined in the investment policies of the Fund, and through diversification of the investment portfolios. The Investment Manager monitors the Fund’s overall market positions on a daily basis, and positions are maintained within established ranges. The following table summarises the investments subject to other price risk: As at 31 December 2015 Other price risk 53,106,320 % of NAV 96.17% If the prices for the equity investments held by the Fund increased or decreased by 5%, with all other variables held constant, this would have increased or decreased the NAV as follows: As at 31 December 2015 Change in NAV 2,655,316 % of NAV 4.81% In practise, the trading results could differ, and the differences could be material.
b) Concentration risk The Fund is exposed to the possible risk inherent in the concentration of the investment portfolios in a small number of industries, investment sectors and/or countries. The Investment Manager moderates this risk through a careful selection of securities in several investment sectors within established ranges. The table below summarises the net exposure to geographic concentration as a percentage of NAV: Countries, as at 31 December 2015 United States of America 62.35% Great Britain 8.39% France 8.23% Sweden 4.54% Japan 3.52% Switzerland 3.16% Netherlands 3.08% Denmark 2.90% Total 96.17%

GuardCap UCITS Funds Plc Notes to Financial Statements For the financial period from 5 December 2014 to 31 December 2015 (continued)
34
4. Financial risk management (continued)
b) Concentration risk (continued) The table below summarises the net exposure to concentration of investment sectors as a percentage of NAV: Investment sectors, as at 31 December 2015 IT Services 14.42% Specialty Retail 10.25% Health Care Equipment & Supplies 8.09% Food Products 7.42% Internet Software & Services 6.99% Diversified Financial Services 6.87% Household Products 6.59% Software 5.39% Health Care Providers & Services 5.02% Internet & Catalog Retail 4.94% Professional Services 4.68% Hotels Restaurants & Leisure 4.17% Machinery 3.51% Textiles, Apparel & Luxury Goods 3.06% Pharmaceuticals 2.90% Building Products 1.87% Total 96.17%
c) Liquidity risk Liquidity risk is the risk that the Company will encounter difficulty in meeting obligations associated with financial liabilities. The main liquidity risk to the Company arises from the redemption requests of investors. The Company’s shareholders may redeem their shares on each Dealing Day for cash equal to a proportionate share of the Company’s net asset value and it is therefore potentially exposed to the liquidity risk of meeting the daily redemptions by its shareholders. In order for the Company to meet these requests, the Company may need to dispose of the underlying assets at an inopportune time. To help manage this risk, if the number of shares to be redeemed on any Dealing Day equals 10% or more of the total number of shares of the Fund in issue on that day, the Directors or their delegate may at their discretion refuse to redeem any shares in excess of 10% of the total number of shares in issue as aforesaid. If the Directors so refuse, the requests for redemption on such Dealing Day shall be reduced pro-rata and shares which are not redeemed by reason of such refusal shall be treated as if a request for redemption had been made in respect of each subsequent Dealing Day until all shares to which the original request related have been redeemed. The Fund’s listed securities are considered readily realisable, as they are quoted in reputable stock exchanges. The Fund has the ability to borrow in the short term to ensure settlement. No such borrowings arose during the financial period.
GuardCap UCITS Funds Plc Notes to Financial Statements For the financial period from 5 December 2014 to 31 December 2015 (continued)
35
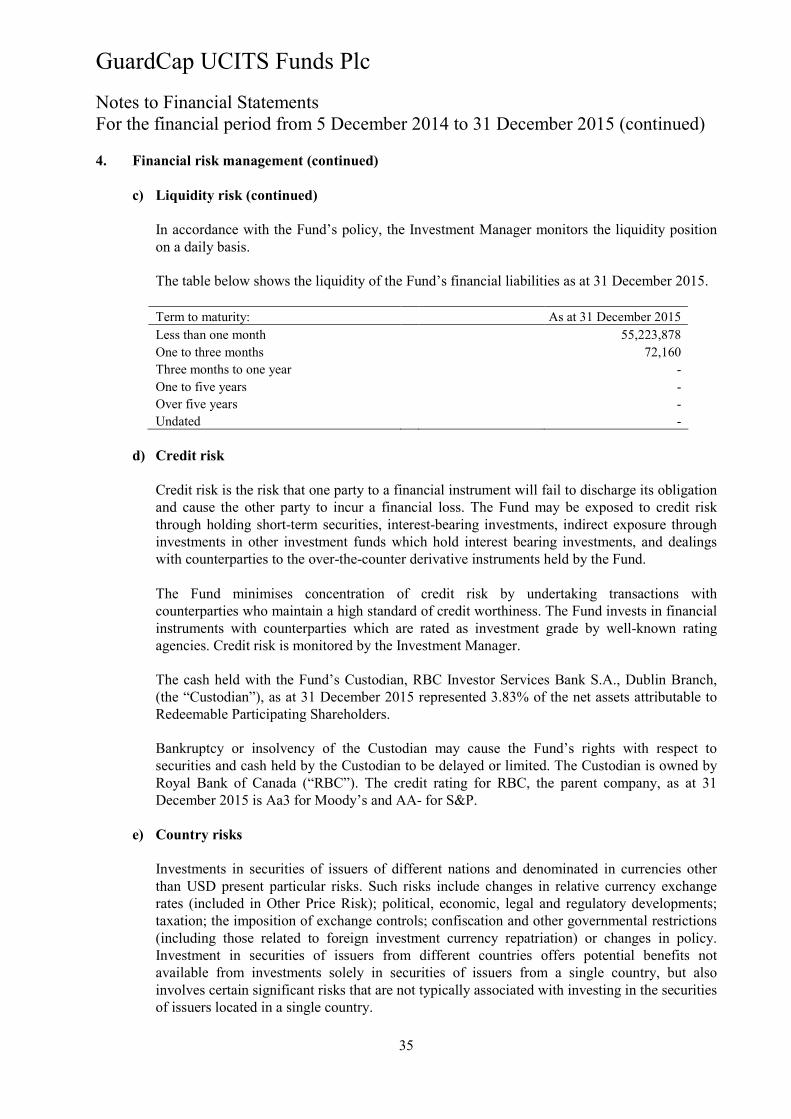
4. Financial risk management (continued)
c) Liquidity risk (continued) In accordance with the Fund’s policy, the Investment Manager monitors the liquidity position on a daily basis.
The table below shows the liquidity of the Fund’s financial liabilities as at 31 December 2015. Term to maturity: As at 31 December 2015 Less than one month 55,223,878 One to three months 72,160 Three months to one year - One to five years - Over five years - Undated -
d) Credit risk
Credit risk is the risk that one party to a financial instrument will fail to discharge its obligation and cause the other party to incur a financial loss. The Fund may be exposed to credit risk through holding short-term securities, interest-bearing investments, indirect exposure through investments in other investment funds which hold interest bearing investments, and dealings with counterparties to the over-the-counter derivative instruments held by the Fund. The Fund minimises concentration of credit risk by undertaking transactions with counterparties who maintain a high standard of credit worthiness. The Fund invests in financial instruments with counterparties which are rated as investment grade by well-known rating agencies. Credit risk is monitored by the Investment Manager. The cash held with the Fund’s Custodian, RBC Investor Services Bank S.A., Dublin Branch, (the “Custodian”), as at 31 December 2015 represented 3.83% of the net assets attributable to Redeemable Participating Shareholders. Bankruptcy or insolvency of the Custodian may cause the Fund’s rights with respect to securities and cash held by the Custodian to be delayed or limited. The Custodian is owned by Royal Bank of Canada (“RBC”). The credit rating for RBC, the parent company, as at 31 December 2015 is Aa3 for Moody’s and AA- for S&P.
e) Country risks Investments in securities of issuers of different nations and denominated in currencies other than USD present particular risks. Such risks include changes in relative currency exchange rates (included in Other Price Risk); political, economic, legal and regulatory developments; taxation; the imposition of exchange controls; confiscation and other governmental restrictions (including those related to foreign investment currency repatriation) or changes in policy. Investment in securities of issuers from different countries offers potential benefits not available from investments solely in securities of issuers from a single country, but also involves certain significant risks that are not typically associated with investing in the securities of issuers located in a single country.

GuardCap UCITS Funds Plc Notes to Financial Statements For the financial period from 5 December 2014 to 31 December 2015 (continued)
36
4. Financial risk management (continued)
f) Counterparty risk
The Fund is exposed to a credit risk on parties with which it trades and will also bear the risk of settlement default. Counterparty risk involves the risk that a counterparty or third party will not fulfill its obligations to the Fund. The Fund may be exposed to counterparty risk through investments such as securities lending and forward contracts. The Investment Manager may instruct the Custodian to settle transactions on a delivery free of payment basis where they believe that this form of settlement is appropriate. There were no derivatives held at 31 December 2015.
g) Efficient portfolio management
The Company will employ an investment risk management process, which enables it to accurately monitor, measure and manage the risks attached to financial derivative instruments (“FDIs”). Efficient portfolio management means investment decisions involving transactions that are entered into for one or more of the following specific aims: 1. the reduction of risk; 2. the reduction of cost; or 3. the generation of additional capital or income for the UCITS with an appropriate level of risk, taking into account the risk profile of the UCITS and the general provisions of the UCITS directives.
Investment techniques and FDIs may be used for efficient portfolio management or investment purposes within the limits of the Company’s prospectus. There were no financial derivative instruments held at 31 December 2015.
h) Global exposure to financial derivative instruments
The Investment Manager has assessed the risk profile of the Fund on the basis of the investment policy, strategy and the use of financial derivative instruments. Based on the risk profile, the Company has determined that the method for the calculation of the global exposure to financial derivative instruments for the Fund will be the commitment approach, where the Fund holds financial derivative instruments.
There were no financial derivative instruments held at 31 December 2015.
i) Custody and title risk
The Custodian is under a duty to take into custody and to hold the property of each sub-fund of the Company on behalf of its shareholders. The Central Bank of Ireland requires the Custodian to hold legally separately the non-cash assets of each sub-fund and to maintain sufficient records to clearly identify the nature and amount of all assets that it holds, the ownership of each asset and where the documents of title to such assets are physically located. When the Custodian employs a sub-custodian, the Custodian retains responsibility for the assets of the sub-fund.

GuardCap UCITS Funds Plc Notes to Financial Statements For the financial period from 5 December 2014 to 31 December 2015 (continued)
37
4. Financial risk management (continued)
i) Custody and title risk (continued) However, it should be noted that not all jurisdictions have the same rules and regulations as Ireland regarding the custody of assets and the recognition of the interests of a beneficial owner such as a sub-fund. Therefore, in such jurisdictions, there is a risk that if a sub-custodian becomes bankrupt or insolvent, the sub-fund’s beneficial ownership of the assets held by such sub-custodian may not be recognised and consequently the creditors of the sub-custodian may seek to have recourse to the assets of the sub-fund. In those jurisdictions where the sub-fund’s beneficial ownership of its assets is ultimately recognised, the sub-fund may suffer delay and cost in recovering those assets. If the Fund invests in markets where custodial and/or settlement systems are not fully developed, such as Russia and Argentina, the assets of the Fund which are traded in such markets and which have been entrusted to sub-custodians, in circumstances where the use of such sub-custodians is necessary, may be exposed to risk in circumstances whereby the Custodian will have no liability.
5. Classification of financial instruments for fair value measurements
Financial instruments are recorded at fair value, and have been categorised based upon a fair value hierarchy. Fair values, based on quoted market prices (Level 1), internal models using observable market information as inputs (Level 2) and internal models without observable market information as inputs (Level 3), of investments are summarised as follows:
As at 31 December 2015 Level 1 Level 2 Level 3 Total Equity investments 53,106,320 - - 53,106,320 Total 53,106,320 - - 53,106,320 Percentage of total investments 100.00% 0.00% 0.00% 100.00%
The carrying values of cash, subscriptions receivable, interest receivable, payable for investments purchased, redemptions payable, distributions payable, accrued liabilities and each Fund’s obligation for NAV substantially equals their fair values due to their short-term nature. Fair values are classified as Level 1 when the related security or derivative is actively traded and a quoted price is available. If an instrument classified as Level 1 subsequently ceases to be actively traded, it is transferred out of Level 1, and reclassified into Level 2, unless the measurement of its fair value requires the use of significant unobservable inputs, in which case it is classified as Level 3.
Equity investments Investments are classified as Level 1 when the investment is actively traded and a reliable price is observable. Some of the Funds’ equity investments do not trade frequently and, therefore, observable prices may not be available. In such cases, fair value is determined using observable market data (e.g., transactions for similar securities of the same issuer), and the fair value is classified as Level 2, unless the determination of fair values requires significant unobservable data, in which case the measurement is classified as Level 3.
There were no transfers of securities between levels for the financial period ending 31 December 2015.
Assets and liabilities not carried at fair value Cash with deposit institutions and all other assets and liabilities not carried at fair value are classified as Level 2 for the Fund.
GuardCap UCITS Funds Plc Notes to Financial Statements For the financial period from 5 December 2014 to 31 December 2015 (continued)
38
5. Classification of financial instruments for fair value measurements (continued)
Assets and liabilities not carried at fair value (continued) The fair value of these instruments has not been disclosed because their carrying amounts represent a reasonable approximation of fair value.
6. Taxation
The Company is an investment undertaking as defined in Section 739B of the Taxes Consolidation Act, 1997. Therefore, the Company will not be liable to Irish tax in respect of its income and gains, other than on the occurrence of a chargeable event. A chargeable event includes any distribution payments to shareholders or any encashment, redemption or transfer of shares or the ending financial year for which the investment was held. Generally a chargeable event arises on any distribution, redemption, repurchase, cancellation, transfer of shares or the ending of a ‘Relevant Period’. A ‘Relevant Period’ is an eight year period beginning with the acquisition of the shares by the shareholder and each subsequent period of eight years beginning immediately after the preceding Relevant Period.
A gain on a chargeable event does not arise in respect of:
a) a shareholder who is not an Irish resident and not ordinarily resident in Ireland at the time of
the chargeable event, provided the necessary signed statutory declarations are held by the Company;
b) certain exempted Irish tax resident Investors who have provided the Company with the
necessary signed statutory declarations; c) an exchange of shares arising on a qualifying amalgamation or reconstruction of the
Company with another fund; d) any transactions in relation to shares held in a recognised clearing system as designated by
order of the Revenue Commissioners of Ireland; e) certain exchanges of shares between spouses and former spouses on the occasion of judicial
separation and/or divorce; f) an exchange by a shareholder, effected by way of an arm’s length bargain where no payment
is made to the shareholder of shares in the Company for other shares in the Company. Capital gains, dividends and interest (if any) received on investment made by the Company may be subject to withholding taxes imposed by the country from which the investment income/gains are received and such taxes may not be recoverable by the Company or its shareholders. In the absence of an appropriate declaration, the Company will be liable for Irish tax on the occurrence of a chargeable event, and the Company reserves its right to withhold such taxes from the relevant shareholders.
GuardCap UCITS Funds Plc Notes to Financial Statements For the financial period from 5 December 2014 to 31 December 2015 (continued)
39
7. Cash and cash equivalents
During the financial period all cash was held with RBC Investor Services Bank S.A., Dublin Branch.
8. Soft commissions
Soft commissions represent formal pre-arranged commitments whereby fund brokerage commissions are allocated according to a pre-determined formula as payment for certain products or services other than order execution. There were no soft commissions during the financial period.
9. Fees
Investment Management fees The Investment Manager will receive a management fee (the "Management Fee") in respect of each A Class of Shares for management services to the Fund, equal to an annualised rate of up to 1.0% of the NAV attributable to each A Class of Shares. The Investment Manager will receive a Management Fee in respect of each I Class of Shares for management services to the Fund, equal to an annualised rate of up to 0.80% of the NAV attributable to each I Class of Shares. The Investment Manager will not receive a Management Fee in respect of each X Class of Shares. Investors will pay the Investment Manager such fees in respect of the X Class of Shares as may be separately agreed with the Investment Manager and payable directly by investors to the Investment Manager. The Management Fee, which is considered to be a related party transaction, is accrued daily and paid monthly in arrears. For purposes of calculating the Management Fee, the NAV of the Fund attributable to a class is determined by or under the direction of the Directors, based on the Fund's NAV as of the close of the prior Business Day adjusted to reflect any applicable redemptions and subscriptions. Notwithstanding the foregoing, the Investment Manager may, in its sole discretion, during any period, elect to waive a portion of its fees with respect to the Fund or any class without notice to shareholders. In addition, the Fund may issue shares of a separate class that may calculate the management fee differently or charge a lower management fee. Investment management fees for the financial period amounted to USD 129,105. Investment management fees outstanding as at 31 December 2015 were USD 21,318. Administration and Custodian fees The Administrator and Custodian will be entitled to receive fees calculated as a percentage of the NAV of each sub-fund for the provision, respectively, of administration, accounting, trustee and custodial services to the Company as set out in the relevant Supplement. Each fund may be subject to a combined monthly minimum fee in respect of administration, accounting and trustee services. The Administrator will also be entitled to receive certain other fees, including for financial reporting services in respect of the Company and for each sub-fund in respect of transfer agency services in respect of the relevant class of shares.

GuardCap UCITS Funds Plc Notes to Financial Statements For the financial period from 5 December 2014 to 31 December 2015 (continued)
40
9. Fees (continued) Administration and Custodian fees (continued) The Administrator and Custodian will also be reimbursed by the Company out of the assets of the relevant sub-fund for reasonable out-of-pocket expenses incurred by them. The Custodian will also be paid by the Company out of the assets of the relevant sub-fund for transaction fees (which will not exceed normal commercial rates) and fees and reasonable out-of-pocket expenses of any sub-custodian appointed by the Custodian. The Administrator and Custodian may also charge each sub-fund certain other additional fees for services that may be required from time to time. The fees and expenses of the Administrator and Custodian are accrued daily and are payable monthly in arrears.
Administration Fees for the financial period amounted to USD 35,260. Administration Fees outstanding as at 31 December 2015 were USD 11,472. Custodian Fees for the financial period amounted to USD 12,586. Custodian Fees outstanding as at 31 December 2015 were USD 7,391. Other than audit fees, no other fees were paid to the auditor by the Company. Auditors’ fees The below table discloses audit remuneration fees for the financial period. 31 December 2015 USD Audit of statutory accounts 13,878 Other assurance services - Tax advisory services - Other non-audit services - 13,878 Directors’ fees The Directors’ fees and expenses charged for the financial period amounted to USD 35,716. Fees of USD 9,345 were outstanding at 31 December 2015. Operating expenses The Fund pays all of its own operating expenses and bears its pro-rata share of the operating expenses of the Company which may be incurred by the Fund, the Company, the Investment Manager or their respective affiliates including, but not limited to the Capped expenses (“Capped Expenses”) and Uncapped expenses (“Uncapped Expenses”). For a detailed list of Capped Expenses and Uncapped Expenses please refer to the Company’s prospectus.

GuardCap UCITS Funds Plc Notes to Financial Statements For the financial period from 5 December 2014 to 31 December 2015 (continued)
41
10. Other receivables and accrued liabilities
Below is the breakdown for other fees receivables and accrued liabilities as at 31 December 2015.
GuardCap Global
Equity Fund 31 December 2015 USD Other receivables Interest and dividends receivable, net 62,023 Receivable from Investment Manager 9,960 Total 71,983
GuardCap Global
Equity Fund 31 December 2015 USD Other accrued liabilities Administration fee payable 11,472 Audit fees payable 13,878 Formation expenses payable 528 Custodian fees payable 7,391 Directors fees payable 9,345 Shareholder service fees payable 1,693 Legal fees payable 135 Other fees payable 4,642 Investment management fees payable 21,318 Registration fees 539 Trustee fees payable 1,219 Total 72,160
11. Share capital and redeemable participating shares
The share capital of the Company will at all times equal the NAV. The authorised share capital of the Company is €300,002 represented by 300,002 Subscriber Shares (“Subscriber Shares”) of no par value issued at €1.00 each and 500,000,000,000 shares (the “Shares”) of no par value. The Directors are empowered to issue up to 500 billion shares of no par value in the Company at the NAV per share (or the relevant initial subscription price in the case of new funds) on such terms as they may deem reasonable. The Subscriber Shares entitle the shareholders holding them to attend and vote at all meetings of the Company, but do not entitle the holders to participate in the dividends or net assets of any fund. Each of the shares entitles the shareholder to participate equally on a pro rata basis in the dividends (in the case of Funds and classes which declare dividends) and net assets of the Fund in respect of which they are issued, save in the case of dividends declared prior to becoming a shareholder.

GuardCap UCITS Funds Plc Notes to Financial Statements For the financial period from 5 December 2014 to 31 December 2015 (continued)
42
11. Share capital and redeemable participating shares (continued) The Directors also reserve the right to redesignate any class of shares from time to time, provided that shareholders in that class will first have been notified by the Company that the shares will be redesignated and will have been given the opportunity to have their shares redeemed by the Company. Each of the shares entitles the holder to attend and vote at meetings of the Company and of the Fund represented by those shares. The Articles provide that matters may be determined at meetings of the shareholders on a show of hands unless a poll is requested by shareholders holding 10% or more of the shares or unless the Chairman of the meeting requests a poll. Each shareholder will have one vote on a show of hands. Each shareholder will be entitled to such number of votes as will be produced by dividing the aggregate NAV of that shareholder’s shareholding (expressed or converted into the base currency and calculated as of the relevant record date) by one. The “relevant record date” for these purposes will be a date being not more than 30 days prior to the date of the relevant general meeting or written resolution as determined by the Directors. Where a separate written resolution or general meeting of a particular class or tranche of shares is held, in such circumstances, the shareholders’ votes will be calculated by reference only to the NAV of each shareholder’s shareholding in that particular class or tranche, as appropriate. The Subscriber Shareholders will have one vote for each Subscriber Share held. In relation to a resolution which in the opinion of the Directors affects more than one class of shares or gives or may give rise to a conflict of interest between the shareholders of the respective classes, such resolution will be deemed to have been duly passed, only if, in lieu of being passed through a single meeting of the shareholders of those classes, such resolution will have been passed at a separate meeting of the shareholders of each such class. Shares in a fund may be purchased on any Dealing Day at the net asset value per share on the relevant Dealing Day on the terms and in accordance with the procedures described below and in the relevant Supplement. Subscription orders are effected at the net asset value per share applicable on the relevant Dealing Day. Details of the deadline by which subscription monies must be received by the Company will be set out in the relevant Supplement. No subscription order will be accepted after the relevant Valuation Point for a fund. If a subscription order is received prior to the Subscription Cut-Off Time, shares will be issued at the NAV per share applicable on the relevant Dealing Day. Subscription orders received after the relevant Subscription Cut-Off Time will be held over without interest on any related subscription monies and, in the absolute discretion of the Directors, either (i) such subscription monies will be returned (without interest) to the person from whom the subscription order and subscription funds were received, or (ii) the relevant shares will be issued on the next applicable Dealing Day at the relevant NAV per share, unless the Directors determine in their sole discretion to accept such subscriptions in exceptional circumstances (with the Directors ensuring that such exceptional circumstances are fully documented) and provided that such subscriptions for shares are received before the Valuation Point on the relevant Dealing Day. Subscription orders will not be processed at times when the calculation of the NAV per share is suspended in accordance with the terms of the Prospectus and the Articles.

GuardCap UCITS Funds Plc Notes to Financial Statements For the financial period from 5 December 2014 to 31 December 2015 (continued)
43
11. Share capital and redeemable participating shares (continued) Shareholders may request that shares of a fund be redeemed on any Dealing Day by completing and submitting a Redemption Application to the Administrator to arrive no later than the Redemption Cut-Off Time, in order to be effective on a Dealing Day. Redemption Applications received after the relevant Redemption Cut-Off Time will be held over until the next applicable Dealing Day, unless the Directors determine in their sole discretion, in exceptional circumstances (with the Directors ensuring that such exceptional circumstances are fully documented) and where such Redemption Applications are received before the relevant Valuation Point, to accept such Redemption Applications on the relevant Dealing Day. Redemption Applications may be sent by facsimile. Any minimum holding period in relation to a fund may be set out in the relevant Supplement. Redemption Applications received after the relevant Redemption Cut-Off Time will be effective on the next succeeding Dealing Day. Redemption Applications will not be processed at times when the redemption of shares or the calculation of the NAV per share is suspended in accordance with the terms of this Prospectus and the Articles. Shares which have been subject to a Redemption Application will be entitled to dividends, if any, up to the Dealing Day upon which the redemption is effective. The applicable Supplement may provide that if Redemption Applications on any Dealing Day exceed a specified percentage of the NAV of the applicable fund (which must be at least 10%), the Company may defer the excess Redemption Applications to subsequent Dealing Days. Any request for redemption on such Dealing Day shall be reduced rateably and the redemption requests shall be treated as if they were received on each subsequent Dealing Day until all the shares to which the original request related have been redeemed. A distribution in respect of a redemption may be made in kind, at the discretion of the Directors, after consultation with the Investment Manager, provided that where the redemption request represents less than 5% of the NAV of a fund, the redemption in kind will only be made with the consent of the redeeming shareholder. The assets to be transferred will be selected at the discretion of the Directors with the approval of the Custodian and taken at their value used in determining the redemption price of the shares being so redeemed. As a result, such distributions will only be made if the Directors and the Custodian consider that they will not materially prejudice the interests of the shareholders of the relevant fund as a whole and the Custodian is satisfied that the assets distributed are equivalent to the amount of the distribution declared. Shareholders will bear any risks of the distributed securities and may be required to pay a brokerage commission or other costs in order to dispose of such securities. If a shareholder so requests, the Investment Manager will sell the assets to be distributed to that shareholder and distribute the cash proceeds to the shareholder.
The Company currently offers 18 classes of shares in the Fund as set out below. The Company may also create additional classes of shares in the Fund in the future with prior notification to, and clearance in advance by, the Central Bank.

GuardCap UCITS Funds Plc Notes to Financial Statements For the financial period from 5 December 2014 to 31 December 2015 (continued)
44
11. Share capital and redeemable participating shares (continued) The following table is a list of the classes of shares available in the Fund. Currently only the USD I Class and USD X Class have been issued:
Share Class Description Minimum Initial Subscription Initial Offer Price USD A Class USD 10,000 USD 10 USD A Class (Hedged) USD 10,000 USD 10 EUR A Class USD 10,000 EUR 10 EUR A Class (Hedged) USD 10,000 EUR 10 GBP A Class USD 10,000 GBP 10 GBP A Class (Hedged) USD 10,000 GBP 10 USD I Class USD 500,000 USD 10 USD I Class (Hedged) USD 500,000 USD 10 EUR I Class USD 500,000 EUR 10 EUR I Class (Hedged) USD 500,000 EUR 10 GBP I Class USD 500,000 GBP 10 GBP I Class (Hedged) USD 500,000 GBP 10 USD X Class USD 10,000,000 USD 10 USD X Class (Hedged) USD 10,000,000 USD 10 EUR X Class USD 10,000,000 EUR 10 EUR X Class (Hedged) USD 10,000,000 EUR 10 GBP X Class USD 10,000,000 GBP 10 GBP X Class (Hedged) USD 10,000,000 GBP 10
Subscription monies must be paid in the class currency and must be paid by wire transfer to the bank account of the Administrator. Money must be remitted from an account in the name of the investor(s). After the initial issue of shares in any class, the shares in such class will be issued on the relevant Dealing Day at the relevant net asset value per share for the applicable class on the terms and in accordance with the procedures described herein.
12. Related party transactions and balances
Parties are considered to be related if one party has the ability to control the other party or exercise significant influence over the other party in making financial or operational decisions, or if the party is a member of the key management personnel of the entity or its parent. The Investment Manager is deemed to be a related party of the Company. For details relating to fees paid by the Company to the Investment Manager please see Note 9. As at 31 December 2015 the Investment Manager and Alexandria Bancorp Limited, an affiliate of the Investment Manager, together held 4,789,333.50 (94.93%) of the Fund shares as at the end of the financial period.
Directors, Steve Bates and Michael Boyd, are employees of the Investment Manager and Steve Bates is also a director of the Investment Manager. As such, they both have a business interest in services provided to the Company. Steve Bates and Michael Boyd do not earn Director's fees from the Company.

GuardCap UCITS Funds Plc Notes to Financial Statements For the financial period from 5 December 2014 to 31 December 2015 (continued)
45
12. Related party transactions and balances (continued) During the financial period Michael Boyd purchased 3,007.879 shares of the GBP I class at a weighted price of GBP 9.9738, worth approximately $45,000.
13. Significant events during the financial period
On 31 March 2015 the Central Bank of Ireland noted an updated supplement for the Fund. The supplement for the Fund was amended to record a change to the settlement cycles for subscriptions from three days to two days. On 23 December 2015 the Central Bank of Ireland noted an updated supplement for the Fund and the prospectus of the Company. The supplement and prospectus were amended to provide for the ability, on the part of the Directors, to impose an anti-dilution levy in certain circumstances.
14. Subsequent events after the financial period end
There were no significant events after the financial period end.
15. Securities lending The Company has no security lending arrangements and no securities lending took place during the financial period.
16. Exchange rates The following exchanges rates against the USD were as follows: 31 December 2015 CHF 1.001600 DKK 6.868085 EUR 0.920260 GBP 0.678311 JPY 120.195053 SEK 8.443593
17. Accounting financial period
These are the first set of annual audited financial statements and cover the period from 5 December 2014 to 31 December 2015.
18. Approval of financial statements
The audited financial statements were approved by the Board on 3 March 2016.

GuardCap UCITS Funds Plc
Supplementary Unaudited Information as at 31 December 2015
46
1. Schedule of Significant Portfolio Changes GuardCap Global Equity Fund Purchases Cost Security name Quantity (USD) Cognizant Technology Solutions Corp 55,047 3,243,097 Stryker Corp 31,130 2,947,041 MasterCard Inc 30,158 2,776,115 Priceline Group Inc 2,140 2,549,568 UnitedHealth Group Inc 23,570 2,548,344 CME Group Inc 26,411 2,430,820 Intertek Group Plc 63,151 2,389,670 Mead Johnson Nutrition Co 29,789 2,365,099 Yum! Brands Inc 31,533 2,266,440 Novo Nordisk A/S 46,357 2,200,549 Moody's Corp 22,349 2,191,314 Ulta Salon Cosmetics & Fragrance Inc 14,028 2,141,190 Gemalto NV 28,303 2,042,435 Reckitt Benckiser Group Plc 22,146 1,914,062 FANUC Corp 11,070 1,880,929 Tiffany & Co 20,824 1,822,494 Alphabet Inc 2,318 1,769,855 LVMH Moet Hennessy Louis Vuitton SE 10,747 1,744,540 Automatic Data Processing Inc 20,239 1,734,499 Nestle SA 23,456 1,719,714 Sales Proceeds Security name Quantity (USD) Novo Nordisk A/S 18,841 1,010,114 Ontario 0% 11/02/2015 600,000 600,000 CME Group Inc 6,081 575,709 Ontario 0% 22/02/2014 425,000 425,000 CME Group Inc 3,213 288,146 Hermes International 112 37,639 Indivior Plc 7,240 19,134